1. Introduction
AMS-100 [
1] is the next-generation high-energy cosmic-ray experiment that is planned to succeed the currently operating AMS-02 [
2] aboard the International Space Station. It serves as a cosmic-ray observatory deployed near the Sun–Earth Lagrange Point 2 for the next decade.
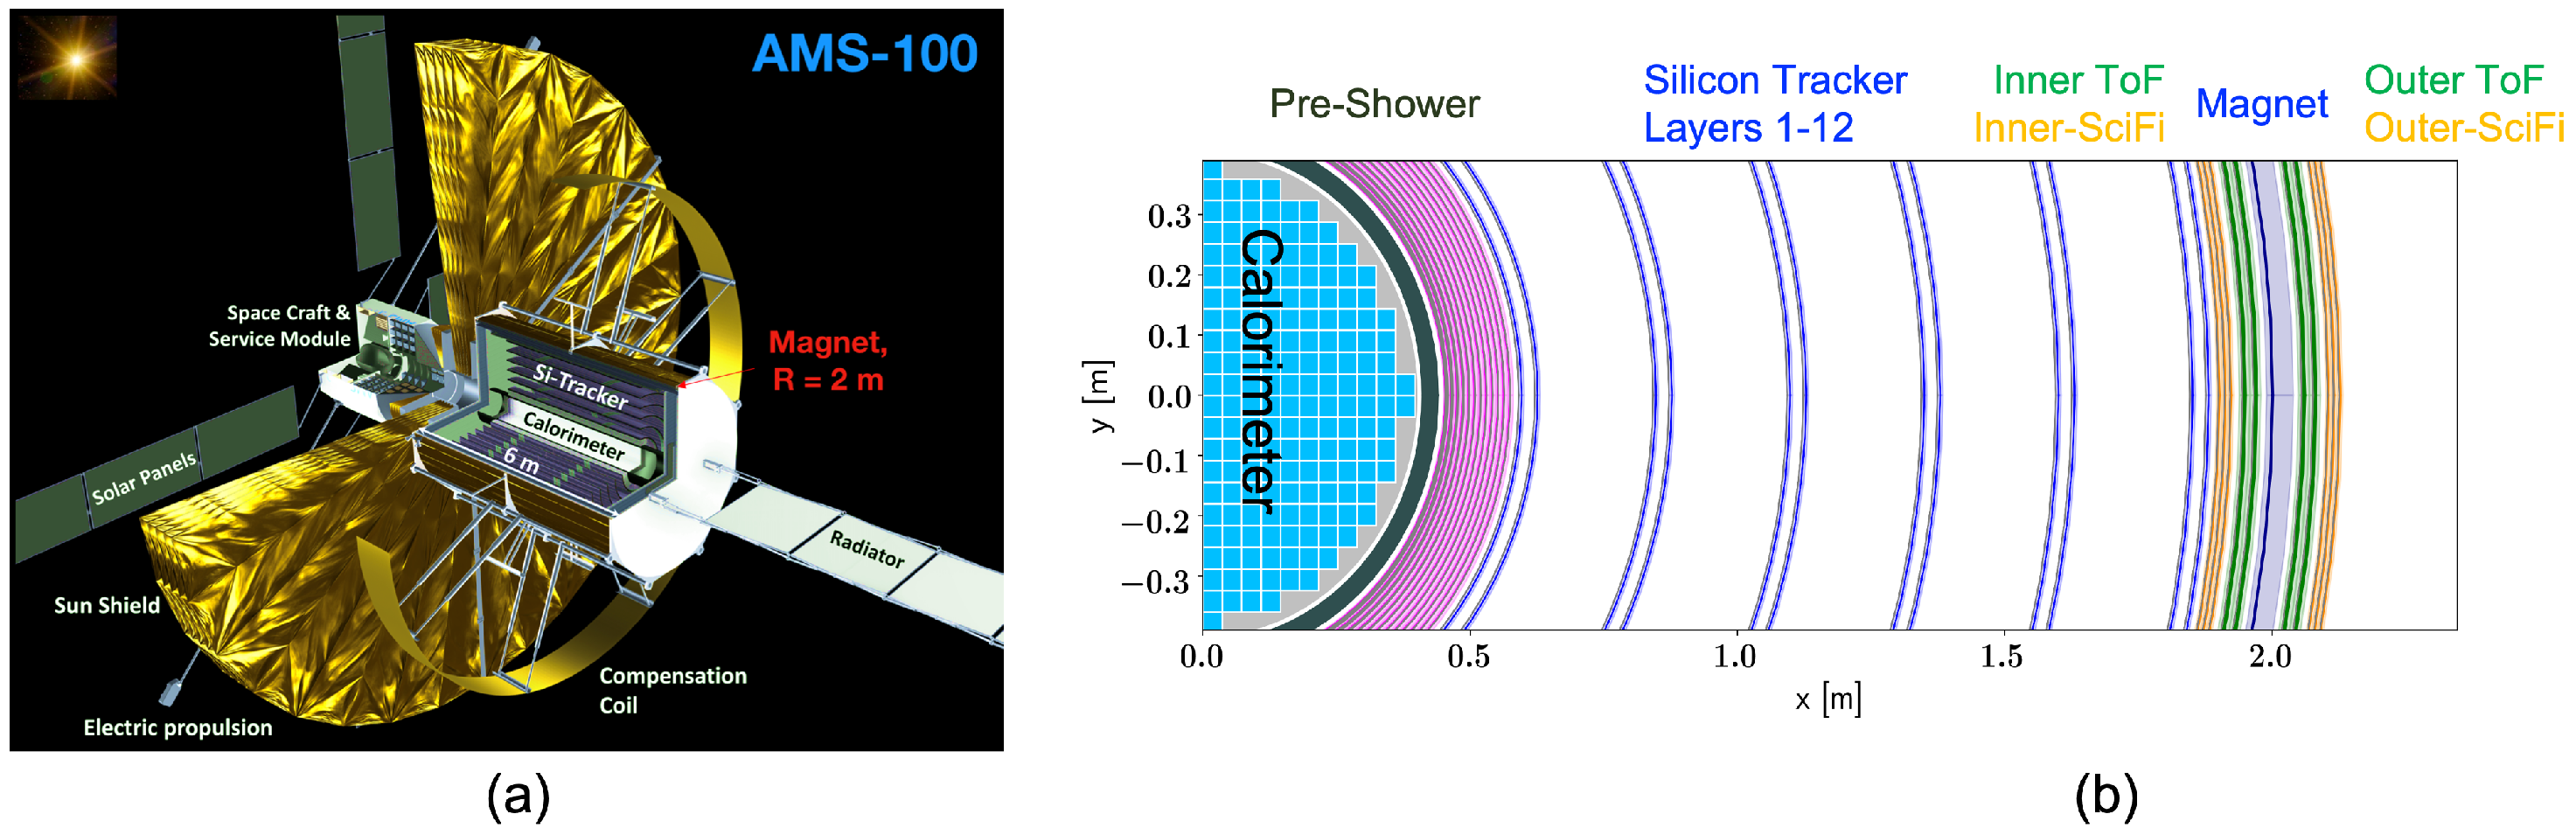
As illustrated in
Figure 1a, AMS-100 consists of a stack of cylindrical sub-detectors with a radius of 2 m and a length of 6 m, surrounded by a magnet and a compensation coil, and it is equipped with external solar panels, a radiator, sun-shield and a space craft service module.
Along the instrument, time-of-flight (TOF) detectors reside on the inside and outside of the solenoid magnet, as illustrated in
Figure 1b.
The TOF covers a cylindrical surface with a length of 6 m and a radius of 2 m resulting in a total area of 75 m
2. It consists of four separate layers. Each layer is constructed from individual scintillator tiles coupled to two SiPMs with a time resolution of
ps, where
is defined in Equation (
2). The time resolution of the TOF system is
. This time resolution allows identifying cosmic ray isotopes, such as
2H,
3He, 10Be, with high accuracy over a wide range of momenta.
Recently, the PANDA [
3] and MEG II [
4] experiments have developed timing detectors based on a scintillator tile readout by a series of SiPMs and obtained a time resolution in the range of
= 50∼60 ps [
3,
4,
5]. In this article, we have adopted similar design concepts targeting a better time resolution mainly due to the enlarged active area of the SiPMs. In addition, we expect reduced electronic noise under the cold environmental temperature of 200 K, at which the TOF will be operated in AMS-100.
2. SiPM-Based Time-of-Flight (Tof) Detector
Similar to the PANDA and the MEG II experiments, a plastic scintillator tile with a short scintillation decay time and high photon statistics for fast timing measurements has been chosen.
The major contribution to the time resolution
from photon statistics, as detected by the SiPM, can be expressed as [
6]
where
and
are the scintillator’s rise and decay time, and
is the number of detected photons.
can be expressed as a product of the number of photons (
), the quantum efficiency (QE), the collection efficiency (CE) and the gain (G) of SiPM. The product of QE·CE is widely defined as the photon-detection efficiency (PDE). Here, noise contributions from crosstalk, afterpulse, dark current and electronic noise are excluded. According to Equation (
1), the time resolution improves as
and
becomes shorter.
For fast timing purposes, polyvinyltoluene-based Eljen-228 and Eljen-232 plastic scintillators are selected because of their high light yield of 10,200 photons/1 MeV e
−, low density of 1.023 g/cm
3 and fast scintillation rise and decay times of less than 500 ps and 1600 ps, respectively. The given refractive index is 1.58, and the light output is constant in the temperature range of −60 °C to +20 °C [
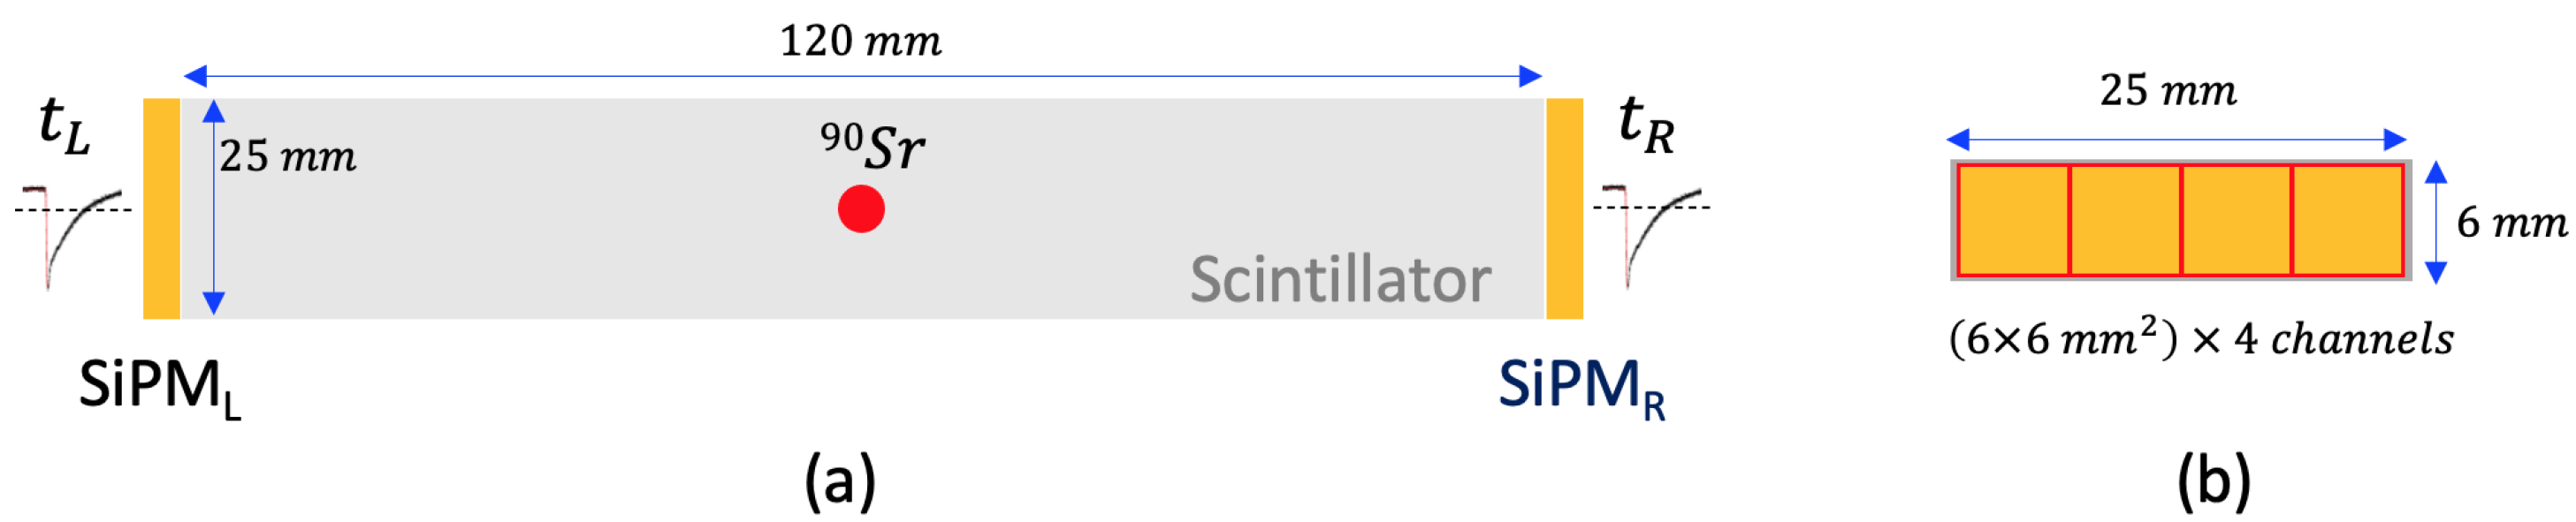
7]. The dimensions of the used scintillator tile are 25 mm (
width) × 6 mm (
thickness) × 120 mm (
length). The thickness is adjusted to match the height of the single-channel SiPM.
A SiPM is a semiconductor-based photon detector that consists of a rectangular array of microcells. Each microcell consists of an avalanche photodiode (APD) operating in Geiger mode and a quenching resistor. All of the APDs and quenching resistors are identical, and microcells are connected to one common output in parallel. Nowadays, the SiPM is a well-known photo sensor as its technology has reached impressive maturity. Similar to the conventional photomultiplier tube, the SiPM provides a fast response. Excellent properties such as compactness, high gain, low cost and high immunity to magnetic fields enable a flexible and highly segmented design for the TOF detector layout in large-scale experiments [
8]. Low bias voltage and low power consumption are additional advantages for a long-term operation in Space.
For fast SiPMs, the S14161 series from Hamamatsu Photonics (HPK) is chosen. Compared to the S13360 series used by PANDA [
3], it provides a higher PDE (50% at
nm,
V) with low crosstalk, a higher gain in the order of
and a lower breakdown voltage (
V). The afterpulse effects and dark counting rate are also significantly reduced by two orders of magnitude compared to the S12571/S12572 series [
9].
This SiPM consists of channels. Each channel has an effective area of (6 × 6) mm2 with a pixel pitch of 50 μm, leading to a large dynamic range due to the high number of microcells (14 k).
There are several ways to combine the
N SiPM channels, such as series, parallel and hybrid connections, as described in detail in reference [
3]. The optimal scenario, which is used in this study, is the hybrid scheme. It makes use of the parallel connection feature of a common
among the
N channels and the series connection feature relevant to the signal quality but with the use of a decoupling capacitor between the channels.
3. Experimental Setup
A TOF counter prototype has been built to quantify the time resolution. As illustrated in
Figure 2a, a single scintillator tile is read out by two SiPM arrays mounted on two opposite edges of a 120 mm long scintillator. Each SiPM consists of four channels in a row, as depicted in
Figure 2b.
Compared with the PANDA TOF detector, the enlarged active area of the SiPM is expected to improve the time resolution by a factor ≃2 given by the different surface coverage [
10], which improves the number of detected photons (
) accordingly (Equation (
1)).
In this article, we use both the coincidence time resolution (
) and the time resolution (
), which are defined as
where
denotes the time stamp of the left or right SiPM, and
t is the average time for a coincident event, as shown in
Figure 2a.
3.1. Design of DAQ
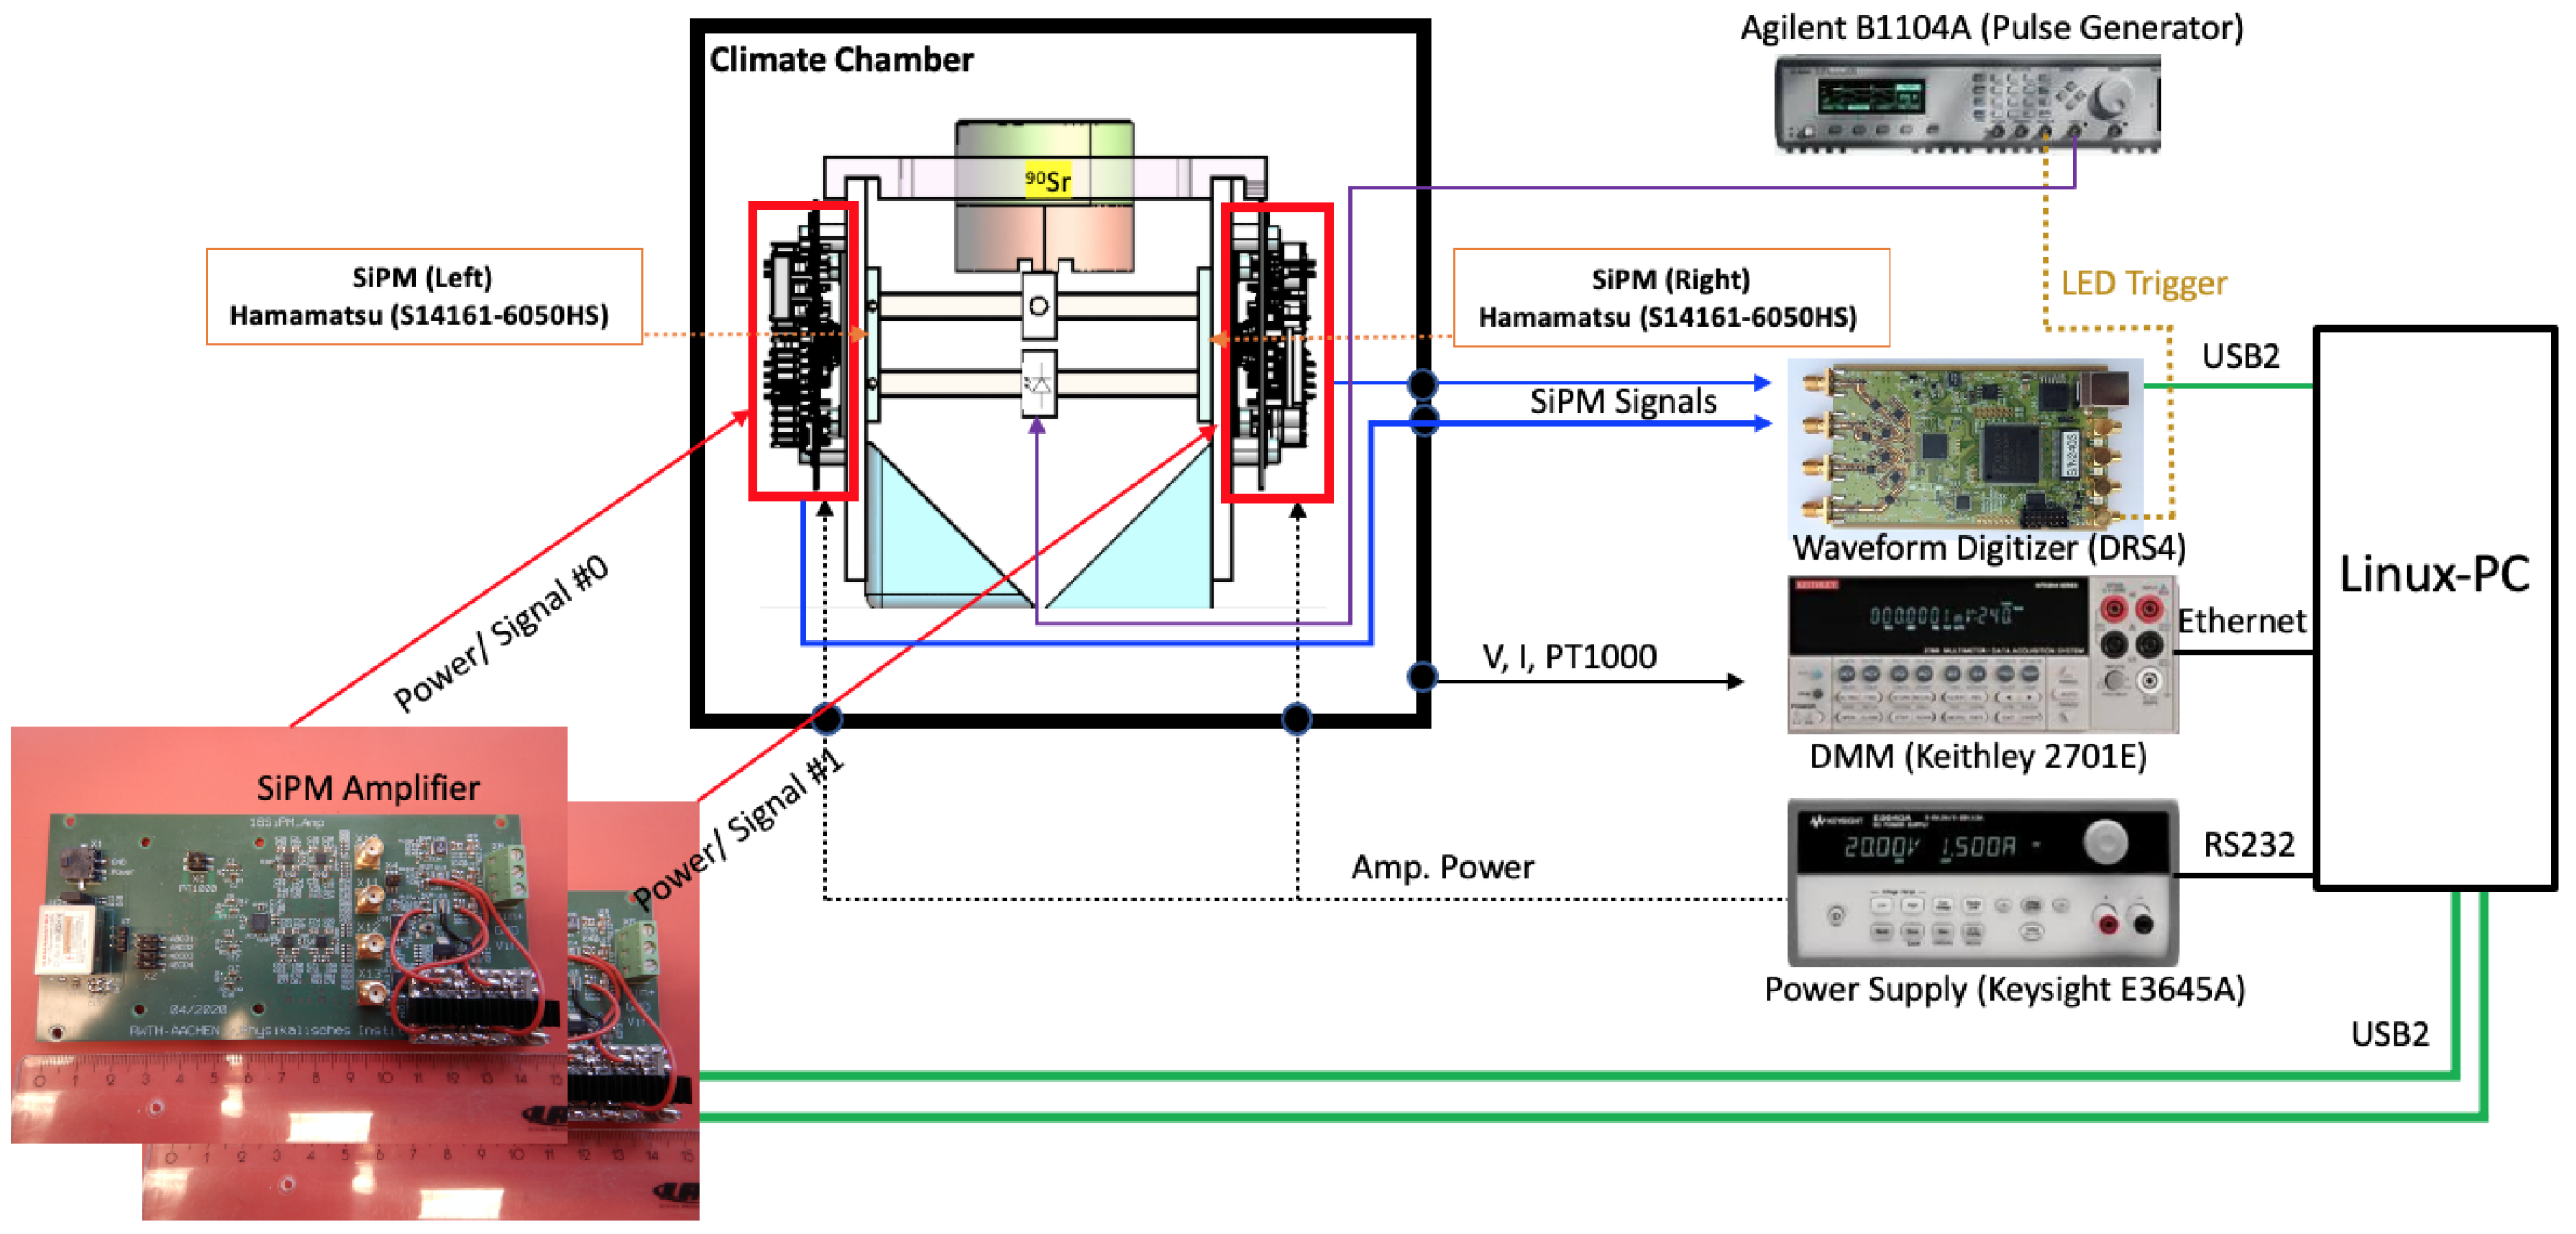
A schematic of the experimental test setup is depicted in
Figure 3. It shows a TOF prototype consisting of a scintillator tile coupled to SiPMs and front-end boards inside a climate chamber. The interior of the climate chamber is light-tight to avoid any background light on the scintillator. Signal, power, communication and other service lines are interconnected with external instruments through a dedicated feedthrough.
The signals induced by an LED or a radioactive source are fed into the front-end board and then read out by a high-speed Domino Ring Sampling (DRS4) waveform digitizer [
11]. The DRS4 evaluation board is capable of digitizing four input channels simultaneously at sampling rates of up to 5 Giga-samples per second with 1024 sampling points per channel. This is sufficient to resolve picosecond (ps) timing. Advanced internal time calibration circuits allow obtaining the sub-ps time resolution. The board is powered through the USB port and contains an onboard trigger logic module.
A preamplifier board is used to control the gain of two phases of Op-amp. An onboard power supply module (Hamamatsu C11204-01 [
12]) provides the bias voltage for the SiPM. A USB micro-controller (FTDI-FT4222H [
13]) is used to read out a temperature sensor on the SiPM. The bias power supply module has a built-in temperature compensation function so that the SiPM can be operated in optimum conditions even in environments of varying temperatures. It is controlled via a USB FT4222H bridge with a serial peripheral interface (SPI) protocol.
All monitoring data of voltages, external power supply current, temperatures and other operating conditions of the climate chamber are recorded by a Digital Multi-Meter (DMM, Keithley 2700E) interfaced to a LabVIEW program. A linux-based PC is used to control and monitor all hardware devices.
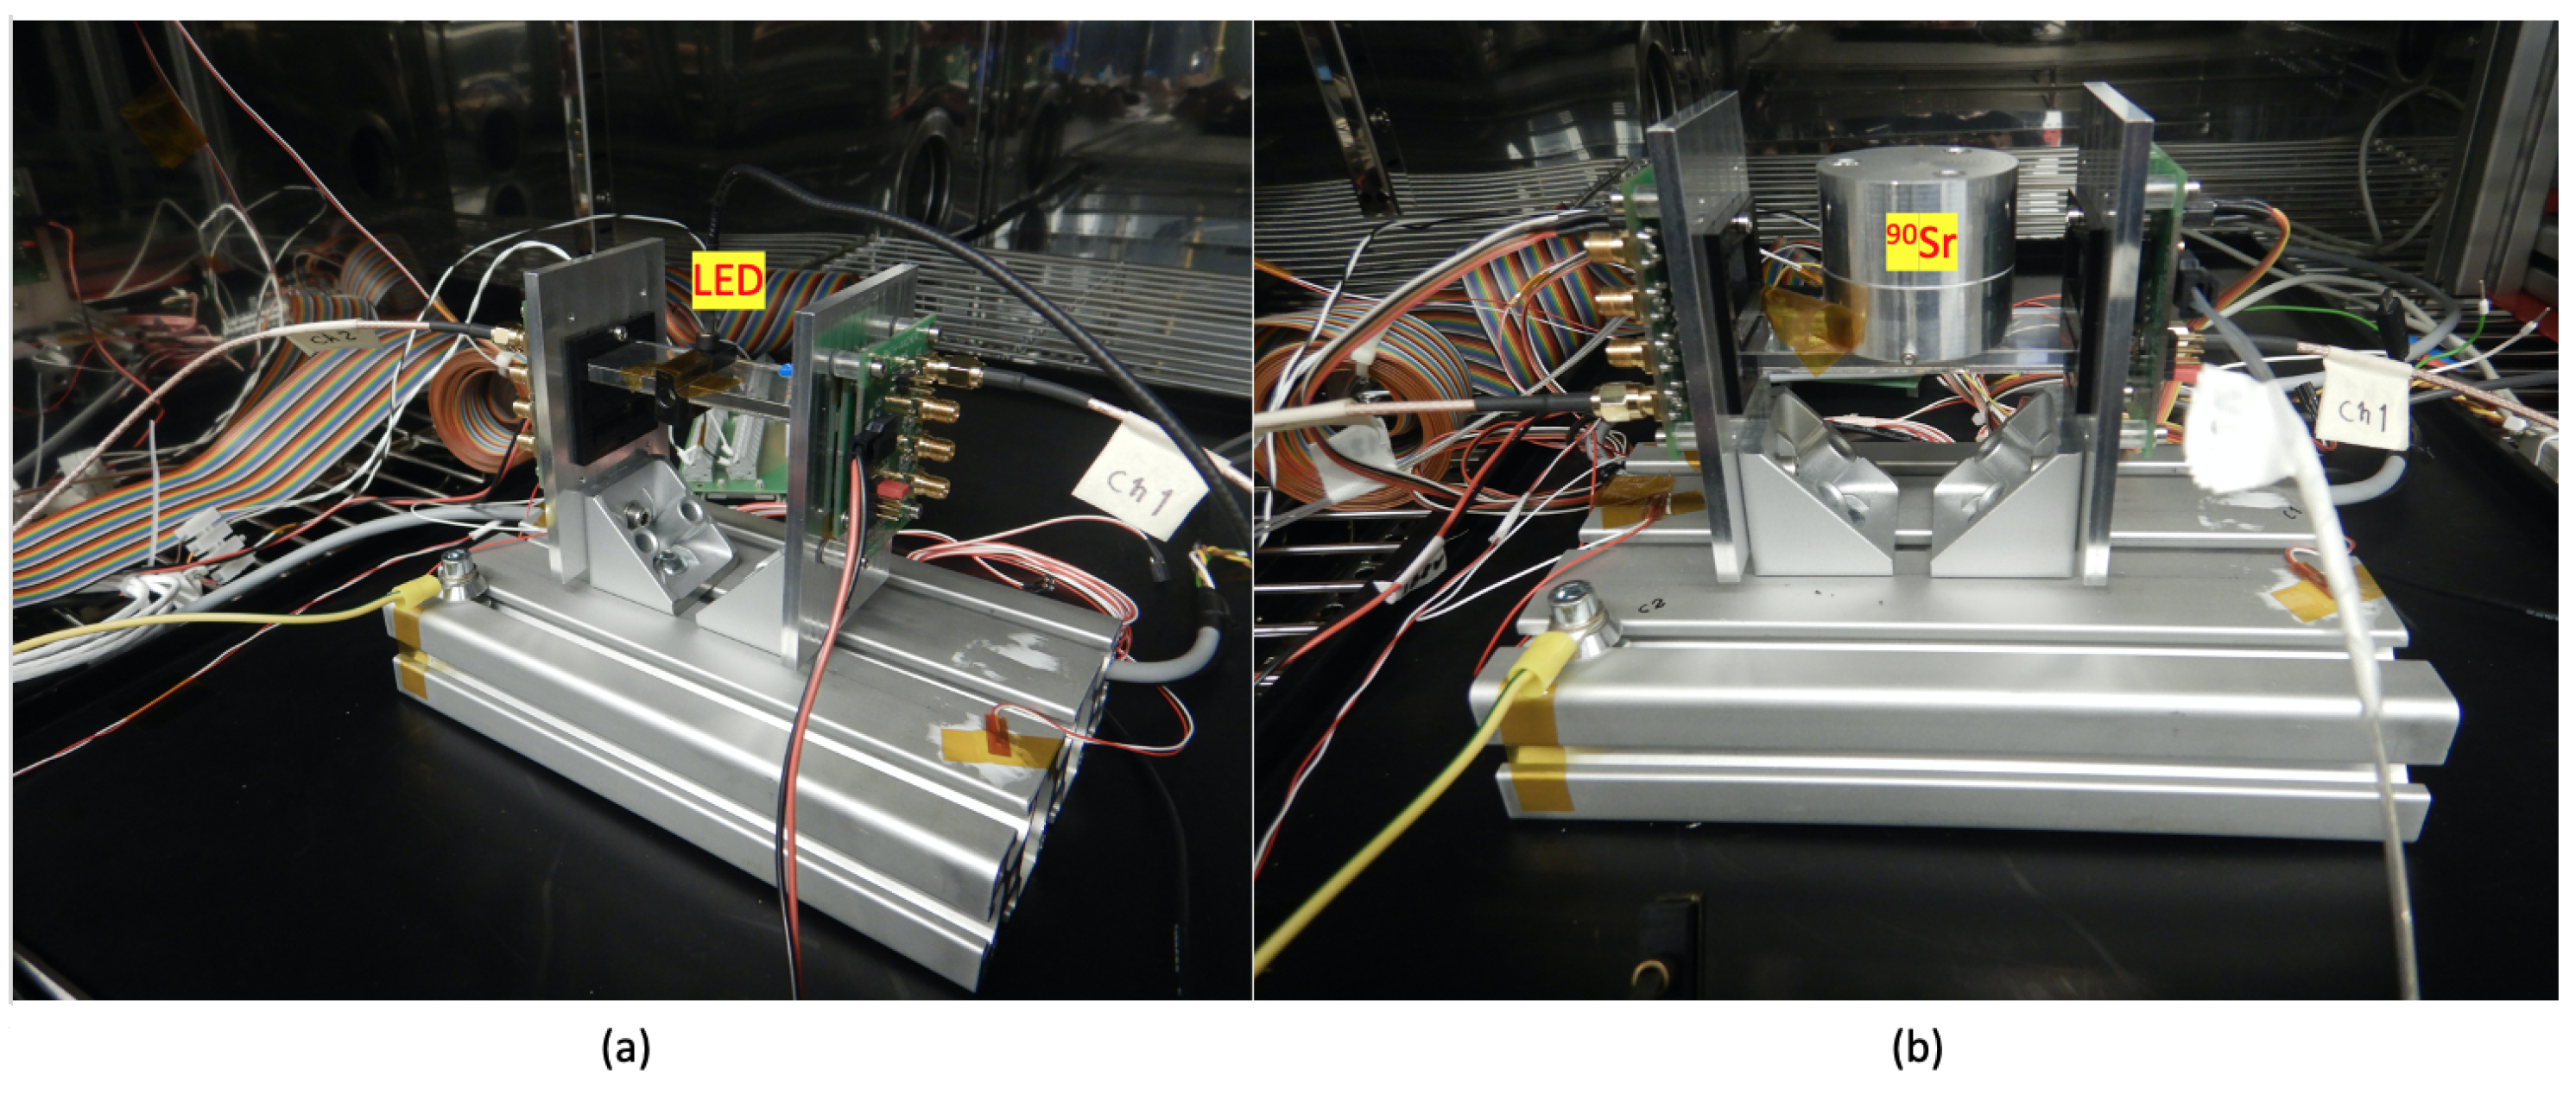
3.2. Ultraviolet (UV) LED and 90Sr Radioactive Source
Figure 4 shows the prototype test setup inside the climate chamber. An ultraviolet (UV) light LED diode (375 nm, Thorlabs LED375L) is placed in the middle of the scintillator, as shown in
Figure 4a. It is used to generate ultra-short light pulses of low power (<1 mW) and 10 ns width (FWHM) within a narrow viewing angle (±20°). The light is transmitted by total reflection towards the SiPMs. The LED is mounted on a mechanical holder with a pin-hole (2 mm diameter) that serves as a collimator of the produced light pulses. The UV-LED has been used to quantify the contribution of the readout electronics to the time resolution. We obtained a contribution of about 5 ps, which is, at present, negligible compared to the observed total time resolution of ≃40 ps described in
Section 4.6.
To evaluate the performance of the prototype, a strontium (
90Sr) radioactive source is used, as shown in
Figure 4b. The electrons emitted by its daughter, yttrium (
90Y), have a continuous energy distribution with a maximum energy of 2.28 MeV. The electrons are collimated with a pin-hole (2 mm diameter) at the bottom of the aluminum housing container. The electrons deposit energy in the scintillator and the resulting light is detected by both SiPMs. The SiPMs are read out by the DRS4. The threshold of its discriminator is adjusted at a low level of
mV. The recorded data are used for offline analysis. In rare cases, the electron can release its maximum energy of 2.28 MeV in the scintillator. The contribution is estimated using the maximum of the signal pulse spectrum in a self-triggered mode to be less than 1‰.
Electrons in the 1∼3 MeV energy range deposit 2 MeV cm
2/g in a vinyltoluene-based plastic scintillator [
14] equivalent to an MIP. Therefore, in this report, we assume that an electron of 1 MeV energy deposits the same energy as an MIP.
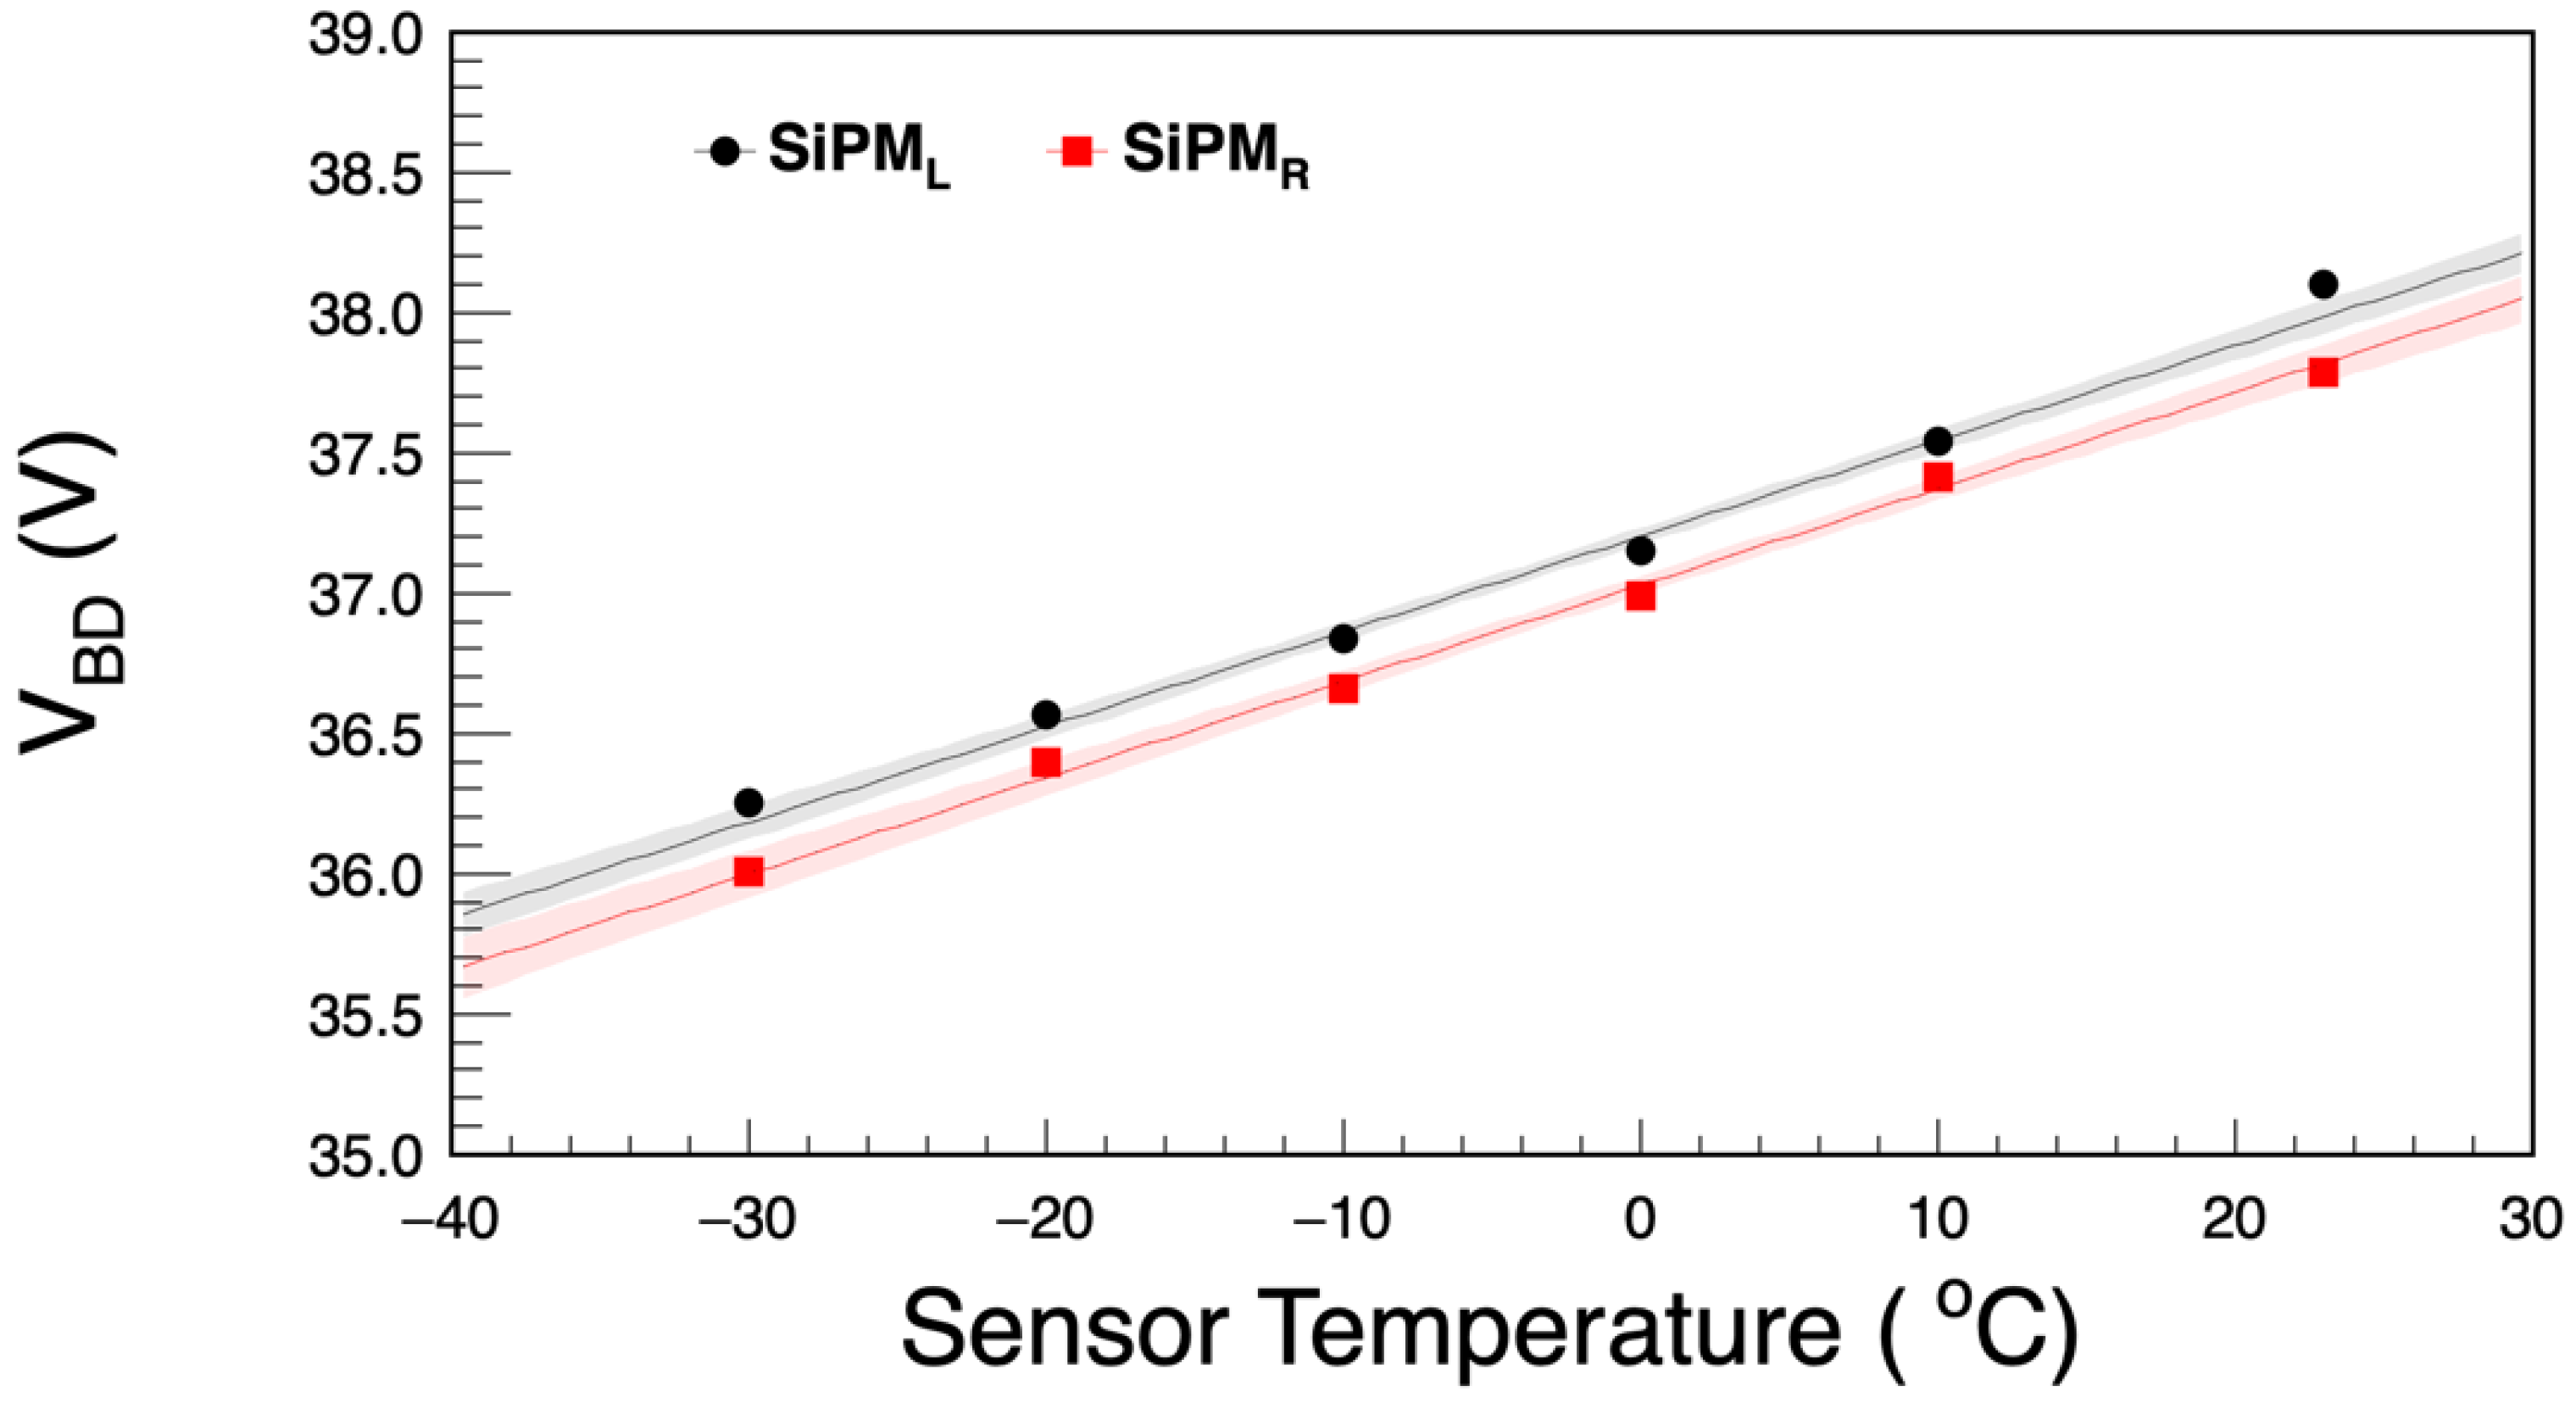
3.3. Breakdown Voltage and Temperature Dependency
The breakdown voltage () decreases at low temperatures due to the larger carrier mobility. It can be determined from the measurements of the pulse height as a function of the bias voltage (). It is derived as the intercept on the axis. The has been determined as 38.1 V for the left SiPM and 37.8 V for the right SiPM at +23 °C.
In a wide range of environmental temperatures, the
is linearly correlated with the temperature (see
Figure 5):
where
denotes the temperature coefficient, and
is the breakdown voltage at the reference temperature
. The measured average temperature coefficient is α = (34.2 ± 0.1 ± 0.3) mV/°C. The errors represent the statistical and systematic uncertainty, respectively. A systematic error of 1% was estimated by varying the fit ranges to determine a breakdown voltage at a given temperature. It is consistent with the reference value of 34 mV/°C provided by the vendor [
9].
The power supply module that is implemented with a temperature–voltage feedback loop generates the bias voltage according to the following formula.
The total charge of the signal is proportional to the gain. The gain (G) increases linearly with the overvoltage and is determined by
where
denotes the SiPM microcell capacitance. If we assume that the temperature gradient of
is negligible, the gain decreases with increasing temperature at the same bias voltage unless temperature compensation is applied.
4. Data Analysis and Results
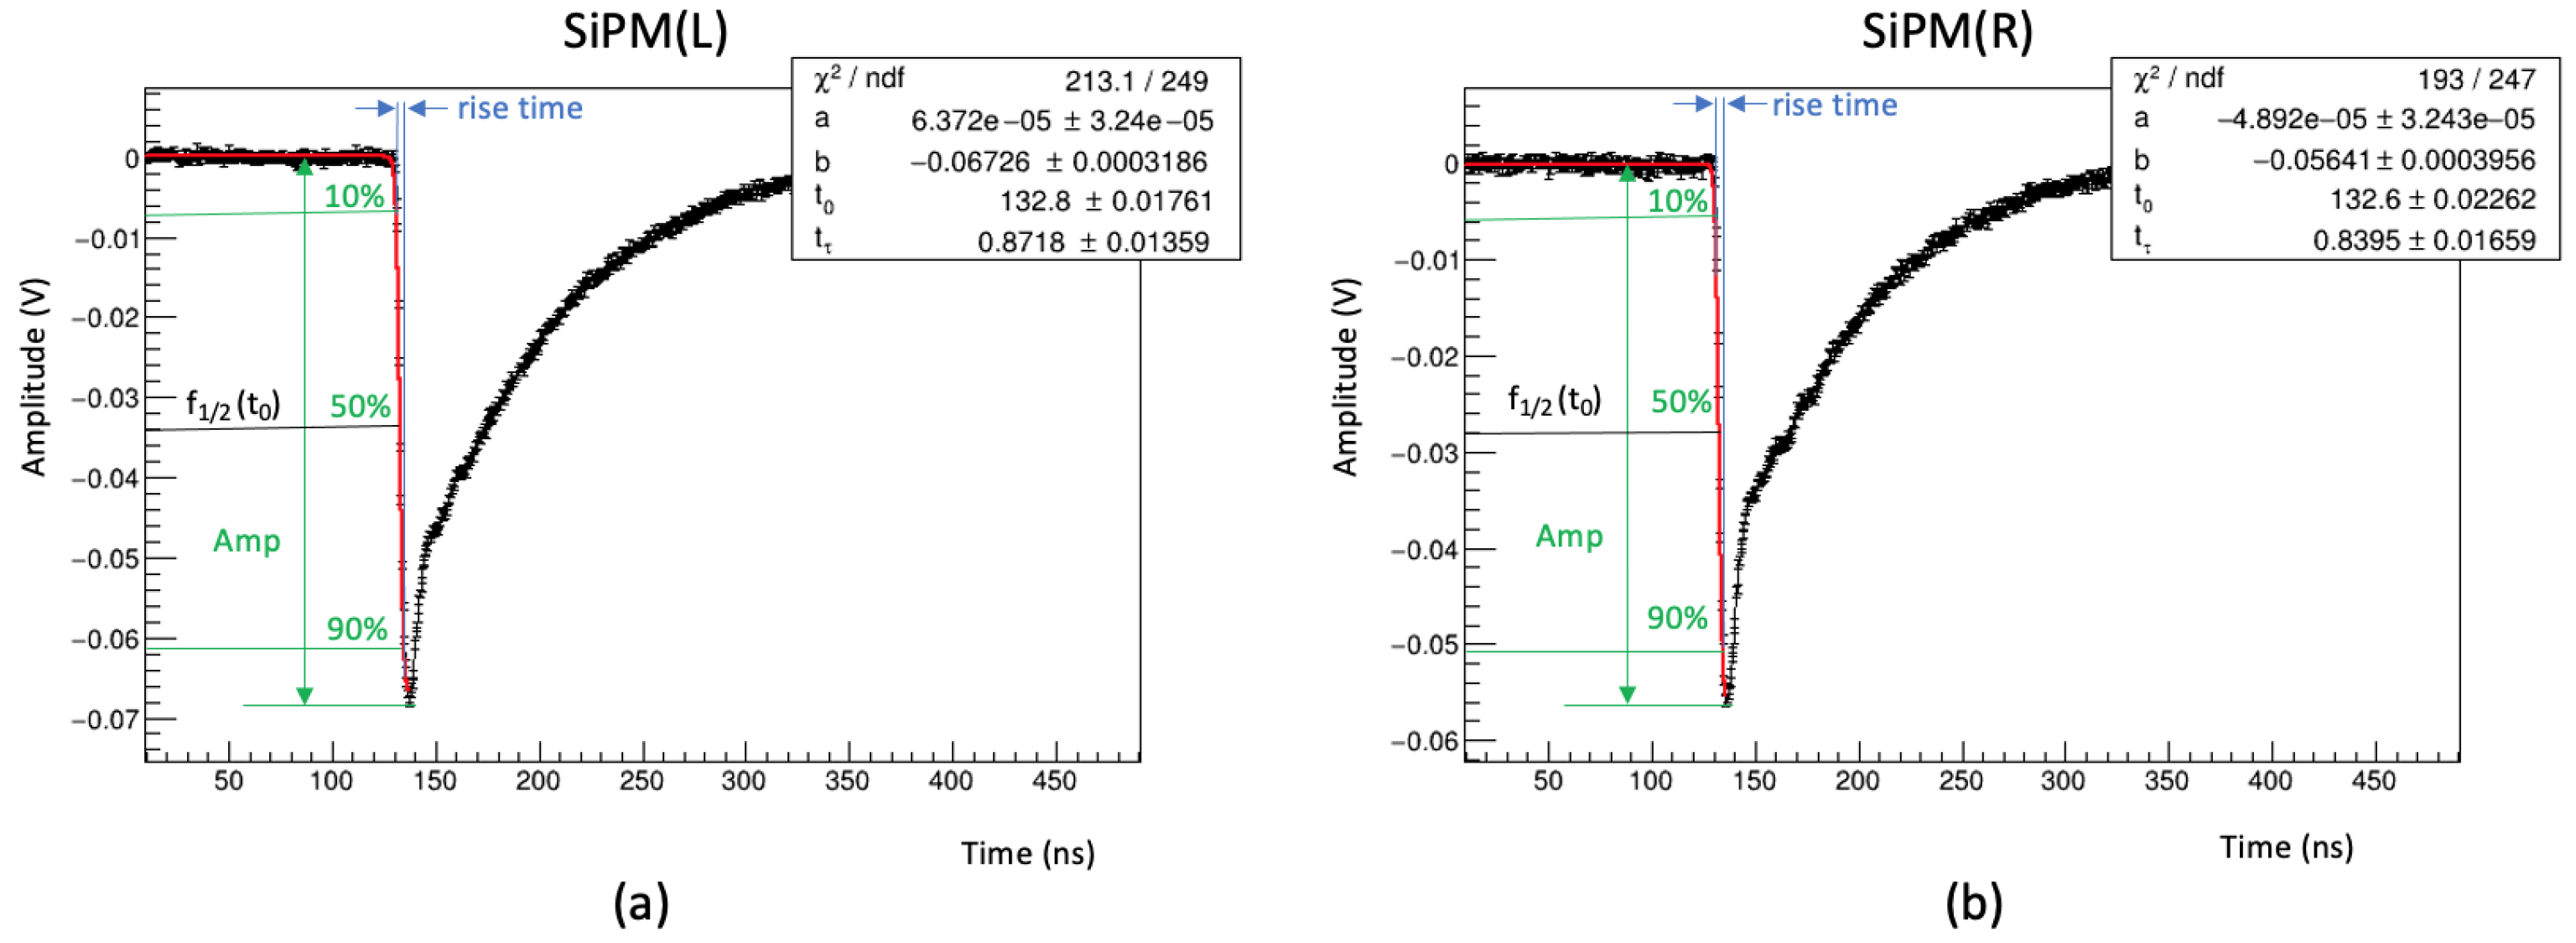
4.1. Fast Leading Edge Signals
Fast leading edges of the signals are fitted to estimate the time constant, rise time, baseline and height of the pulse after baseline subtraction.
Figure 6 illustrates the raw signals at
V induced by the
90Sr source and recorded by both SiPMs. Each signal shape is well described by a step function of the form
where
a and
b describe the pulse baseline and the amplitude of the signal, respectively.
refers to the time at half maximum of pulse height and
to a time constant. The rise time is estimated by the time needed for the pulse amplitude to rise from 10% to 90% of its maximum.
Similarly, the decay time is defined as the time needed for the pulse amplitude to decrease from 90% to 10% of its maximum. The total collected charge is estimated from the area between the graph and the time axis.
4.2. Coincidence Time Resolution (CTR)
The accuracy of the timing measurements is limited by jitter due to noise and time-walk from amplitude variations. The contribution of jitter to the time resolution is generally expressed to first approximation as
where
denotes the electronic noise,
is the slope of the signal amplitude at a given threshold, which can be approximated as the ratio of peak amplitude (
) to rise time (
), and
is the signal-to-noise ratio. Consequently, the time resolution improves directly with decreasing signal rise time and increasing peak signal amplitude.
The best time resolution is obtained from a constant fractional timing method as it eliminates an amplitude-dependent time-walk for signals [
15,
16]. In this article, this method is implemented as a constant fractional pulse height trigger routine in the offline waveform analysis.
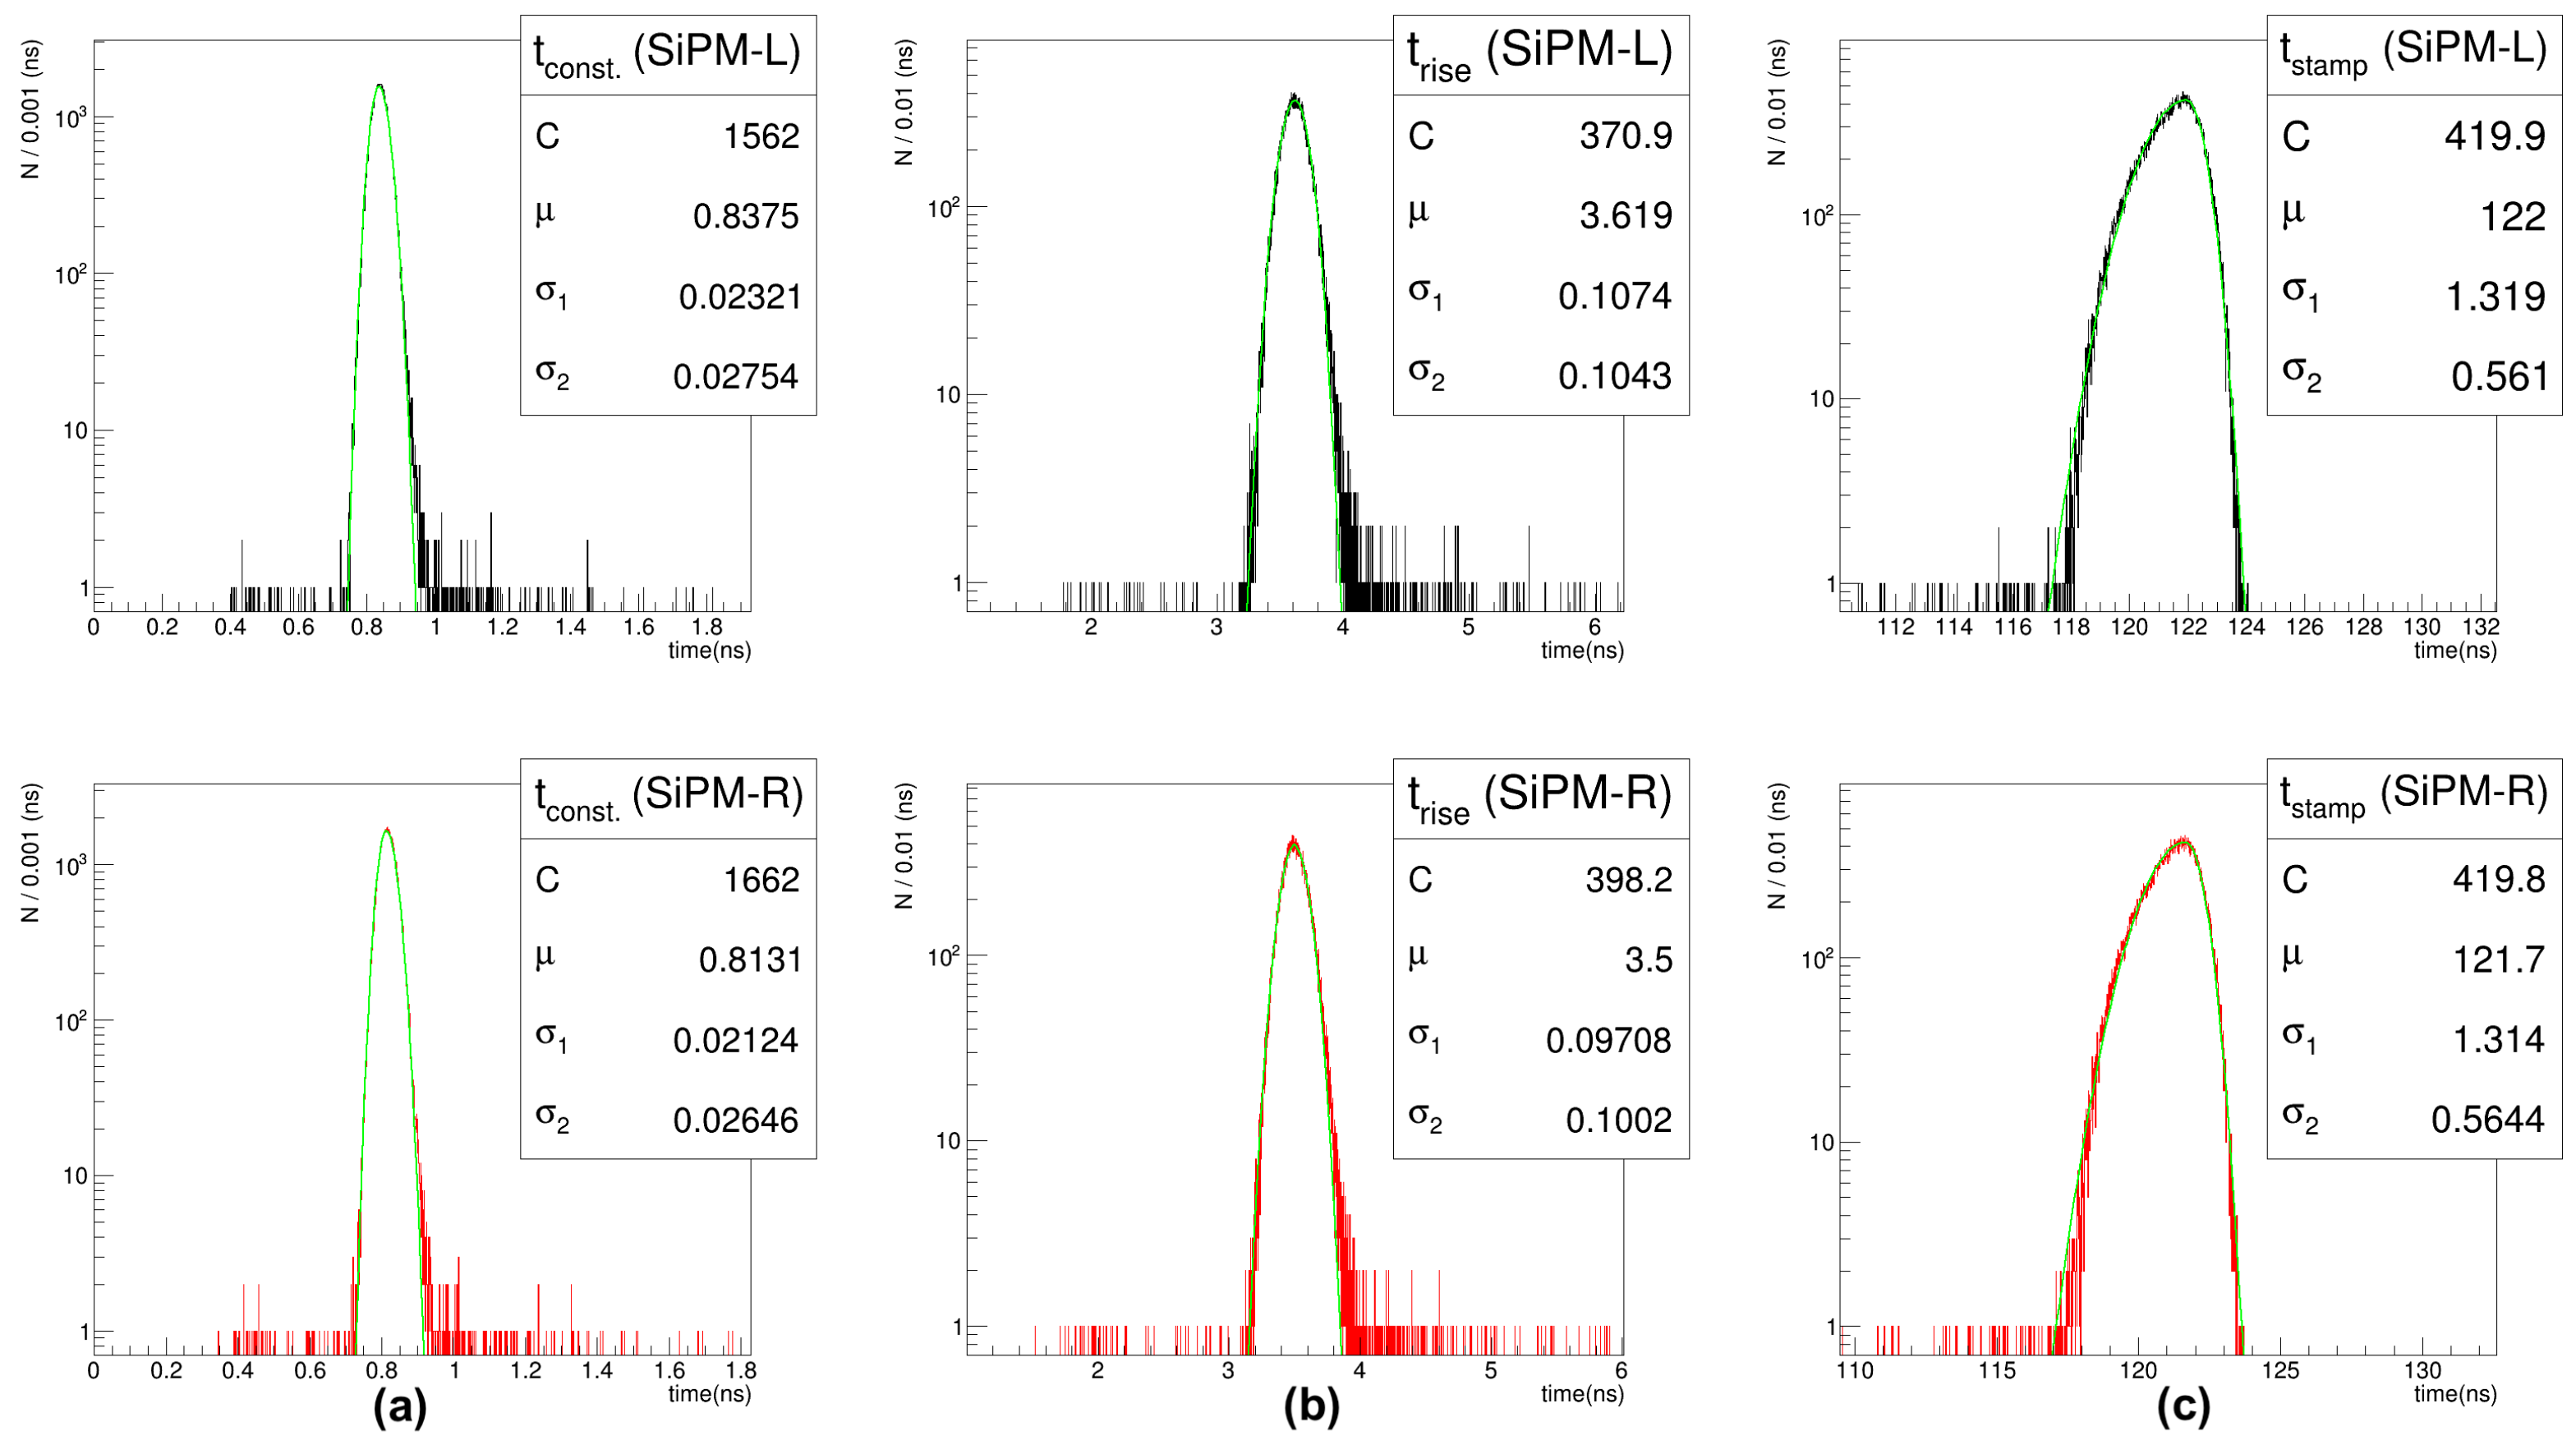
In
Figure 7, the distributions of the time constant, the rise time and the time stamps for both left and right SiPMs are presented at a constant fractional threshold of 0.2 (20%). The raw data are collected with a 70 mV trigger out of a maximum pulse height of 170 mV, which is estimated at the maximum electron energy of 2.28 MeV. Events are selected for the coincident pairs of signals within a time difference window fixed at 10 ns with an efficiency of 99.9%. The measured timing distributions are fitted using an asymmetric Gaussian function with mean value
, amplitude
C and its standard deviation
defined as
where
if
and
otherwise.
The time constant and the rise time are identical for both SiPMs and have a value of 0.8 ns and 3.6 ns, respectively.
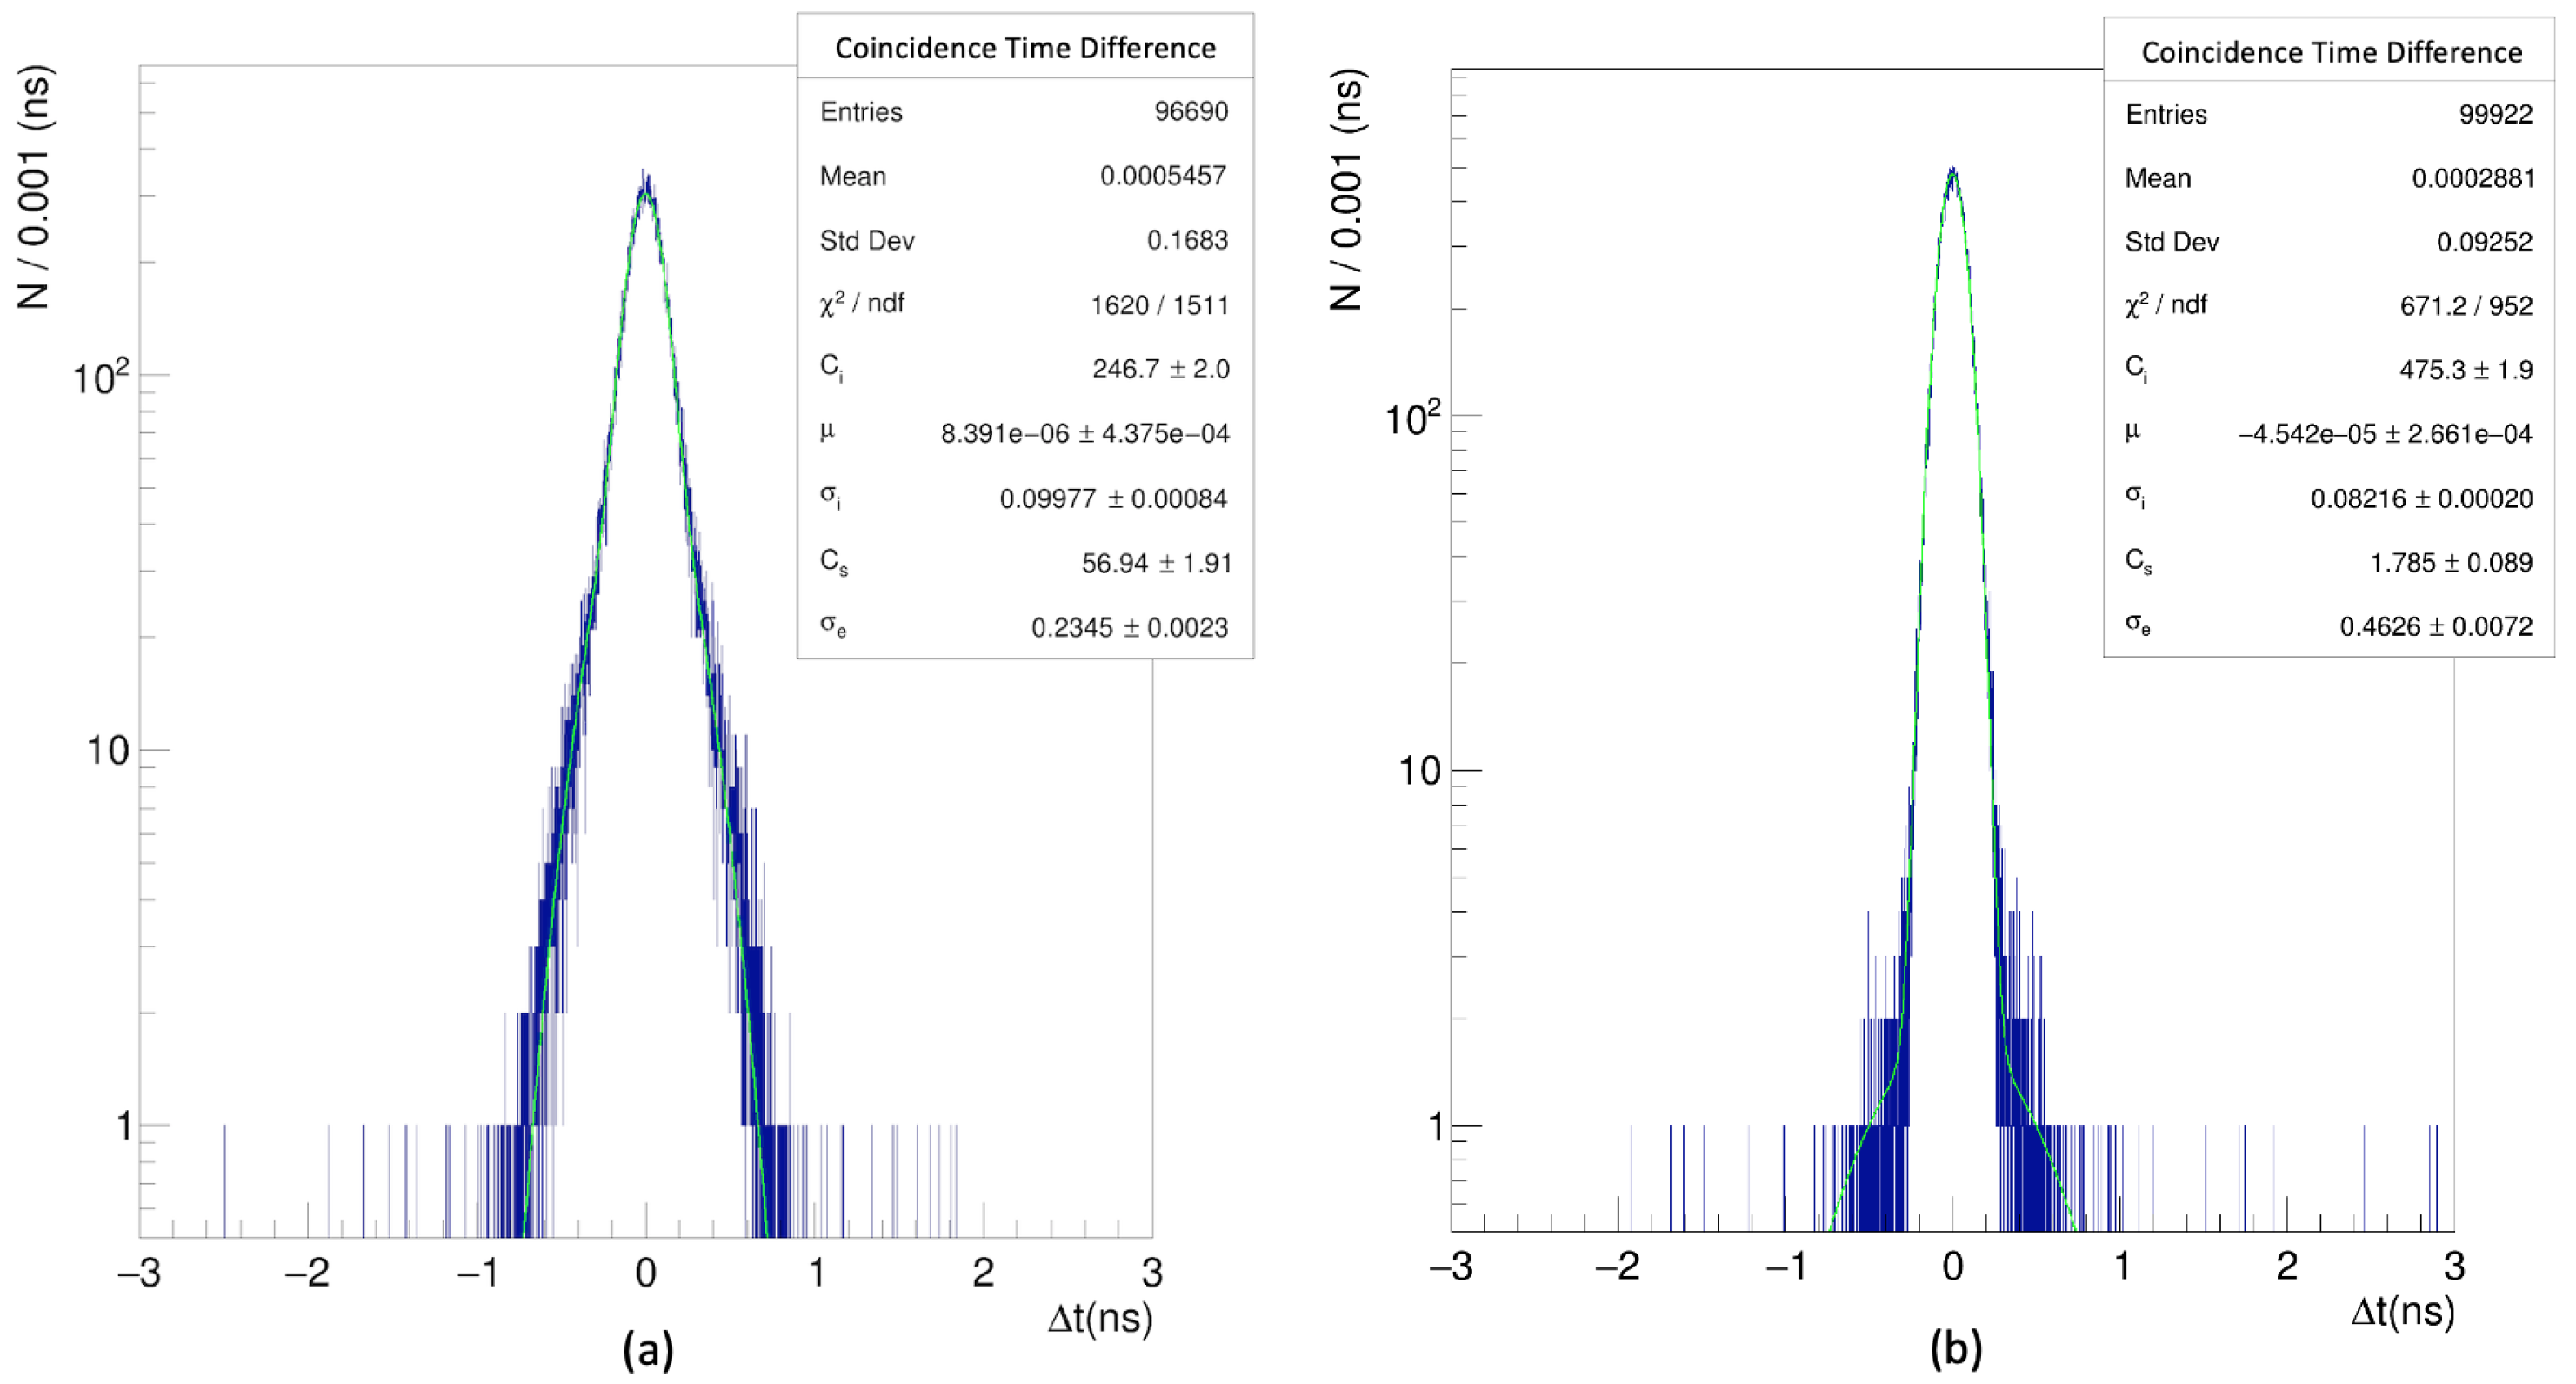
The time difference between coincident pairs of pulses, that is, between left and right SiPMs (
), is shown in
Figure 8 for two samples collected at low and high trigger levels of 20 mV and 70 mV. Considering the core Gaussian fits, the measured CTR is
σΔt = (100 ± 0.8) ps and
σΔt = (82 ± 0.2) ps with an efficiency of 70% and 98%, respectively. The systematic uncertainty is estimated to be 1% by repeating the measurement several times. It includes the effect of temperature variations of ±0.1 °C in the climate chamber and the source position of ±2 mm. The contribution of this systematic uncertainty on the fits is negligible.
4.3. Comparative Study of the CTR of Two Scintillators
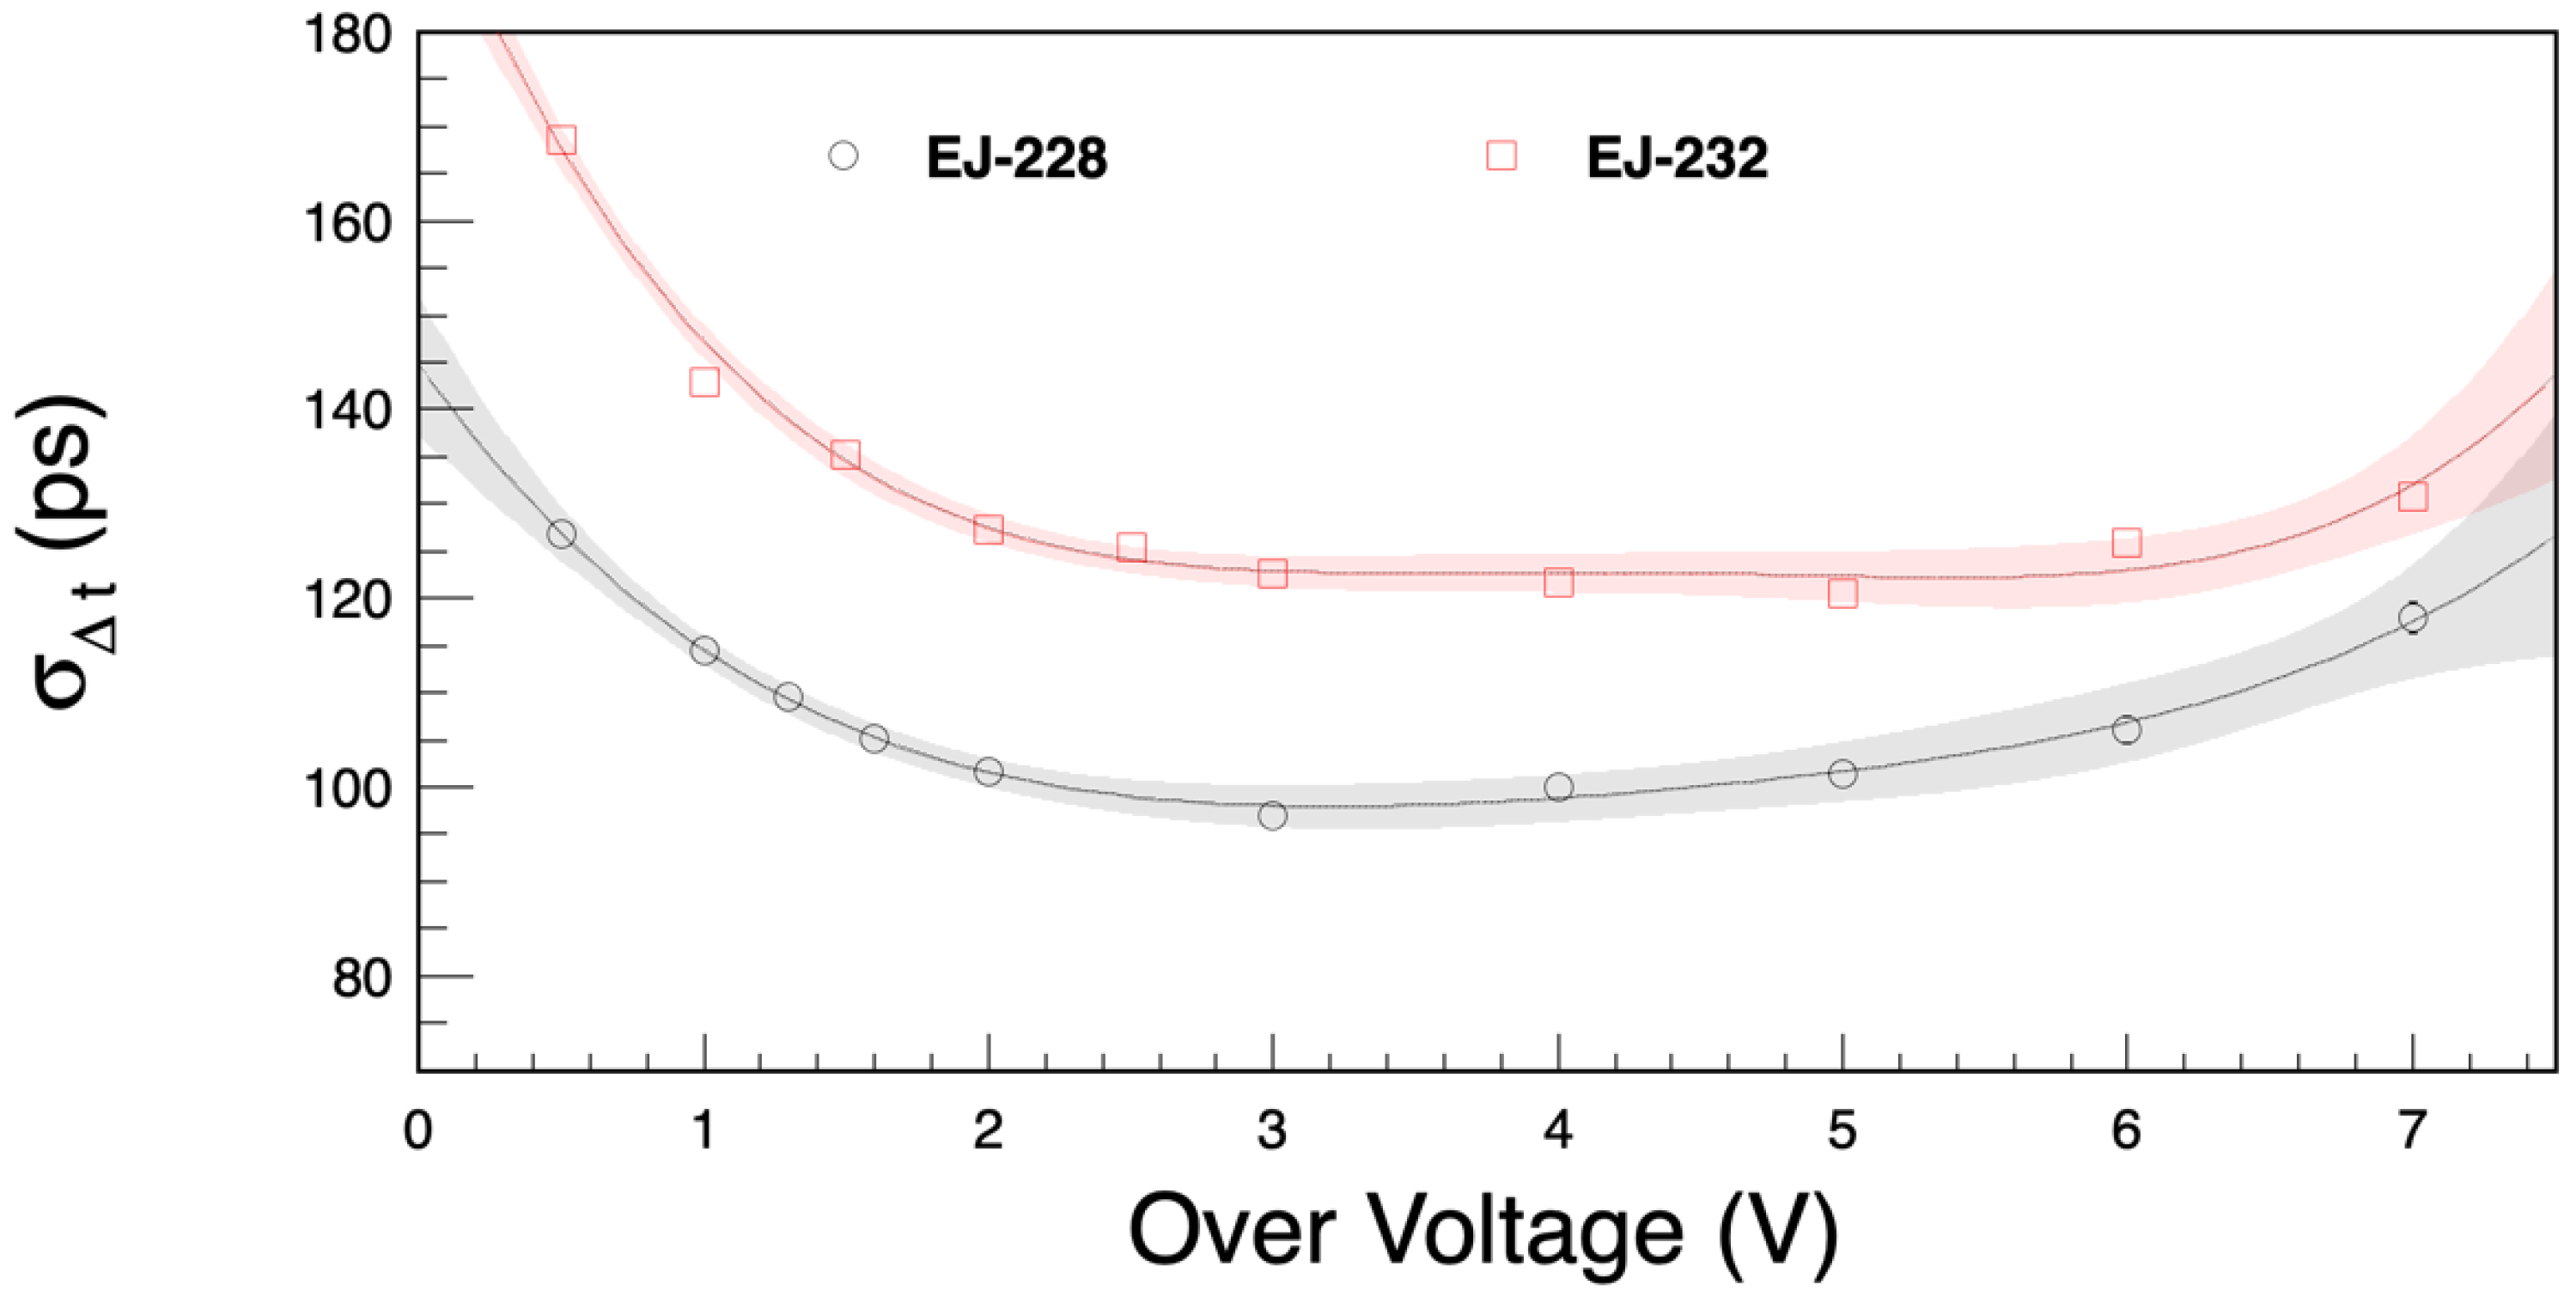
In
Figure 9, we compare the CTR between Eljen-228 and Eljen-232 scintillators as a function of overvoltage. This study was performed by varying the overvoltage from 0.5 V up to 7 V at a fixed discriminator threshold of 10 mV and a constant environmental temperature of +23 °C. The minimum CTR is estimated to be equal to
ps and
ps for Eljen-228 and Eljen-232, respectively. The results show a better performance for Eljen-228, which originates from a 20% higher light yield that overcompensates for the 30% longer rise time, compared to Eljen-232.
A quantitive understanding of this result would require a detailed study with a Monte-Carlo simulation to model the optical photon transport in the plastic scintillator coupled to the SiPM, as reported in the articles [
17,
18].
The CTR is highly dependent on the bias voltage, trigger threshold level, optical couplings and temperature conditions.
For the following CTR measurements, the scintillator (Eljen-228) is wrapped with a single layer of aluminized mylar to enhance scintillation light collection. The possible impact of optical coupling grease between the scintillator and the SiPMs was not investigated in this study.
4.4. Position Dependency of Time Resolution
The position dependency of the time resolution was studied in 5 mm steps in the longitudinal direction with a bias voltage of 41.0 V (or
V) and a discriminator threshold of 40 mV to acquire electrons that are close to MIPs (
MeV). The time difference,
, of the two SiPMs can be expressed as a linear function of the source position as
where
represents the start time,
is the position of the source with respect to the center of the scintillator and
l is the length of the scintillator.
denotes the time stamp of each SiPM, and
is the effective speed of light in the scinitllator.
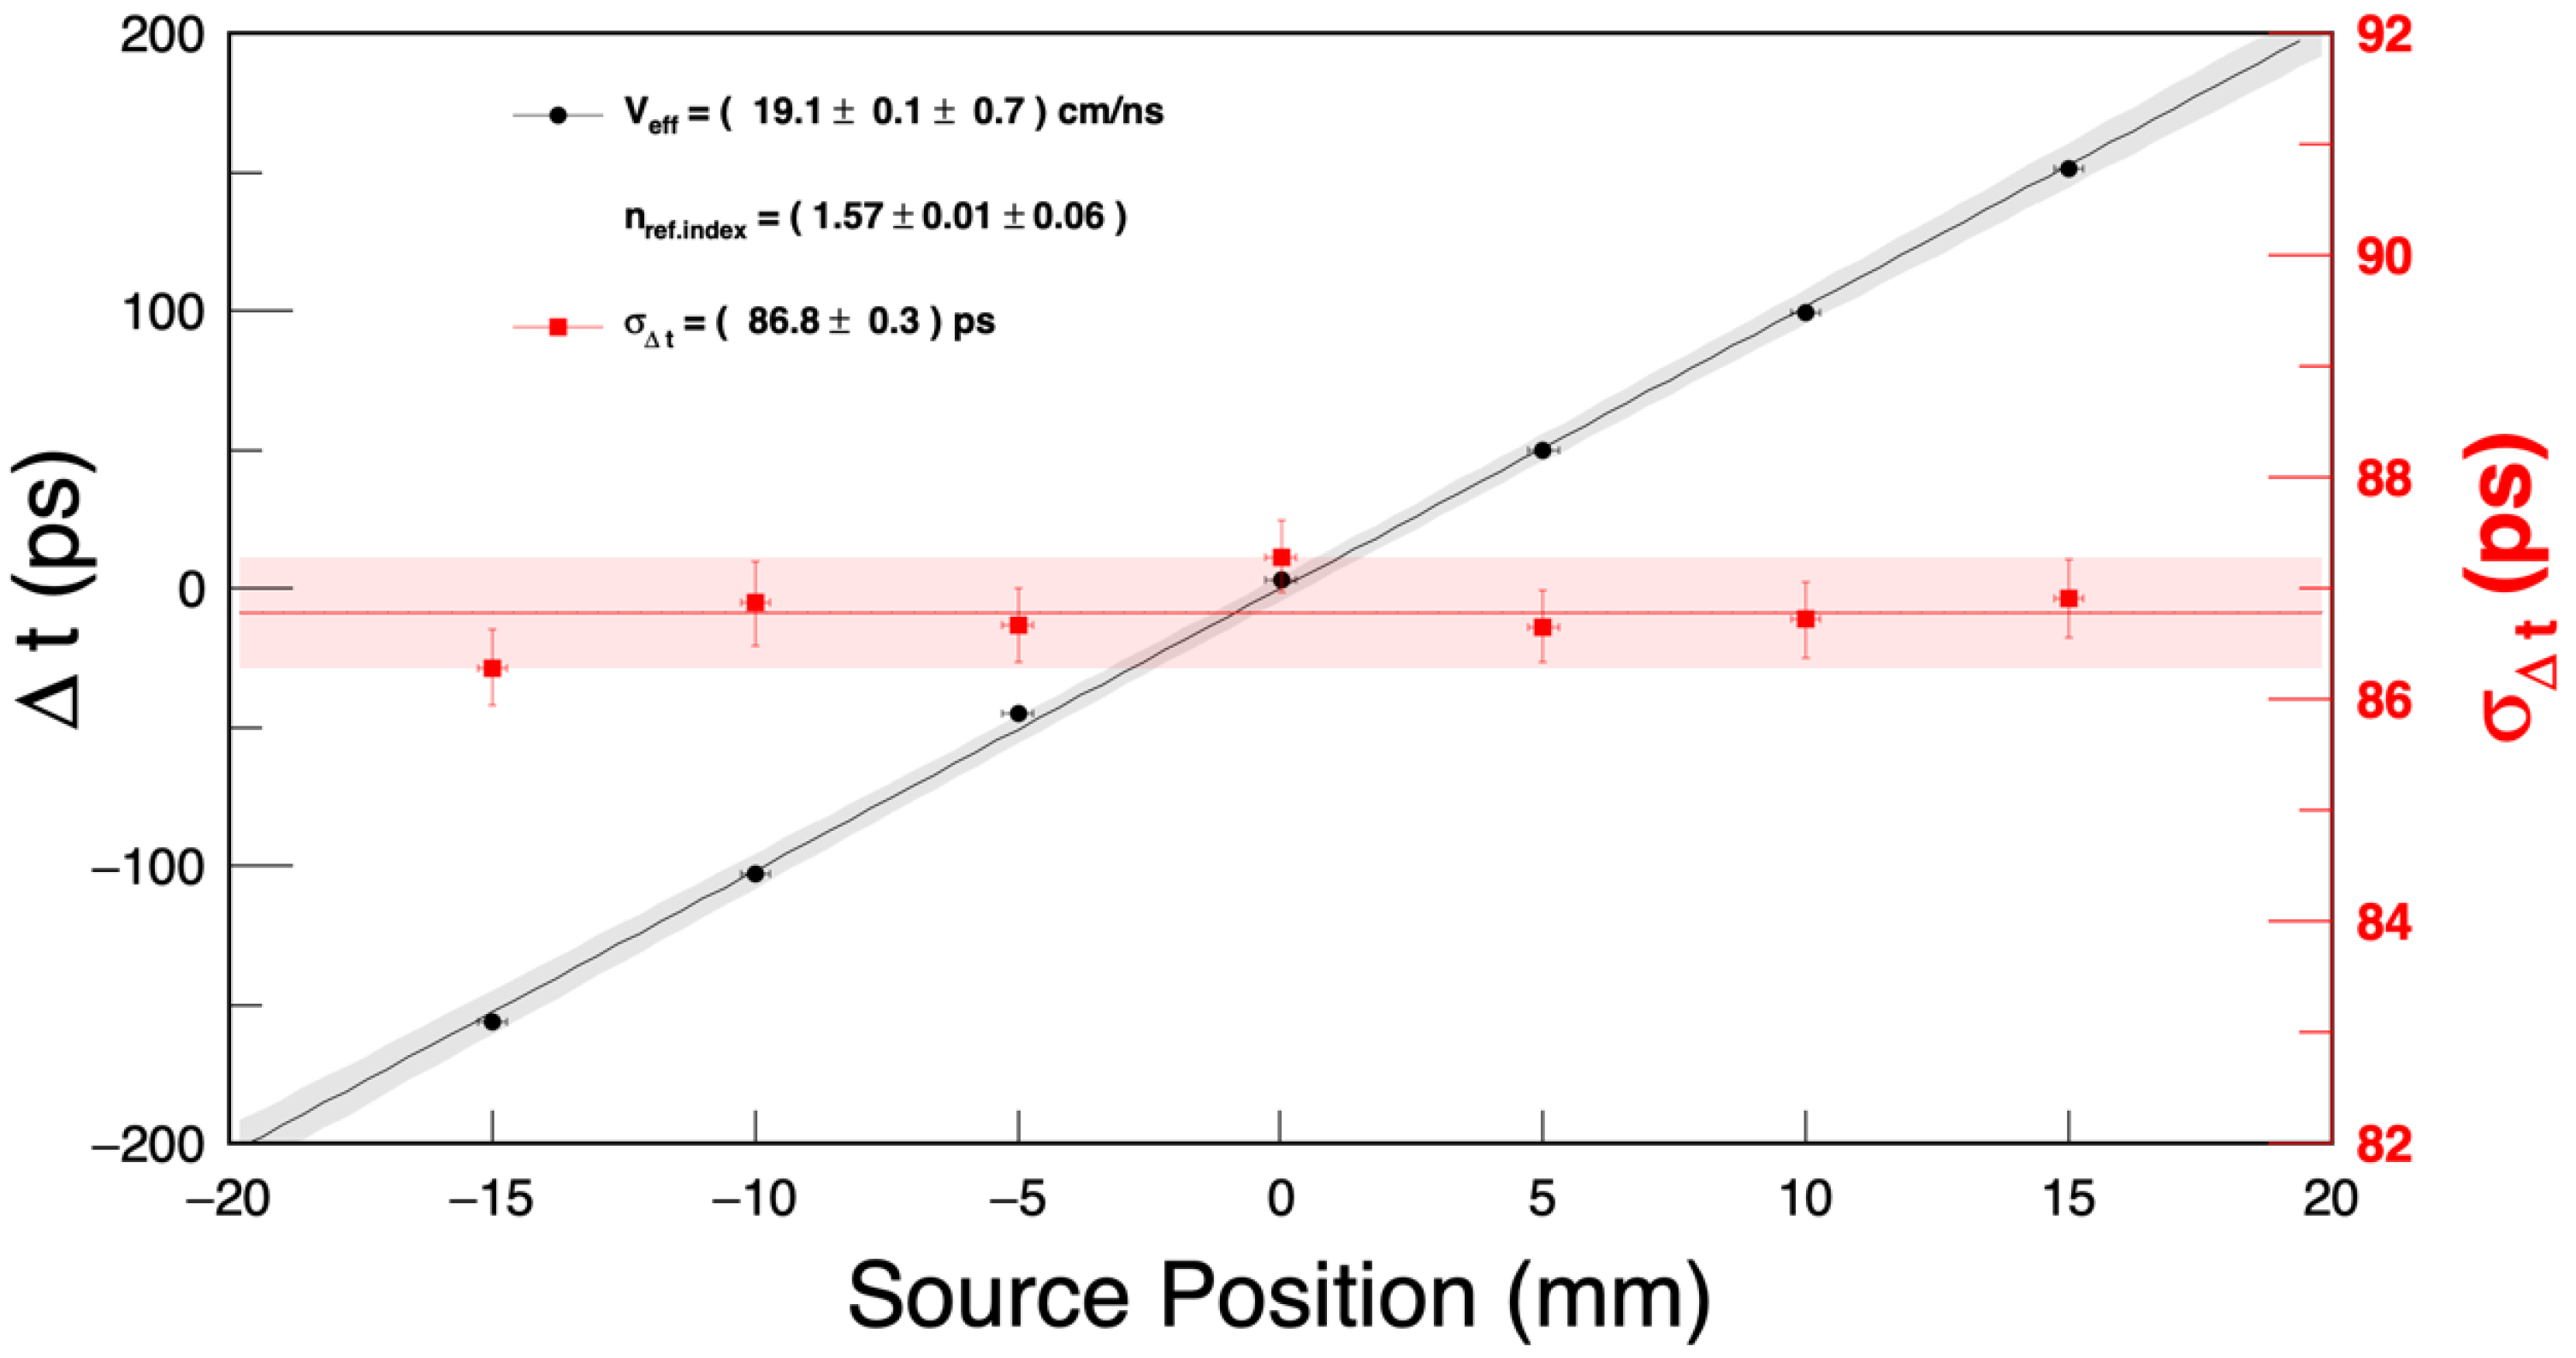
As shown in
Figure 10, we can derive the effective speed of light in the scintillator,
cm/ns, by fitting the data by a function linear in the source position. The systematic error is estimated by varying the constant fractional threshold by 0.1 (10%). The measured
results in a refractive index of
, which is consistent with the value of
given in the data sheet of the product.
The average CTR is equal to ps, which is equivalent to ps. This indicates good uniformity along the longitudinal direction of the scintillator. This result can also be translated into a position resolution of mm.
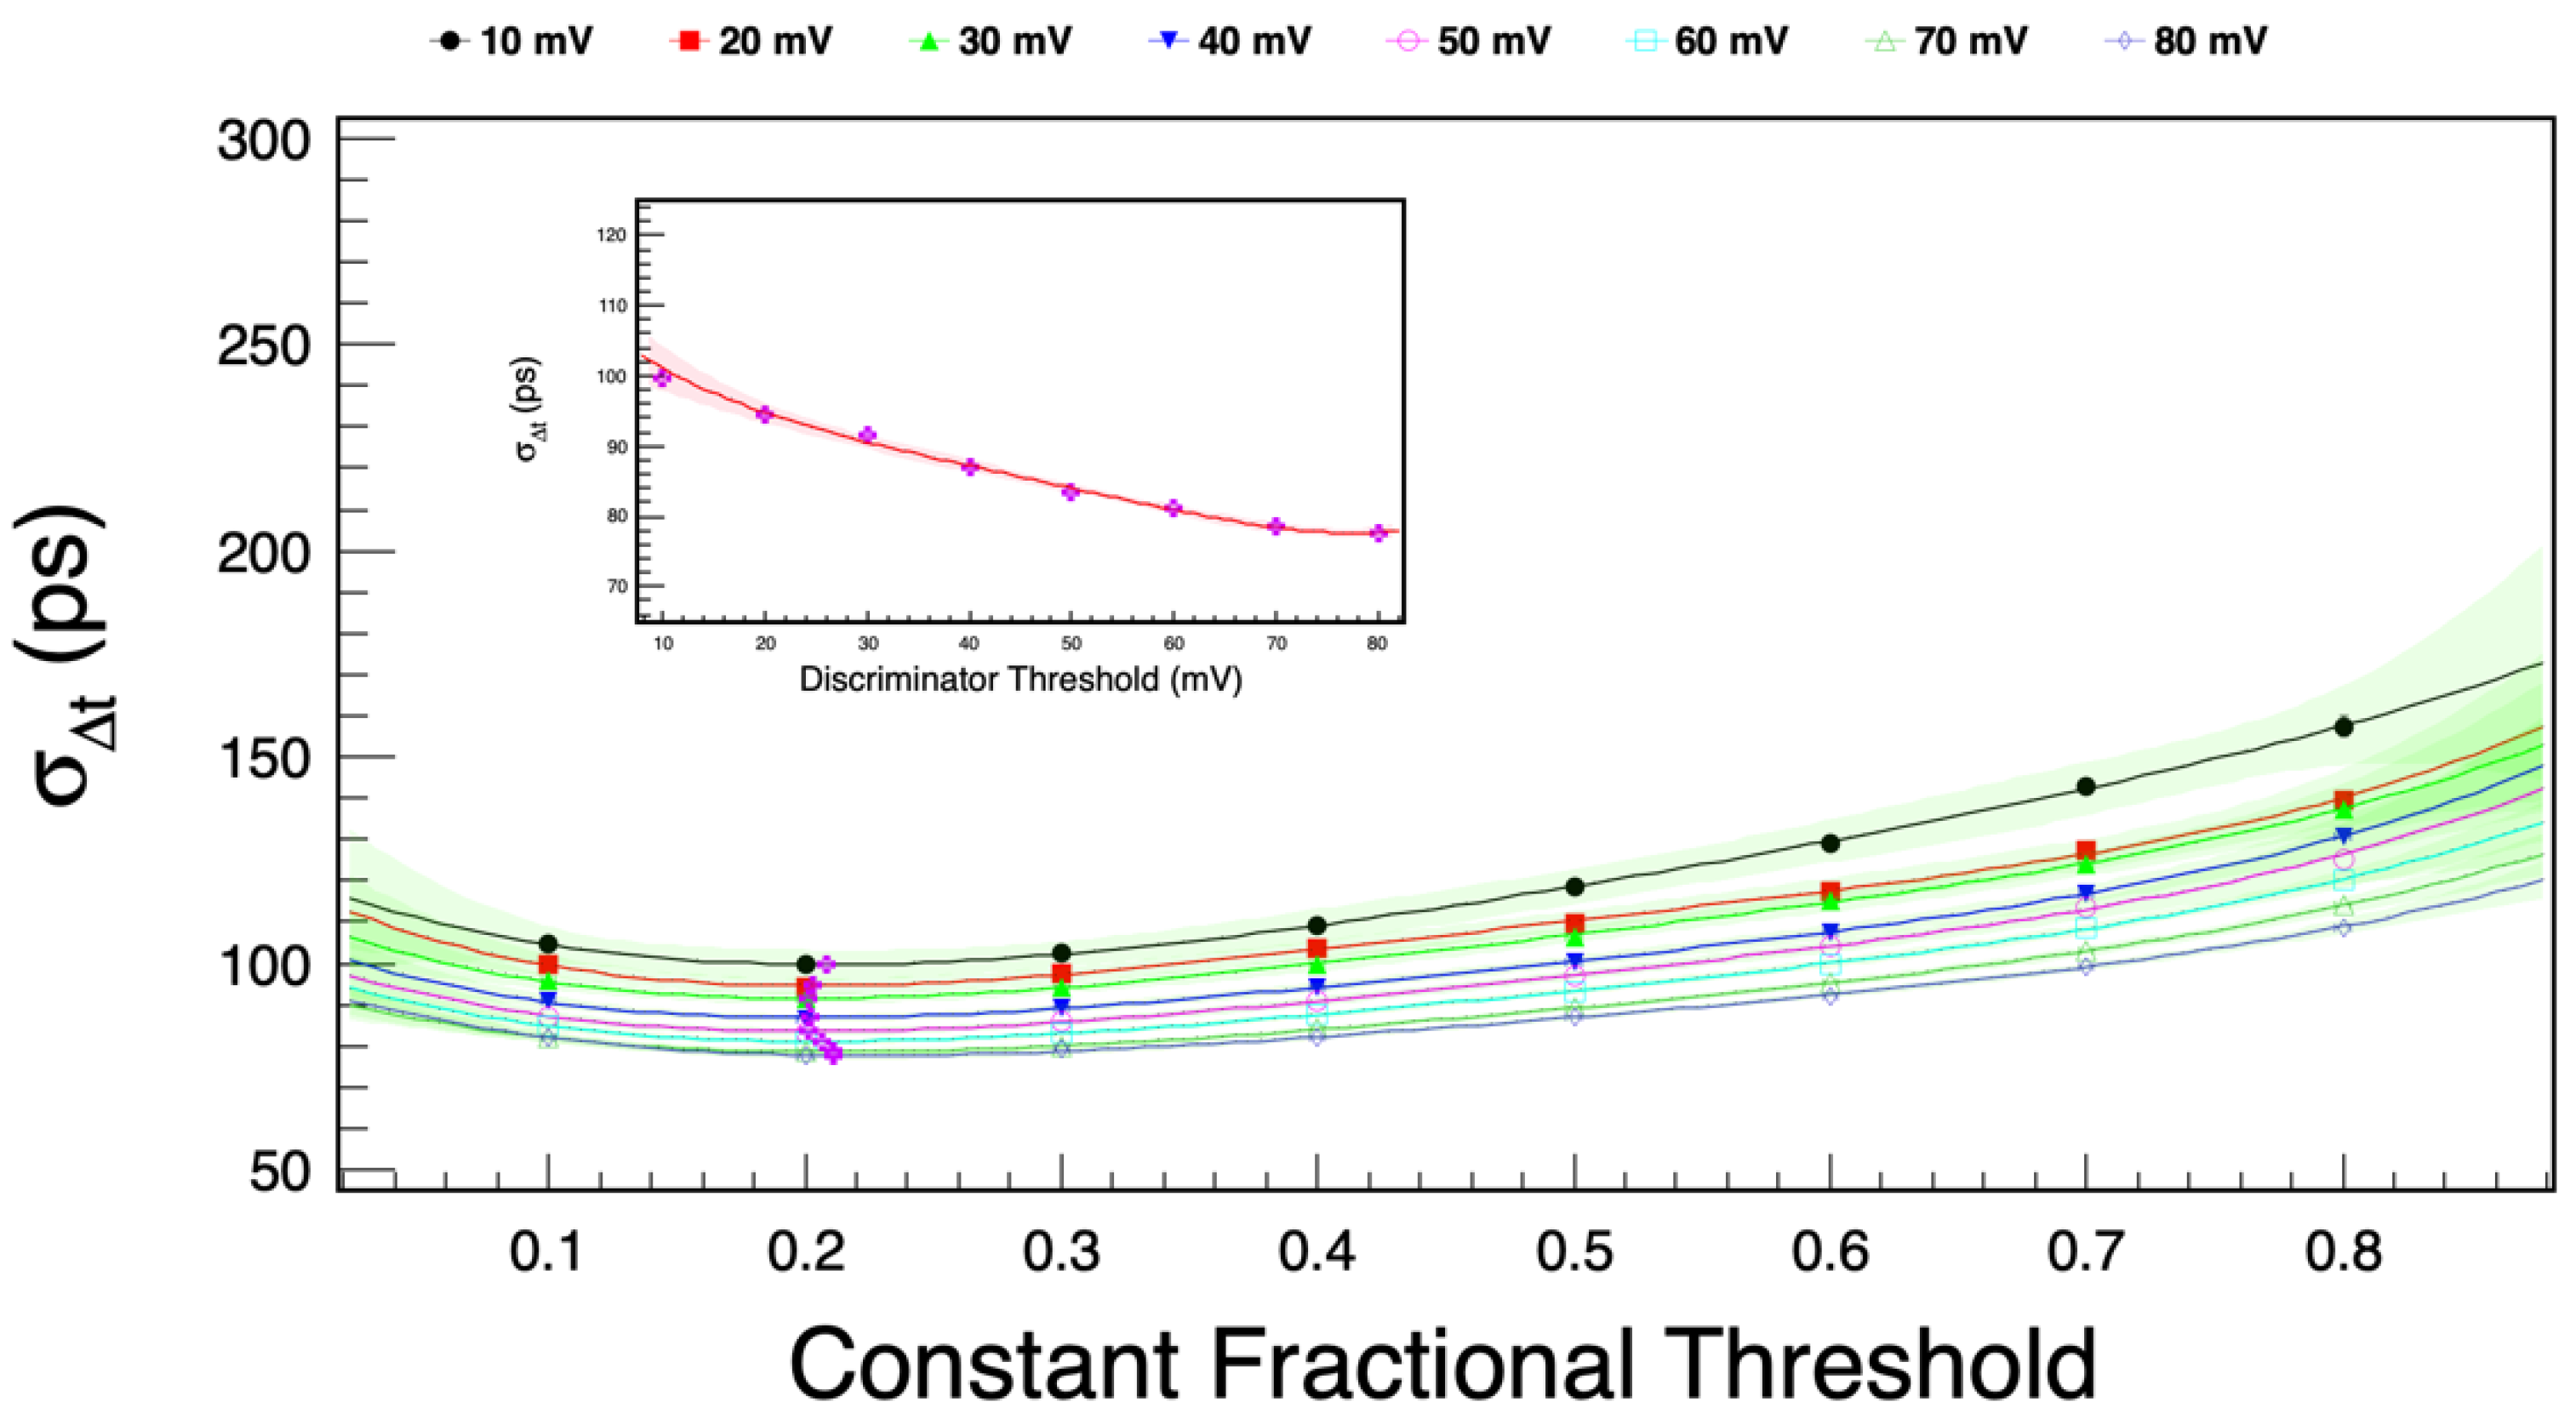
4.5. Time Resolution vs. Bias Voltage
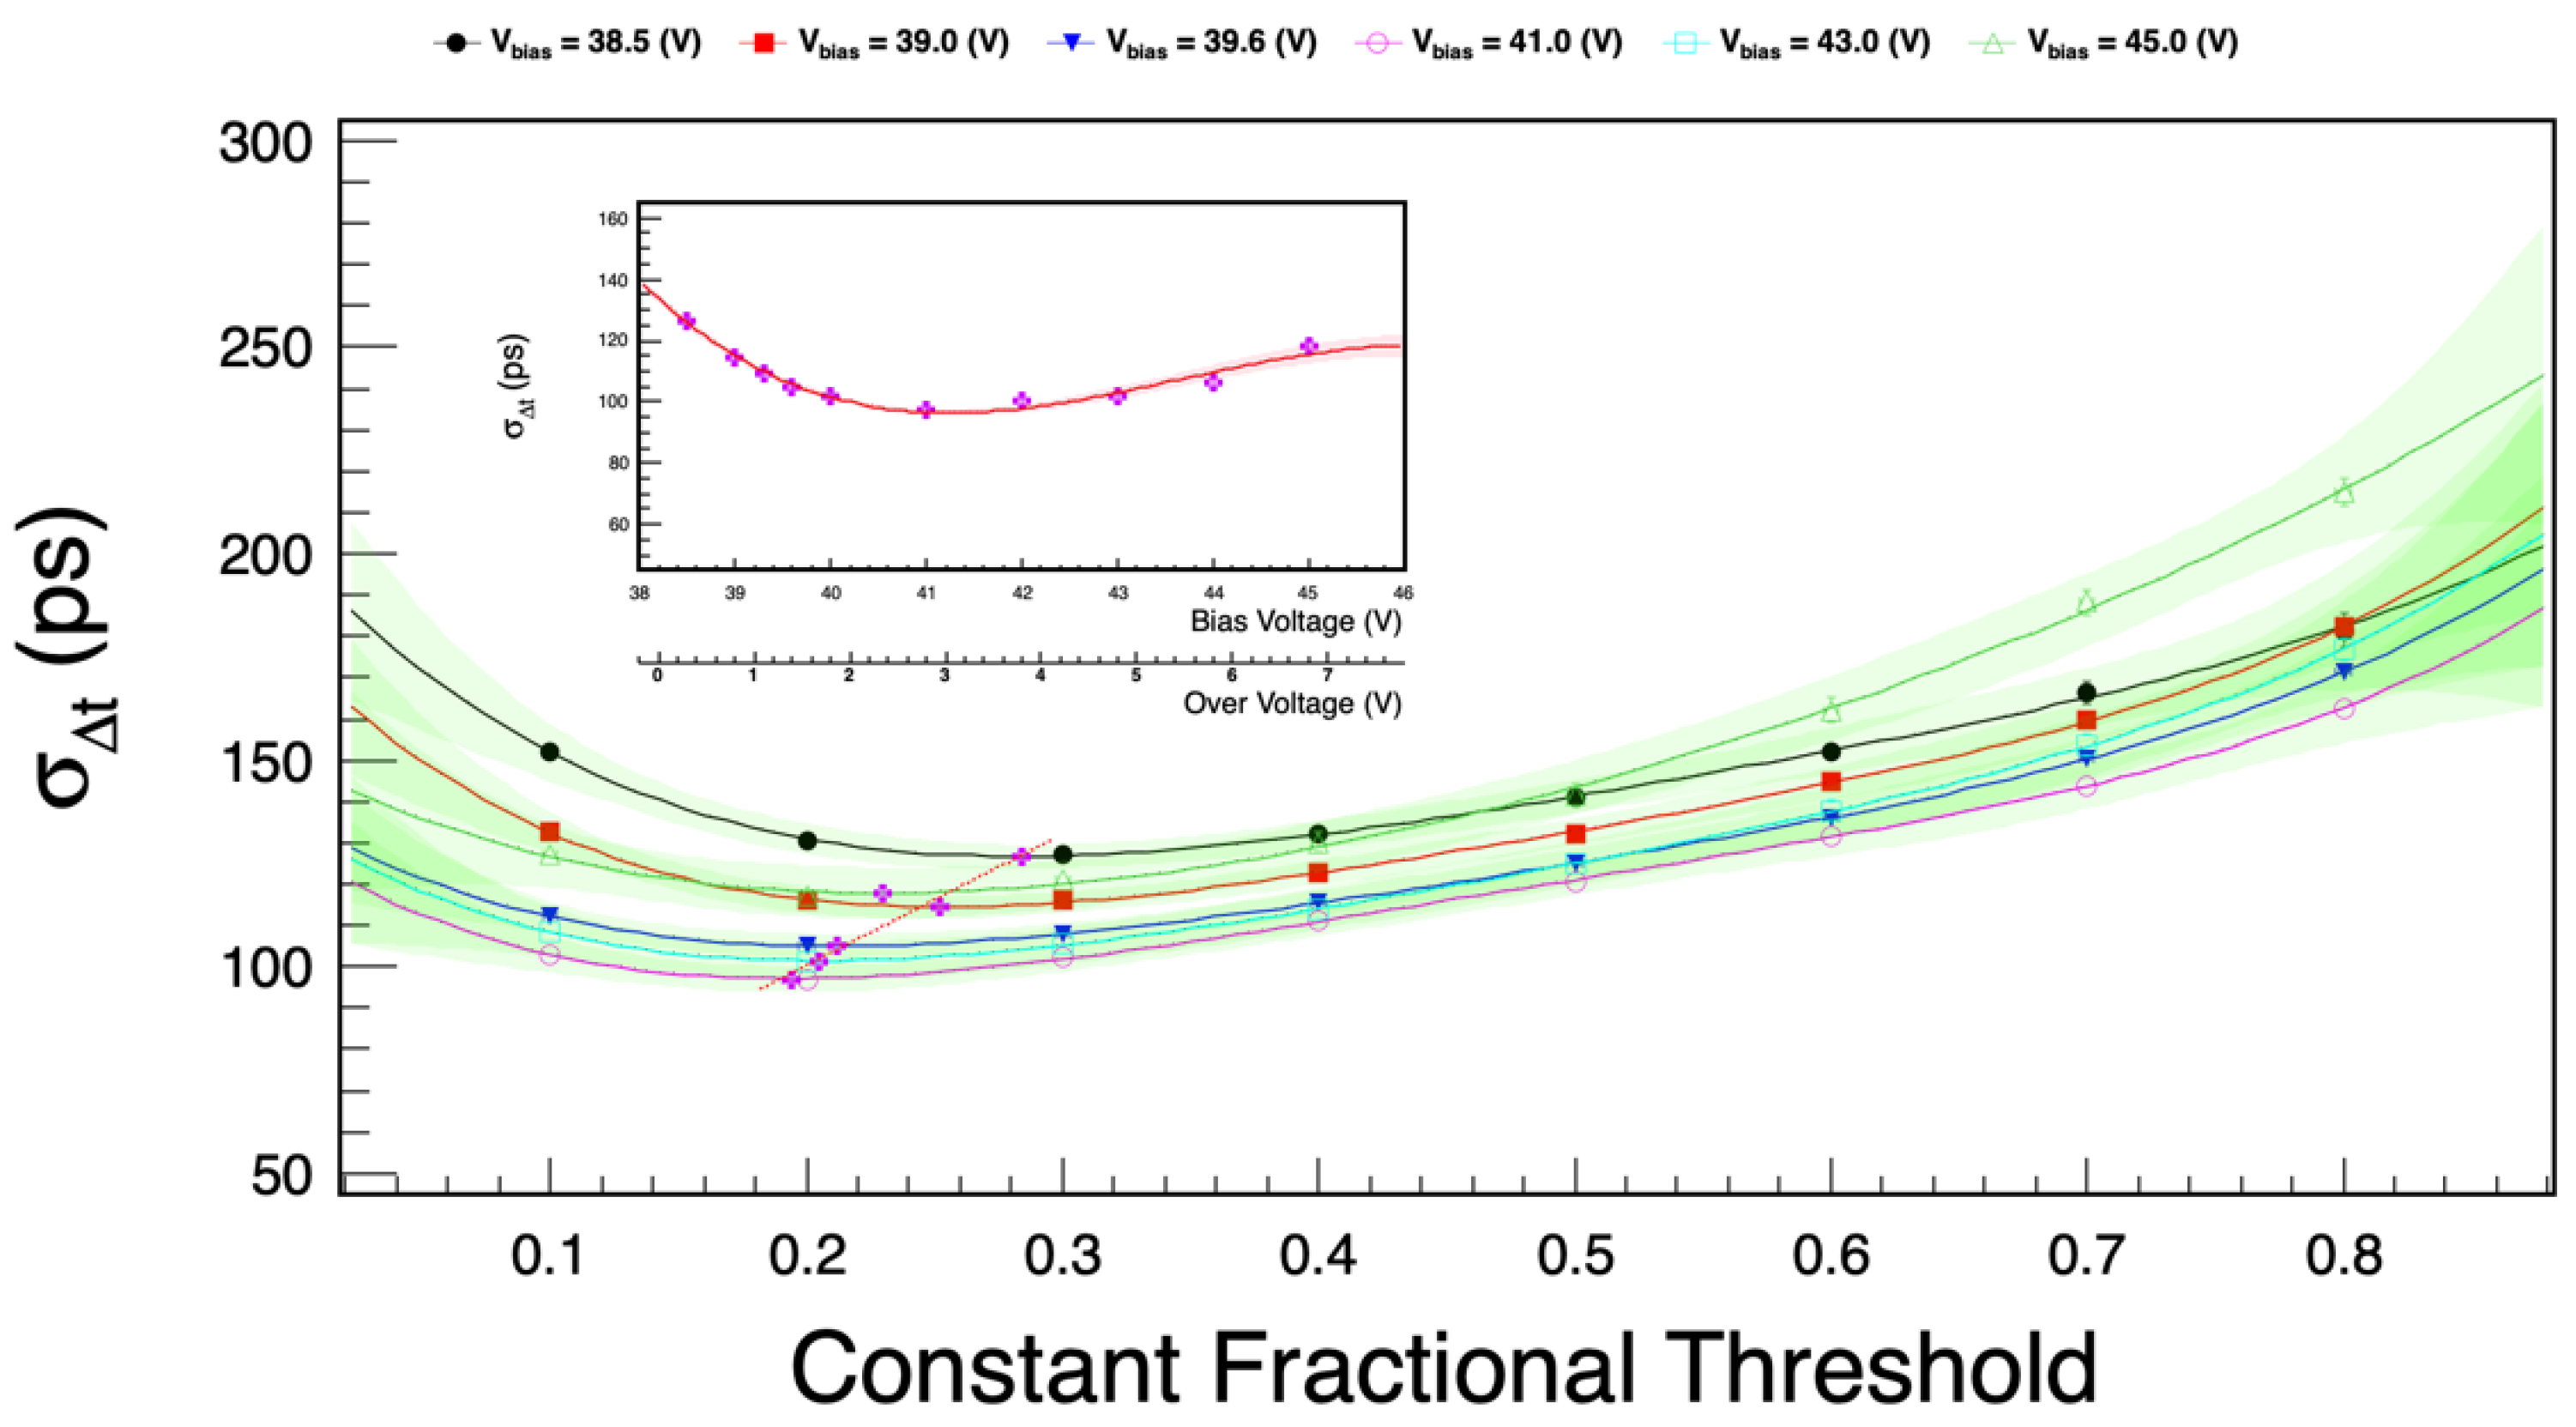
At a low constant discriminator threshold of 10 mV, we varied the bias voltage
of the SiPM from 38.5 V to 45.0 V and recorded the pulse shapes at a temperature of +23 °C. This low threshold collects the events matching an average electron energy of 0.5 MeV. At each bias voltage, the fractional threshold level varies from 0.1 to 0.9 in a step of 0.1. The obtained values for the CTR are shown in
Figure 11.
The minimum time resolution is obtained for a constant fractional threshold level between 0.2 and 0.3 anti-correlated with the bias voltage and consistent with the expectation from Equation (
7) that the optimum time resolution is achieved when the pulse height derivative (
) is at its maximum.
The time resolution manifestly improves when the bias voltage is increased to above
V due to enhanced PDE, gain and SNR, as shown in Equations (
1) and (
7), but it starts deteriorating above
V (or
V) due to dark current noise, crosstalk and afterpulse effects, which are expected to increase with
[
19].
The best time resolution achieved is at an overvoltage of V.
4.6. Time Resolution vs. Discriminator Threshold
At a constant overvoltage of V and operating temperature of +23 °C, the time resolution dependency on the deposited energy of the electrons is estimated by varying the level of the discriminator threshold from 10 mV to 80 mV in steps of 10 mV.
Figure 12 illustrates the CTR measurements. The optimum time resolution is obtained for a constant fractional threshold of 0.2 (20%) consistent with the previous result of bias voltage scan.
The effects of timing jitter on the CTR are most significant at low discriminator thresholds because at high thresholds, more photo-electrons are created. As the discriminator threshold increases, electrons of higher energy are collected. The deposited energy can be estimated by comparing the average pulse height with the end point of the pulse height spectrum. At a discriminator threshold of 45 mV, the average pulse height matches about 1 MeV electrons close to an MIP. At this point, the time resolution is ps. The first error is a statistical error from the fit, and the second is a systematic error estimated by considering a temperature uncertainty of 0.1 °C and a source position uncertainty of ±2 mm.
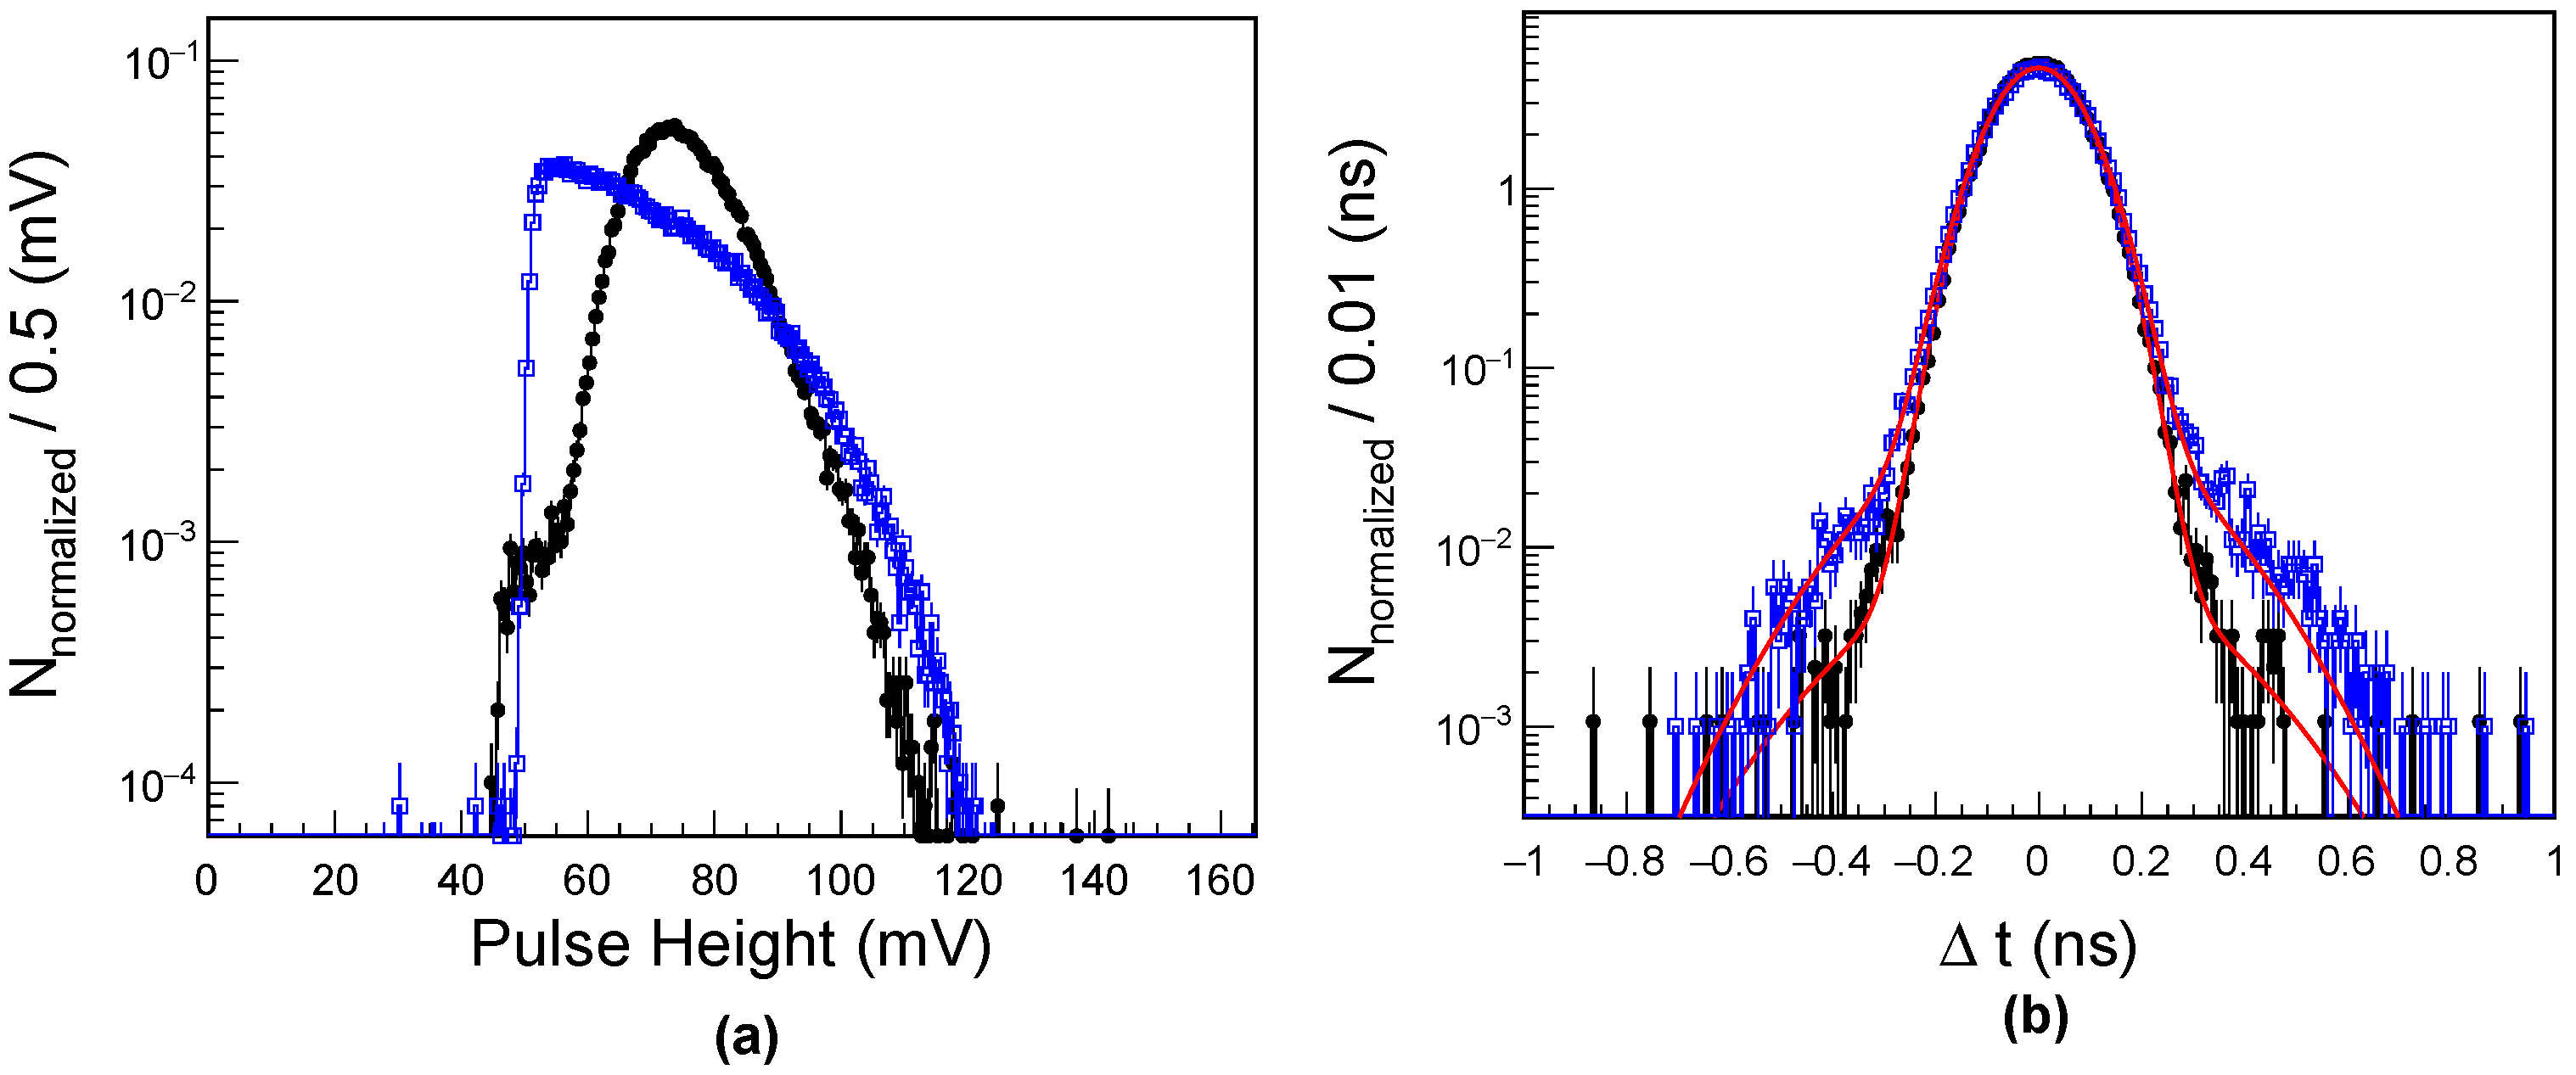
An external trigger counter was mounted behind the 120 mm scintillator to select MIPs from 90Sr to validate the time resolution obtained with the internal self trigger. The external trigger counter consists of a 10 × 10 × 6 mm3 scintillator (EJ-232) read out by two SiPMs (S14520-6050VS) for a coincidence trigger.
In the external trigger setup, the events are selected by using the same discriminator threshold of 45 mV at
V. In
Figure 13, the pulse heights and the CTR results are compared with the internal trigger mode. In
Figure 13a, the external and the internal triggered pulse height spectra are shown. Compared with the internal trigger mode, the mean value of the pulse amplitude is 10% higher, and the selected events are mostly electrons between 1 and 2 MeV, i.e., MIP-like particles [
14]. In the internal trigger mode, non-MIP-like low energetic electrons contribute to the signals and worsen the measured time resolution, as shown in
Figure 13b. The measured time resolution with the external trigger is
ps. The systematic error is estimated by varying the threshold of the external trigger.
4.7. Time Resolution vs. Operating Temperature
The sensitivity of the SiPM depends on the product of the photon detection efficiency (PDE) and the gain (G), as described in Equation (
1). Both factors depend on the overvoltage (
), which is strongly correlated with the temperature due to the strong temperature dependency of the breakdown voltage (
), as expressed in Equation (
3). This temperature-induced change of
affects not only
but also other characteristics of SiPM, such as PDE, gain, dark count rate, crosstalk and afterpulse probability [
19]. However, the light output of the scintillator is constant in the temperature range between −60 °C and +20 °C, as discussed earlier.
The temperature dependency of the CTR is examined by decreasing the operating temperature from +23 °C to −30 °C, while the bias voltage is varied to keep the same overvoltage
according to Equation (
4), and the discriminator thresholds are set as in
Section 4.5 and
Section 4.6. It should be noted that the bias voltage is applied considering temperature compensation.
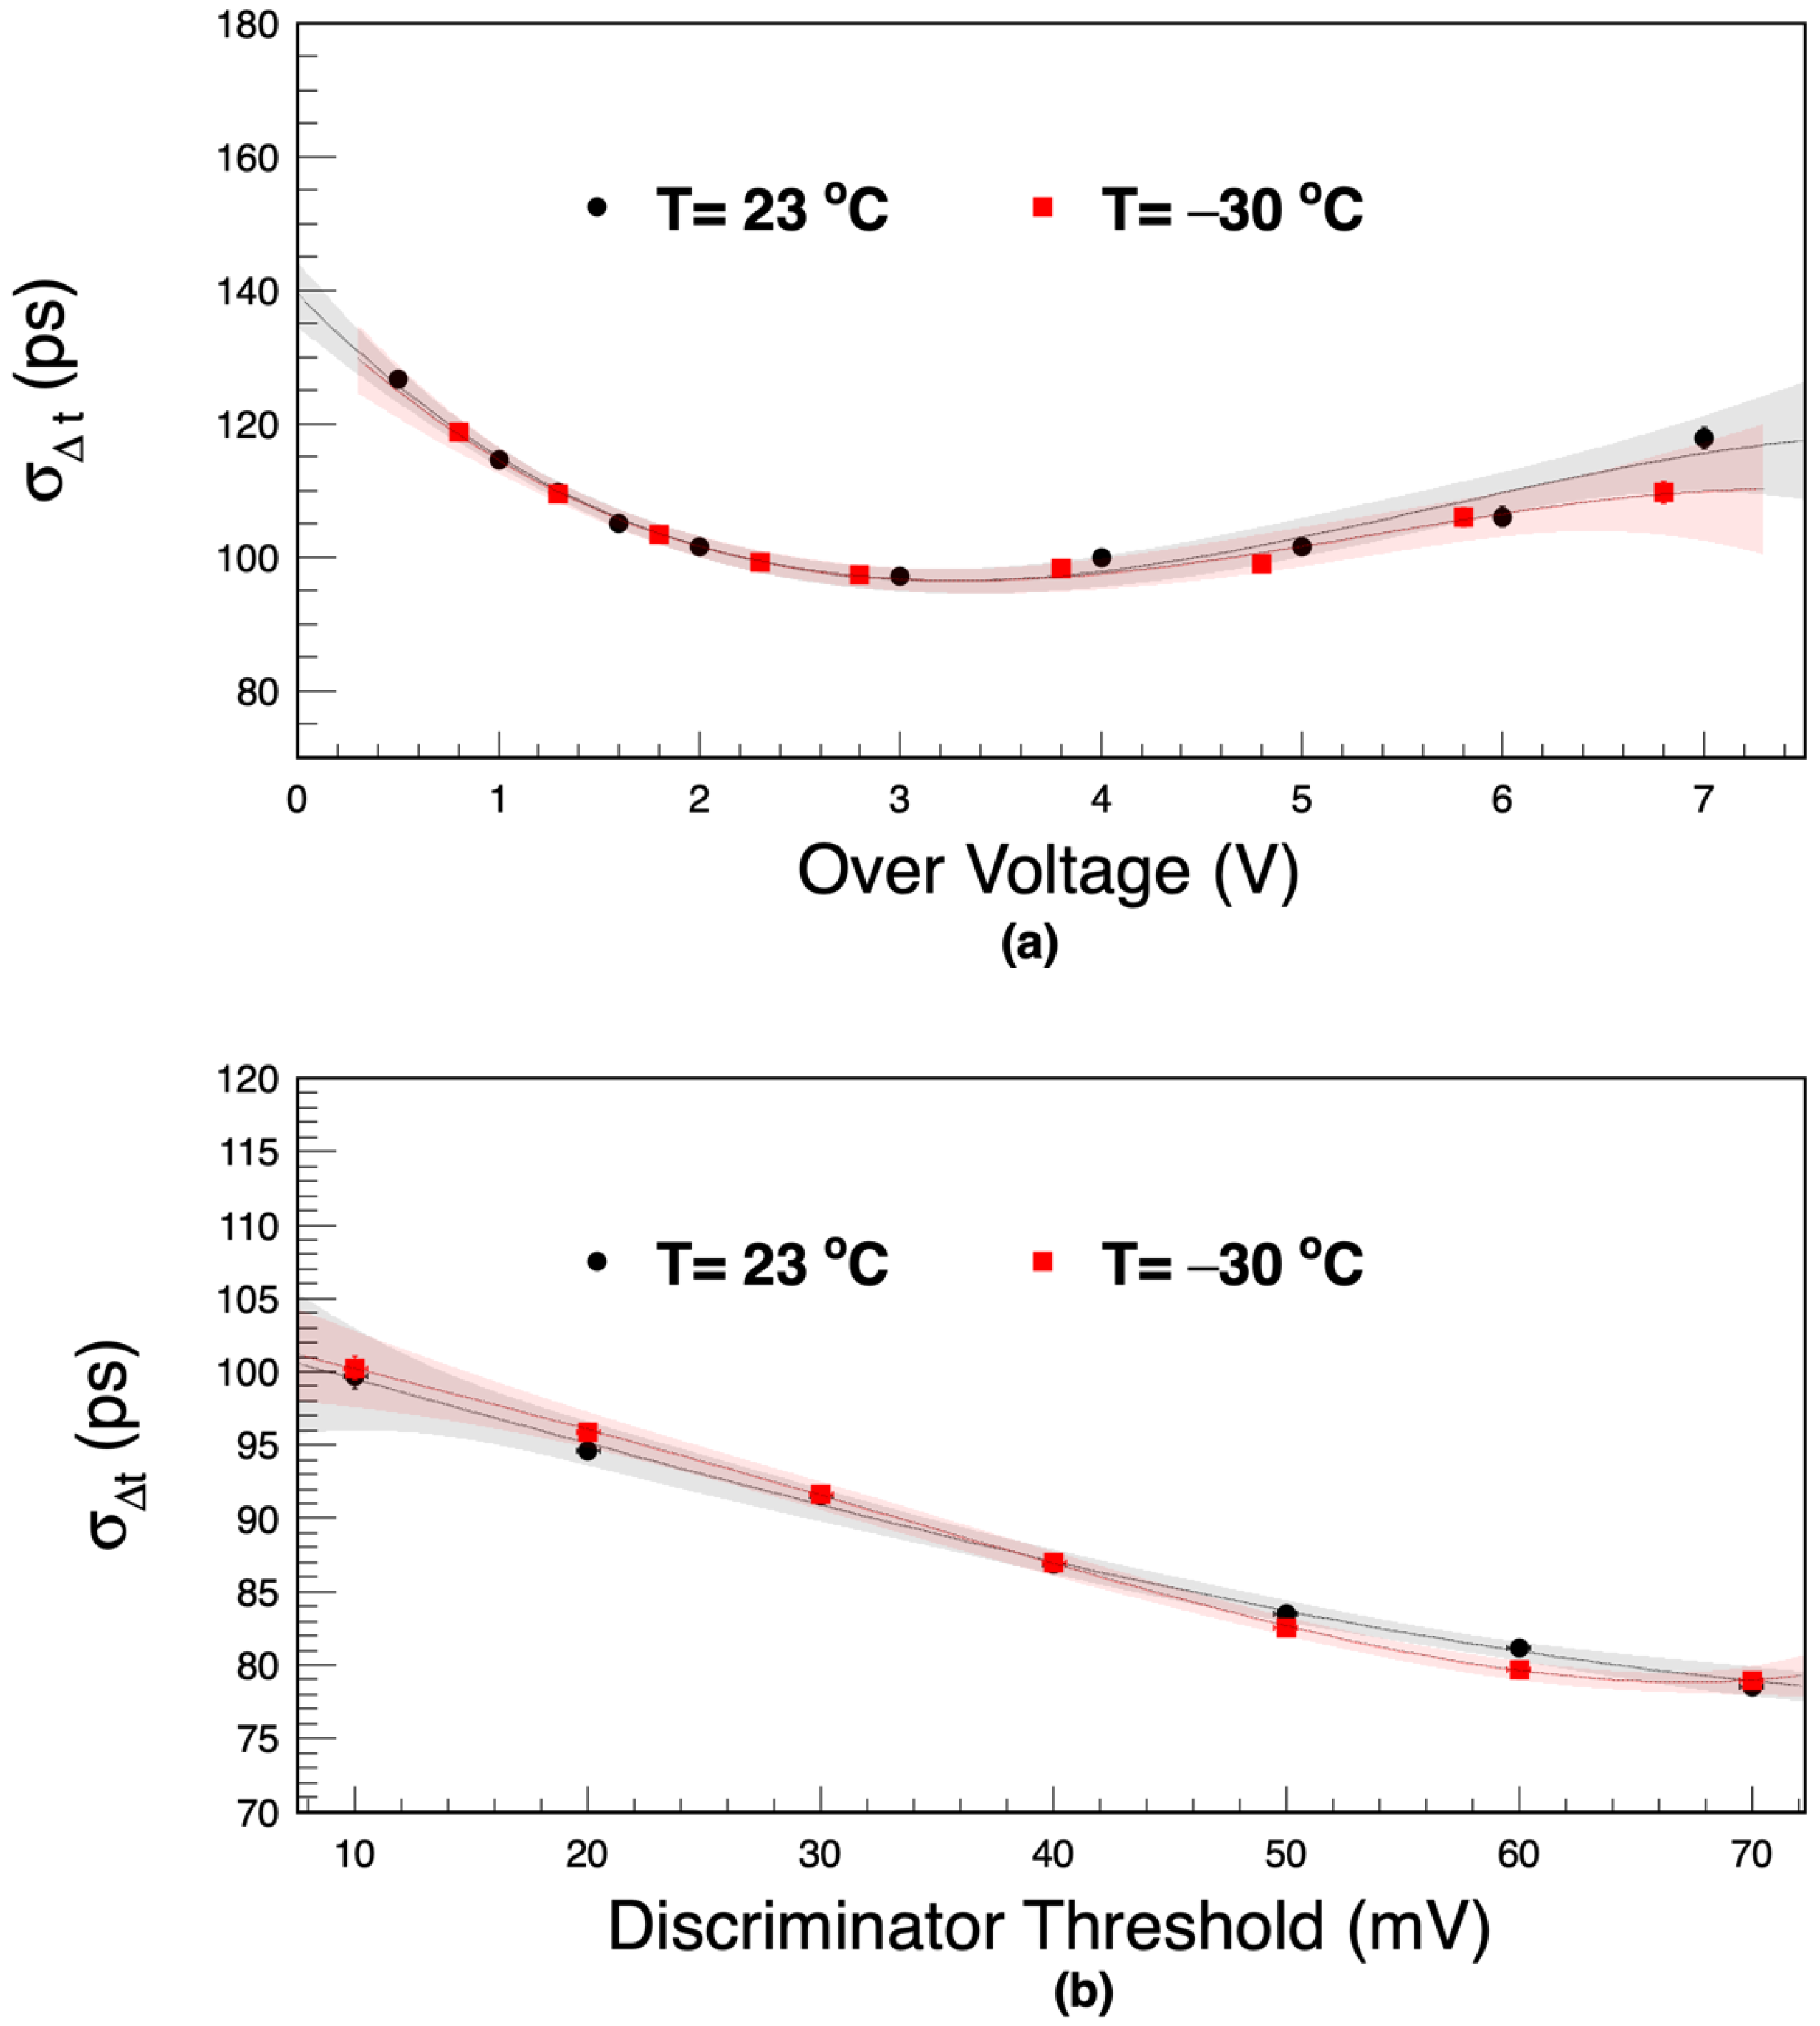
To compare the results of the CTR behavior for both temperatures, the CTR is studied as a function of overvoltage and discriminator threshold, as presented in
Figure 14.
As already mentioned in
Section 3.3, the breakdown voltage (
) shifted from 38 V to 36 V as the operating temperature decreased from +23 °C to −30 °C.
Figure 14a shows the measured CTR at a low discriminator threshold of 10 mV. For both temperatures, the CTR as a function of overvoltage has a minimum of
ps at
V.
This implies that for the temperature range studied here the time resolution is independent of the temperature, provided that the overvoltage remains the same. A minor difference of the CTR above
V might be the result of the reduced dark counts and the reduced probability of optic crosstalks at cold temperatures [
19,
20].
In
Figure 14b, the CTR is measured as described in
Section 4.6 at the same overvoltage of
V while changing the operating temperature. At −30 °C, the time resolution reaches
ps at a threshold of 45 mV, where the average deposited energy of the electrons is close to an MIP (
MeV). This fact is consistent with the result obtained at +23 °C.
5. Conclusions
A TOF prototype for the AMS-100 experiment has been constructed and its performance has been studied under different operational and environmental conditions. This prototype consists of a 120 mm-long scintillator tile with a surface area of (25 × 6 mm2) coupled to two SiPMs at its opposite sides. To optimize the time resolution, each SiPM combines four channels into one readout channel by a hybrid connection, and its signal is fed into a high-speed waveform digitizer. By using a radioactive 90Sr source, a time resolution of ps is obtained for MIP-like particles in the external trigger mode.
This result significantly improves the time resolution of 50∼60 ps reported previously by PANDA and MEG II. This achievement is the result of the use of a new type of SiPM that not only covers the full cross-section of the scintillator at both ends but also offers an improved time resolution over a broad overvoltage range compared to previous SiPMs. Moreover, this work demonstrates the fact that even under different temperature conditions, the time resolution of the TOF counter remains stable provided that the overvoltage is kept the same.
The expected improvement in time resolution of a factor of two from the improved scintillator surface coverage could not be demonstrated. For this purpose, the capacitance (C) of the chosen SiPM (S14161-6050HS, pF, area 6 × 6 mm2, 16 channels) is too large. The SiPM from Hamamatsu (S14161-3050HS, pF, area 3 × 3 mm2, 64 channels) will be used to investigate the impact of the capacitance in detail while keeping the scintillator surface coverage at the same level.
In addition, further improvements can be expected from new SiPM technologies [
21,
22].


 ,
, 