Article

Pulse-Height and 2-D Charge-Spread Single-Pixels Studies on a LuYAP:Ce Scintillation Array

1
Independent Researcher, 00100 Rome, Italy
2
ENEA—Italian National Agency for New Technologies, Energy and Sustainable Economic Development, TERIN-ICT, 00100 Rome, Italy
3
Department of Molecular Medicine, Sapienza University of Rome, 00100 Rome, Italy
4
Department of Medico-Surgical Sciences and Biotechnologies, Sapienza University of Rome, 00100 Rome, Italy
*
Author to whom correspondence should be addressed.
Instruments 2021, 5(3), 26; https://doi.org/10.3390/instruments5030026
Submission received: 6 April 2021 / Revised: 25 July 2021 / Accepted: 25 July 2021 / Published: 30 July 2021

Abstract

:
The present work deals with a 10 × 10 array of (Lu0.7Y0.3)AP:Ce 2 × 2 × 10 mm3 pixels, manufactured by Crytur (Cz), that has been utilized in a previous paper. The crystal-array has been coupled to an 8 × 8 anodes H10966 model Hamamatsu (Jp) Position-Sensitive Photo Multiplier Tube (PSPMT) connected to electronics for single events scintillation read-out. The response of such a detector has been studied under Co-57, or Ba-133, or Cs-137 gamma-ray emissions, as well as with Lu-176 self-activity only. The present work is aimed at characterizing the individual crystal-pixels’ single-event responses in terms of pulse-height and of spreads of the 2-D charge-distributions. In particular, the charge-spread characterization pointed out several defects in the crystal-array assembly, not detected by usual pulse-height studies. The diagnostic method based on charge-spread analysis seems also well suited for scintillation array characterizations for gamma-ray detectors studies, as well as for quality controls of such pixelated devices during the lifetime of systems in the field of radionuclide medical imaging (SPECT and PET). The method is also appropriate for other applications where gamma-ray spectroscopy is required, like nuclear physics, astrophysics, astroparticle physics, homeland security, and non-proliferation.

1. Introduction

The first citation of an assembly based on a scintillation array for Single-Photon Emission Computed Tomography (SPECT) goes back to 1993 when R. Pani et al. presented a prototype made of a YAlO3:Ce (YAP:Ce) pixelated scintillation crystal coupled to a PSPMT [1].
The use of a pixelated scintillator recalls the former multi-crystal 2-D detector-block of M. E. Casey and R. Nutt (1986) for Positron Emission Tomography (PET). The block was made of a 32 × 8 array of Bi4Ge3O12 (BGO) scintillation crystals coupled, through an appropriate light guide, to four single-channel Photo-Multiplier Tubes (PMT)s for position evaluation [2]. A relevant physical difference between SPECT and PET techniques arises from the value of the energy of photons produced by the radio-traced pharmaceuticals previously administrated to the patient. Typical photon-energy values in the practice of radionuclide medical imaging are 140.5 keV from Tc-99m and 511 keV from β+ annihilation for SPECT and PET, respectively. Nuclear medicine diagnostics utilize several radio-tracers whose emissions are in the intermediate range between the cited ones, like in the case of In-111, emitting 171.3- and 245.4-keV gamma-rays. Therefore, the physical processes playing a role inside the scintillator in the energy-range of interest refer to photo-electric and scattering interactions. Both the processes may give rise, in a scintillation-array made of a few millimeters cross-dimensions crystal-pixels, to interactions involving multiple crystal-pixels that are seen as occurring at the same time in the time-scale of the electronic acquisition system. Consequently, a charge-quantity is produced at the photo-cathode also in correspondence of the crystal-pixel(s) different from the primary. This results in a mispositioning of the event whose calculation is based on the scintillation light intensities released in the involved pixels, and on the coordinates of their axes. The primary goal of the present work is to show how the events involving multiple crystal-pixels may be identified and rejected by using the single-event charge-spread information.
The main performance parameter characterizing a radionuclide imager is the system spatial resolution which, for SPECT cameras, mainly depends on the collimator specifications. A constraint for PET systems consists of the β+ emission, which is detected through the two 511 keV gamma-rays emitted during the β+ annihilation process occurring in the proximity of a nucleus. So, the spatial resolution of a PET system is also affected by the β+ range in the body [3] and by the acollinearity of the two gamma-rays [4]. Another factor affecting both PET and SPECT systems is the inter-crystal-scatter which, more generally, regards the events releasing energy in multiple crystal-pixels of an array [5,6]. Due to these events, the popular Anger’s centroiding algorithm [7] necessarily produces values of spatial coordinates different from those of the primary interaction. A solution to the problems arising from the inter-crystal scatter may be provided through the evaluation of the symmetry of the 2-D single-event charge-distributions that allow the rejection of unwanted events.
Previous works have published some preliminary results in recent years [8,9,10], where the motivations for choosing LuYAP:Ce crystals, as well as references about the scintillator itself, have been presented. In brief, some characteristics are summarized here. The (Lu0.7Y0.3)AP:Ce scintillator shows good light yield and energy resolution (≈8% at 662 keV) and short decay time (about 21 ns) with a density of 7.2 g/cm3. Furthermore, good mechanical properties such as being free of cleavage planes and the lack of hygroscopicity make the material easy to be cut and polished and attractive for array machining with a wide possibility of optical treatment surfaces [8].
Accurate characterizations of pulse-height and charge-spread responses of individual crystal-pixels of the array were carried out on four data-takings dealing with Co-57, or Ba-133, or Cs-137 point-source irradiation (whose major nuclear gamma emissions range from 122.5- to 661.7-keV) or Lu-176 self-activity, respectively. The results pointed out noticeable spreading in pixel-results of both pulse-height and charge-spread values over the entire array of crystal-pixels, markedly for charge-spread values. The differences between the pixel-results have suggested searching for subsets of crystal-pixels showing rather uniform values with enough statistics (see Section 3.3 and see Section 3.4). Due to the lack of homogeneity between the single-pixel charge-spread results, eight decuples (in mathematics, a “decuple” is a list of 10 elements) of crystal-pixels per data-taking, were picked out, each decuple totalizing around 20,000 events that assure enough statistics. Four decuples regarded the pulse-height response, and the other four the charge-spread behavior.
The rules for picking out the representative decuples are described in Section 3.1 and Section 3.2, while Section 3.3 reports on the pulse-height and charge-spread results from the selected decuples.
As the graphical results put together a huge number of items (basic plots are in the order of: 100 crystal-pixels × 5 parameters (Qnet, FWTMx, FWTMy, Fsym, Cx, Cy), ×4 radiation sources ≈ 2000 items), the most important plots have been reported in the body of text or, for a reasonable number of cases, as well as, among the additional materials, in Appendix A. The body of text reports aggregated results, while Appendix A includes the items referred to in the text. Additional plots supporting the concepts expressed in the text have been identified by the letter “A” followed by two-digit numbers. This layout of the manuscript leaves the choice up to each individual reader whether to access experimental details. Given this, many plots deemed to have minor importance, have been omitted in order to keep the manuscript length down to an acceptable dimension. Nevertheless, as is customary for the readers, details may be requested from the corresponding author.
It is worth recalling that the physical meaning of the spreads of the 2-D charge profiles is in connection with the single-event charge distribution at PSPMT anodes following a scintillation spot. This concept is not to be confused with the distribution of centroids of events (Cx, Cy) from an entire data-taking. The second is usually referred to as the Point Spread Function (PSF) of the detector.

2. Materials and Methods

The experimental setup is hereafter summarized from [8,9,10]. The (Lu0.7Y0.3)AP:Ce crystal-pixels, were grown by Opto Materials (It). Pixels, polished on all sides, were 2 × 2 × 10 mm3 sized. The 10 × 10 array of pixels was assembled by Crytur (Cz) by using composite layers made of dielectric adhesive film as inter-pixel coatings (average thickness 0.020 ± 0.005 mm). The overall array dimensions were (20.42 ± 0.05) × (20.42 ± 0.05) × (9.96 ± 0.01) mm3 and its weight was 29.46 ± 0.01 g. The external coating of the array was made of an aluminum sheet, 0.1-mm thick. The crystal-array was coupled, with a layer of BC630 optical grease by Saint Gobain (Fr), to the 1.5 mm thick optical window of an H10966-100-Mod8 Hamamatsu PSPMT Assembly (Jp), having 8 × 8 square anodes with 6.125 mm average side. The photo-cathode, with 35% quantum efficiency, as well as the overall anodic surface area were 49 × 49 mm2 sized. Anodes were individually connected to a charge amplifier designed as an integrator with a reset. Charge readout was performed by using four PCBs (for 14-bit digitization) directly connected to the four back-connectors of PSPMT assembly. An FPGA board with a 100 MHz clock was used for data acquisition and a CPU carried out the data storage via USB 2.0. The readout sequence starts with a step of charge-feedback capacitors reset by a sequence 1.2 μs long. Secondly, after a random amount of time, a scintillation event is detected (start of acquisition) and the charge-integration is enabled for a time-interval 1 μs long. QUIne
Three data-takings were carried out by using Co-57, or Ba-133, or Cs-137 radio-isotopic sources, 1-mm in diameter, positioned at a 10-cm axial distance from the crystal-array center. A fourth data-taking was performed without external sources, for studying the Lu-176 self-activity emissions. Data unfolding was performed by using a MATLAB-based (The MathWorks, Inc., Natick, MA, USA) procedure developed for off-line processing of single-events charge list-files from a given data-taking [9]. The procedure can be described by the main following steps: (a) preparation of X- and Y-charge-profiles from single-anode data; (b) an X- and Y-profiles fitting procedure by using a suitable scintillation light-distribution model; (c) evaluation and storage of values of physical quantities characterizing the events.

3. Crystal-Array Characterizations

Single-events were characterized by the basic physical quantities net charge Qnet (Qnet stays for single-event net charge after the subtraction of a possible pedestal or offset due to a pile-up of events or to the non-effective base-line restoring circuits from a saturation, or other, in charge units (ch.u.)), and charge-distribution spreads along axes Full Width at Tenth Maximum (FWTMx), and FWTMy by means of their linear combination Fsym (in brief, the value of Fsym represents the distance between the point representing a given event and the bisector of the first quadrant of the plane (FWTMx, FWTMy), that is, the distance from the ideal symmetry, in mm. See also Section 3.3).
The crystal-array characterization was carried out by using Co-57 or Ba-133 or Cs-137 radio-isotopic point sources (located at a 10-cm distance from the scintillator), whose major nuclear gamma emissions range from 122.5- to 661.7-keV, or under Lu-176 self-activity only. In the following, the data-takings have been referred to in the above-cited sequence.
The mean free-path values corresponding to highest-yield gamma-ray emissions from radio-isotopic sources are 0.97, 8.4, or 16.2 mm at 122.5, 356.0, 661.7 keV, respectively.

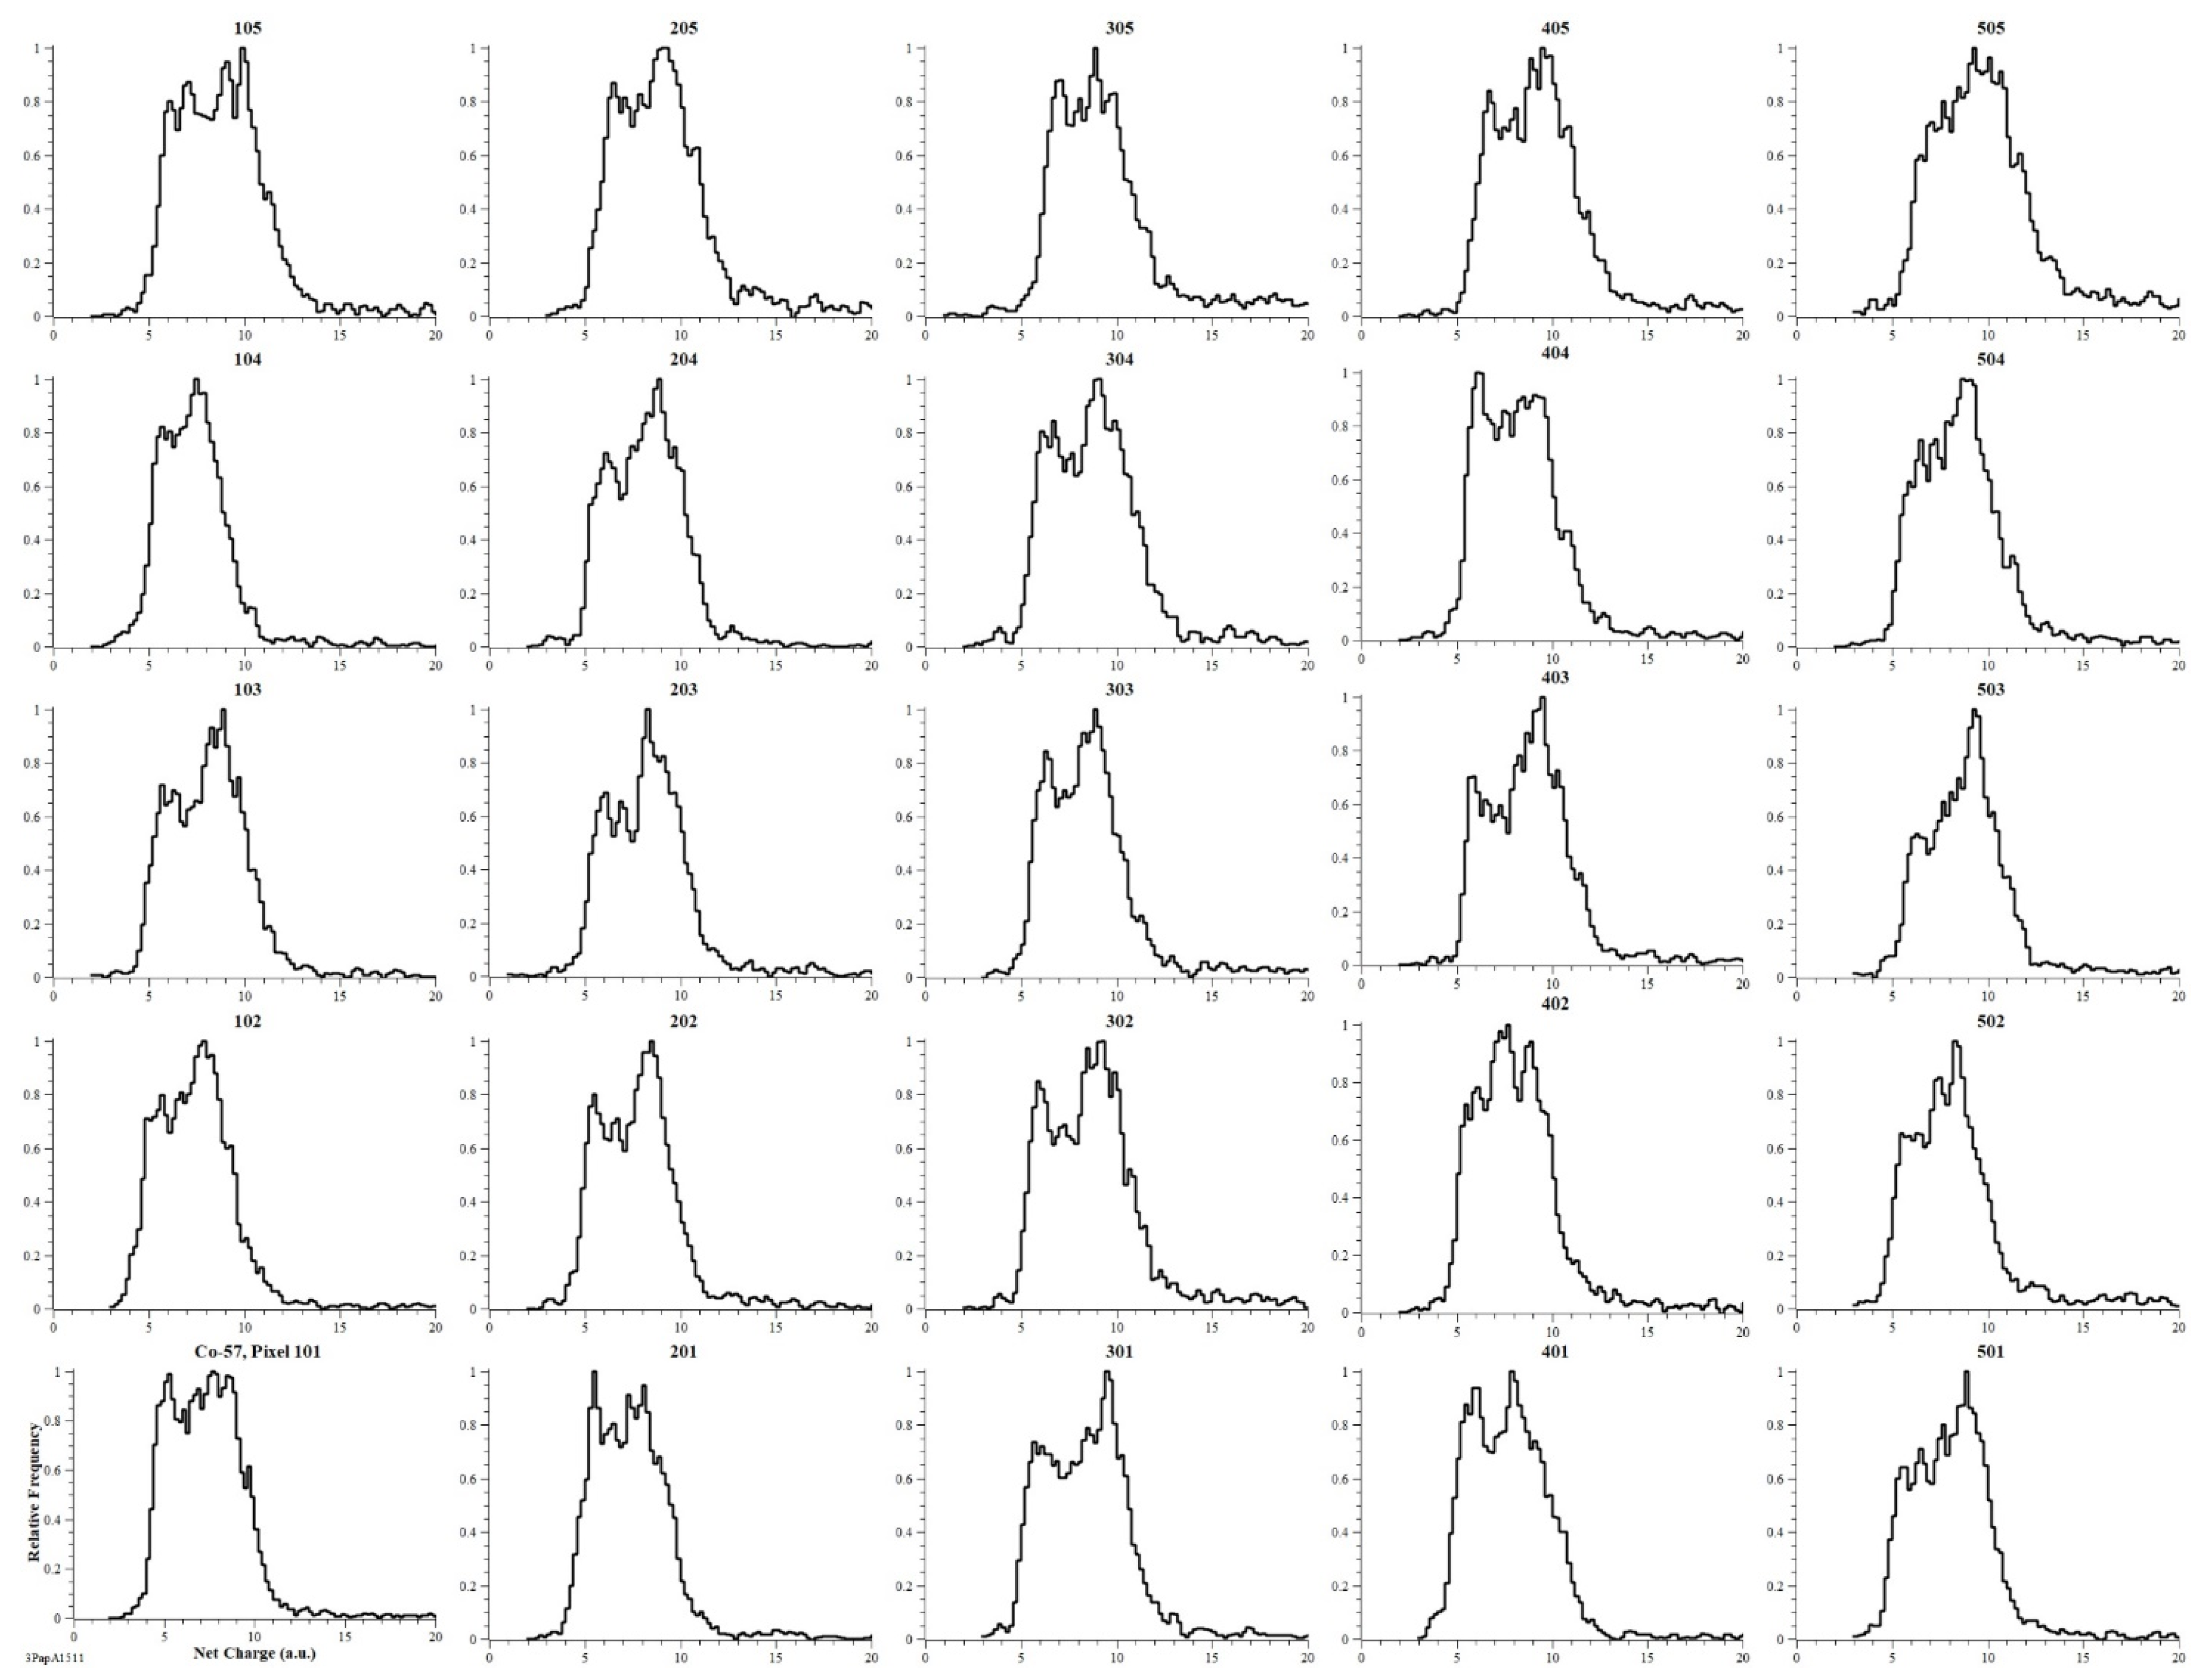
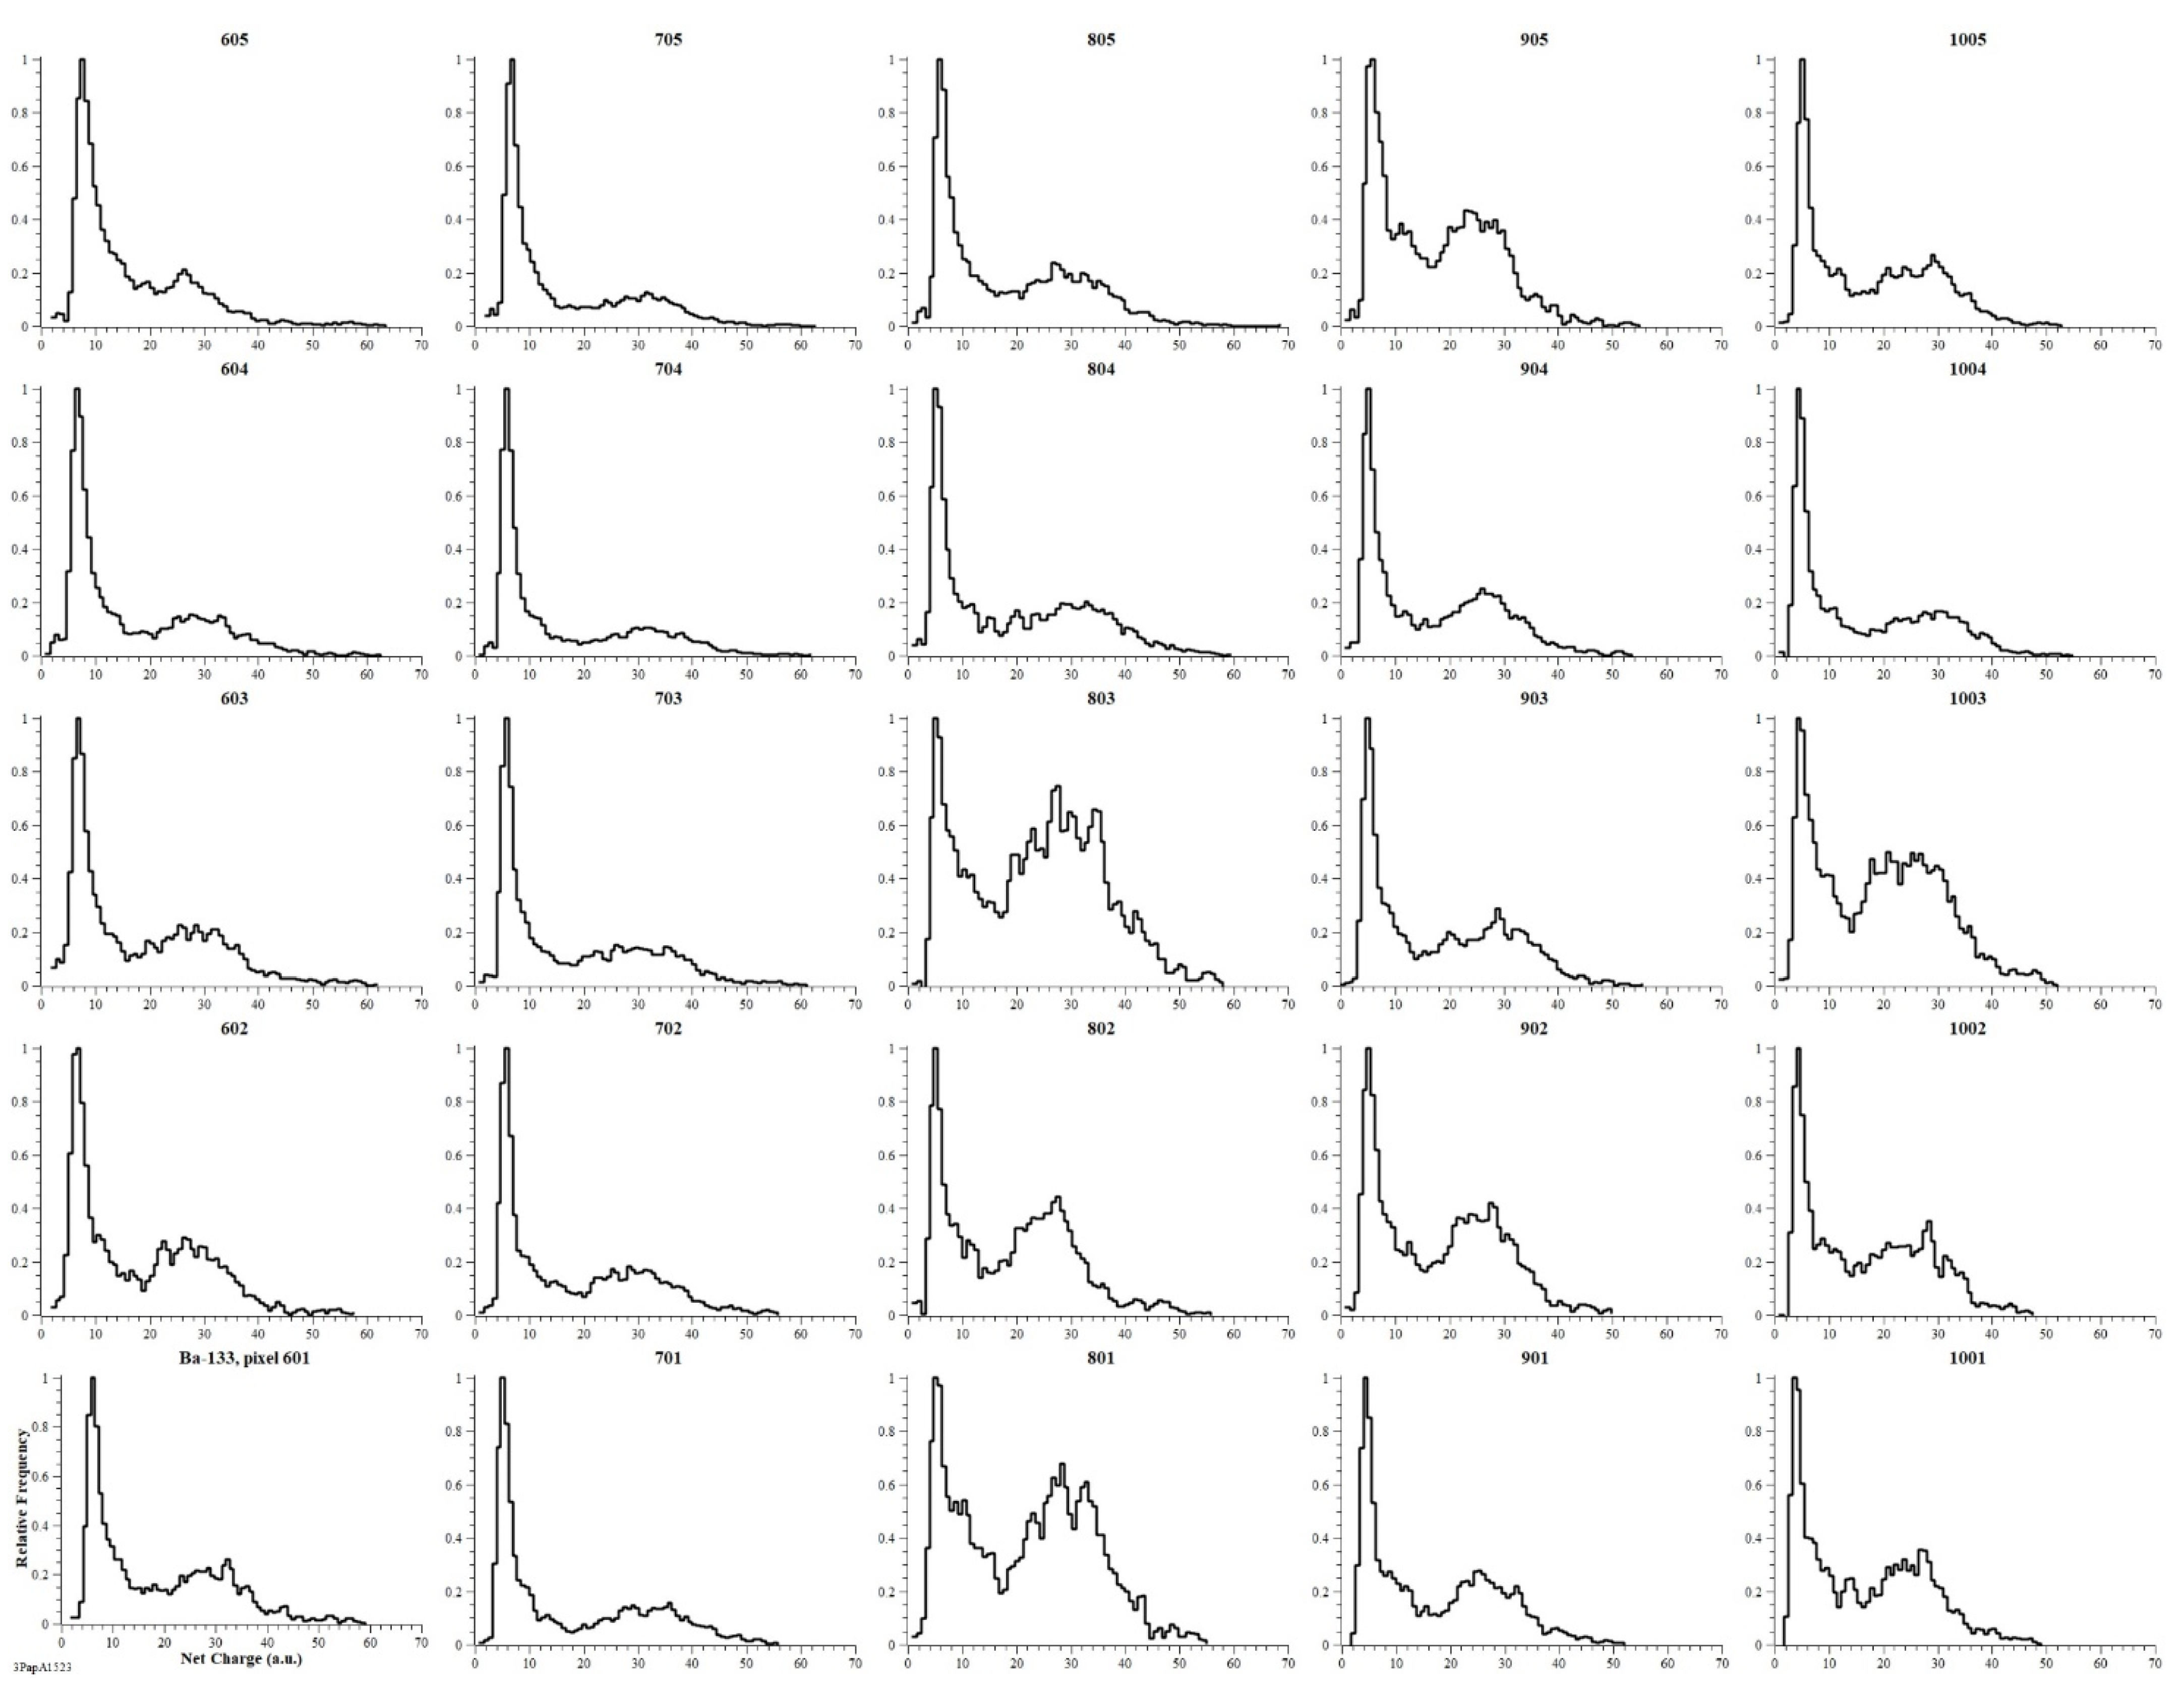
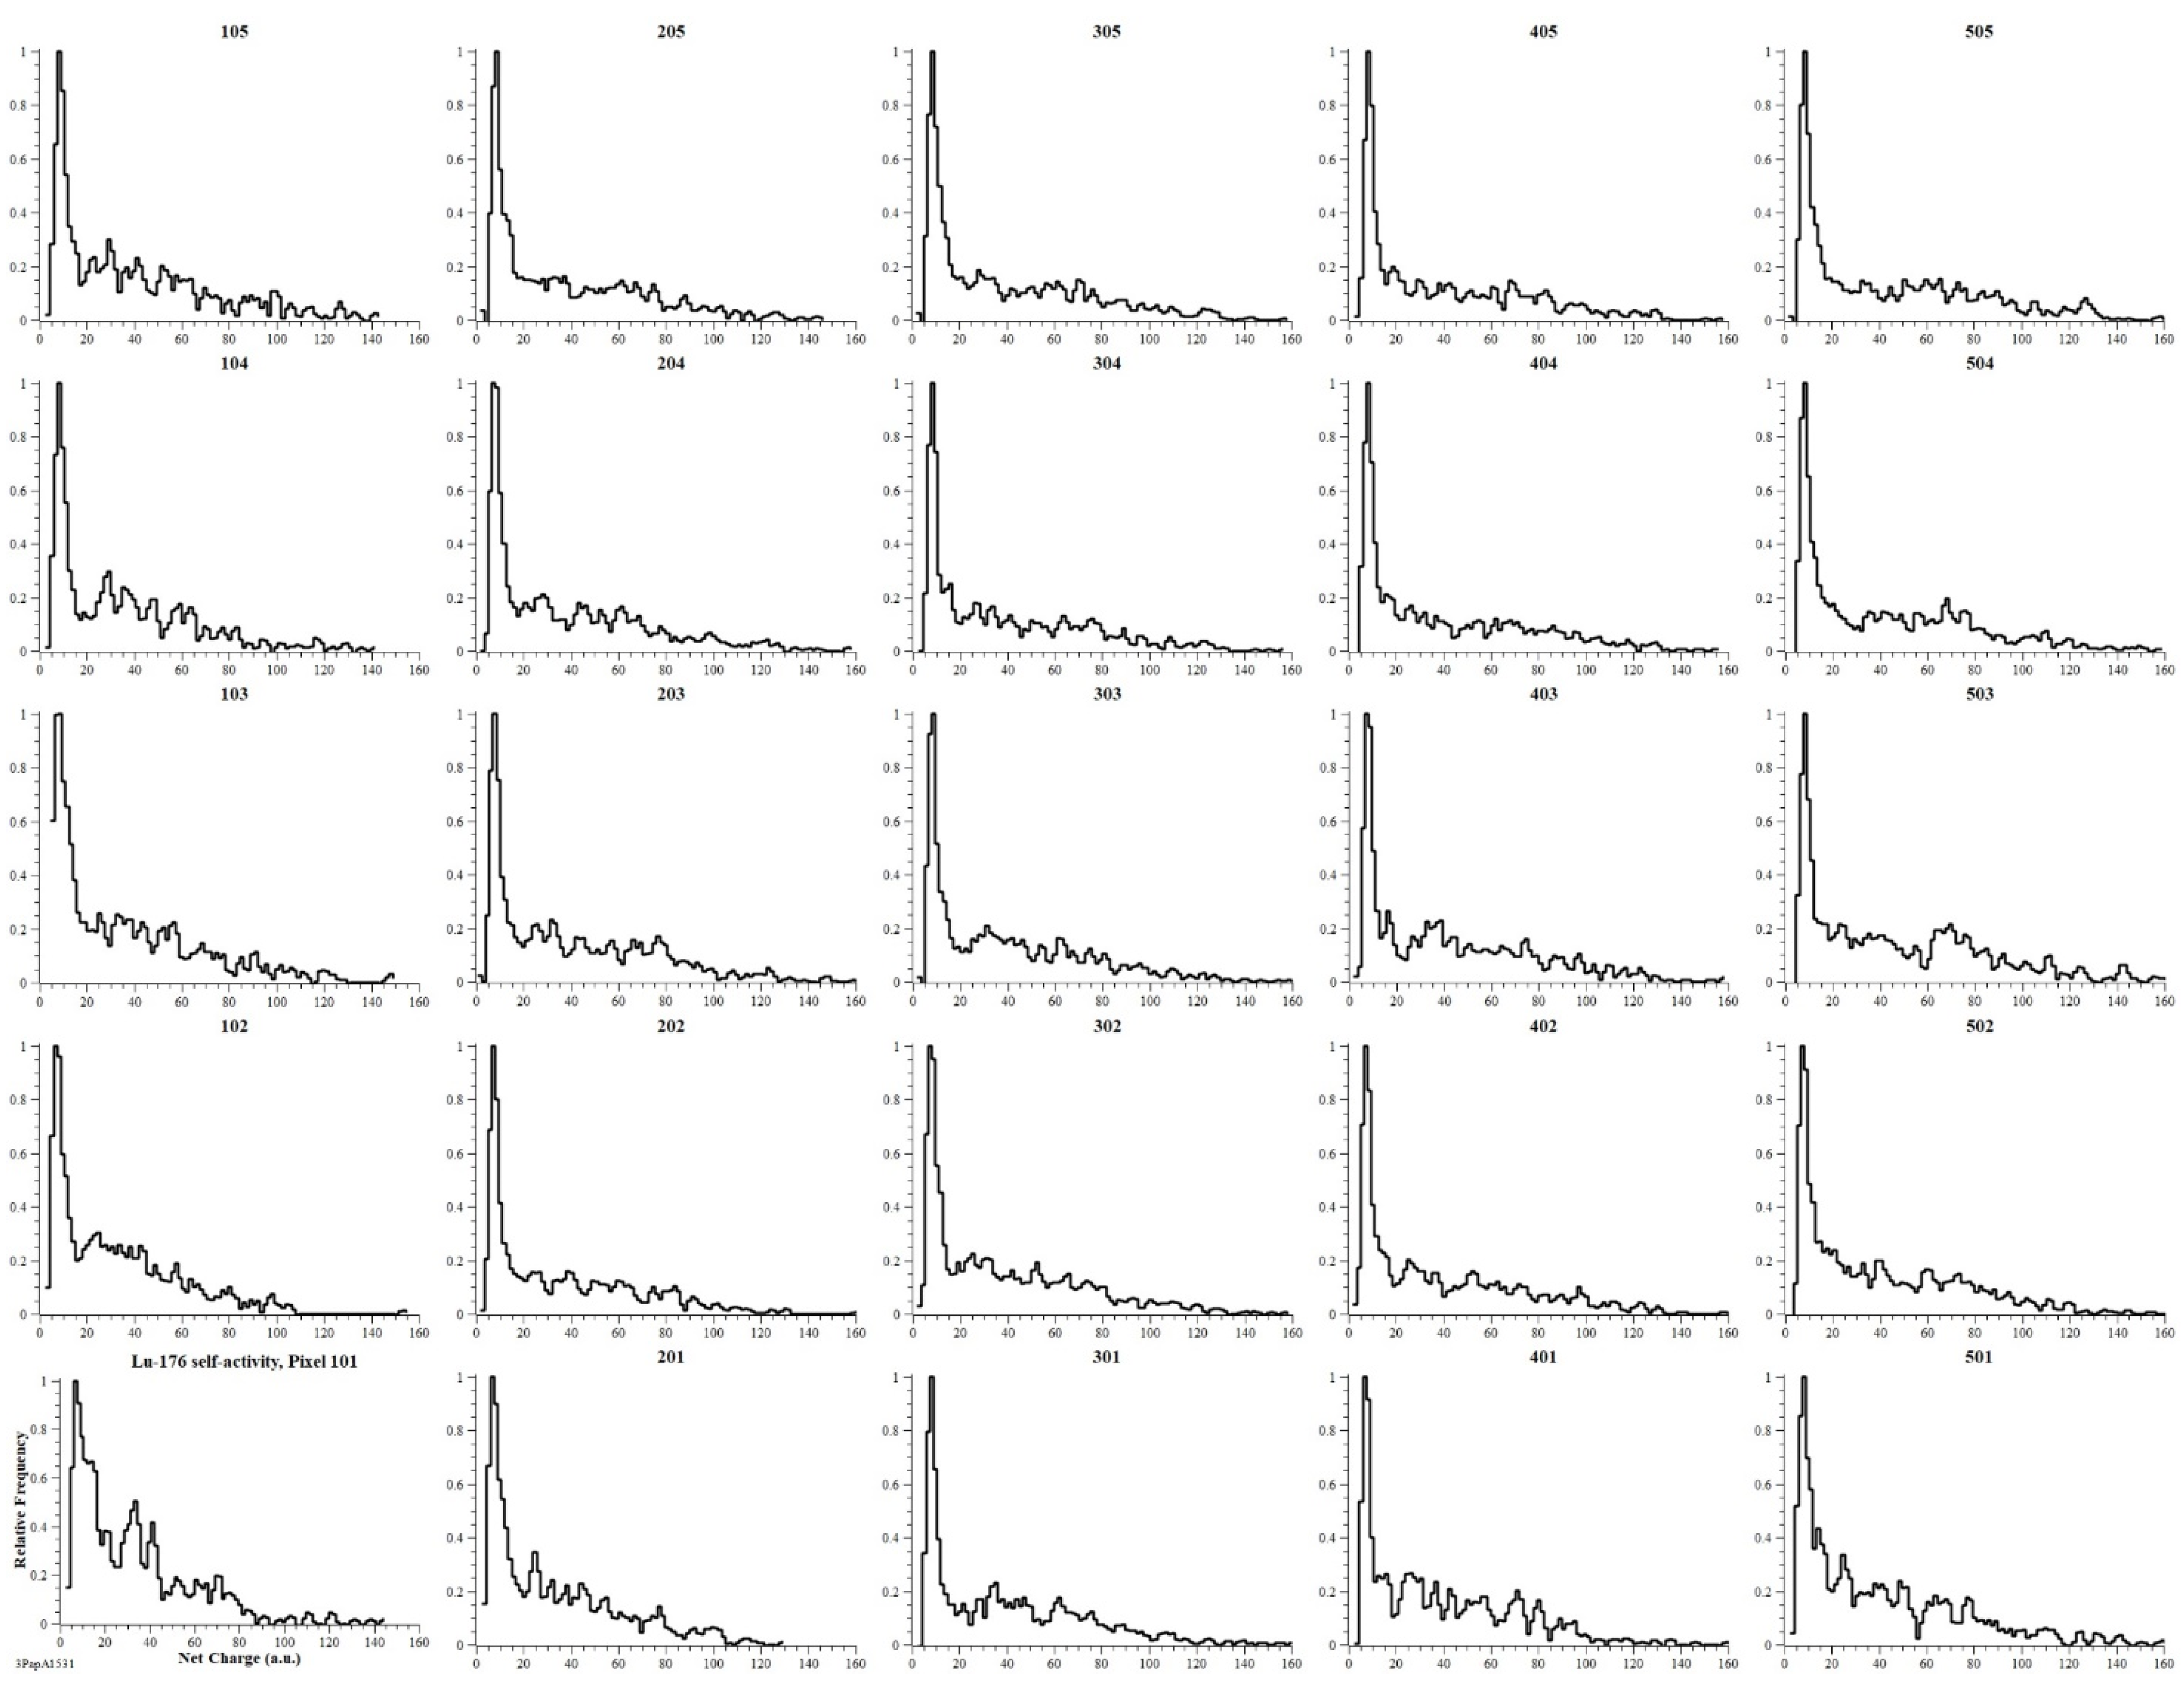
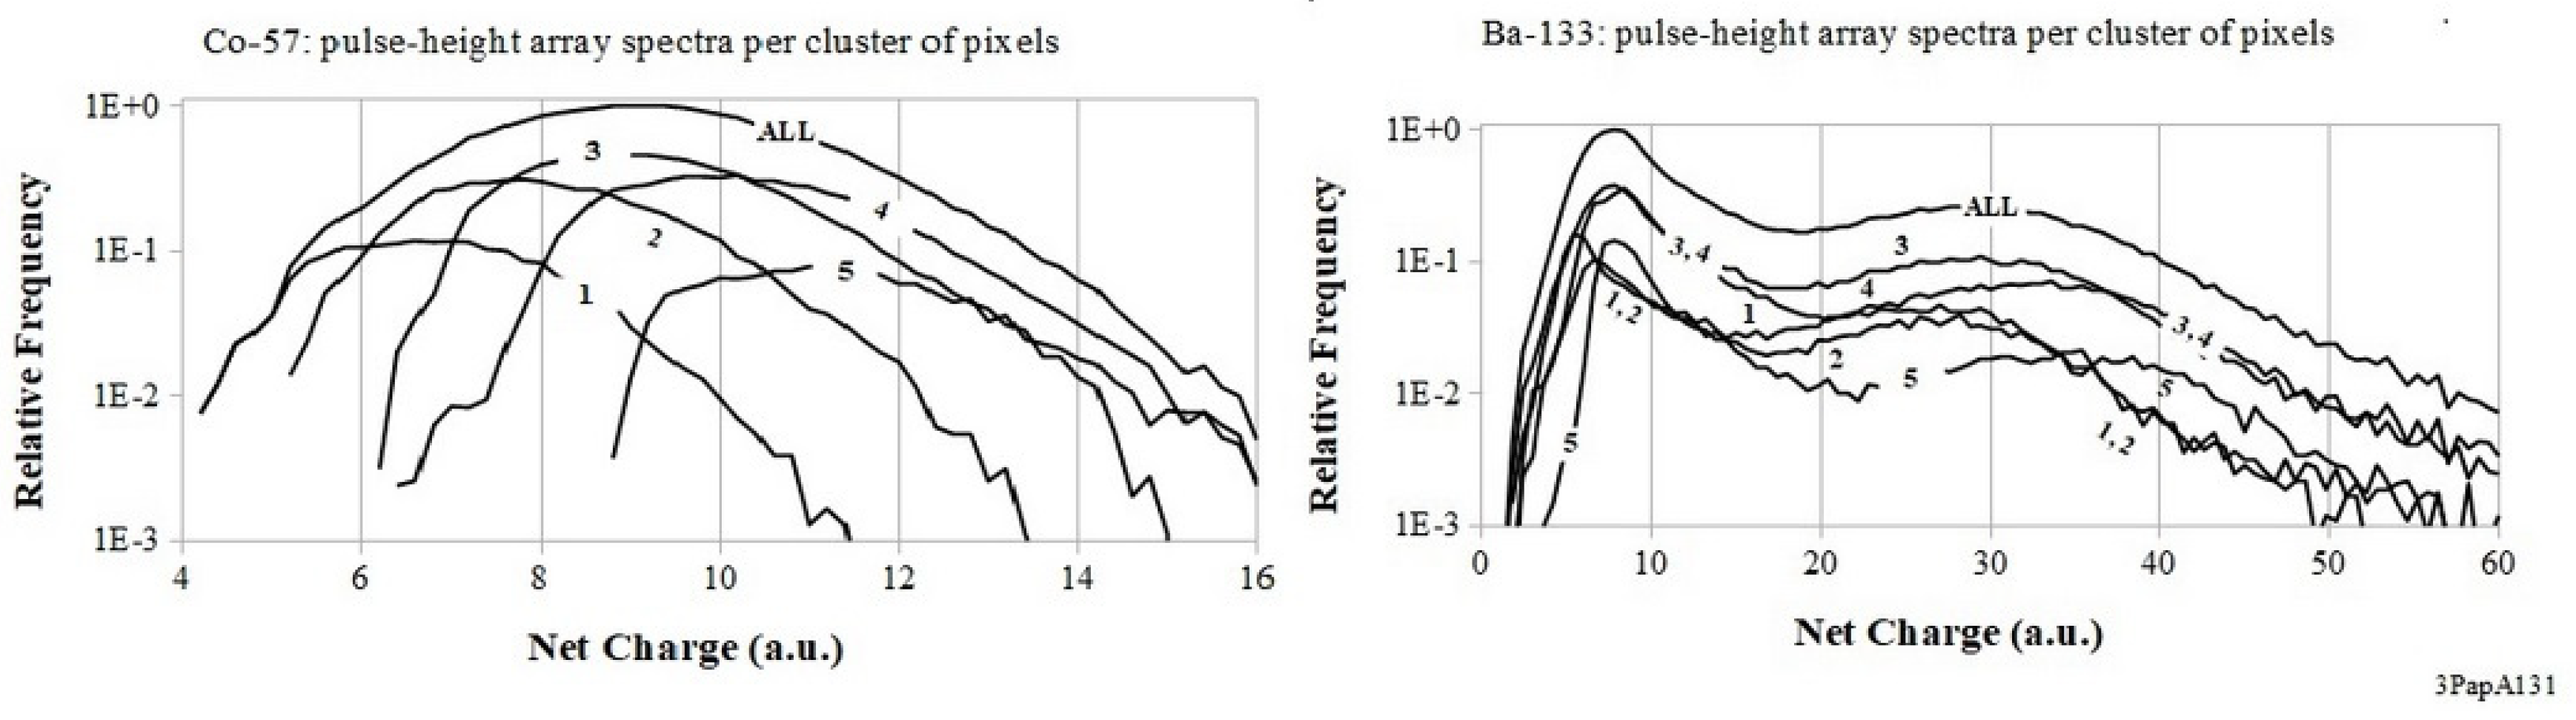
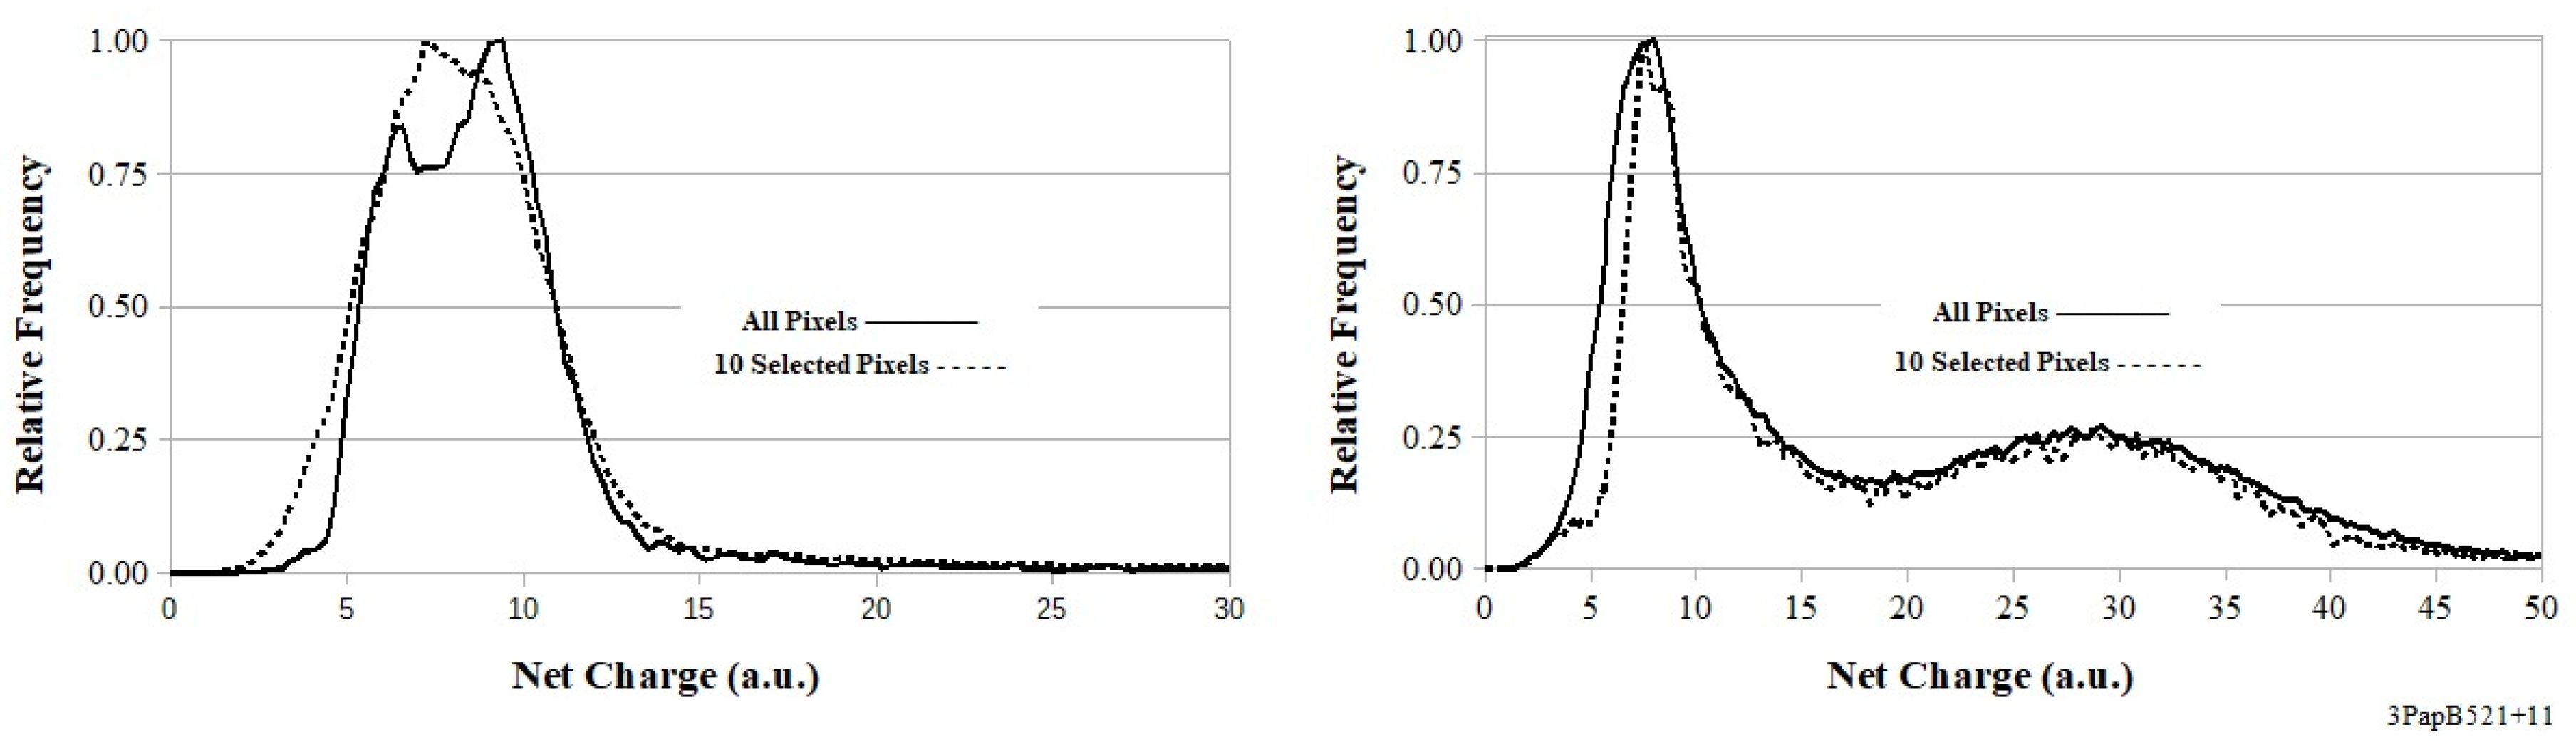
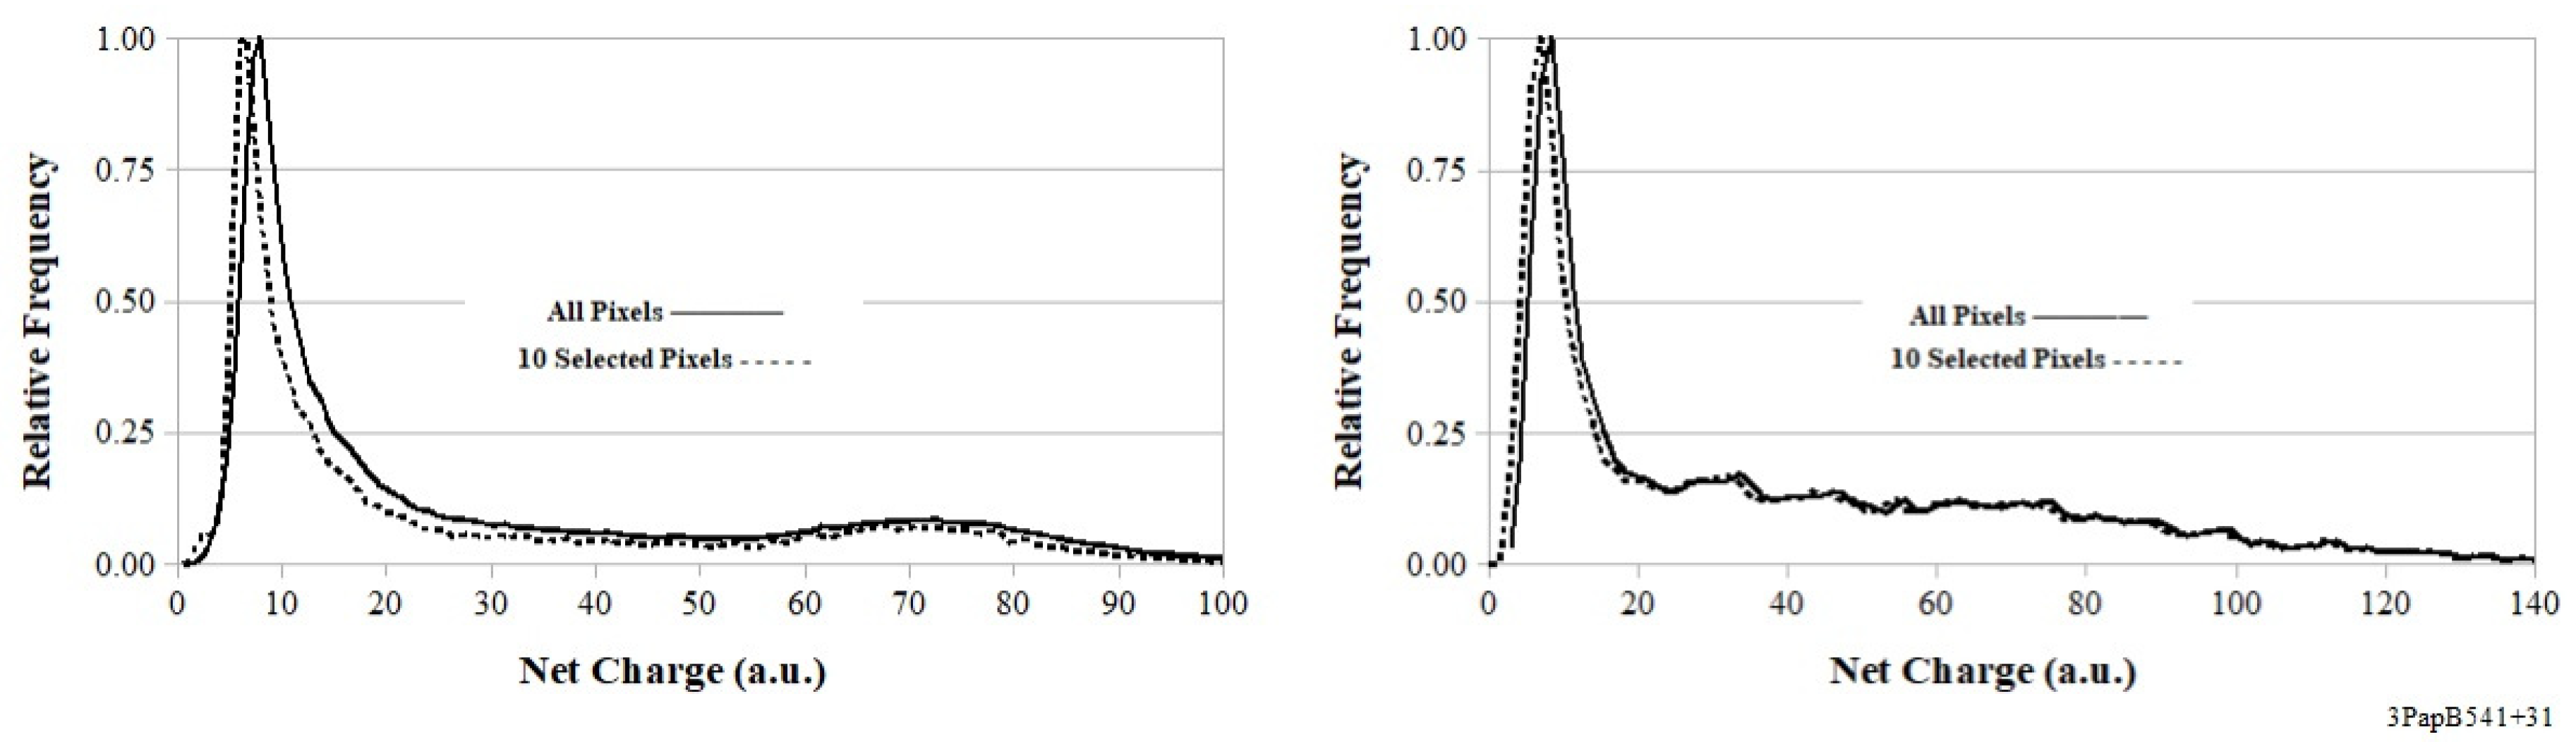
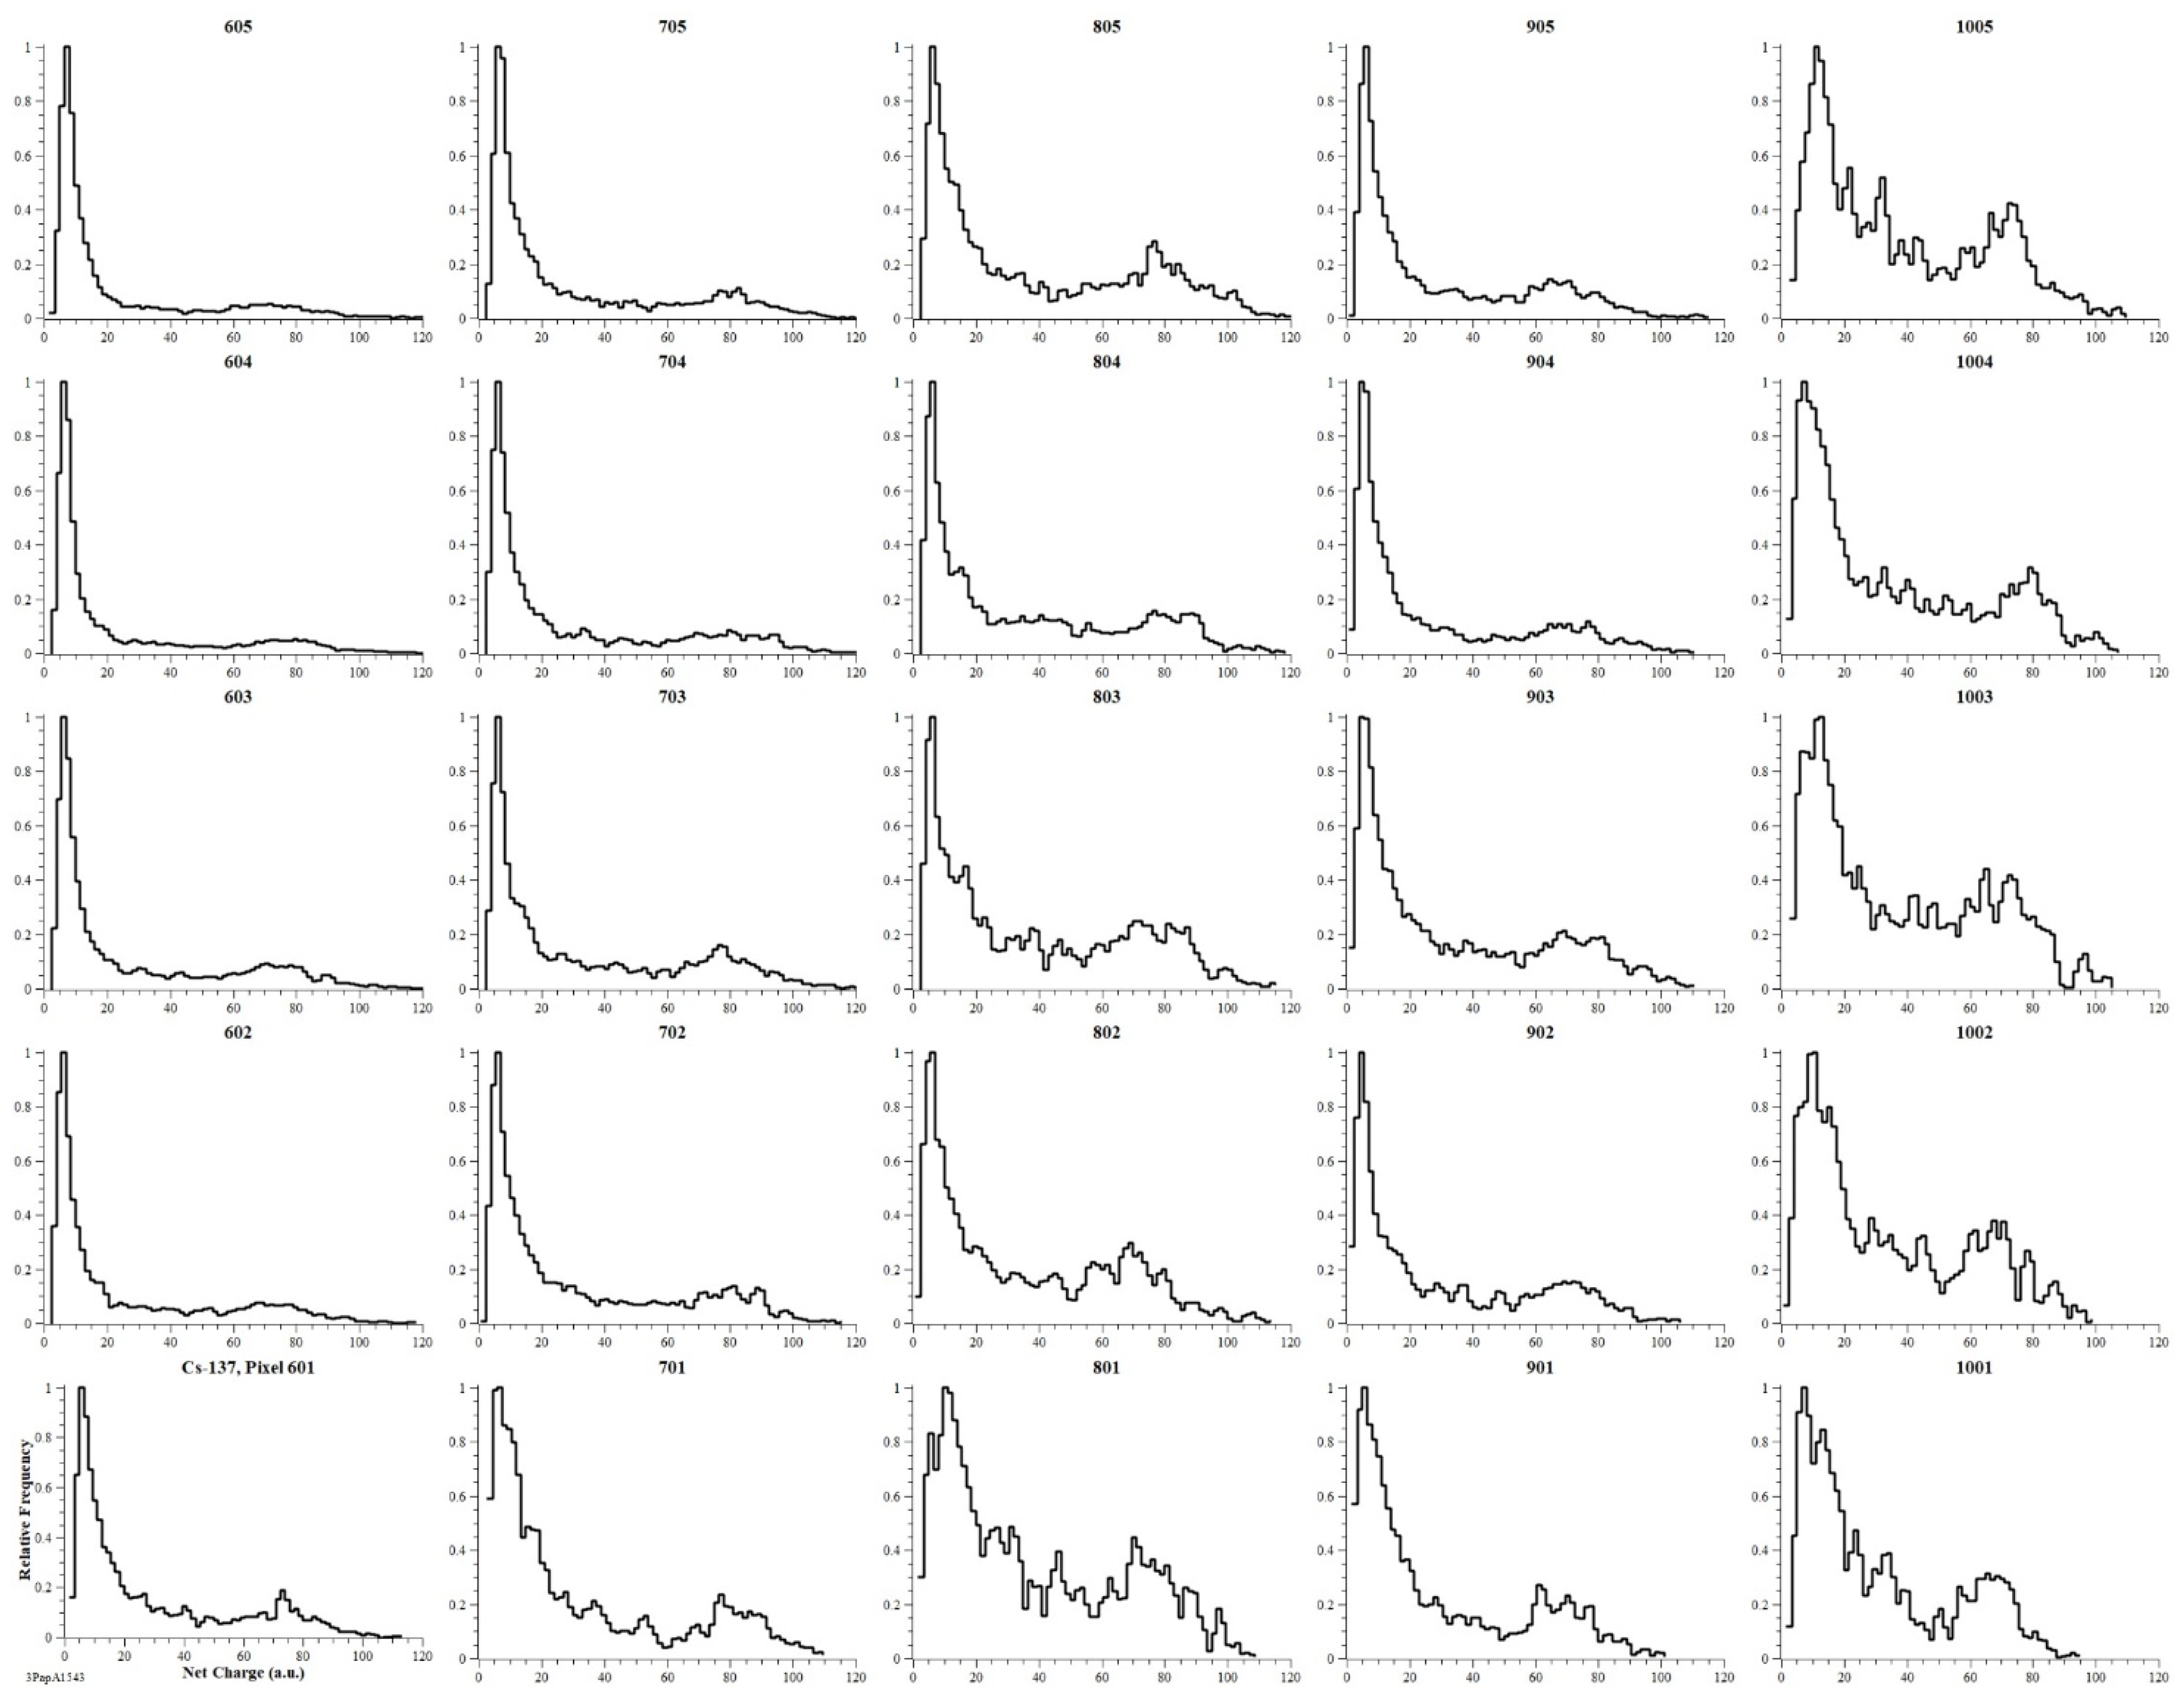
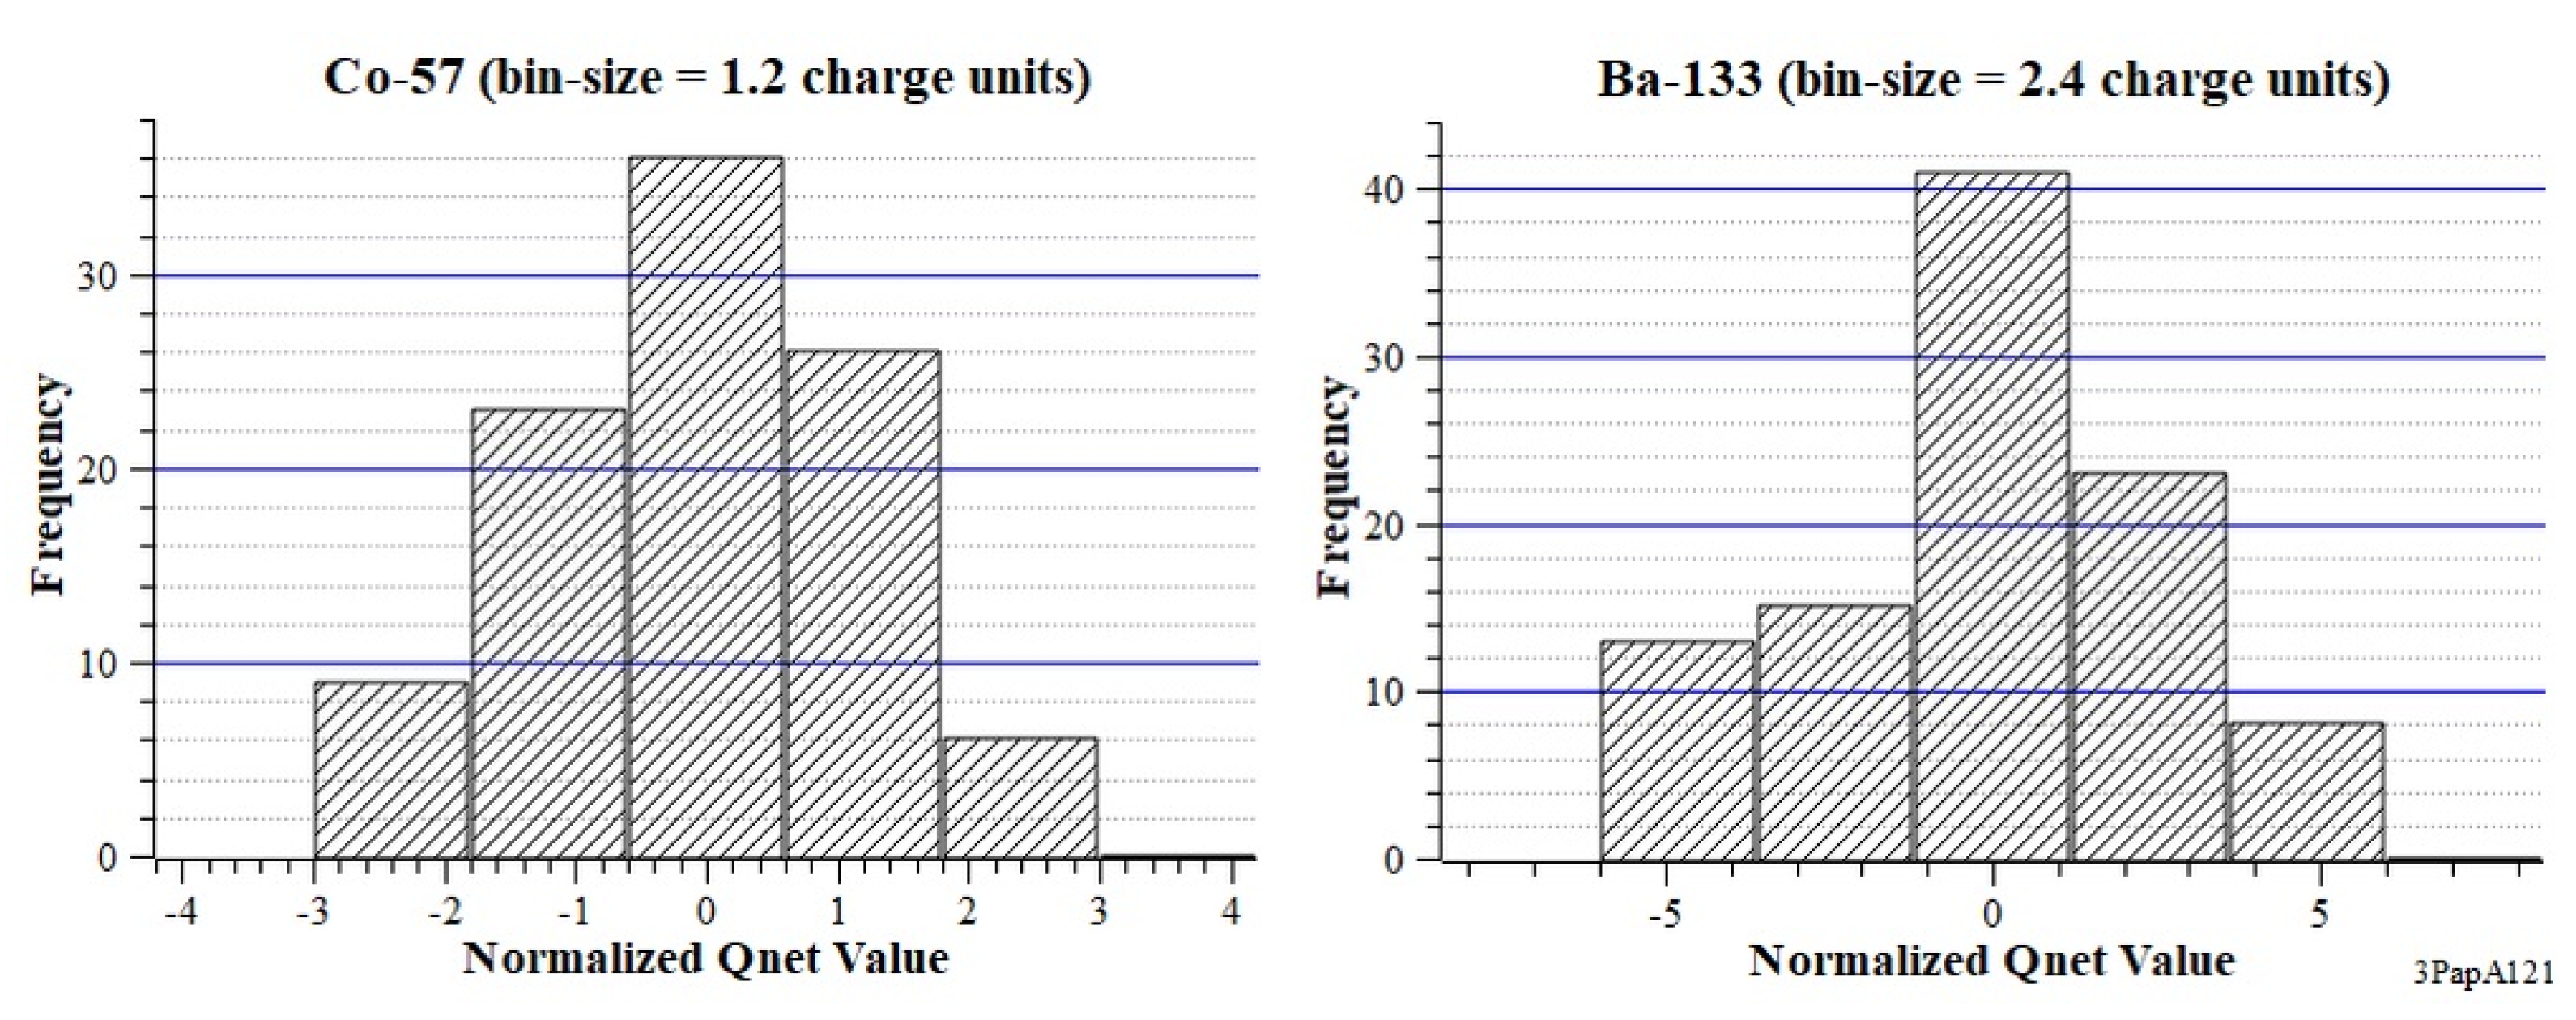
3.1. Crystal-Pixel’s Pulse-Height Response

The spectra are provided per quarter of the crystal-array, allowing an overview of the pulse-height responses, where the frequency values were normalized, pixel by pixel, to the respective maximum crystal-pixel value. The spectra underwent smoothing by using the Savitzky–Golay method [11] with five points and a second-order polynomial. The crystal-pixels were identified in the following by using the RRCC notation, where RR and CC are two-digit integers representing the row and column numbers within the crystal-array, respectively. In order to avoid confusion in the orthography of the RRCC code text, the leftmost zero is conventionally suppressed. The representations of the RRCC codes are also detailed in the array maps shown in the present Section.
The spectra from Co-57, built from single-events net-charge values with 0.2 charge-units (ch.u.) binning, were reported, for the first quarter of the array, in Figure A1 (see Appendix A). The plots identified by the letter “A” followed by two-digit numbers are reported in Appendix A). On the whole, one may observe broad peaks made by the responses of the crystal-pixels to the Co-57 gamma-rays, as well as to the Lu X-ray escape peaks, represented by the bumps on the left of the broad peaks. Differences in the peak positions, and in the peak-to-escape count ratios may be observed. Several pixels show spectra where the X-ray escape component is almost missing, mostly in pixels from 501 to 510 (as well as from 801 to 810, and from 901 to 910, not reported). Some individual similar cases were found in other columns of the array. A hypothesis about this is proposed in Section 3.3.2.
Ba-133 spectra of the third quarter, reported in Figure A2, were built from single-events net charge values with 0.75 ch.u. binning. Spectra generally show a narrow high peak, and a broad lower one divided by a valley from 10 to 20 ch.u. Relative peak ratios in the range between around 10:1 and 10:5 were observed on the entire crystal-array, as for the pixels 705 and 801.
Cs-137 third quarter spectra, reported in Figure A3, were built from single-events net charge values with 1.5 ch.u. binning. Spectra generally show a narrow high peak and a broad lower one divided by a valley from 30- to 40-ch.u. Relative peak ratios are typically around 10:1 but some exceptions around 10:4 are observed, as in the case of pixel 1003.
Lu-176 self-activity first quarter spectra, reported in Figure A4, were built from single-events net charge values with 1.5 ch.u. binning. Plots generally show a narrow high peak below 20 ch.u. and an indented, descending portion above 20 ch.u. The self-activity data are affected by low statistics, well visible for pixel 101.
Table 1 reports some statistics of pulse-height pixel-values whose results were utilized for building the pulse-height spectra for single pixels.
It is worth remarking that the anodic homogeneity corrections were applied during the charge data-processing according to the map of homogeneity values supplied by Hamamatsu for the specific H10966-100-Mod8 PSPMT Assembly used for data-takings [9]. As a consequence, the pulse-height differences shown in Figure A1 (as well as in the plots of the rest of pixels and of data-takings) must be ascribed to reasons different from the lack of PSPMT response homogeneity.
In order to compare the distributions obtained from different gamma-ray sources, the pulse-height pixel-values were normalized to the respective mean pixel-value by using Equation (1):
*Qnet(i,k) = Qnet(i,k) − Qnet(k),   (i = 1, …, Nep; k = 1, …, Npix),
where:
  • *Qnet(i,k) = Normalized Qnet value of ith event of the kth crystal-pixel;
  • Qnet(i,k) = Qnet value of ith event of the kth crystal-pixel;
  • Qnet(k) = Average Qnet value of the kth crystal-pixel;
  • Nep = No. of events falling in the crystal-pixel;
  • Npix = No. of pixels.
Qnet distributions results are presented in Figure A5 and Figure A6 as histograms by using a bin-size value such that five-bar plots are produced with the central cluster zero-centered. Lu-176 self-activity and Cs-137 results showing, respectively, one or two set-apart highest pixel-value(s) were grouped into six clusters. The histograms show substantially symmetrical shapes with the exception of the Cs-137 one where, the 10-mm thicknesses of (Lu0.7Y0.3)AP:Ce crystal-pixels are quite small, compared to the mean free path value at 661.7 keV, which is around 16 mm, that is, exceeding the pixel-height.
Pulse-height spectra of pixels per cluster, as defined by the histograms above cited, are presented in Figure 1 and Figure 2. Plots were built by using the single-event net charge values from each data-taking. Spectra were normalized to the maximum count of the respective total spectrum. Clusters of pixels were numbered in order of ascending net-charge value. Plots were drawn with semilog scales in order to better visualize all the net-charge regions.
Spectra generally show distinct curves per cluster that may be attributed to different average light outputs per group, probably due to the different behavior in terms of reflection properties shown as a function of photon energy. The comparison between Co-57 and Cs-137 spectra shows a better reflecting capability for the portion of crystal-pixels walls near the light output face for high Depth of Interaction (DoI). In fact, as one can verify, the relative shifts between the peak position of cluster 1 and cluster 6 for Co-57 and Cs-137 are about 67% and 28%, respectively.
In terms of crystal-pixel position in the array map, the clusters of pixels are distributed, per data-taking, in the way reported in Figure 3 and Figure 4. As one can observe, the 2-D distributions are generally different with respect to each other, but particularly in the case of Co-57 compared to the rest of data-takings.

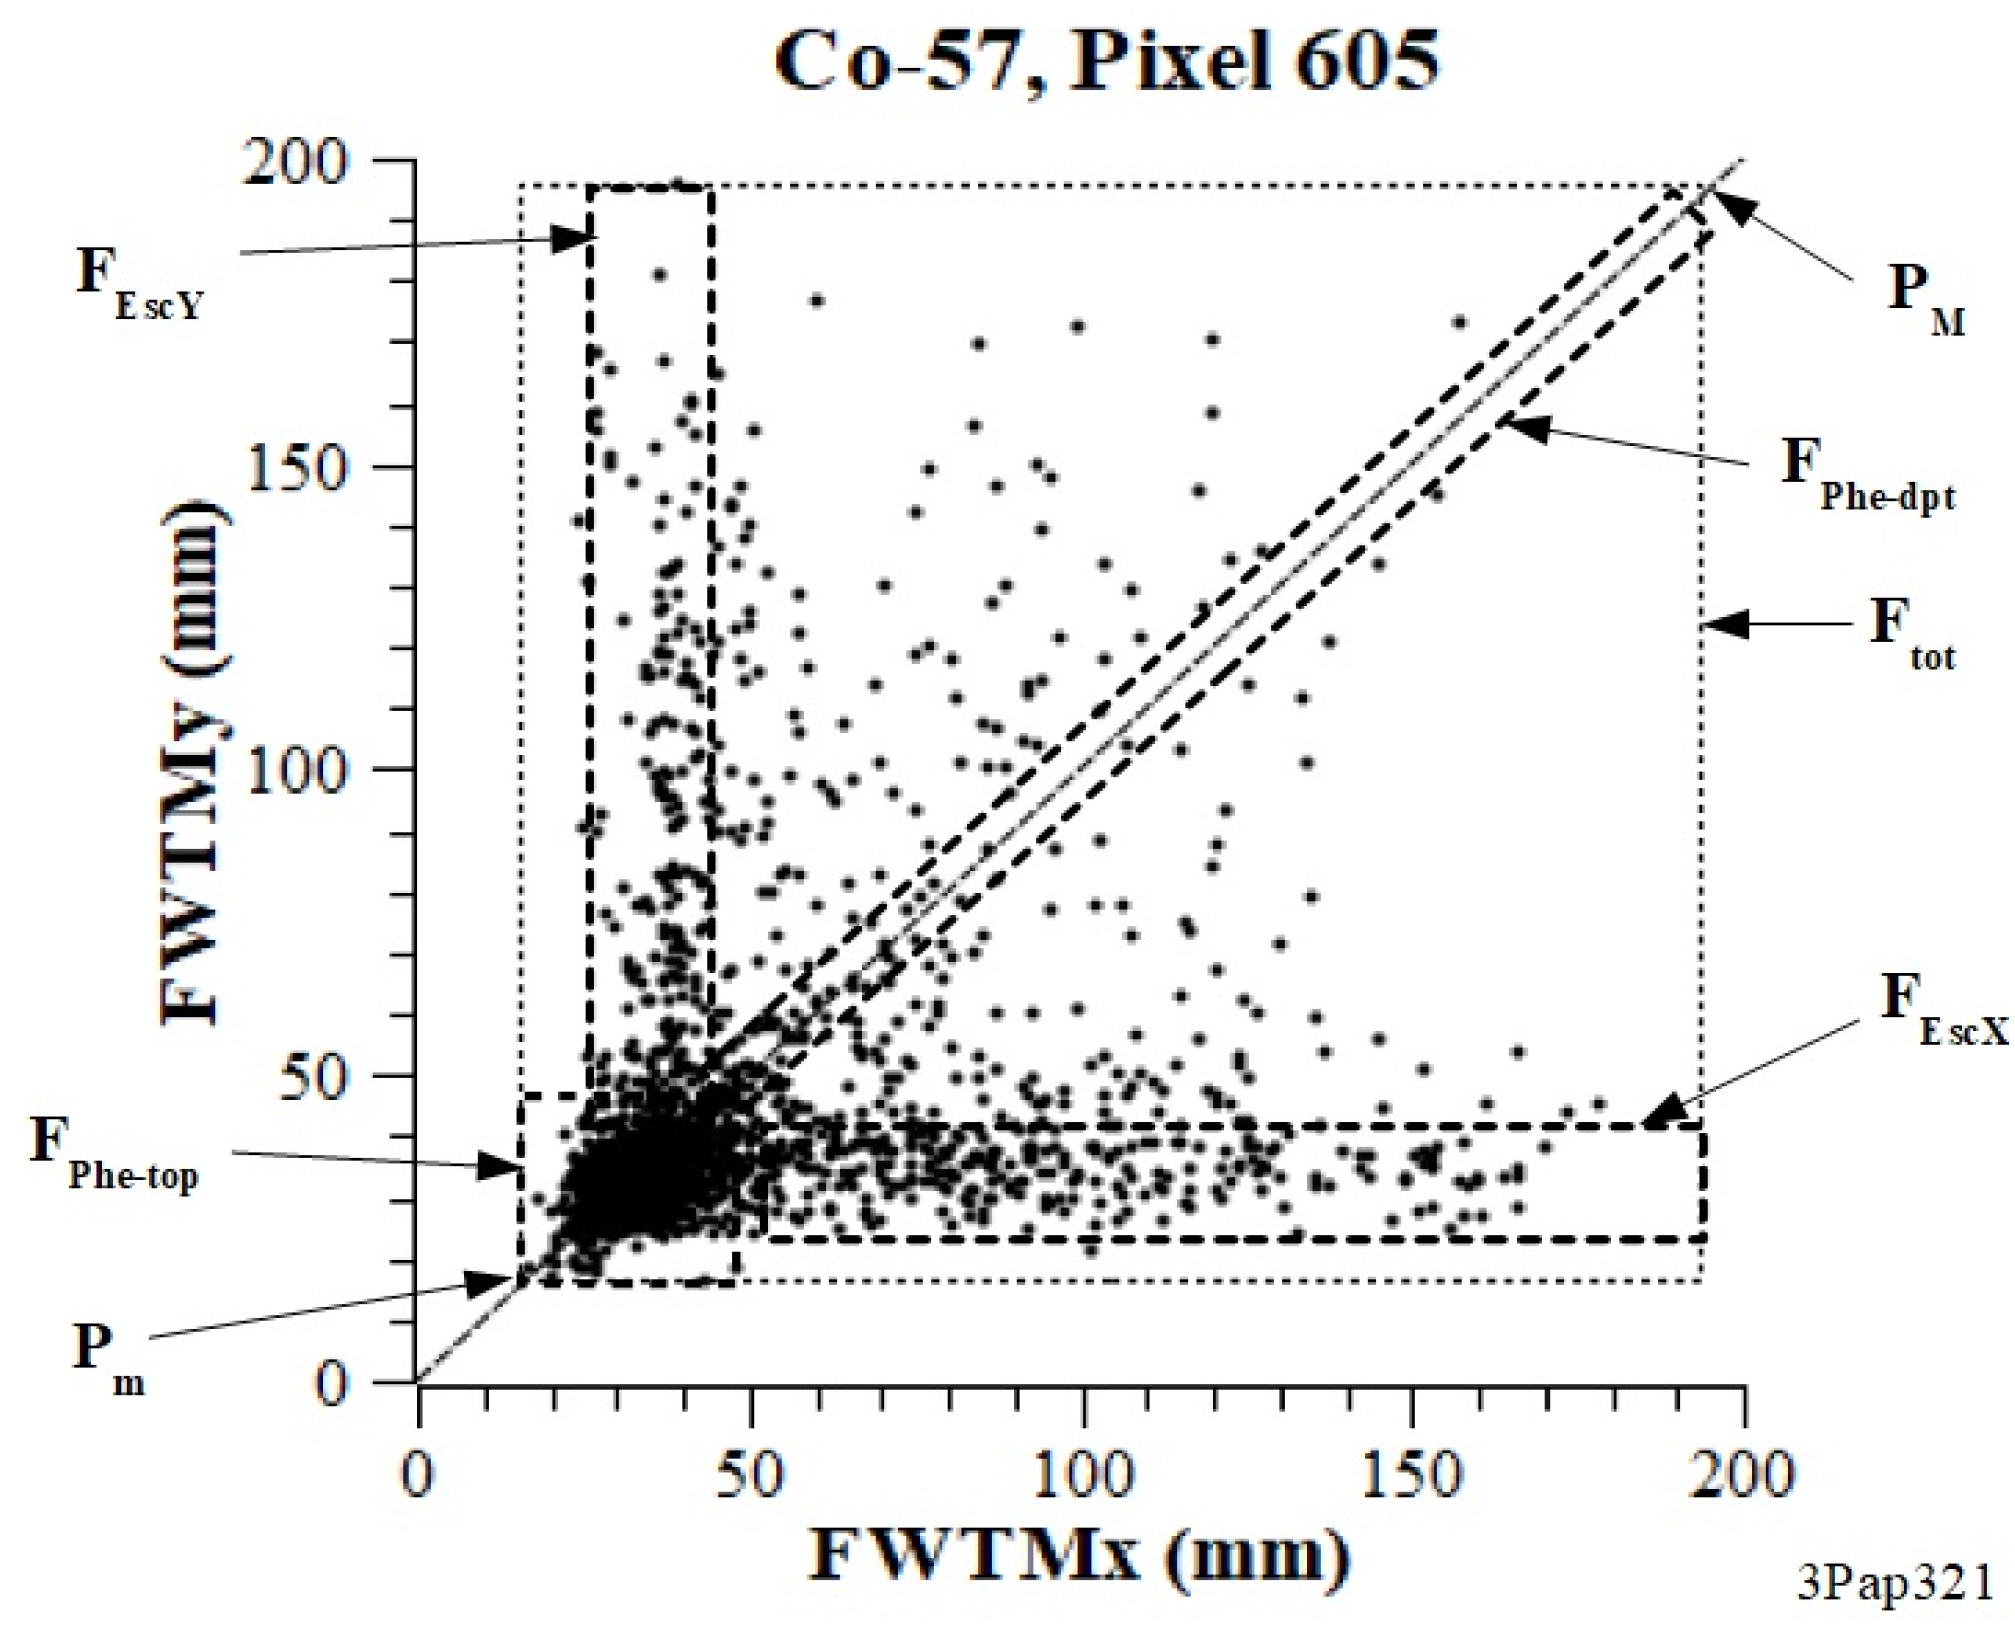
3.2. Crystal-Pixel’s 2D Charge-Symmetry Response (FWTM)

As discussed in [9,10], single-events are also characterized by the FWTMx, and FWTMy values obtained by fitting the 2-D experimental charge-distributions. In the following, the results of a study on the 2-D charge-symmetry spreads regarding the Co-57, or Ba-133, or Cs-137 point-source or Lu-176 self-activity are presented. Plots are shown per quarter of crystal-array, together with the bisector of the semi-planes (FWTMx, FWTMy), in order to better show the asymmetry of single-events charge-spread distributions.
It is worth recalling that the physical meaning of FWTMx and FWTMy is in connection with the 2-D charge-profiles of a single-event, and it may not be confused with the characteristic of the distribution of all events of a data-taking in a given pixel.

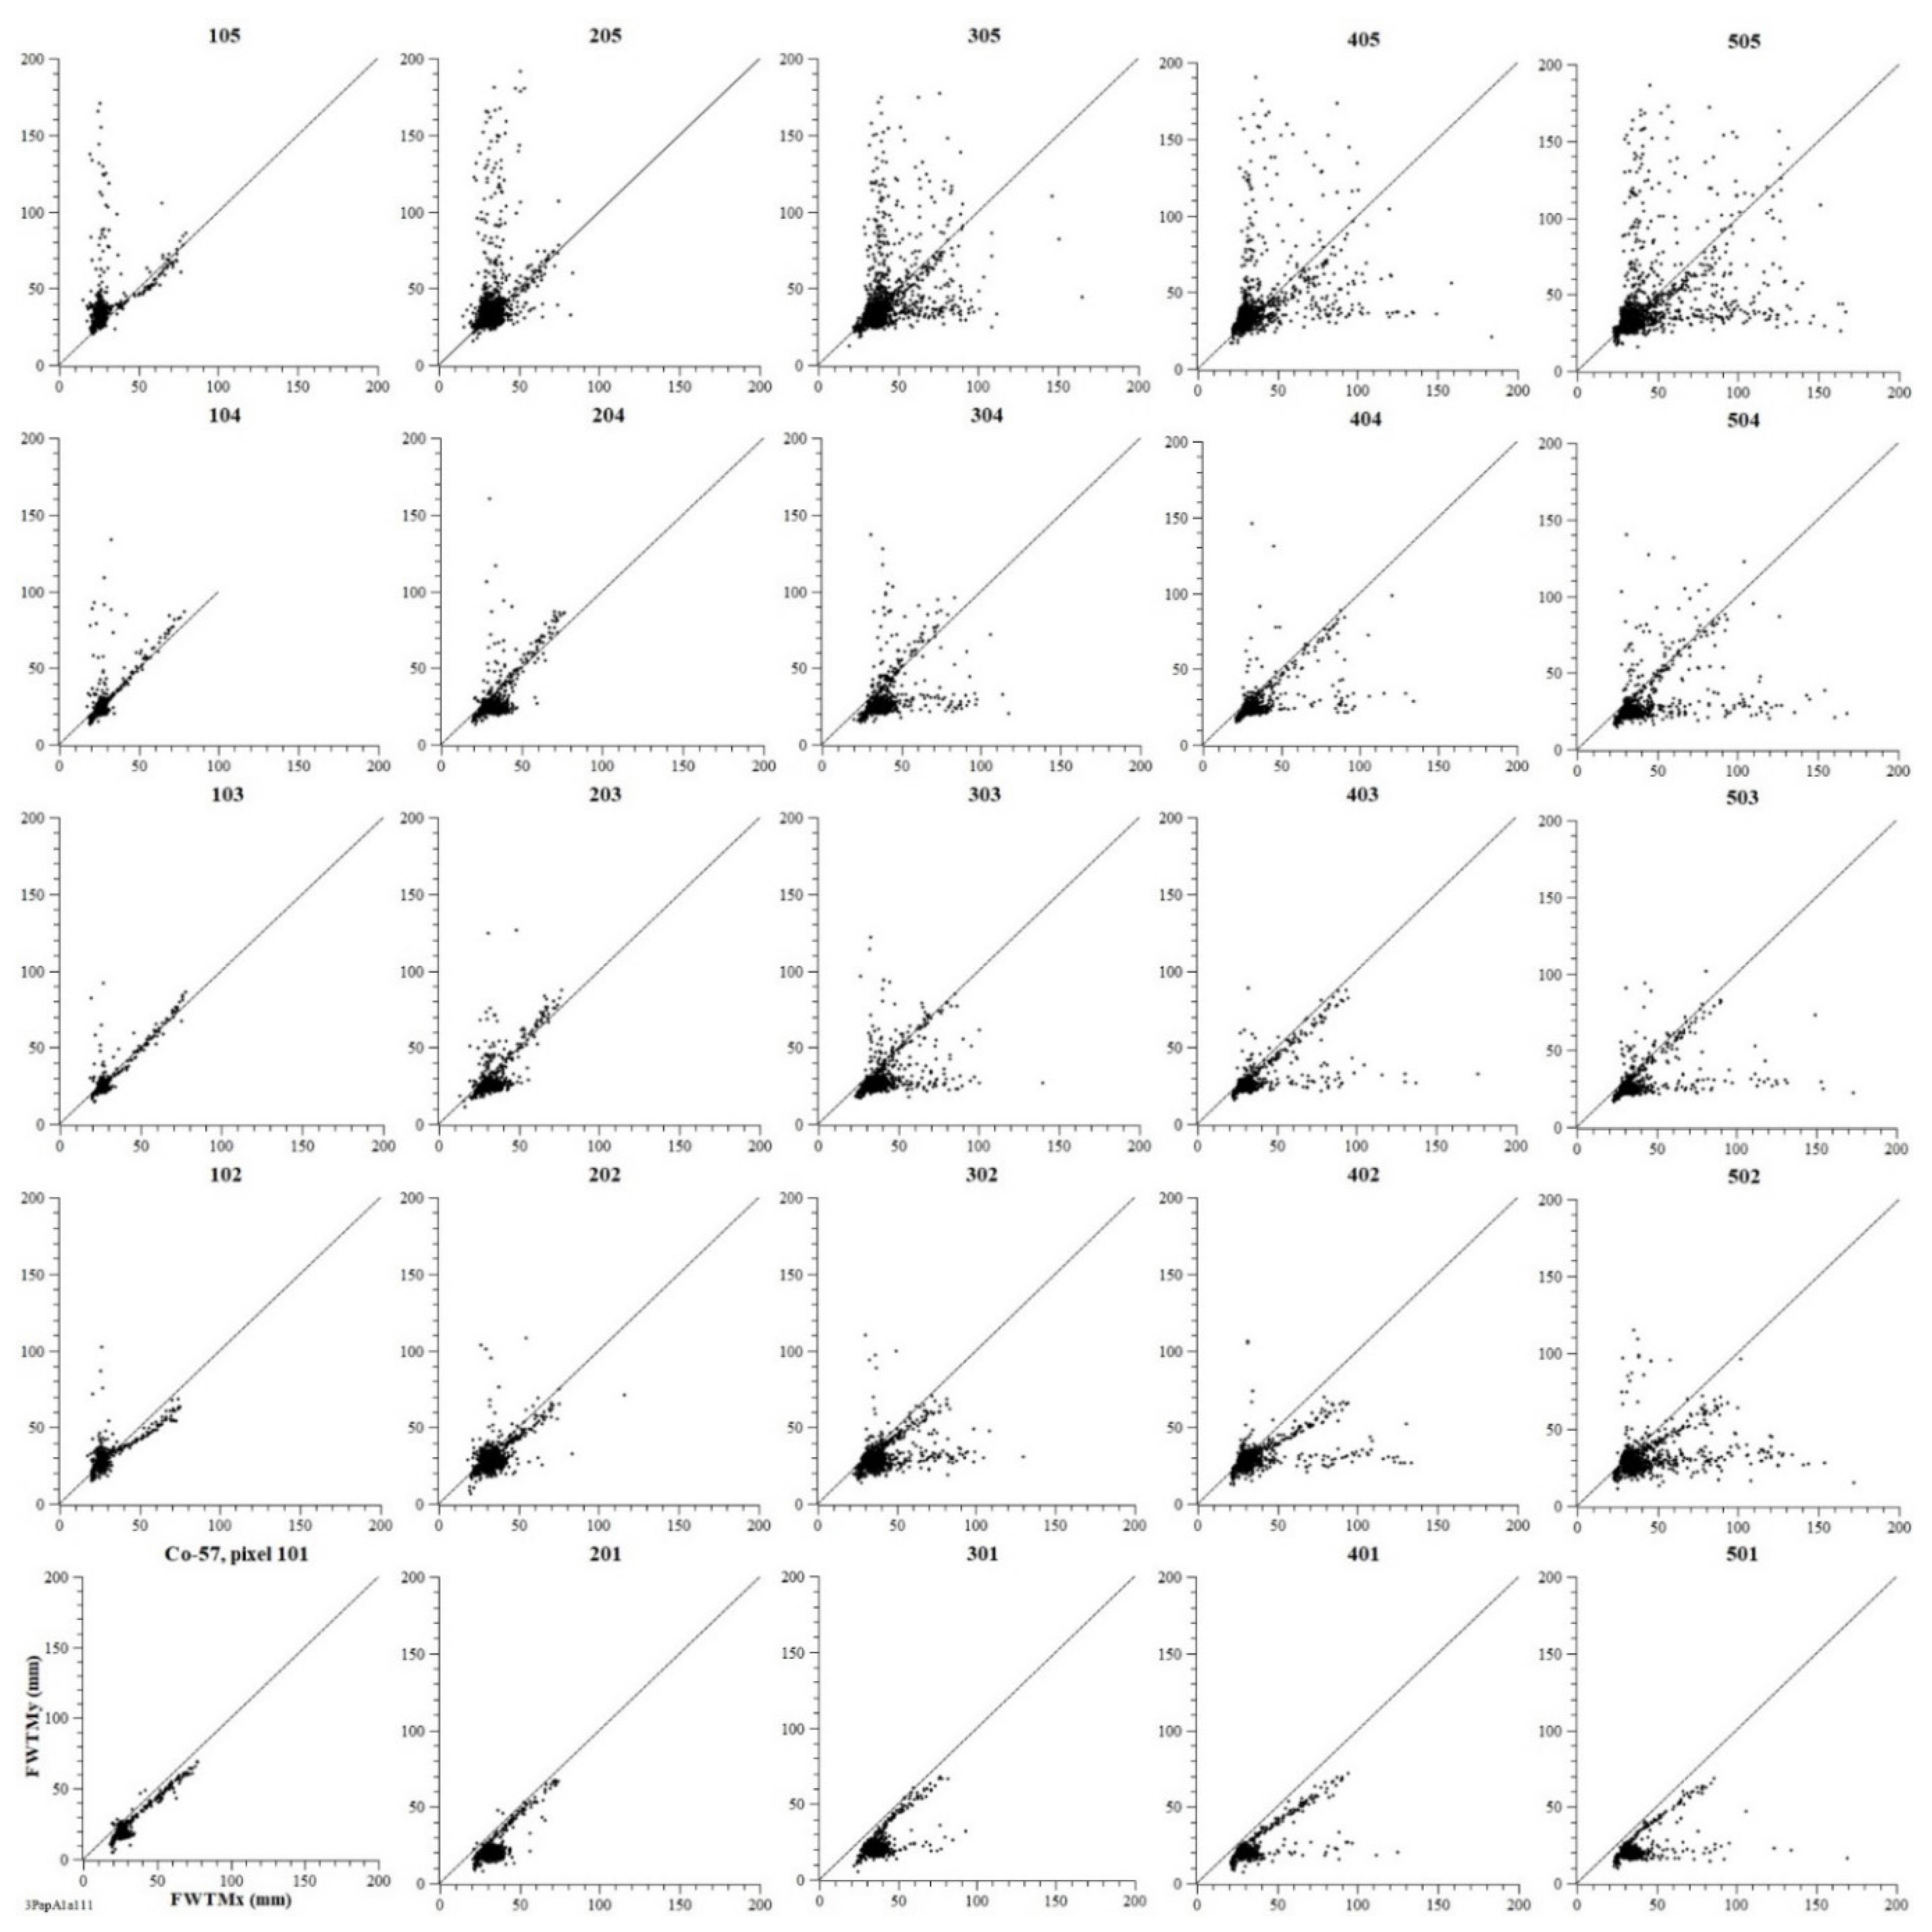
3.2.1. Co-57 FWTMxy Scatter-Plots

Figure A7 shows the FWTMxy 2-D charge-distributions from the Co-57 data for the first quarter of crystal-array.
It may be useful to recall that mean free path values in 10-mm-thick (Lu0.7Y0.3)AP are about 0.97 and 1.3 mm at 122.1- and 136.5-keV nuclear emissions from Co-57, respectively. In other words, interactions take place within the first millimeter of the path with a probability of (1 − 1/e) ≈ 0.63. Furthermore, photo-fraction values of about 0.87 and 0.84 were calculated at these photon-energies, respectively. This indicated that the rest of the interactions undergo scattering with 0.13 and 0.16 probability, respectively.
Thus one may expect from a well-working pixel a plot where the typical structures, like those shown by the Co-57 distributions for pixels 505 or 605, are well visible (see Figure A7, and Figure 5, respectively). The case of pixel 605 is widely depicted in Figure 5.
These structures are also recognizable in the rest of data-taking, with the proper adaptations, so the following considerations have some general meaning, but are specific in the first instance in the case of Tc-99m SPECT which is well mimed by Co-57. Even if the transition between the following cases (a) and (b) take place in reality in a continuous way, the following schematization is intended for explanatory purpose:
(a)
A photo-electric interaction takes place in the matter if the incident photon annihilates and its energy is transferred to an atomic electron, net of its binding energy. The majority of photo-electric interactions ionize an atom of the scintillator at the top of crystal-pixel, within the first mean-free-path, with a probability of about 0.63. The following scintillation light-spot is transmitted by the residual length of crystal-pixel, acting as light-pipe, toward the light-output face and, finally, to the photo-cathode of PSPMT, via its optical window. The 2-D charge distribution at anodes will be narrow, due to the light-focusing around the pixel-axis carried out by the light-pipe, and symmetric, because the energy of the incident photon has been released completely inside the crystal-pixel. So, the events absorbed at the top of the pixel will fall along the bisector of the plane (FWTMx, FWTMy) and near the origin forming the dense cloud close to the origin.
(b)
In addition, the rest of photo-electric interactions take place at a depth ranging from about 1 to 10 mm of crystal-pixel length, with a probability of about 0.37. The photon energy is released by ionizing an atom of the scintillator, and the light-spot will produce a 2-D charge distribution at PSPMT anodes. The focusing effect of the light-guide will be reduced compared to case (a), giving rise to a wider charge distribution whose maximum spread value corresponds to the maximum detectable by the given detector setup. The 2-D charge distribution is again symmetric because the energy of the incident photon has been released completely inside the crystal-pixel. The representative point on the plot is located on the bisector, but farther away from the origin.
(c)
The ionization process itself cited in (a) and (b) ends up producing also X-rays, typical of components of scintillator, like the Lu K 63.2 keV (maximum energy value for Lu K sub-shell) whose mean-free-path value in (Lu0.7Y0.3)AP is about 0.7 mm. If the emission of X-ray takes place near to the pixel-surface, and in its direction, the X-ray has a significant probability of escaping from the pixel and being absorbed in a neighboring one. In the time-scale of electronic signals, the “primary” ionization and the one following X-ray absorption are coincident, thus the scintillation spots at the output faces of the primary and the neighboring pixels contribute to the same pulse. Therefore, the charge distribution at PSPMT anodes becomes broader, the amount of broadening depending, in principle, on the energy quantities deposited in the two pixels. For Co-57 data, one may observe that Lu K X-ray energy is about half of 122.1 keV Co-57 emission. This produces a charge distribution at PSPMT anodes having double-width compared to the case of X-ray emission taking place near to the pixel-surface, but toward the pixel-axis. X-ray escape-events are located in the plane (FWTMx, FWTMy) along the trails, parallel to axes, connected to the dense cloud of events close to the origin. An event belongs to a horizontal trail if X-ray escape and primary pixels are in the same row of the crystal-array (c1). On the contrary, the point belongs to the vertical trail (c2). One may finally observe from experimental plots, that the distance between the point and the dense cloud, along the trail, is related to the DoI in primary crystal-pixel. In better detail, the greater the DoI (i.e., the lesser the distance between the point-of-interaction and the light-output-face) the wider the charge-distribution, the maximum value of the distribution width being measured if the interaction takes place in close proximity to the light output face itself.
(d)
A scattering process, takes place in the matter if a photon interacts with a free or weakly-bound electron. The primary photon disappears, and a secondary photon appears, having lower energy, and traveling along a different angular direction on the plane including both the trajectories. In order to respect the energy balance, a fraction of primary photon energy, depending on the diffusion angle, is transferred to the recoil-electron that is converted into a scintillation spot. From the standpoint of deposited energy, the story of a primary photon may evolve in a twofold manner. After undergoing one or more scattering processes in the array, the last diffused photon may: (d1) undergo a photo-electric process, or (d2) escape from the crystal-array. Like in case (c), in the scale of electronic signals, cited processes are time-coincident, thus the scintillation spots at the output faces of the involved pixels contribute to the same charge pulse at the PSPMT anodes. Case (d1) is identical to photo-electric process (a) or (b) because the deposited energy is the same, but it may be rejected on the basis of the 2-D charge-distribution asymmetry. On the contrary, the events like (d2) may be refused only if the value of energy deposited in the array is external to the energy window set for events acceptance.
With reference to Figure 5, let us consider the square domain Ftot of the plane (FWTMx, FWTMy), with sides parallel to axes, having opposite vertices located along the bisector at the points Pm ≡ min(FWTMxy), and at PM ≡ max(FWTMxy). The terms in brackets representing the values of 2-D charge-distribution spreads measured along X- or Y-axes in the given data-taking. By definition, the domain Ftot contains the points representative of all events.
The domain FPhe-top may be empirically defined as the rectangle giving the highest value of events per mm2 as a function of the position of the vertex opposite to Pm along the bisector. These events refer to the photo-electric interactions occurring within the uppermost portion of the pixel, one mean free path thick.
The associate domain FPhe-dpt marks out the rest of photoelectric events occurring at greater depth in the pixel. It has a rectangular shape, overlapping the bisector, with major sides parallel to the bisector such as to reach the sides of Ftot, and minor sides perpendicular to the bisector. Figure 5 shows a minor side of FPhe-dpt with a length of about 12 mm. The rectangular domains FEscX and FEscY regard the photoelectric events, taking place in the given pixel, but with a Lu K X-ray escaping towards a neighboring one. In order for that to happen, the X-ray must be emitted from a very thin layer of scintillator near to the pixel surface, having a thickness less than the value of mean free path in (Lu0.7Y0.3)AP, that is in the order of 0.2 mm. In the same way, the X-ray will be absorbed in the most external layer of the neighboring pixel. In terms of the columns and rows of the crystal-array, FEscX contains the events with primary interaction in RRCC and X-rays absorbed in RRCC’, where CC’ = CC ± 1. On the contrary, FEscY includes the events with X-rays captured in RR’CC, with RR’ = RR ± 1. Both CC’ and RR’ must be integers >0 and ≤10, because of the dimensions of the given crystal-array. The cases in which the X-rays fall in RR’CC’, that is, diagonally, were not considered because they are very rare.
Finally, the points, belonging to FScatt = Ftot − (FPhe-top + FPhe-dpt + FEscX + FEscY), represent the scattered events because photoelectric and scattering interactions are the only two alternatives in competition with each other in the energy range of interest. Table 2 shows the experimental event counts and the corresponding relative frequencies per domain obtained from Co-57 data for crystal-pixel 605.
It may be interesting to observe that gamma-ray interactions, taking place far from the top of crystal-pixel, are characterized by higher values of 2-D charge spread. This makes it more probable for a high fraction of light photons of the scintillation spot to be trapped in the crystal-pixel due to overcoming the critical angle value at the light output face. This produces a loss of events because of reduced light intensity [12]. On the contrary, gamma-rays interacting at the top of the pixel produce much more narrow 2-D charge-distributions like in the domain FPhe-Top. This favors the scintillation light photons in reaching the pixel output face with an angle smaller than the critical angle value, that is, in avoiding the internal trapping. It can be said that, at least for Tc-99m SPECT applications (well-mimed by Co-57 gamma-rays), the segmented crystal structure made of a highly absorbing scintillator enhances the visibility of photoelectric interactions compared to the unwanted scattered gamma-rays.
With the aim of recovering the events having a photoelectric origin, corrections should be introduced for escaped events, as well as for deep photo-electric interactions. Corrections would be very simple in the cases of X- and Y-escaped photons because the value of Qnet is already correct, and the centroid of an event may be appropriately shifted by the quantity of ½ the pitch of the crystal array. A slightly complicated algorithm should be adopted for peripheral crystal-pixels, as well as for corner ones, because of the undetected X-rays energy. The model presently used for data processing [9] is symmetric with respect to X- and Y-axes, and cannot realize the escape direction but the width of distribution only. Future developments might be aimed to study a new asymmetric model able to measure both parameters. Furthermore, the events belonging to FPhe-dpt need no correction because both Qnet and events centroid are correct yet (see Figure 5). Moreover, events from scattering interactions may be banally removed because each event may be identified according to the domain of belonging.
Some typologies of bad-working crystal-pixels may be observed in Figure A7. Corner pixels, 101 or 1001 (the last not shown), display empty X-ray escape domains along both X- and Y-directions, indicating a light loss from the top of the crystal-pixels. In other words, the lack of X-ray escape events, shows undetected interactions in the pixels receiving the escaped X-rays. On the contrary, pixels 110, and 1010 (not shown) display FEsc-Y domains weakly populated, and empty FEsc-X, showing light-photons escape along the X-direction only.
On the whole, one may note that the crystal-pixels showing all the domains nearly correctly working under Co-57 irradiation (according to the expectations) are around a dozen in the whole array, indicating generalized problems. Possible reasons may be due (i) to the detachment of reflective coating of pixels, (ii) to its vertical misalignment, (iii) to differences in pixel height that open windows, at the top and/or at the bottom of pixels, allowing light photons to escape from the crystal-array.
Finally, deflections of distributions above or below the bisector, like those of crystal-pixels 204 and 402 (see Figure A7) are quite frequently observed, pointing out also depth-depending defects attributable to the light-reflecting coating of crystal-pixels.

3.2.2. Comments

In order to limit the length of the paper, the plots of FWTMxy of 2-D charge-distributions from the data-takings other than Co-57 were omitted. Nevertheless, the reader can find more information about the symmetry of single-event charge-distributions from the plots of Fsym parameter-values that are presented in Section 3.3.
On the whole, the comparison between the responses from Co-57, Ba-133, and Cs-137 data-takings shows an agreement regarding the shapes of distributions of events per domain. An increased density of interactions is well visible in the Cs-137 plots along the bisector compared to other data-takings. In these plots, a factor around two is globally observed for the maximum of FWTMxy measured-value like in pixel 902 (not reported) compared to Co-57 and to Ba-133 results which, in turn, showed no relevant differences one over the other. The behaviors of pixels 204 and 402 have to be pointed out as singularities, where the distributions of events along the bisector are located above and below them, respectively, under both Co-57 (see Figure A7) and Ba-133 irradiation, while they are located oppositely in the case of Cs-137. The last defect may be referred to as the different reflectivity behaviors of pixels-coating the X- and Y-faces, and at the top and bottom of the pixel itself. In fact, deeper interactions of pixel 204 show, along the bisector, FWTMx > FWTMy values from both Co-57 and Ba-133 gamma-rays, while the inequality is reversed for Cs-137. The case of pixel 402 is the opposite because the inequality is FWTMx < FWTMy for both Co-57 and Ba-133 gamma-rays, and is reversed for Cs-137.
The plots from Lu-176 show the FEsc-X and FEsc-Y domains to be substantially empty because, during the event file download, the value of lower threshold of charge was set above the corresponding energy value of the escaping X-rays, that is, around 25 keV (Lu-176 (γ 1) 88.3 keV − Lu K X-ray 63.2 keV = 25.1 keV), probably due to noisy signals. The reasons why the other Lu 176 high-yield emissions like (γ 2), and (γ 3) at 201.8 and 306.8 keV, respectively, did not contribute to the Lu X-ray production need more investigation, keeping in mind the endogenous nature of radiations, as well as their timing and angular correlations. The behaviors of pixels 204 and 402 are similar to those above-described for Co-57 and Ba-133 data-takings, that is, the distributions of events along the bisector show deflections opposite to those of Cs-137.
On the whole, the comparison of the distributions regarding a given crystal-pixel between exogenous-radiation data-takings shows distributions of single-events reaching distances as far from the origin as the gamma-rays mean free path value can increase (results from Lu 176 self-activity data are not in agreement with this). This encourages a specific study for inferencing the value of DoI of an event as a function of the distance from the origin along the bisector of the plane (FWTMx, FWTMy).

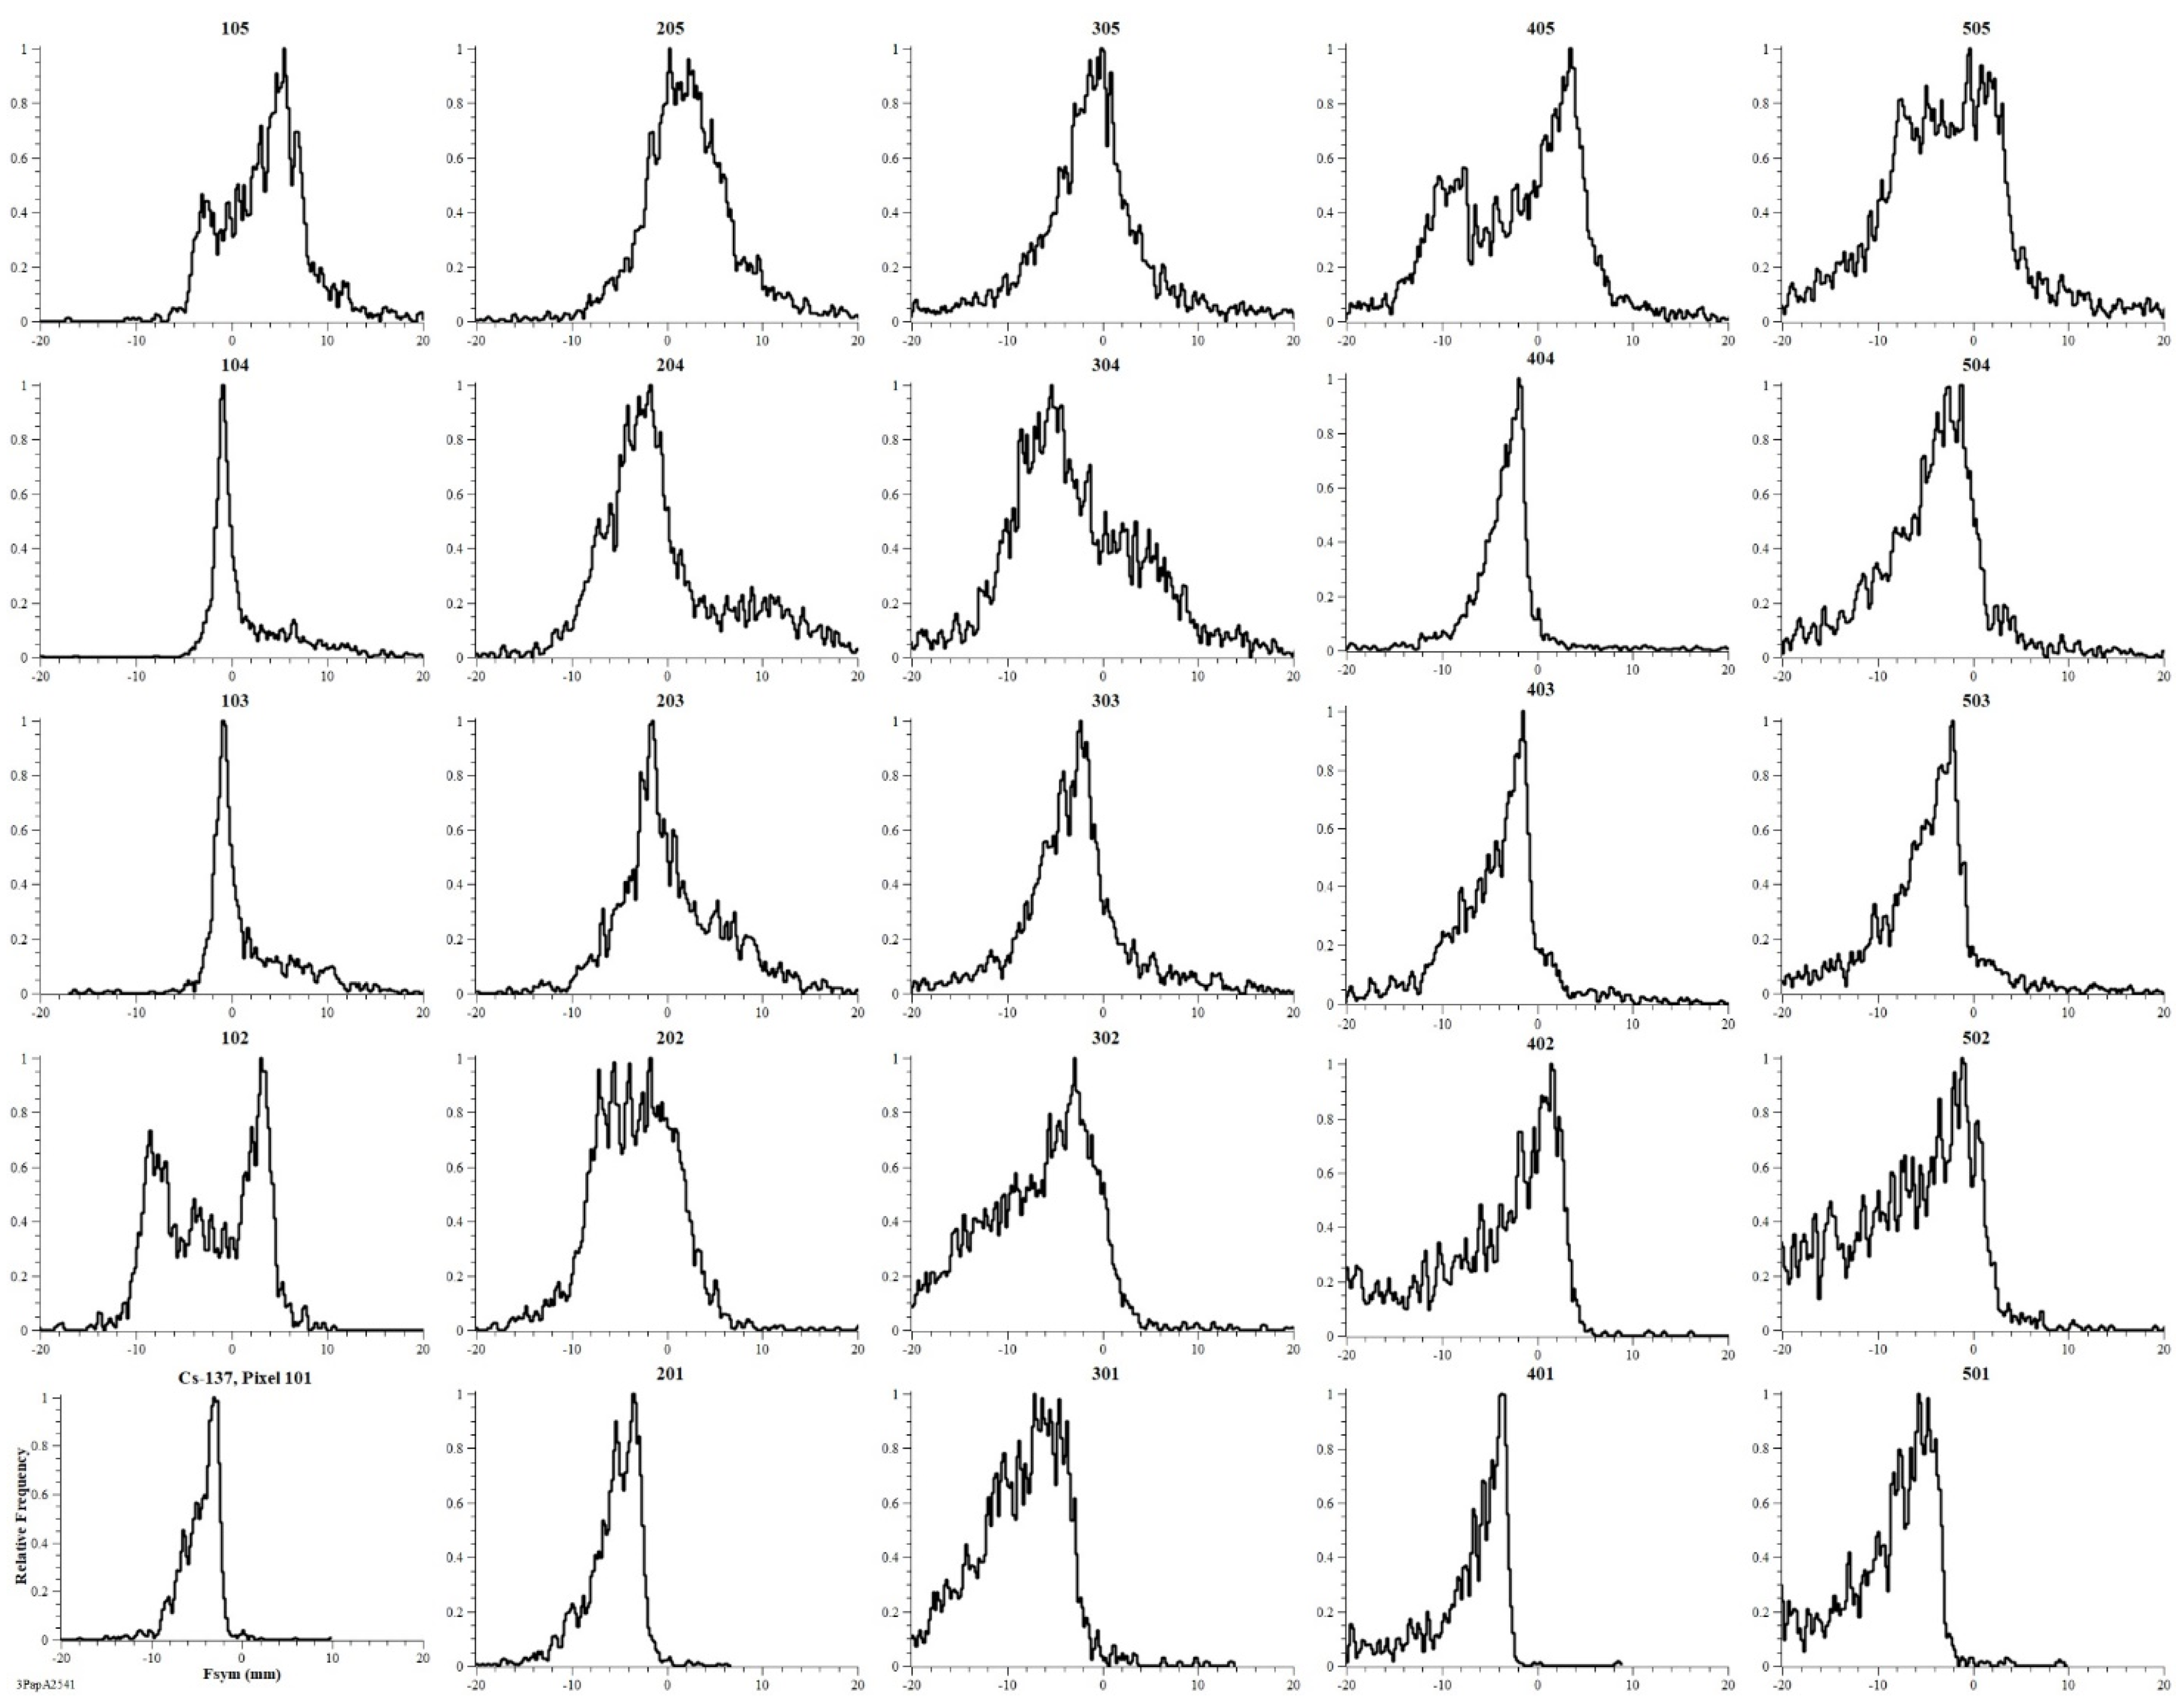
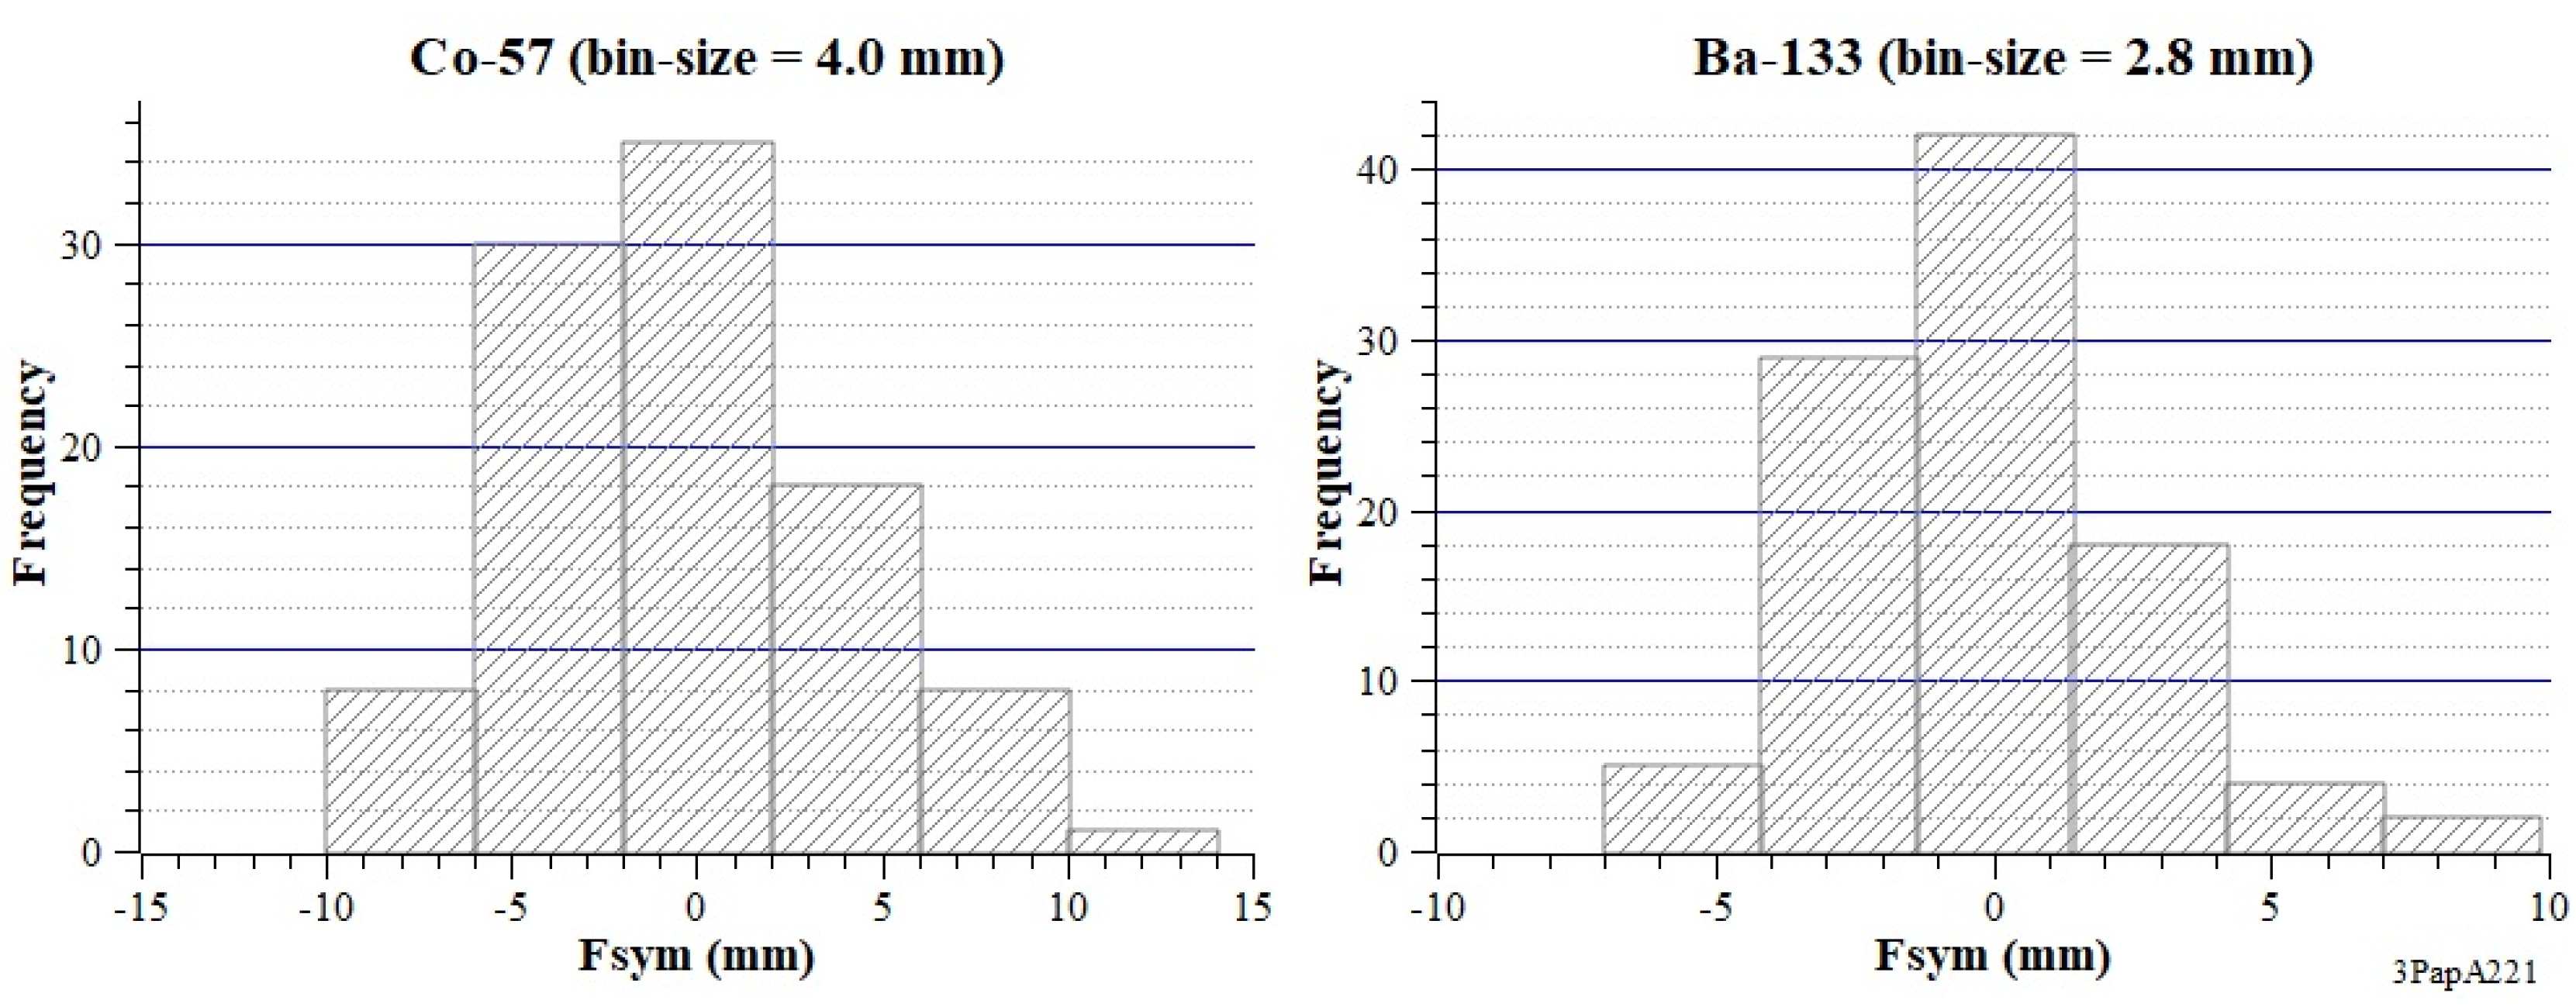
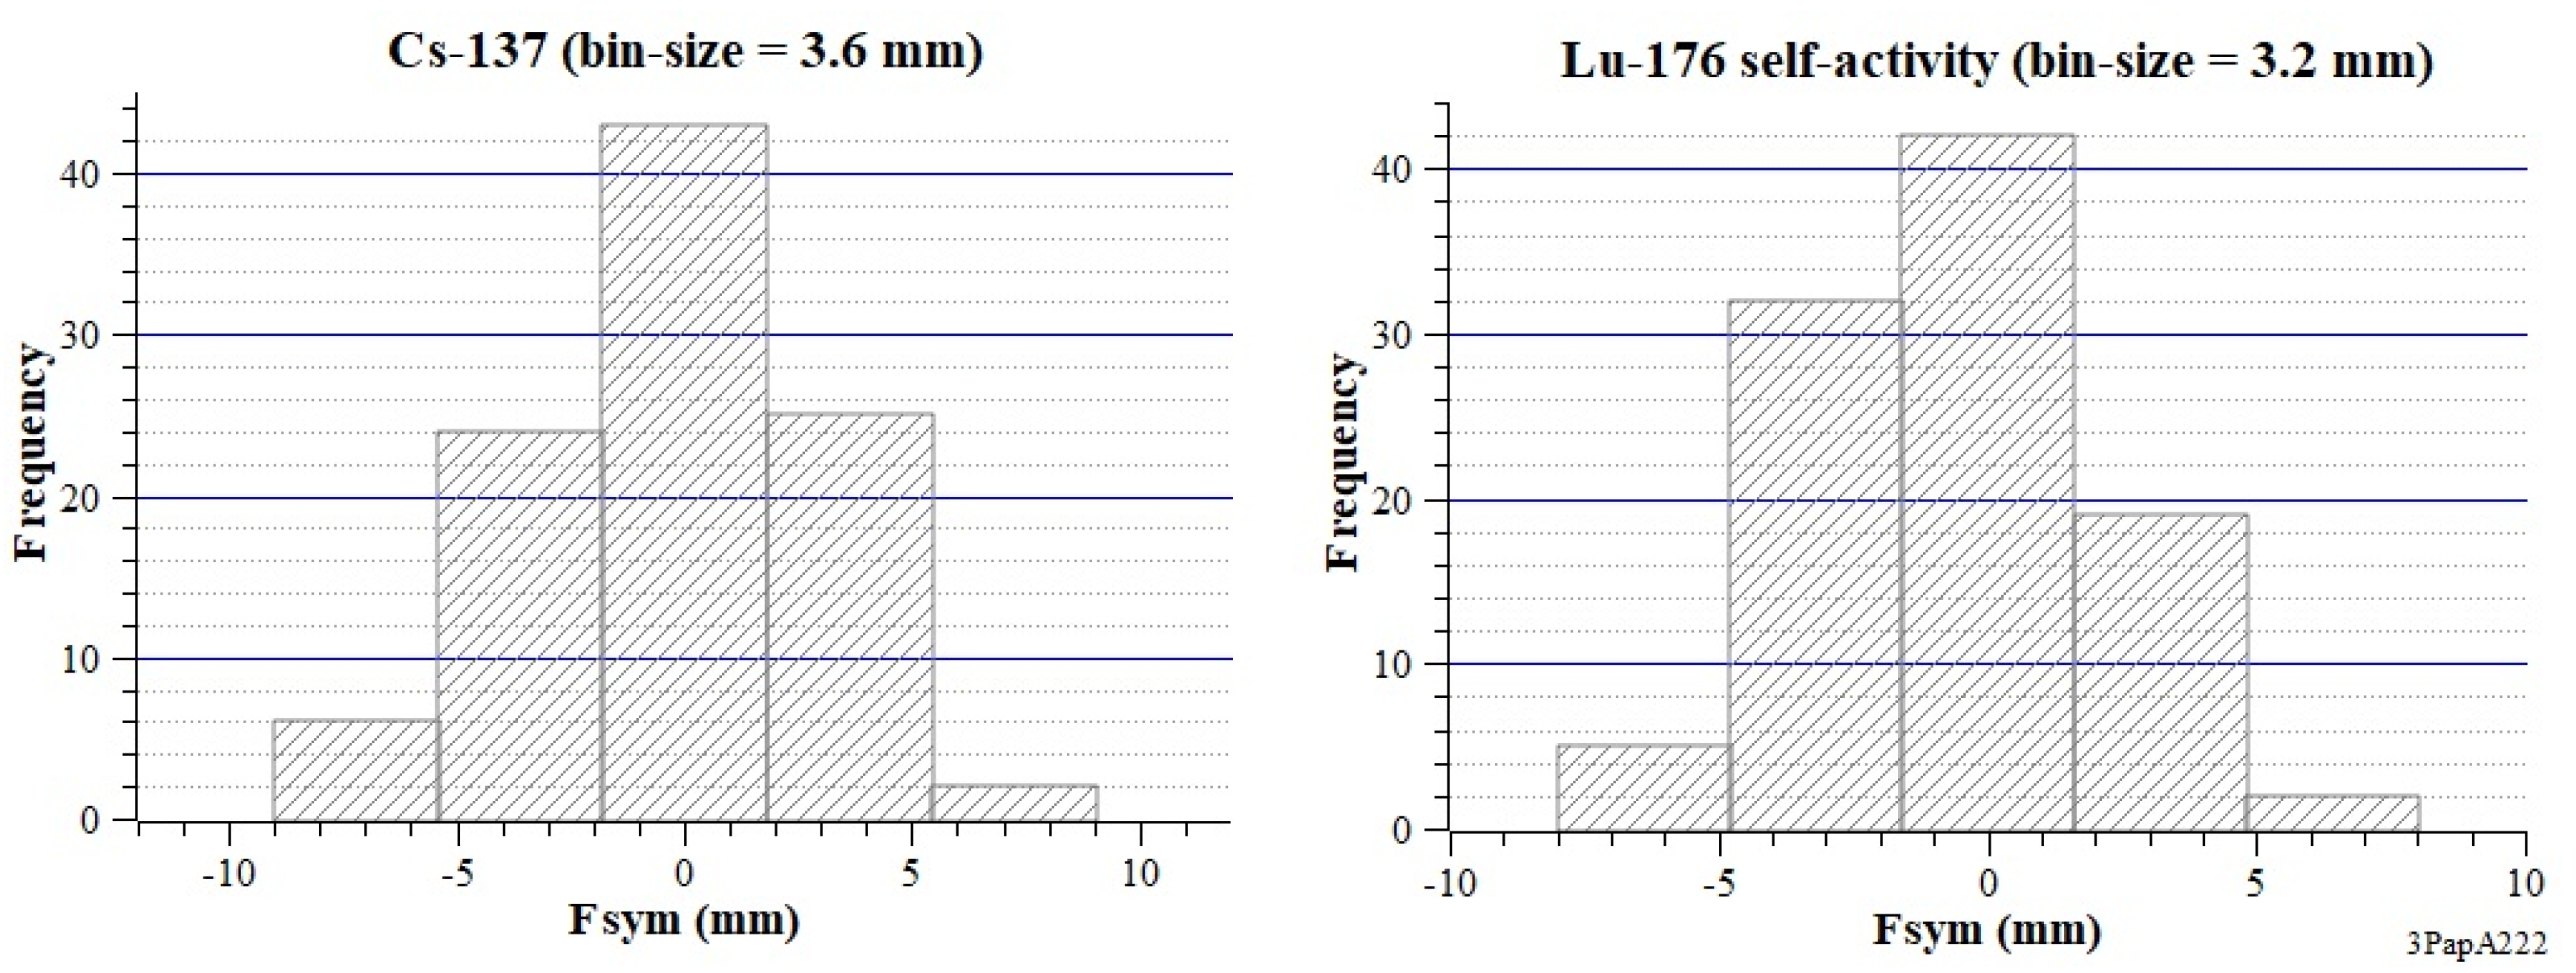
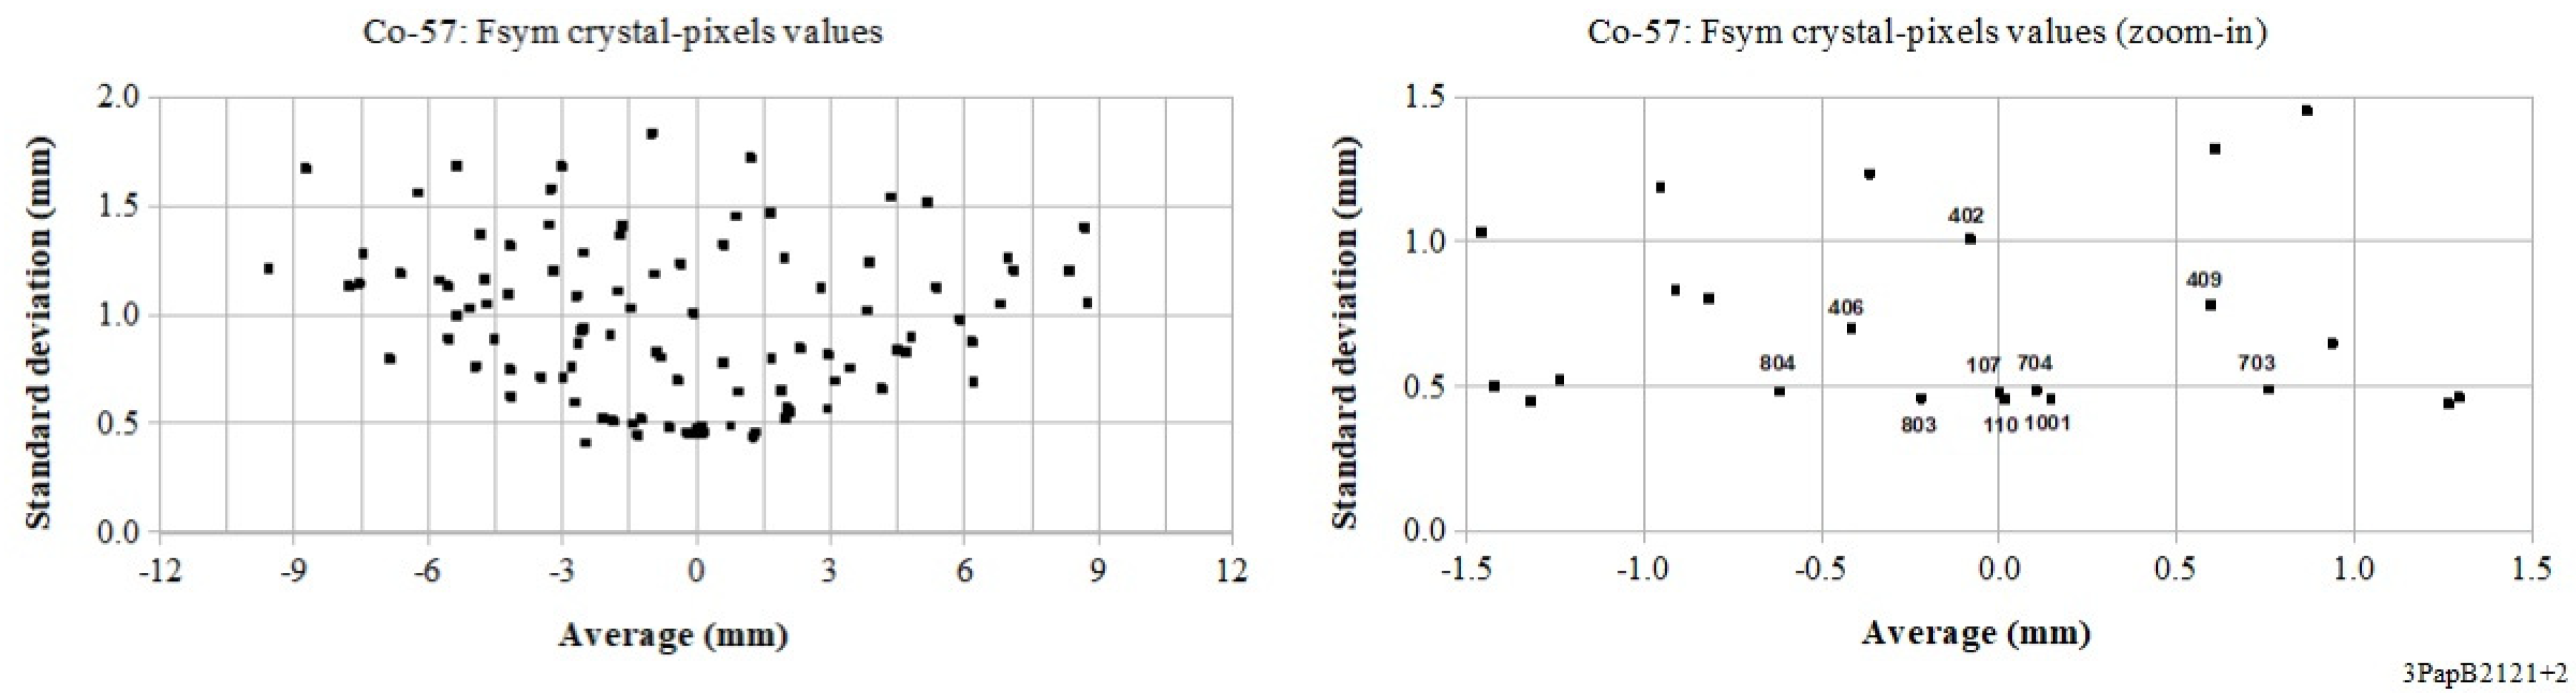
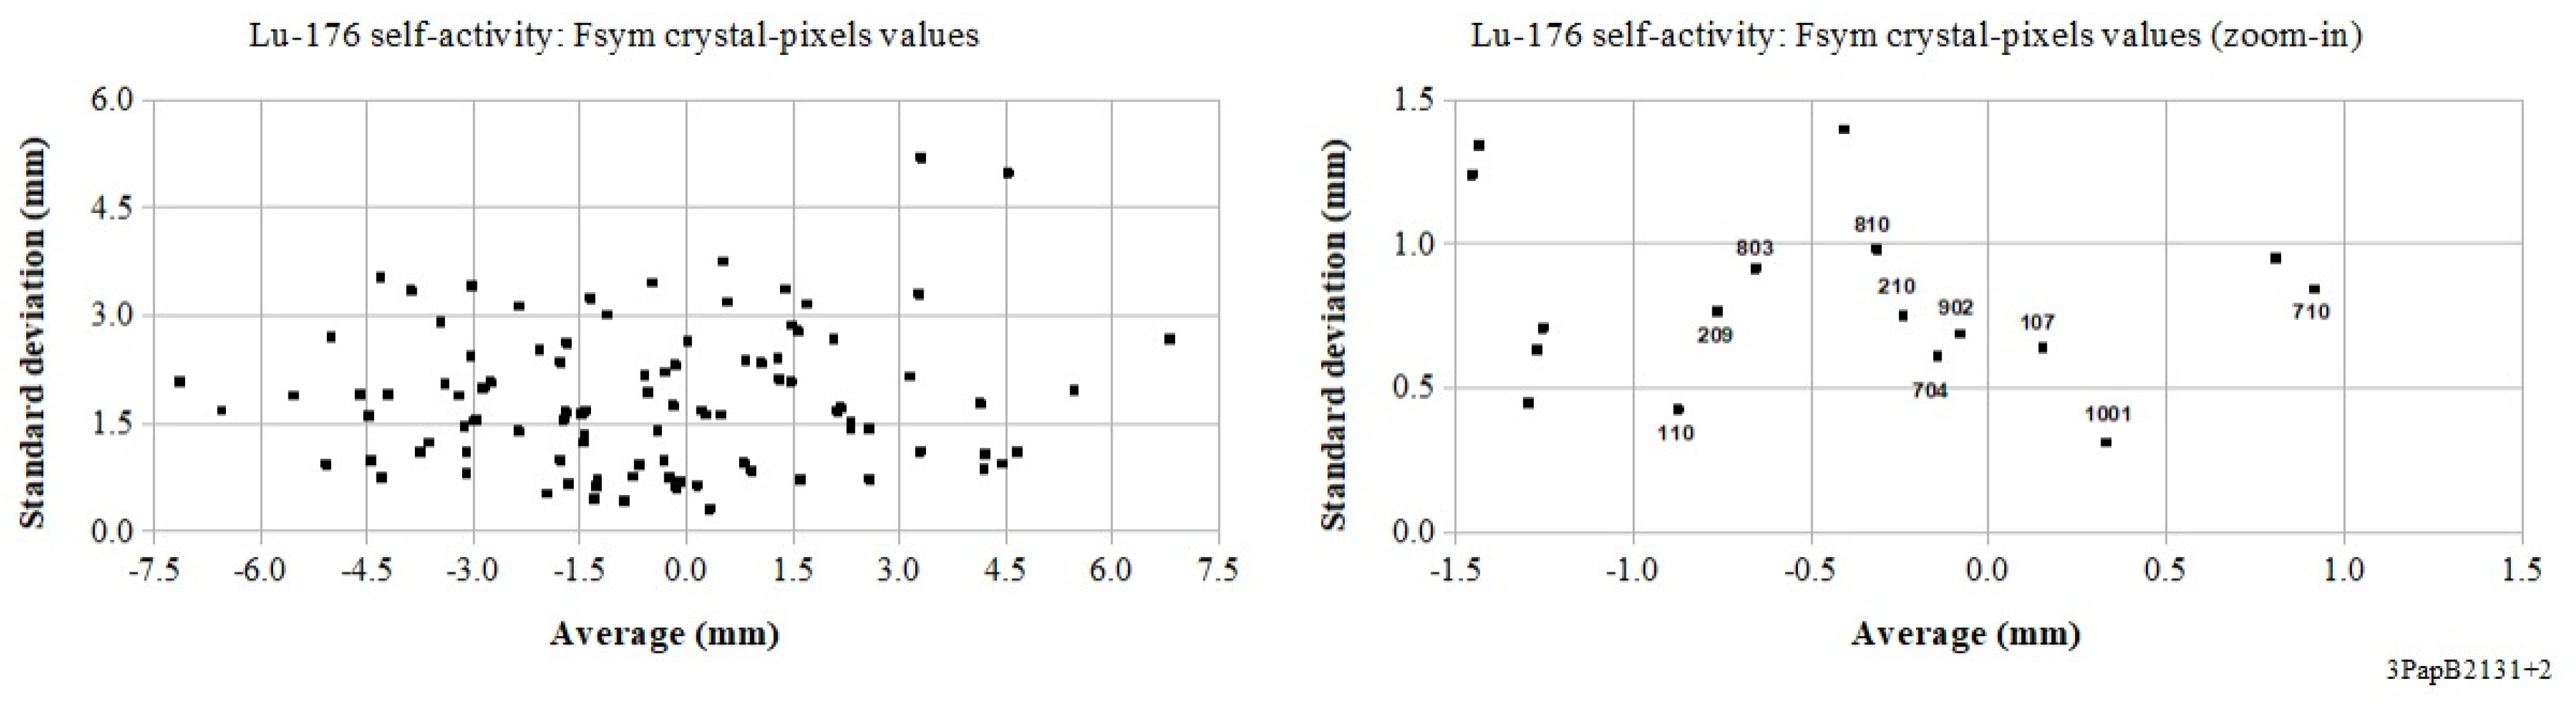
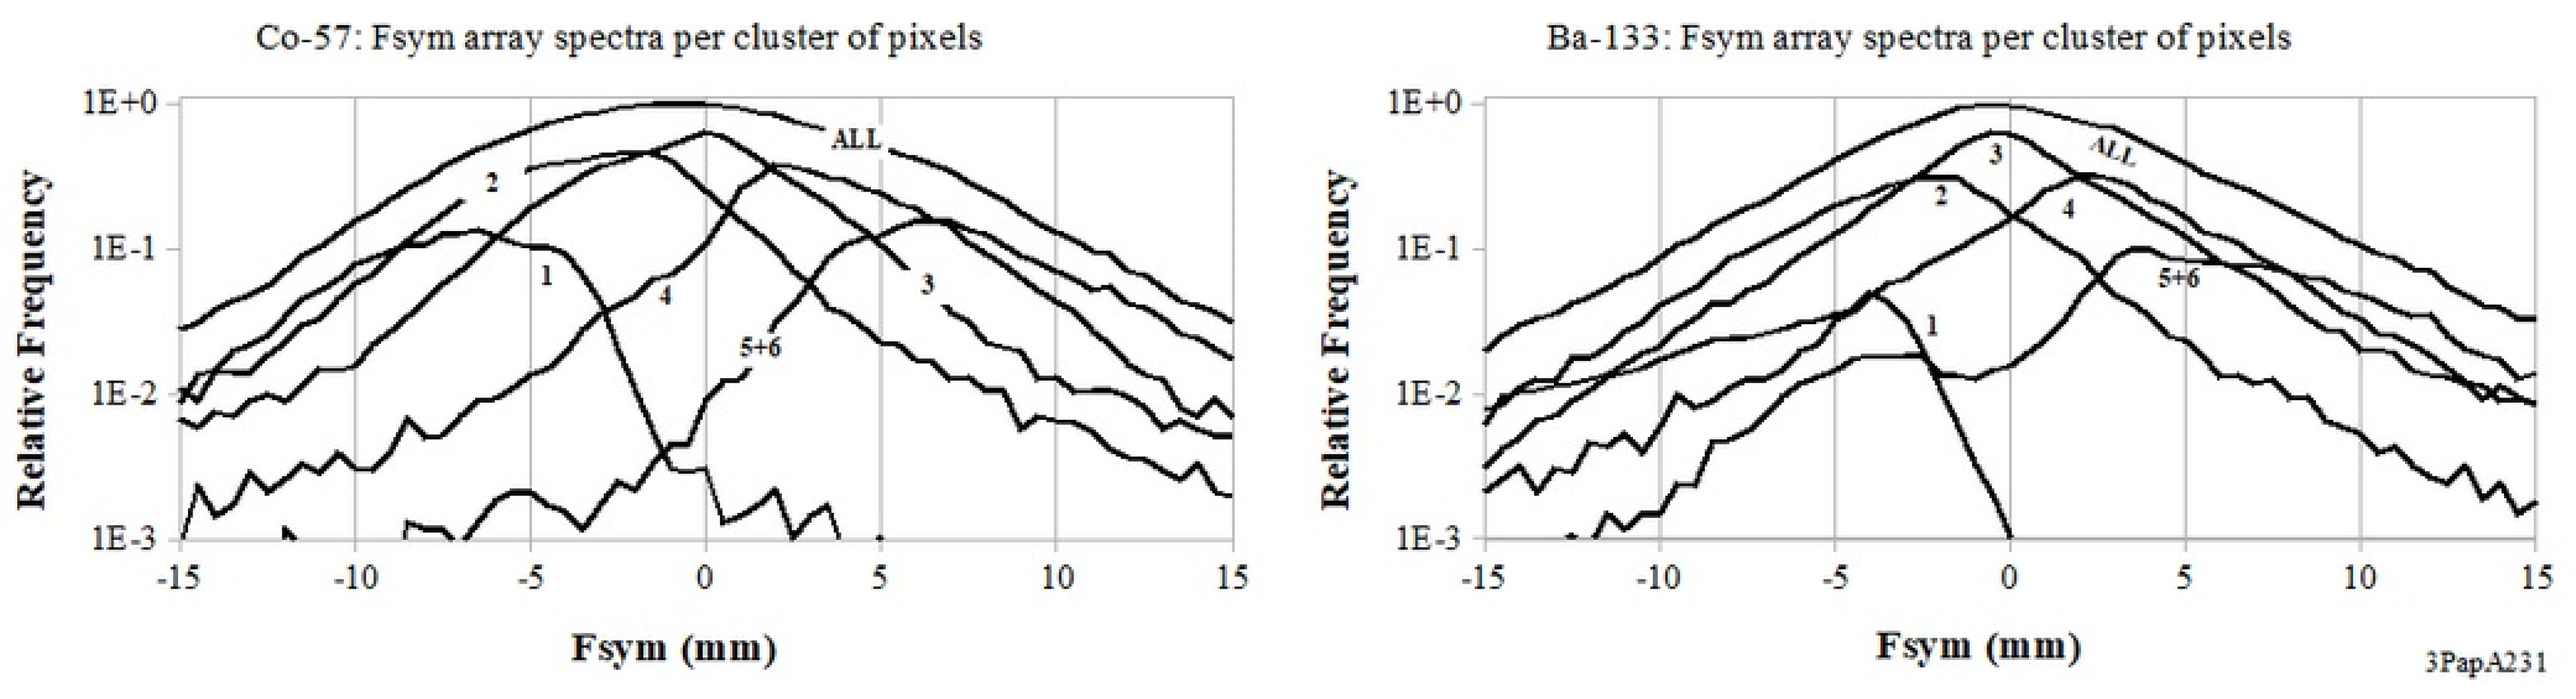
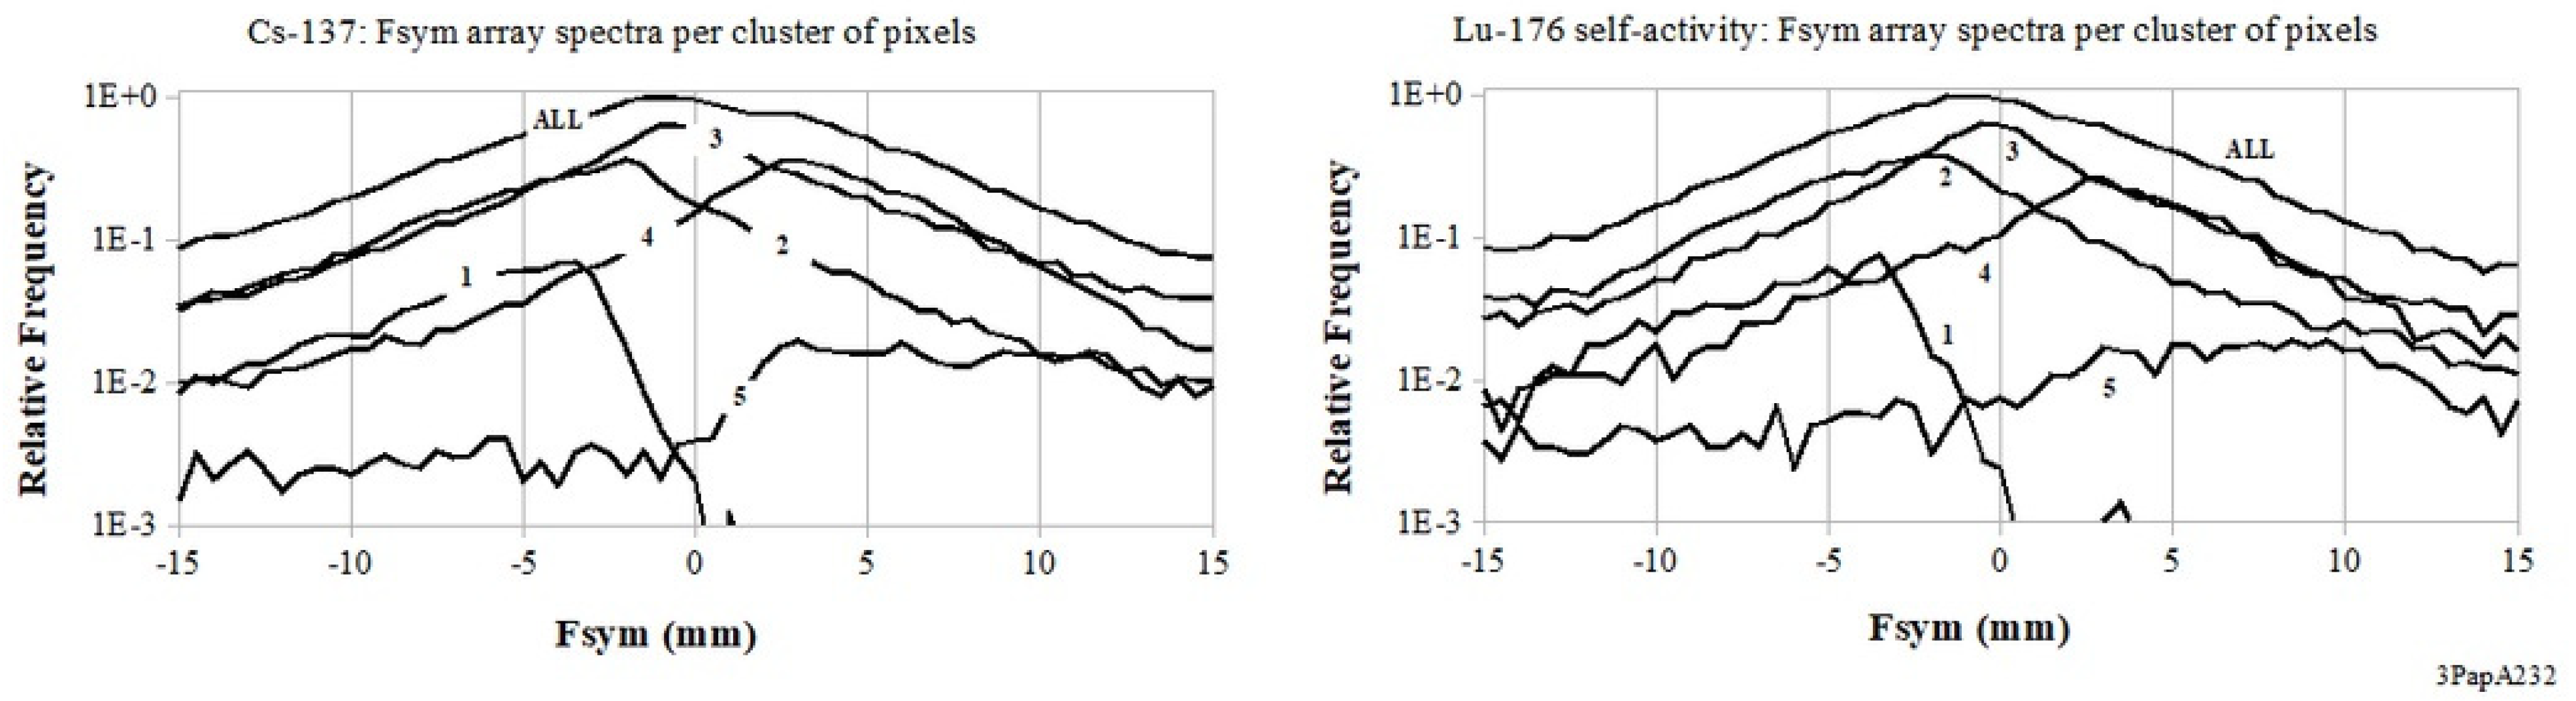
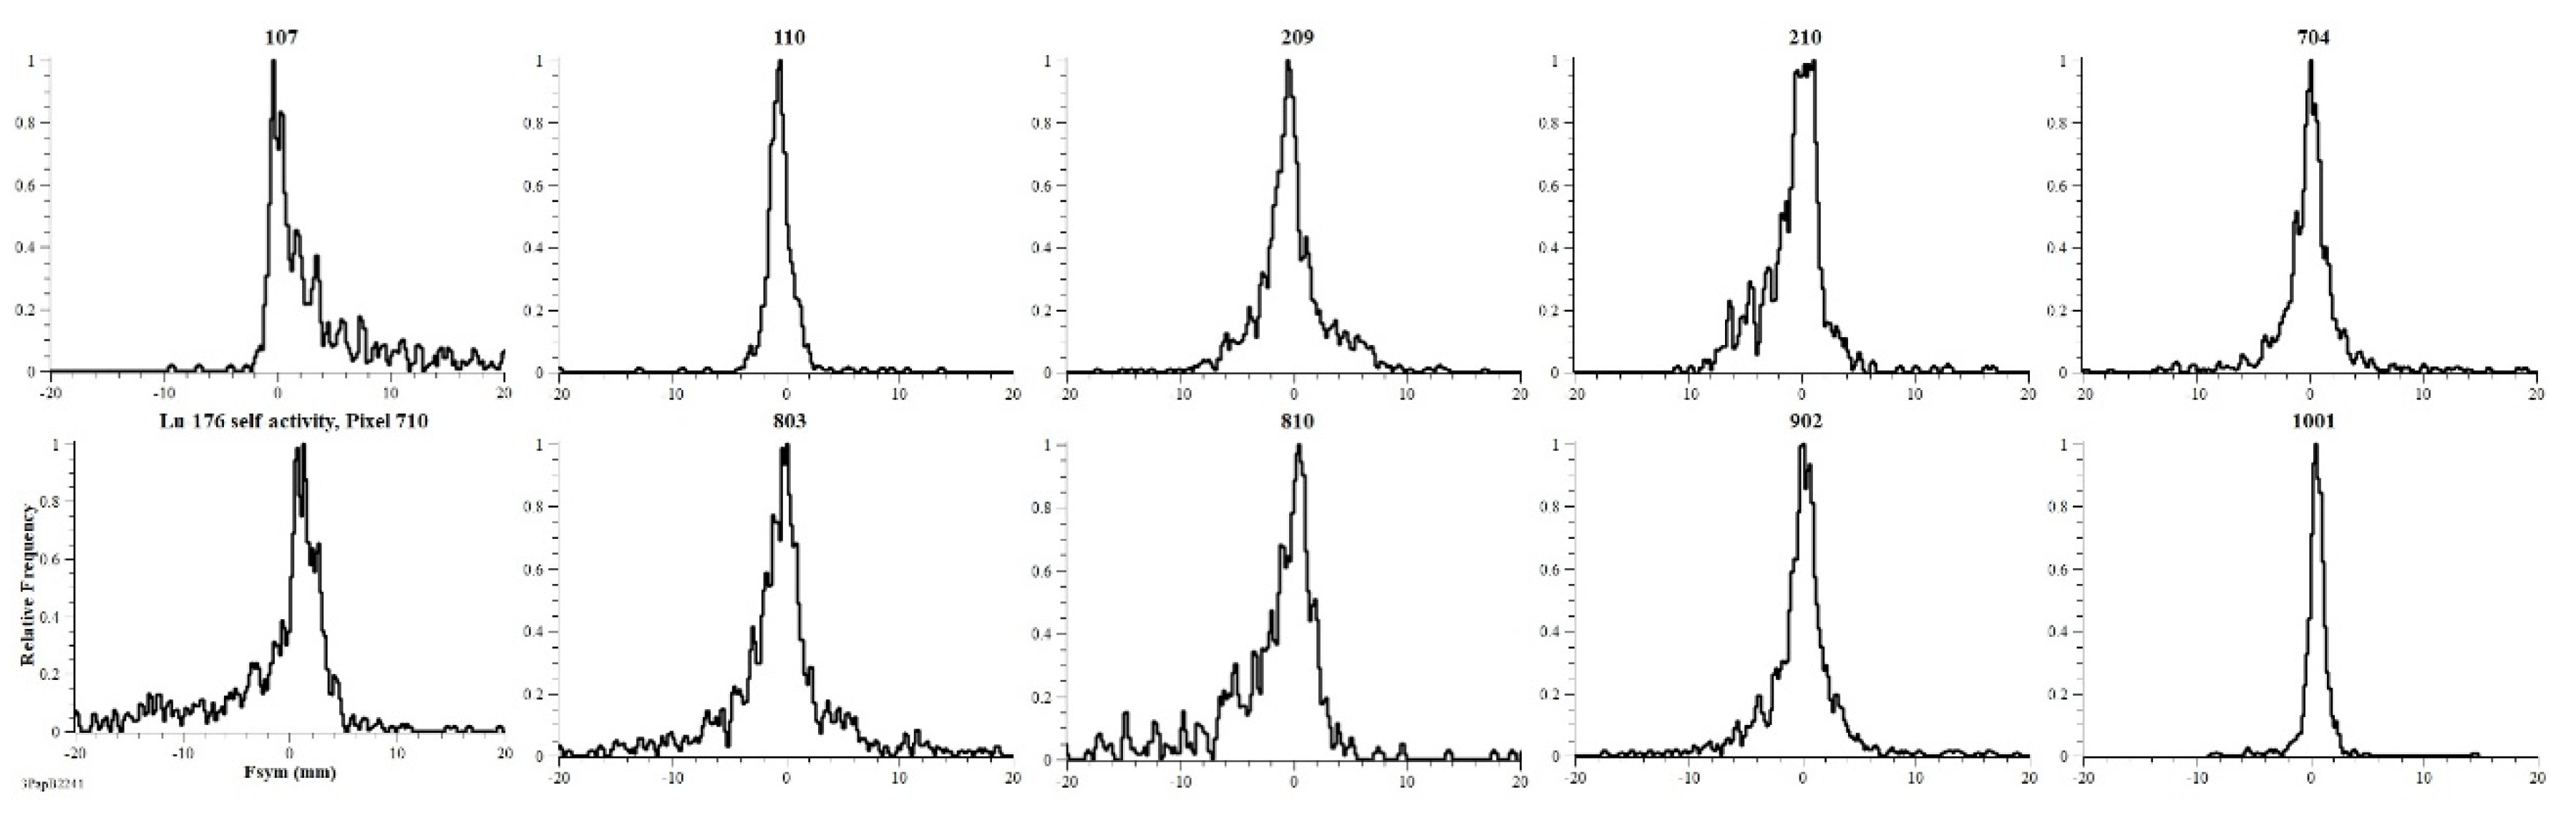
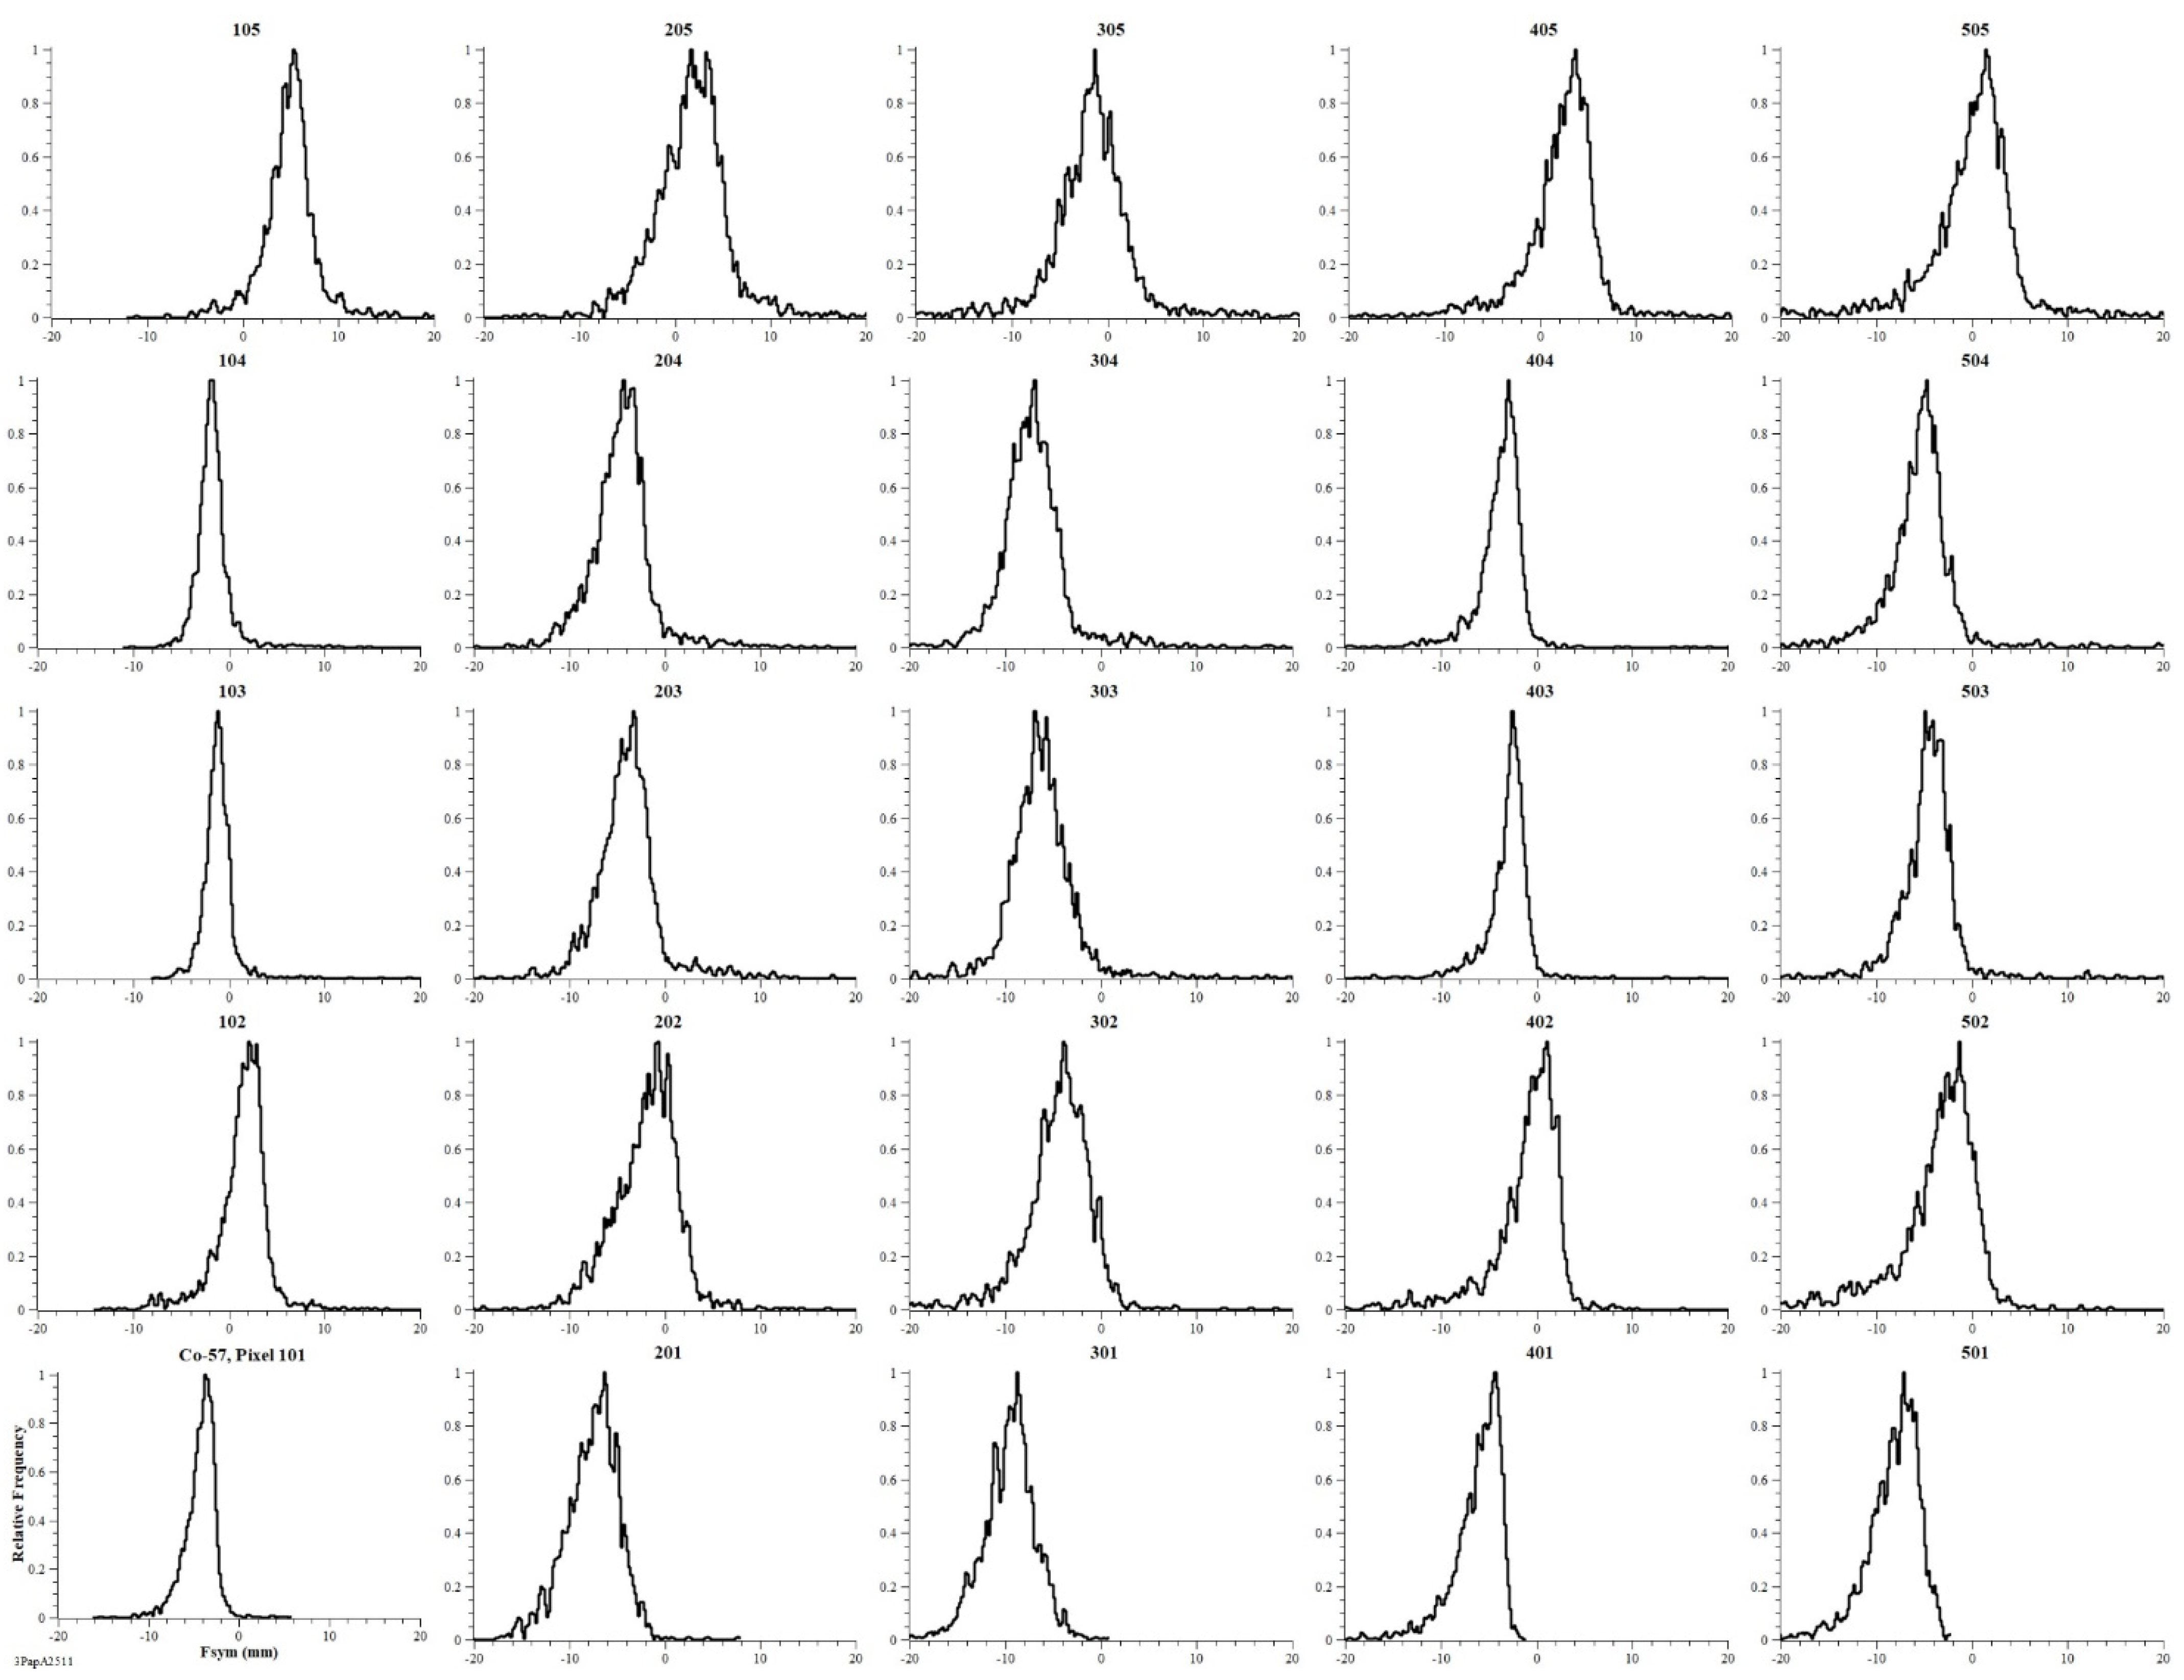
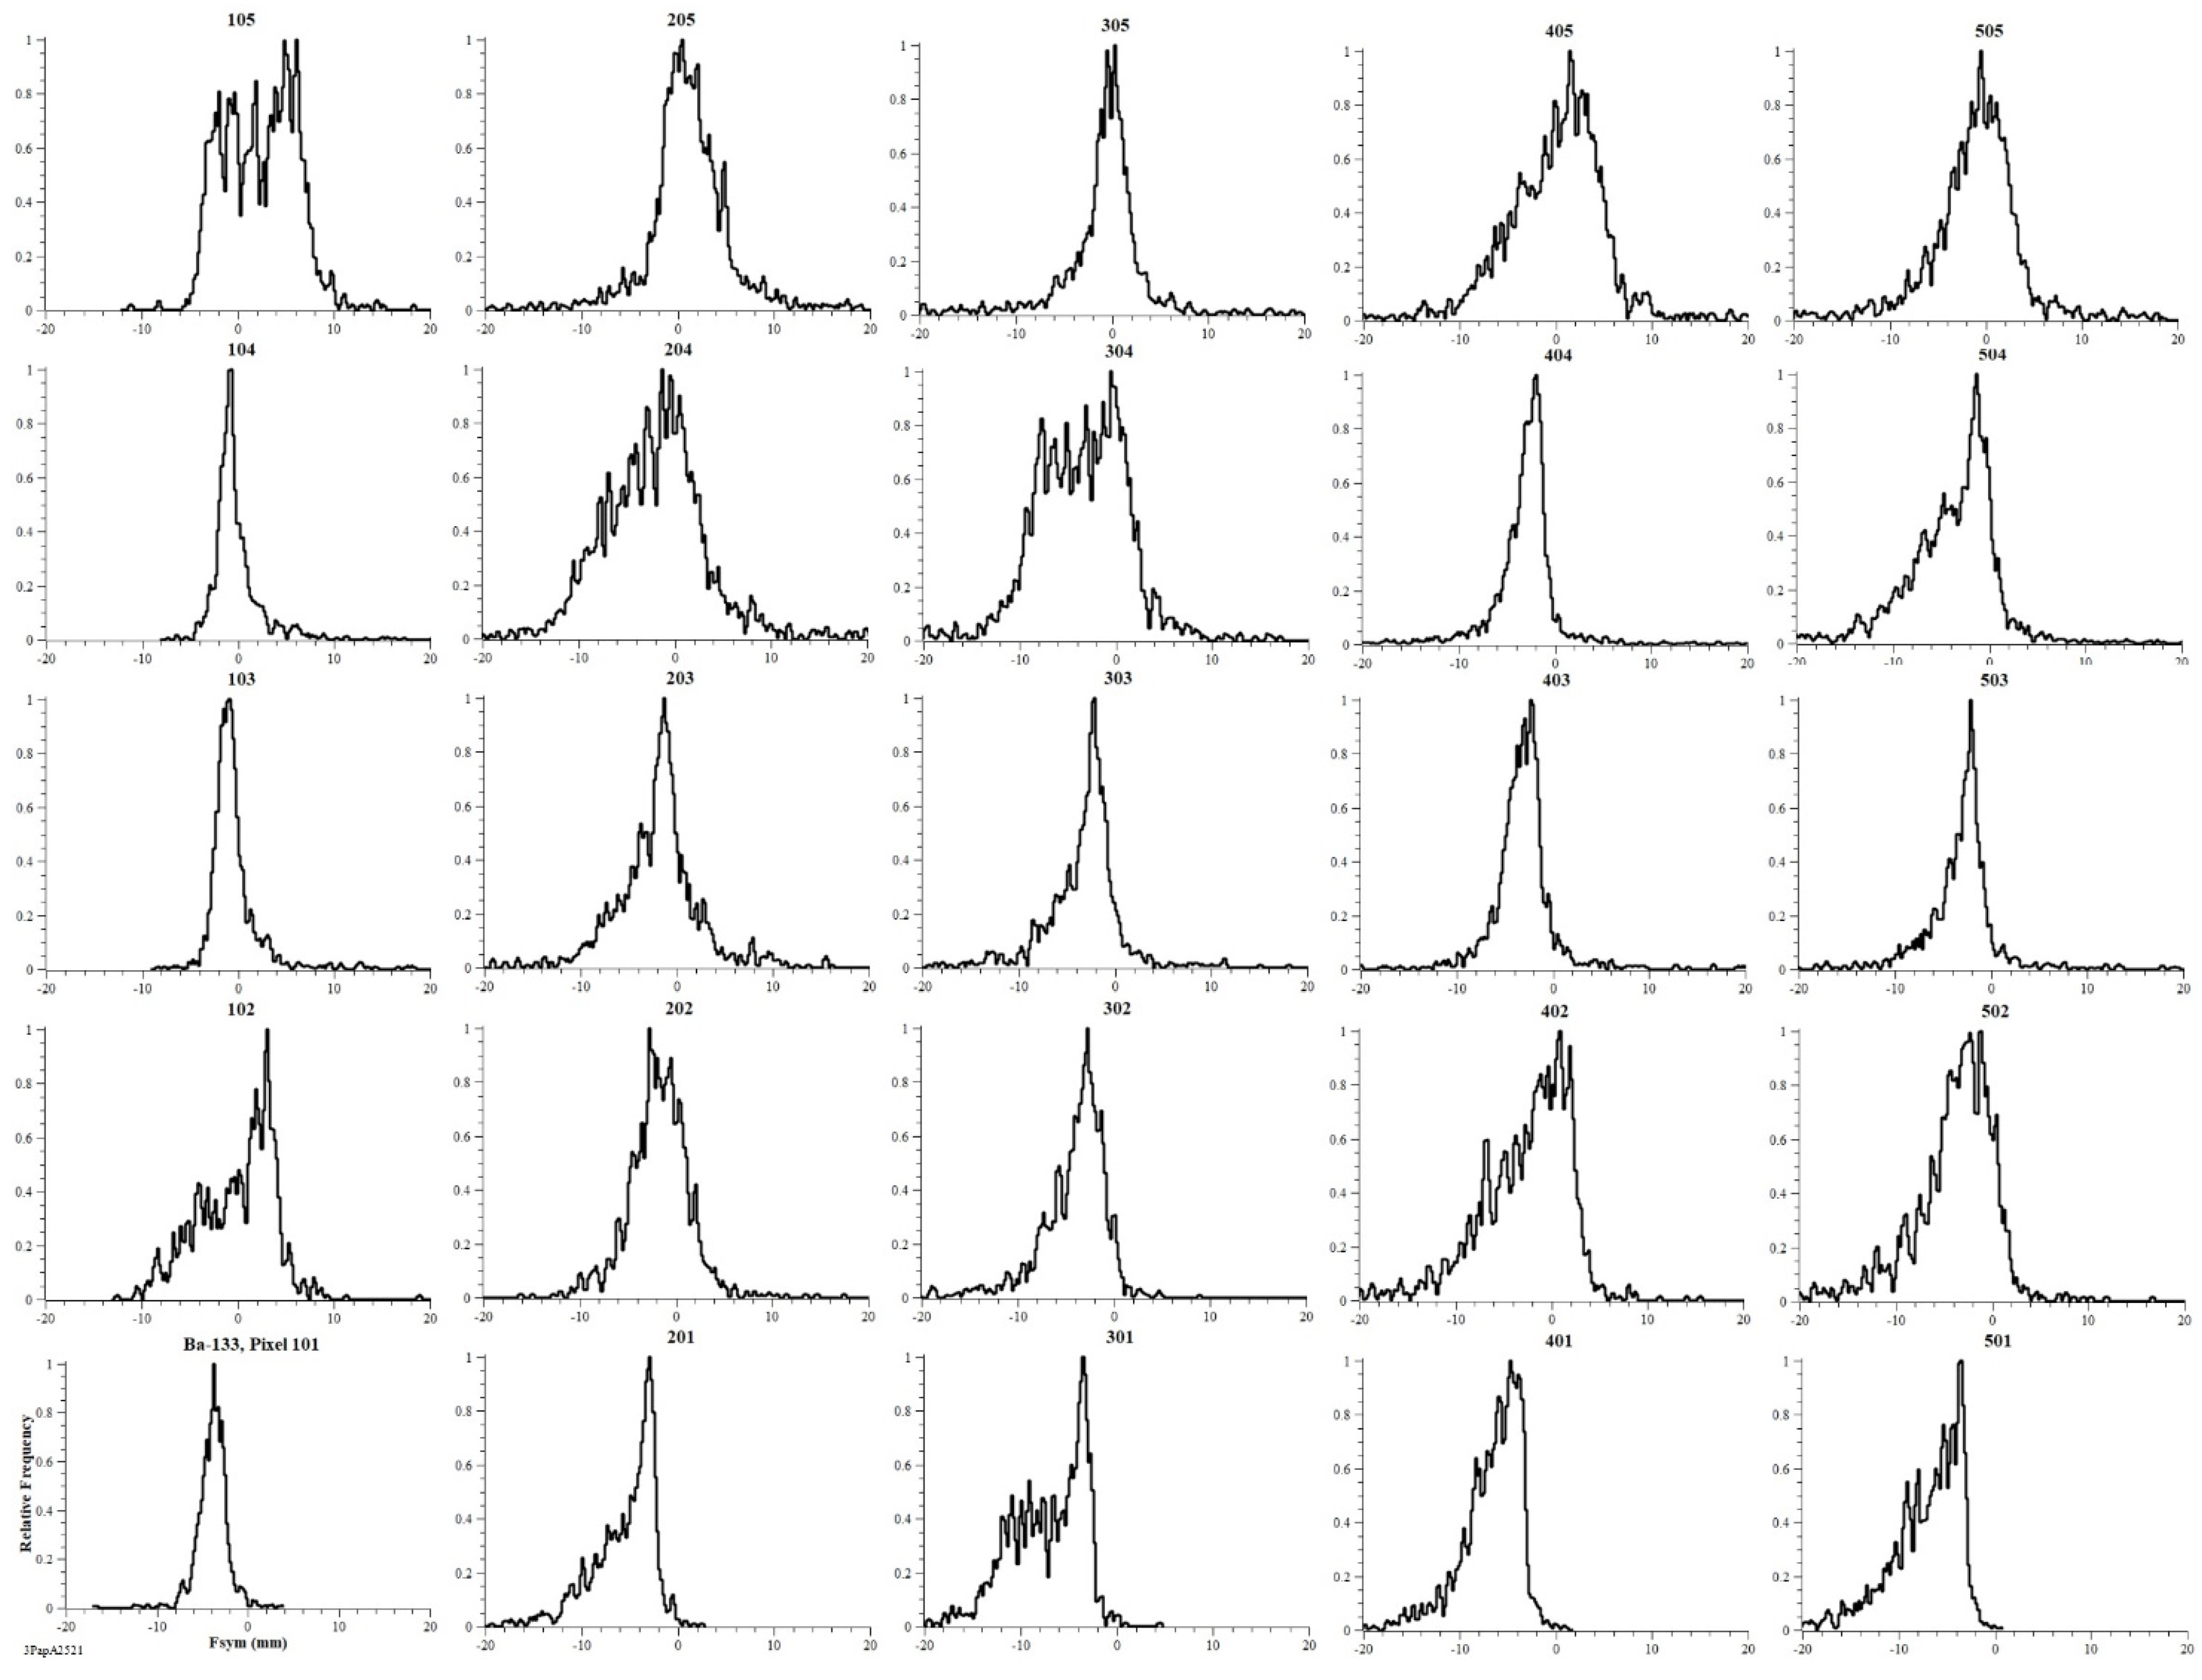
3.3. Crystal-Pixel’s 2D Charge-Symmetry Response (Fsym)

In the following, the physical concept of single-event symmetry of spreads of 2-D charge-distribution, measured by the value of Fsym parameter was extensively used in the analysis of experimental data. In brief, the value of Fsym represents the distance between the point representing a given event and the bisector of the first quadrant of the plane (FWTMx, FWTMy), that is, the distance from the ideal symmetry, in mm [10].
In short, each event can also be characterized by the charge-distributions measured along X- and Y- axes, whose spread values FWTMx and FWTMy, respectively, can be evaluated by fitting the experimental charge-data to an appropriate analytical model. In better detail, the model must be suitable to represent distributions, for both axes independently, in an adaptive way, that is, assuring the possibility of varying the value of the ratio of Full Width at Half Maximum (FWHM) to FWTM, within a certain range of values along X- and Y- axes [9].
Let us consider an ideal 2-D crystal-array made of pixels surrounded by coatings characterized by homogeneous reflective properties and having contiguous light-output faces lying on the same plane. In principle, such an ideal array produces single-event symmetric 2-D charge-distributions at the PSPMT output if a single incident gamma-ray releases all its energy inside the volume of the given crystal-pixel (case a). Otherwise, if a fraction of residual energy is deposited in one or more other pixels of the array, asymmetric 2-D charge-distributions appear at the PSPMT output (case b). Since the variables FWTMx and FWTMy indicate single-event values of full-width at the 10th maximum of charge-distributions, the cases (a) are represented in the plane (FWTMx, FWTMy) by points falling along the bisector of the first quadrant (the first quadrant of the plane (FWTMx, FWTMy) may be defined as the set of points having both FWTMx and FWTMy coordinates > 0), while the cases (b) are localized above or below this bisector depending on the values of the event charge-spreads (above it, if FWTMy > FWTMx, or below it, if FWTMy < FWTMx).
In real crystal-pixels, differences of reflective properties of the walls producing deviations from the ideal symmetrical behavior may occur due to several defects (such as faults in the coating and/or gluing materials, as well as deterioration attributable to mechanical, thermal, radiation damage, or other) taking place during the manufacturing process or along the crystal-array lifetime.
According to the notation introduced in [10], the selection of events falling within a given distance from the bisector may be more easily carried out by rotating the frame of reference (X,Y) around the origin by the angle of α = −π/4 radians, and by using appropriate windows of acceptance, working on the rotated ordinate FWTMyR = Fsym for selecting events.
The Equations (2)–(5), rewritten from [10], apply to single-events of a given data-taking, with α = rotation angle, in radians, and n = 1, … Nevents of data-taking:
FWTMxR(n) = FWTMx(n) cosαFWTMy(n) sin α
FWTMyR(n) = FWTMx(n) sinα + FWTMy(n) cos α
Fsym(n) = FWTMyR(n).
For a rotation angle α = −π/4 radians, by using Equations (2) and (3), Equation (4) can be written:
Fsym(n) = 2−½ (FWTMx(n) + FWTMy(n)).
Equation (6) give the values of lower- and upper-thresholds for the events belonging to a given pixel:
Thr1,2 (pix) = Fsym* ± κ σFsym*,
where:
  • Thr1,2 (pix) correspond, respectively, to the minus or plus sign in the second term of Equation (6) for a given crystal-pixel. The thresholds define the windows of acceptance of single-events by a given degree of symmetry of 2-D charge-distributions for the given pixel;
  • Fsym* represents the average of the Fsym(n) values characterizing the single-events belonging to the given crystal-pixel;
  • κ is a real number to be used for events clustering. It represents a multiplier factor defining the width of the acceptance window, and
  • σ(Fsym*) is the standard deviation of Fsym*.
The quantities Thr1,2 (pix), Fsym*, and σ(Fsym*) are in millimeters because the average value of Fsym(n) is expressed in millimeters and its standard deviation is in millimeters. The results presented in [10] relate to events grouped by using five κ-values from 0.5 to 1.5 by 0.25 steps. In the present work, such values were extended to include the four elements 0.25, 2.0, 2.5, and 3.0, in order to perform a more detailed study of event windowing.
Spectra from all data-takings, obtained by building histograms from single-events Fsym values with 0.2 mm binning, were smoothed by using the Savitzky–Golay method [11] with five-points and a second order polynomial. Frequency values were normalized, crystal-pixel by crystal-pixel, to the respective maximum value for better comparison.

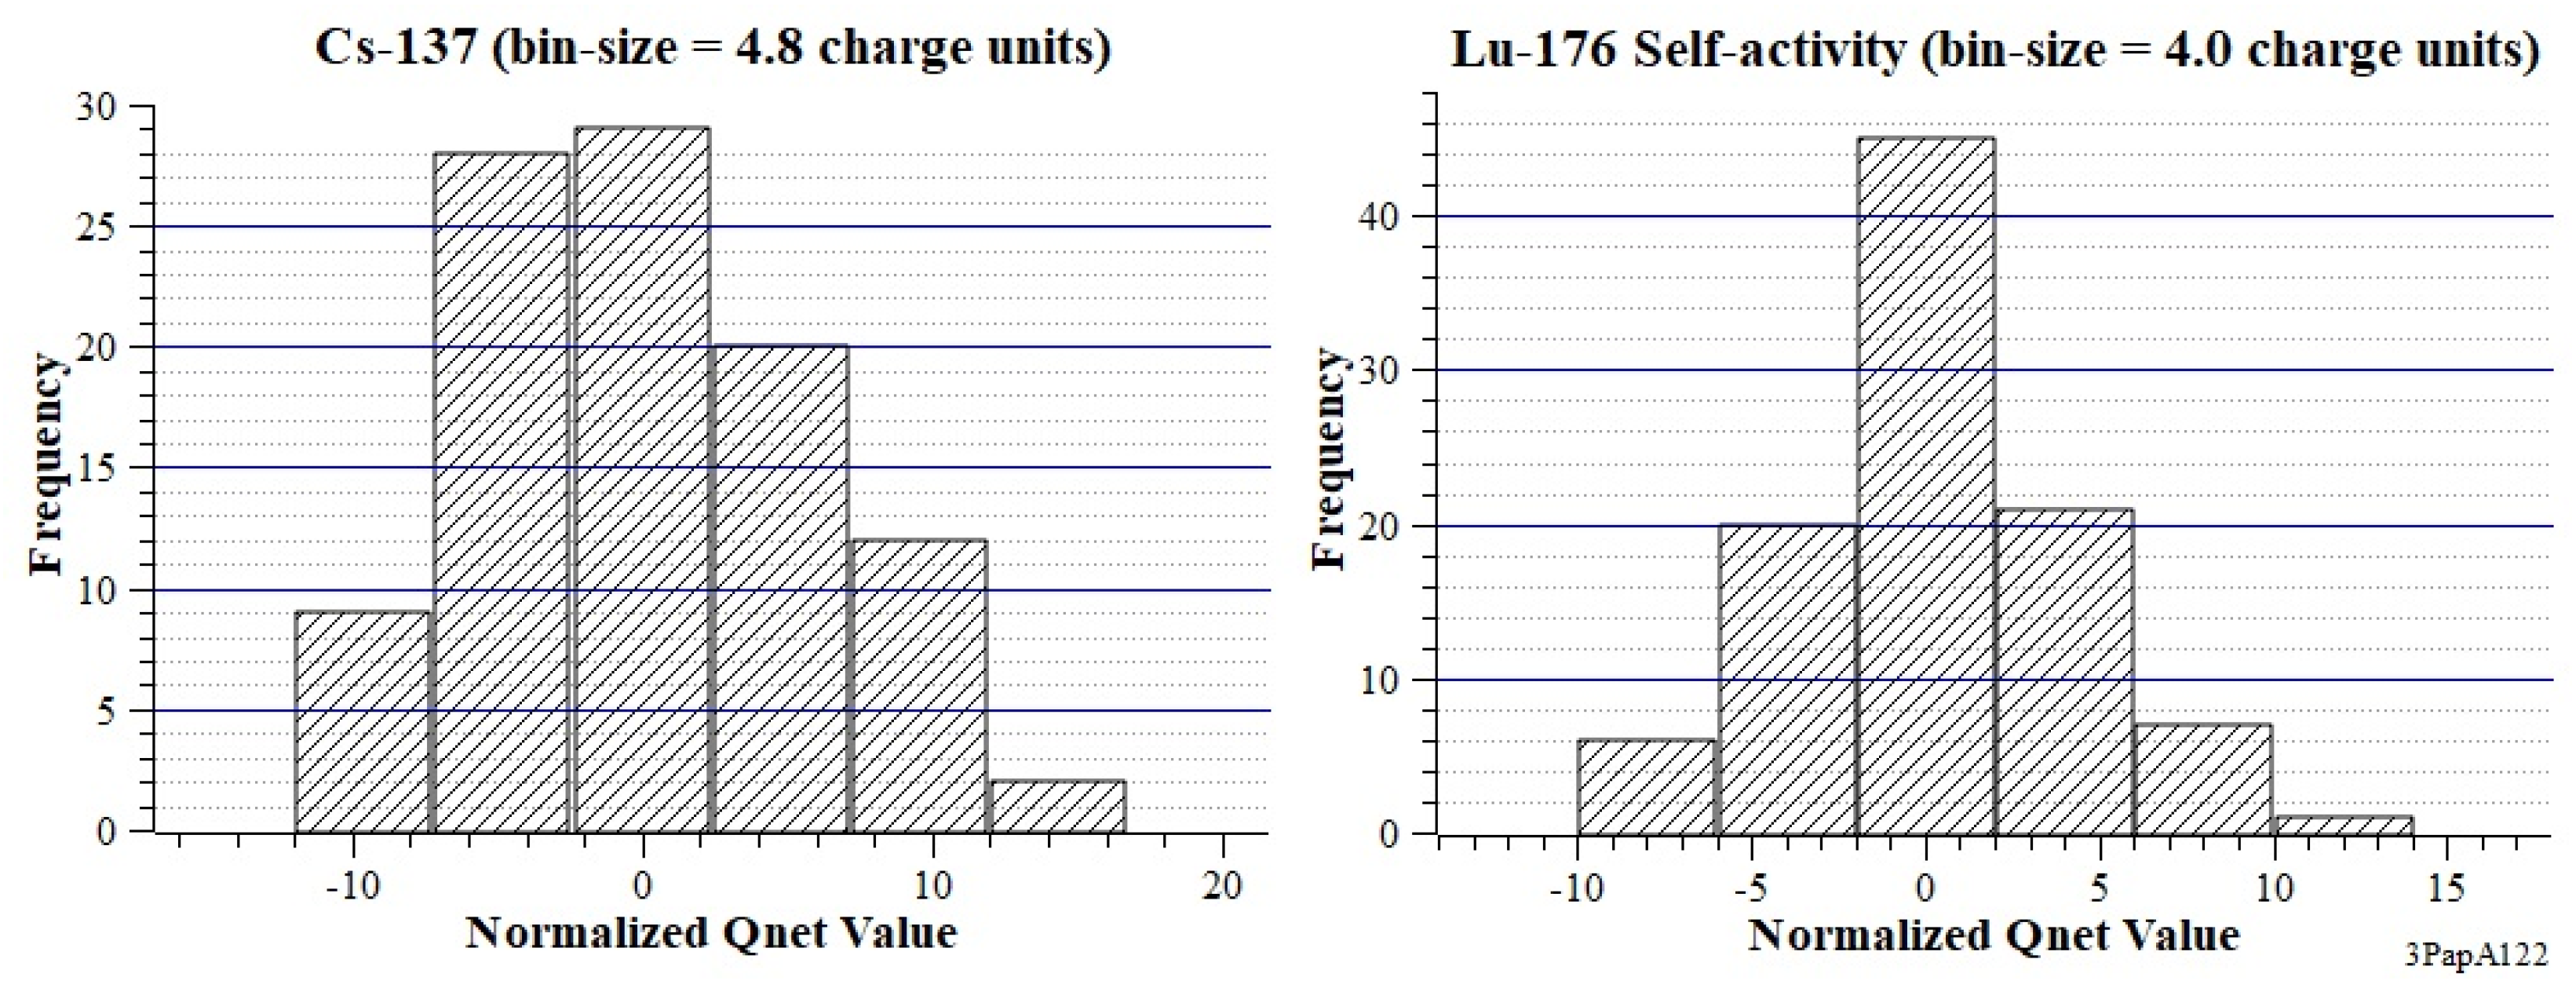
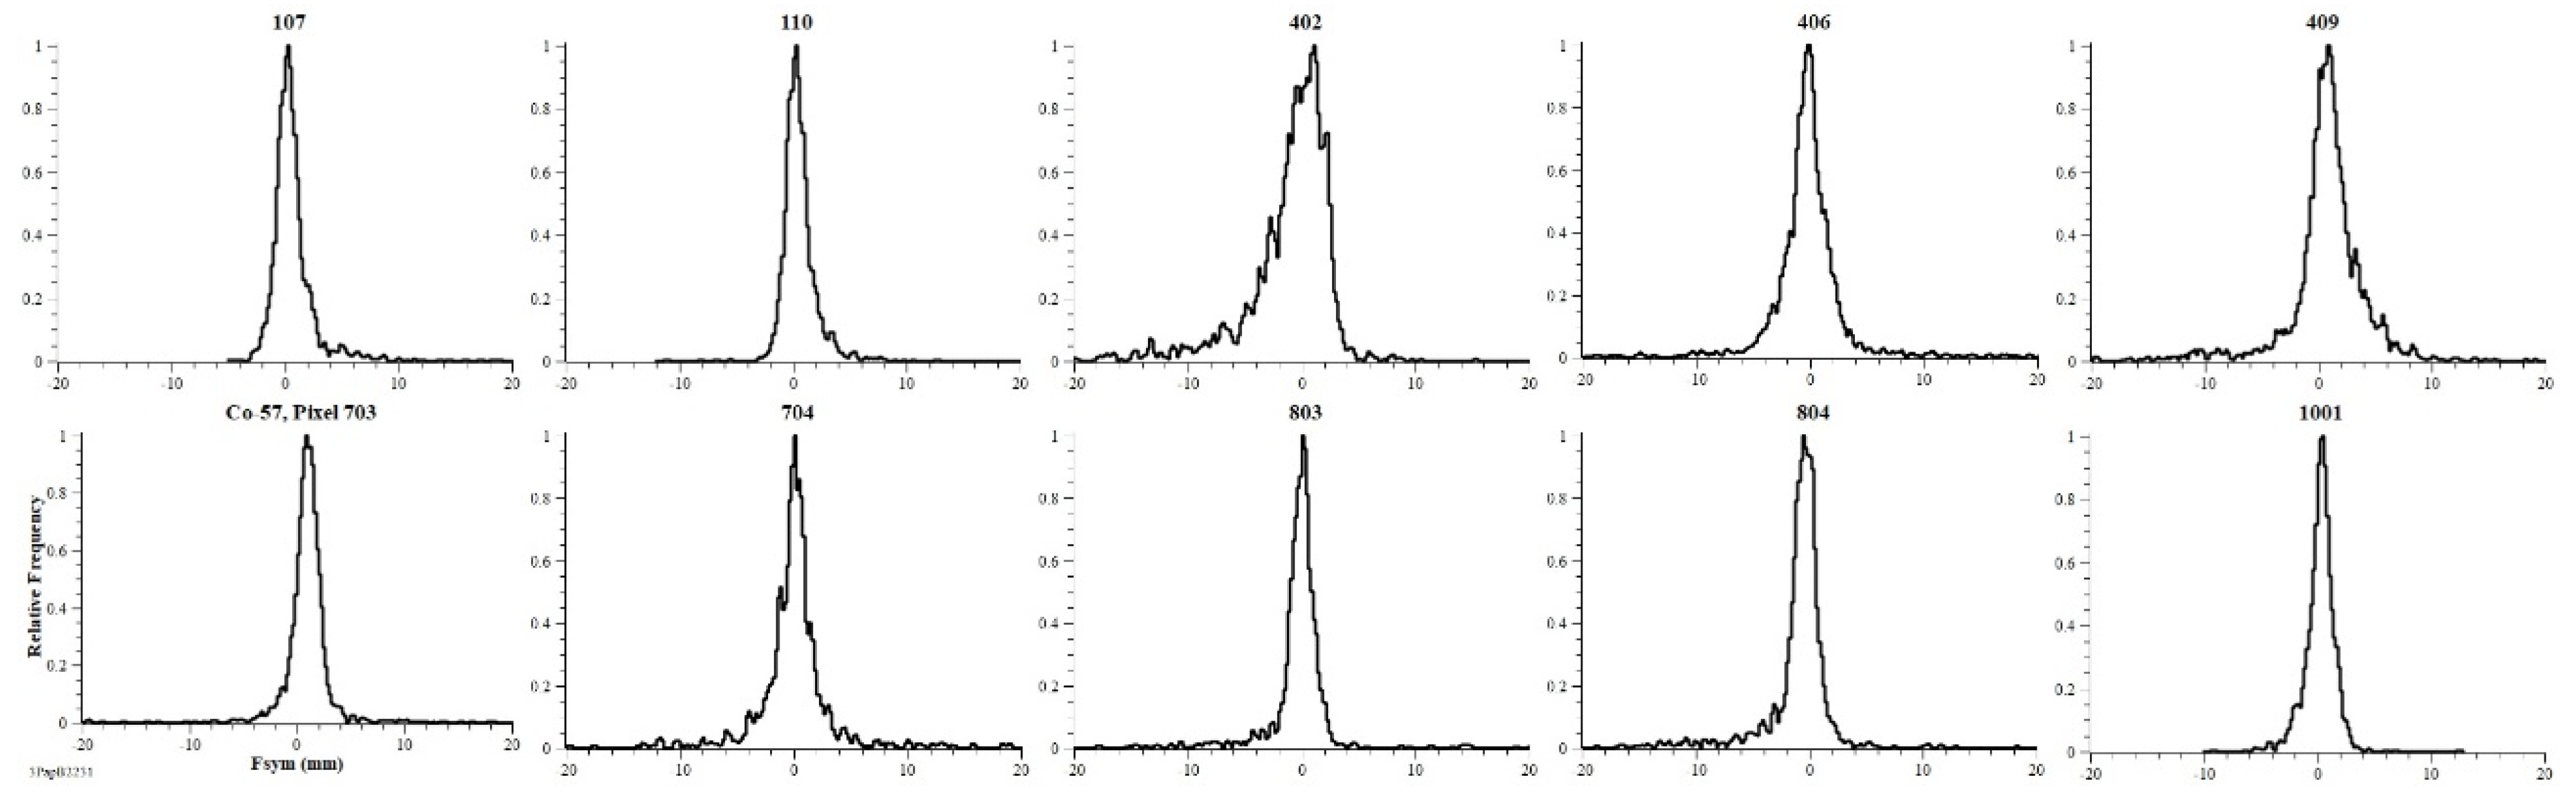
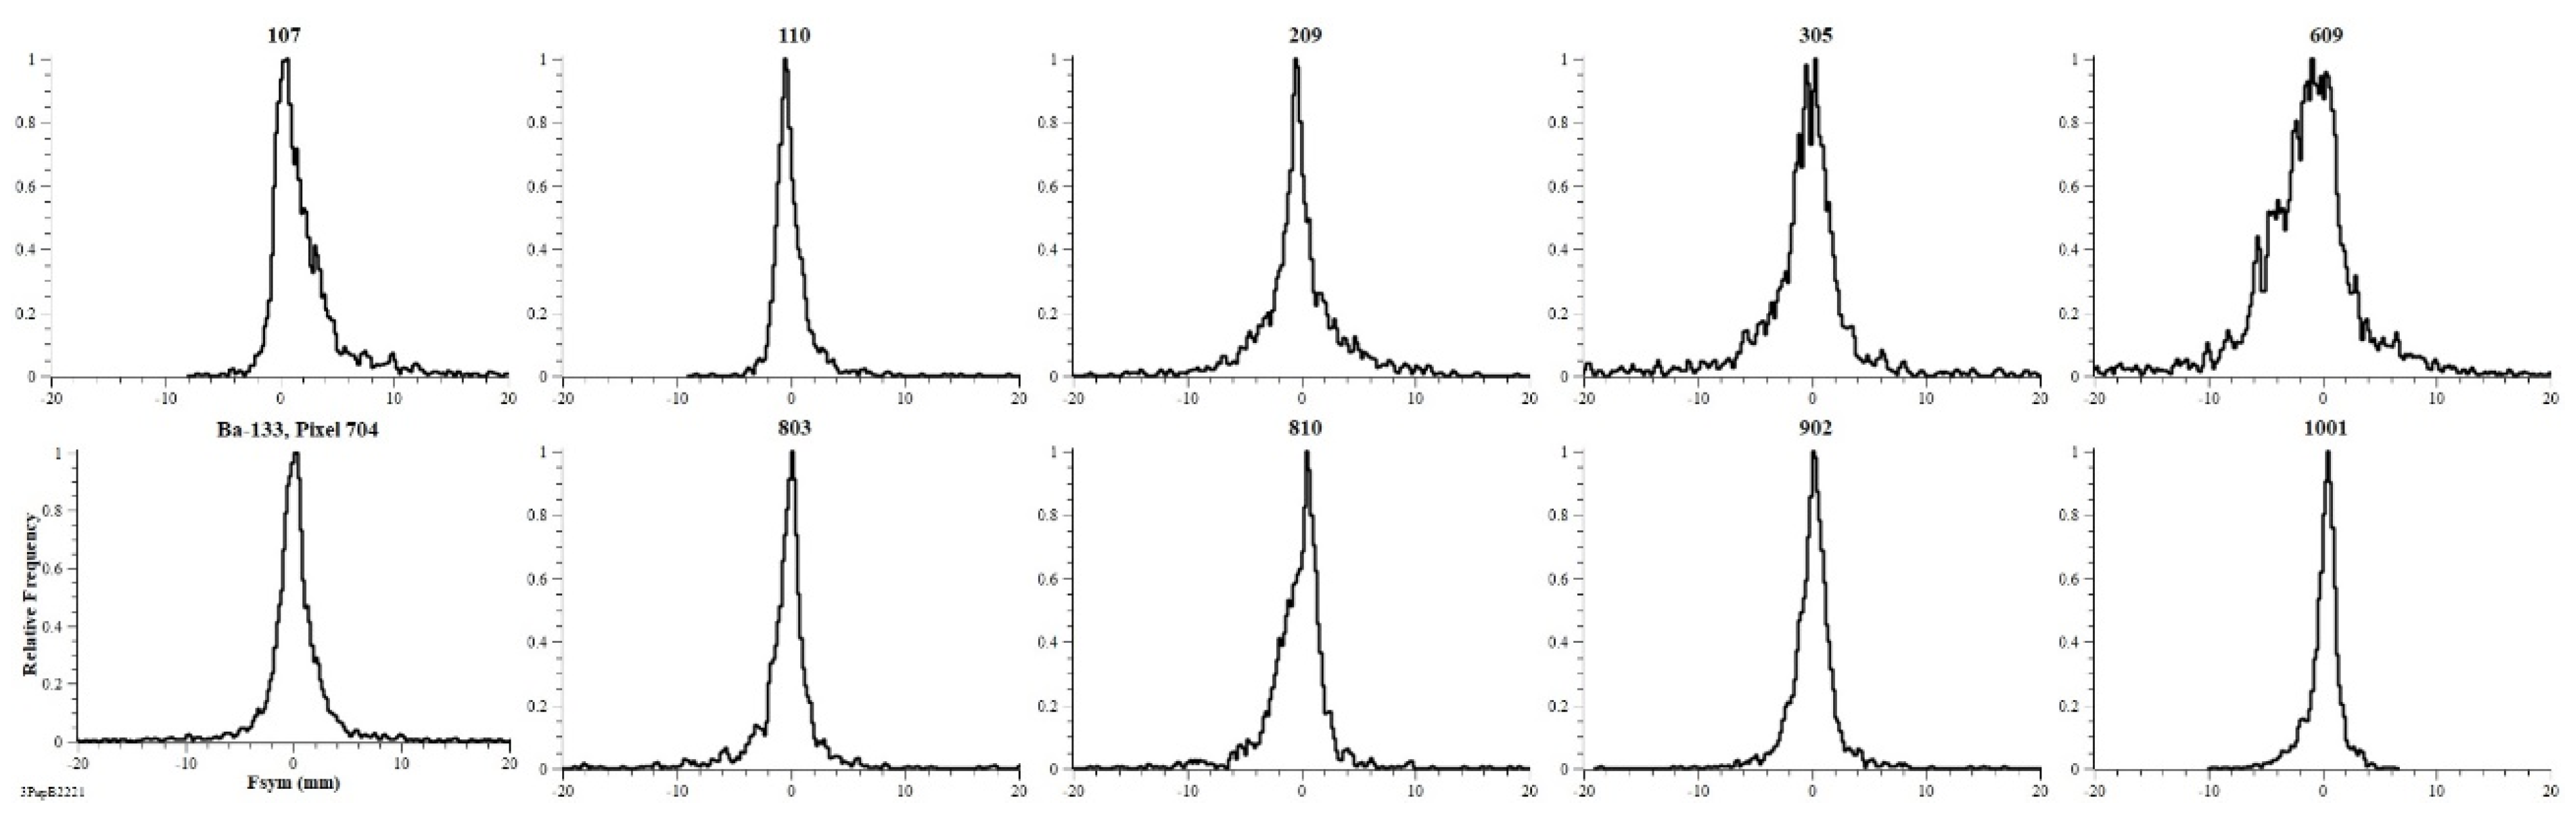
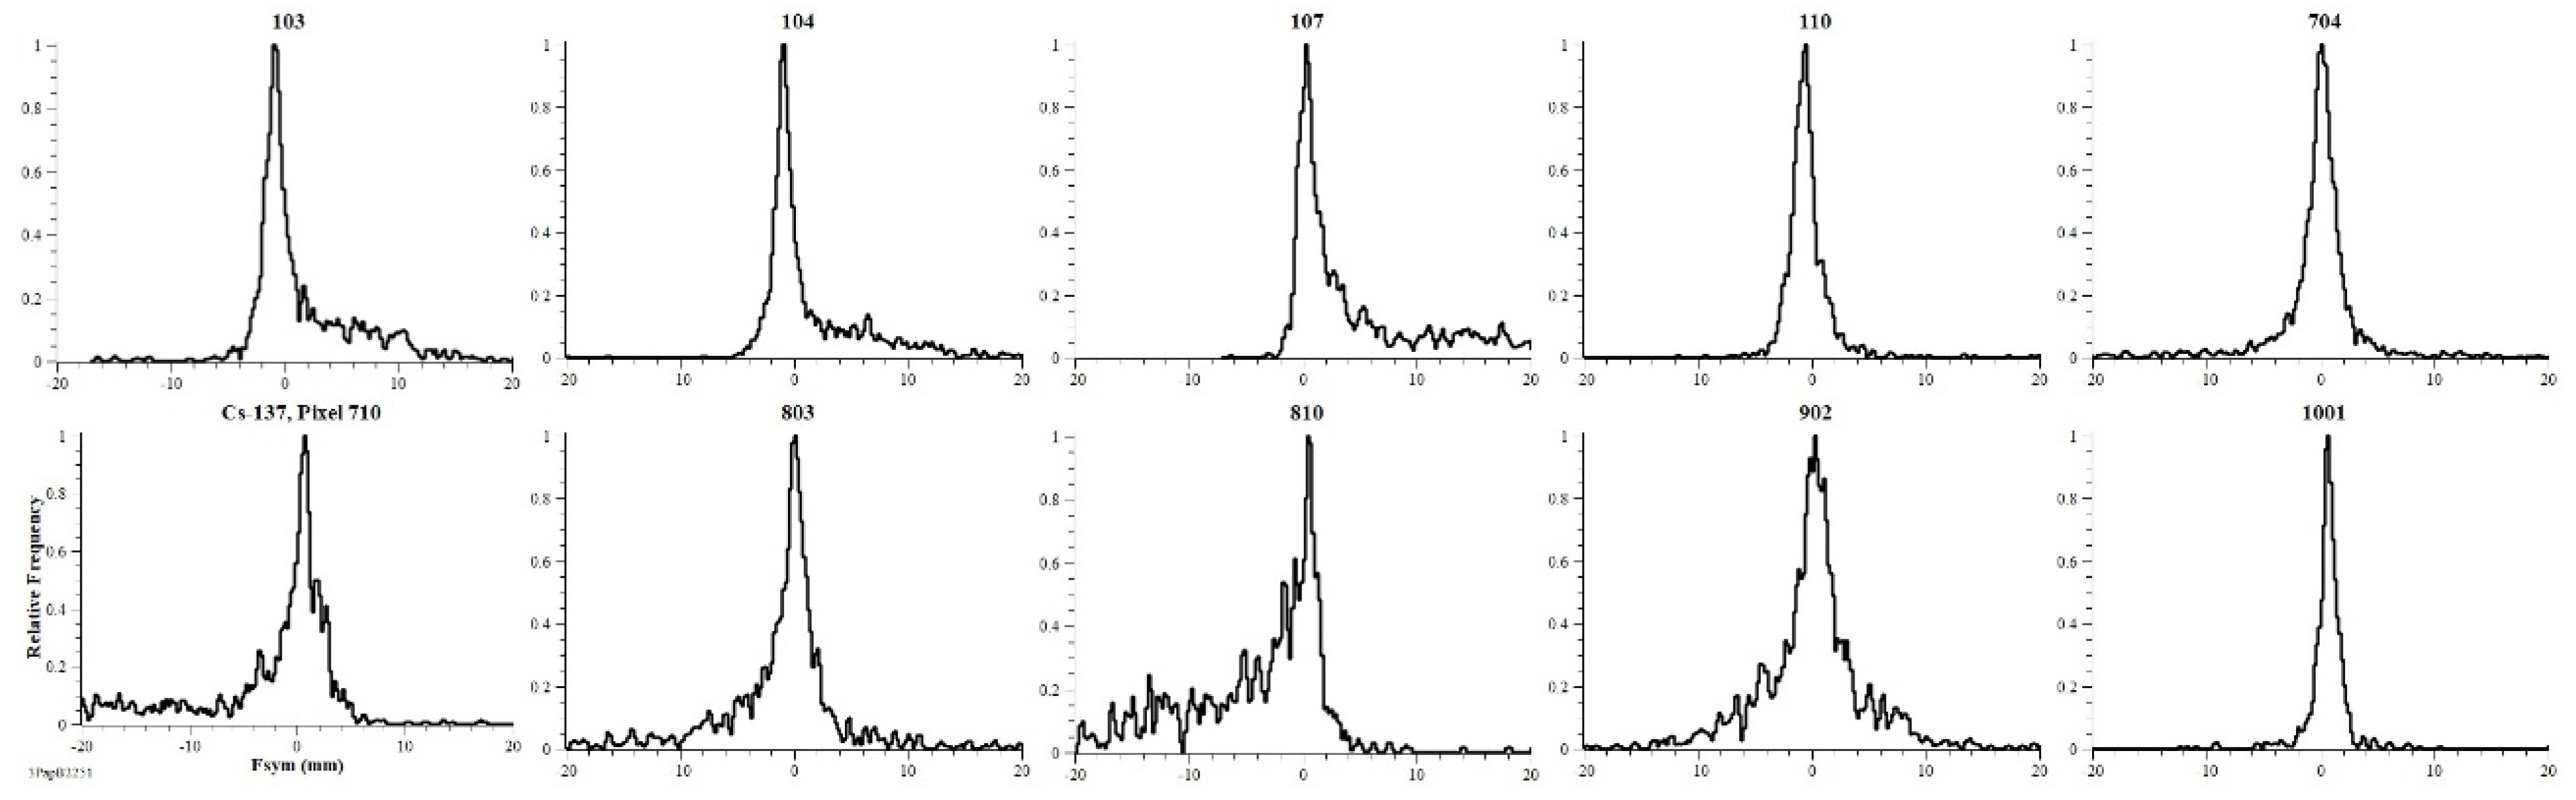
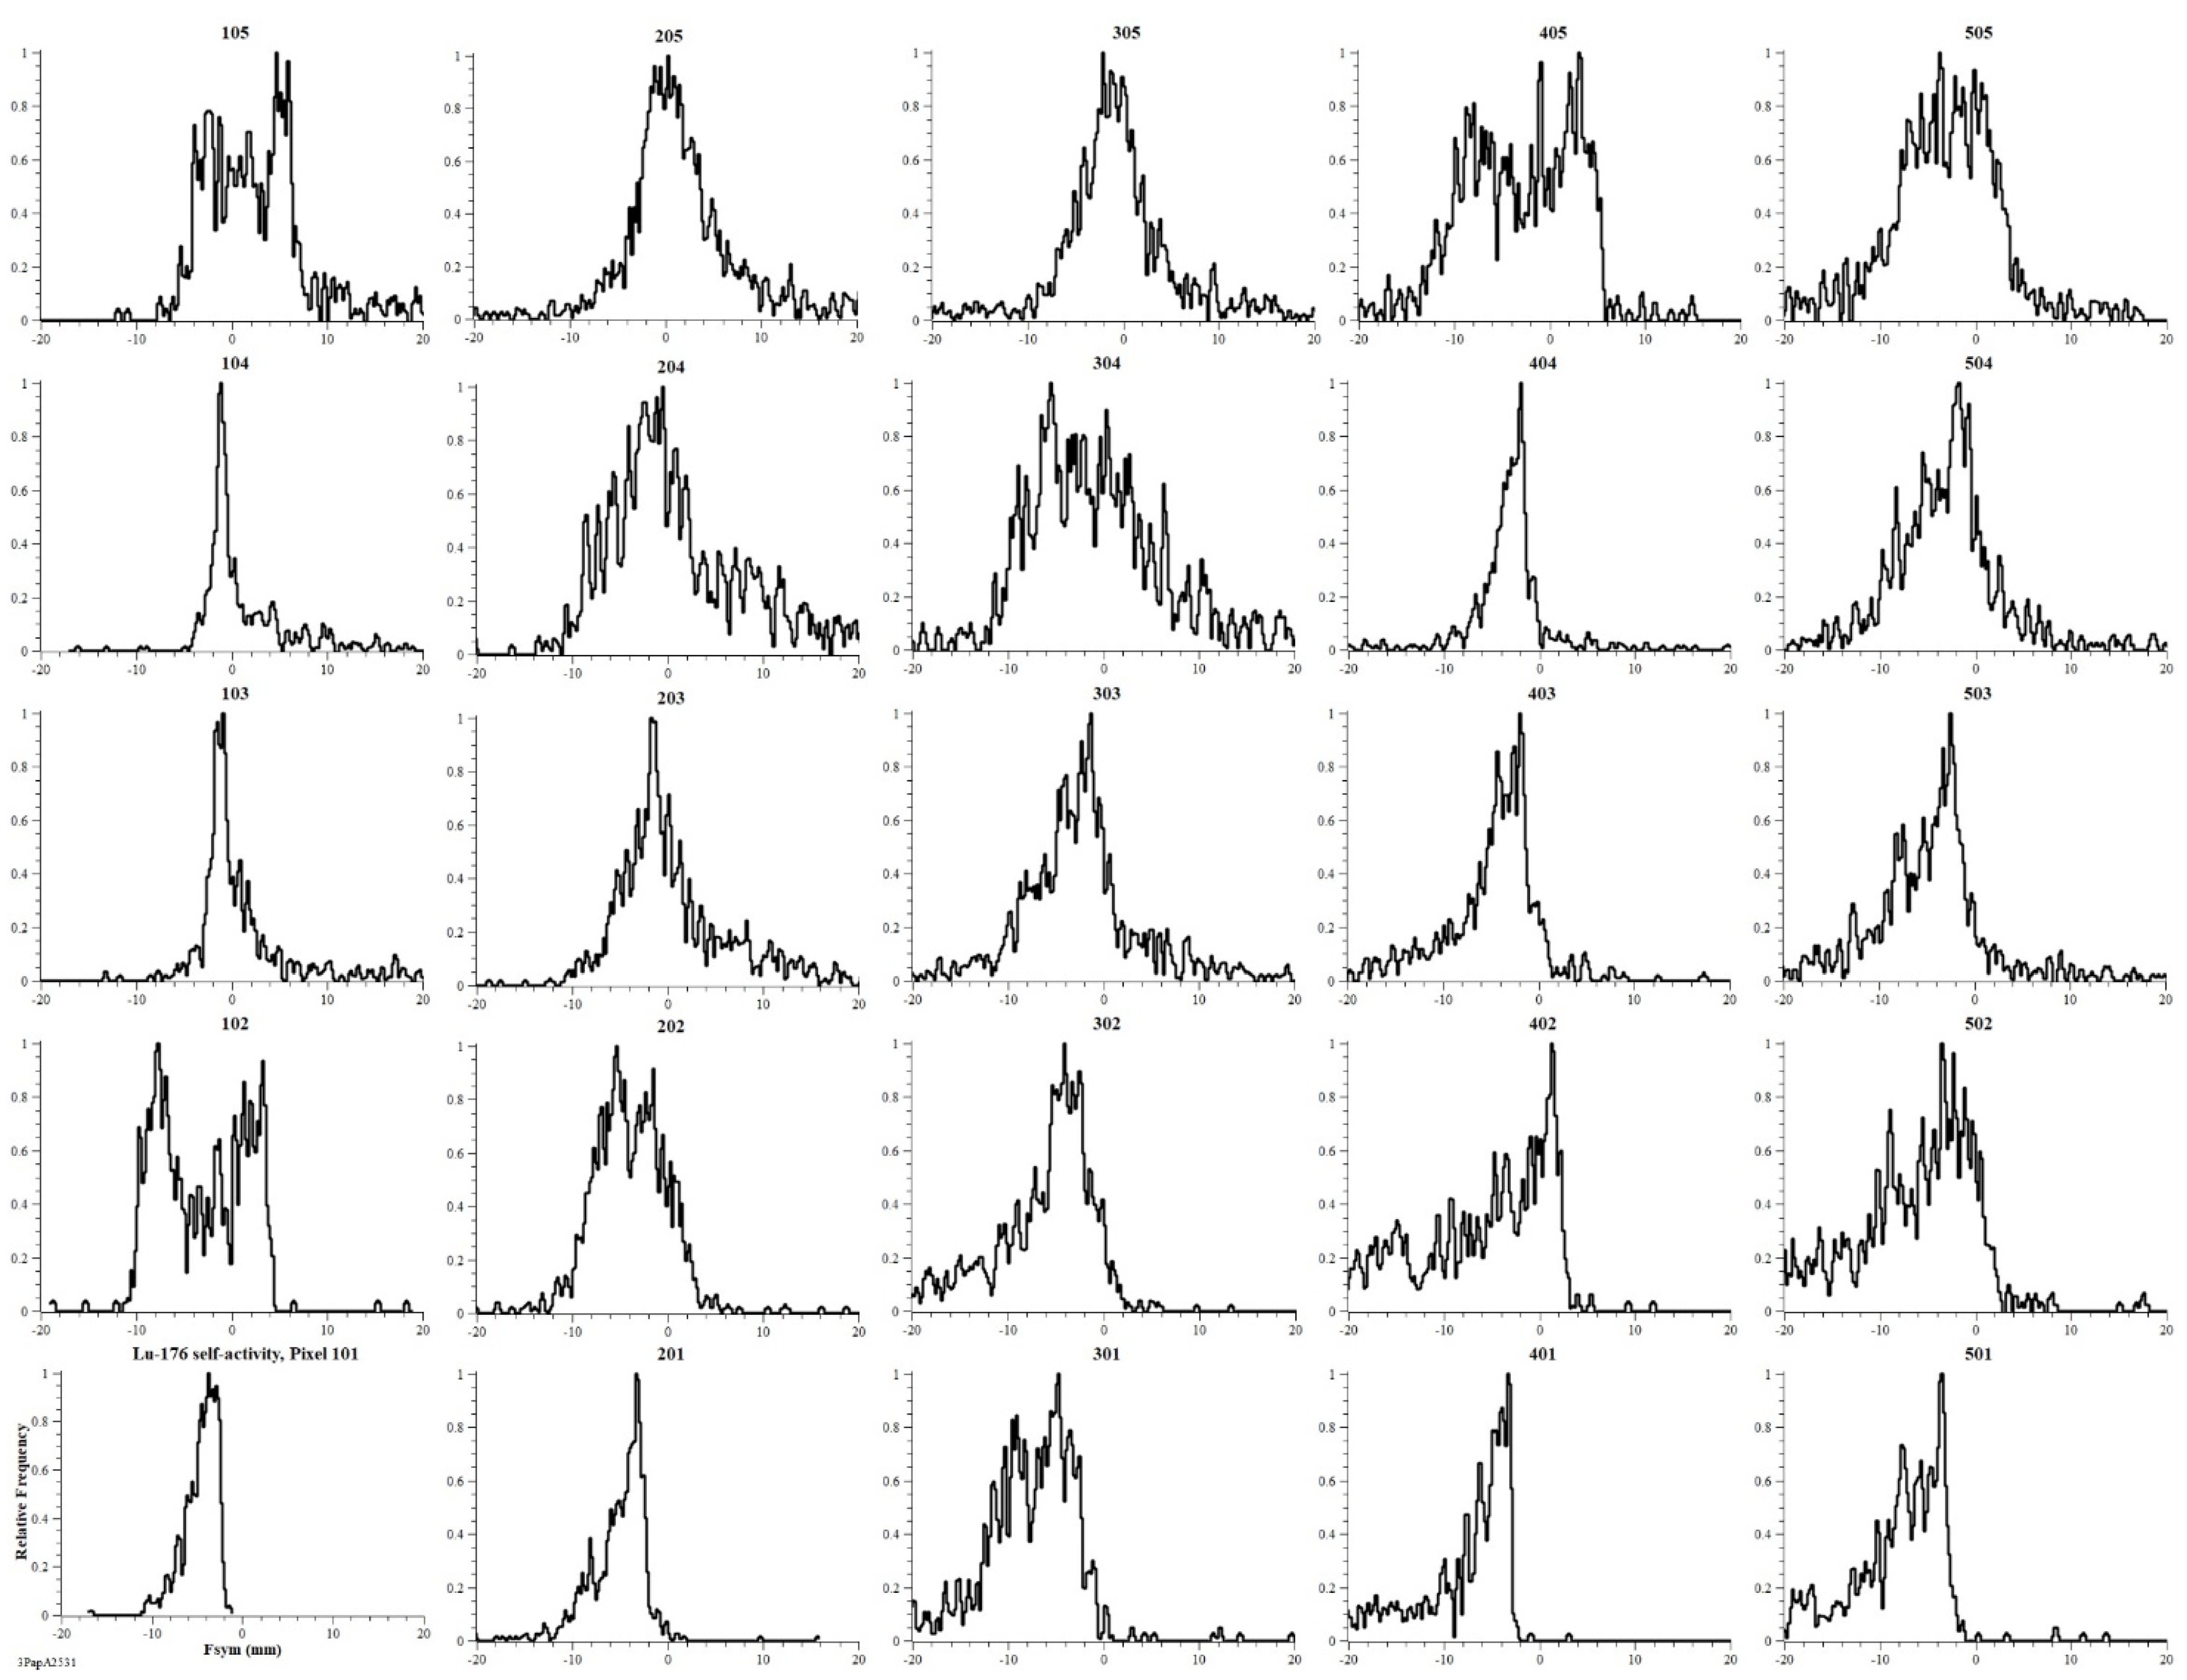
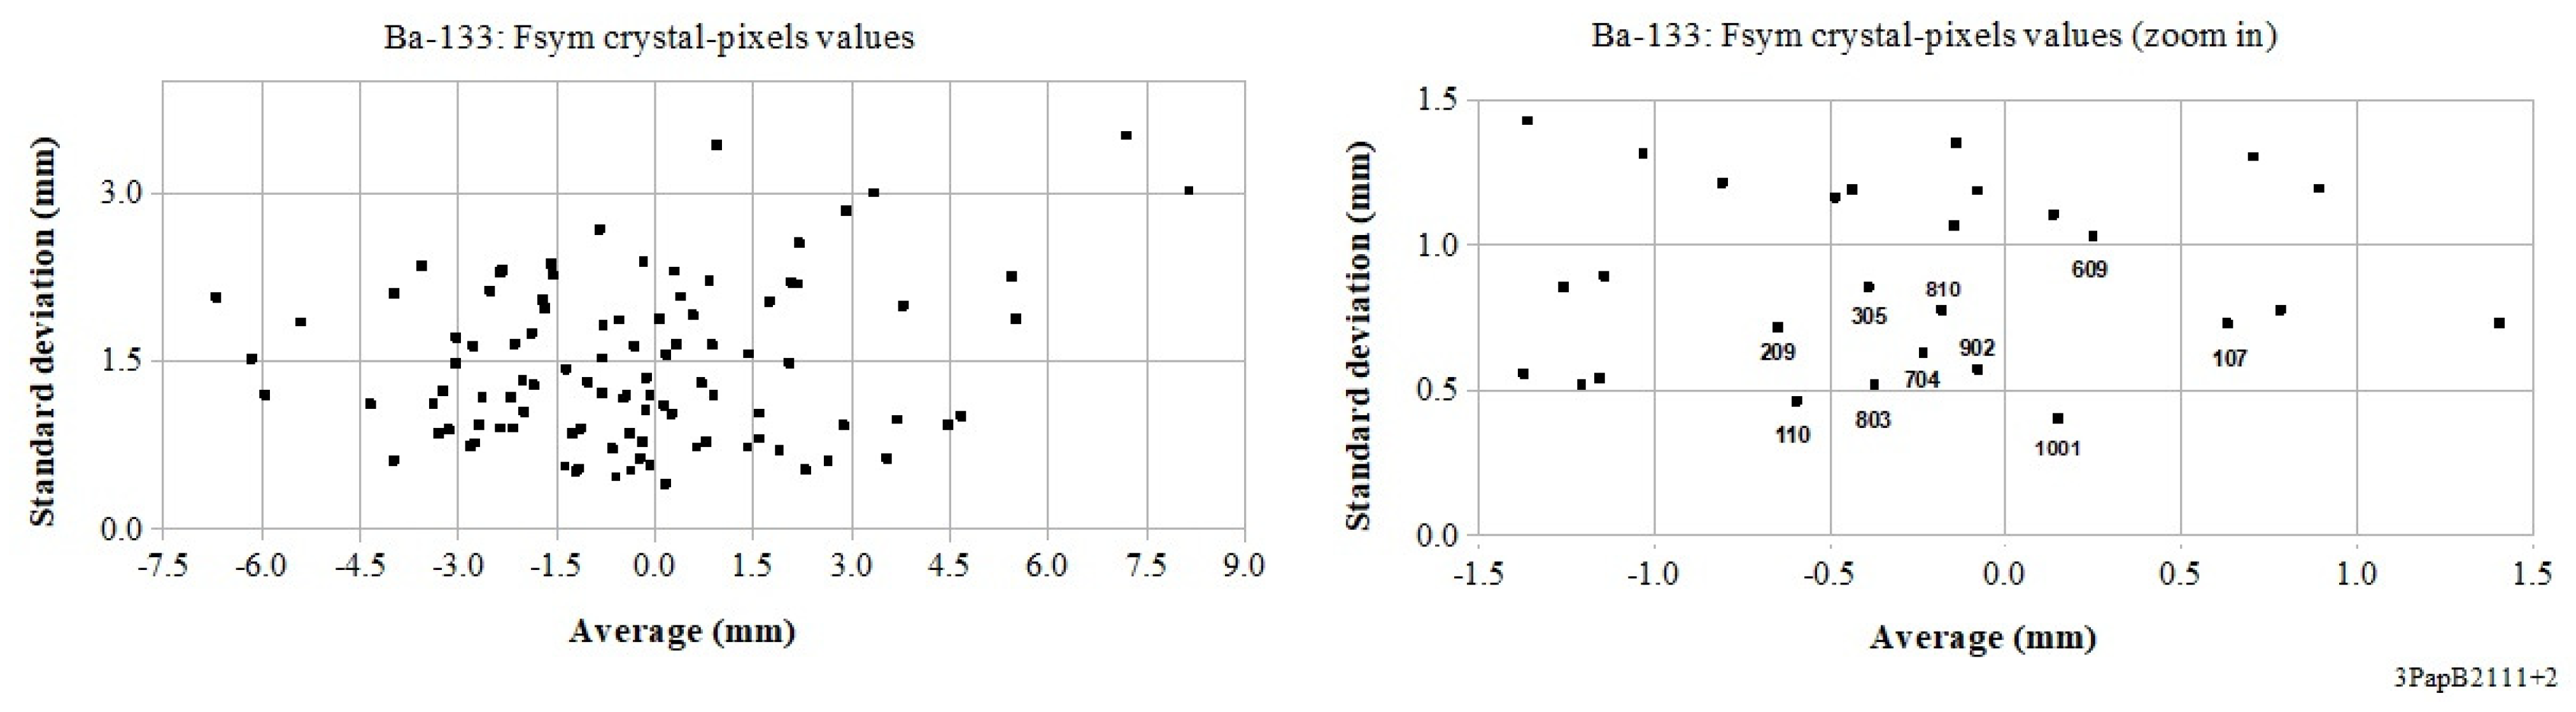
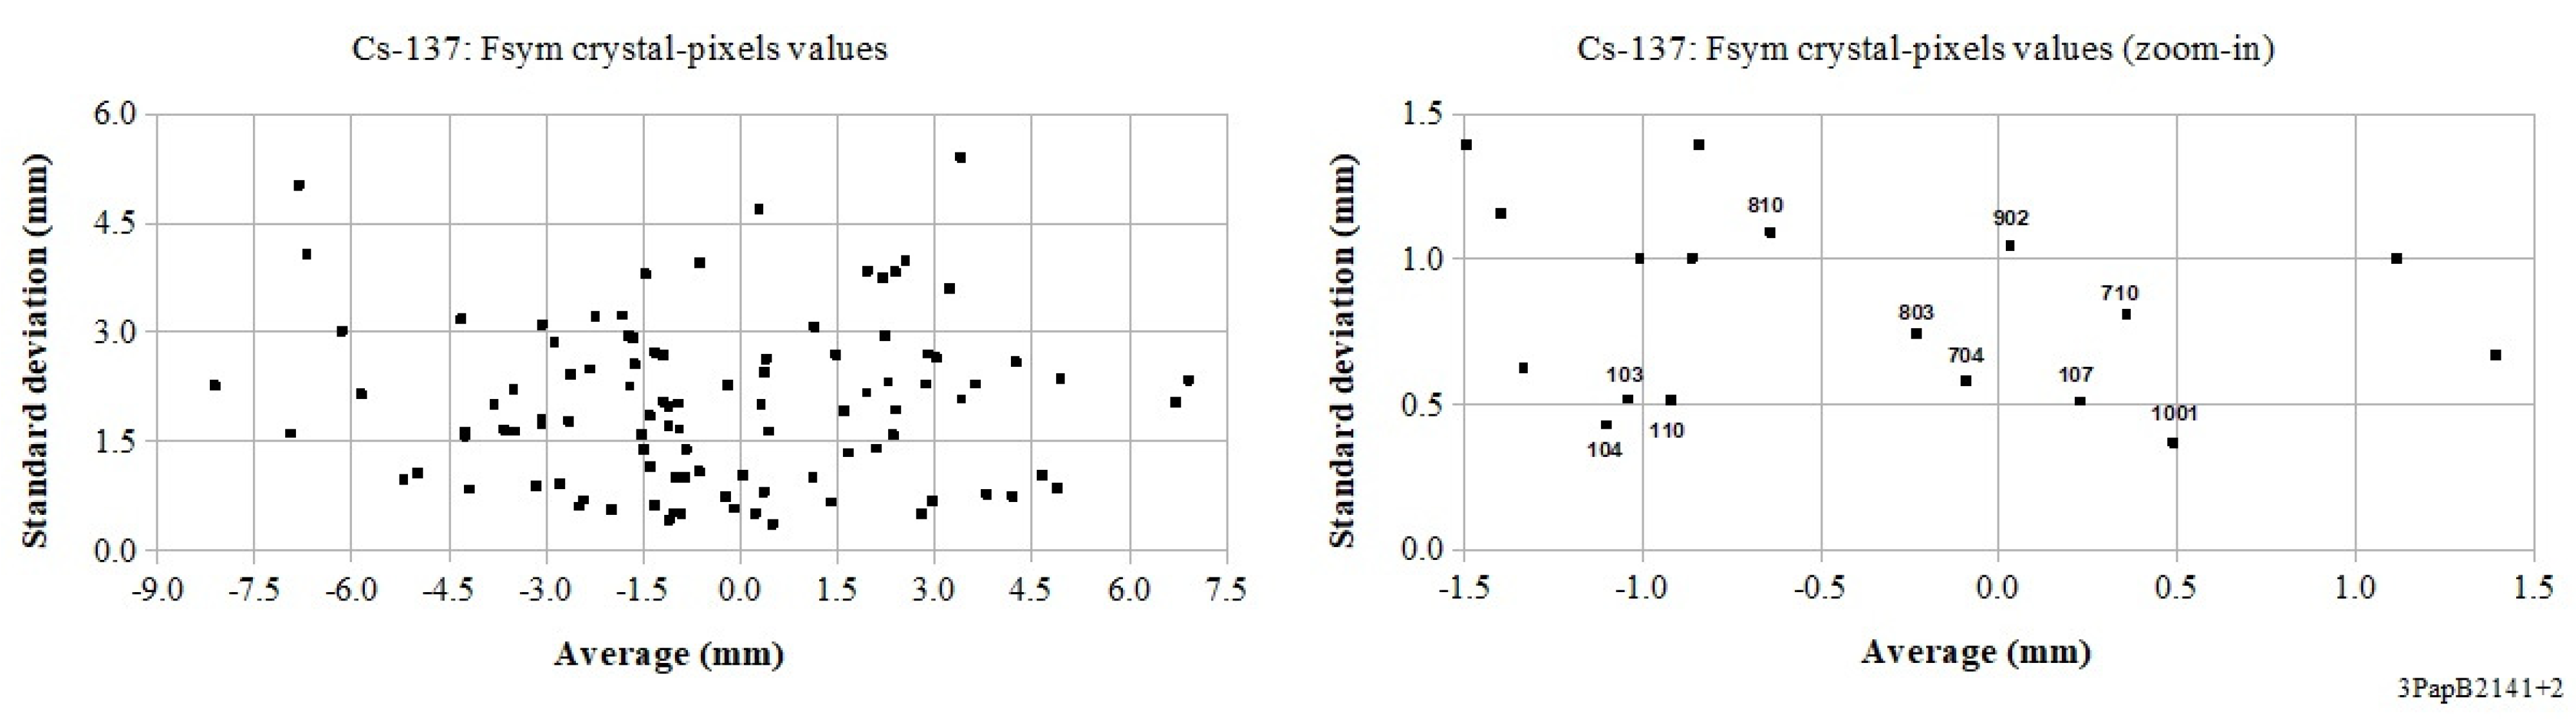
3.3.1. Fsym Distributions from Co-57, Ba-133, Cs-133, and Lu-176

Figure A8, Figure A9, Figure A10 and Figure A11 show, for the first quarter of the crystal-array, the Fsym distributions from the Co-57, Ba-133, Cs-137, and Lu-176 self-activity data-takings.

3.3.2. Comments

Figure A1 and Figure A8 report, respectively, examples of pulse-height Qnet and charge-symmetry Fsym spectra under Co-57 point-source irradiation. Both the plots refer to the first quarter of the crystal-array that includes the data of pixels characterized by RR ≤ 5 and CC ≤ 5. Among these pixels, 301, 304, and 403 were included in the list of the decuple of selected pixels for Qnet, and the 402 for Fsym.
On the whole, a few pixels show Fsym distributions with two peaks, like that of pixel 408 from Ba-133 data (plot not shown). From the pulse height point of view, it can be shown that the Fsym left peak is produced in a prevailing way by the low net-charge events, below 15 ch.u. (plot not shown), while the rest of Fsym spectrum is from the remainder of events. This may reasonably indicate a type of defect occurring if the array’s top face shows bad pixel-alignments, like in the case of unsatisfactory polishing. In fact, due to the low values of the mean free path in (Lu0.7Y0.3)AP for the Ba-133 emissions around 81 keV (about 0.3 mm), as well as for the others low-energy radiation, the defect may consist of light photons escaping from the top of the array.
The defect may be responsible for the scintillation light-photons escaping from the crystal-array, which is demonstrated by the lack of events in the X-direction near the vertex of cloud in the bottom-left of the scatter-plot FWTMy vs. FWTMy related to such a pixel 408 (plot not shown). Statistics on Fsym crystal-pixel values of the array are shown in Table 3.
Figure A12 and Figure A13 summarize the Fsym crystal-pixel results of the array from all the data-takings. The statistics are presented as histograms built by using bin-size values such that five-cluster plots are produced with the central cluster zero-centered. Co-57 and Ba-133 results showing one or two set-apart highest pixel-value(s), respectively, were grouped into six clusters, where the sixth one is populated by one or two cases only.
Figure 6 and Figure 7 display the Fsym spectra, calculated for all the data-takings, from the events clustered according to the respective binning of histograms of Figure A12 and Figure A13.
Figure 8 and Figure 9 illustrate the maps of crystal-pixel Fsym clusters in the array per data-taking. As one may observe, the 2-D charge-distributions are quite similar with respect to each other, but a noticeable density of high values of cluster numbers (see the top rows of figures) has to be brought to the reader’s attention.

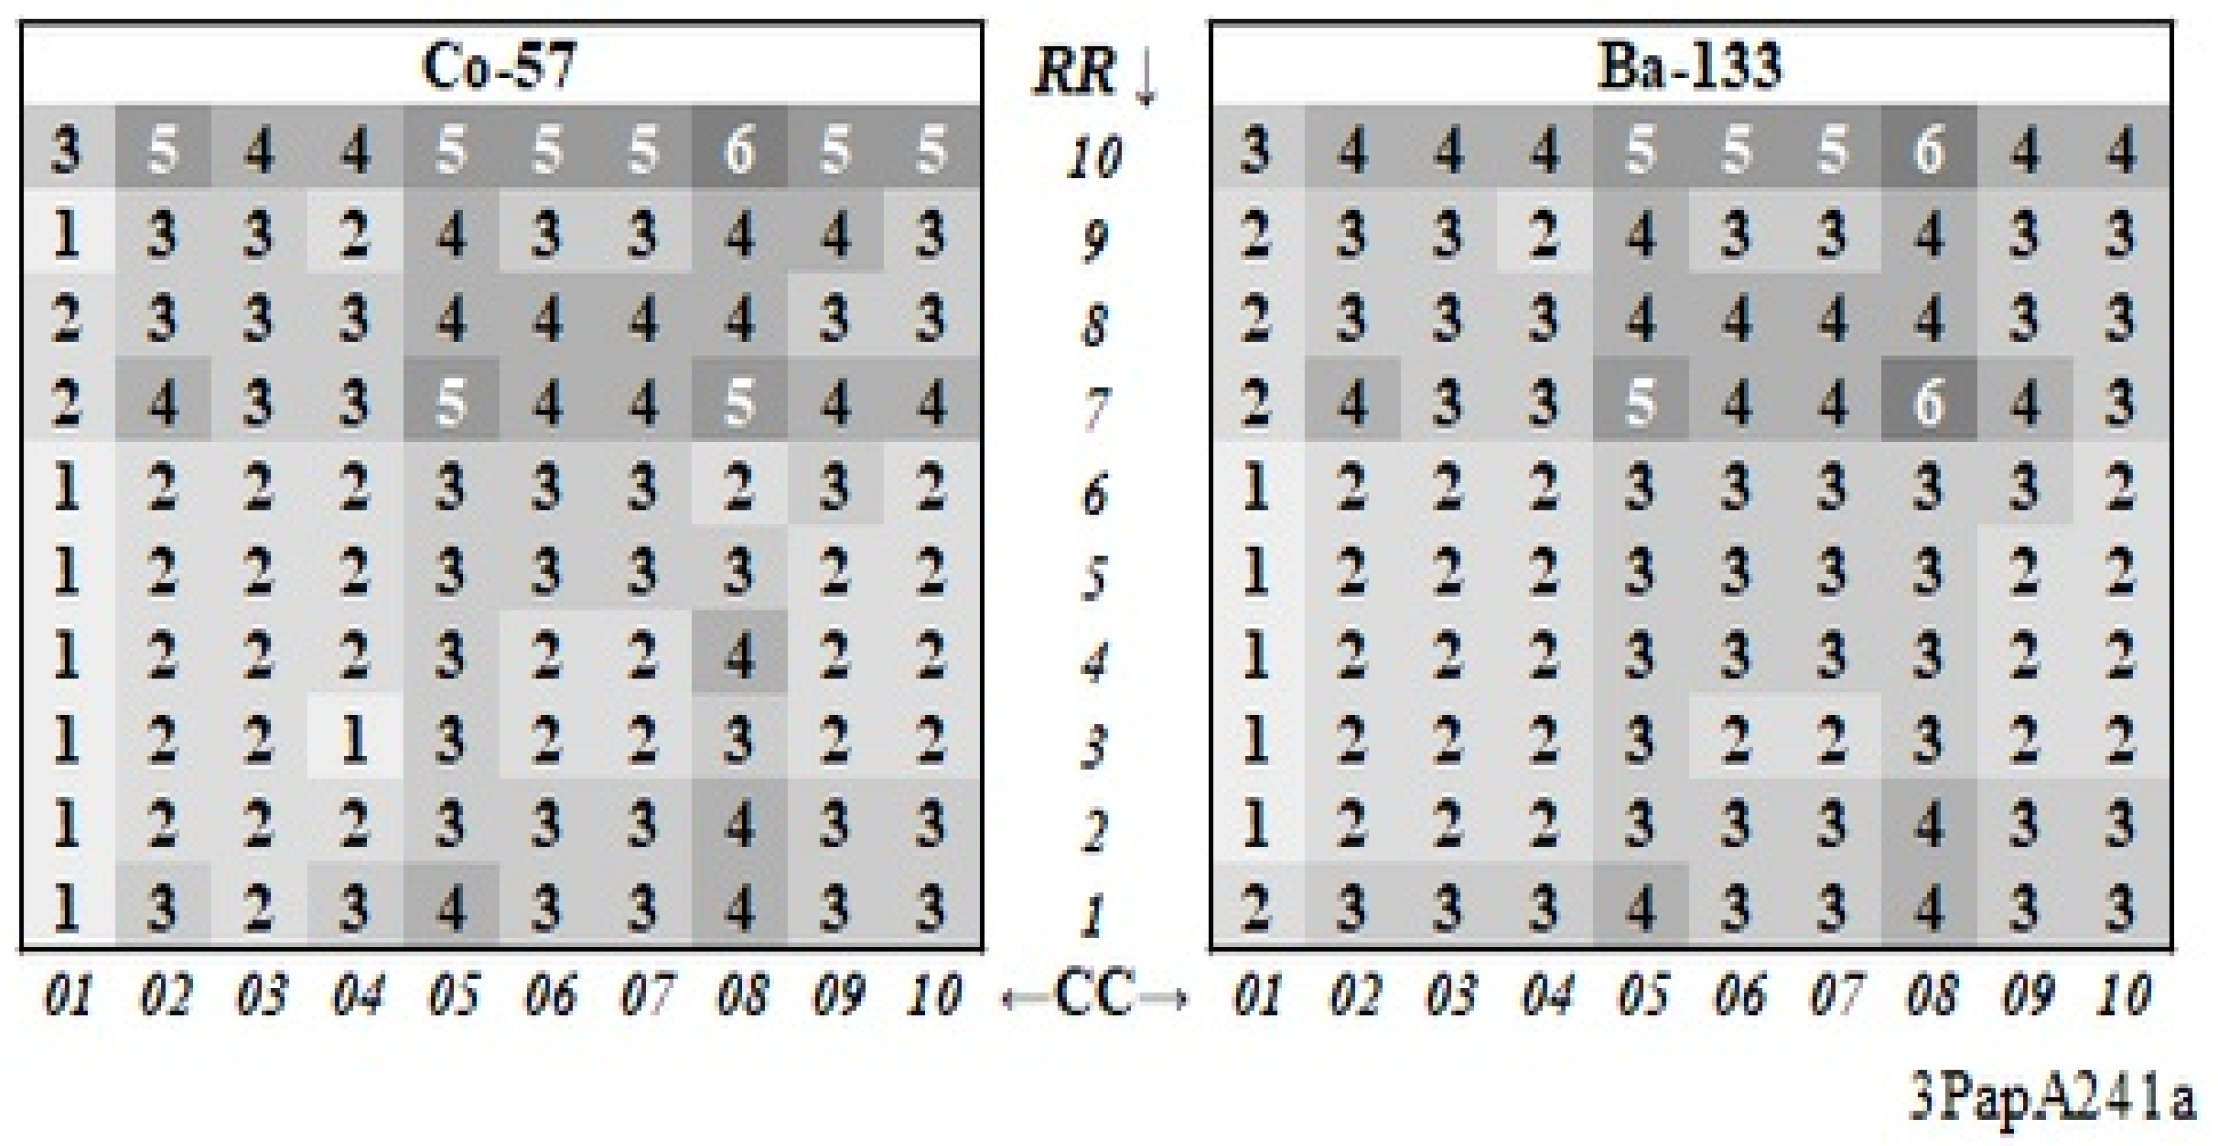
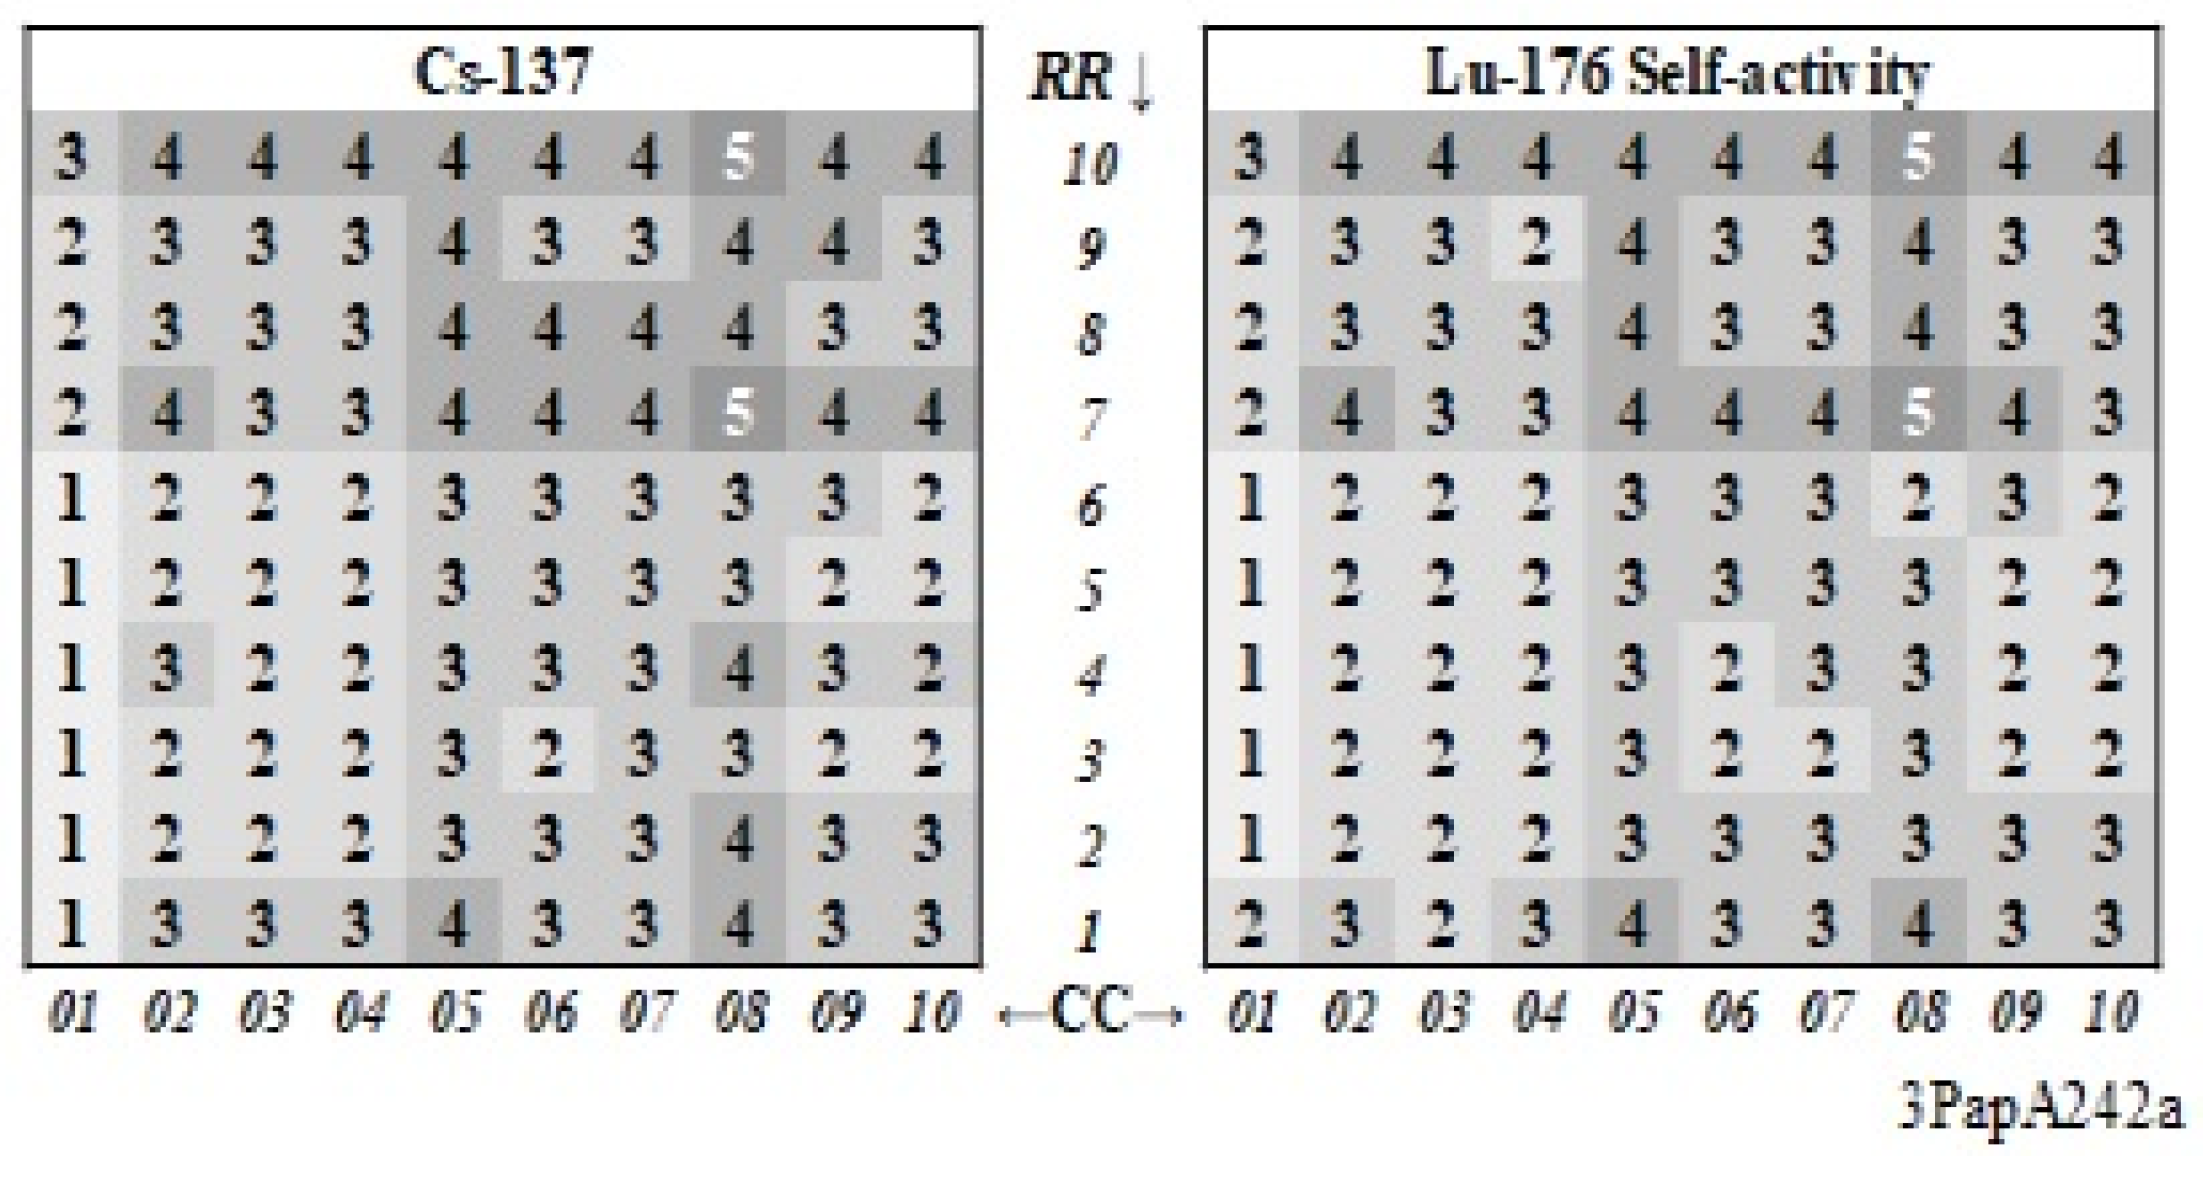
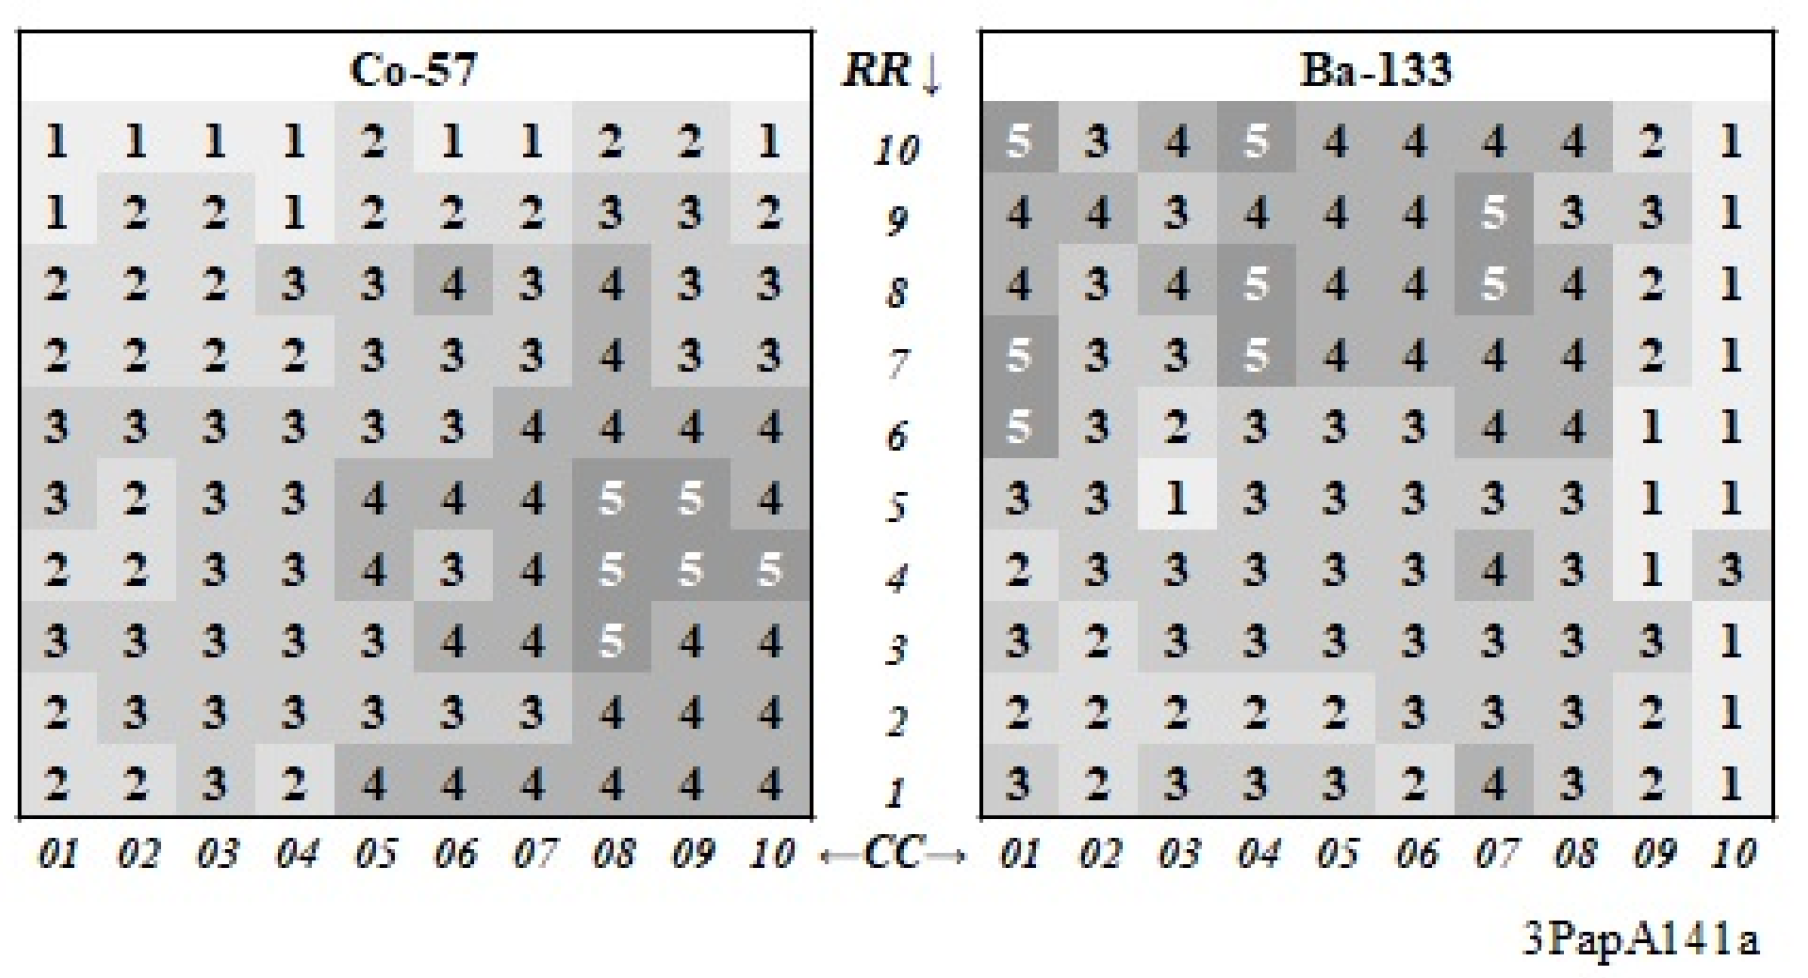
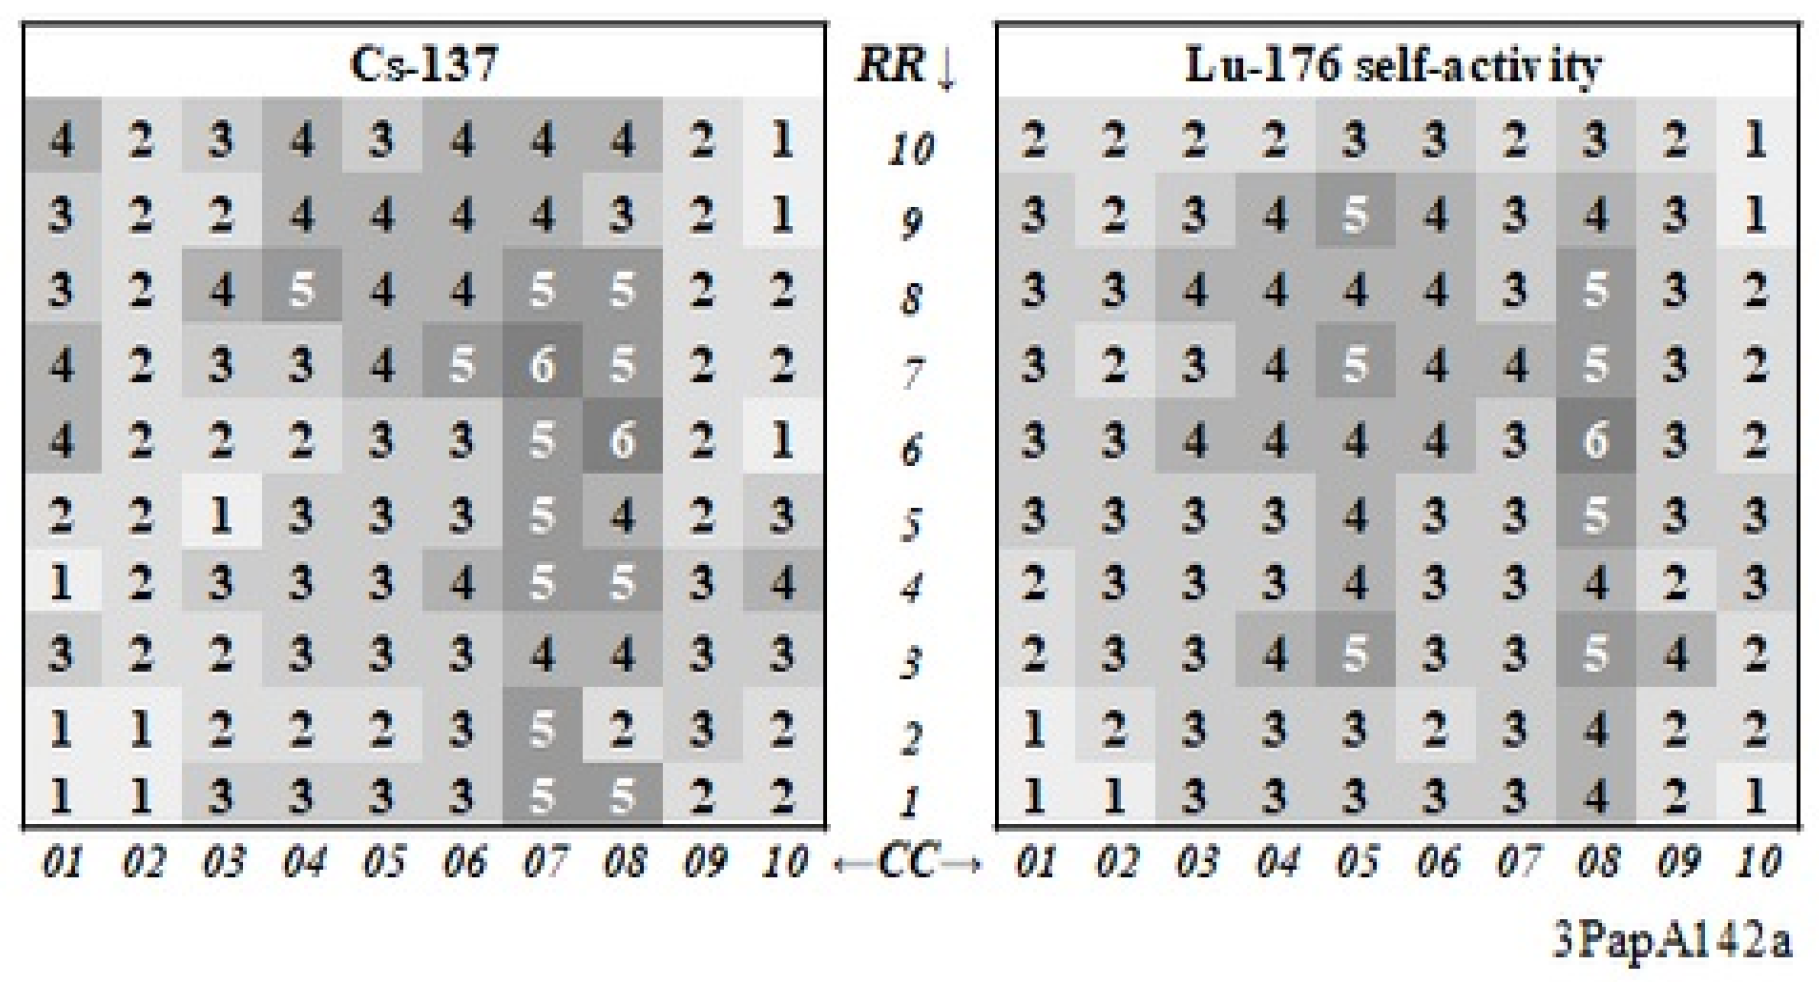
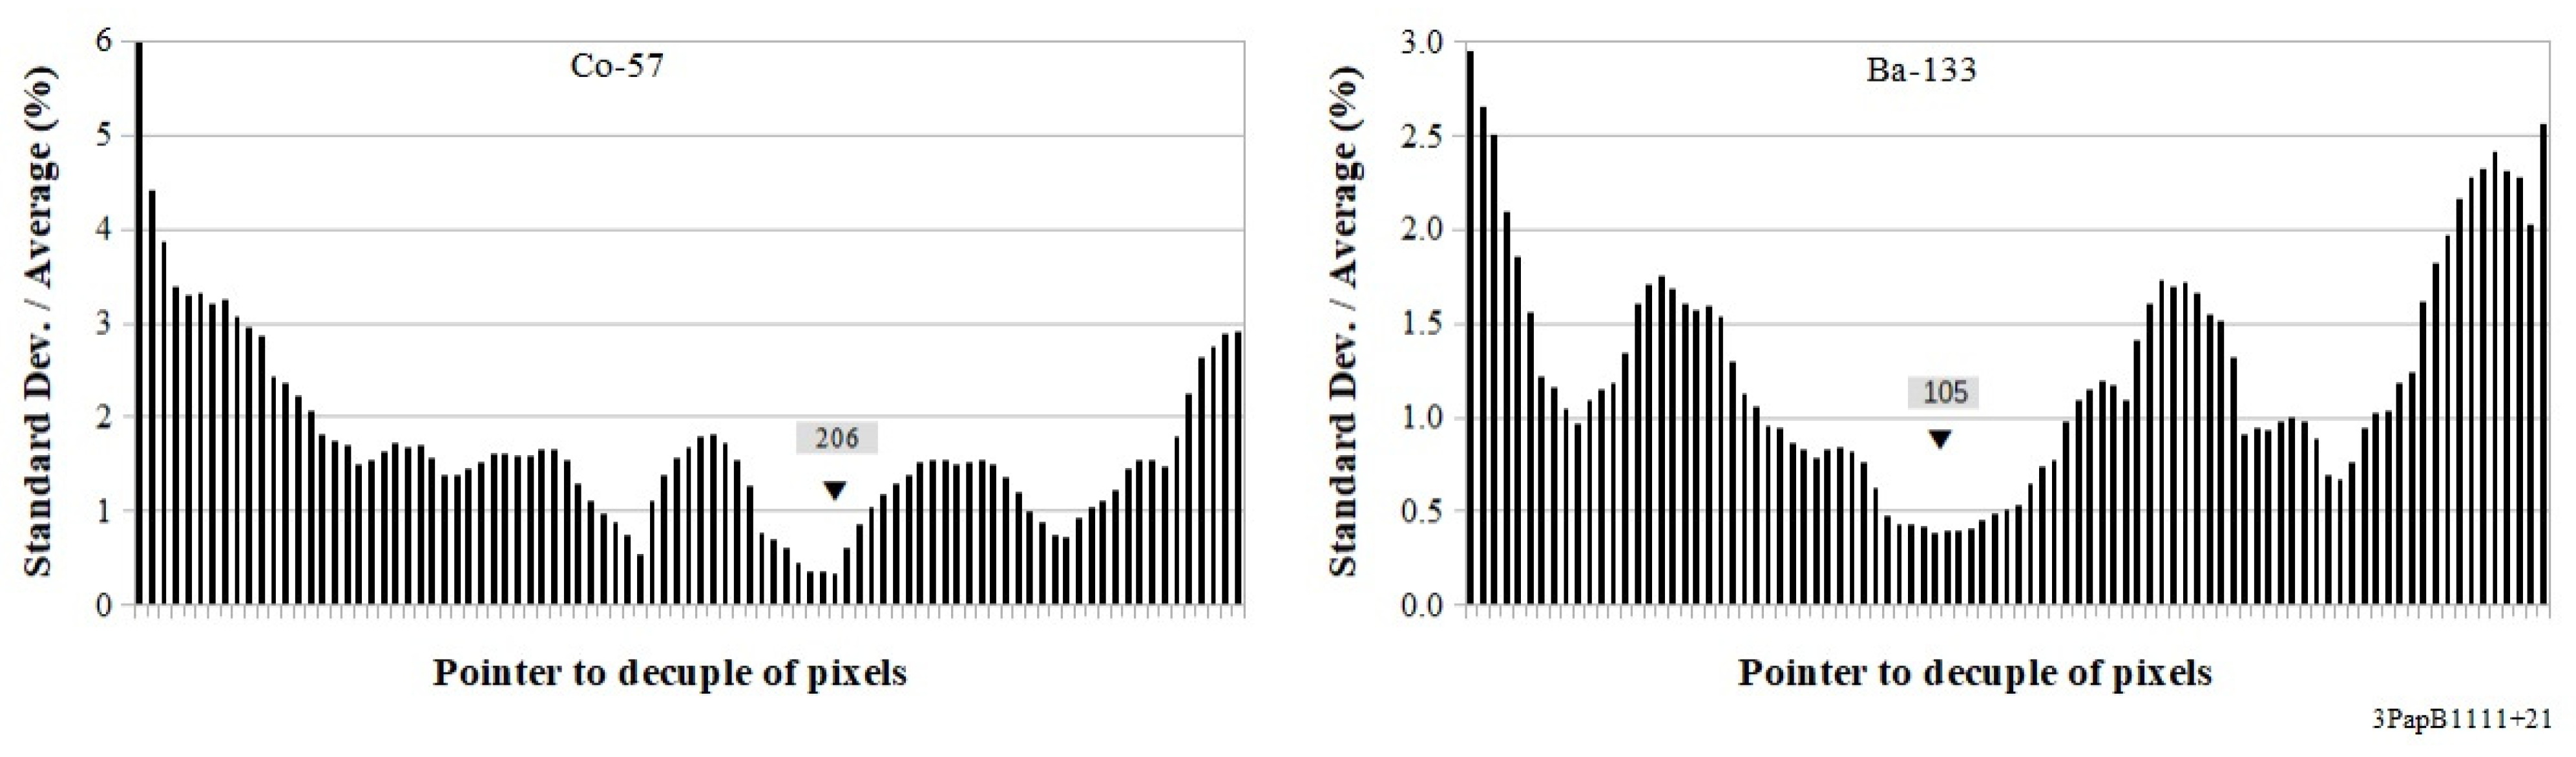
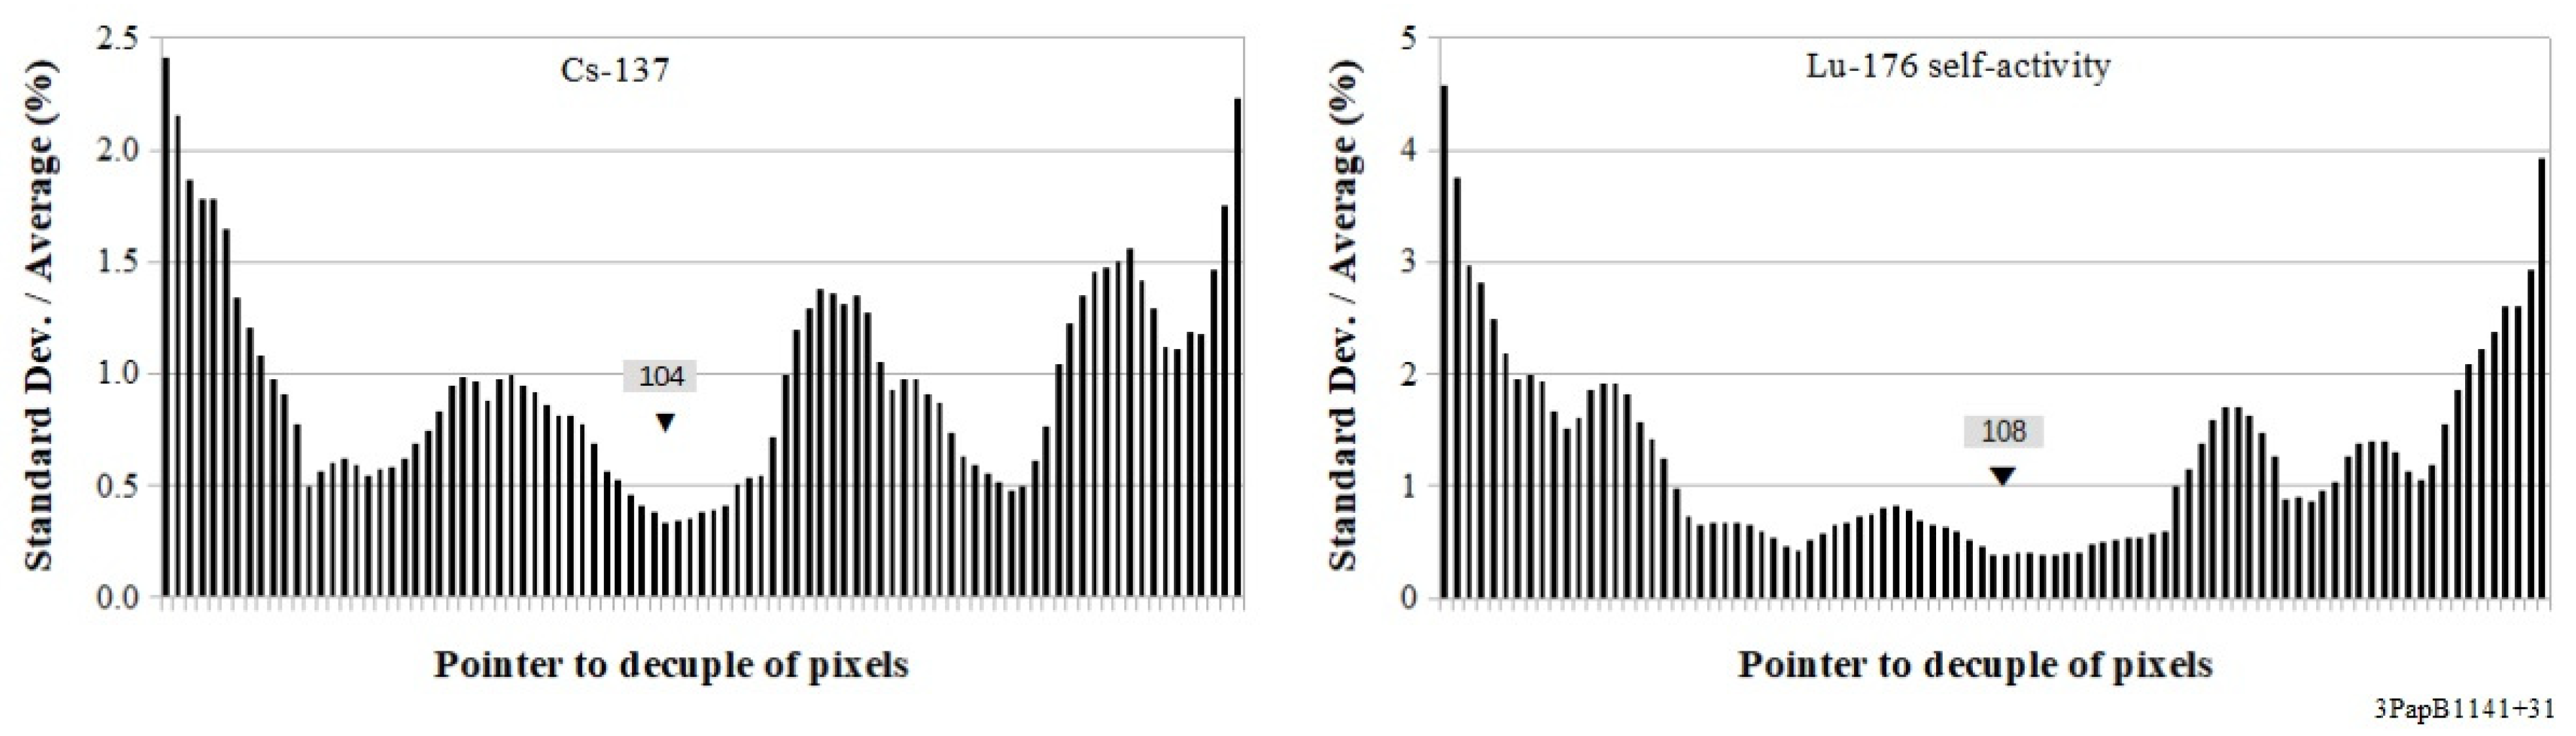
3.4. Ten-Pixels Subsets Selection

The plots of Figure A14, Figure A15, Figure A16 and Figure A17 show the crystal-pixel values of the standard deviation of Fsym, as a function of the Fsym average values obtained from Co-57, or Ba-133, or Cs-137, or Lu-176 self-activity data, respectively.
The 100-point plots in the left frame, corresponding to each one of the 10 × 10 crystal-pixels of the array, show a lower profile, recalling the shape of an upside-down open umbrella, where the points closer to the origin representing the pixels with more symmetrical distributions. The respective plots on the right frame show a zoom-in of the central regions with the RRCC codes of the decuple of crystal-pixels nearer to the origins.
The relevant global dispersion of results has suggested searching for a small set of sample pixels showing the most similar properties of charge spread symmetry to be localized around the origin. Taking into account the available statistics of around 2500 events per crystal-pixel, a decuple of pixels was assumed to be statistically significant. The selection criterion for identifying the decuple is really two-fold because it must refer, separately, to the values of pulse-height or to charge-spread symmetry, which are independent quantities. Furthermore, the decuples of pixels for each data-taking are required due to different mean-free-path of characteristic emissions, as well as to the irradiation set-ups. The decuples were chosen by using the algorithm hereafter described. The list of 100 Qnet average values per crystal-pixel arranged in ascending order was considered. The number of possible choices of the following decuples along the entire set of 100 elements is 91. The values of an indicator, defined as the ratio of standard deviation to the average value, were calculated for each one of 91 decuples and reported in histograms. The subset achieving the minimum value of the indicator was wanted.
Figure A18 and Figure A19 show the histograms, regarding the pulse-height responses from all data-takings, used for decuples selection. Table 4 shows the decuples of crystal-pixels (referred to by the RRCC notation) having, in the left columns, the most similar net-charge Qnet average values, and, in the right columns, the best average values of Fsym per data-taking.
As one can above observe, the selection criteria are really specific for the two independent physical quantities Qnet (Table 4, left) and Fsym (Table 4, right).
The pulse-height responses of the decuples of pixels are compared, per data-taking, to the results of the entire array. It is worth noting that no supposed property of crystal-pixels, like maximum light output or ideal symmetry of light distributions, was assumed for decuples selections. Consequently, such selected pixels seem easy to be manufactured.
The pulse-height responses are compared in Figure 10 and Figure 11 for Co-57, Ba-133, Cs-137, and Lu-176 self-activity data, respectively.
On the whole, compared to a lower threshold set at about 20 ch.u., all spectra show small relative differences in the regions above that threshold. In the lower-energy regions, the selected decuples of pixels show maximum peaks located systematically at lower energies with respect to all pixels. It is worth remarking that, from Figure 10 left to Figure 11 right, the Qnet scales were progressively increased for better clarity. The inversion in the relative weight of the two peaks, more visible for Co-57 (Figure 10 left), needs further investigations to be explained.
In order to show how the selection criterion works, the Fsym spectra picked out are reported in Figure 12, Figure 13, Figure 14 and Figure 15. Spectra are shown, from top-left to bottom-right, in ascending order of crystal-pixel RRCC. The selection criterion is based on calculations of Euclidian distances from the origin of the points representing the pixels in the plane (Fsym average, Fsym standard deviation) (see Figure A14).
As a comment on the Fsym selected spectra, one may observe that the lower the number of crystal-pixels the better the symmetry, the higher the value of mean free path for the gamma-rays of the data-taking. This seems to indicate a higher number of pixel coating defects in the closeness of the light output face. The case of Lu-176 self-activity has shown behavior like that of Cs-137 data.

4. Conclusions

Comprehensive results of experimental characterizations have been presented regarding the response of a (Lu0.7Y0.3)AP:Ce scintillation array coupled to a PSPMT with single-event charge readout electronics. The assembly has been studied under Co-57, or Ba-133, or Cs-137 irradiation or with Lu-176 self-activity only.
Pulse-height and 2-D charge-distributions symmetry responses from individual crystal-pixels of at least half crystal-array have been presented. Results of charge-distributions symmetry studies regarded both FWTMxy, and Fsym parameters for locating the pixels showing better closeness to the ideal symmetry.
The charge-symmetry characterization selected only a minority of crystal-pixels that would have shown acceptable operation. Thus, in order to study the behavior of a crystal-array completely made of well-working pixels, sub-sets of pixels have been picked out assuring enough statistics. In particular, eight decuples of pixels have been picked out, four for each parameter (pulse-height and charge-symmetry).
Results from the events belonging to the decuples of pixels will be described in forthcoming work. In particular, energy and imaging responses will be presented therein showing some cases of sub-sets of events filtered by charge-spread symmetry. Analyses will be presented by using both the cumulative and the differential logic for events clustering. The first grouping logic is more similar to the usual technique based on energy windowing only, and the second one will show the improvement achievable by filtering the events having better symmetry of charge spread.

Author Contributions

Conceptualization, R.S.; Data curation, M.P.; Investigation, R.P. (Rosanna Pellegrini) and R.P. (Roberto Pani). All authors have read and agreed to the published version of the manuscript.

Funding

This research received no external funding.

Data Availability Statement

Data sharing not applicable.

Conflicts of Interest

The authors declare no conflict of interest.

Appendix A. Additional Experimental Materials

Figure A1. Co-57 pulse-height spectra per crystal-pixel for the first quarter of the array which includes the pixels with RR ≤ 5 and CC ≤ 5. The common axes and plot descriptions are only once in the bottom-left frame for better clarity. Spectra have undergone denoising smoothing, and were built by using 0.2 ch.u. binning. Frequency values were normalized, pixel by pixel, to the respective maximum value.
Instruments 05 00026 g0a1
Figure A2. Ba-133 pulse-height spectra per crystal-pixel for the third quarter of the array which includes the pixels with RR > 5 and CC ≤ 5. The common axes and plot descriptions are shown only once in the bottom-left frame for better clarity. Spectra have undergone denoising smoothing, and were built by using 0.75 ch.u. binning. Frequency values were normalized, pixel by pixel, to the respective maximum value.
Instruments 05 00026 g0a2
Figure A3. Cs-137 pulse-height spectra per crystal-pixel for the third quarter of the array which includes the pixels with RR > 5 and CC ≤ 5. The common axes and plot descriptions have been shown only once in the bottom-left frame for better clarity. Spectra have undergone denoising smoothing, and have been built by using 1.5 ch.u. binning. Frequency values have been normalized, pixel by pixel, to the respective maximum value.
Instruments 05 00026 g0a3
Figure A4. Lu-176 pulse-height spectra per crystal-pixel for the first quarter of the array which includes the pixels with RR ≤ 5 and CC ≤ 5. The common axes and plot descriptions are shown only once in the bottom-left frame for better clarity. Spectra have undergone denoising smoothing, and were built by using 1.5 ch.u. binning. Frequency values were normalized, pixel by pixel, to the respective maximum value.
Instruments 05 00026 g0a4
Figure A5. Histograms of average Qnet crystal-pixel values from Co-57 (left) or Ba-133 (right) data. Plots were drawn with 1.2- and 2.4-mm bins, respectively.
Instruments 05 00026 g0a5
Figure A6. Histograms of average Qnet crystal-pixel values from Cs-137 (left) or Lu-176 self-activity (right) data. Plots were drawn with 4,8- and 4.0-mm bins, respectively.
Instruments 05 00026 g0a6
Figure A7. FWTMy vs. FWTMx scatter-plots per pixel for the first quarter of crystal-array under Co-57 point-source irradiation. The first quarter includes the pixels with RR ≤ 5 and CC ≤ 5. The axes titles and the plots descriptions, suitable for all the frames of the figure, are reported only once in the bottom-left frame. The scatter-plots, obtained from single-events values, are reported together with the bisector of the semi-plane as a reference.
Instruments 05 00026 g0a7
Figure A8. Fsym spectra per pixel for the first quarter of crystal-array under Co-57 point-source irradiation. The first quarter includes the pixels with RR ≤ 5 and CC ≤ 5. The common axes and the plot descriptions are reported only once in the bottom-left frame. The spectra, obtained by building histograms from single-events Fsym values with 0.2 mm binning, have undergone smoothing for denoising data. The frequency values were normalized, pixel by pixel, to the respective maximum value.
Instruments 05 00026 g0a8
Figure A9. Fsym spectra per pixel for the first quarter of crystal-array under Ba-133 point-source irradiation. The first quarter includes the pixels with RR ≤ 5 and CC ≤ 5. The common axes and the plot descriptions are reported only once in the bottom-left frame. The spectra, obtained by building histograms from single-events Fsym values with 0.2 mm binning, have undergone smoothing for denoising data. The frequency values were normalized, pixel by pixel, to the respective maximum value.
Instruments 05 00026 g0a9
Figure A10. Fsym spectra per pixel for the first quarter of crystal-array under Cs-137 point-source irradiation. The first quarter includes the pixels with RR ≤ 5 and CC ≤ 5. The common axes and the plot descriptions are reported only once in the bottom-left frame. The spectra, obtained by building histograms from single-events Fsym values with 0.2 mm binning, have undergone smoothing for denoising data. The frequency values were normalized, pixel by pixel, to the respective maximum value.
Instruments 05 00026 g0a10
Figure A11. Fsym spectra per pixel for the first quarter of crystal-array from Lu-176 self-activity data-taking. The first quarter includes the pixels with RR ≤ 5 and CC ≤ 5. The common axes and plot descriptions are reported only once in the bottom-left frame. The spectra, obtained by building histograms from single-events Fsym values with 0.2 mm binning, have undergone smoothing for denoising data. The frequency values were normalized, pixel by pixel, to the respective maximum value.
Instruments 05 00026 g0a11
Figure A12. Histograms of average Fsym crystal-pixel values from Co-57 (left) and Ba-133 (right) data-takings. The plots were drawn with 4.0- and 2.8-mm bins, respectively.
Instruments 05 00026 g0a12
Figure A13. Histograms of average Fsym crystal-pixel values from Cs-137 (left) and Lu-176 self-activity (right) data-takings. The plots were drawn with 3.6- and 3.2-mm bins, respectively.
Instruments 05 00026 g0a13
Figure A14. Plot of standard deviation Vs. average of Fsym values (left) obtained for all the crystal-pixels of the 10 × 10 array under Co-57 irradiation. A relevant overall dispersion of results is shown, suggesting to search for a subset of pixels showing the most similar symmetry properties. Zoom-in (right) of the central-zone of the plot on the left, showing the decuple of pixels with the smaller charge-spread values around the origin. The selected decuple was, in RRCC ascending order, 107, 110, 402, 406, 409, 703, 704, 803, 804, and 1001 with distance-values from origin ranging from 0.45- to 1.01-mm.
Instruments 05 00026 g0a14
Figure A15. Plot of standard deviation Vs. average of Fsym values (left) obtained for all the crystal-pixels of the 10 × 10 array under Ba-133 irradiation. A relevant overall dispersion of results is shown, suggesting to search for a subset of pixels showing the most similar symmetry properties. Zoom-in (right) of the central-zone of the plot on the left, showing the decuple of pixels with the smaller charge-spread values around the origin. The selected decuple was, in RRCC ascending order, 107, 110, 209, 305, 609, 704, 803, 810, 902, and 1001 with distance-values from origin ranging from 0.40- to 1.03-mm.
Instruments 05 00026 g0a15
Figure A16. Plot of standard deviation Vs. average of Fsym values (left) obtained for all the crystal-pixels of the 10 × 10 array under Cs-137 irradiation. A relevant overall dispersion of results is shown, suggesting to search for a subset of pixels showing the most similar symmetry properties. Zoom-in (right) of the central-zone of the plot on the left, showing the decuple of pixels with the smaller charge-spread values around the origin. The selected decuple was, in RRCC ascending order, 103, 104, 107, 110, 704, 710, 803, 810, 902, and 1001 with distance-values from origin ranging from 0.37- to 1.09-mm.
Instruments 05 00026 g0a16
Figure A17. Plot of standard deviation Vs. average of Fsym values (left) obtained for all the crystal-pixels of the 10 × 10 array from Lu-176 self-activity data. A relevant overall dispersion of results is shown, suggesting to search for a subset of pixels showing the most similar symmetry properties. Zoom-in (right) of the central-zone of the plot on the left, showing the decuple of pixels with the smaller charge-spread values around the origin. The selected decuple was, in RRCC ascending order, 107, 110, 209, 210, 704, 710, 803, 810, 902, and 1001 with distance-values from origin ranging from 0.31- to 0,98-mm.
Instruments 05 00026 g0a17
Figure A18. Plots of standard deviation to average ratios calculated for the decuples of adjacent net-charge pixel-values chosen along the entire set of 10 × 10 array of crystal-pixels, ordered by descending values for Co-57 (left) and Ba-133 (right), respectively. The solid triangles show the pointers to the minimum values of the ratios corresponding to the decuple made by 206, 207, 301, 304, 403, 406, 604, 709, 710, 809 pixels for Co-57, and by 105, 204, 206, 309, 405, 501, 503, 606, 608, 801 ones for Ba-133. The pixels are referred to by the RRCC notation.
Instruments 05 00026 g0a18
Figure A19. Plots of standard deviation to average ratios calculated for the decuples of adjacent net-charge pixel-values chosen along the entire set of 10 × 10 array of crystal-pixels, ordered by descending values for Cs-137 (left) and Lu-176 (right), respectively. The solid triangles show the pointers to the minimum values of the ratios corresponding to the decuple made by 104, 301, 305, 403, 405, 504, 505, 506, 510, 901 pixels for Cs-137, and by 108, 303, 305, 309, 502, 701, 702, 706, 810, 905 ones for Lu-176. The pixels are referred to by the RRCC notation.
Instruments 05 00026 g0a19

References

  1. Pani, R.; de Notaristefani, F.; Blazek, K.; Maly, P.; Pellegrini, R.; Pergola, A.; Soluri, A.; Scopinaro, F. Multi-Crystal YAP:Ce Detector System for Position Sensitive Measurements, 3rd ed.; London Conference on Position-Sensitive Detectors, PSD-3: Uxbridge, UK, 1993; also published in Nucl. Instrum. Methods Phys. Res. Sect. A 1994, 348, 551–558. [Google Scholar]
  2. Casey, M.E.; Nutt, R. A multicrystal two dimensional BGO detector system for positron emission tomography. IEEE Trans. Nucl. Sci. 1986, 33, 460–463. [Google Scholar] [CrossRef]
  3. Levin, C.S.; Hoffman, E.J. Calculation of positron range and its effect on the fundamental limit of positron emission tomography system spatial resolution. Phys. Med. Biol. 1999, 44, 781–799. [Google Scholar] [CrossRef] [PubMed]
  4. Shibuya, K.; Yoshida, E.; Nishikido, F.; Suzuki, T.; Tsuda, T.; Inadama, N.; Yamaya, T.; Murayama, H. Annihilation photon acollinearity in PET: Volunteer and phantom FDG studies. Phys. Med. Biol. 2007, 52, 5249–5262. [Google Scholar] [CrossRef] [PubMed]
  5. Shao, Y.; Cherry, S.; Siegel, S.; Silverman, R. A study of inter-crystal scatter in small scintillator arrays designed for high resolution PET imaging. IEEE Trans. Nucl. Sci. 1996, 43, 1938–1944. [Google Scholar] [CrossRef]
  6. Park, S.; Rogers, W.; Clinthorne, N. Effect of Intercrystal Compton Scatter on Efficiency and Image Noise in Small Animal PET Module. In Proceedings of the IEEE Nuclear Science Symposium Conference Record, Portland, OR, USA, 19–25 October 2003; pp. 2272–2277. [Google Scholar]
  7. Anger, H.O. Scintillation Camera. Rev Sci Instrum. 1953, 29, 27–33. [Google Scholar] [CrossRef]
  8. Pani, R.; Cinti, M.N.; Scafè, R.; Bennati, P.; Meo, S.L.; Preziosi, E.; Pellegrini, R.; de Vincentis, G.; Sacco, D.; Fabbri, A. A study of response of a LuYAP:Ce array with innovative assembling for PET. Nucl. Instrum. Methods Phys. Res. Sect. A 2015, 795, 82–87. [Google Scholar] [CrossRef]
  9. Scafè, R.; Pellegrini, R.; Cinti, M.N.; Puccini, M.; Pani, R. A novel scintillation imager with charge-spread discrimination. Analytical models suitable for crystal-arrays. Nucl. Instrum. Methods Phys. Res. Sect. A 2016, 833, 110–121. [Google Scholar] [CrossRef]
  10. Scafè, R.; Pellegrini, R.; Puccini, M.; Cinti, M.N. Pani Rejection of events undergoing multiple interactions within a scintillation crystal array based on spatial charge spread discrimination for gamma-ray imaging. Nucl. Instrum. Methods Phys. Res. Sect. A 2017, 870, 97–102. [Google Scholar] [CrossRef]
  11. Savitzky, A.; Golay, M.J.E. Smoothing and Differentiation of Data by Simplified Least Squares Procedures. Anal. Chem. 1964, 36–38, 1627–1638. [Google Scholar] [CrossRef]
  12. Knoll, G.F. Radiation Detection and Measurement, 3rd ed.; John Wiley & Sons: New Hoboken, NJ, USA, 2000; pp. 247–250. [Google Scholar]
Figure 1. Semilog plots of the pulse-height spectra per cluster of pixels from Co-57 (left) and Ba-133 (right) data. The total spectra of the array are drawn (topmost curves) together with the ones of the clusters from 1 to 5 × 10⁻³.
Instruments 05 00026 g001
Figure 2. Semilog plots pulse-height spectra per cluster of pixels from Cs-137 (left) and Lu-176 self-activity (right) data. Total spectra of the array are drawn (topmost curves) together with the ones of clusters from 1 to 5 + 6.
Instruments 05 00026 g002
Figure 3. Array maps representing the crystal-pixel’s 2-D distributions per pulse-height cluster from Co-57 (left) and Ba-133 (right) data-takings. Bin-sizes of 1.2-, and 2.4-charge-units were chosen, respectively, for clustering the Qnet values from each irradiation into five groups, which makes the distributions comparable with each other. The coordinates of the pixels in the array were described by using the RRCC codes.
Instruments 05 00026 g003
Figure 4. Array maps representing the crystal-pixel’s 2-D distributions per pulse-height cluster from Cs-137 (left) and Lu-176 self-activity (right) data-takings. Bin-sizes of 4.8-, and 4.0-charge-units were chosen, respectively, for clustering the Qnet values from each irradiation into five or six groups, which makes the distributions comparable with each other. The coordinates of the pixels in the array were described by using the RRCC codes.
Instruments 05 00026 g004
Figure 5. Domains of interest, defined in the first quadrant of the plane (FWTMx, FWTMy), where the spreads of 2-D charge distributions of the Co-57 data, for the crystal-pixel 605, were defined. Ftot contains all the events by construction, FPhe-top contours the photo-electric interactions occurring at the top of the pixel (first mean-free-path). The domain FPhe-dpt marks out the photoelectric events taking place at greater depth in the pixel. The last two domains FEscX and FEscY regard the photoelectric events with a Lu K X-ray escaping to the X- or Y-neighboring pixel, respectively. Finally, the points of Ftot not belonging to other domains, represent the domain of scattered events Fscatt.
Instruments 05 00026 g005
Figure 6. Fsym spectra per cluster of pixels from the Co-57 (left) and the Ba-133 (right) data. All event spectra of the array are drawn (topmost curves) together with the ones of the individual clusters from 1 to 5 + 6, represented, respectively, from the left to the right. Bin-sizes are of 0.2-, and 0.6-mm, respectively.
Instruments 05 00026 g006
Figure 7. Fsym spectra per cluster of pixels from Cs-137 (left), and Lu-176 self-activity (right) data. All event spectra of the array are drawn (topmost curves) together with the ones of individual clusters from 1 to 5, represented, respectively, from left to right. Bin-sizes are of 1.6-, and 1.2-mm, respectively.
Instruments 05 00026 g007
Figure 8. Array maps representing the crystal pixel’s Fsym values by clusters from Co-57 (left) and Ba-133 (right) data. Bin-sizes values of 4.0-, and 2.8-mm were used, respectively. The locations of pixels in the array were described by the RRCC codes.
Instruments 05 00026 g008
Figure 9. Array maps representing the crystal-pixel’s Fsym values by clusters from Cs-137 (left) and Lu-176 self-activity (right) data. Fsym bin-sizes values of 3.6-, and 3.2-mm were used, respectively. The locations of pixels in the array were described by the RRCC codes.
Instruments 05 00026 g009
Figure 10. Co-57 (left), and Ba-133 (right) data: comparison between the pulse-height spectra from All pixels and the ones from the respective selected decuples of pixels. Spectra were normalized to the respective maximum values.
Instruments 05 00026 g010
Figure 11. Cs-137 (left), and Lu-176 self-activity (right) data: comparison between the pulse-height spectra from All pixels and the ones from the respective selected decuples of pixels. Spectra were normalized to the respective maximum values.
Instruments 05 00026 g011
Figure 12. Fsym spectra from Co-57 data regarding the selected decuple of pixels of the crystal-array with the best charge-symmetry response. Spectra are shown, from top-left to bottom-right, in ascending RRCC crystal-pixel order. Common axes titles and plot descriptions are reported only once in the bottom-left frame for better clarity. The selection criterion, based on Euclidian distances from origin in the plane (average, standard deviation), founded the best decuple of zero-centered spectra made by pixels 107, 110, 402, 406, 409, 703, 704, 803, 804, and 1001, whose distance values from origin ranged from 0.45 to 1.01 mm.
Instruments 05 00026 g012
Figure 13. Fsym spectra from Ba-133 data regarding the selected decuple of pixels of the crystal-array with the best charge-symmetry response. Spectra are shown, from top-left to bottom-right, in ascending RRCC crystal-pixel order. Common axes titles and plot descriptions are reported only once in the bottom-left frame for better clarity. The selection criterion, based on Euclidian distances from origin in the plane (average, standard deviation), founded the best decuple of zero-centered spectra made by pixels 107, 110, 209, 305, 609, 704, 803, 810, 902, and 1001 whose distance values from origin ranged from 0.40- to 1.03-mm.
Instruments 05 00026 g013
Figure 14. Fsym spectra from Cs-137 data regarding the selected decuple of pixels of the crystal-array with the best charge-symmetry response. Spectra are shown, from top-left to bottom-right, in ascending RRCC crystal-pixel order. Common axes titles and plot descriptions are reported only once in the bottom-left frame for better clarity. The selection criterion, based on Euclidian distances from origin in the plane (Average, Standard Deviation), founded the best decuple of zero-centered spectra made by pixels 103, 104, 107, 110, 704, 710, 803, 810, 902, and, 1001, whose distance values from origin ranged from 0.56 to 1.42 mm.
Instruments 05 00026 g014
Figure 15. Fsym spectra from Lu-176 self-activity data regarding the selected decuple of pixels of the crystal-array with the best charge-symmetry response. Spectra are shown, from top-left to bottom-right, in ascending RRCC crystal-pixel order. Common axes titles and plot descriptions are reported only once in the bottom-left frame for better clarity. The selection criterion, based on Euclidian distances from origin in the plane (Average, Standard Deviation), founded the best decuple of zero-centered spectra made by pixels 107, 110, 209, 210, 704, 710, 803, 810, 902, and 1001, whose distance values from origin ranged from 0.45 to 1.37 mm.
Instruments 05 00026 g015
Table 1. Statistics of pulse-height pixel-values for spectra preparation.
ParameterCo-57Ba-133Lu-176
Self-Activity
Cs-137
Centroid of …
122- to 136-keV Peaks276- to 384-keV PeaksAll Spectrum662-keV
Peak
Average (ch.u.)8.829.538.671.6
St. Dev. (ch.u.)1.22.53.85.8
Minimum (ch.u.)5.823.929.260.2
Maximum (ch.u.)11.134.749.985.6
(Max-Min)/Average0.600.370.530.35
Table 2. Co-57 data-token, pixel 605: experimental events-count and relative frequencies per domain.
DomainNo. of EventsRelative Frequency
Ftot29621.000
FPhe-Top21620.730
FEscX3060.103
FEscY1730.058
FPhe-Dpt1530.052
FScatt1680.057
Table 3. Statistics on Fsym crystal-pixel values of the array.
ParameterCo-57Ba-133Lu-176
Self-Activity
Cs-137
Average (mm)−0.4−0.3−0.6−0.5
St. Dev. (mm)4.32.72.83.1
Minimum (mm)−9.6−6.7−7.1−8.1
Maximum (mm)12.68.16.86.9
(Max-Min)/Aver.−56−45−24−32
Table 4. Decuples of crystal-pixels having the most similar net-charge Qnet average values, and the best charge-spread 2-D symmetry Fsym average values, per data-token. Crystal-pixels are referred to by the CCRR notation.
The 10 pixels of the 10 × 10 Array Having the …
… Most Similar Net-Charge Values… Best Charge-Spread Symmetry Values
Co-57Ba-133Cs-137Lu-176
self-act.
Co-57Ba-133Cs-137Lu-176
self-act.
206105104108107107103107
207204301303110110104110
301206305305402209107209
304309403309406305110210
403405405502409609704704
406501504701703704710710
604503505702704803803803
709606506706803810810810
710608510810804902902902
8098019019051001100110011001
Publisher’s Note: MDPI stays neutral with regard to jurisdictional claims in published maps and institutional affiliations.

