Article

The Role of Scale Adjustment in Color Change Evaluation

Department of Physics and Astronomy “Ettore Majorana” & INFN-CT, PH3DRA (Physics for Dating Diagnostics Dosimetry Research and Applications) Labs, via Santa Sofia 64, 95123 Catania, Italy
*
Author to whom correspondence should be addressed.
Instruments 2019, 3(3), 42; https://doi.org/10.3390/instruments3030042
Submission received: 7 June 2019 / Revised: 3 August 2019 / Accepted: 12 August 2019 / Published: 14 August 2019

Abstract

:
The aim of this research work was to assess the influence of different scale adjustment conditions on both color measurement and color difference quantification and, in particular, to determine the best procedure to follow for a high-reliability protocol. This issue is very important in the Cultural Heritage field and, above all, in color measurement, which is carried out at different times during conservation and restoration campaigns or during archaeological excavations. Color change evaluation, performed by way of spectrophotometric measurements under different scale adjustment procedures on selected samples represented by colored reflectance standards and colored paintings, aimed to obtain results not only on ideal samples (certified standards) but also on real case studies (paintings). The study was conducted by focusing on the coordinates of the CIELAB color space and, in particular, on the calculation of the ΔE*ab quantity. The results show the introduction of nonsystematic variation with different scale adjustment procedures independent of materials and hue.

1. Introduction

The importance of colorimetric measurements is well known and has been assessed by UNI, the Italian standardization body, and by CEN (Comité Européen de Normalisation) [1]. Color measurements can be carried out in situ by colorimetric and spectrophotometric techniques; these are the most used in Cultural Heritage because they are not invasive or destructive with respect to the analyzed sample. Spectrophotometric analysis is based on the study of the spectral reflectance factor (SRF%) trend in the visible range of the electromagnetic spectrum (400–700 nm). The behavior of the SRF% provides information about the optical characteristics of a material, and it is used to specify its colors [2]. When a reflectance spectrum from an object’s surface is recorded under standard operative conditions, the spectral curve can in fact be used for the quantitative specification of color. By the integration of SRF% curves, software processes calculate the color coordinates in a selected space codified by CIE (Commission Internationale de l’Eclairage) by considering the selected illuminant and the color matching functions [2].
Furthermore, the SRF% trend represents an assisting tool for pigment identification by comparison between the acquired curves and those stored in a specific database under the same experimental conditions [3,4,5,6].
In the Cultural Heritage field, the study of color coordinate trends instead is useful for many applications. It could be important for evaluating the difference between colors of neighboring areas in artworks, before and after restoration; for monitoring the degradation phenomena in natural and artificial stones [7,8,9]; or for monitoring color alteration in paintings produced by degraded varnish or due to the action of improper light sources and to high variation in relative humidity and temperature [10,11,12,13].
Especially in conservation and restoration programs, color measurements, performed at different times for evaluating possible color changes, require specifying all measurement parameters such as the illuminant, measurement area, selection of specular components included and/or excluded, and viewing conditions, including the scale adjustment procedure.
According to International Bureau of Weight and Measures, the term “calibration” refers to the establishment of a relation between the value measured by the instrument and the certificate reference target in order to find and eliminate systematic errors of an instrument’s scale [14]. In general use, the calibration also includes the process of adjusting the output or indication on a measurement instrument to correspond with the value of the applied standard, within a specific accuracy [2]. This latter operation, which we named scale adjustment, is fundamental for spectrophotometric and color specification, especially in the case of chromatic difference evaluation. Measurements of spectral reflectance, indeed, are usually not made as absolute measurements of the incident and reflected radiant flux but rather as measurements relative to a standard of known reflectance value. The CIE recommends the perfect reflecting diffuser as a reference for making measurements of the reflectance factor [15]. A perfect reflecting diffuser is defined as the ideal uniform diffuser with a reflectance equal to unity [16,17]. There is no material that has the properties of a perfect reflecting diffuser; however, through specific techniques and tools, it is possible to calibrate using a white standard representing the ideal uniform diffuser [18].
Normally, each device, such as colorimeters and spectrophotometers, is provided by the supplier with its coupled white standard, and a standard procedure for scale adjustment is suggested. This obligatory procedure starts by taking two measurements. The first one is used to establish the zero of the scale, and it is performed by using a specific attachment for the instrument that absorbs all light. The second is made with the white standard, for setting the maximum of the scale. When you buy the instrument, the device for performing the zero scale is optional, and this could make you think that it is not necessary. Concerning this, research work aimed to evaluate specifically what happens if during a measurement campaign the minimum scale adjustment (black) passage is skipped. During measurements, it is in fact possible to perform the adjustment of the lightness axis only by the maximum value corresponding to the white reference and using as minimum value (corresponding to “black”) the electronic noise of the instrument.
In the Cultural Heritage field, especially for measurements conducted in situ, in a museum or during archaeological excavations, and scheduled at different times, there may not be the appropriate conditions for performing the minimum and maximum scale adjustment according to the standard procedure. This research work aimed to evaluate the influence of different scale adjustment conditions on color difference assessment. Color measurements were carried out on two types of samples: certified standards and painting samples. The certified standards aid in developing consistent color reproduction for manufacturers of products such as textiles, papers, and paints, and they provide highly stable, reproducible spectral reflectance. The painting samples, produced in the laboratory according to old recipes, do not have standardized optical characteristics.

2. Materials and Methods

2.1. Samples

We analyzed two types of samples: certified colored standard and paintings. The standards were Spectralon® supplied by the Labsphere company. They present properties such as Lambertian behavior, durability, and stability.
Eight colored standards, identified with code CSS (Color Standard Spectralon), and two standards available among the neutral ones, corresponding to the minimum (2%) and the maximum (99%) reflectance values identified with code RSS (Reflectance Standard Spectralon), were used.
As reported in Table 1, the minimum and maximum values were used as references for black (K) and white (W).
The colored painting samples were realized in the laboratory; they are illustrated in Figure 1 and described in Table 2. These samples were prepared according to old recipes, in order to reproduce ancient paintings [19], following a consolidated preparation procedure [20,21,22]. They were realized by mixing pigments purchased in powder state, a dry bulk solid composed of loose particles, with wet medium at a fixed ratio of 1:3 between the powder and the wet medium for all samples. The selected medium was egg tempera. All paints were obtained by brushing the mixtures on canvas. The samples were painted on canvas boards sold by Zecchi srl.

2.2. Experimental Setup and Scale Adjustment Procedure

The analysis was conducted using a Konica Minolta spectrophotometer, model CM-2600d with measurement geometry d/8°, by selecting small aperture value (SAV) with diameter Ø = 6 mm. The color coordinates were calculated considering D65 illuminant and a CIE 1964 standard colorimetric observer (10° standard observer). Data were obtained from repeated measurements (five different measurements for each point), and the elaboration regarded SPEX/100 values (specular component excluded and UV included). The acquisition step was performed using SpectraMagic software, while Origin software (OriginPro 8) was used for data processing.
The measurements on the colored standards and paintings were realized in six different modes, considering all possible combinations for the adjustment of the maximum (white) and the minimum (black) of the lightness scale. Table 3 reports the adopted procedures according to our laboratory code and a brief description with the type of white and black references employed.
The code “PC” corresponds to the scale adjustment as indicated by the instrument supplier. The supplier equipped the spectrophotometer with a white calibration plate (CM-A145) for the maximum lightness and a black box (Zero-Calibration Box CM-A32 Minolta) for the minimum lightness. This last device is listed among the optional ones when you purchase the instrument. This explains why the spectrometer software allows for adjusting the minimum of the lightness scale without any black reference.

2.3. Spectrophotometric Analysis

The results were elaborated focusing on the CIELAB 1976 coordinates in which L* represents lightness; a* represents the red/green axis; and b* the yellow/blue axis. CIELAB is a popular color space for measuring reflective objects belonging to Cultural Heritage [1]. In this space, the color difference ΔEab between the points a and b is the Euclidian distance, and it is calculated as follows [1,23]:
Δ E a b * = ( Δ L * ) 2 + ( Δ a * ) 2 + ( Δ b * ) 2 .
ΔL*, Δa*, and Δb* are calculated with respect to the PC procedure, which is considered the target.
Concerning ΔE*ab, values ranging from 0 to 1 were considered as not perceptible by the human eye, and for values between 1 and 2, only experienced observers can notice the color difference. ΔE* values higher than 3.5 were considered as clearly visible [24].
Uncertainty was calculated as the root-mean-square (RMS) average of the standard deviation (SD) of repeated measurements and systematic uncertainty attributable to instrumentation. This last contribution was estimated based on CIELAB color coordinates measured on the white calibration plate [2,25].

3. Results and Discussion

In Table 4, the color coordinates L*, a*, and b* measured on the standards listed in Table 1 are reported. The uncertainties associated were about 3%.
To better highlight the color differences due to the adjustment conditions, ΔE*ab was calculated by considering the measurement carried out with the PC procedure as the target and the other adjustment conditions as samples. The results are reported in Table 5.
Table 5 shows that ΔE*ab presented higher values in terms of color perception in the case of SS-PC, particularly for the red and orange with respect to yellow and green. Violet was the hue least subject to variation in this case. According to the thresholds in [24], skillful observers can notice the color differences for WS-PC. Most of the ΔE*ab values for WO, WD, and SK fall within those not perceptible by the human eye [24]. In order to determine the influence of each color coordinate in ΔE*
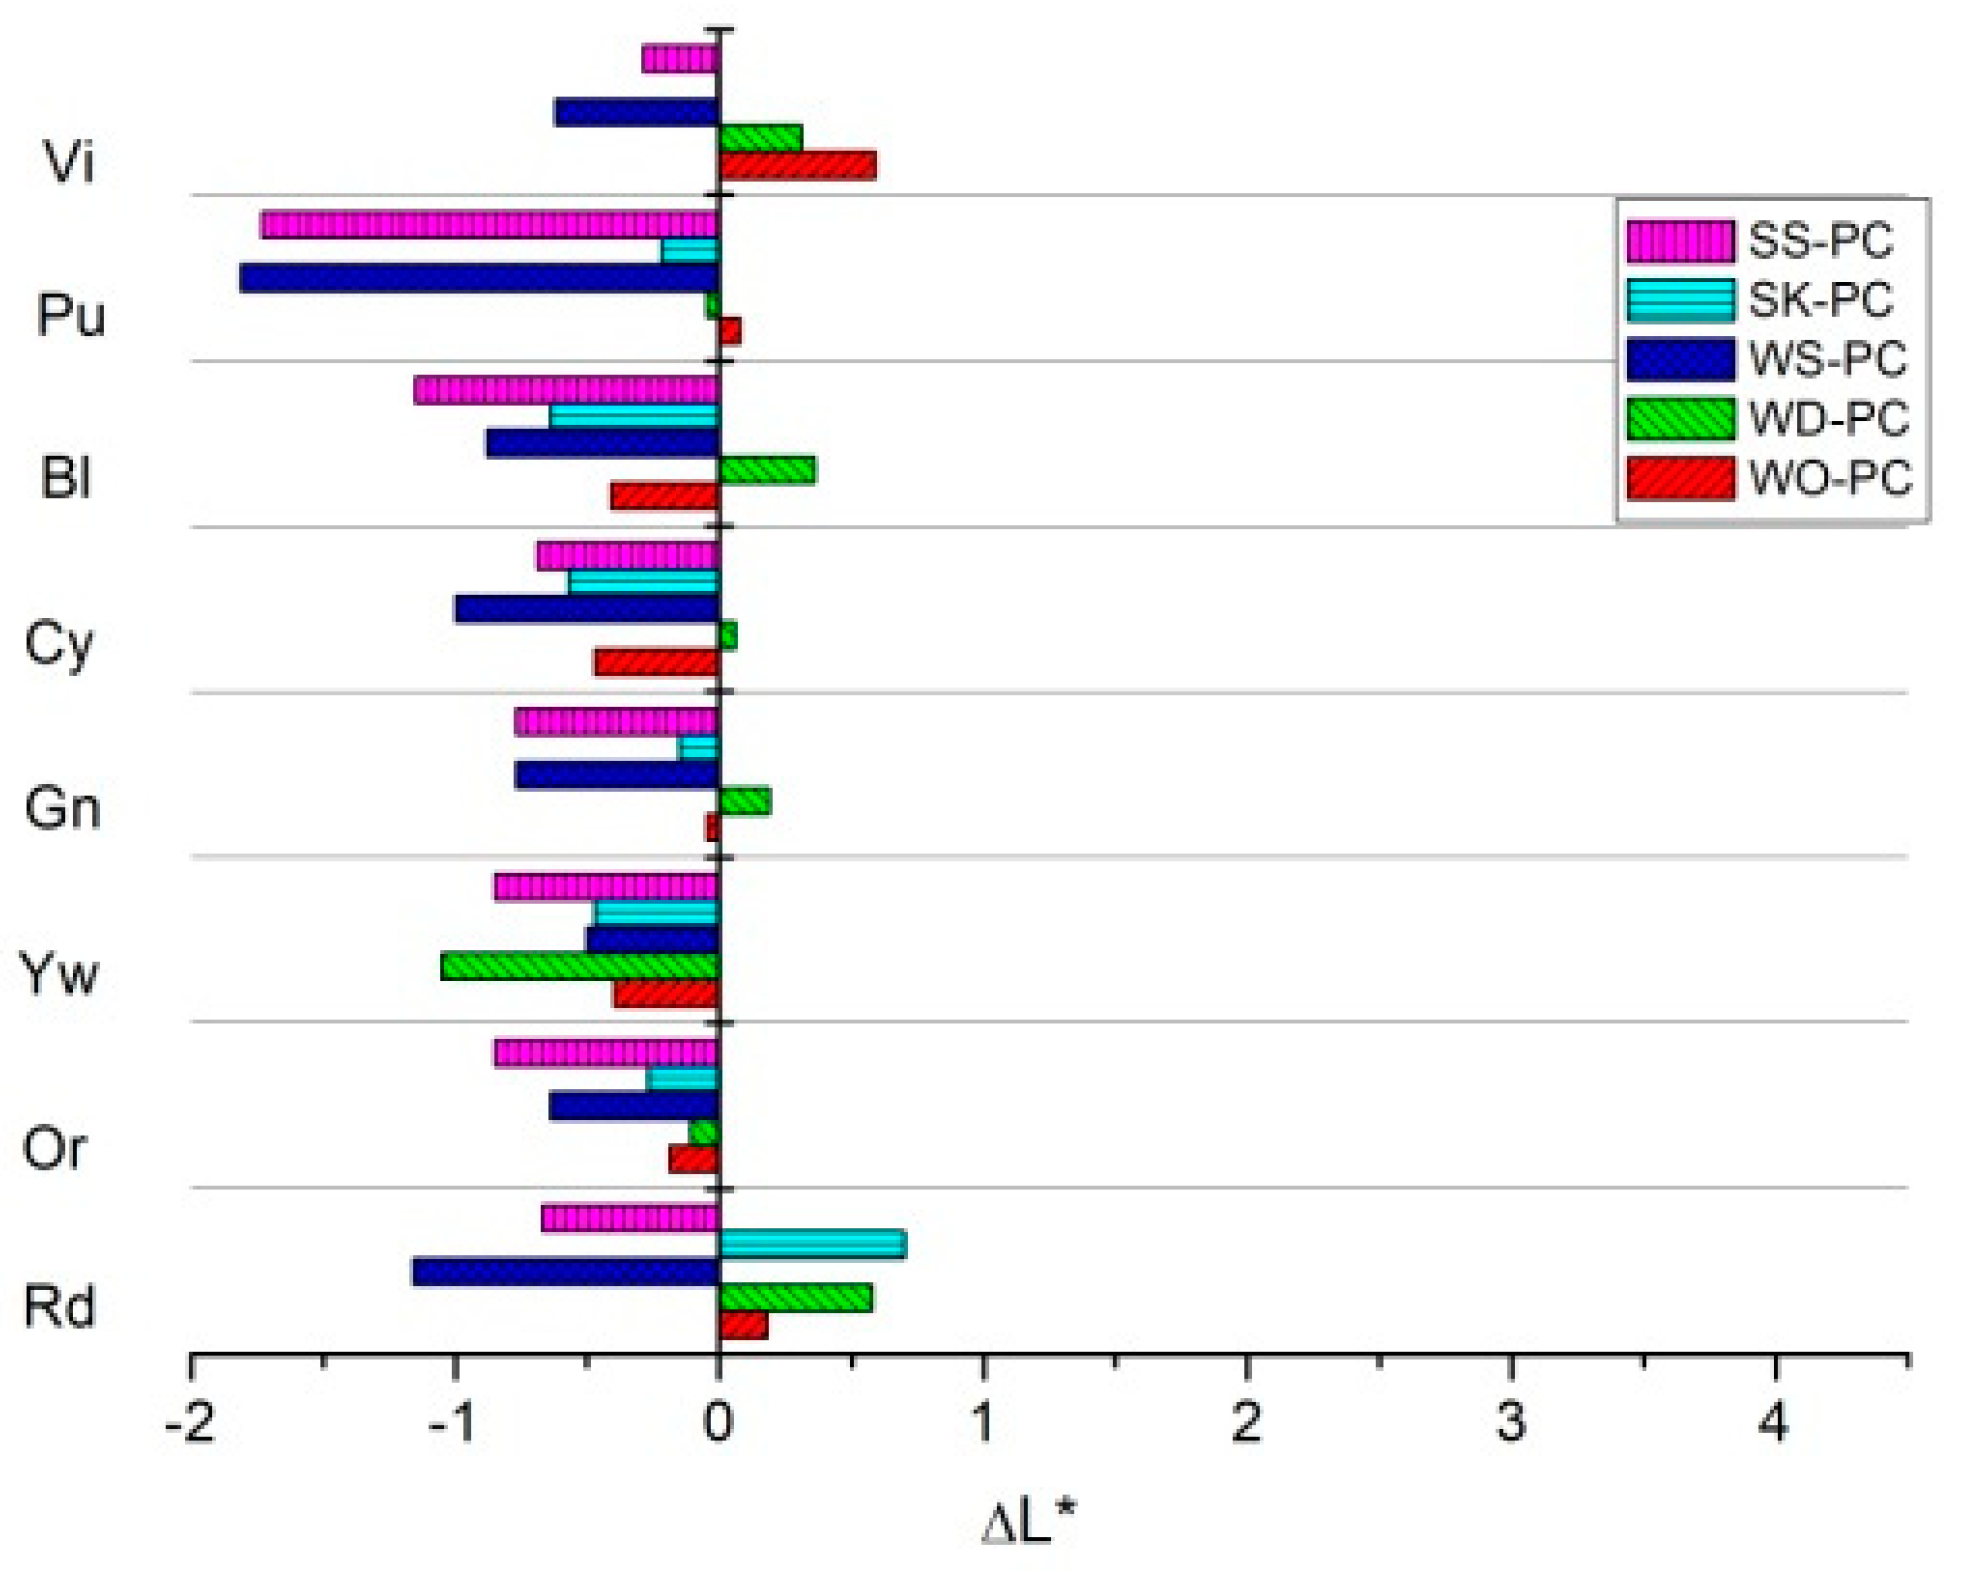
ab quantities, ΔL*, Δa*, and Δb* are plotted in Figure 2, Figure 3 and Figure 4. In general, we cannot see systematic variations in the color coordinate values in the functions of the procedures adopted, and among these procedures, the worst are SS and WS. We can observe this in Figure 2, Figure 3 and Figure 4. In particular, in 
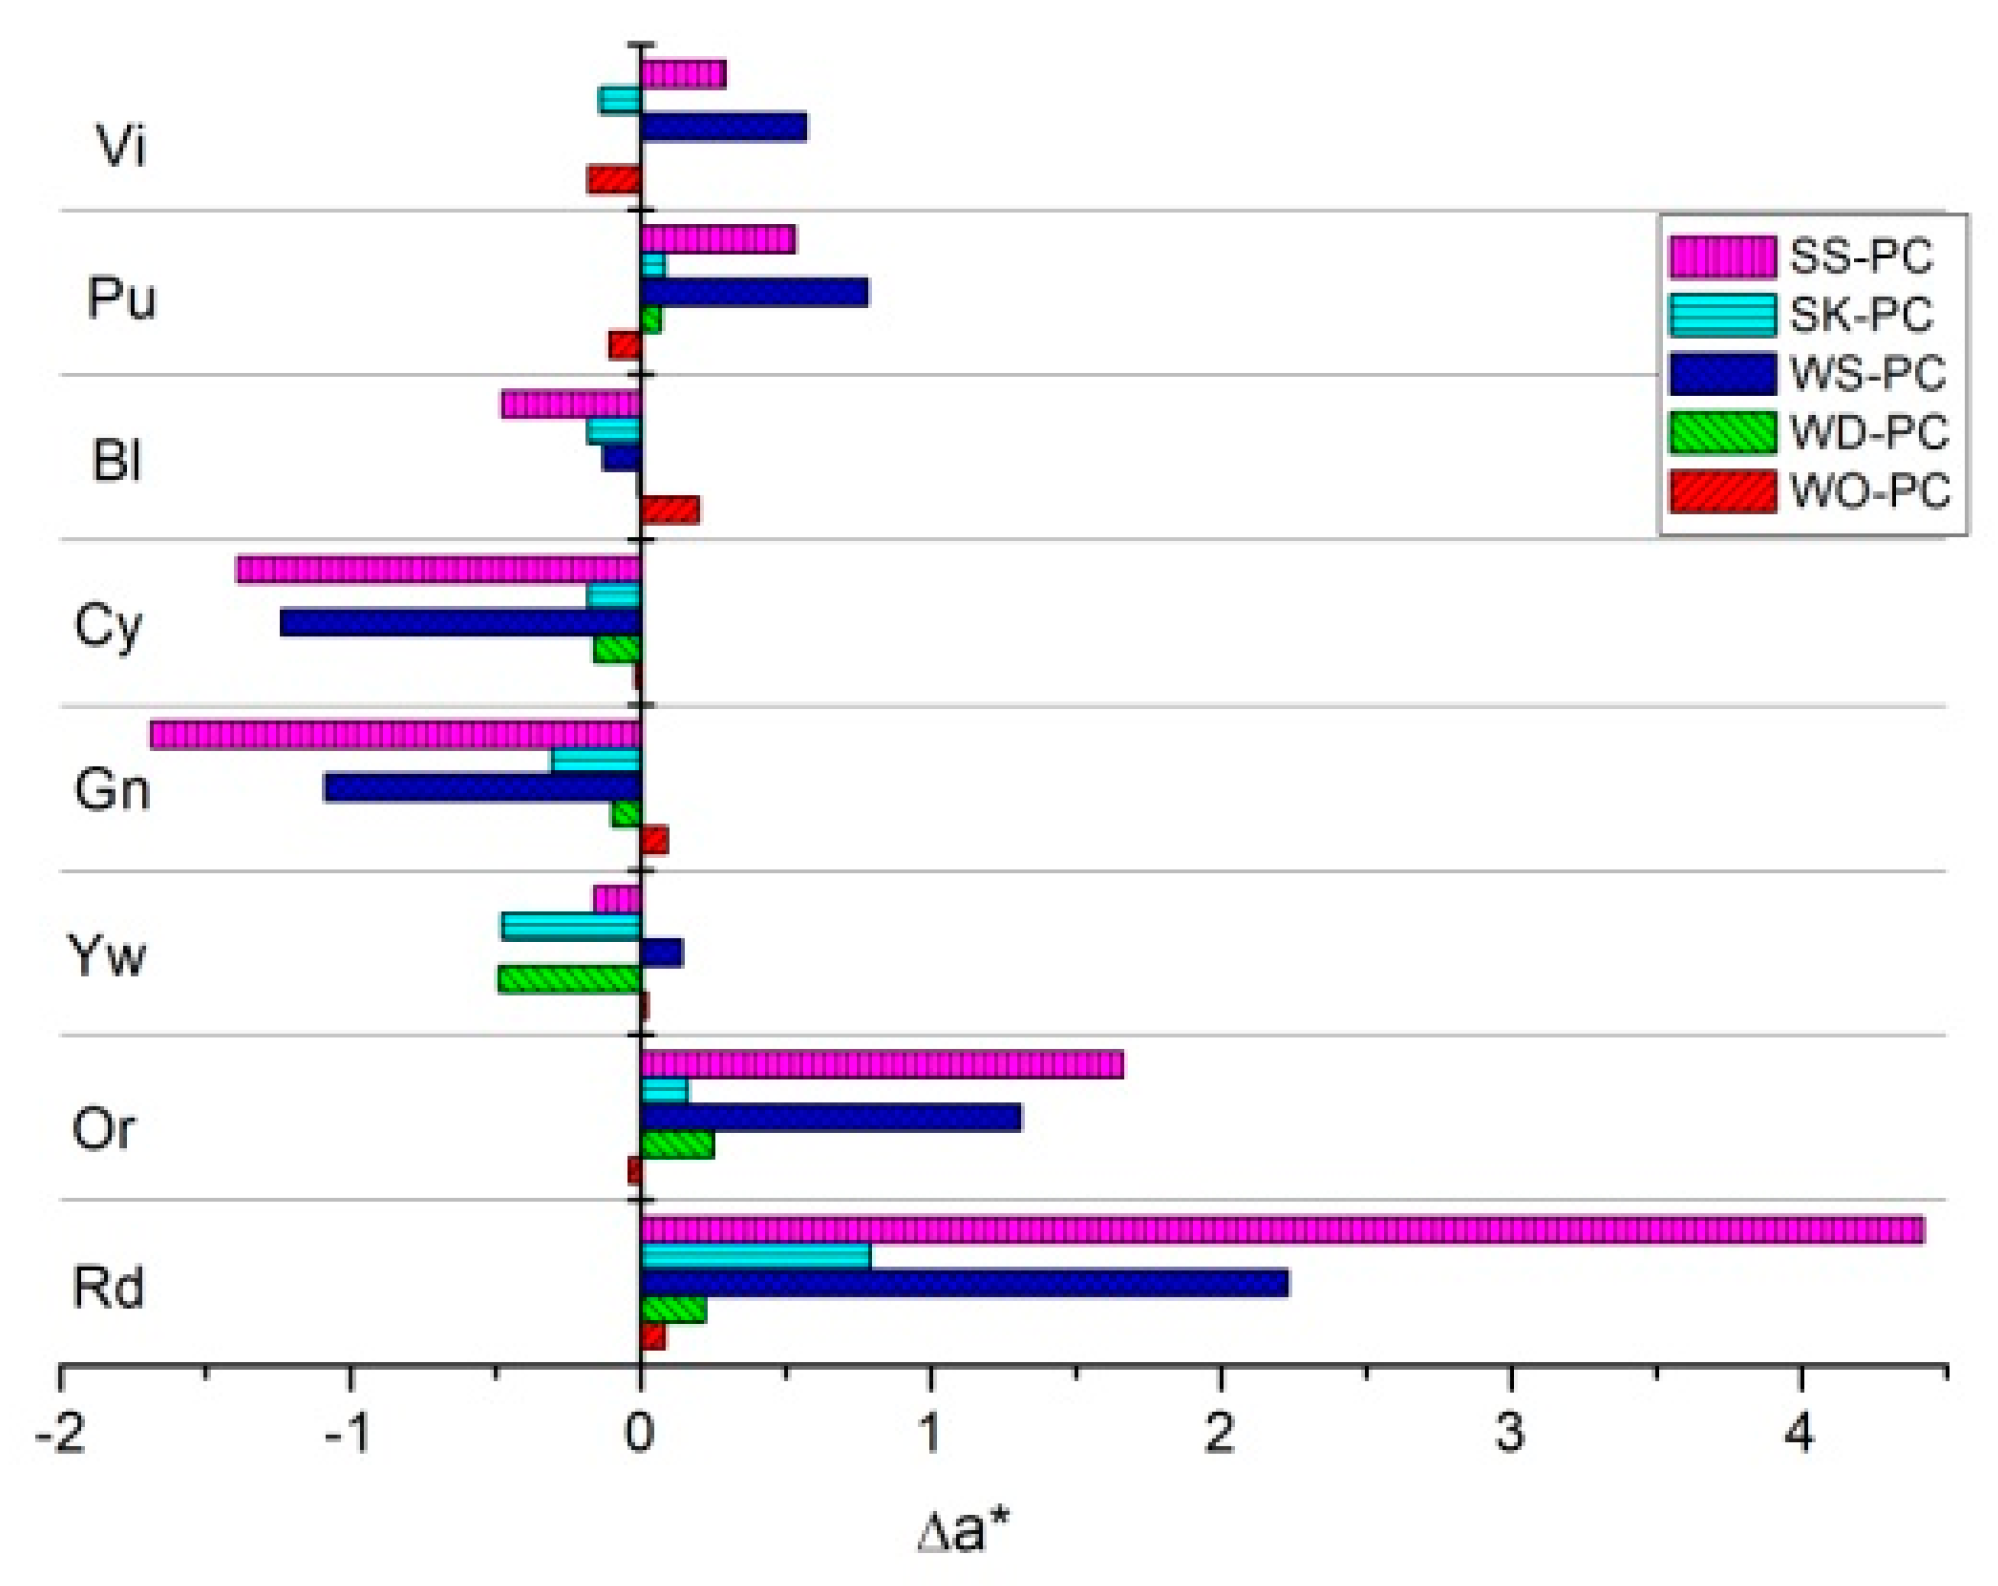
Figure 2, we observe negative ΔL* values for all standards until a value of 2 for the purple standard. Regarding Δa*, 
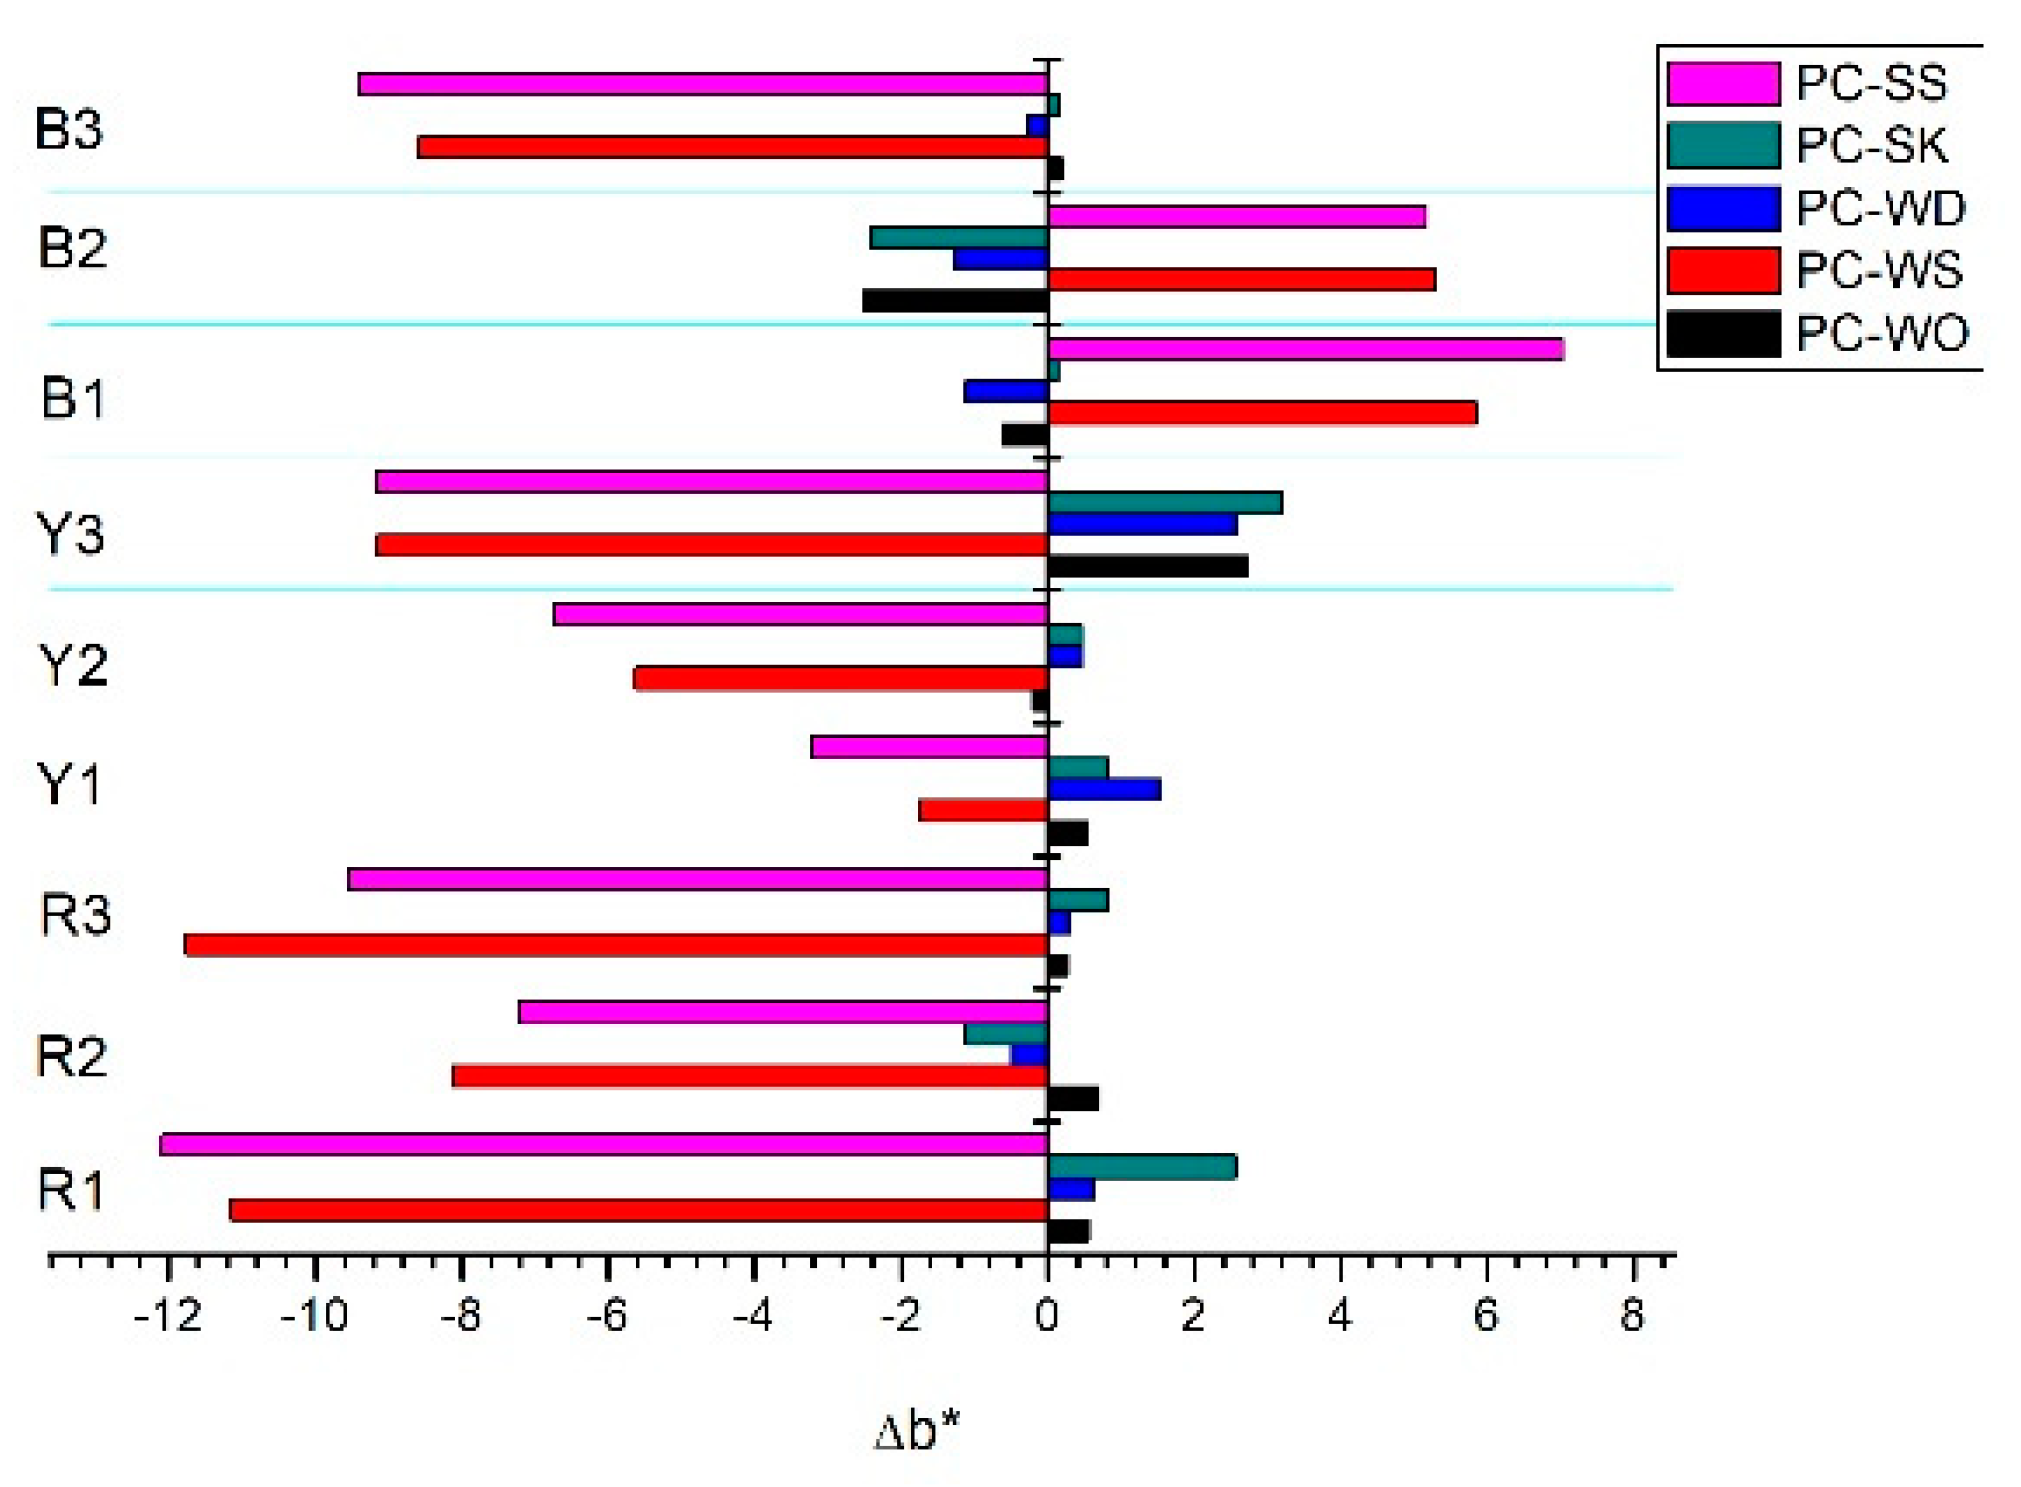
Figure 3 shows meaningful red shift for the Vi, Pu, Or, and Rd standards, with values up to 4, and green shift for Bl, Cy, Gn, and Yw for the SS and WS procedures. The higher values of Δb* (up to 3.5) also observed in this case are related to the SS and WS procedures, and in particular, we see yellow shift for the Gn, Yw, Or, and Rd standards and blue shift for the Pu, Bl, Cy, and Vi ones (Figure 4). Not only the lightness but also the color coordinates (a*, b*) are influenced by the use of different adjustment procedures, in some cases in a significant way.
Concerning the painting samples, Table 6 and Table 7 respectively report the color coordinates and the ΔE*ab values calculated with the different scale adjustment procedures with respect to the PC one. Considering the thresholds discussed in Section 2.3, like for the standard samples, the SS and WS procedures present higher values of ΔE*ab. In general, with respect to the values reported in Table 5 for standards, painting samples present higher values of ΔE*ab that reach, in some cases (PC-WS and PC-SS), values greater than 5 [24]. To better evaluate the contribution of each CIELAB coordinate to the color difference, ΔL*, Δa*, and Δb* are plotted in Figure 5, Figure 6 and Figure 7.
Figure 5 shows positive ΔL* values for all procedures and for all hues. This behavior is totally different from that for the standards. Δa* presents significant red shift only for SS and WS for blue paintings and green shift for yellow and red ones (Figure 6). SS and WS procedures, in comparison to PC, present significant blue shift for yellow and red samples (Figure 7). The tendency found for the painting samples is different from that for the standards, for which the shifts are correlated with the hue. Furthermore, in relation to the standards, the absolute variations are greater for the painting samples. This evidence could be explained by considering the non-Lambertian surface of the laboratory samples and the possible influence of the egg tempera. In order to support this hypothesis, it would be necessary to increase the number of samples in order to have a statistically consistent number.

4. Conclusions

The aim of this research work was to contribute to the evaluation of the role played by scale adjustment on color measurement, with particular attention to color difference quantification. To evaluate the influence of scale adjustment, certified standards and painting samples were measured using a spectrophotometer. The results showed that during a colorimetric measurement campaign, together with other measurement conditions and parameters, the adjustment procedure must be indicated. In result communication, the omission of this important step in the colorimetric measurements could in fact lead to the reporting of color variations which are not “real” due to the use of different references for the reflectance maximum (white) and minimum (black) values.
The results from both certified standards and painting samples show nonsystematic uncertainty. This is important in the case of comparison of data acquired with different scale adjustment procedures at different times, which could invalid chromatic change evaluations. In all fields, especially in Cultural Heritage, this is a relevant issue, because it could have consequences in terms of conservation and restoration programs.
In relation to the standard procedure, performed using both white plate calibration and a black box device, WO is the procedure that ensured the highest reliability. All other possible procedures must be excluded.

Author Contributions

Conceptualization, A.M.G.; methodology, A.M.G. and G.S.; formal analysis, G.S. and S.P.; investigation, A.M.G. and S.P.; data curation, G.P. and G.S.; writing—original draft preparation, G.S. and S.P.; writing—review and editing, G.P., G.S. and S.P.; supervision, A.M.G.

Funding

This research received no external funding.

Acknowledgments

The authors would like to acknowledge the professor Claudio Oleari for his teaching and useful discussions that allowed them to improve their expertise in the field of color specification.

Conflicts of Interest

The authors declare no conflict of interest.

References

  1. EN15886: Conservation of Cultural Property—Test Method—Colour Measurements of Surfaces; European Committee for Standardization: Brussels, Belgium, 2010.
  2. Oleari, C. Standard Colorimetry: Definitions, Algorithms and Software; John Wiley: Chichester, UK, 2016. [Google Scholar]
  3. Official Site CNR. Available online: http://fors.ifac.cnr.it (accessed on 5 June 2019).
  4. Dupuis, G.; Elias, M.; Simonot, L. Pigment identification by fiber optics diffuse reflectance spectroscopy. Appl. Spectr. 2002, 56, 1329–1336. [Google Scholar] [CrossRef]
  5. Gil, M.; Green, R.; Carvalho, M.L.; Seruya, A.; Queralt, I.; Candeias, A.E.; Mirão, J. Rediscovering the palette of Alentejo (Southern Portugal) earth pigments: Provenance establishment and characterization by LA-ICP-MS and spectra-colorimetric analysis. Appl. Phys. A 2009, 96, 997–1007. [Google Scholar] [CrossRef]
  6. Henin, E.; Ali, M.; Ciliberto, E.; Gueli, A.M.; Belal, A.; Pasquale, S. Investigation and analysis of vintage hand coloured photographs from Francis Amin’s private collection, Egypt. IJCS 2019, 10, 257–270. [Google Scholar]
  7. Fermo, P.; Goidanich, S.; Comite, V.; Toniolo, L.; Gulotta, D. Study and Characterization of Environmental Deposition on Marble and Surrogate Substrates at a Monumental Heritage Site. Geosciences 2018, 8, 349. [Google Scholar] [CrossRef]
  8. Gherardi, F.; Kapridaki, C.; Roveri, M.; Gulotta, D.; Maravelaki, P.N.; Toniolo, L. The deterioration of Apuan white marble in contemporary architectural context. J. Cult. Herit. 2019, 35, 297–306. [Google Scholar] [CrossRef]
  9. López, A.; Guzmán, G.A.; Di Sarli, A.R. Color stability in mortars and concretes. Part 1: Study on architectural mortars. Constr. Build. Mater. 2016, 120, 617–622. [Google Scholar] [CrossRef]
  10. Bullock, L. Reflectance Spectrophotometry for Measurement of Color Change. Nat. Gallery Tech. Bull. 1978, 2, 9–55. [Google Scholar]
  11. Bacci, M.; Cucci, C.; Picollo, M.; Porcinai, S.; Pretzel, B.; Radicati, B. Control of the Color Evolution with Time of a Luca Signorelli Painting. In Proceedings of the 10th Congress of the International Color Association, Granada, Spain, 8–13 May 2005; pp. 623–626. [Google Scholar]
  12. Lo Monaco, A.; Marabelli, M.; Pelosi, C.; Picchio, R. Colour measurements of surfaces to evaluate the restoration materials, O3A: Optics for Arts, Architecture, and Archaeology III, edited by Luca Pezzati and Renzo Salimbeni. In Proceedings of the SPIE—The International Society for Optical Engineering, Bellingham, WA, USA, 25–26 May 2011; Volume 8084, pp. 1–14. [Google Scholar]
  13. Pelosi, C.; Capobianco, G.; Agresti, G.; Bonifazi, G.; Morresi, F.; Rossi, S.; Santamaria, U.; Serranti, S. A methodological approach to study the stability of selected water colours for painting reintegration, through reflectance spectrophotometry, Fourier transform infrared spectroscopy and hyperspectral imaging. Spectrochim. Acta Part A Mol. Biomol. Spectrosco. 2018, 198, 92–106. [Google Scholar] [CrossRef] [PubMed]
  14. JCGM 200:2012, International Vocabulary of Metrology-Basic and General Concepts and Associated Terms (VIM) 3rd ed. Available online: http://www.bimp.org\eng\publications\guides\#vim (accessed on 19 July 2019).
  15. CIE 15-1971. Colorimetry. 1971. Available online: http://www.cie.co.at/publications/colorimetry (accessed on 5 June 2019).
  16. Artom, M.; Billmeyer, F.W.; Budde, W.; Clarke, F.J.J.; Erb, W.; Fillinger, L.; Hammond, H.; Hemmendinger, H.; Krochmann, J.; Venable, W.H. A Review of Publications on Properties and Reflection Values of Material Reflection Standards; CIE 46-1979. 1979. Available online: http://www.cie.co.at/publications/technical-reports (accessed on 5 June 2019).
  17. Budde, W. Calibration of reflectance standard. J. Res. Nat. Bur. of Stan. Sec. A 1976, 80A, 585–595. [Google Scholar] [CrossRef]
  18. Wyszecki, G.; Stiles, W.S. Color Science: Concept and Methods, Quantitative Data and Formulae; Wiley Classics Library: Hoboken, NJ, USA, 2000. [Google Scholar]
  19. Cennini, C. Libro Dell’arte (a Cura di F. Frezzato); Neri Pozza publisher: Vicenza, Italy, 2009. [Google Scholar]
  20. Gueli, A.M.; Bonfiglio, G.; Pasquale, S.; Troja, S.O. The effect of particle size on pigments colour. Color Res. Appl. 2017, 42, 236–243. [Google Scholar] [CrossRef]
  21. Gueli, A.M.; Pasquale, S.; Troja, S.O. The Influence of vehicle on historical pigments colour. Color Res. Appl. 2018, 42, 823–835. [Google Scholar] [CrossRef]
  22. Gueli, A.M.; Gallo, S.; Pasquale, S. Optical and colorimetric characterization on binary mixtures prepared with coloured and white historical pigments. Dyes Pigment. 2018, 157, 342–350. [Google Scholar] [CrossRef]
  23. Alessi, P.J.; Carter, E.C.; Fairchild, M.D.; Hunt, R.WG.; McCamy, C.S.; Kranicz, B.; Moore, J.R.; Morren, L.; Nobbs, J.H.; Yaguchi, H. CIE 15 Colorimetry, 3rd ed.; Commission Internationale de l’èclairage: Vienna, Austria, 2004. [Google Scholar]
  24. Mokrzycki, W.S.; Tatol, M. Color difference DE: A survey. Mach. Graph. Vis. 2011, 20, 383–411. [Google Scholar]
  25. Taylor, J.; Hanson, A.R.; Clarke, P.J.; Campos, J.; Pons, A.; Czepluch, W.; Jaaskelainen, T.; Hiltunen, J.; Gaudemer, J.; Soares, O. Good Practice Guide to Surface Color Measurements. EUR 19552 EN. 2000. [Google Scholar]
Figure 1. The painting samples realized in the laboratory with pure pigments and egg tempera.
Instruments 03 00042 g001
Figure 2. ΔL* calculated using PC adjustment as the target and other adjustment conditions as samples.
Instruments 03 00042 g002
Figure 3. Δa* calculated using PC adjustment as the target and other adjustment conditions as samples.
Instruments 03 00042 g003
Figure 4. Δb* calculated using PC adjustment as the target and other adjustment conditions as samples.
Instruments 03 00042 g004
Figure 5. ΔL* calculated using PC adjustment as the target and the other procedures as samples.
Instruments 03 00042 g005
Figure 6. Δa* calculated using PC adjustment as the target and the other procedures as samples.
Instruments 03 00042 g006
Figure 7. Δb* calculated using PC adjustment as the target and the other procedures as samples.
Instruments 03 00042 g007
Table 1. Description of standard samples listed according to the hue, the laboratory code (Lab Code), and the code provided by the supplier. The standards having minimum (2%) and maximum (99%) reflectance were used, respectively, as black and white references. For each sample, the diameter was of 1.25 inches, except for the maximum and minimum targets, which were 1 inch.
StandardLab CodeSupplier’s Code
RedRdCSS-RD-010
GreenGnCSS-GN-010
BlueBlCSS-BL-010
YellowYwCSS-YW-010
CyanCyCSS-CY-010
OrangeOrCSS-OR-010
PurplePuCSS-PU-010
VioletViCSS-VI-010
Maximum Reflectance = “white”WRSS-99-010
Minimum Reflectance = “black”KRSS-02-010
Table 2. The pigments listed by hue and the lab code used for the painting sample preparation.
HueLab CodePigments
RedR1Cinnabar
R2Red ochre
R3Hematite
YellowY1Lead tin yellow
Y2Yellow ochre
Y3Siena earth
BlueB1Lapis lazuli
B2Azurite
B3Indaco
Table 3. Different procedures of adjustment employed in the color measurements on Spectralon® color standards and on paintings.
Lab CodeDescriptionL* Max (White)L* Min (Black)
PCStandard Protocol White CM-A145Box CM-A32
WOWhite onlyWhite CM-A145-
WDWhite and dark White CM-A145Flash in the darkness
WSWhite and standard R% blackWhite CM-A145Standard SRS-02-010
SSStandard R% white and blackStandard SRS-99-010Standard SRS-02-010
SKStandard R% white and blackStandard SRS-99-010Box CM-A32
Table 4. CIELAB coordinate values for the standards obtained by varying the scale adjustment procedures.
StandardPCWOWDWSSKSS
L*a*b*L*a*b*L*a*b*L*a*b*L*a*b*L*a*b*
Rd48.5545.5422.1348.7345.6222.3149.1345.7622.4547.3947.7723.7149.2546.3322.8947.8849.9625.71
Gn63.95−29.0416.9863.90−28.9517.0164.14−29.1417.0263.18−30.1317.5763.80−29.3516.9763.18−30.7317.90
Bl59.92−4.76−39.4659.51−4.56−40.1560.28−4.77−39.0959.04−4.89−40.9459.28−4.94−40.0558.77−5.24−40.87
Yw87.318.3872.6786.918.4072.7686.267.8971.7986.818.5275.3486.847.9072.5286.468.2275.39
Cy72.51−30.73−11.6272.04−30.75−11.6072.57−30.90−11.7371.51−31.97−12.0571.94−30.91−11.5371.82−32.12−12.01
Or67.0150.0746.1066.8250.0346.0966.9050.3247.0166.3751.3848.7766.7450.2346.9966.1651.7349.86
Pu49.329.71−6.0149.409.60−6.1549.279.78−6.0447.5110.49−6.1949.119.79−5.8447.5910.24−6.50
Vi62.7116.95−24.1663.3016.7723.9363.0216.95−23.9362.0917.52−24.6362.7016.81−23.9162.4217.24−24.60
Table 5. ΔE*ab values obtained for all standards considering as target the measurement made with the PC adjustment and as samples the measurements carried out with other adjustment conditions (see Table 3).
StandardW0-PCWD-PCWS-PCSK-PCSS-PC
Rd0.270.702.971.305.73
Gn0.110.211.460.342.07
Bl0.830.521.730.891.88
Yw0.411.462.720.682.86
Cy0.470.211.650.601.60
Or0.190.953.040.944.19
Pu0.200.091.980.291.88
Vi0.660.380.960.280.61
Table 6. CIELAB coordinates for the paintings obtained for the scale adjustment procedures.
PigmentPCWOWDWSSKSS
L*a*b*L*a*b*L*a*b*L*a*b*L*a*b*L*a*b*
R143.8338.3724.1443.6938.4023.5841.9638.0024.1038.1843.2035.2942.6636.3521.5738.6146.3736.24
R244.5526.3223.4145.1325.9522.7243.0426.8523.9139.2431.6531.5543.7727.2124.5340.6931.3530.64
R332.0519.7914.0932.1919.6313.8131.3419.6113.7923.4028.6715.8531.9719.3813.2723.4128.0713.64
Y178.910.4444.6078.470.8144.0676.330.7143.0877.84−0.0646.3778.35−0.8143.7976.820.6547.84
Y267.3416.2346.5368.3216.3946.7467.2716.1746.0765.9817.2352.1667.4216.1746.0767.1617.8753.28
Y359.2317.8146.8058.2817.1844.0756.9717.1944.2554.2019.6055.9656.1917.4143.6055.0919.5155.97
B139.09−0.04−31.0038.47−0.06−30.3837.38−0.14−29.8832.11−0.33−36.8537.850.27−31.1432.430.15−38.02
B233.68−6.78−20.7536.56−8.36−18.2136.30−7.78−19.4829.82−10.77−26.0436.87−8.15−18.3329.76−9.85−25.92
B314.252.94−10.1814.953.10−10.3714.963.08−9.9115.130.96−1.6015.292.54−10.3415.110.52−0.77
Table 7. ΔE*ab values obtained for the scale adjustment procedures with respect to the PC one.
PigmentPC-WOPC-WDPC-WSPC-SKPC-SS
R10.581.9113.403.4715.42
R20.981.6711.081.639.61
R30.340.7917.090.9215.31
Y10.793.022.131.603.86
Y21.010.485.880.486.94
Y32.963.4810.604.4410.20
B10.892.059.111.299.68
B24.153.087.674.247.18
B30.740.7716.650.4417.16

