1. Introduction
The TOTEM experiment [
1] is dedicated to studies of forward hadronic phenomena at the LHC, particularly to the measurement of the total cross-section, elastic scattering and diffractive processes. It is located at the LHC Interaction Point (IP) 5 together with the CMS experiment. TOTEM’s detector apparatus [
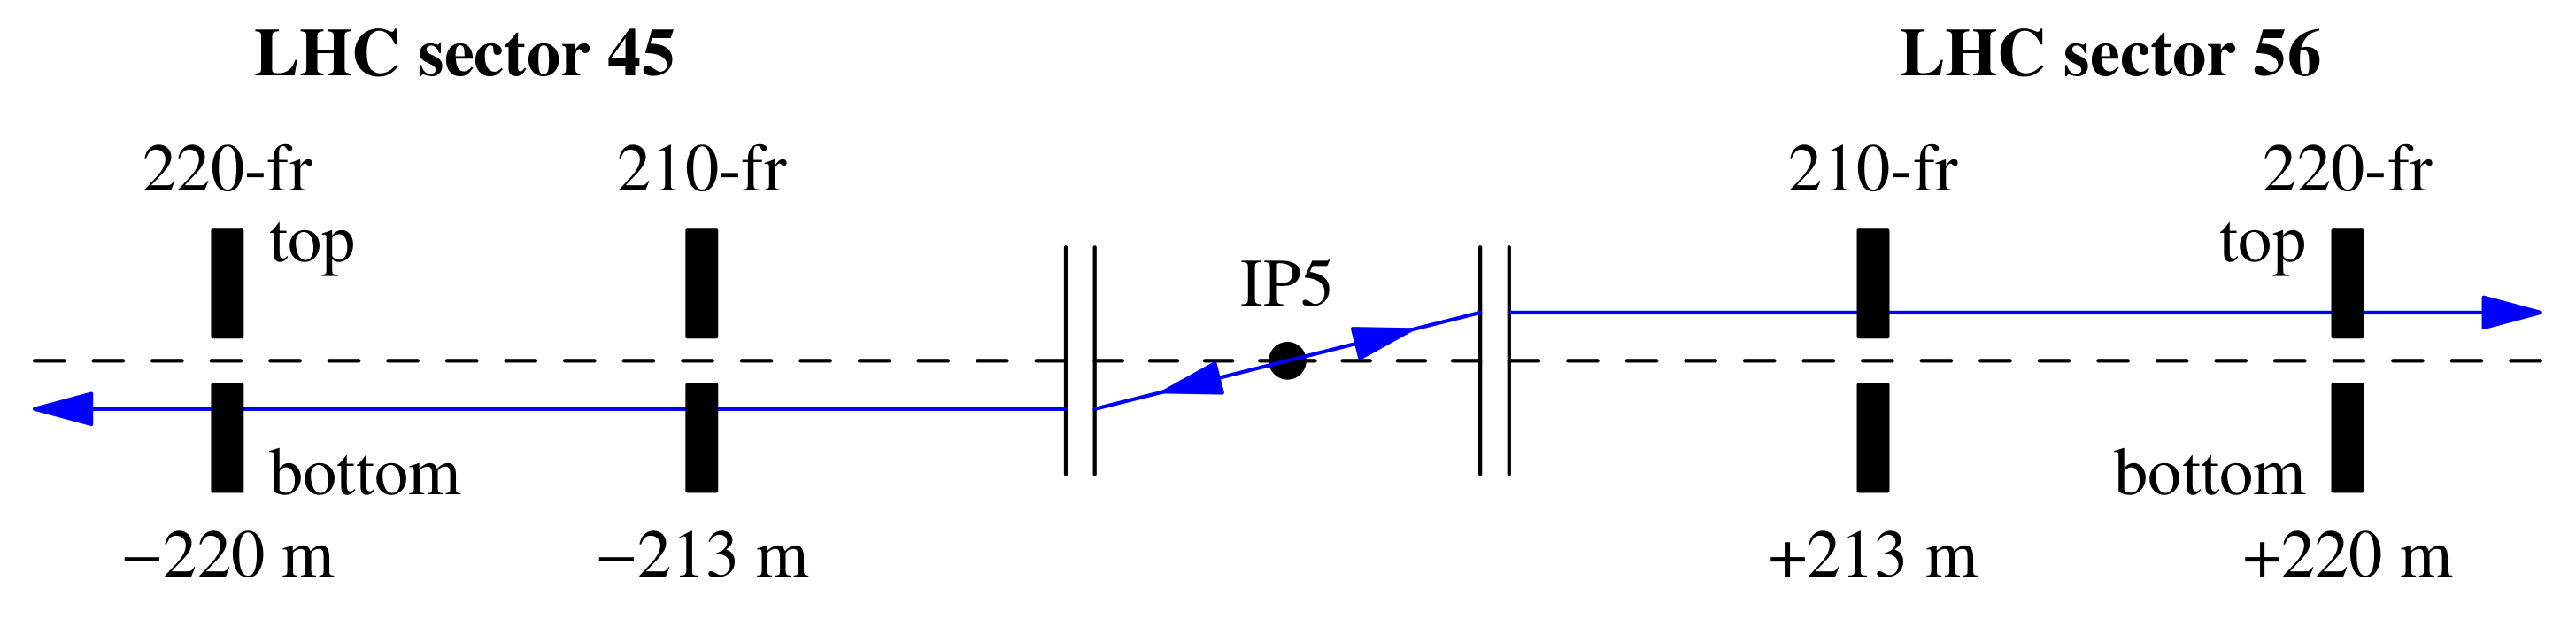
2] includes a forward proton spectrometer and two forward tracking telescopes. The proton spectrometer is composed of Roman Pot (RP) detectors, movable beam-pipe insertions capable of approaching the LHC beam to a distance of less than a millimetre, in order to detect protons with low scattering angles typical for forward hadronic processes. The RPs are placed symmetrically around the IP as shown in
Figure 1, in the LHC sector 45 (region between IP 4 and 5) and sector 56 (region between IP 5 and 6). The RPs relevant for the present article approach the LHC beams vertically and are organised in two units: “210-fr” about
from the IP and “220-fr” about
from the IP. Each RP houses 10 planes of silicon strip sensors designed specifically to reduce the insensitive area at the edge facing the beam to only a few tens of micrometers [
1].
Since elastic scattering events consist of two collinear protons emitted in opposite directions, the events detected by TOTEM RPs can have two topologies, called “diagonals”: 45 bottom–56 top (blue arrows in
Figure 1) and 45 top–56 bottom, where the numbers refer to the LHC sector.
2. Physics Motivation for TOTEM Measurements at the LHC Injection Energy
The lowest energy at which the LHC can be easily operated is the injection energy,
. TOTEM could profit from this configuration to perform several interesting physics measurements. As shown in
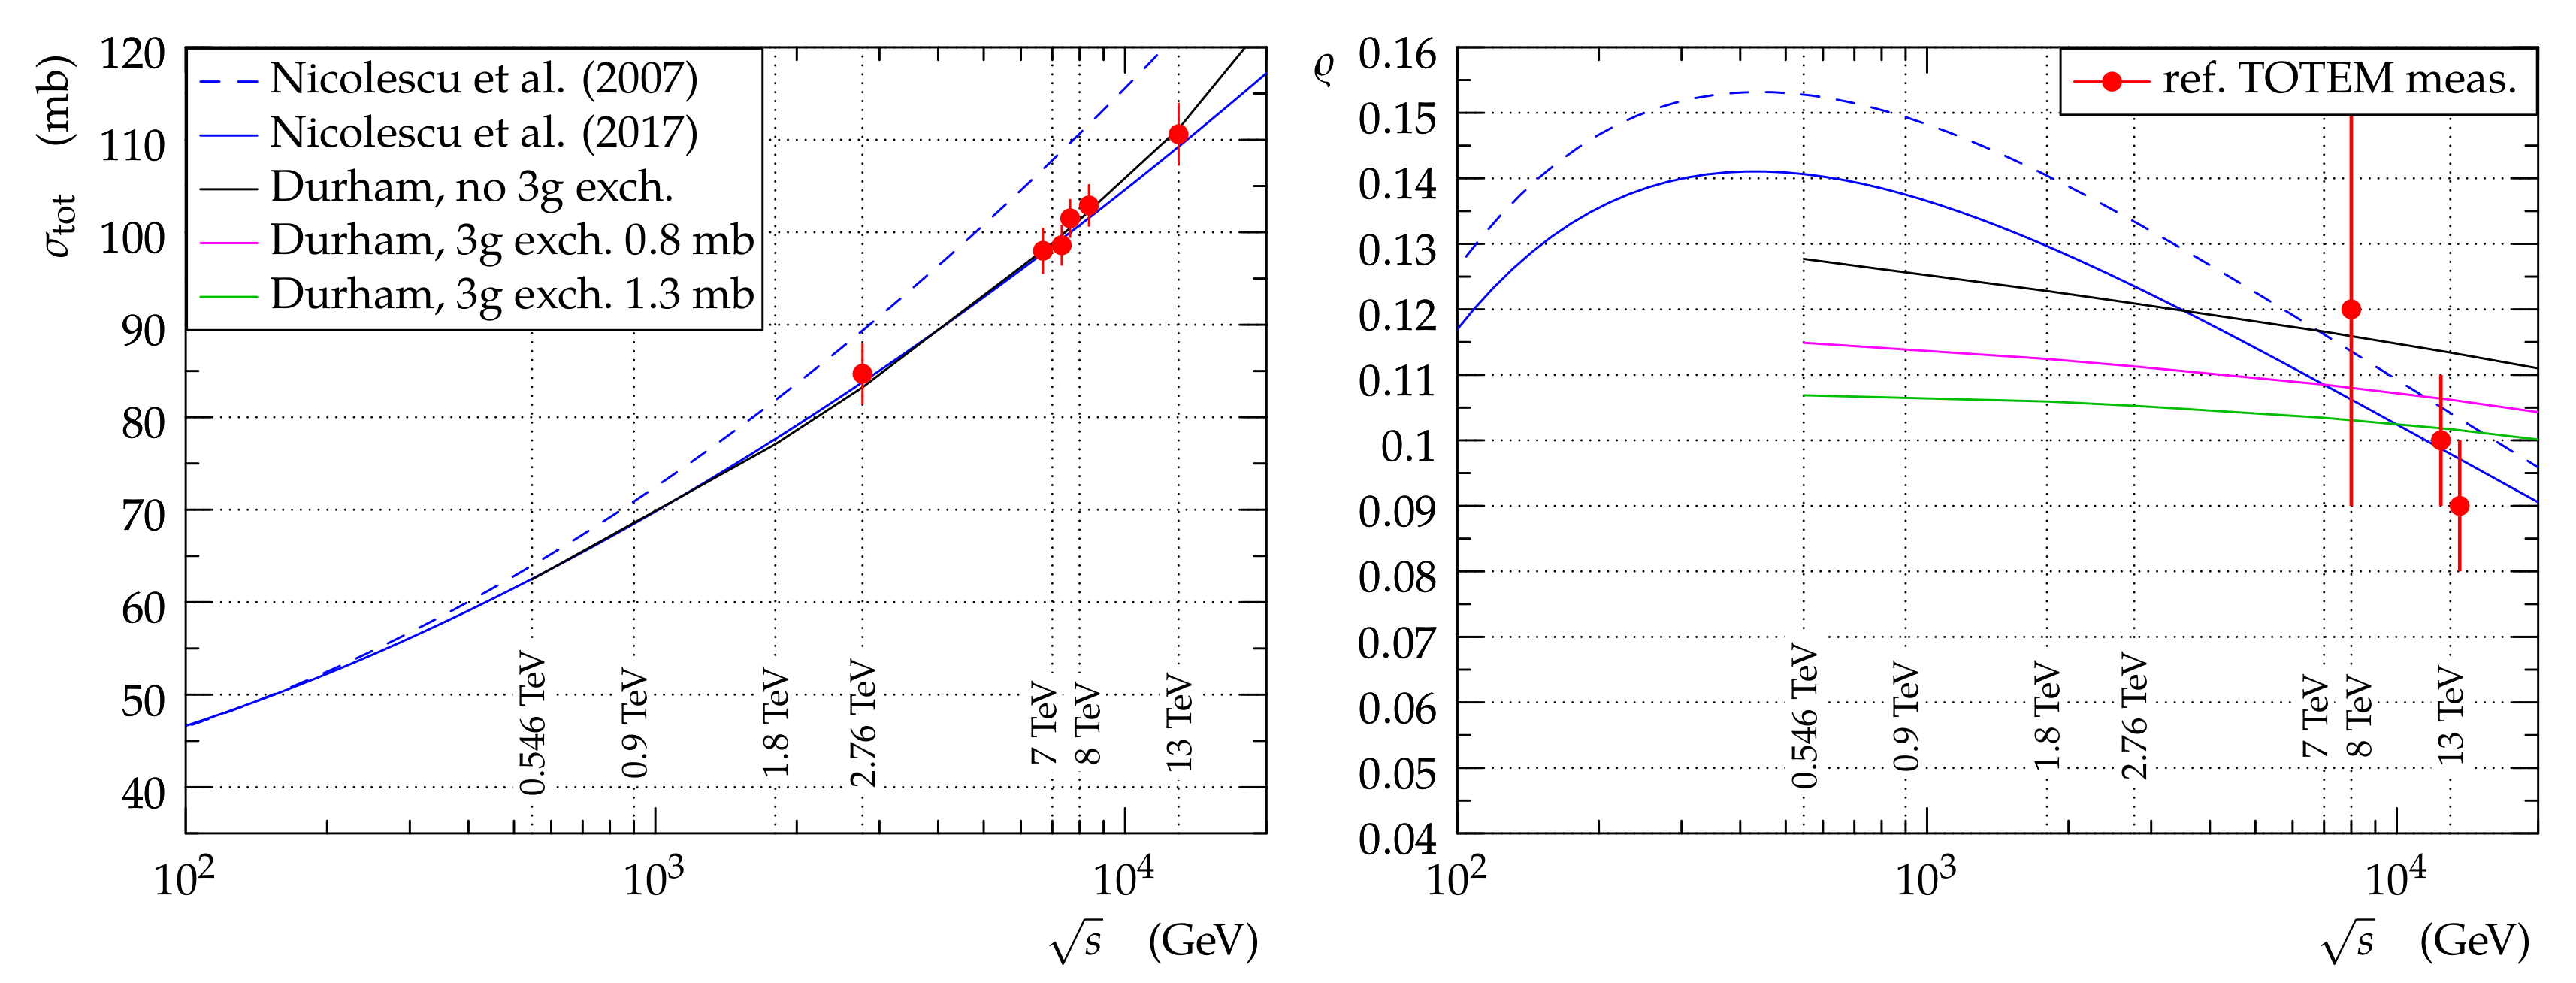
Figure 2, left, the range of total cross-section,
, measurements would extend from
to
(and possibly to
in the LHC Run III). Since all the results would come from a single experiment with a unified experimental method, it would present a valuable data set.
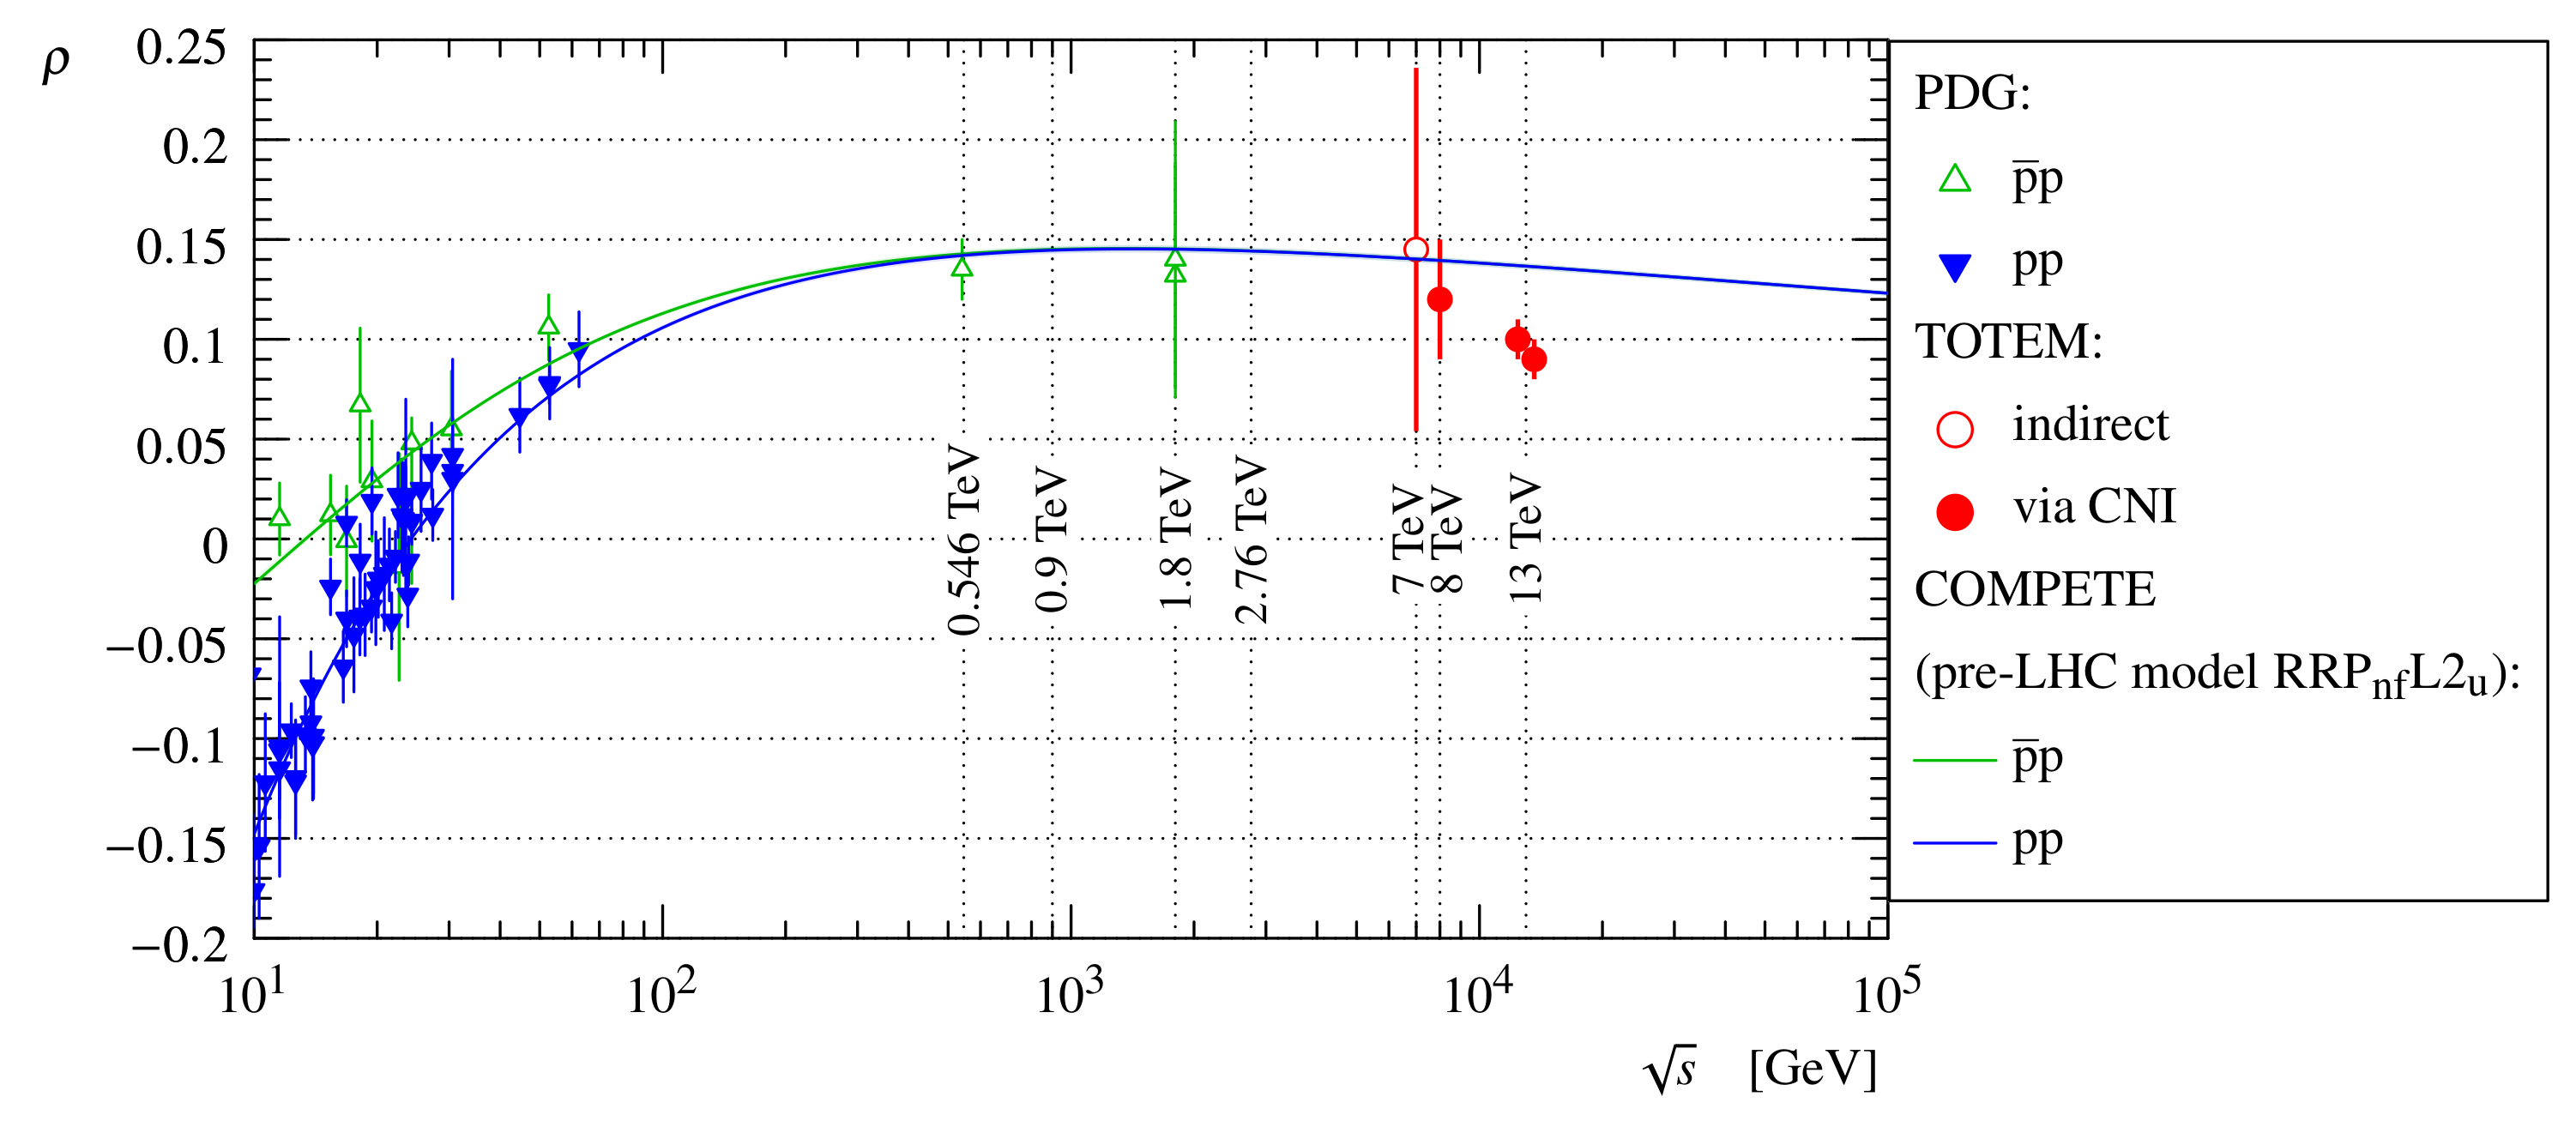
Another quantity of interest is the
parameter, the ratio of the real to the imaginary part of the forward elastic amplitude (for a historical review see e.g., Section 4.2 in Ref. [
4]).
Figure 3 shows that there are no proton-proton measurements available from
to
, thus a measurement at
would be indicative for
behaviour in the medium energy range. Furthermore, due to the proximity of a precise UA4/2 measurement [
5] an interesting
to
comparison could be made. Another argument for preferring the lowest energy possible comes from
Figure 2, right. It shows several models compatible with the present TOTEM
and
measurements. While the models give similar
value at
, their predictions differ significantly at
. Discrimination between the models should be possible with the expected
measurement precision.
3. Beam-Conditions Tests with Roman Pot Detectors
The
parameter is determined by analysing the interference between the Coulomb (electromagnetic) and nuclear (strong) components of the elastic scattering amplitudes [
3,
6]. This interference is sizeable at very low values of the four-momentum transfer squared,
. In order to reach such small
values a special LHC optics and very close approach of RPs to the beam are needed.
The special optics is typically characterised by a high
value, i.e., the betatron function at the IP (
at
[
6] and
at
[
3]). This simultaneously optimises the low
acceptance (by large vertical effective length) and
resolution (by low beam divergence), for details see e.g., Ref. [
3]. At the LHC injection energy
fulfils these requirements [
7].
The RPs typically need to be inserted to a distance of about 3 times the transverse beam size,
[
3,
6]. At such distances, RPs can be subject to background particles from various sources including beam halo or collimator-induced showers. An appropriate collimation strategy [
8] is thus essential for a successful measurement.
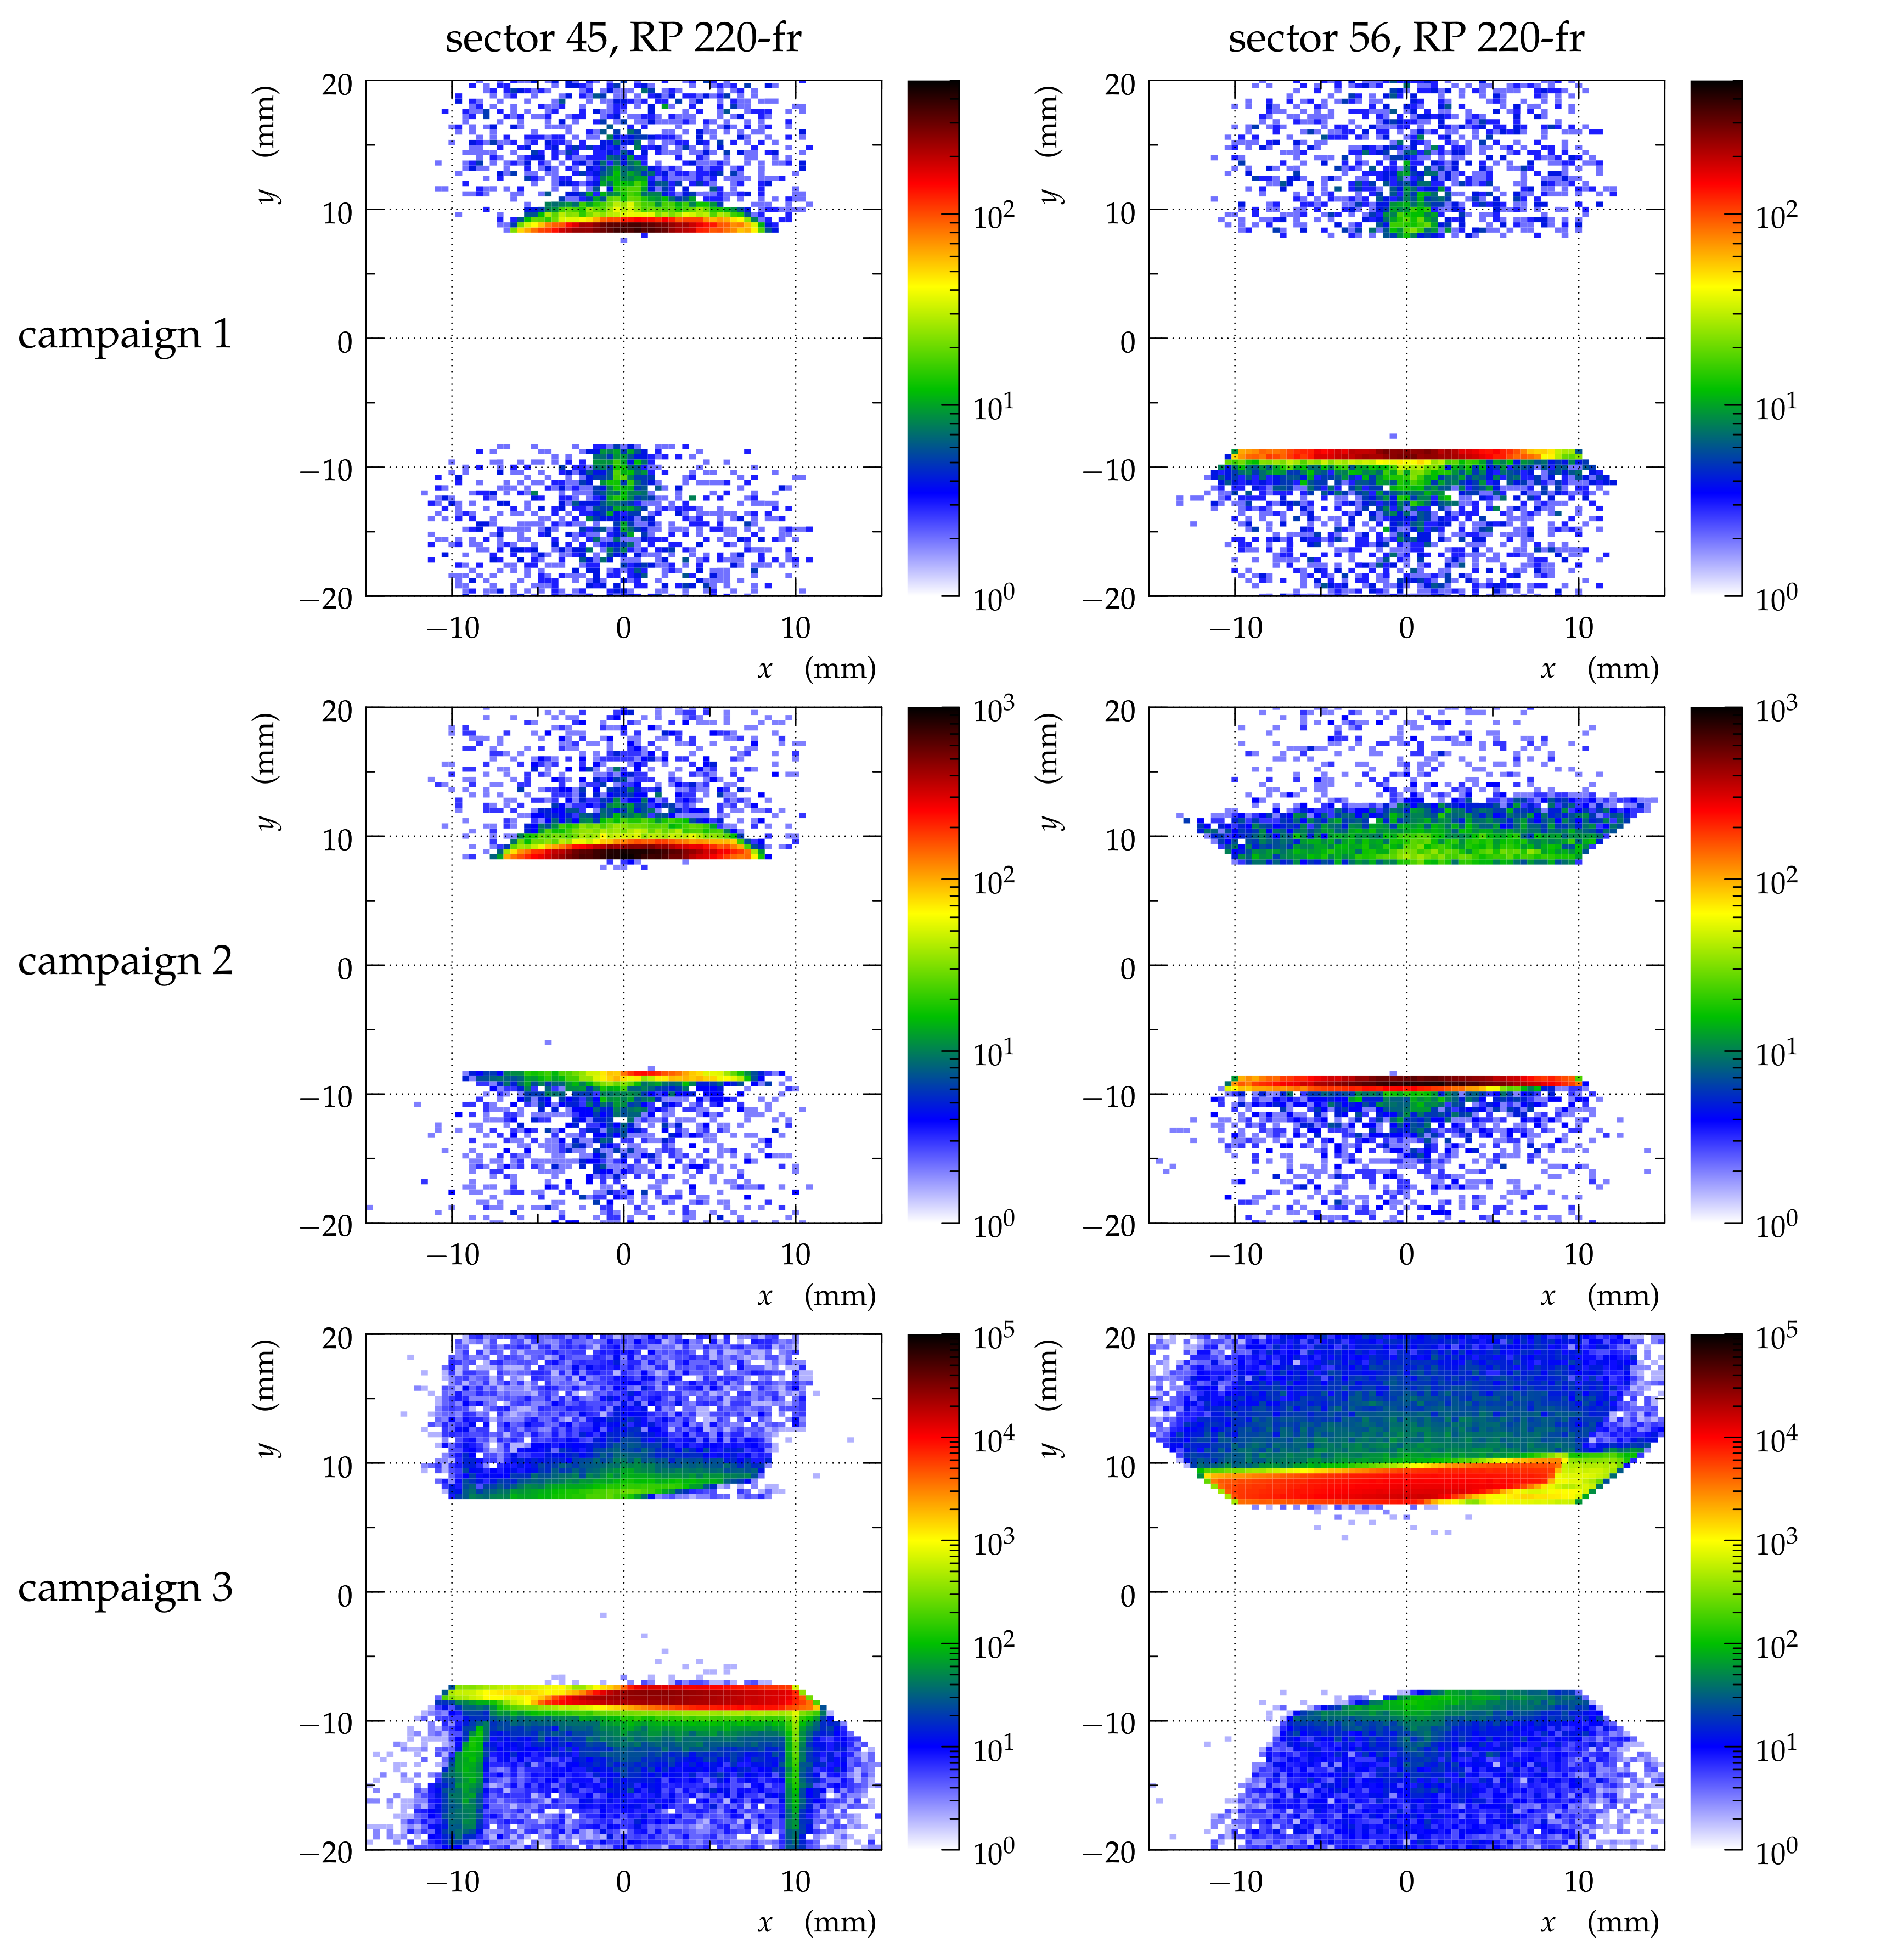
The collimation strategy for the injection energy measurements has been studied three times so far:
“campaign 1” on 8 November 2017 [
9],
“campaign 2” on 22 November 2017 [
10] and
“campaign 3” on 8 May 2018 [
11].
In each of the campaigns several tests were performed: building the collimation hierarchy with different collimators, placed at different distances from the beam. For example, in campaign 1, in the vertical plane, the collimators TCP.D6L7, TCLA.A5R3, TCTPV.4L2 and TCTPV.4L8 (see Ref. [
8] for explanation) were tried as primary collimators placed at
. These were accompanied by secondary collimators at
chosen from the same list plus the collimator TCTPV.4L5. Beyond the collimation optimisation, several other tests were performed: decreasing the bunch intensity (to prevent intra-beam scattering), increasing RF voltage (to prevent de-bunching) and verification of RP alignment (to exclude outliers). Details of the tests can be found in the LHC OP logbook [
9,
10,
11].
Figure 4 compares the most successful tests from each campaign. The expected physics signal is concentrated at
and at the sensor edge, see e.g., the top part in the top right plot. Beyond that, one can observe several background structures:
sharp horizontal bands (e.g., top part of campaign 3, sector 56),
wide round structures (e.g., top part of campaign 2, sector 45)
and vertical bands (e.g., bottom part of campaign 3, sector 45).
The occurrence, size and intensity of these structures is not reproducible from a test to another. Most likely they have origin in a non fully optimised collimation scheme, but no details neither a possible mitigation are known at the moment.
Taking the example of campaign 1 (top row in
Figure 4), elastic scattering yields
events per histogram bin in the signal region. When background structures are present (diagonal 45 top–56 bottom) they yield
events per bin and therefore background strongly dominates over signal.
4. Background Estimate
The non-physical background can be suppressed by event selection during offline analysis. This selection enforces the kinematic properties of elastic scattering: two anti-collinear protons emerging from the same vertex. The list of tagging cuts reads as follows:
cuts 1 and 2: opposite scattering angles of the protons, in horizontal and vertical plane,
cuts 5 and 6: vertical correlation between track position and angle, in sector 45 and 56,
cuts 7 and 8: same vertex of the protons, in horizontal and vertical plane,
cuts 9 and 10: horizontal correlation between track position and angle, in sector 45 and 56.
All cuts are applied at level.
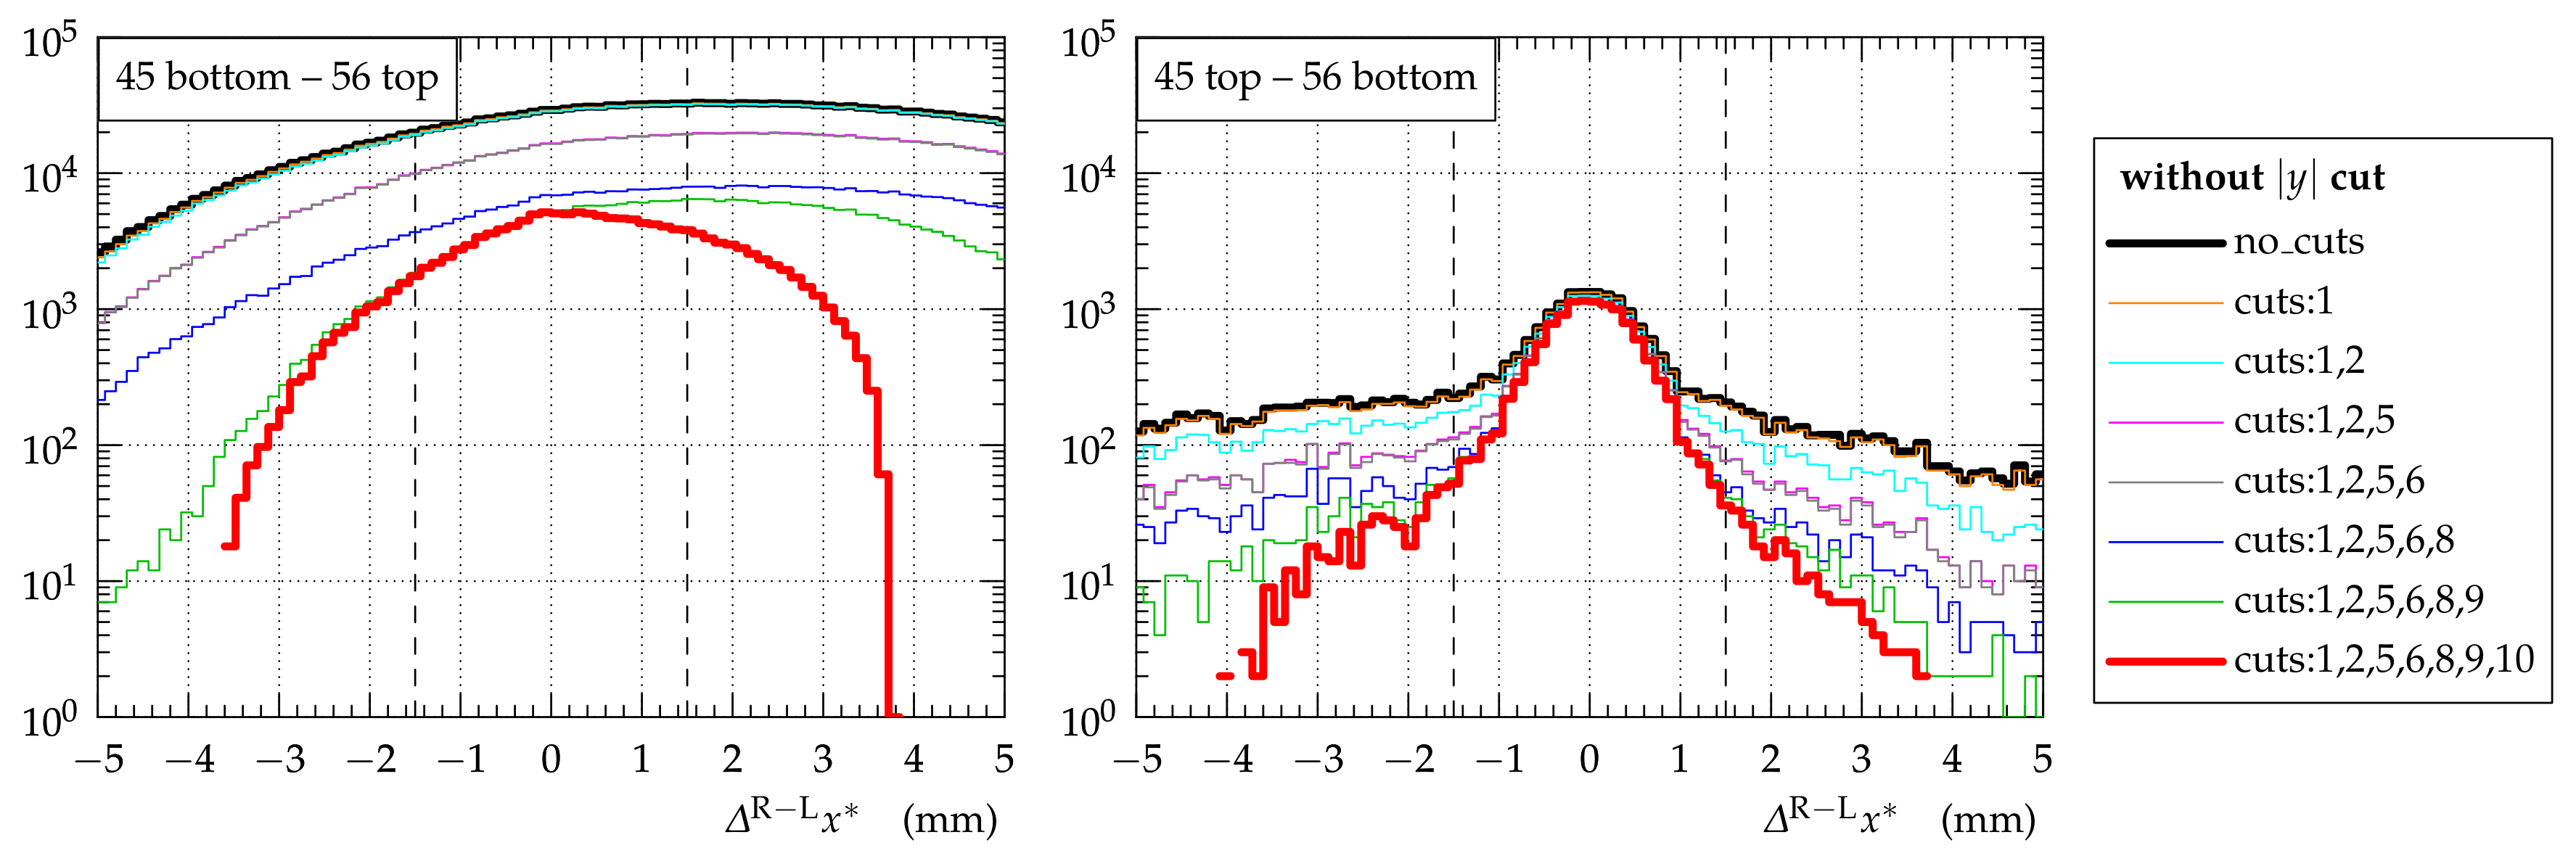
Figure 5 illustrates the effect of the tagging cuts for the most successful test of campaign 3. This dataset was chosen since one diagonal (45 top–56 bottom) provides an optimistic example while the other diagonal (45 bottom–56 top) provides a pessimistic example (cf.
Figure 4, bottom). The plots compare the distributions of the cut-7 discriminator obtained with different sets of tagging cuts. For diagonal 45 top–56 bottom, the increasing number of applied tagging cuts gradually suppresses the tails of the distributions (background) while keeping the central part (signal) almost untouched. The level of irreducible background can be estimated by interpolating the thick red histogram (after all cuts) to the signal region (in between the vertical dashed lines), yielding background/signal ratio of few percent. For the diagonal 45 bottom–56 top, the picture is completely different: even with all cuts applied (thick red histogram) the distribution shape does not correspond to the expected signal. One can conclude that the data from this diagonal are dominated by background.
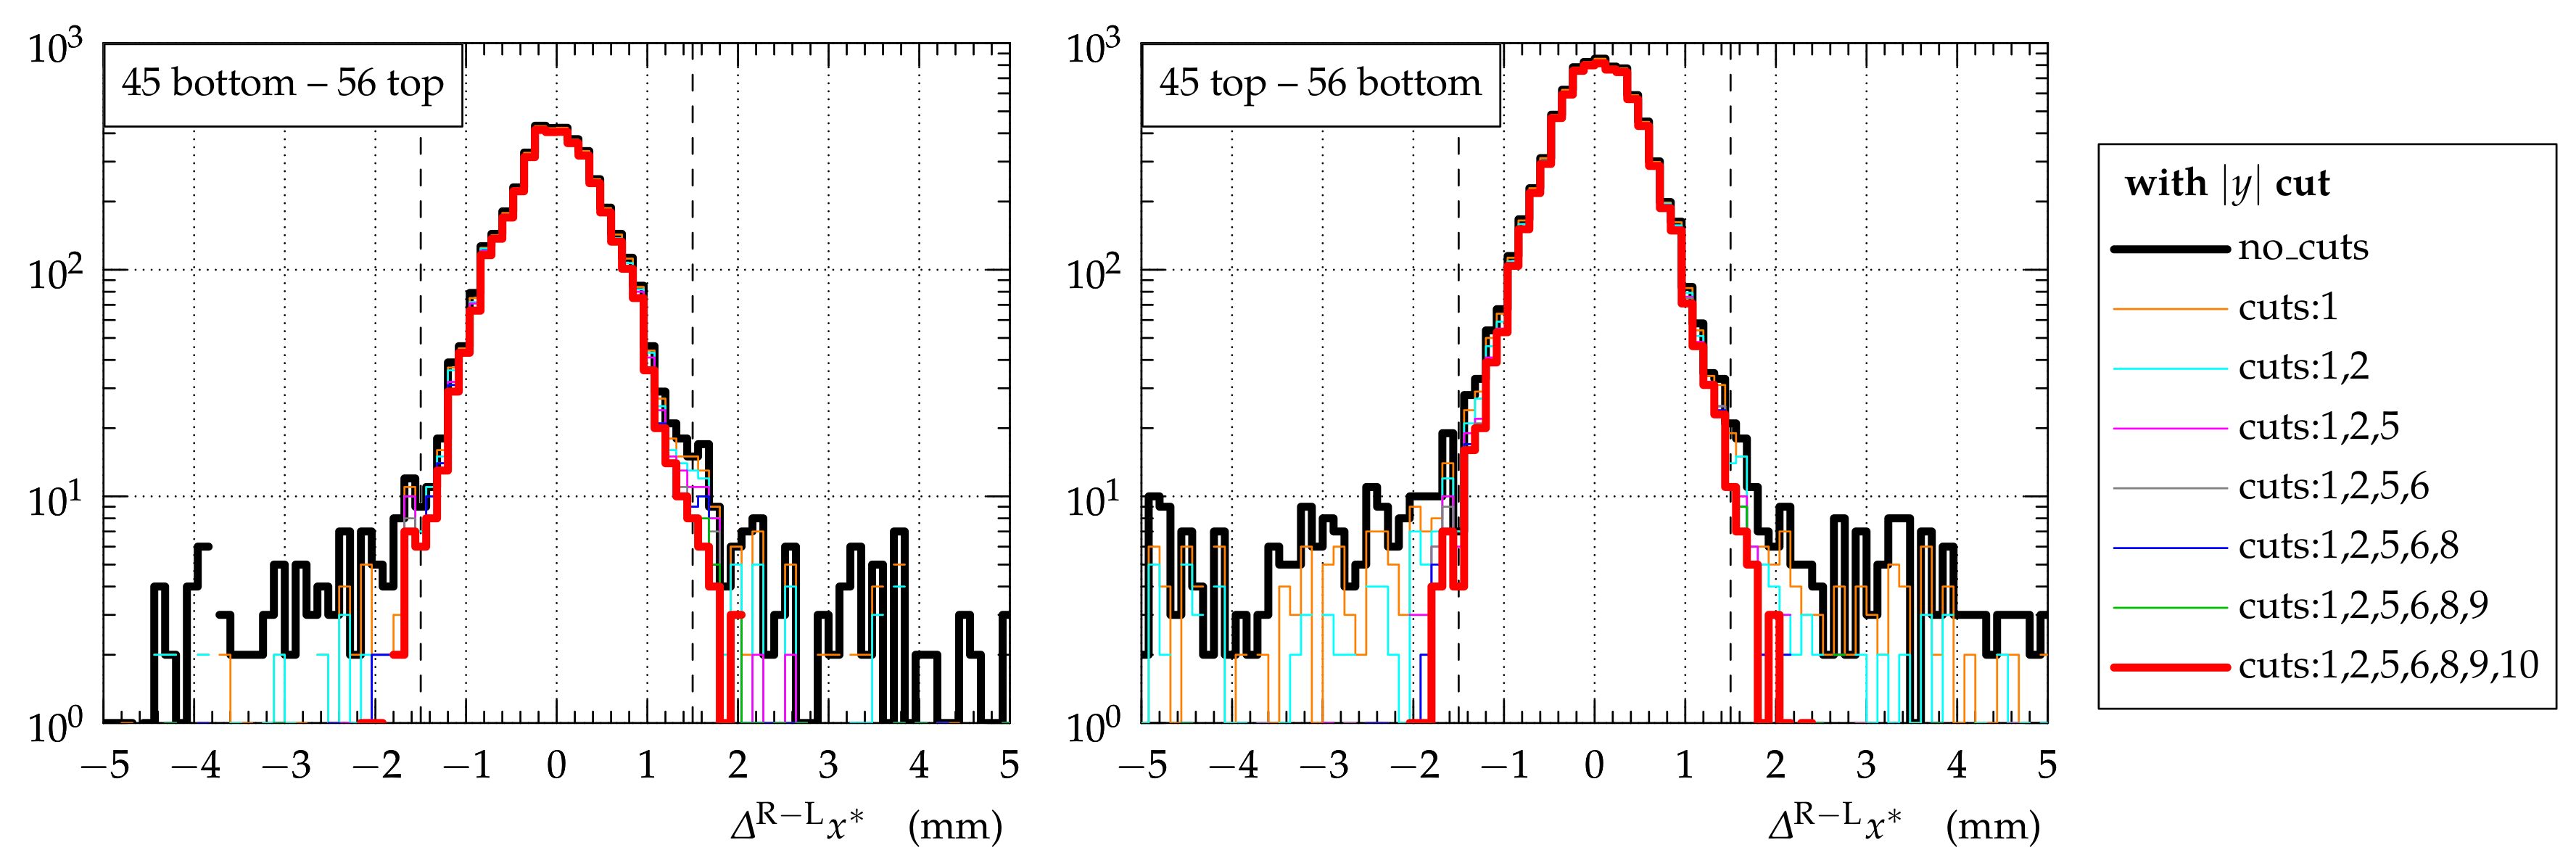
The large background component in the diagonal 45 bottom–56 top can be already seen in
Figure 4, bottom, mostly in the horizontal bands at the sensor edges. It is therefore interesting to repeat the background estimate excluding these background bands with a cut:
which would effectively correspond to a RP position of about
. This background estimate is illustrated in
Figure 6 which shows that with the
cut the irreducible background is negligible for both diagonals.
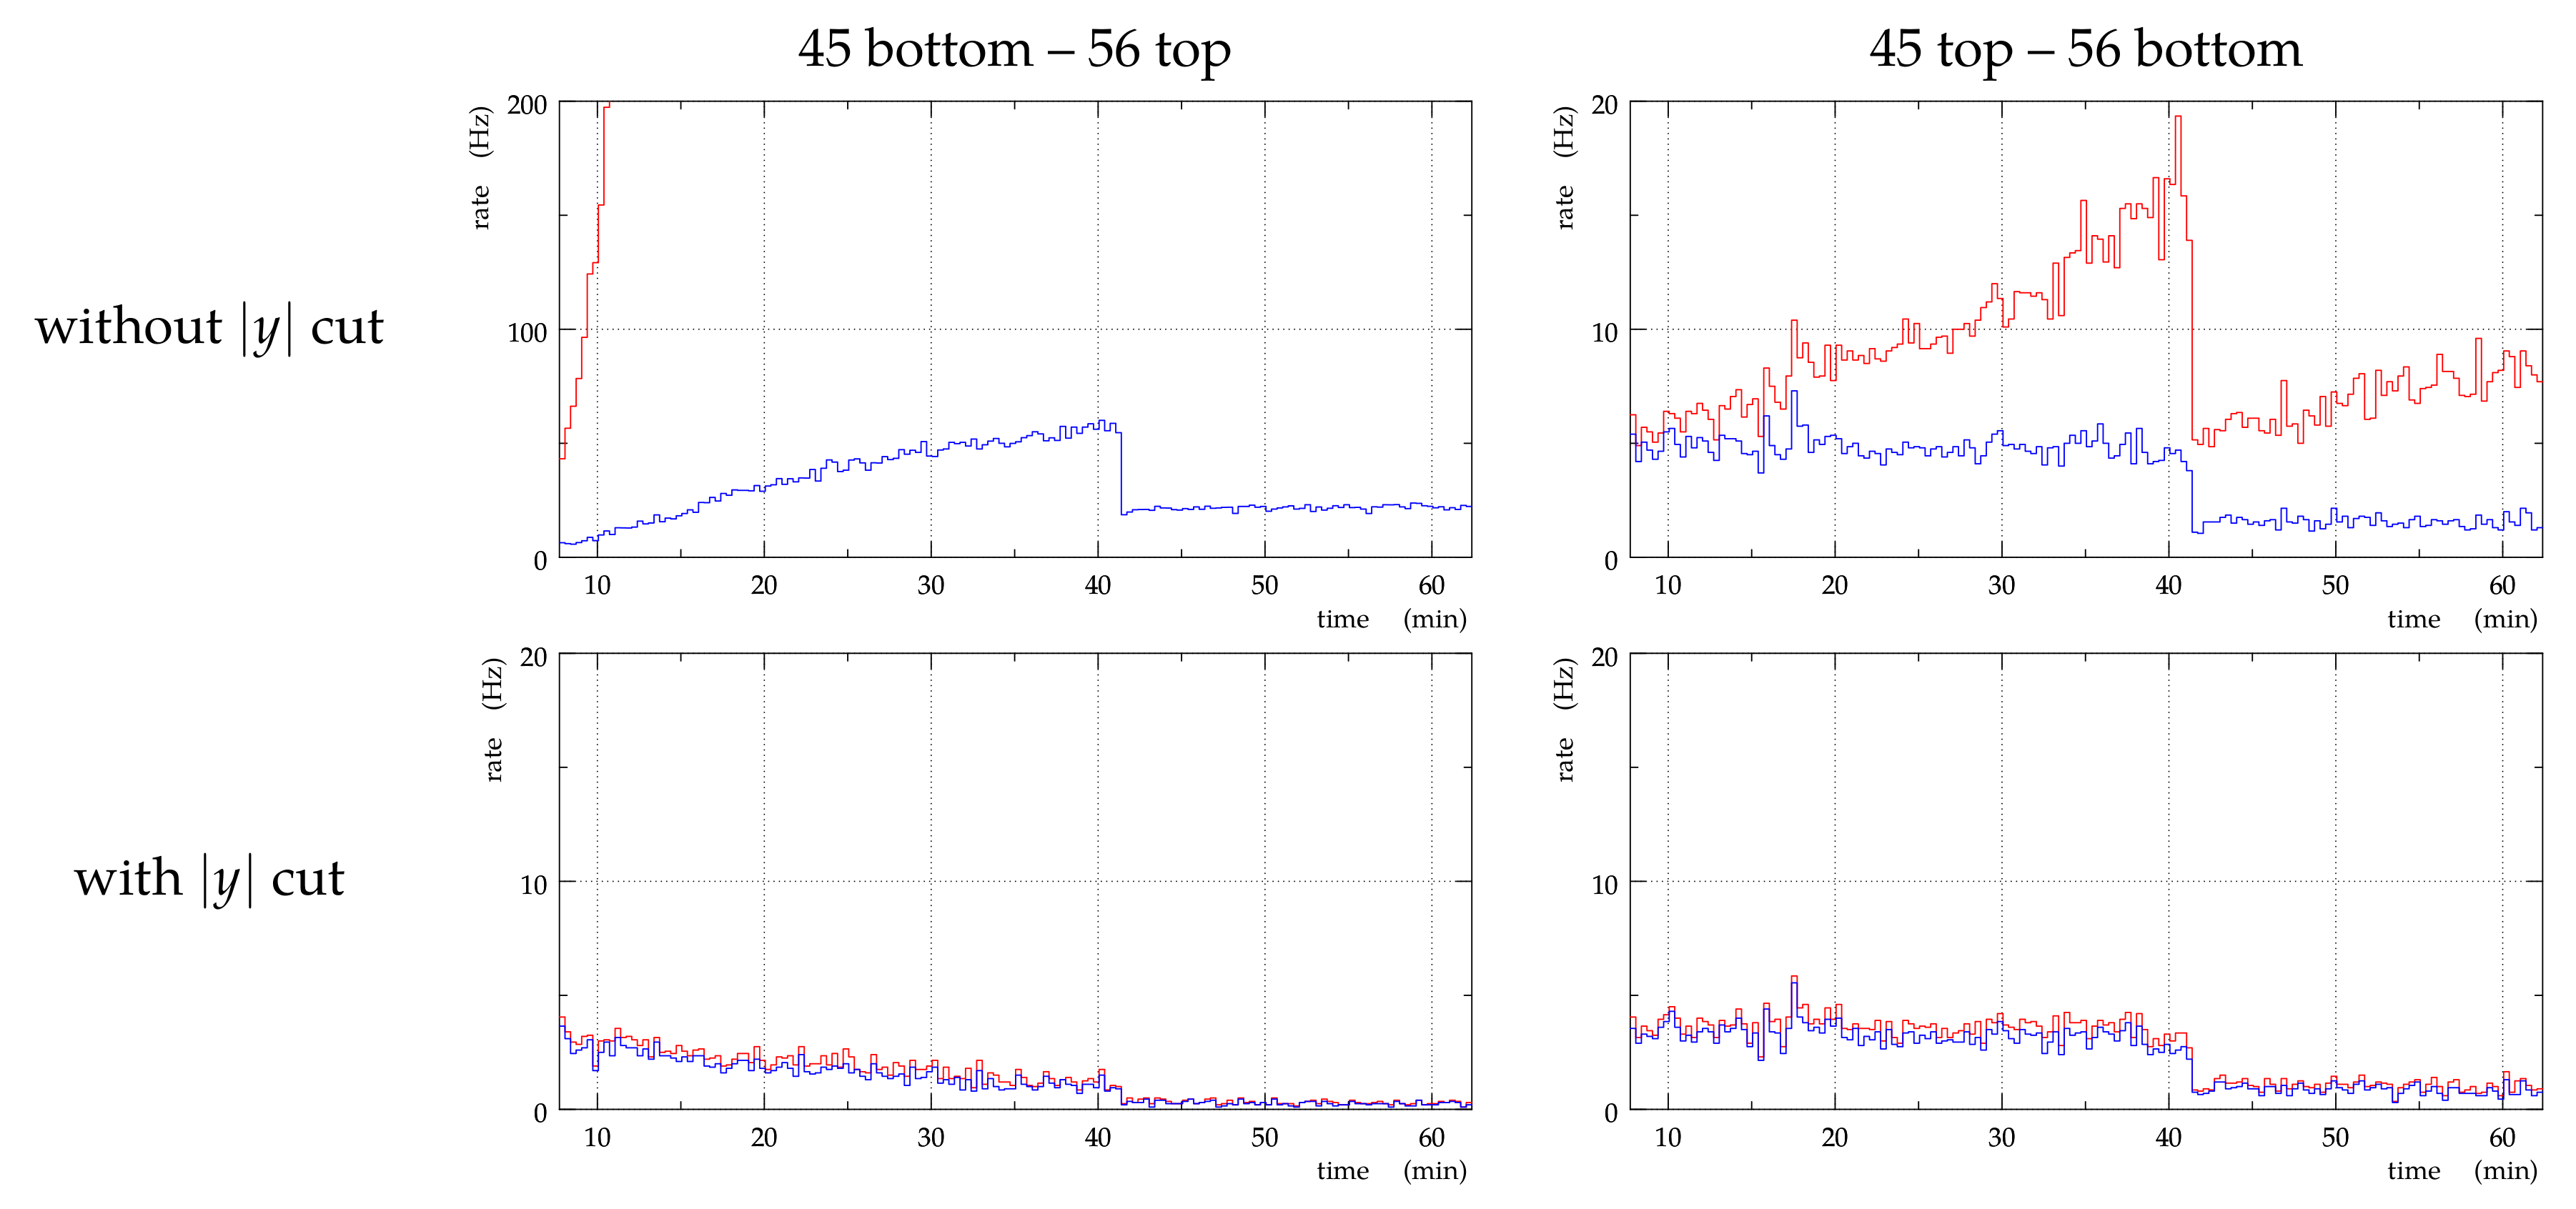
5. Rate Evolution
Figure 7 shows the evolution of rates with time for the most successful test of campaign 3—the same example as in the previous section. When no
cut is applied (top row), the rate of events with a diagonal topology (red) grew very fast for the diagonal 45 bottom–56 top. This led to saturation of trigger bandwidth and a necessity to change the trigger configuration which is visible as a discontinuity in the histograms at the time about 42 min. For the diagonal 45 top–56 bottom the red histogram grew, too, but the tagging cuts were able to remove most of the increasing background and thus the corresponding blue histogram is independent of time (up to the discontinuity due to the trigger configuration change).
When the cut is applied (bottom row), the red and blue histograms are very similar, confirming the conclusion of low residual background from the previous section. For the diagonal 45 top–56 bottom the histograms are flat (up to the discontinuity due to the trigger configuration change) as expected. For the diagonal 45 bottom–56 top the rate decreases with time. This can be explained by increasing inefficiency of track reconstruction—increasing rate of background particles also increases the probability of impeding the reconstruction of the elastic protons.
6. Summary
The first tests with RPs at demonstrated serious challenges with beam background when RPs were inserted to . Most often the background appears as horizontal bands close to the sensor edges. The background tends to dominate over the physics signal and cannot be eliminated by standard tagging cuts. The background was present in all three test campaigns, however it had different sizes and intensities in different tests. The background is not reproducible from a test to another. Most likely the background is due to a non fully optimised collimation scheme, but no further details are yet known. In two tests there was one diagonal with a background level compatible with physics requirements. This shows that low-background configuration can be achieved.
Simulating an additional RP position margin of about (thus RP position ) in the offline analysis brings the background to a level which can be handled with the conventional tagging cuts and is thus appropriate for physics data-taking. The additional margin would reduce the RP acceptance from to which most likely would not compromise the measurement.
TOTEM encourages further studies and developments of the collimation schemes for high optics at the LHC injection energy. If successful, this would allow TOTEM to take data with RPs at about which maximises physics sensitivity. Taking data with RPs at about remains a viable but less attractive option.

