

Comparison of Different Methods for Evaluating Quantitative X-ray Fluorescence Data in Copper-Based Artefacts

 ,
,
Abstract
1. Introduction
2. Results
3. Discussion
4. Materials and Methods
4.1. Reference Materials
4.2. Calibration Procedures
4.2.1. Off-Line PyMca Calibration
4.2.2. Customized Bruker Calibration
4.2.3. Bruker Built-In Calibration
4.3. Statistical Techniques
4.4. Instrumentation
5. Conclusions
Author Contributions
Funding
Data Availability Statement
Acknowledgments
Conflicts of Interest
References
- Shackley, M.S. An Introduction to X-Ray Fluorescence (XRF) Analysis in Archaeology. In X-ray Fluorescence Spectrometry (XRF) in Geoarchaeology; Shackley, M.S., Ed.; Springer: New York, NY, USA, 2011; pp. 7–44. ISBN 978-1-4419-6885-2. [Google Scholar]
- Liritzis, I.; Zacharias, N. Portable XRF of Archaeological Artifacts: Current Research, Potentials and Limitations. In X-ray Fluorescence Spectrometry (XRF) in Geoarchaeology; Shackley, M.S., Ed.; Springer: New York, NY, USA, 2011; pp. 109–142. ISBN 978-1-4419-6885-2. [Google Scholar]
- Analytical Methods Committee AMCTB No. 108. Hand-Held X-ray Fluorescence Analysis of Archaeological Artefacts: Challenges, Advantages and Limitations. Anal. Methods 2021, 13, 3731–3734. [Google Scholar] [CrossRef]
- Piorek, S. Handheld X-ray Fluorescence (HHXRF). In Portable Spectroscopy and Spectrometry; Crocombe, R., Leary, P., Kammrath, B., Eds.; Wiley: Hoboken, NJ, USA, 2021; pp. 423–453. ISBN 978-1-119-83557-8. [Google Scholar]
- Ferretti, M. The Investigation of Ancient Metal Artefacts by Portable X-ray Fluorescence Devices. J. Anal. At. Spectrom. 2014, 29, 1753–1766. [Google Scholar] [CrossRef]
- Karydas, A.G. Application of a Portable XRF Spectrometer for the Non-Invasive analysis of Museum Metal Artefacts. Ann. Di Chim. 2007, 97, 419–432. [Google Scholar] [CrossRef]
- Charalambous, A.; Kassianidou, V.; Papasavvas, G. A Compositional Study of Cypriot Bronzes Dating to the Early Iron Age Using Portable X-ray Fluorescence Spectrometry (pXRF). J. Archaeol. Sci. 2014, 46, 205–216. [Google Scholar] [CrossRef]
- Vianello, A.; Tykot, R.H. Investigating Technological Changes in Copper-Based Metals Using Portable XRF Analysis. A Case Study in Sicily. Open Archaeol. 2017, 3, 392–408. [Google Scholar] [CrossRef]
- Colacicchi Alessandri, O.; Caruso, G.; Orazi, N.; Ferretti, M. A Technical Examination of the Great Bronzes of the Museo Nazionale Romano. Stud. Conserv. 2023, 68, 326–342. [Google Scholar] [CrossRef]
- Ferrence, S.; Giumlia-mair, A. Bronze Age Metal Objects from East Crete, Greece. ISIJ Int. 2014, 54, 1139–1146. [Google Scholar] [CrossRef]
- Fernandes, R.; Van Os, B.J.; Huisman, H.D. The Use of Hand-Held XRF for Investigating the Composition and Corrosion of Roman Copper-Alloyed Artefacts. Herit. Sci. 2013, 1, 30. [Google Scholar] [CrossRef]
- Nicholas, M.; Manti, P. Testing the Applicability of Handheld Portable XRF to the Characterisation of Archaeological Copper Alloys. In Proceedings of the ICOM-CC 17th Triennial Conference Preprints, Melbourne, Australia, 15–19 September 2014; p. 13. [Google Scholar]
- Markowicz, A. An Overview of Quantification Methods in Energy-Dispersive X-ray Fluorescence Analysis. Pramana—J. Phys. 2011, 76, 321–329. [Google Scholar] [CrossRef]
- Beckhoff, B.; Kanngießer, B.; Langhoff, N.; Wedell, R.; Wolff, H. Handbook of Practical X-ray Fluorescence Analysis; Springer: Berlin/Heidelberg, Germany, 2006; ISBN 978-3-540-28603-5. [Google Scholar]
- Sitko, R. Quantitative X-ray Fluorescence Analysis of Samples of Less than ‘Infinite Thickness’: Difficulties and Possibilities. Spectrochim. Acta Part B At. Spectrosc. 2009, 64, 1161–1172. [Google Scholar] [CrossRef]
- Van Grieken, R.; Markowicz, A. Handbook of X-ray Spectrometry; CRC Press: Boca Raton, FL, USA, 2001; ISBN 978-0-429-20827-0. [Google Scholar]
- Andermann, G.; Kemp, J.W. Scattered X-rays as Internal Standards in X-ray Emission Spectroscopy. Anal. Chem. 1958, 30, 1306–1309. [Google Scholar] [CrossRef]
- Lucas-Tooth, H.J.; Price, B.J. A Mathematical Method for the Investigation of Interelement Effects in X-ray Fluorescence Analysis. Metallurgia 1961, 64, 149–161. [Google Scholar]
- Lucas-Tooth, J.; Pyne, C. The Accurate Determination of Major Constituents by X-ray Fluorescent Analysis in the Presence of Large Interelement Effects. Adv. X-ray Anal. 1963, 7, 523–541. [Google Scholar] [CrossRef]
- Sherman, J. The Theoretical Derivation of Fluorescent X-ray Intensities from Mixtures. Spectrochim. Acta 1955, 7, 283–306. [Google Scholar] [CrossRef]
- Shiraiwa, T.; Fujino, N. Theoretical Calculation of Fluorescent X-ray Intensities in Fluorescent X-ray Spectrochemical Analysis. Jpn. J. Appl. Phys. 1966, 5, 886. [Google Scholar] [CrossRef]
- Sitko, R.; Zawisz, B. Quantification in X-ray Fluorescence Spectrometry. In X-ray Spectroscopy; Sharma, S.K., Ed.; InTech: London, UK, 2012; ISBN 978-953-307-967-7. [Google Scholar]
- Elam, W.T.; Shen, R.B.; Scruggs, B.; Nicolosi, J. Accuracy of Standardless FP Analysis of Bulk and Thin Film Samples Using a New Atomic Database. Adv. X-ray Anal. 2004, 47, 104–109. [Google Scholar]
- Mantler, M.; Kawahara, N. How Accurate Are Modern Fundamental Parameter Methods? Rigaku J. 2004, 21, 17–25. [Google Scholar]
- Sitko, R. Influence of X-ray Tube Spectral Distribution on Uncertainty of Calculated Fluorescent Radiation Intensity. Spectrochim. Acta Part B At. Spectrosc. 2007, 62, 777–786. [Google Scholar] [CrossRef]
- Martindale Johnson, L.R.; Ferguson, J.R.; Freund, K.P.; Drake, L.; Duke, D. Evaluating Obsidian Calibration Sets with Portable X-ray Fluorescence (ED-XRF) Instruments. J. Archaeol. Sci. Rep. 2021, 39, 103126. [Google Scholar] [CrossRef]
- Heginbotham, A.; Bassett, J.; Bourgarit, D.; Eveleigh, C.; Glinsman, L.; Hook, D.; Smith, D.; Speakman, R.J.; Shugar, A.; Van Langh, R. The Copper CHARM Set: A New Set of Certified Reference Materials for the Standardization of Quantitative X-ray Fluorescence Analysis of Heritage Copper Alloys*: The Copper CHARM Set. Archaeometry 2015, 57, 856–868. [Google Scholar] [CrossRef]
- Solé, V.A.; Papillon, E.; Cotte, M.; Walter, P.; Susini, J. A Multiplatform Code for the Analysis of Energy-Dispersive X-ray Fluorescence Spectra. Spectrochim. Acta Part B At. Spectrosc. 2007, 62, 63–68. [Google Scholar] [CrossRef]
- Porcinai, S.; Cagnini, A.; Galeotti, M.; Ferretti, M. Quantitative Analysis of Copper Alloys by Means of Portable X-ray Fluorescence: A Comparison between Analysis of Shavings and Surfaces. Spectrochim. Acta Part B At. Spectrosc. 2023, 210, 106808. [Google Scholar] [CrossRef]
- Heginbotham, A.; Solé, V.A. CHARMed PyMca, Part I: A Protocol for Improved Inter-laboratory Reproducibility in the Quantitative ED-XRF Analysis of Copper Alloys. Archaeometry 2017, 59, 714–730. [Google Scholar] [CrossRef]
- Konstantakopoulou, E.; Casanova Municchia, A.; Ferretti, R.; Porcinai, S.; Ferretti, M. Quantitative Criteria to Configure and Characterise Portable X-ray Fluorescence Spectrometers. In Proceedings of the 2023 IMEKO TC-4 International Conference on Metrology for Archaeology and Cultural Heritage, Rome, Italy, 19–21 October 2023; pp. 704–708. [Google Scholar]


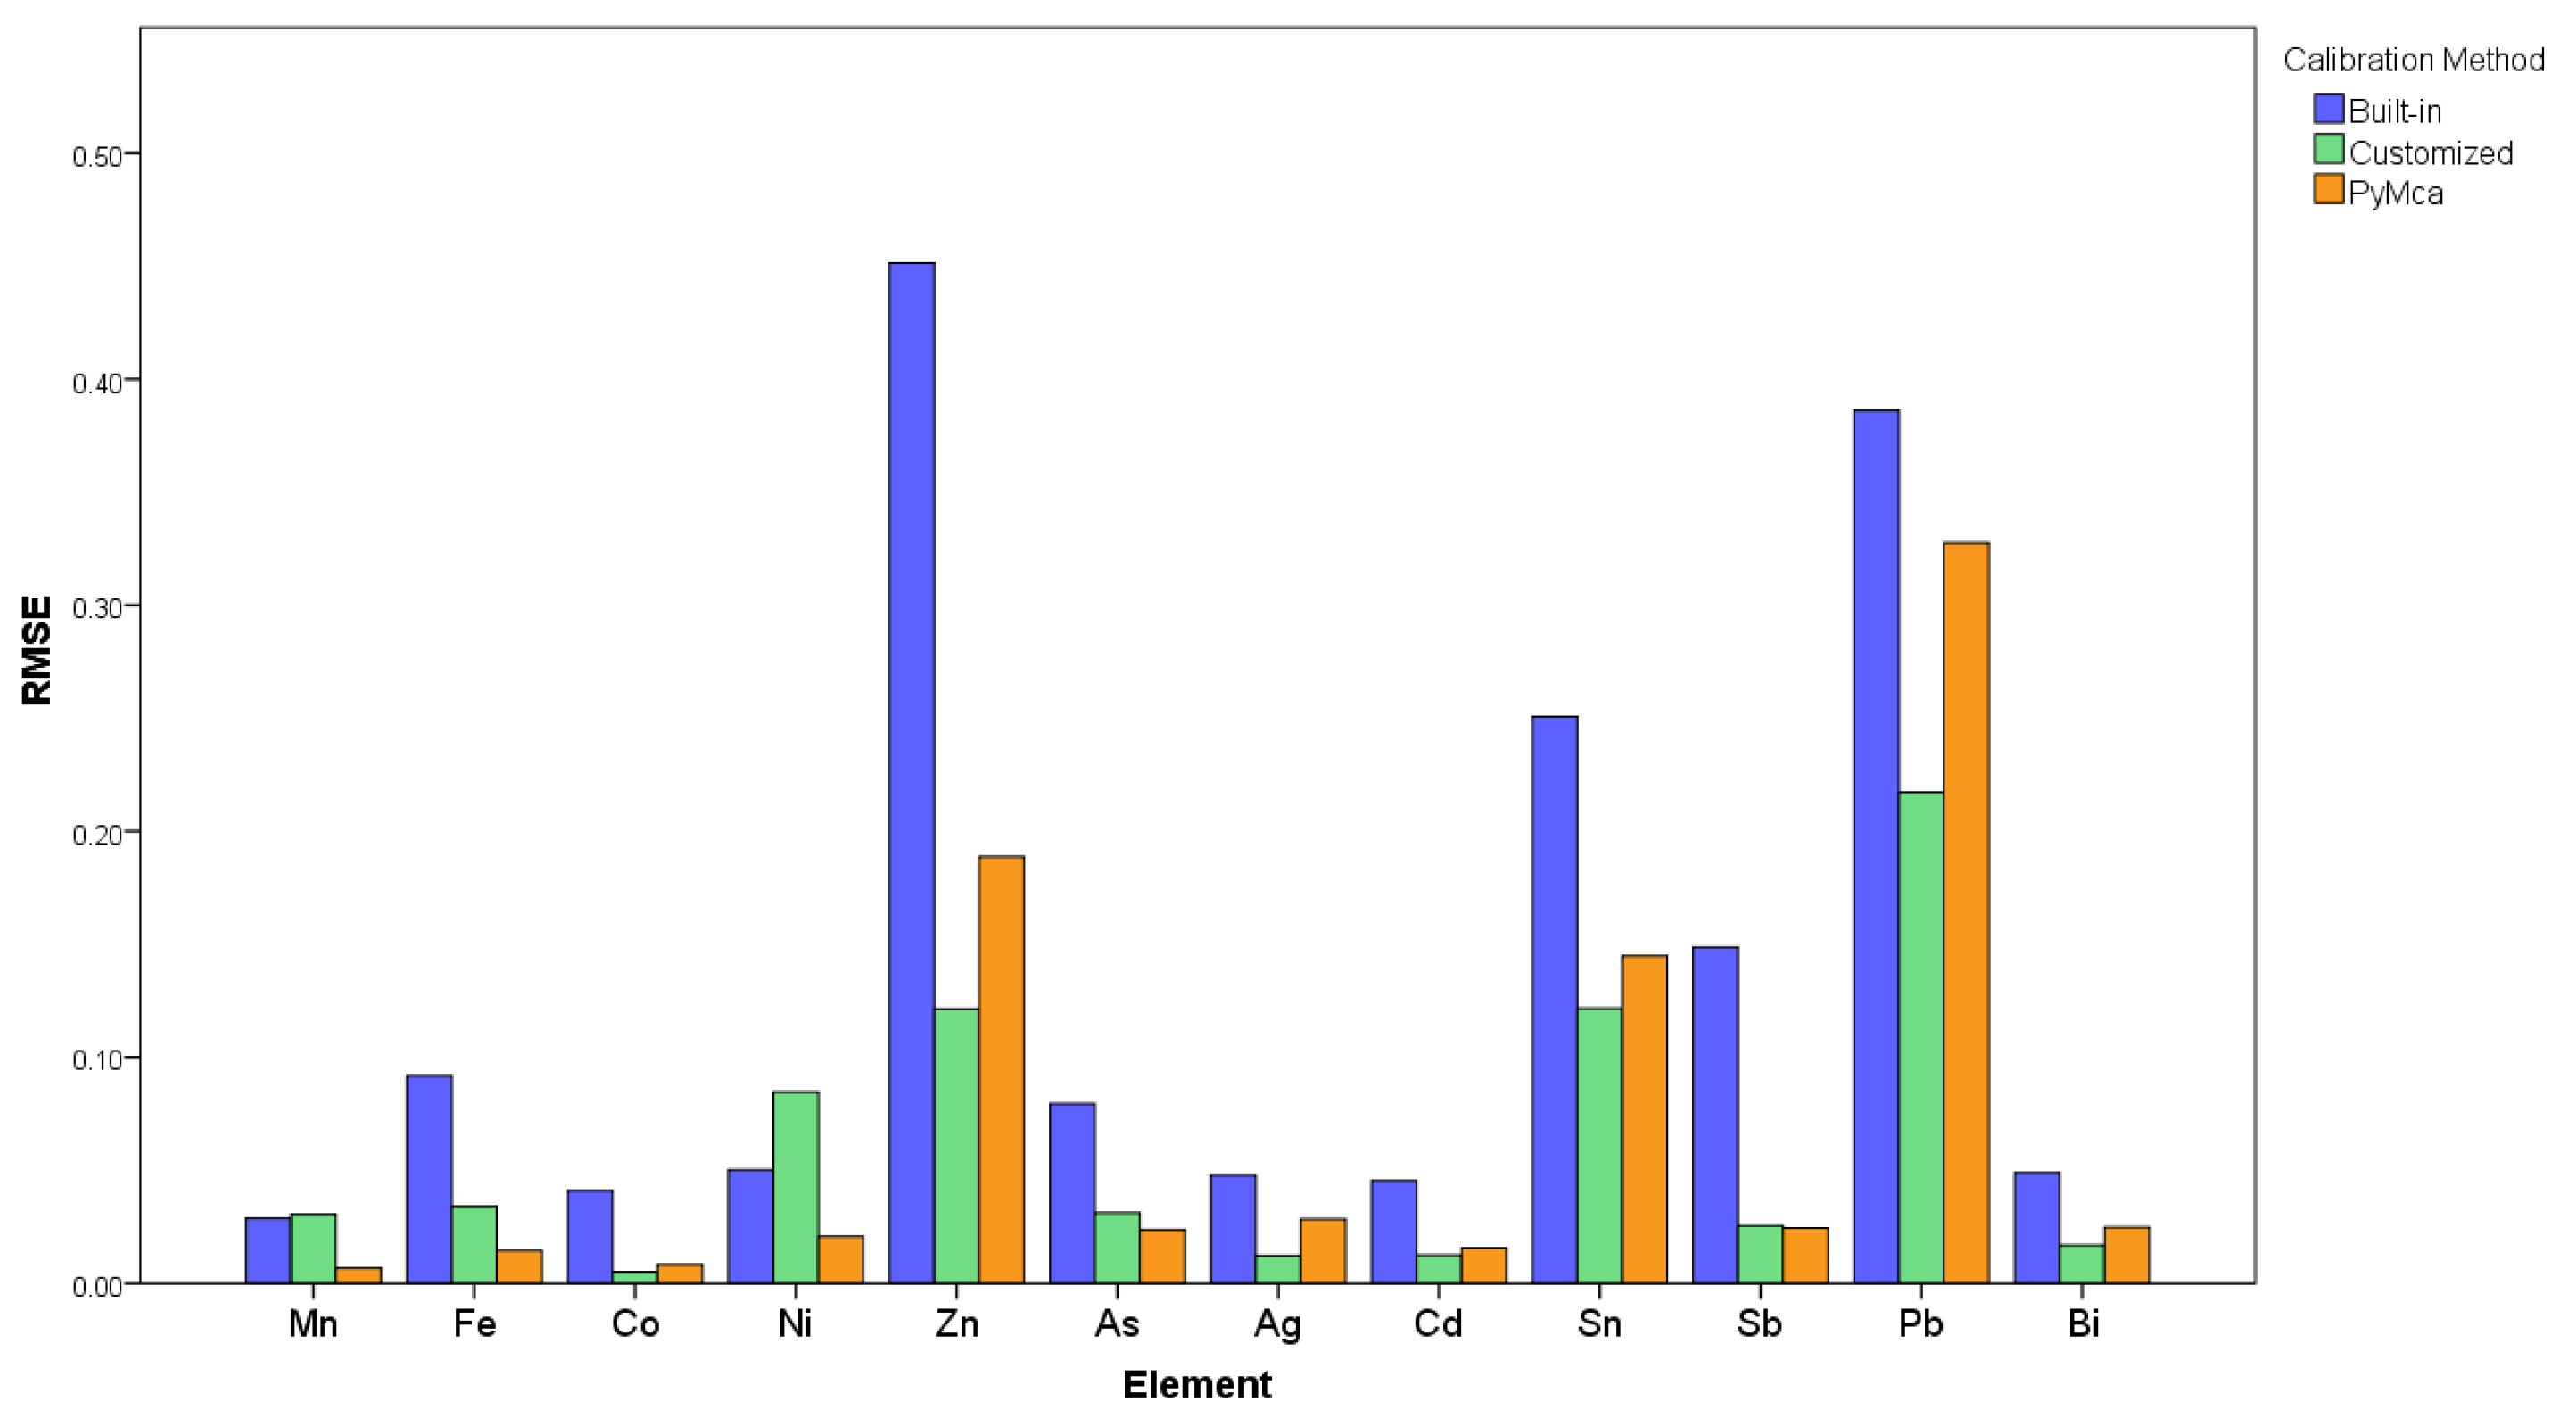
| Element | Calibration Procedure | R2 | RMSE |
|---|---|---|---|
| Mn | Off-Line PyMca | 0.998 | 0.007 |
| Customized Bruker | 0.953 | 0.031 | |
| Bruker Built-in | 0.926 | 0.029 | |
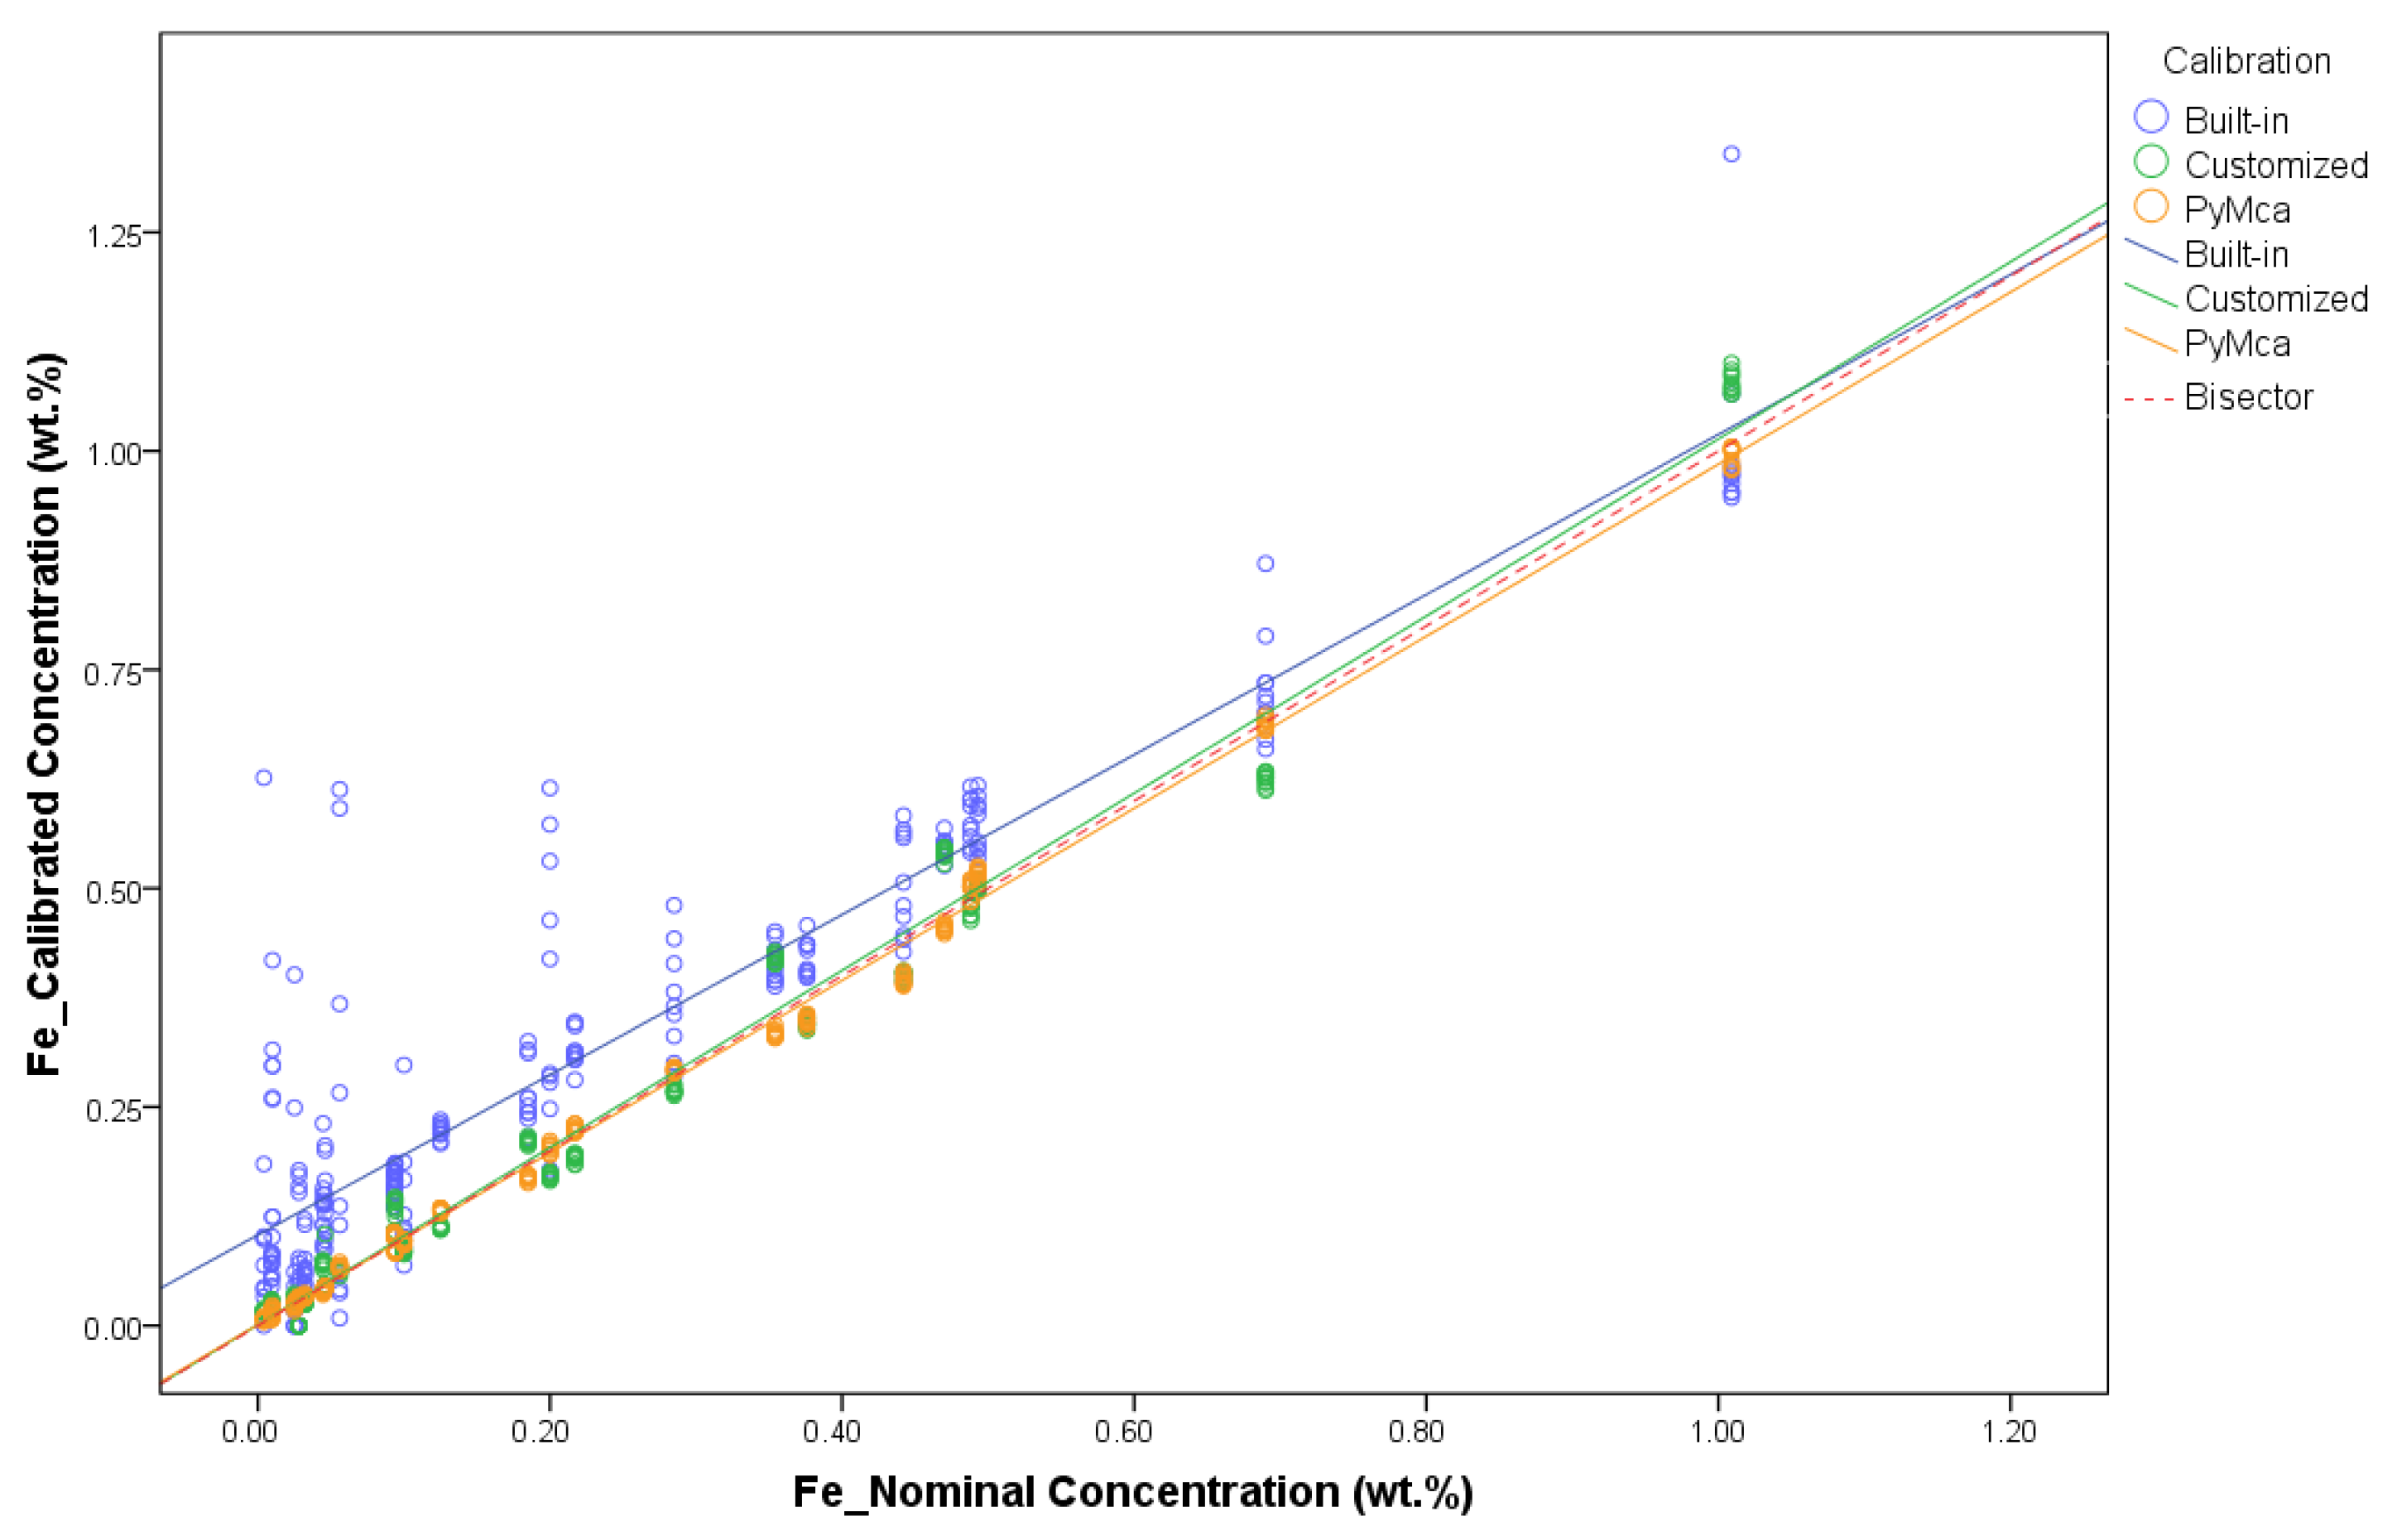
| Fe | Off-Line PyMca | 0.996 | 0.015 |
| Customized Bruker | 0.982 | 0.034 | |
| Bruker Built-in | 0.860 | 0.092 | |
| Co | Off-Line PyMca | 0.998 | 0.008 |
| Customized Bruker | 0.999 | 0.005 | |
| Bruker Built-in | 0.974 | 0.041 | |
| Ni | Off-Line PyMca | 0.997 | 0.021 |
| Customized Bruker | 0.951 | 0.085 | |
| Bruker Built-in | 0.982 | 0.050 | |
| Zn | Off-Line PyMca | 1.000 | 0.189 |
| Customized Bruker | 1.000 | 0.121 | |
| Bruker Built-in | 0.997 | 0.451 | |
| As | Off-Line PyMca | 0.996 | 0.024 |
| Customized Bruker | 0.992 | 0.031 | |
| Bruker Built-in | 0.961 | 0.079 | |
| Ag | Off-Line PyMca | 0.997 | 0.028 |
| Customized Bruker | 1.000 | 0.012 | |
| Bruker Built-in | 0.994 | 0.048 | |
| Cd | Off-Line PyMca | 0.983 | 0.016 |
| Customized Bruker | 0.993 | 0.012 | |
| Bruker Built-in | 0.925 | 0.045 | |
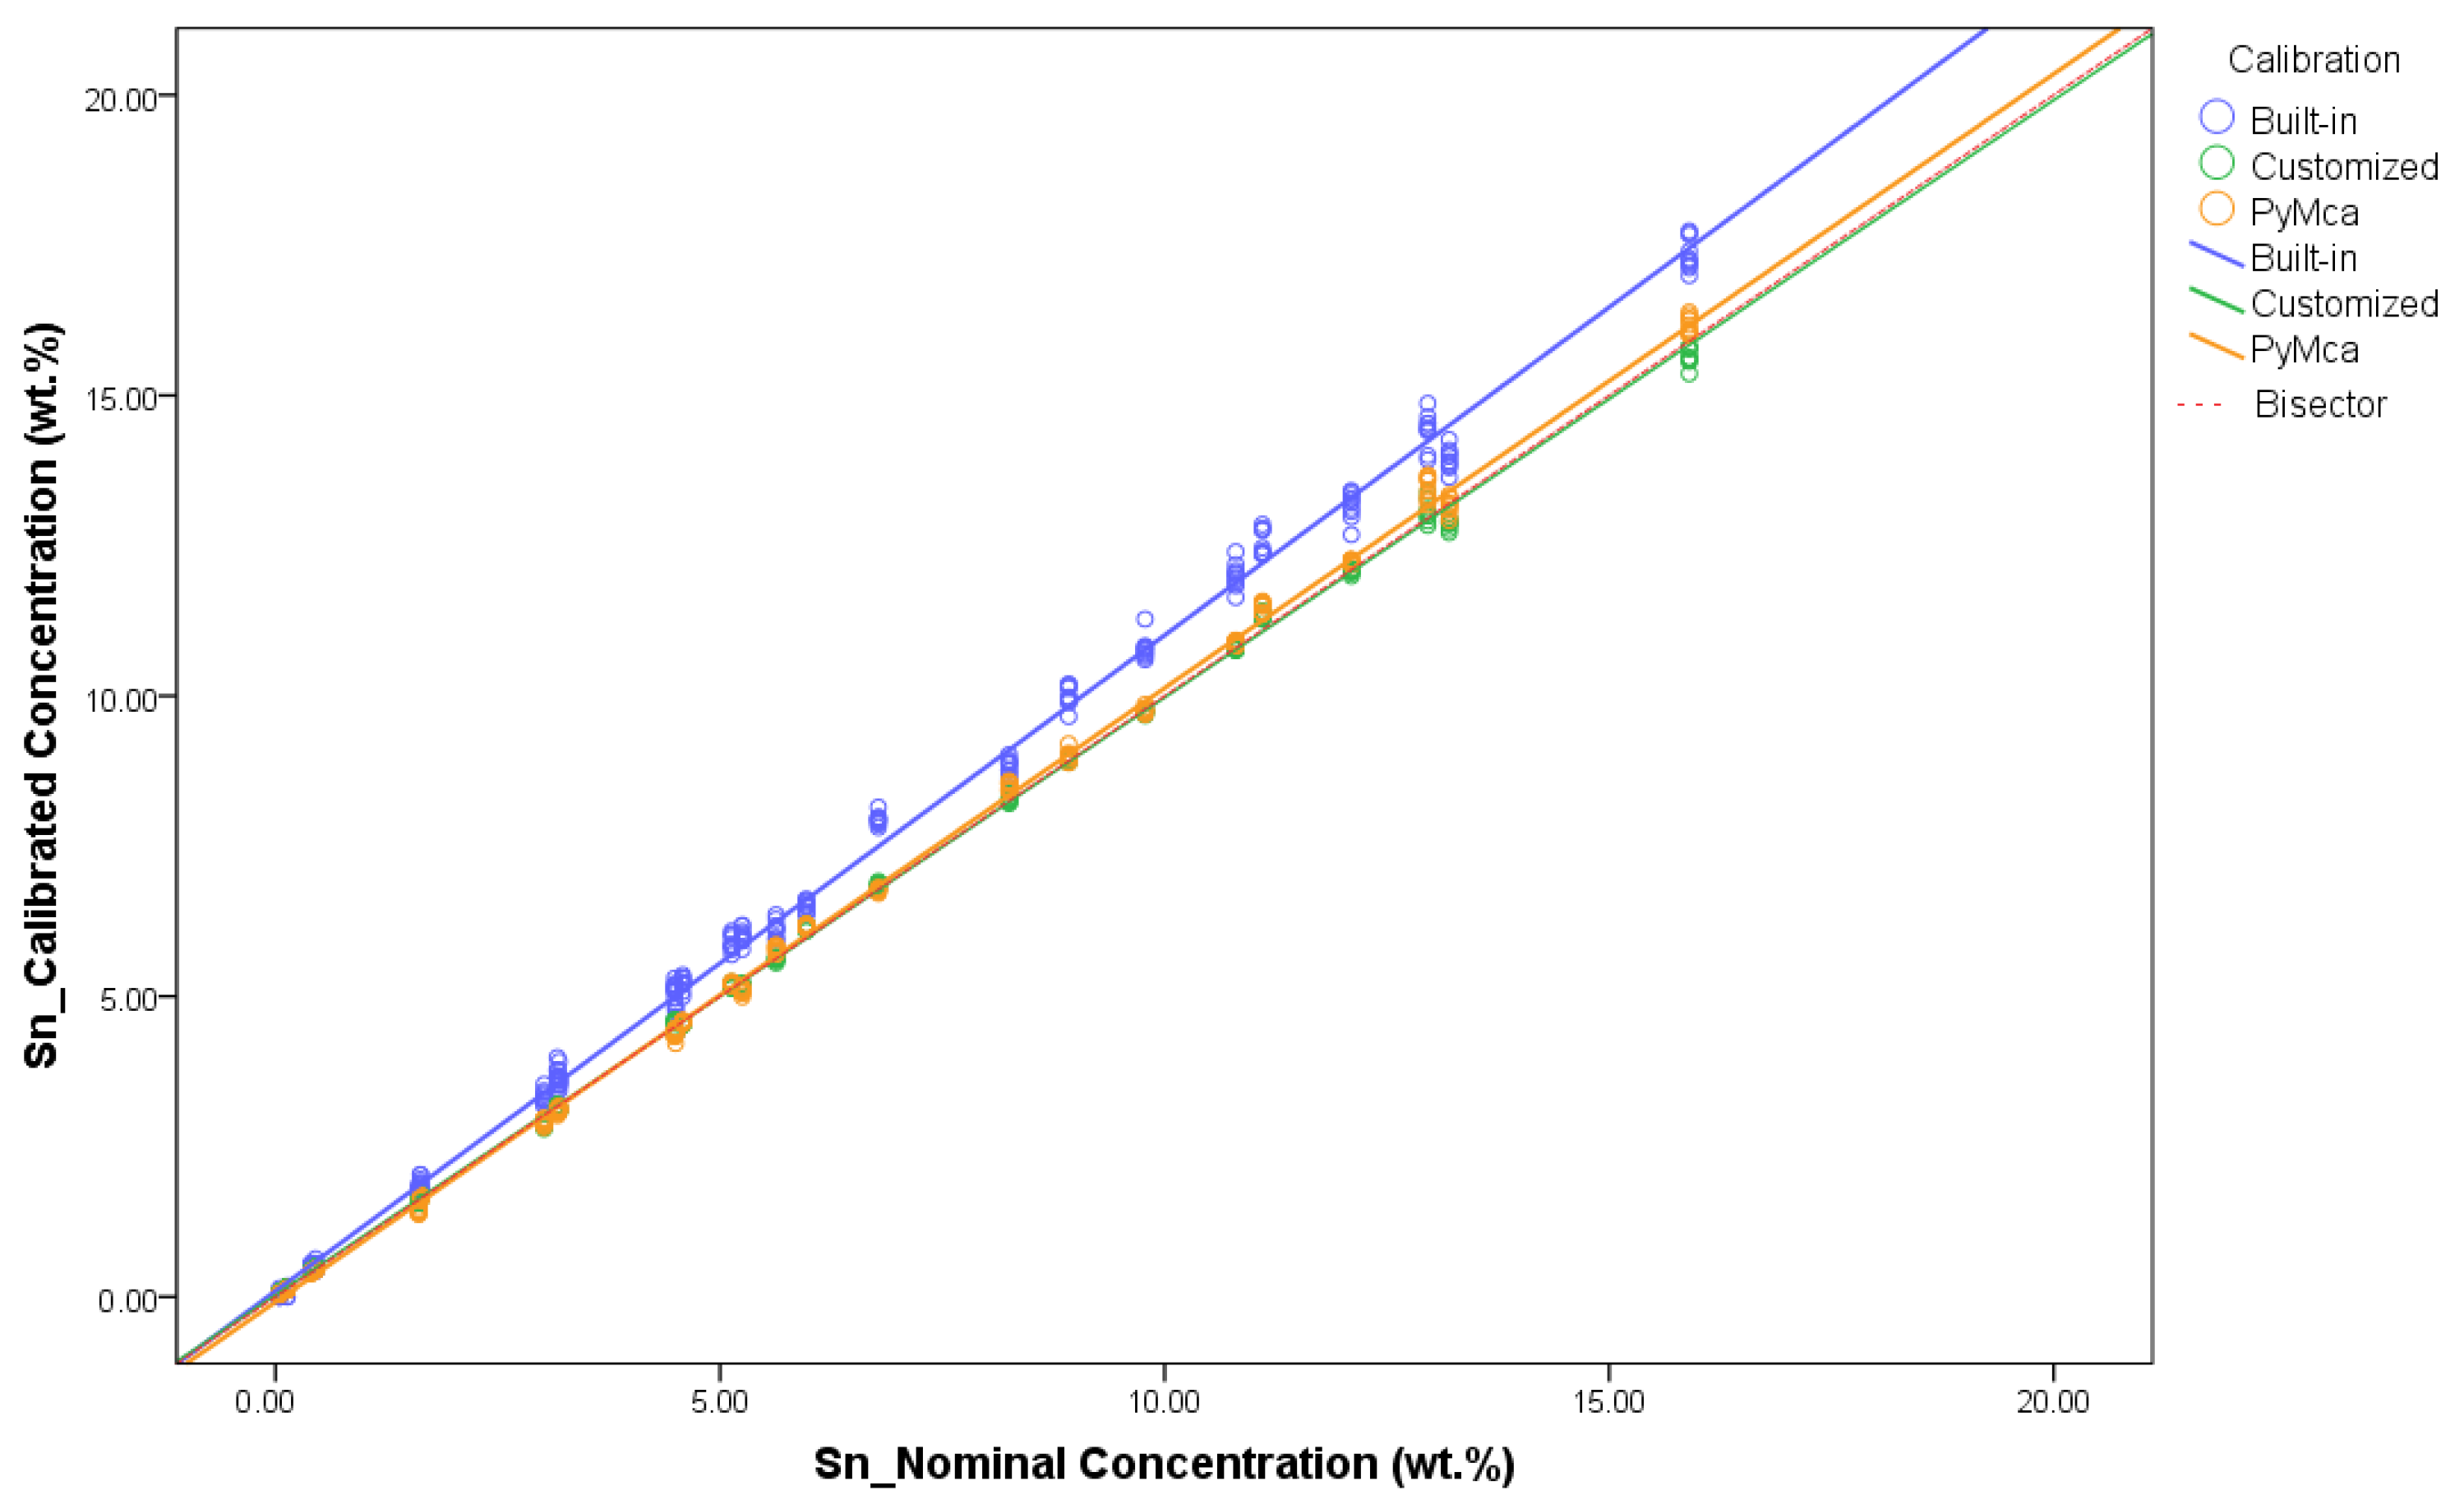
| Sn | Off-Line PyMca | 0.999 | 0.145 |
| Customized Bruker | 0.999 | 0.122 | |
| Bruker Built-in | 0.997 | 0.251 | |
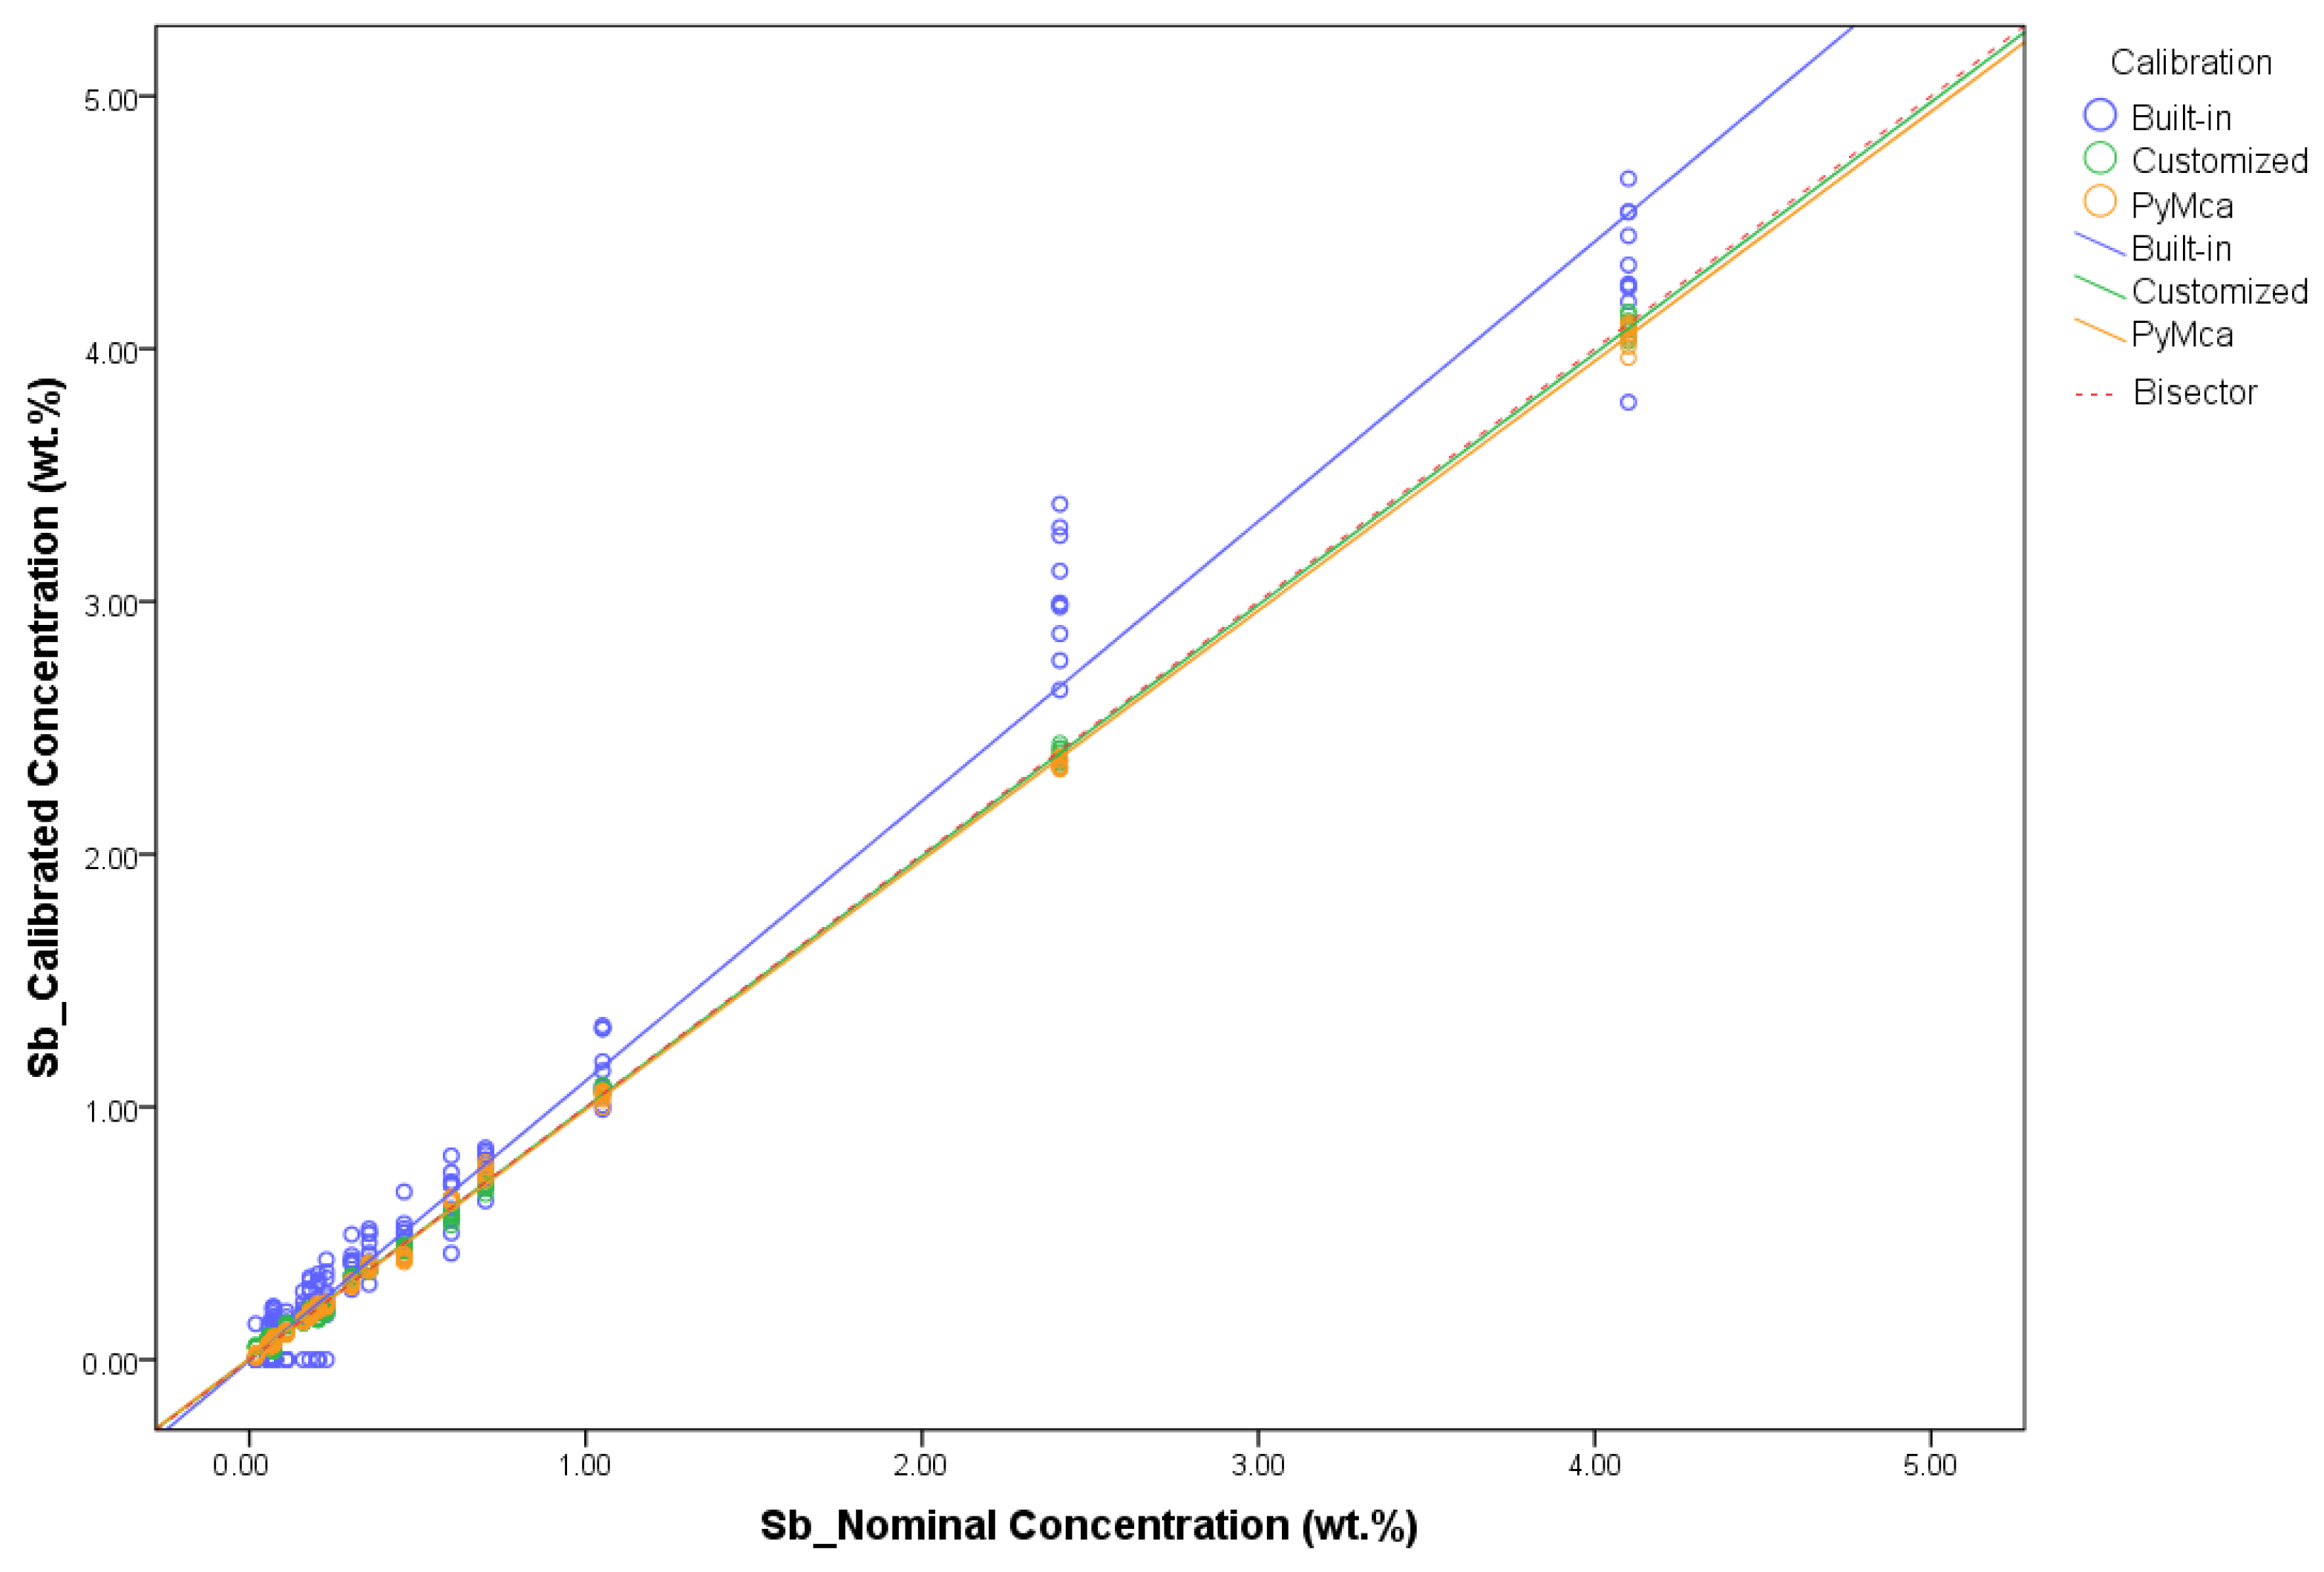
| Sb | Off-Line PyMca | 0.999 | 0.024 |
| Customized Bruker | 0.999 | 0.025 | |
| Bruker Built-in | 0.982 | 0.149 | |
| Pb | Off-Line PyMca | 0.991 | 0.328 |
| Customized Bruker | 0.997 | 0.217 | |
| Bruker Built-in | 0.991 | 0.386 | |
| Bi | Off-Line PyMca | 0.986 | 0.025 |
| Customized Bruker | 0.996 | 0.017 | |
| Bruker Built-in | 0.959 | 0.049 |
| Mass Weight in % | |||||||||||||||||||||||
|---|---|---|---|---|---|---|---|---|---|---|---|---|---|---|---|---|---|---|---|---|---|---|---|
| Reference Material | Supplier | Mg | Al | Si | P | S | Cr | Mn | Fe | Co | Ni | Cu | Zn | As | Se | Ag | Cd | Sn | Sb | Te | Au | Pb | Bi |
| 1116 | Department of Commerce Malcolm Baldrige Secretary (Washington, DC, USA) | - | - | - | 0.008 | - | - | - | 0.046 | - | 0.048 | 90.37 | 9.44 | - | - | - | - | 0.044 | - | - | - | 0.042 | - |
| 31X 7835.8-B4 | MBH Analytical LTD (London, EN, UK) | - | 0.219 | - | 0.154 | - | - | 0.010 | 0.045 | 0.313 | 0.157 | 72.7 | 21.55 | 0.151 | - | 0.549 | 0.094 | 0.451 | 0.110 | 0.101 | - | 3.22 | 0.101 |
| 31X 7835.9-B2 | - | 0.120 | 0.047 | 0.062 | 0.020 | - | 0.005 | 0.185 | 0.115 | 0.195 | 76.58 | 16.20 | 0.098 | 0.300 | 2.00 | 0.058 | 1.61 | 0.460 | - | - | 1.05 | 0.900 | |
| 31X TB5-B6 | - | 0.071 | 0.111 | 0.025 | - | 0.003 | 0.283 | 0.094 | 0.020 | 0.106 | 61.49 | 35.62 | 0.396 | - | 0.216 | 0.490 | 0.129 | 0.229 | - | - | 0.575 | 0.292 | |
| 32X LB10-G1 | - | - | - | 0.003 | 0.010 | - | - | - | 0.084 | 0.69 | 77.40 | 0.110 | 0.165 | - | 0.070 | - | 8.25 | 0.600 | 0.010 | - | 12.5 | 0.092 | |
| 32X LB14-G1 | - | 0.001 | 0.001 | 0.058 | 0.018 | - | 0.001 | 0.009 | 0.089 | 0.254 | 77.01 | 0.586 | 0.050 | - | 0.120 | - | 5.63 | 0.075 | - | - | 15.42 | 0.720 | |
| 32X LB17-A4 | - | 0.388 | - | 0.051 | - | 0.001 | 0.296 | 0.488 | 0.008 | 0.465 | 74.83 | 0.634 | 1.51 | - | 0.911 | 0.151 | 5.97 | 4.10 | - | - | 9.83 | 0.220 | |
| 32X PB12-E3 | 0.003 | 0.007 | 0.010 | 0.172 | 0.013 | - | 0.011 | 0.032 | 0.014 | 0.221 | 93.29 | 0.546 | 0.087 | - | - | - | 5.25 | 0.160 | - | - | 0.102 | 0.057 | |
| 32X SN5-B1 | - | 0.215 | - | - | - | 0.023 | 0.528 | 1.01 | 0.129 | 0.667 | 78.97 | 0.604 | 0.056 | - | 0.095 | 0.130 | 15.9 | 0.702 | 0.001 | 0.010 | 0.860 | 0.124 | |
| 32X SN6-B3 | - | 0.059 | - | - | - | 0.015 | 0.090 | 0.376 | 0.75 | 0.295 | 85.73 | 2.00 | 0.804 | - | 1.01 | 0.024 | 6.78 | 0.304 | - | 0.003 | 1.64 | 0.127 | |
| 33X GM20-B3 | - | 0.133 | - | 0.060 | - | - | 0.040 | 0.442 | 0.021 | 0.211 | 89.49 | 1.80 | 0.300 | - | 0.200 | 0.020 | 4.49 | 2.41 | - | - | 0.294 | 0.044 | |
| 33X GM21-B6 | - | 0.175 | 0.022 | 0.068 | 0.064 | - | - | 0.690 | - | 0.200 | 78.96 | 4.95 | 0.335 | 0.177 | 0.700 | 0.250 | 4.50 | 1.05 | - | - | 7.40 | 0.460 | |
| 33X GM4-AD1 | - | 0.002 | 0.001 | 0.003 | 0.034 | - | 0.001 | 0.093 | 0.001 | 1.48 | 84.02 | 5.90 | 0.023 | - | 0.021 | - | 3.02 | 0.057 | - | - | 5.27 | 0.044 | |
| 33X RB2-A3 | 0.001 | 0.036 | 0.012 | 0.021 | 0.078 | 0.002 | 0.003 | 0.493 | 0.035 | 0.255 | 82.67 | 9.14 | 0.021 | - | 0.003 | - | 3.19 | 0.019 | - | - | 3.85 | 0.101 | |
| B14 | Centre Technique des Industries de la Fonderie (Sevres, FR) | - | - | 0.110 | 0.700 | 0.021 | - | 0.014 | 0.125 | - | 0.302 | 86.80 | 0.175 | 0.039 | - | - | - | 11.10 | 0.072 | - | - | 0.520 | - |
| B21 | - | 0.130 | - | 0.004 | 0.047 | - | - | 0.285 | - | 1.21 | 83.05 | 6.17 | - | - | - | - | 5.13 | 0.180 | - | - | 3.79 | - | |
| B3 | - | 0.130 | 0.062 | 0.480 | 0.046 | - | 0.194 | 0.217 | - | 1.53 | 80.25 | 2.26 | - | - | - | - | 12.96 | 0.204 | - | - | 1.65 | - | |
| BS836A-2 | Brammer Standard Company (Houston, TX, USA) | - | 0.002 | 0.002 | 0.083 | 0.042 | - | 0.001 | 0.025 | - | 0.460 | 84.70 | 4.55 | 0.008 | - | 0.023 | - | 4.58 | 0.068 | - | - | 5.32 | - |
| CURM No.42.23-2 | Bureau of Analysed Samples Ltd. (Middlesbrough, EN, UK) | - | 0.008 | 0.015 | 0.128 | 0.045 | - | 0.019 | 0.354 | - | 0.168 | 74.36 | 22.13 | 0.168 | - | - | - | 1.63 | 0.356 | - | - | 0.575 | 0.034 |
| CURM No.54.01-4 | 0.008 | 0.040 | 0.039 | 0.053 | 0.023 | - | 0.158 | 0.028 | - | 0.348 | 95.42 | 0.346 | 0.044 | - | - | - | 3.17 | 0.070 | - | - | 0.307 | - | |
| SS 551 | British Chemical Standard (Warwickshire, EN, UK) | - | 0.052 | 0.018 | 1.01 | - | - | - | 0.200 | - | 0.760 | 87.40 | 0.740 | - | - | - | - | 8.92 | - | - | - | 0.790 | - |
| SS 552 | - | 0.023 | 0.019 | 0.770 | - | - | - | 0.100 | - | 0.560 | 87.70 | 0.350 | - | - | - | - | 9.78 | - | - | - | 0.630 | - | |
| SS 553 | - | 0.017 | 0.022 | 0.680 | - | - | - | 0.056 | - | 0.440 | 87.00 | 0.490 | - | - | - | - | 10.8 | - | - | - | 0.470 | - | |
| SS 555 | - | 0.005 | 0.036 | 0.180 | - | - | - | 0.010 | - | 0.110 | 87.10 | 0.160 | - | - | - | - | 12.1 | - | - | - | 0.240 | - | |
| SS 556 | - | 0.005 | 0.005 | 0.100 | - | - | - | 0.004 | - | 0.014 | 86.40 | 0.090 | - | - | - | - | 13.2 | - | - | - | 0.160 | - | |
| UZS60 | Centre de développement des industries de mise en forme del materiaux (Sevres, FR) | - | - | 3.72 | 0.070 | - | - | - | 0.470 | - | 0.490 | 78.98 | 15.3 | - | - | - | - | 0.40 | - | - | - | 0.570 | - |
| Calibration Procedure | Voltage (kV) | Current (μA) | Primary Filtration | Measuring Time (s) |
|---|---|---|---|---|
| Off-Line PyMca | 49 | 39.3 | Al (300 μm) and Ti (25 μm) | 30 |
| Customized Bruker | 49 | 39.3 | Al (300 μm) and Ti (25 μm) | 30 |
| Bruker Built-in | 15 | 23.2 | - | 30 |
Disclaimer/Publisher’s Note: The statements, opinions and data contained in all publications are solely those of the individual author(s) and contributor(s) and not of MDPI and/or the editor(s). MDPI and/or the editor(s) disclaim responsibility for any injury to people or property resulting from any ideas, methods, instructions or products referred to in the content. |
© 2024 by the authors. Licensee MDPI, Basel, Switzerland. This article is an open access article distributed under the terms and conditions of the Creative Commons Attribution (CC BY) license (https://creativecommons.org/licenses/by/4.0/).
Share and Cite
Konstantakopoulou, E.; Casanova Municchia, A.; Luvidi, L.; Ferretti, M. Comparison of Different Methods for Evaluating Quantitative X-ray Fluorescence Data in Copper-Based Artefacts. Condens. Matter 2024, 9, 5. https://doi.org/10.3390/condmat9010005
Konstantakopoulou E, Casanova Municchia A, Luvidi L, Ferretti M. Comparison of Different Methods for Evaluating Quantitative X-ray Fluorescence Data in Copper-Based Artefacts. Condensed Matter. 2024; 9(1):5. https://doi.org/10.3390/condmat9010005
Chicago/Turabian StyleKonstantakopoulou, Eleni, Annalaura Casanova Municchia, Loredana Luvidi, and Marco Ferretti. 2024. "Comparison of Different Methods for Evaluating Quantitative X-ray Fluorescence Data in Copper-Based Artefacts" Condensed Matter 9, no. 1: 5. https://doi.org/10.3390/condmat9010005
APA StyleKonstantakopoulou, E., Casanova Municchia, A., Luvidi, L., & Ferretti, M. (2024). Comparison of Different Methods for Evaluating Quantitative X-ray Fluorescence Data in Copper-Based Artefacts. Condensed Matter, 9(1), 5. https://doi.org/10.3390/condmat9010005