In order to trace the low concentrated minor phases in the Y-Ba-Cu-O family, the standard preparations of Y–123 in the flowing oxygen atmosphere at 935 °C must be replaced by more unconventional methods, which include treatment in an evacuated cell and firing temperatures ranging from 500–1100 °C. The powders of prepared compounds were pressed into pellets measuring 8 mm in diameter and 0.8–1 mm in thickness, and in order to measure electric resistance, we pressed together four gold wires, 100 microns in diameter, with the powder.
2.1. YBa2Cu3O5+x
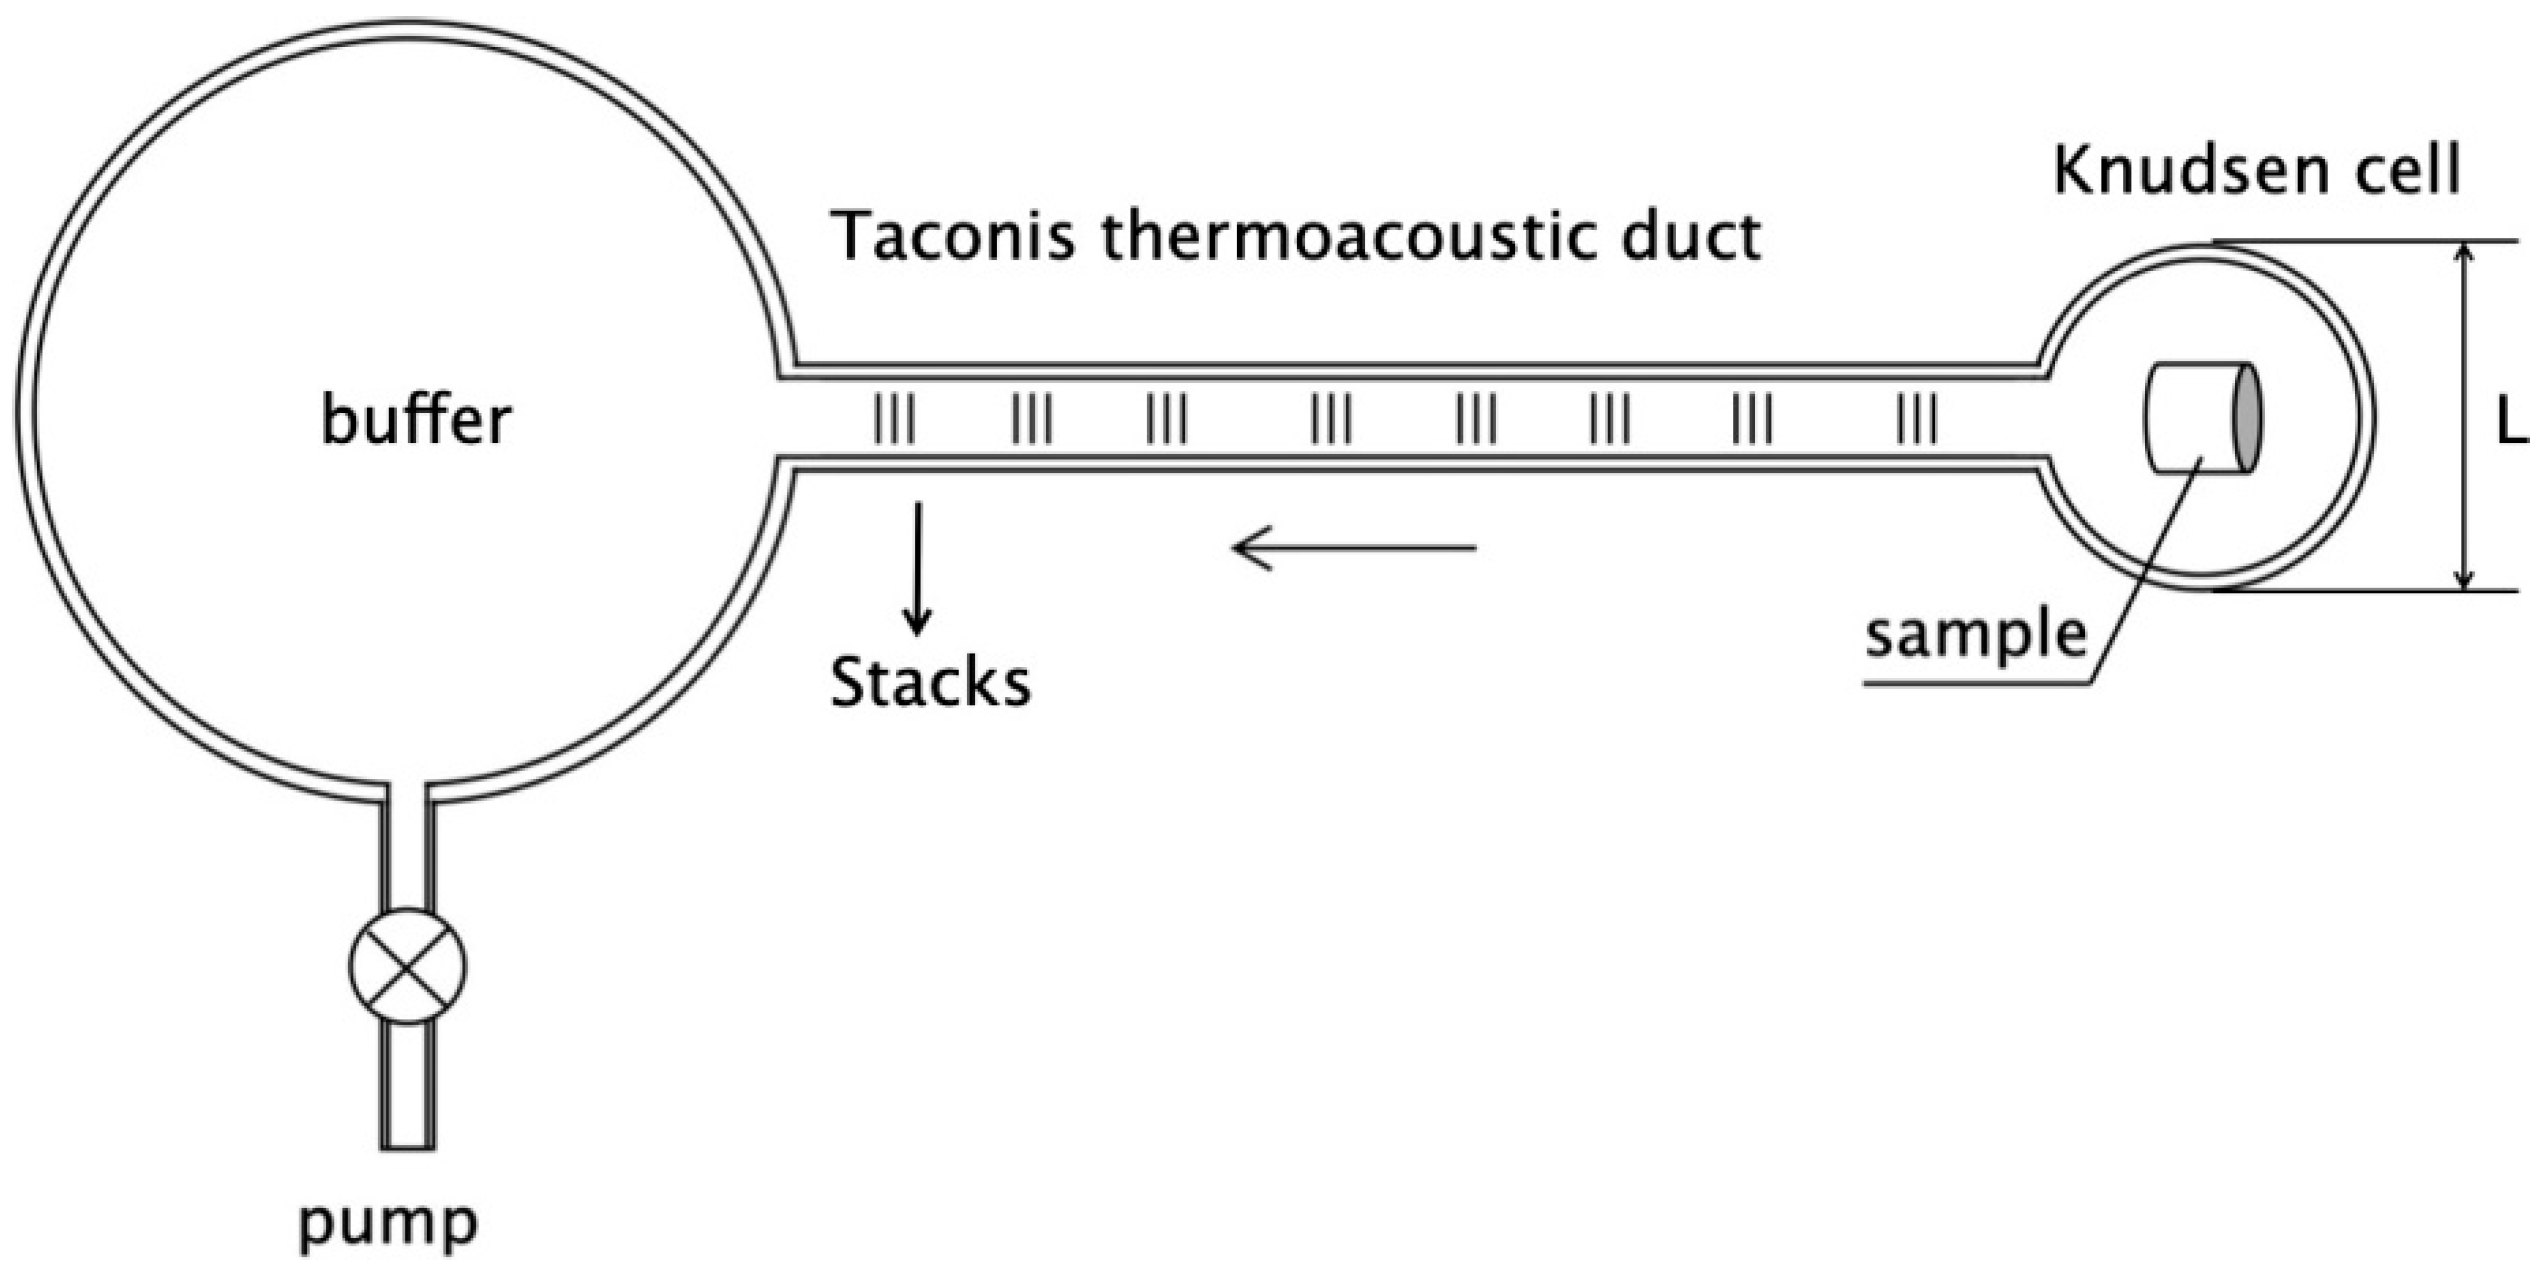
Two oxygen atoms were removed from the Y–123 (
x = 0.16) pellet by use of the vacuum sublimation device designed in this laboratory and schematically presented in
Figure 1.
The thermo-acoustic engine resonates between the Taconis thermo-acoustic duct [
8] and Knudsen cell, the latter held at 645 °C, while the buffer is at RT. Gas dynamics in a Taconis duct is governed by two parameters: the dynamic gas viscosity
ν =
μ/
ρ, indicated by a viscous depth
l = (2
ν/
ω)
1/2, and thermal diffusivity of the gas in the duct, given by
k = λ/
ρ·
cp.λ,
cp and
ρ are the thermal conductivity, specific heat and gas density, respectively. The ratio of a dynamic viscosity and thermal diffusivity defines the Prandtl number governing the sublimation efficiency of the sample. The Taconis gas density stacks are visualized in the duct.
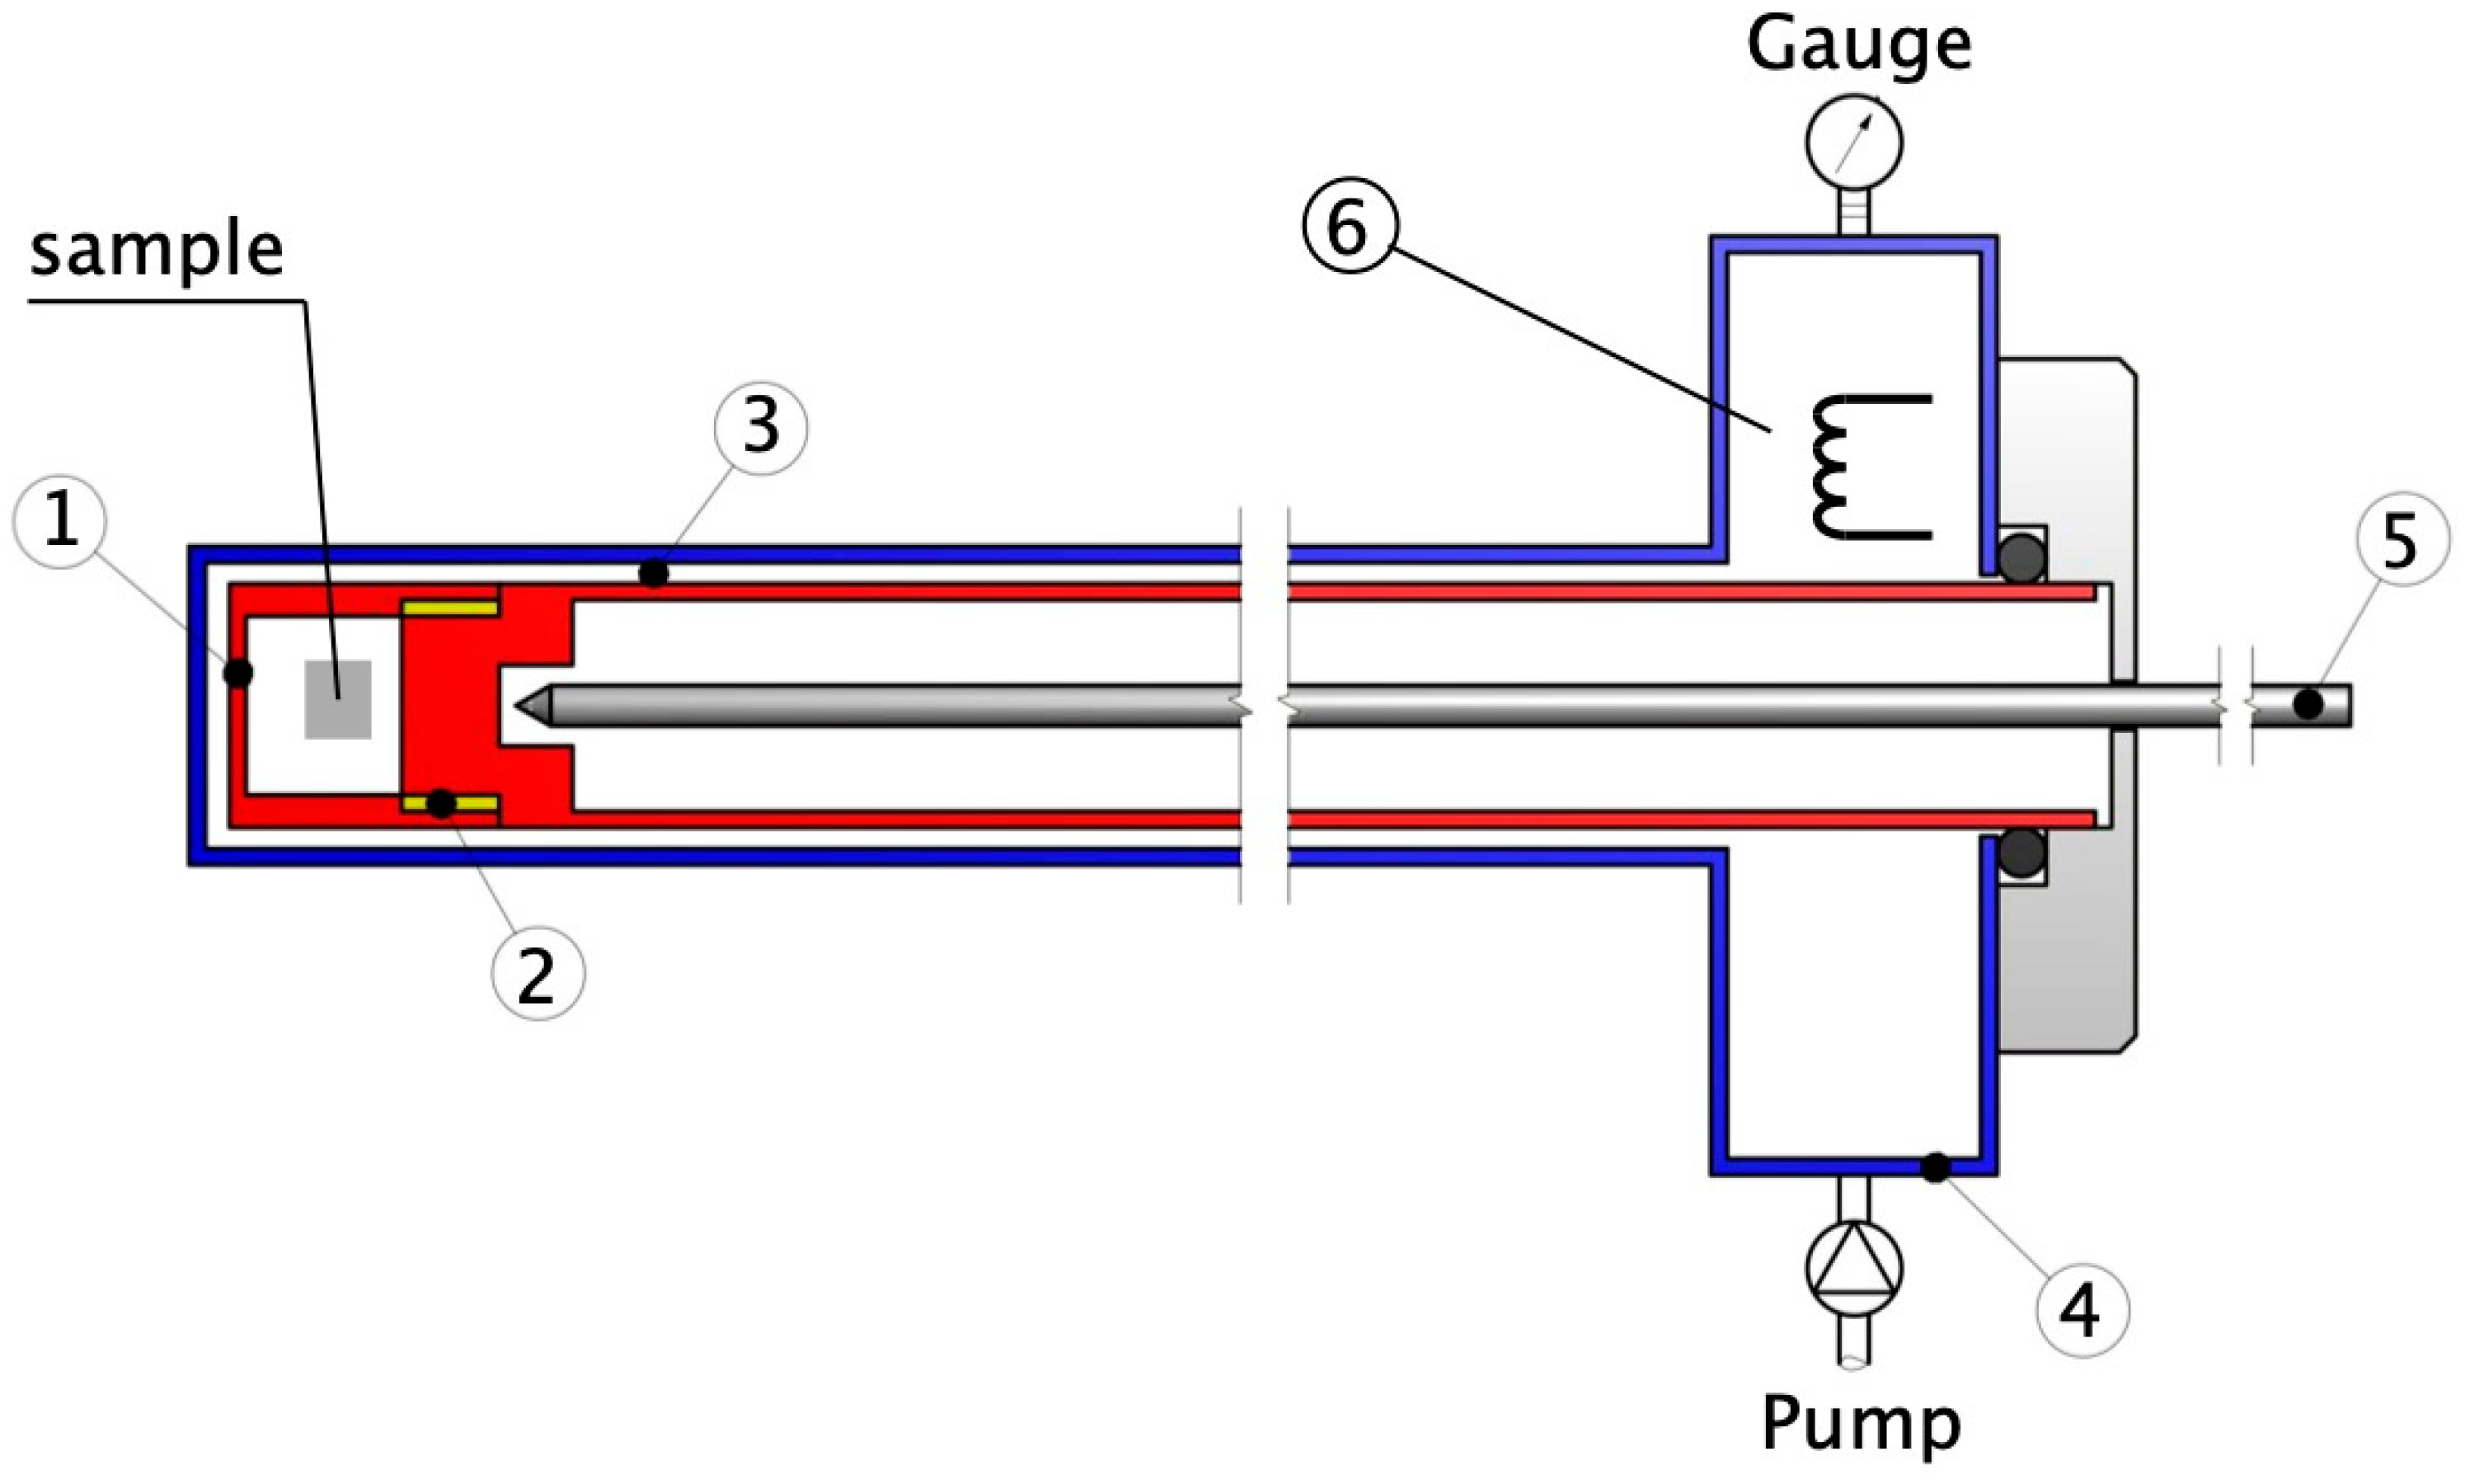
The practical performance of the thermo-acoustic resonator is visualised in
Figure 2. The sample is positioned in the cell 1, and the pumping was proceeded through screw thread 2, funnelled to a coaxial duct between sample holder 3 and outer tube 4. The diameters between the outer tube 4 and inner sample holder 3 differ by 0.14 mm and define the cross-section of the duct. The volume of the Knudsen cell is 0.8 cm
3, and it resonates with Taconis oscillations, giving rise to pressure fluctuations strong enough to drain oxygen from the sample. Obviously, molecular velocities
v = (2δ
p/
ρ)
1/2, driven by pressure oscillations in a small density range
δp, are in the supersonic regime, indicating that strong sublimation occurs. The pumping path in the coaxial duct terminates in a vacuum buffer, and the dynamic pressure of ~0.15 mbar in the buffer was adjusted by a fine needle valve. The temperature was monitored by use of the type K thermocouple 5. An additional adjusting parameter is provided by the fraction of the Taconis coaxial duct exposed to the hot zone of the oven. The Knudsen cell was maintained at a constant temperature of 645 °C, and enhanced pressure oscillations in the cavity favoured a strong reduction of oxides. For instance, copper oxide CuO was reduced to pure copper at already 332 °C. The resonant frequency of 11.2 kHz was measured by use of a hot wire anemometer 6 assembled from a platinum wire measuring 25 microns in diameter and fixed in the buffer interior.
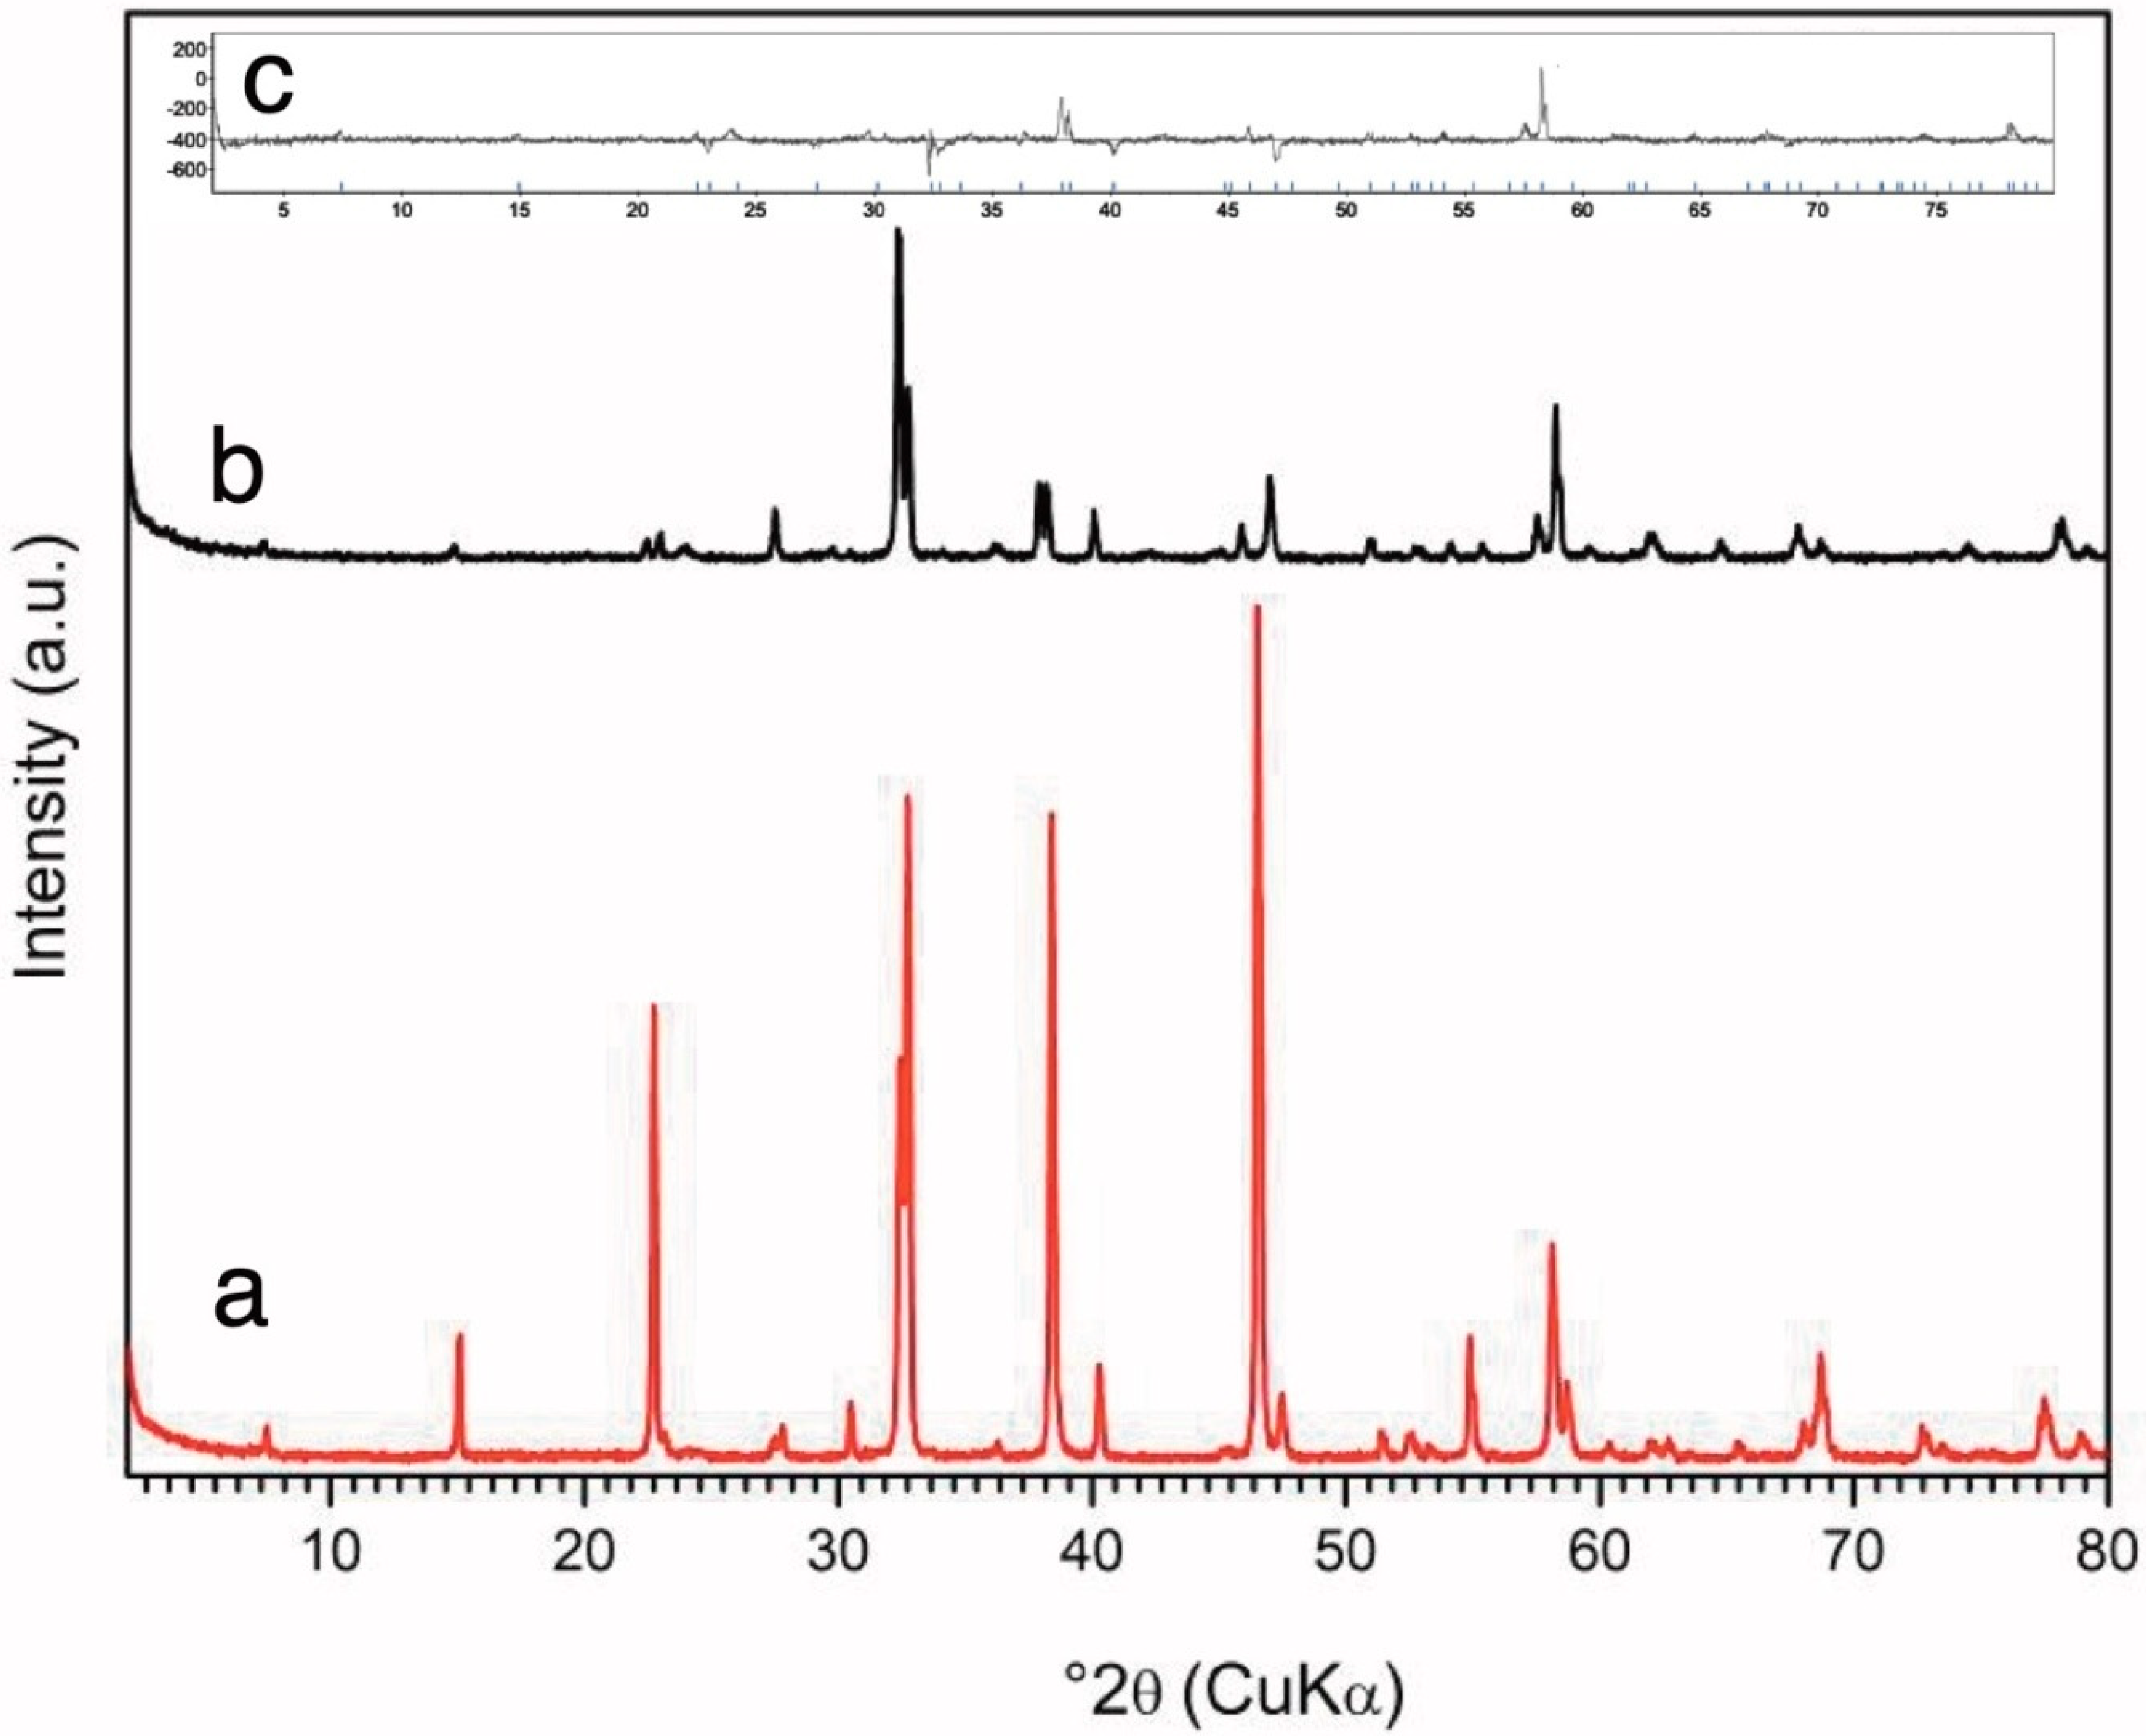
The reduction of the Y–123 superconductor was monitored by weight, and XRD data are presented in
Figure 3. Refinement provides the dimensions of the tetragonal cell: a = b = 0.38605 nm and c = 1.18450 nm. The samples are indicated by yellow colour, and an additional evaluation of the oxygen content was performed by a reduction in hydrogen atmosphere. The final result was YBa
2Cu
3O
5±0.06.When exposed to free air atmosphere, Y–5 absorbs the oxygen, and, in the course of one month of exposure, it converts to YBa
2Cu
3O
5.14.
Doping of the pellet YBa2Cu3O5 by oxygen proceeded in a calibrated alumina cell. In an independent heating stage, the cell was filled with argon gas in order to evaluate an increase of the pressure by heating and to trace the possible degassing from the ceramic background. Oxygen pressure was measured by use of an absolute capacitance gauge with a sensitivity better than 0.1 mbar.
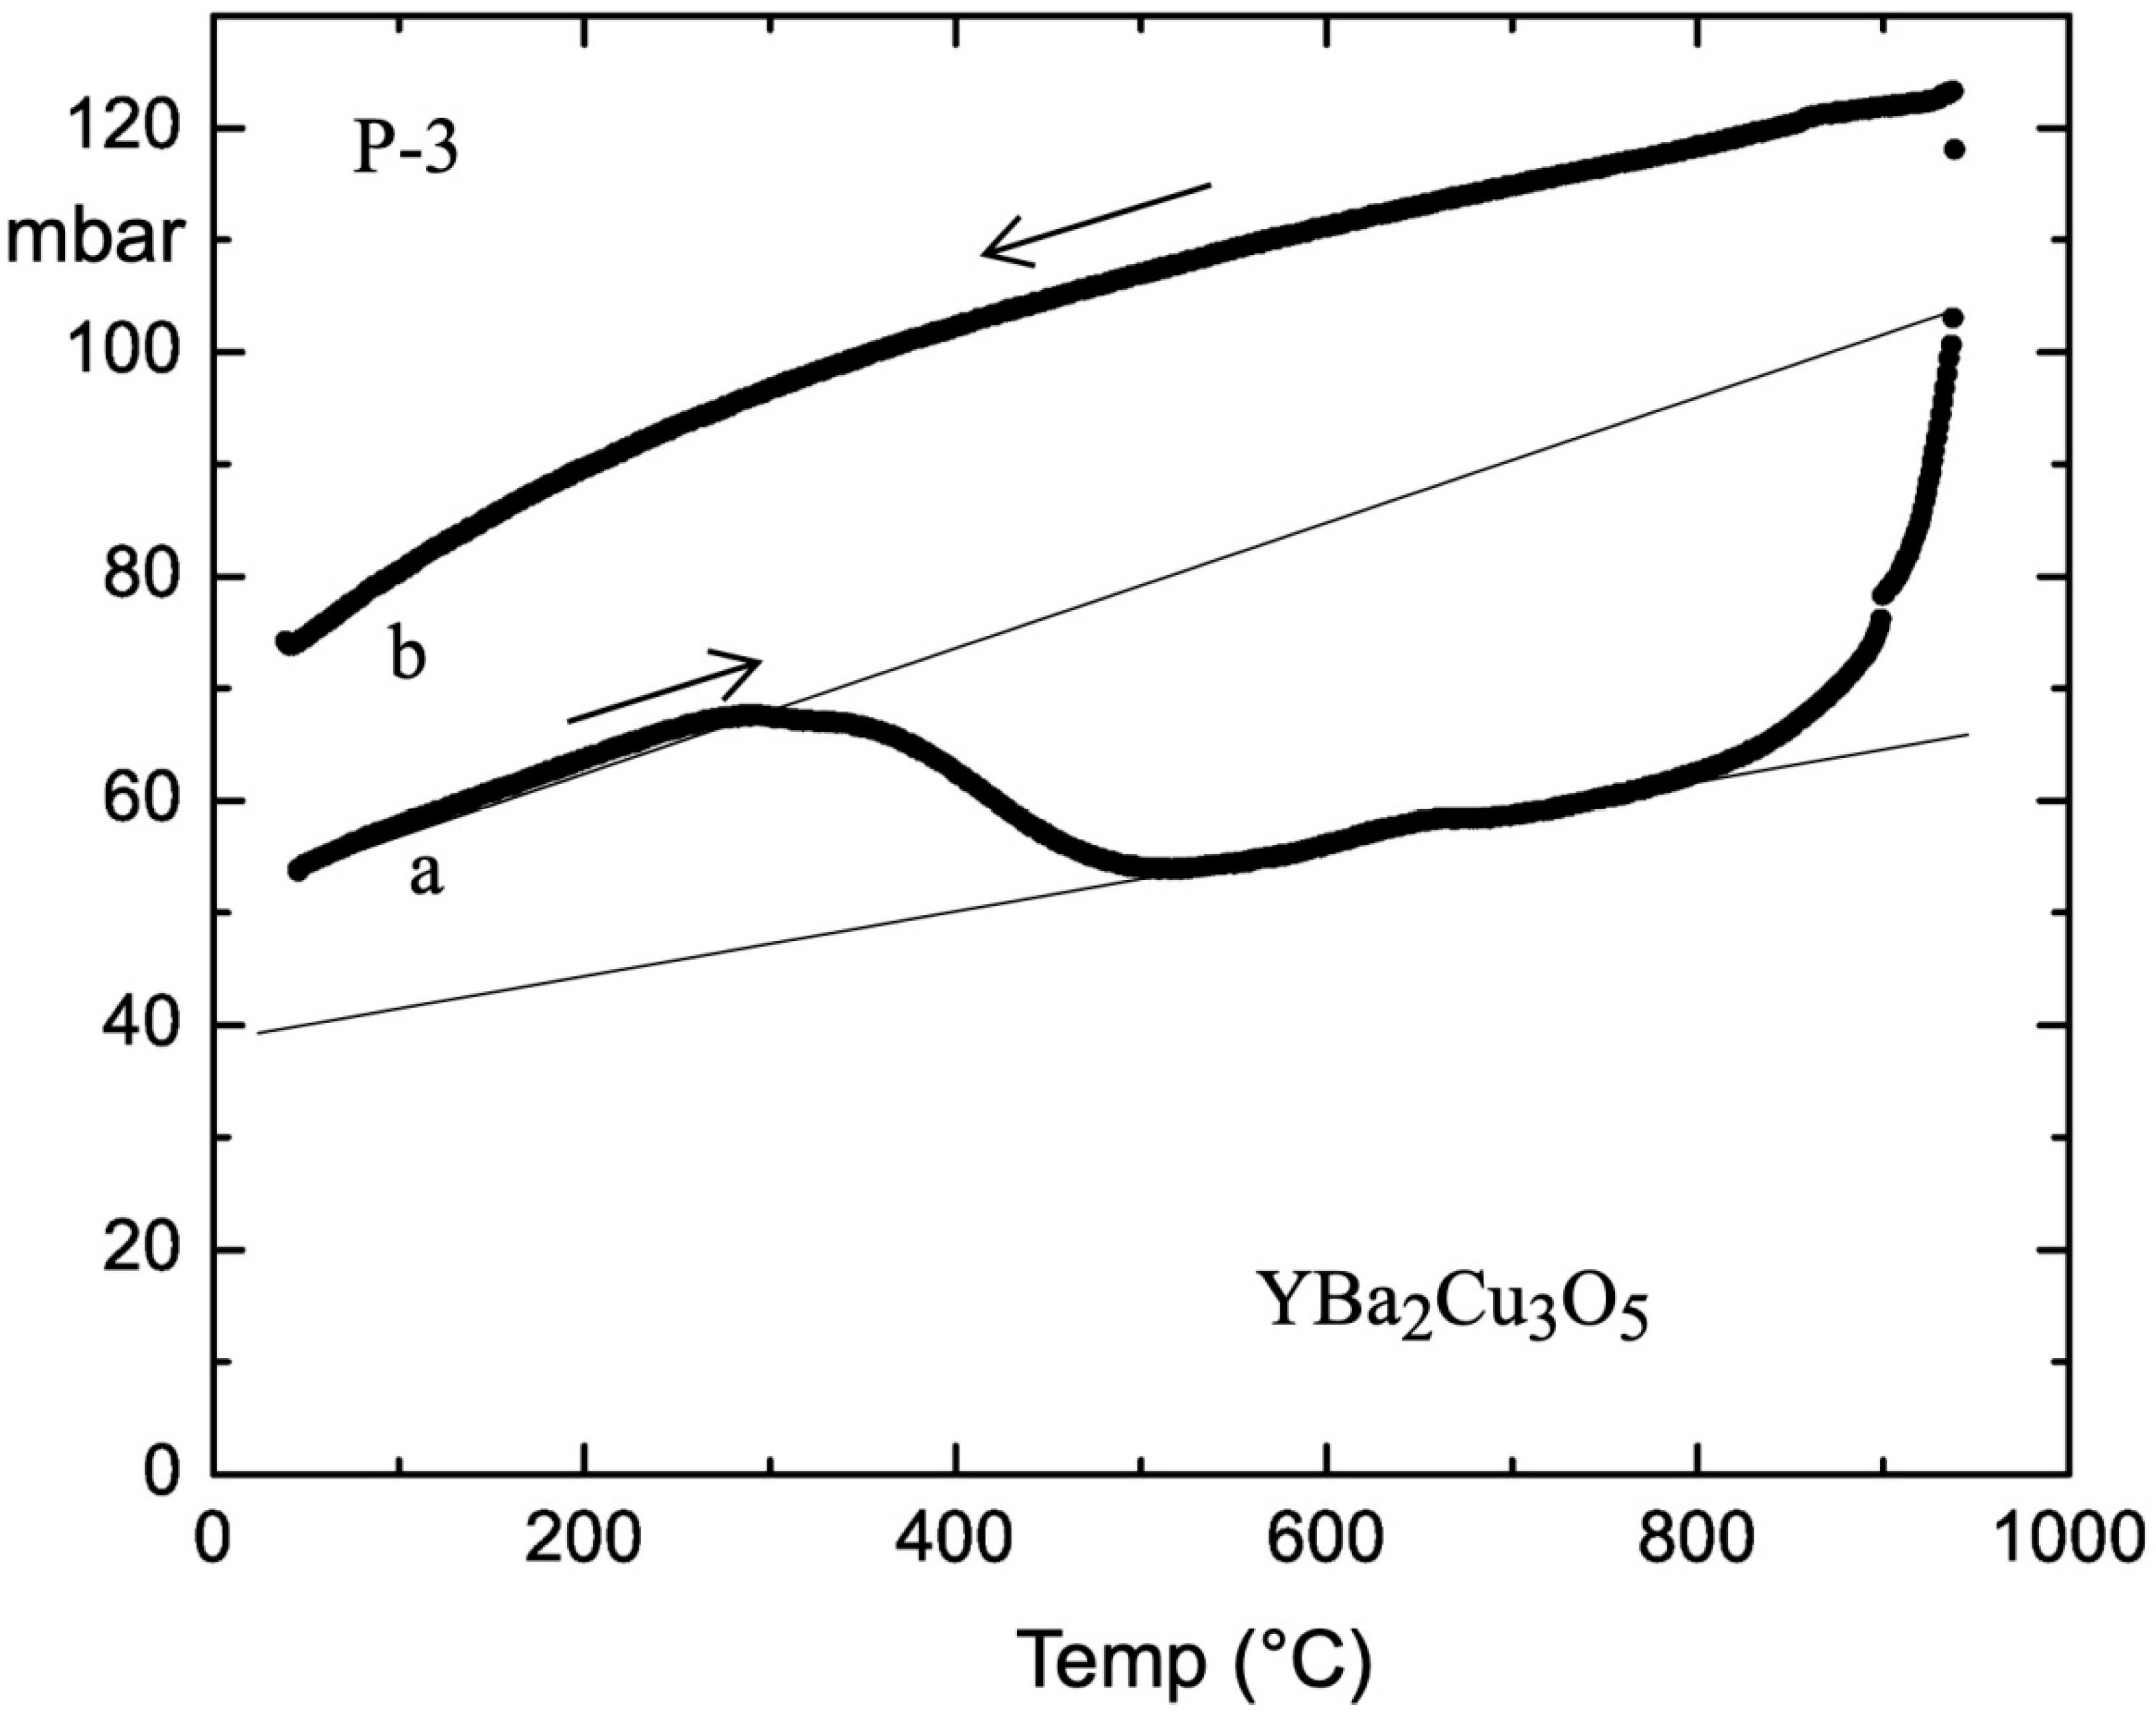
The oxygen doping is presented in
Figure 4, and the starting oxygen pressure at RT was 50 mbar (a).The attached straight line shows an increase of the pressure as a result of the cell heating, prior to absorption which starts at 292 °C. It is indicative that the slope of the temperature-dependent pressure after absorption differs from the initial one and that an additional absorption step is visible at 632 °C, appealing for a second minor phase in Y–5. The release of adsorbed oxygen starts at 825 °C, and additional pressure above the linear straight line results from the partial deterioration of the unit cell Y–5.The temperature dependence of the oxygen pressure by cooling to RT is shown in curve (b), while the yellow pellet becomes black. The final oxygen content of 2.625 moles in the pellet was evaluated by weight and by reduction in a 2 bar hydrogen atmosphere at 410 °C.
In the next preparation, YBa
2Cu
3O
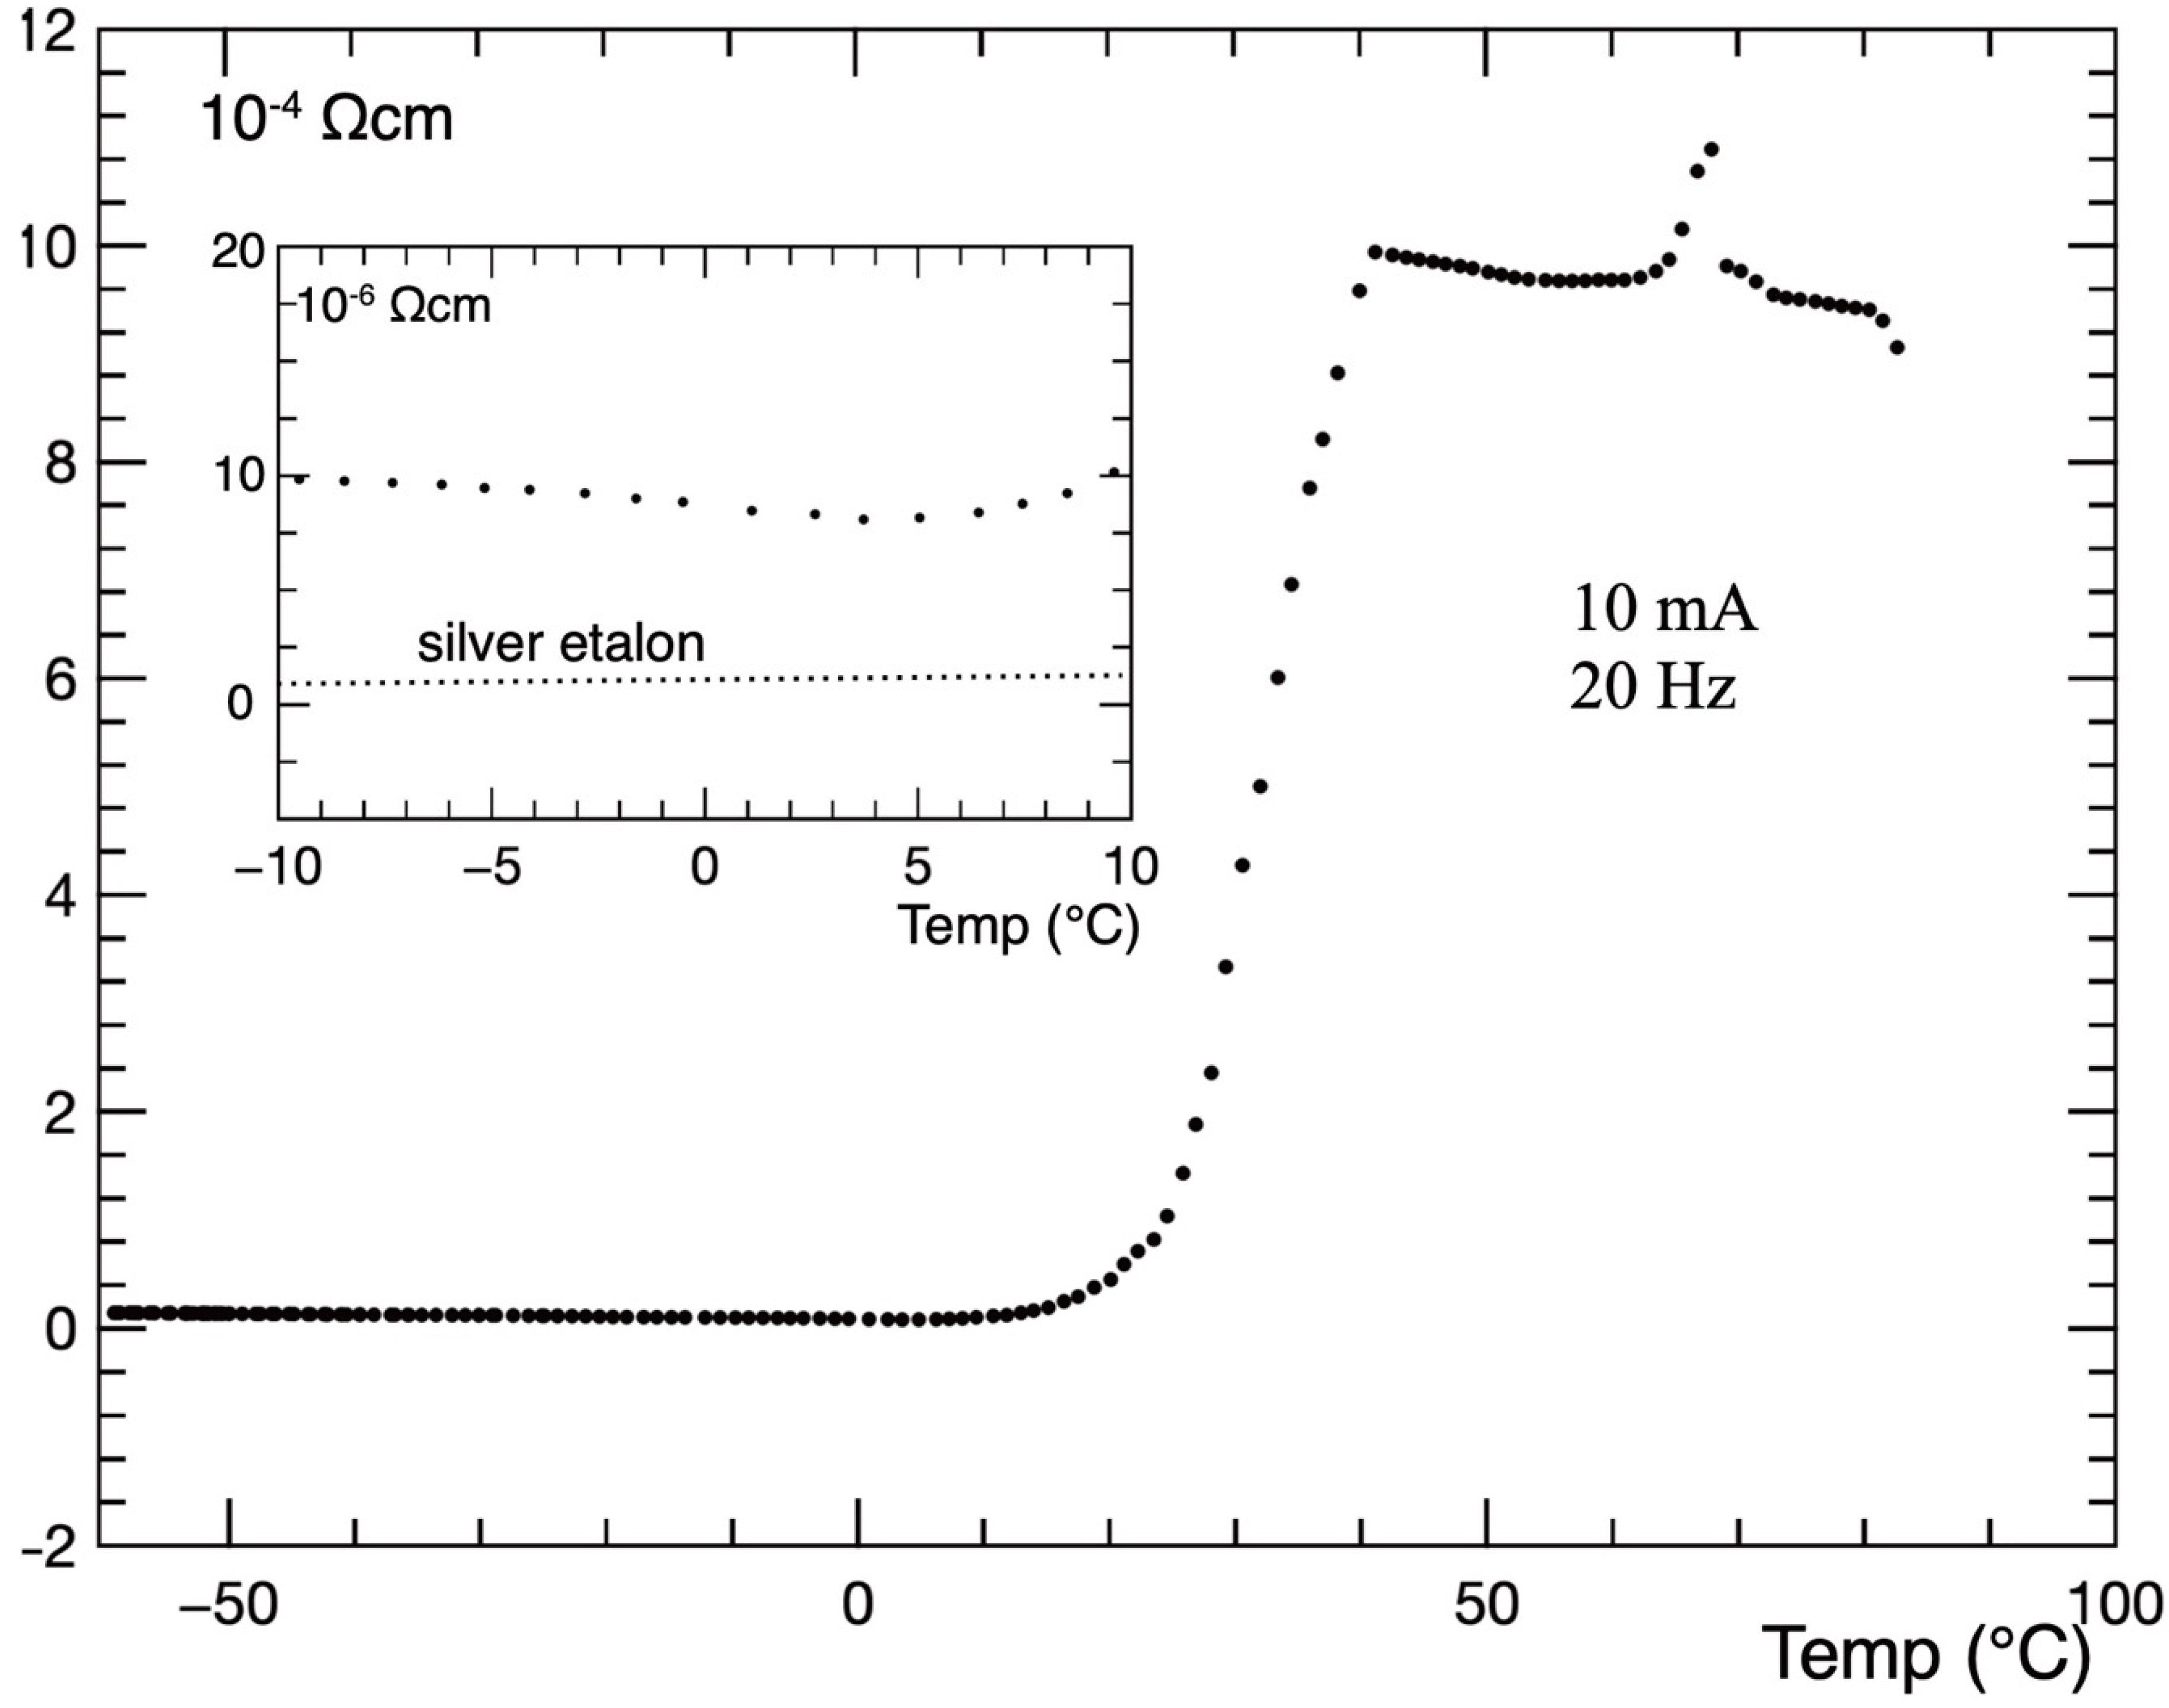
5.32 was produced, and the temperature dependence of the resistance, measured in 10 mA AC current 20 Hz by use of a lock-in amplifier, is shown in
Figure 5. It falls down at 41 °C, and a magnified portion between −10 and +10 °C is shown in the inset. Amplification of the lock-in transformer is frequency-dependent for very small resistances that are measured, and a silver pellet of a similar size was used as an etalon for frequency calibration of the transformer. A comparatively high measuring current lifts the sample resistivity to 10
−5 Ωcm, while the application of 1 mA results in a resistivity under 10
−6 Ωcm. Extrapolation to zero current gives 0.17·10
−6 Ωcm at the ice point.
In the next preparation, YBa
2Cu
3O
5.32 was produced, and the temperature dependence of the resistance, measured in 10 mA AC current 20 Hz by use of a lock-in amplifier, is shown in
Figure 5. It falls down at 41°C, and a magnified portion between −10 and +10 °C is shown in the inset. Amplification of the lock-in transformer is frequency-dependent for very small resistances that are measured, and a silver pellet of a similar size was used as an etalon for frequency calibration of the transformer. A comparatively high measuring current lifts the sample resistivity to 10
−5 Ωcm, while the application of 1 mA results in a resistivity under 10
−6 Ωcm. Extrapolation to zero current gives 0.17 × 10
−6 Ωcm at the ice point.
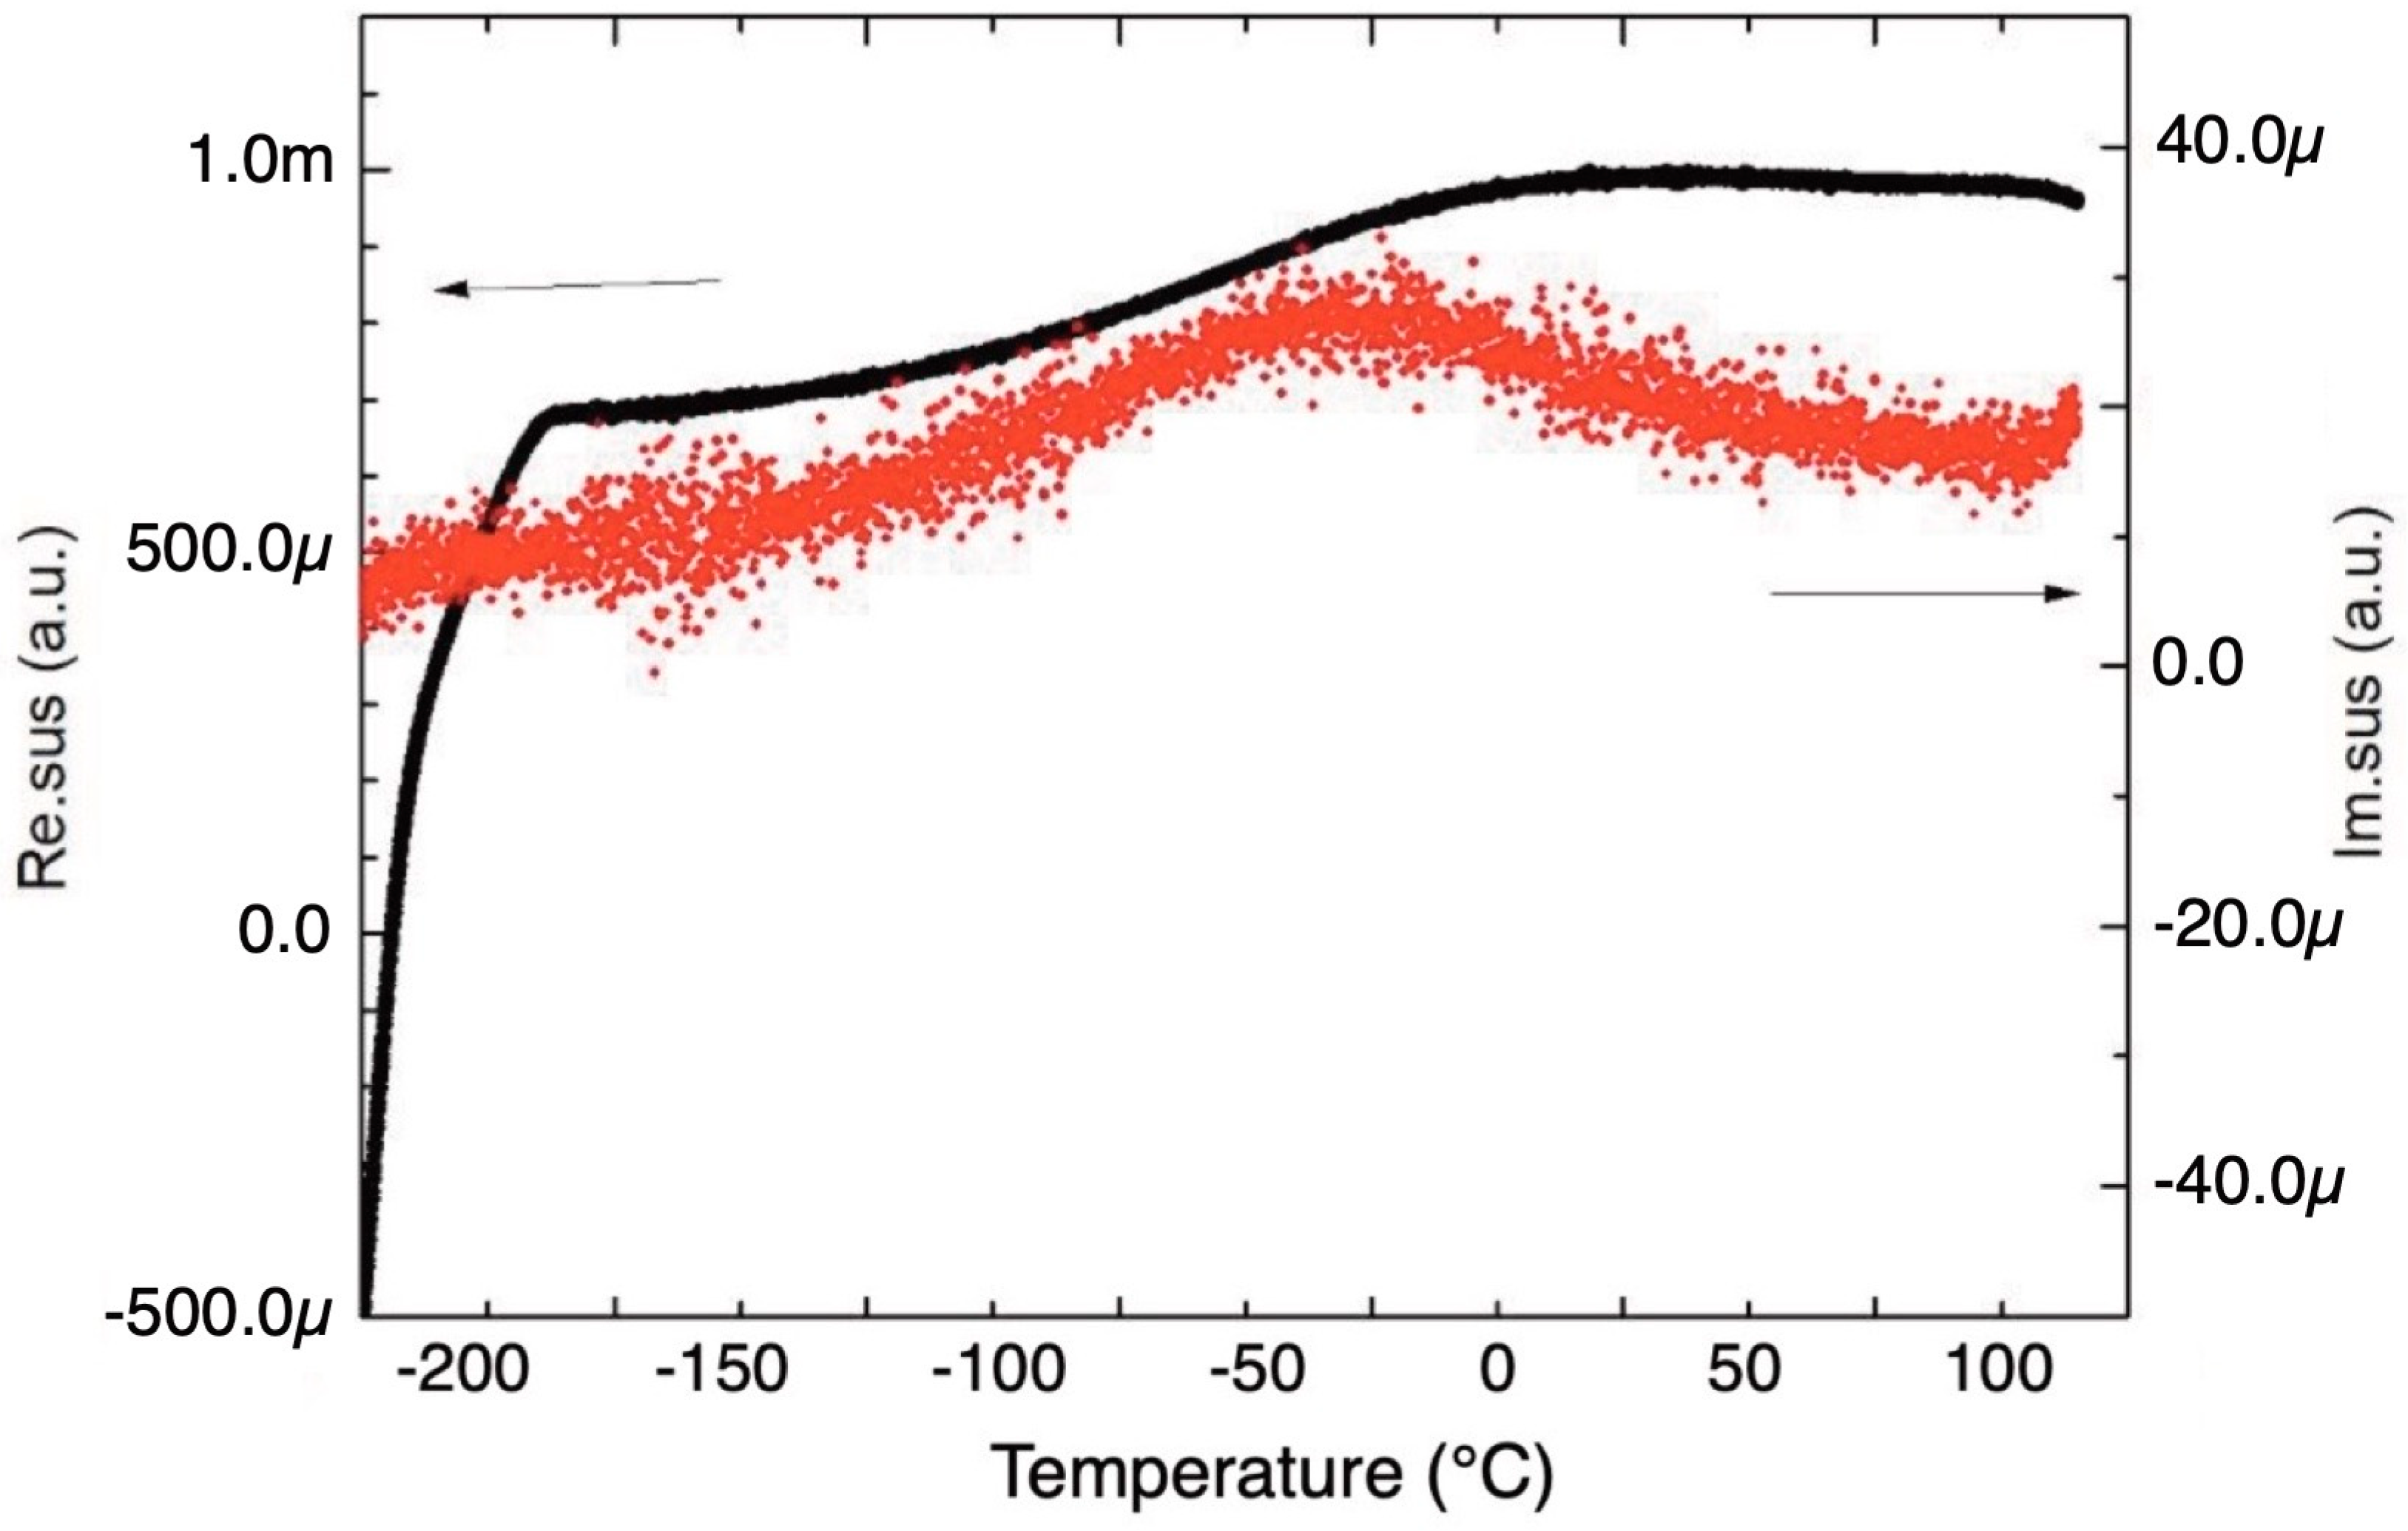
The measurement of the AC magnetic susceptibility of YBa
2Cu
3O
5.25 was performed by use of a high-resolution CryoBIND Research susceptometer. The real (black) and imaginary (red) parts are shown in
Figure 6.The mass of the sample was 57 mg. The AC field was 0.75 Oe (RMS), the frequency was 231 Hz, and the superimposed DC field was 44 Oe. The data appear for two diamagnetic phases. One phase is indicated by a temperature-dependent susceptibility decreasing by cooling from +11 °C, and its volume fraction is estimated to be 0.05 percent. The second phase is YBa
2Cu
3O
7−x that remained after incomplete draining in the Knudsen cell, and its volume fraction is 0.25 percent.
An important achievement of these experiments is, in contrast to past decades events, a fair reproducibility of the measured data. However, an appreciable increase of the diamagnetic fraction was not observed during the preparation, and this in turn calls attention to the fact that the yellow phase may not be a carrier of diamagnetic susceptibility above 93 K. Moreover, although XRD stressed the iso-structural properties of the tetragonal YBa
2Cu
3O
6, shown in
Figure 3, several additional and indicative diffractions seem to appear.
2.2. Delafossite Y2Cu2O4+δ
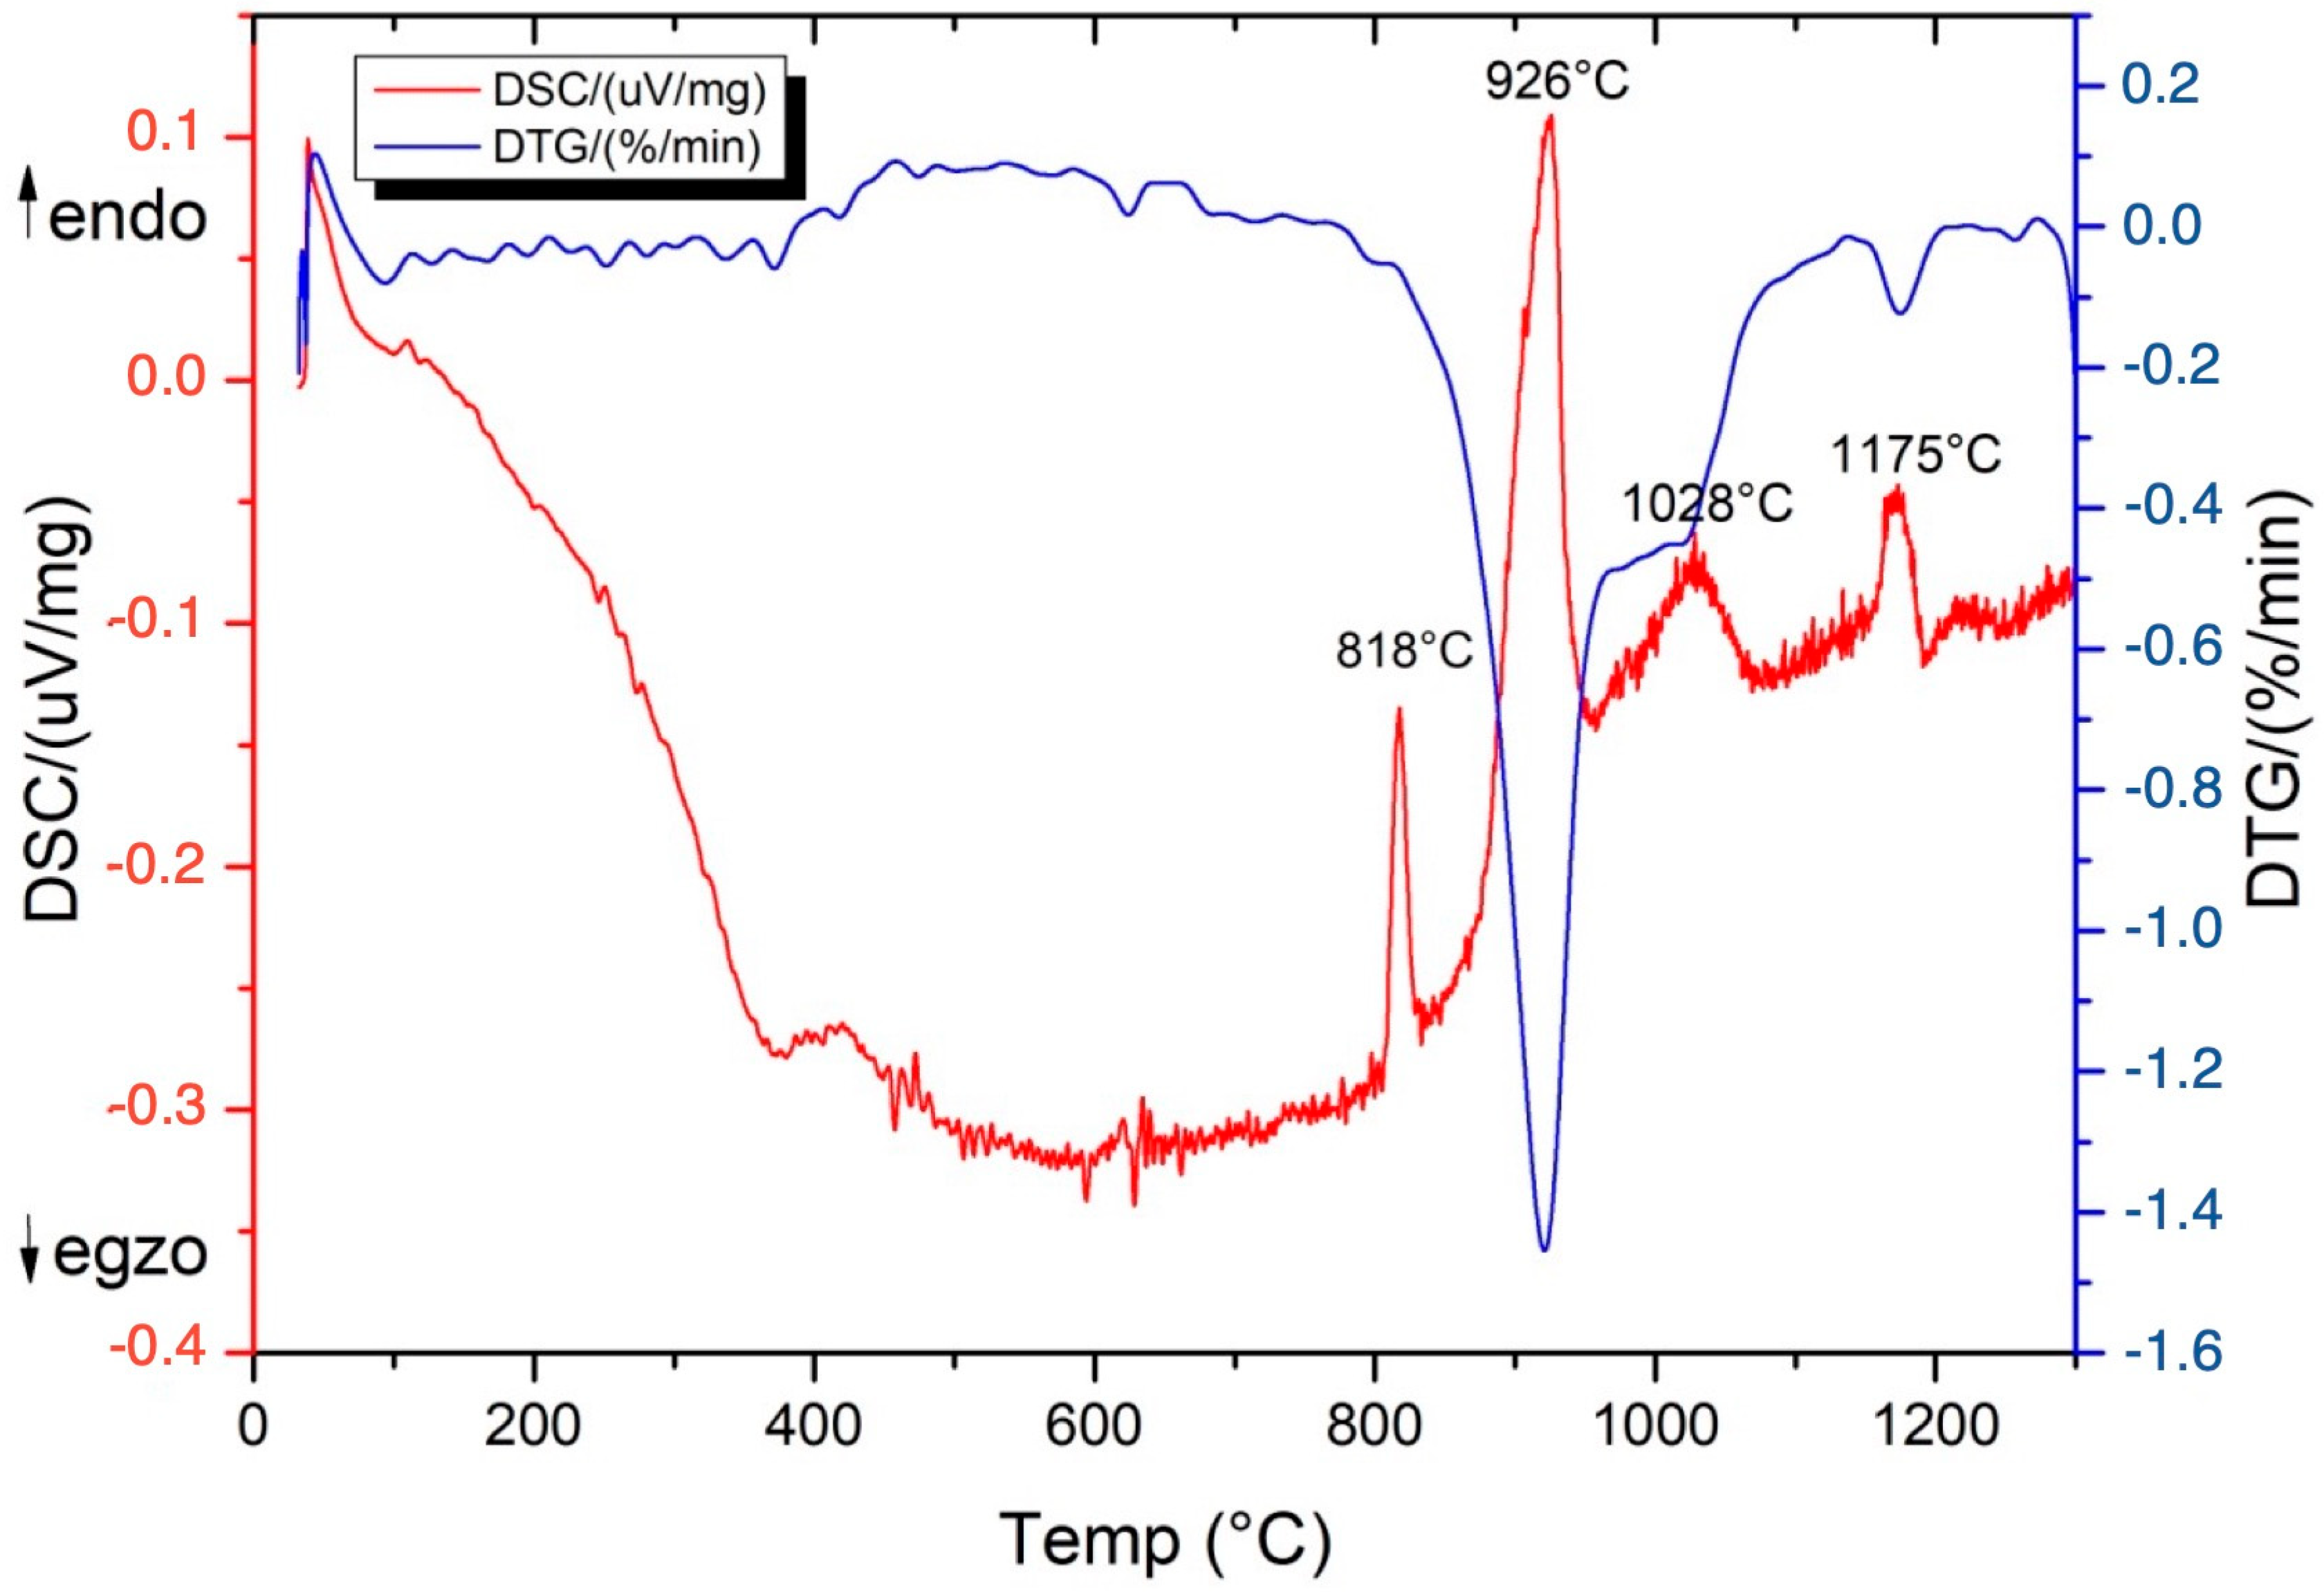
The non-reacted mixture Y–123 was heated and analyzed by simultaneous differential scanning calorimeter (DSC) and thermogravimetry (DTG) in an inert gas atmosphere. The measured data, shown in
Figure 7, stress endothermic features at 818 °C, 926 °C (Y–123 phase), 1028 °C (green phase Y
2BaCuO
5), and 1175 °C. The endothermic peak at 818 °C is indicated by the absence of BaCO
3 decomposition. Obviously, a reaction involves no barium, which sounds like the group of oxides Y
nCu
nO
x referred in the literature to as delafossites. The lowest member is hexagonal YCuO
2, first synthesized by Ishiguro and co-workers [
9] and later examined by Aride and co-workers [
10].
The starting powder components for the preparation of Y2Cu2O4 are Y2O3 + Cu2O, pressed in pellets and fired for 24 h in vacuum at 818–820 °C. The pink-coloured pellet becomes reddish-black and insulating, while the XRD record confirms the presence of YCuO2, non-reacted Y2O3 and elementary Cu. Preparations at 0.5 and 1 bar oxygen result in reddish and green/grey colours, respectively, both species being insulators. Lattice parameters of the hexagonal cell are a = 0.35206 nm and c = 1.1418 nm.
The next experiments were focused on the insulating samples Y
2Cu
2O
4 doped by comparatively small oxygen pressures.
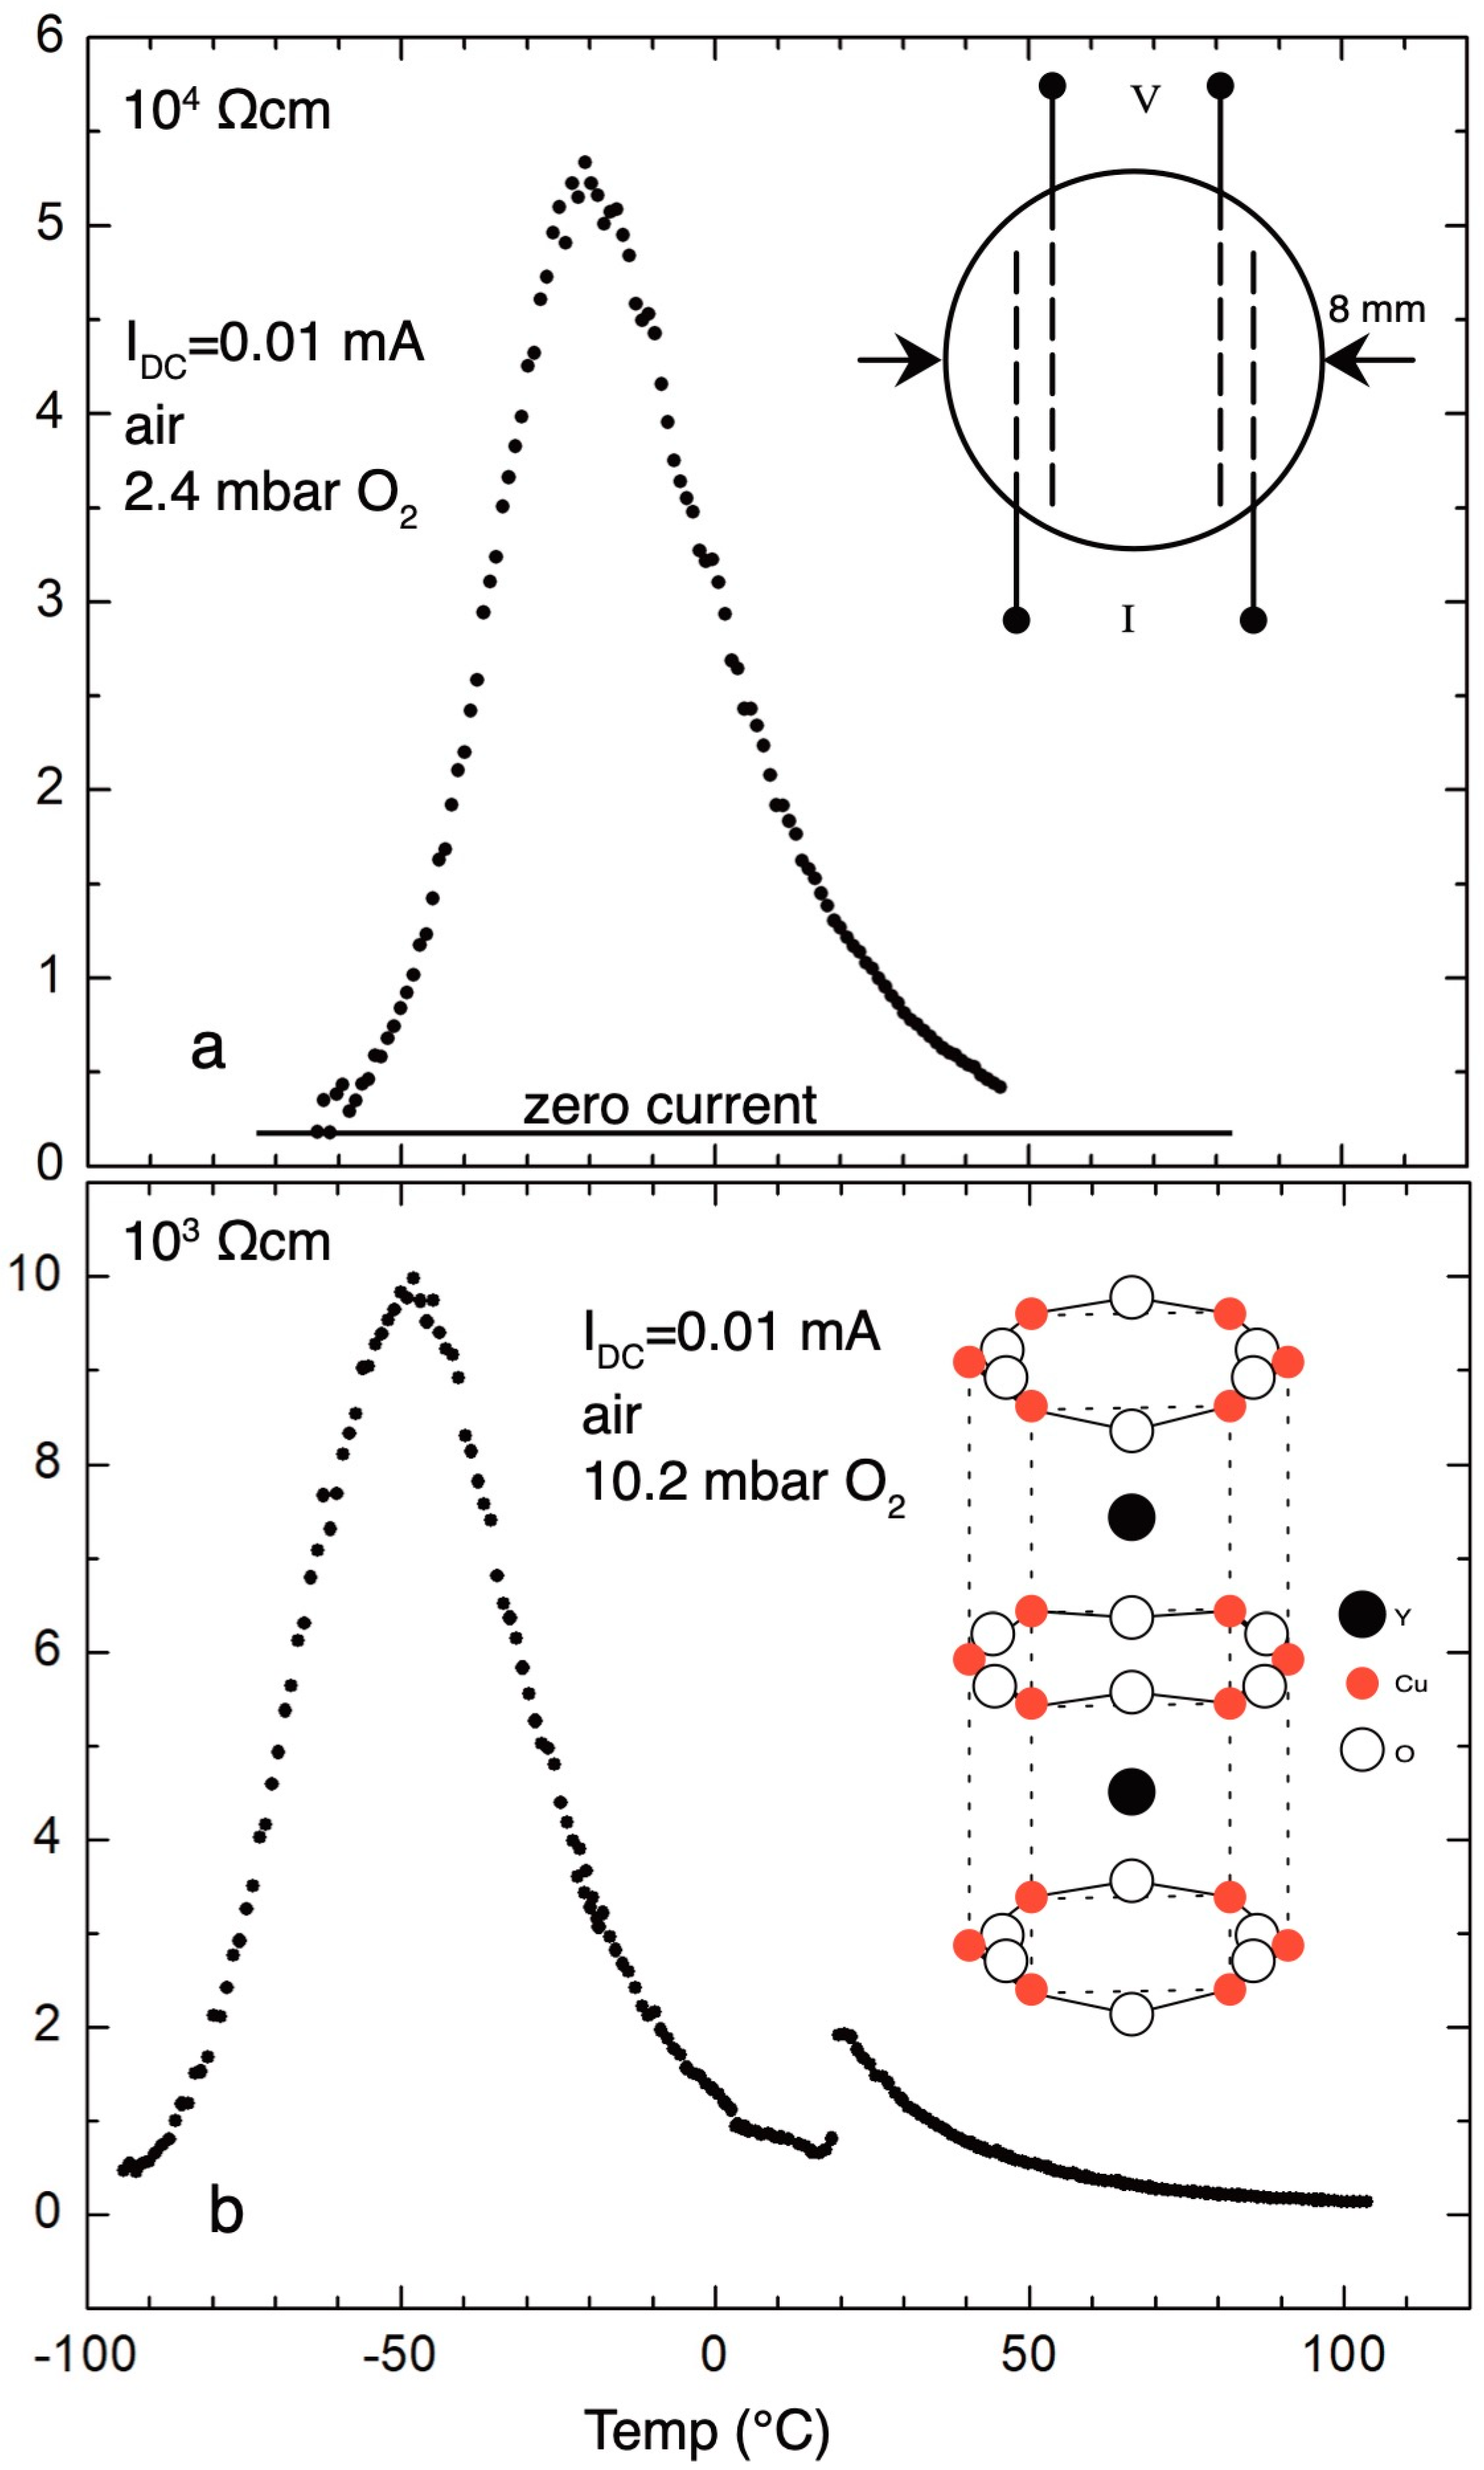
Figure 8a,b show a gradual decrease of the resistivity, measured in air, with increasing oxygen pressure in the reaction cell. Inset of
Figure 8a presents the structure of the pellet prepared for the measurement of the electric resistivity. The pronounced maxima of resistivities are observed at −21 °C and −53 °C for oxygen pressures of 2.4 and 10.2 mbar, respectively.
It was observed that annealing near 40–50 mbar oxygen results in the lowest resistivities, in the order of 10−4 Ωcm at the ice point, and by further increase of the oxygen pressure, higher than 150 mbar, samples gradually become insulators again. In both extreme cases, the valency of copper is uniform: Cu+ in zero pressure annealing and Cu2+ in 1 bar. The mixed valency state Cu+/Cu2+, as a precondition for conductivity, is established for oxygen pressures between 0.01 and 0.5 bar. Depending on the annealing pressure, pellets are differently coloured, which appeals for the more complex pressure-temperature phase diagram.
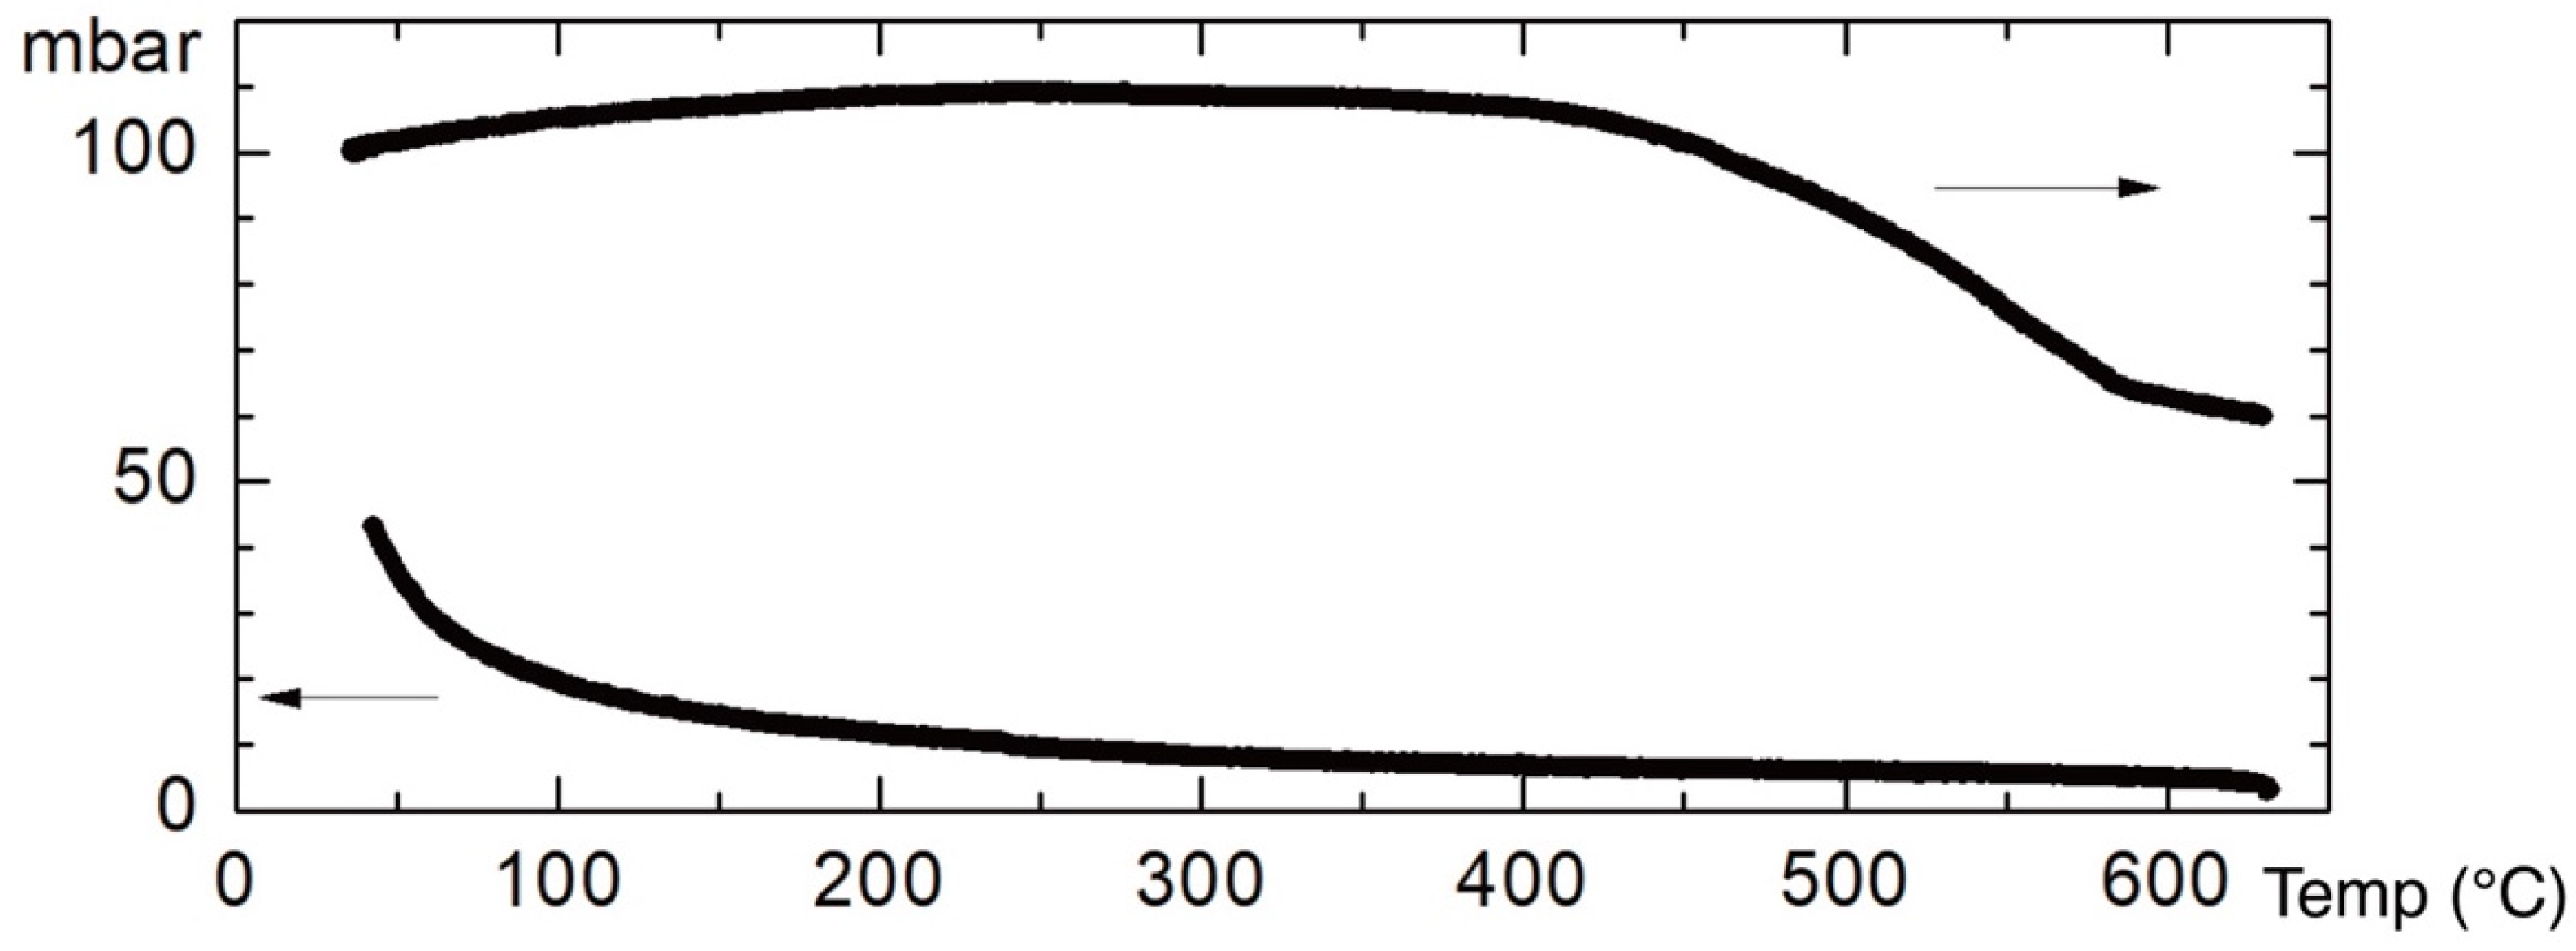
The next doping pressure, dependent on temperature, is shown in
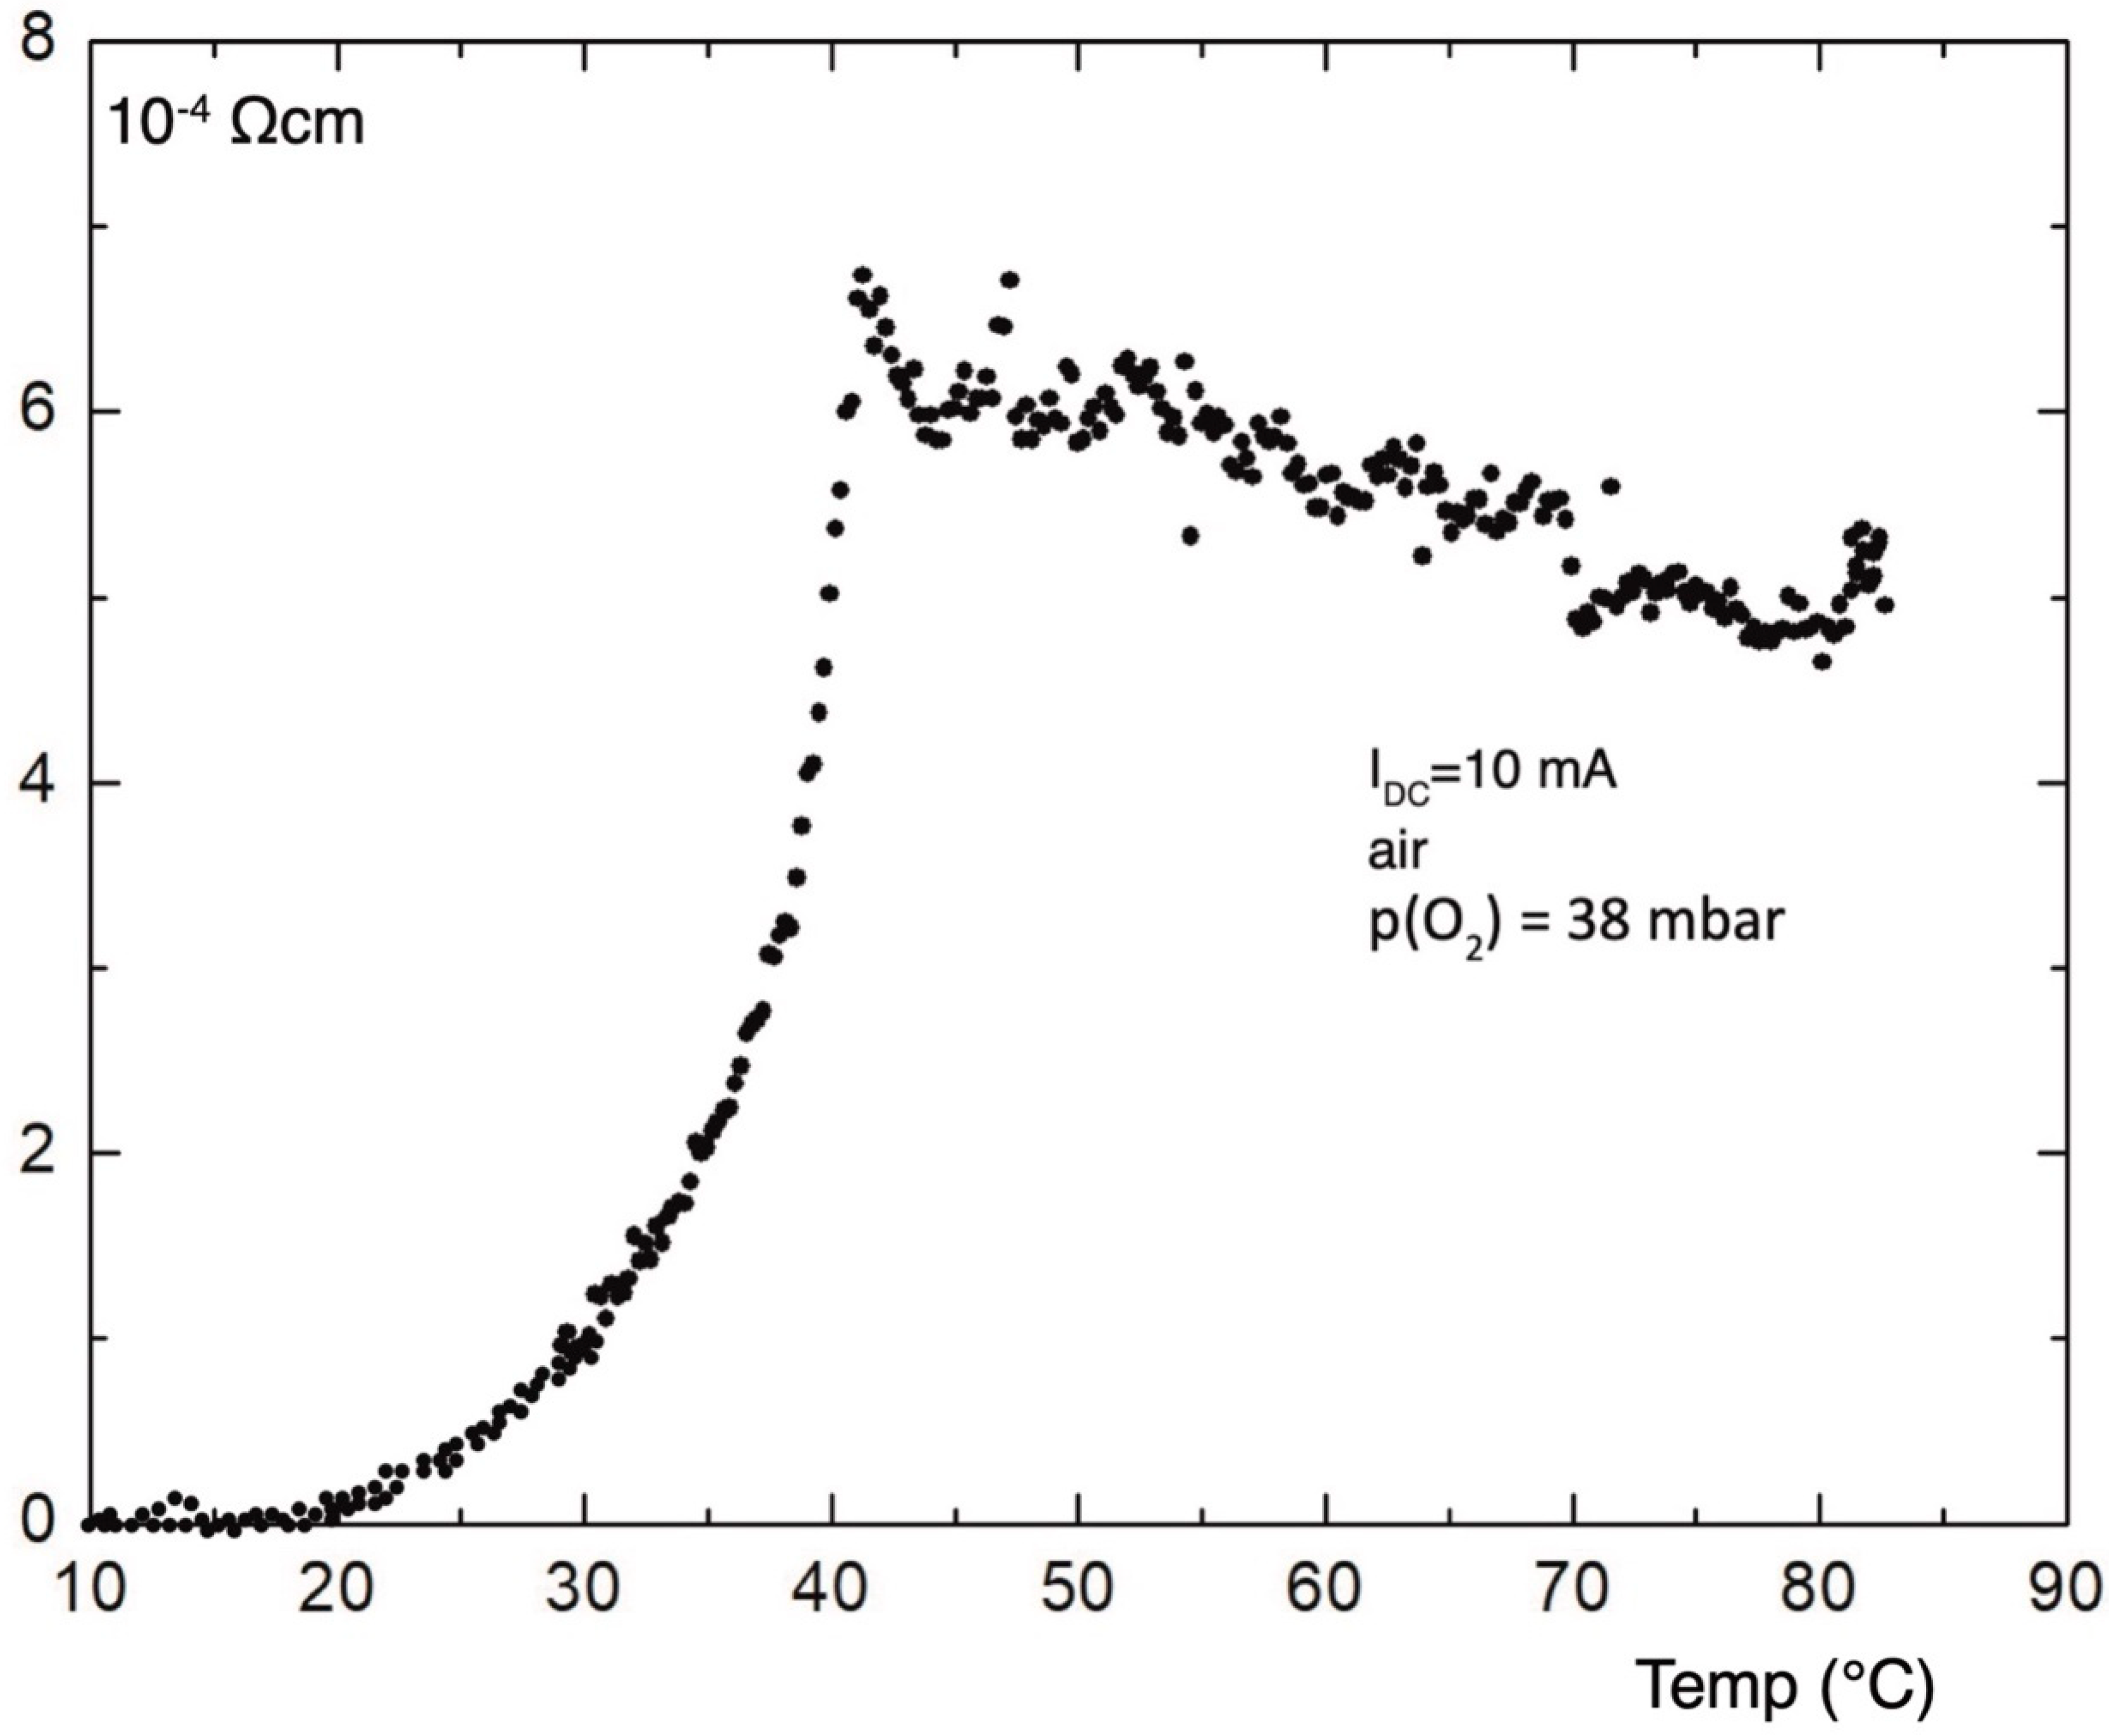
Figure 9. The starting pressure at RT was 100 mbar. In order to minimize the background increase of the pressure due to the heating, the pressure cell was externally buffered. The absorption starts at 395 °C and finishes at 587 °C. In order to eliminate the contribution of the oxygen that adhered on the grain boundaries, the pressure cell was evacuated prior to cooling to RT, and an increase of the released oxygen was visible at temperatures approaching RT. The remaining oxygen pressure in the air was 38 mbar, also confirmed by a weight control.
Figure 10 shows the temperature dependence of the electric resistivity measured in air, after annealing in oxygen at temperatures up to 645 °C, as presented in
Figure 9; it decreases comparatively slow by cooling, due to the high measuring current of 10 mA. Resistivity falls below 10
−6 Ωcm at a temperature of less than −100 °C.
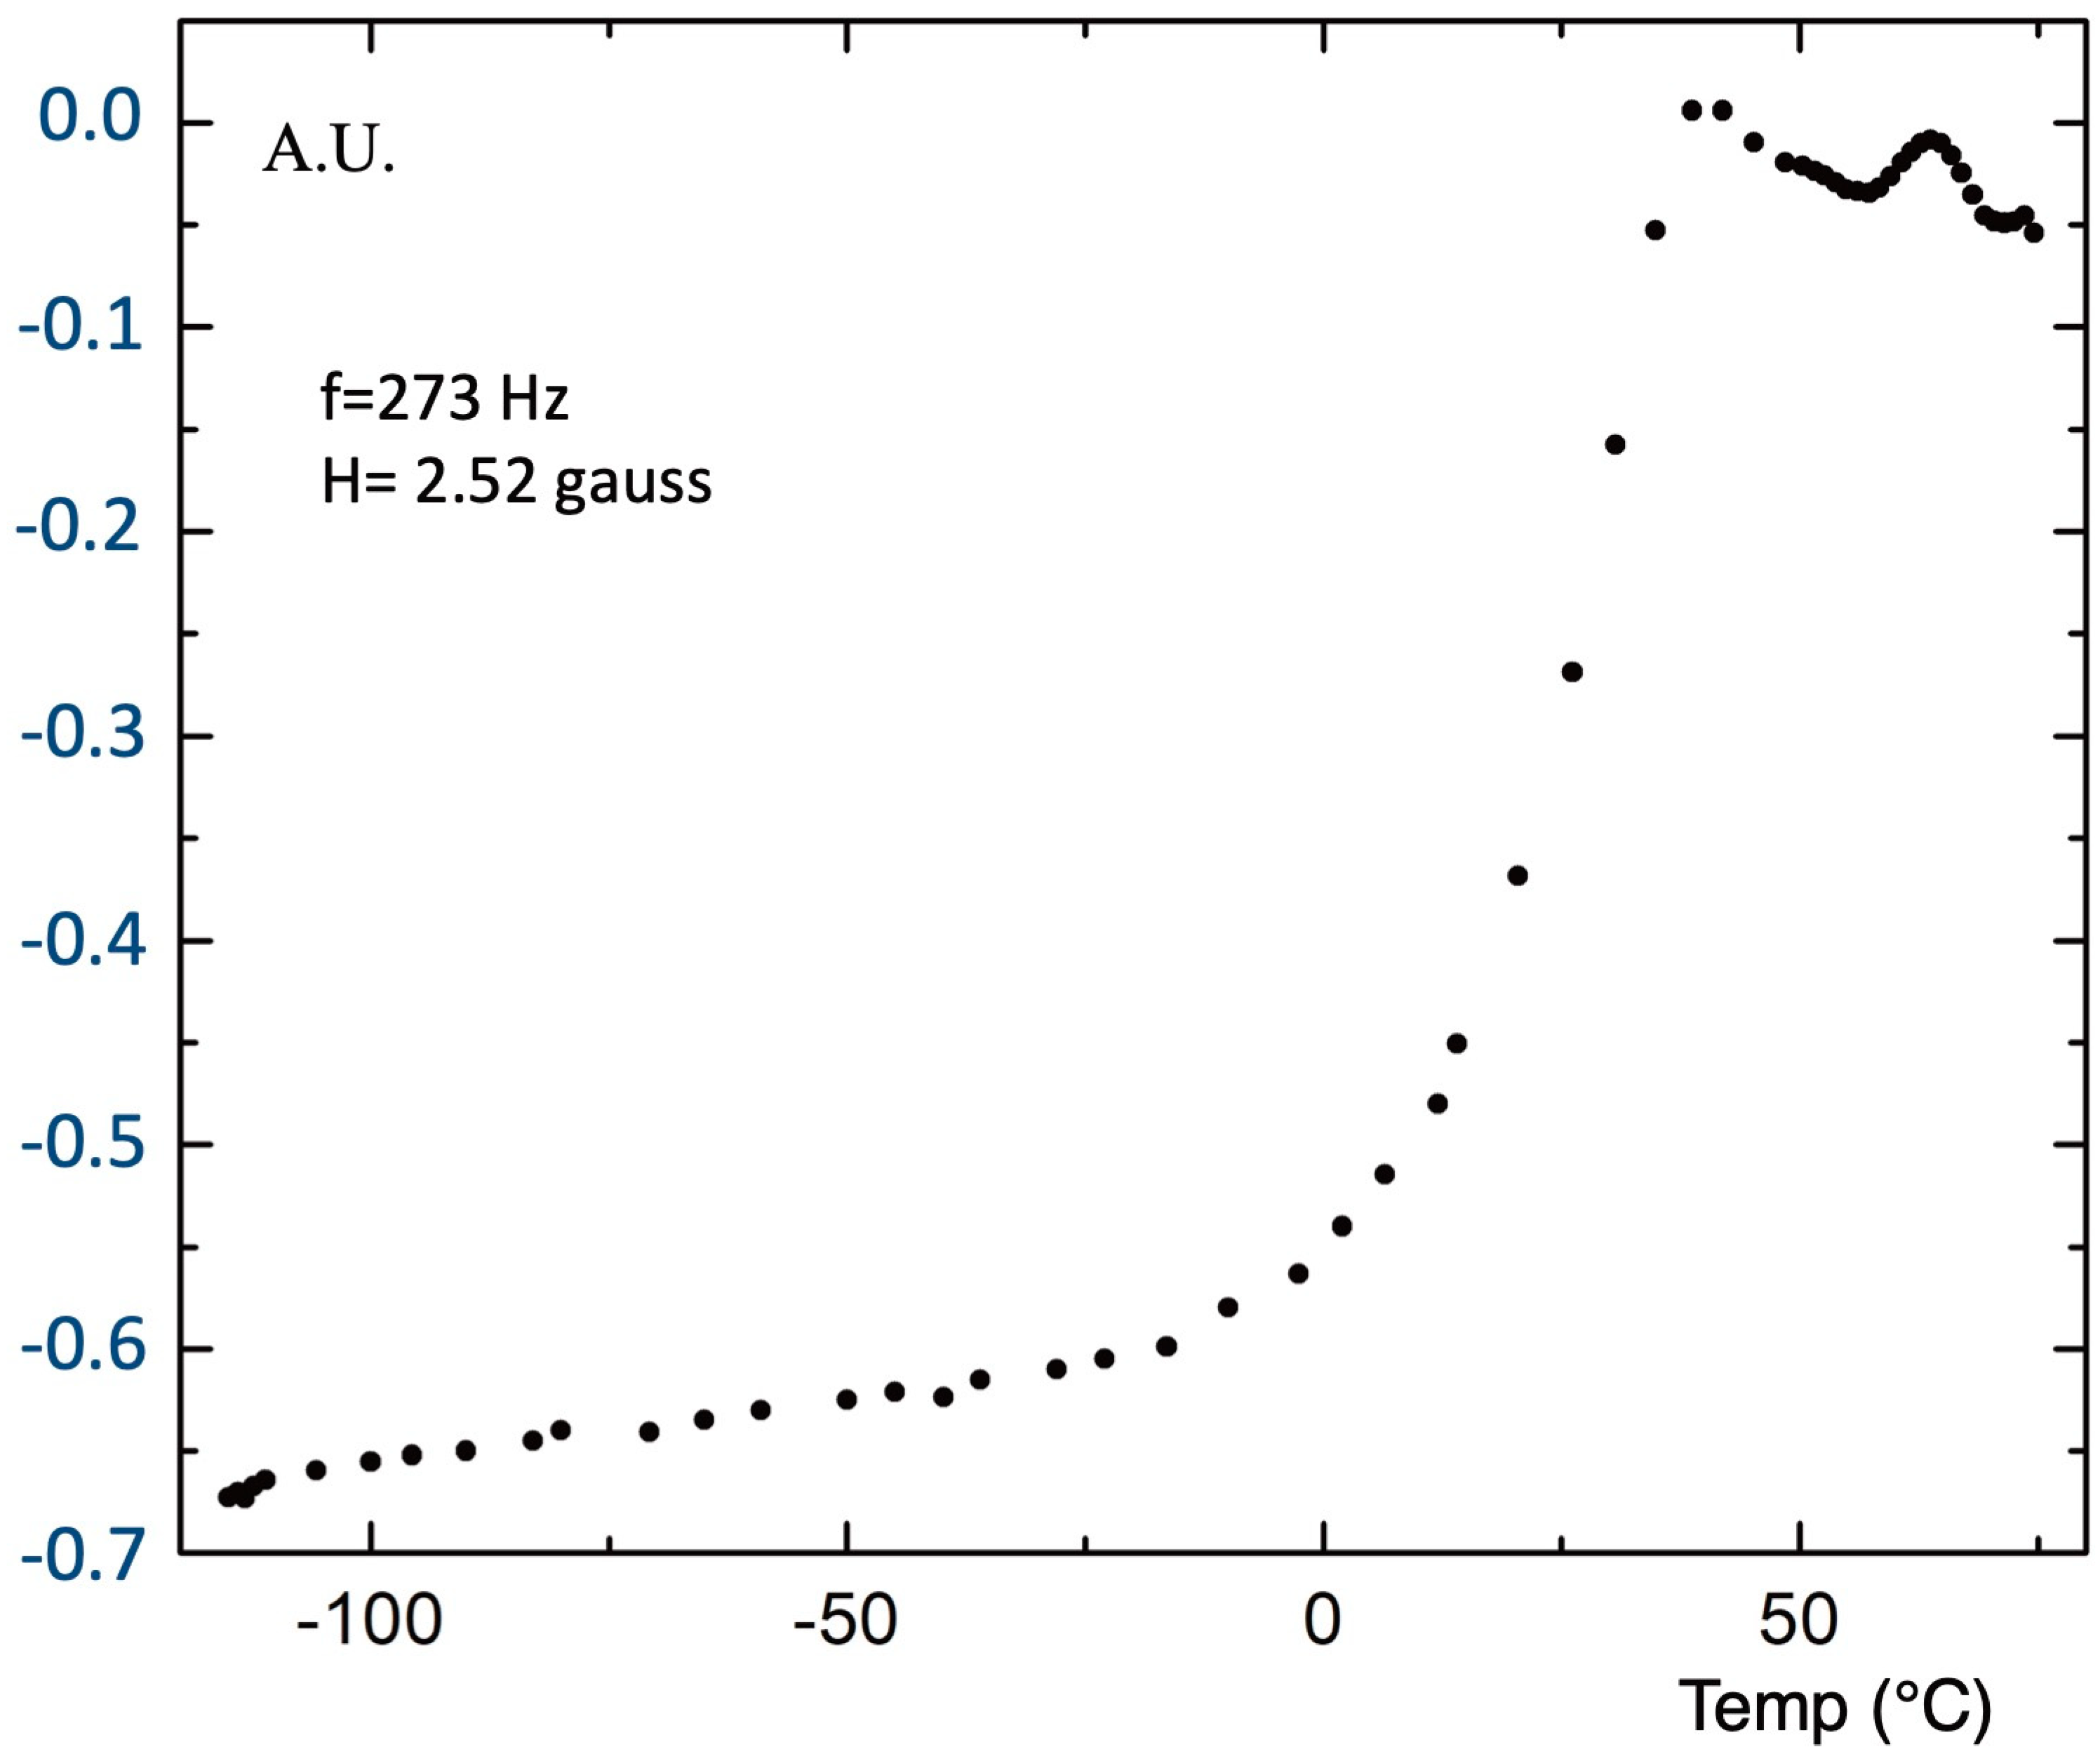
The AC magnetic susceptibility of the pellet presented by resistivity, shown in
Figure 10, was measured in air by use of a primary and two secondary coaxial coils. The signal from the two secondary coils was compensated when both were empty. A certified pellet of High Tc superconductor GdBa
2Cu
3O
7–x, with a diameter of 10 mm and thickness of 1 mm, was used as an etalon. The temperature dependence of AC susceptibility is shown in
Figure 11.

