Although the atomic relaxations suggest that all the structures in
Table 1 are stable, we will demonstrate that some of them are not, thereby showing that DFT-GGA alone is not sufficient to predict the correct structures of small copper clusters. On the other hand, based on our current knowledge, previous theoretical studies by other authors have only considered the GGA approach in the DFT framework to study the structures of small copper clusters, and, therefore, we can find different results among similar works. For example, Cogollo-Olivo et al. [
21] and Ahmed et al. [
22] reported two stable isomers for Cu
, one of them being an isosceles triangle (GS) and the other a bent-type isomer. Moreover, Guvelioglu et al. [
36] also used DFT-GGA and reported two stable triangular isomers for Cu
, whereas Lammers and Borstel [
67] used the tight-binding method and instead reported four. In our case, the DFT-GGA atomic relaxations suggest an equilateral triangle as the GS of Cu
(A isomer in
Table 1) and a linear isomer as the stable structure (B isomer in
Table 1). An equilateral triangle was also proposed as the GS for Cu
in [
18,
19], and a linear isomer was also proposed as the stable GS for Cu
in [
18]. In the same way, for Cu
, Guvelioglu et al. [
36] and Cui-Ju et al. [
18] suggested the possibility of a metastable tetrahedral structure (using DFT-GGA), but Cogollo-Olivo et al. [
21], using the same level of theory, showed that this isomer is not stable, whereas our DFT-GGA atomic relaxations also predict the possibility of a tetrahedral structure (F isomer in
Table 1), Furthermore, this tetrahedral isomer was proposed as the GS for Cu
in [
17,
19] who used the Monte Carlo and tight-binding methods, respectively. Structures C and D in
Table 1 are in agreement with those reported in [
21,
22,
36], whereas the E isomer for Cu
was also reported in [
36]. Our atomic relaxations do not predict the other Cu
isomers reported in [
21]. Regarding Cu
(clusters with this particular size have been already synthesized and proposed as promising catalysts [
1,
5]), the G and H isomers in
Table 1 were also reported by Cogollo-Olivo et al. [
21], Ahmed et al. [
22], and Guvelioglu et al. [
36], whereas our DFT-GGA atomic relaxations also predict the I, J, and K structures for Cu
. Moreover, the J isomer was also suggested as stable by the authors of [
18], and the H structure was proposed as the GS for Cu
in [
17]. Finally, for Cu
, the L, M, N, and O structures in
Table 1 were also reported by Cogollo-Olivo et al. [
21], whereas the P and Q isomers were reported in [
36], and the last structure (R) for Cu
was obtained by our DFT-GGA atomic relaxations. In addition, the L isomer was also proposed by the authors of [
18,
20,
22], the M, N, and P isomers were also proposed by the authors of [
18], and the P isomer was also proposed as the GS for Cu
by the authors of [
17,
19], who used the Monte Carlo and tight-binding methods, respectively. To clarify why there are some different results in the works mentioned above and identify which structures in
Table 1 are really stable, we use other approaches in the next subsections of this work.
3.1. Binding Energies of Cu Clusters
Binding energies (
) are usually used to determine the ground state (GS) of each group of isomers. The isomer with the highest binding energy is the GS, and the isomers with negative binding energies are not stable. In this work, the binding energies were calculated for all the isomers in
Table 1 using DFT + SGGA + vdW +
U (DFT with GGA, spin-polarized calculations, van der Waals (vdW) dispersion forces, and Hubbard-
U correction), the values of
U term were varied from 0 to 9 eV, and the results are shown in
Table 2,
Table 3 and
Table 4. In these tables, the isomers A, C, G, and L are the GS of each group of copper clusters with 3–6 atoms, respectively. In
Table 2,
Table 3 and
Table 4,
are the relative binding energies and the binding energy differences between each isomer and the corresponding GS.
In this study, spin-polarized calculations and vdW forces have minor relevance in determining the binding energies’ values, whereas the
U term produces larger changes in the
values (see
Table 2,
Table 3 and
Table 4).
decreases for all structures in
Table 1 when the value of
U increases. This is the first effect we can observe due to the inclusion of
U. The second is that the decrease in
is not in the same proportion for all isomers. In some, the decrease is greater than in others, which can be observed in the data for
in
Table 2,
Table 3 and
Table 4. For some structures,
increases, and for others, it decreases when the
U term enhances. Therefore the
U term produces an energetic rearrangement in the structures. Note that when
, the energetic arrangement of the isomers is as shown in
Table 5.
For
eV, the energetic arrangement of the isomers is as shown in
Table 6. In
Table 5 and
Table 6, it can be seen that the GS of the structures is the same for
and
eV, but for Cu
and Cu
, there are changes in the order of some isomers. For example, when
, the second isomer of Cu
is (H), the third is (I), the fourth is (J), and the fifth is (K). But when
eV, the (I) isomer becomes the second, the (K) isomer is now the third, and H and J become the fourth and fifth, respectively. Therefore, we can say that the
U term favors 2D structures because the
of the 3D structures (H and J) increases more than the
of the planar isomers (I and K). A similar analysis can be made for Cu
, where for
eV, the O, N, P, R, and Q isomers become the third, fourth, fifth, sixth, and seventh, respectively. In addition, for
eV, the N isomer of Cu
does not converge. But for
eV, that structure does converge. So the following question can be asked: What is the correct value of
U for copper clusters? We provide a response to that question later.
On the other hand, recalling the main objective of this work, it can be observed in
Table 2,
Table 3 and
Table 4 that the atomic relaxations with the
U term can still predict stable copper clusters. We proceed to carry out another type of analysis. For this, we start with Cu
clusters.
3.1.1. Energy Landscape for Cu Copper Clusters
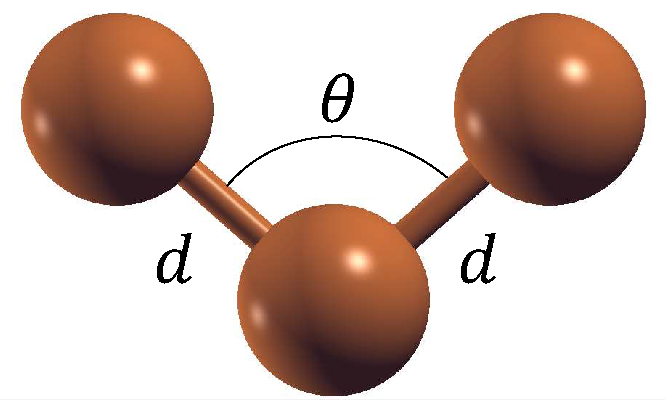
Figure 1 shows a general Cu
copper cluster. It is possible to find all the isomers for Cu
by varying the angle (
) and calculating the optimal interatomic distance (
d).
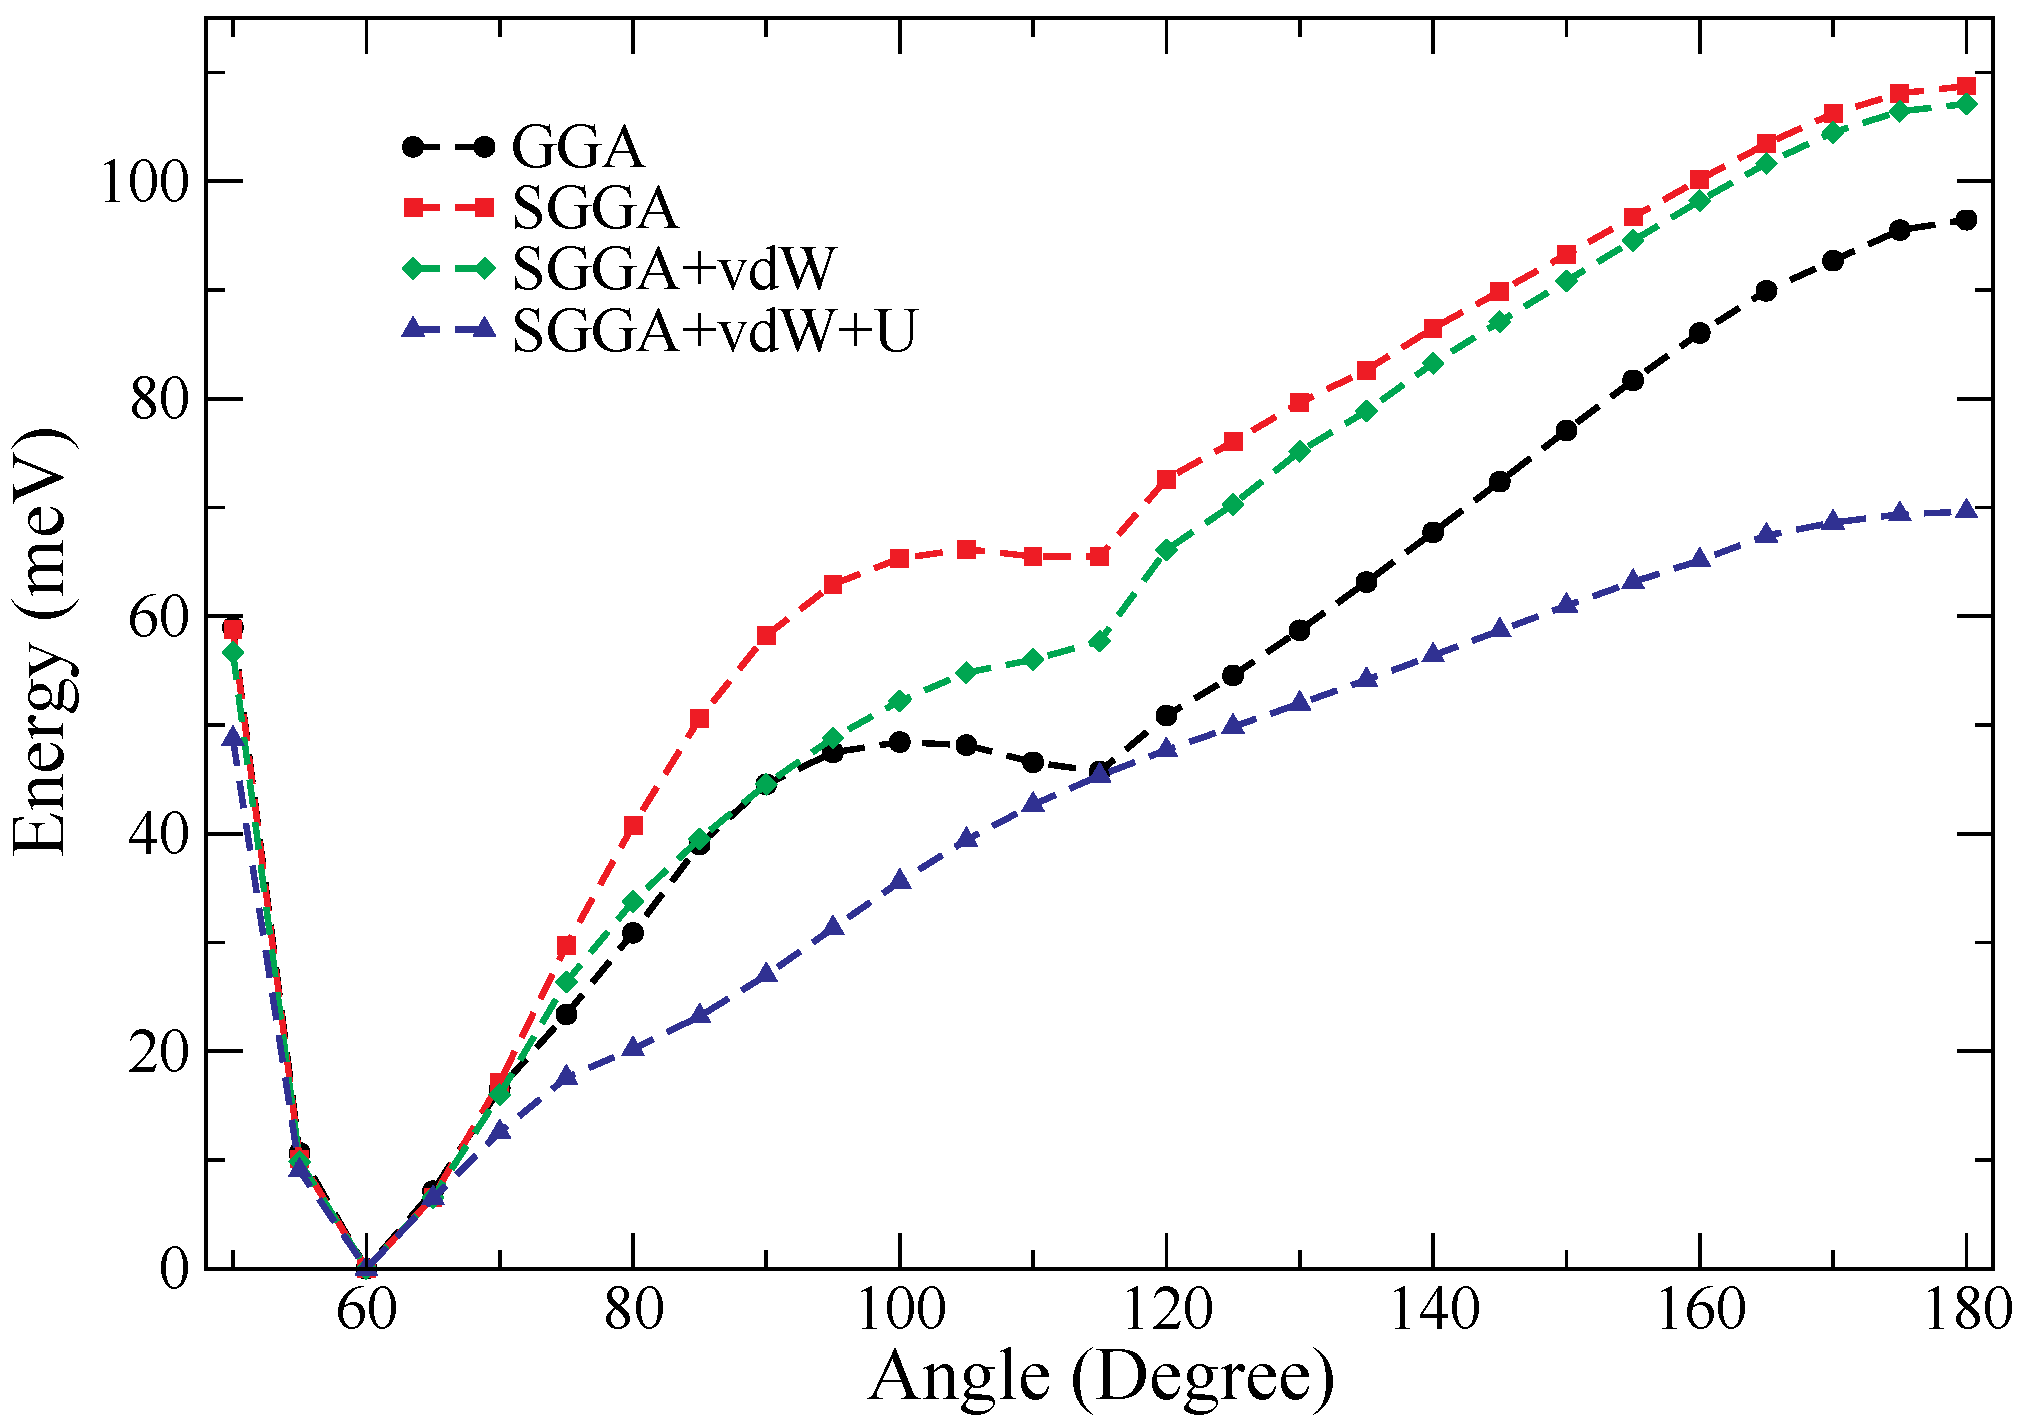
In
Figure 2, the energy landscape of Cu
is shown. To make this graph, we fixed several angles (from 0 to 180 degrees in steps of 5 degrees) and identified the optimal
d distance, which minimizes the energy for each of them. We see that using just GGA (black curve), it predicts two minimum energy points (
), representing two stable isomers, as reported in [
21,
22]. The minimum energy point (near
) tends to disappear when the spin-polarized calculations (red curve) and vdW dispersion forces (green curve) are introduced (here, the first effect due to spin-polarized calculations and vdW forces is observed). Finally, when the Hubbard
U term is taken into account (blue curve), there is only one minimum energy point on the energy landscape of Cu
, corresponding to one stable isomer for Cu
, which is an equilateral triangle (
). The inclusion of the term
U rules out the possibility of finding the metastable isosceles triangle reported in previous DFT studies [
21,
22,
36]. On the other hand, in
Figure 2, it can be seen that the linear isomer for Cu
corresponds to a maximum energy point (
); therefore, the linear isomer Cu
(B) in
Table 1 is unstable. By analyzing the behavior of the Cu
(B) isomer, we can see that the atomic relaxations could converge on structures that correspond to points of maximum energy in the energy landscape. However, the point of maximum energy seen in
Figure 2 at
is really a saddle point. In other words, at this point, the energy is a function of two variables
E(
,
d). Therefore, for variations of
, the behavior of the energy is as shown in
Figure 2, whereas for a fixed
value (
) and variations of the interatomic distance (
d),
E(
,
d) has a minimum at
. So we can ask: Which of the structures in
Table 1 are also unstable (saddle points for the energy)? Building the energy landscape for Cu
, Cu
, and Cu
is not easy, so we must find other ways to determine the stability of copper clusters.
3.1.2. Binding Energies Calculated Using the HSE Hybrid Functional
Using the HSE hybrid functional, atomic relaxations were also performed for all structures in
Table 1, and the values of the binding energies are shown in
Table 2,
Table 3 and
Table 4. It can be seen that the
values calculated using the HSE are lower than those found using SGGA + vdW +
U. On the other hand, it can be observed that the HSE indicates that the isomers Cu
(F), Cu
(J), and Cu
(P) are not stable, in contrast to the predictions using SGGA + vdW +
U.
Table 2,
Table 3 and
Table 4 also show that the HSE indicates a stable configuration for Cu
(N) in accordance with the SGGA + vdW +
U predictions for this structure for
eV. The latter is very interesting because SGGA + vdW +
U predicts that Cu
(N) is unstable for
eV, so we may think that there should be a limit for taking a correct value of
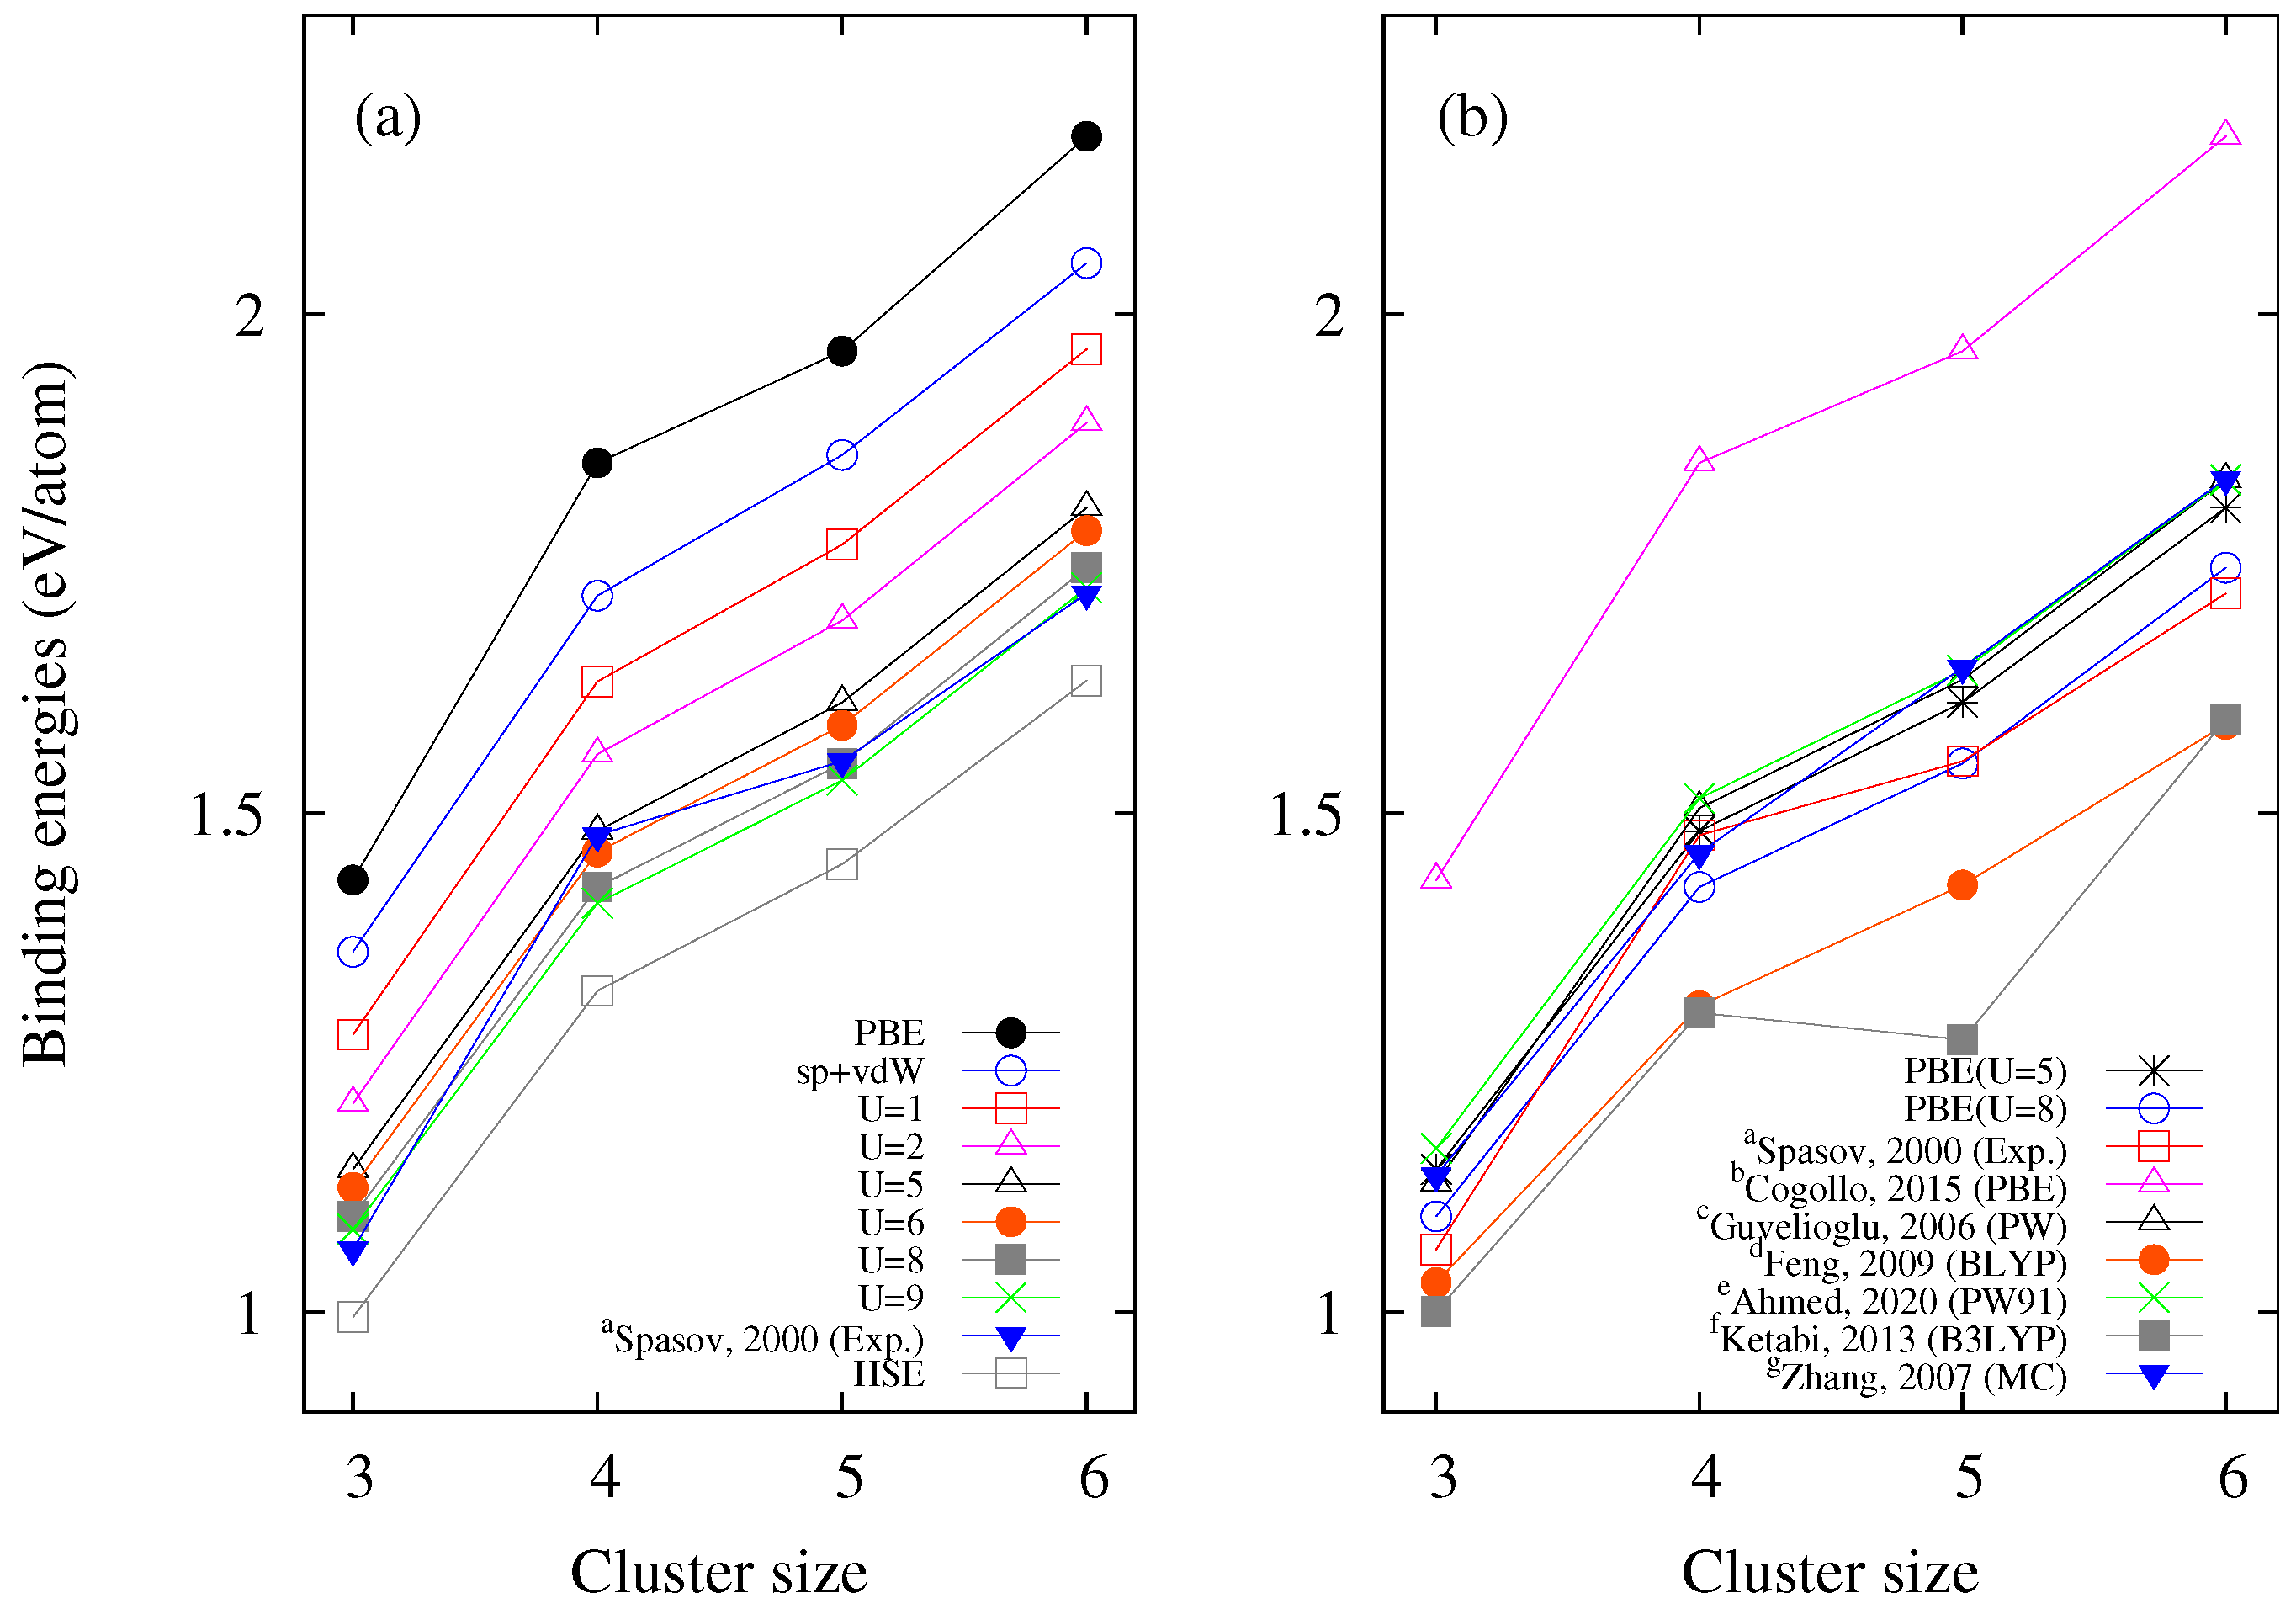
U for copper clusters. In fact, this is confirmed by looking at
Figure 3a, where graphs of the
values are shown as a function of the size of the copper cluster (for the GS) for different levels of theory.
In
Figure 3a, it can be seen that when the value of
U increases, the
values tend to approach the experimental values reported by Spasov et al. (2000) [
23]. It can also be observed that the
values calculated using the HSE hybrid functional are further from the experimental data than those calculated using SGGA + vdW +
U. On the other hand,
Table 2,
Table 3 and
Table 4 also show the values of the binding energies reported by other authors [
17,
18,
19,
20,
21,
22,
23,
36], and
Figure 3b shows a comparison of the binding energies calculated in this work for
and
eV with those reported in other works. It can be seen that our results are closer to the experimental values than those previously calculated, even for
eV. Therefore, we can suggest any value of
U in the interval (
) eV as a suitable choice to work with copper atoms. These values of
U are, in any case, in line with those of previous works that have used values for
U between 4 and 8 eV for copper and copper oxides [
8,
68,
69,
70,
71,
72]. In addition, in
Figure 3a, it can be seen that the values of the binding energies calculated using only spin polarization and vdW (sp-vdW) are closer to the experimental data compared to those found using only PBE. This shows the importance of including these interactions in this work.
Remembering again that the main objective of this work is to study the stability of the structures in
Table 1, the only thing we can say up until now is that for Cu
, there is only one stable isomer. For Cu
, Cu
, and Cu
, we still cannot ensure that these isomers are stable because we did not build their energy landscapes, and as we mentioned before, this is not easy. Therefore, we choose to calculate the vibration frequencies of these structures to investigate which of them are really stable.
3.2. Density of States of Phonons of Cu Copper Clusters
To finish the investigation on the stability of the copper clusters in
Table 1, we calculated the vibration frequencies of these isomers using SGGA + vdW +
U. At this point, we know from the previous subsection what values of
U we can use, so we used
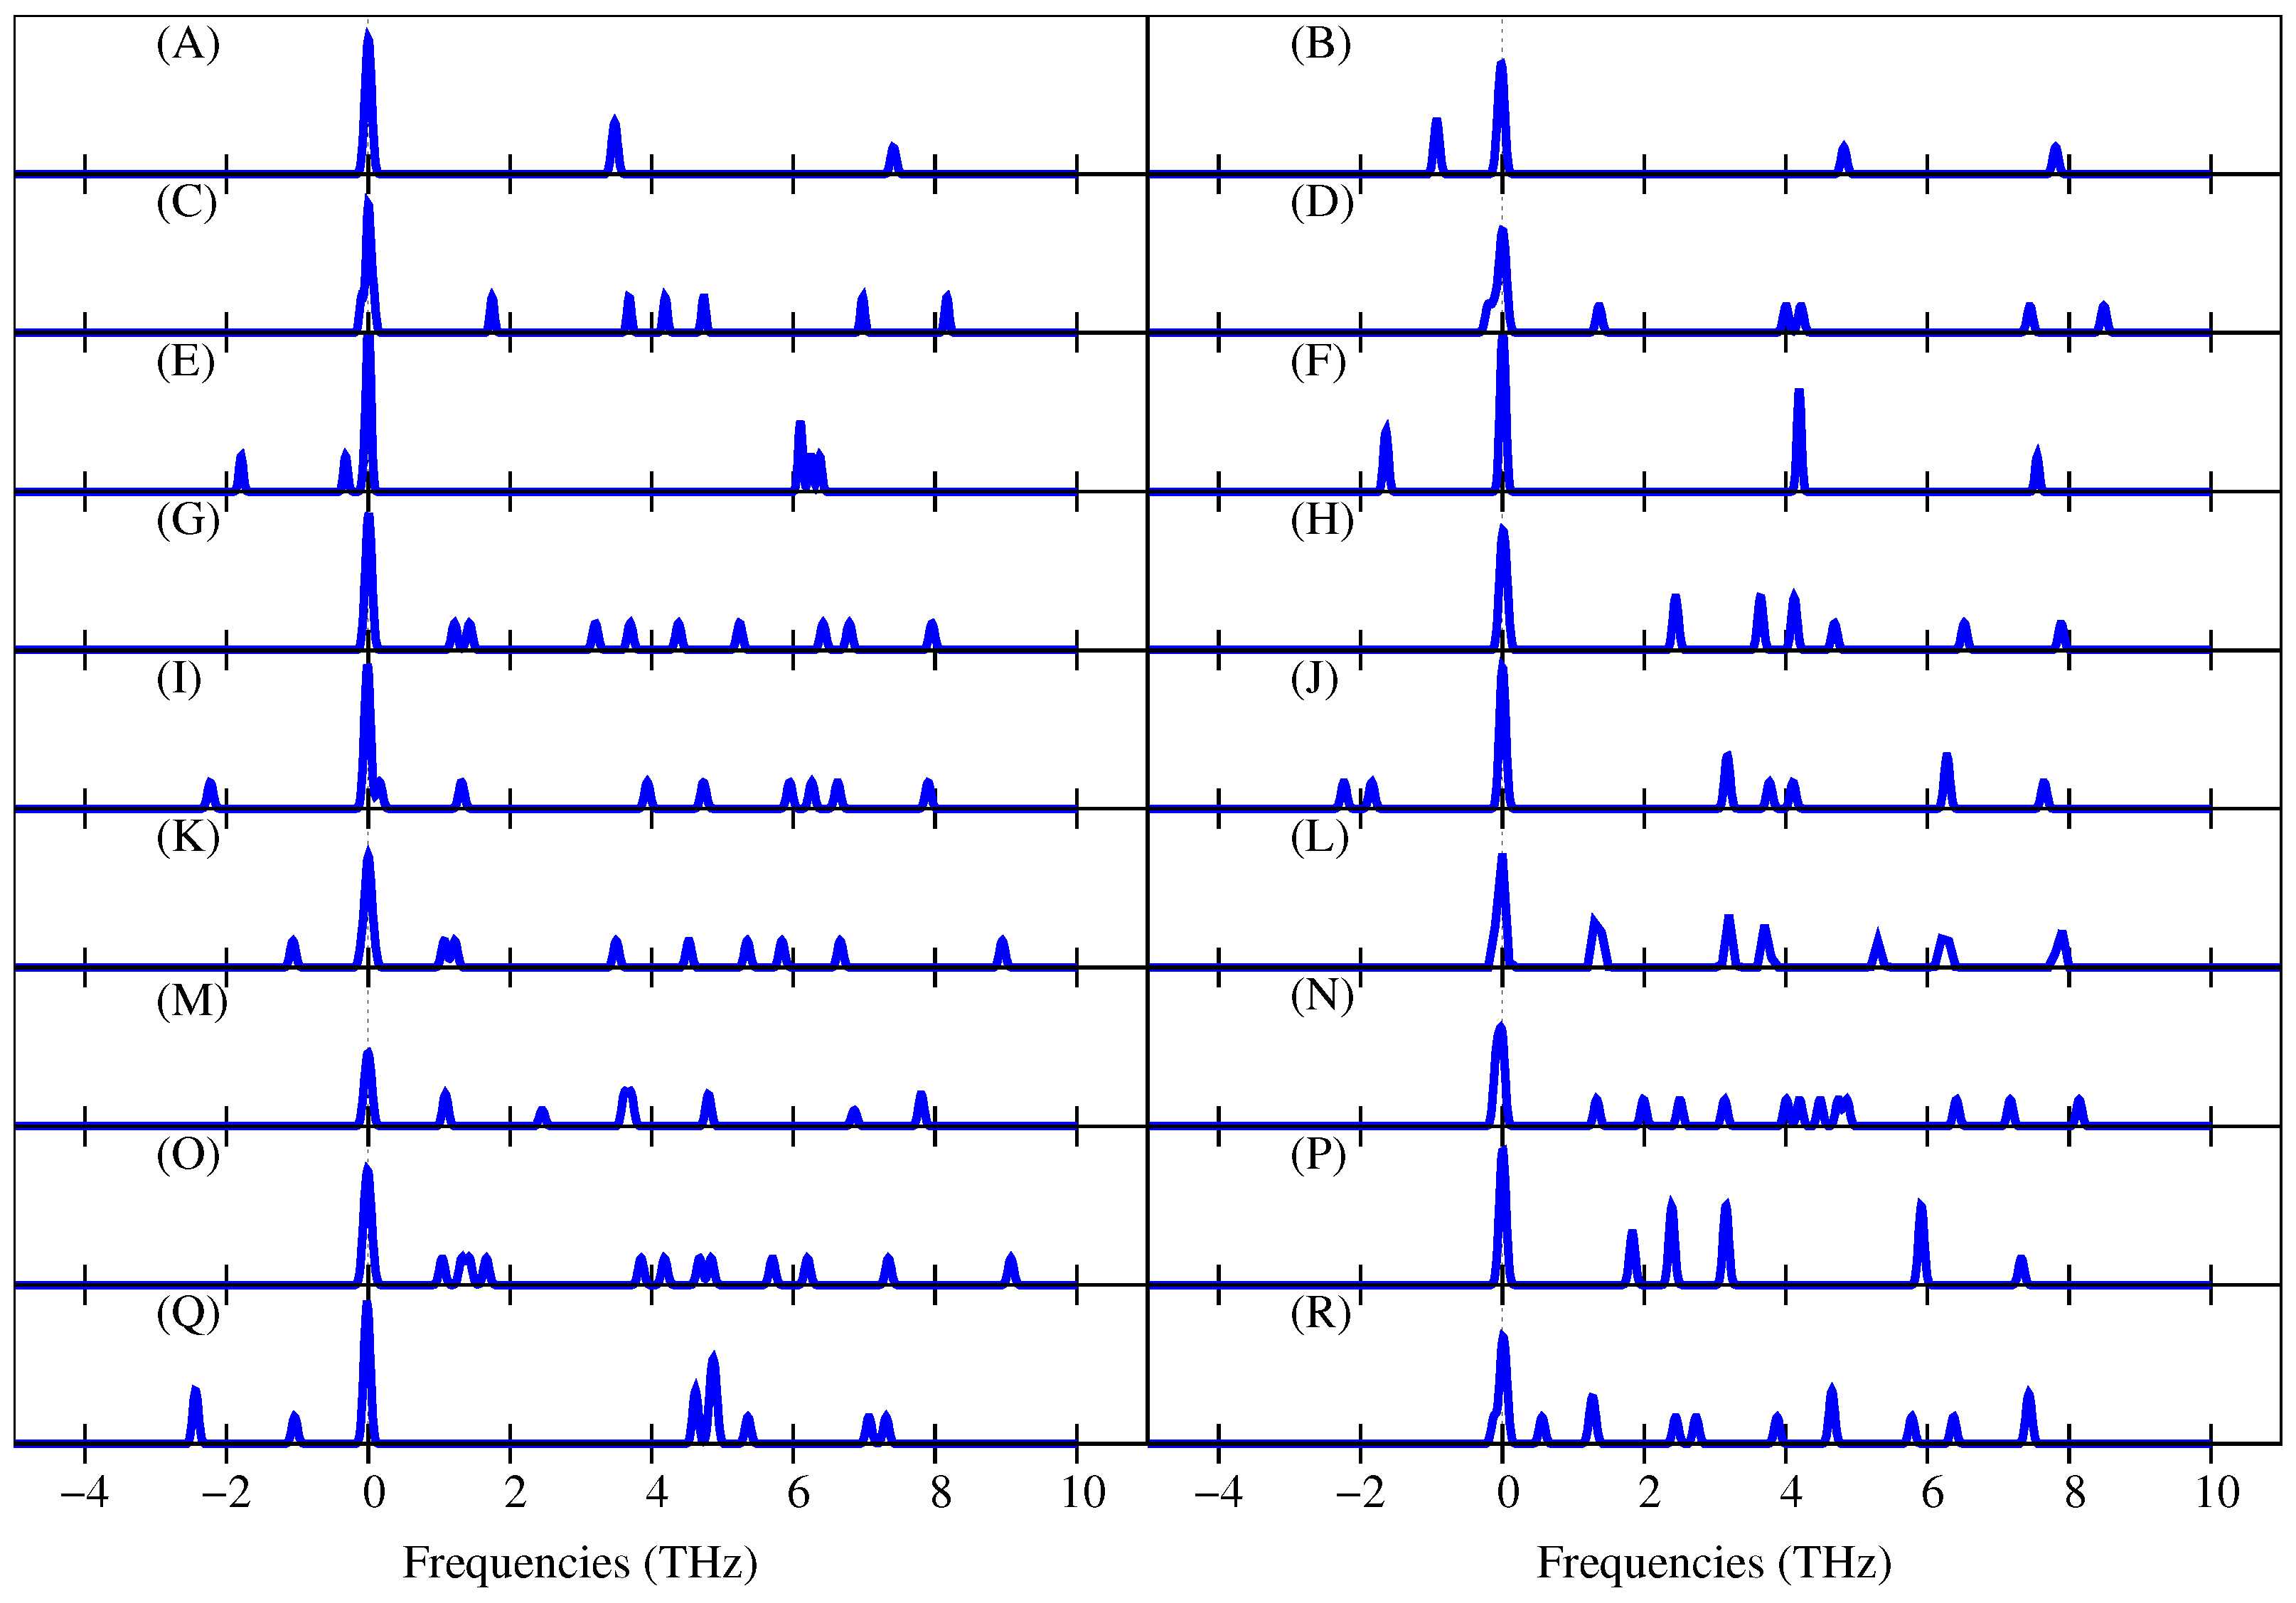
eV to continue. In
Figure 4, the phonon state densities for
eV are presented. Note that Cu
(B) has negative frequencies, confirming that this isomer is unstable. It can also be seen that the phonon state densities of the isomers Cu
(D), Cu
(F), Cu
(I), Cu
(J), Cu
(K), and Cu
(Q) also have negative frequencies; therefore, those isomers are also unstable. Remember that the HSE hybrid functional also predicted that Cu
(F) and Cu
(J) were unstable. Furthermore, the HSE suggested that Cu
(P) was unstable, but the atomic relaxation using SGGA + vdW +
U and the phonon state density predicted that Cu
(P) was stable. In this case, we think that Cu
(P) is really stable, considering that the results of the
values using SGGA + vdW +
U were closer to the experimental data compared to those obtained using the HSE (see
Figure 3a).
Of the 18 initial structures in
Table 1, only 11 are stable: one for Cu
, two for Cu
, two for Cu
, and six for Cu
. We have seen that only the atomic relaxations using SGGA + vdW +
U or the HSE hybrid functional were not enough to determine the stability of the small copper clusters in this study. We also needed to calculate the energy landscape (as for Cu
) or the vibrational frequencies of the isomers to determine their stability.
As an additional result, in
Figure 4, it can be seen that the vibrational frequencies of the copper clusters are between 0 and 10 THz.
3.3. Structural and Electronic Properties of Cu Copper Clusters
In this subsection, the main structural and electronic properties of the eleven stable copper clusters are presented.
Table 7,
Table 8 and
Table 9 show the bond lengths of the isomers for three different values of the
U term. It can be seen that when the
U term increases, all the bond lengths of the isomers also increase. This helps to explain why the binding energies of the isomers decrease when the
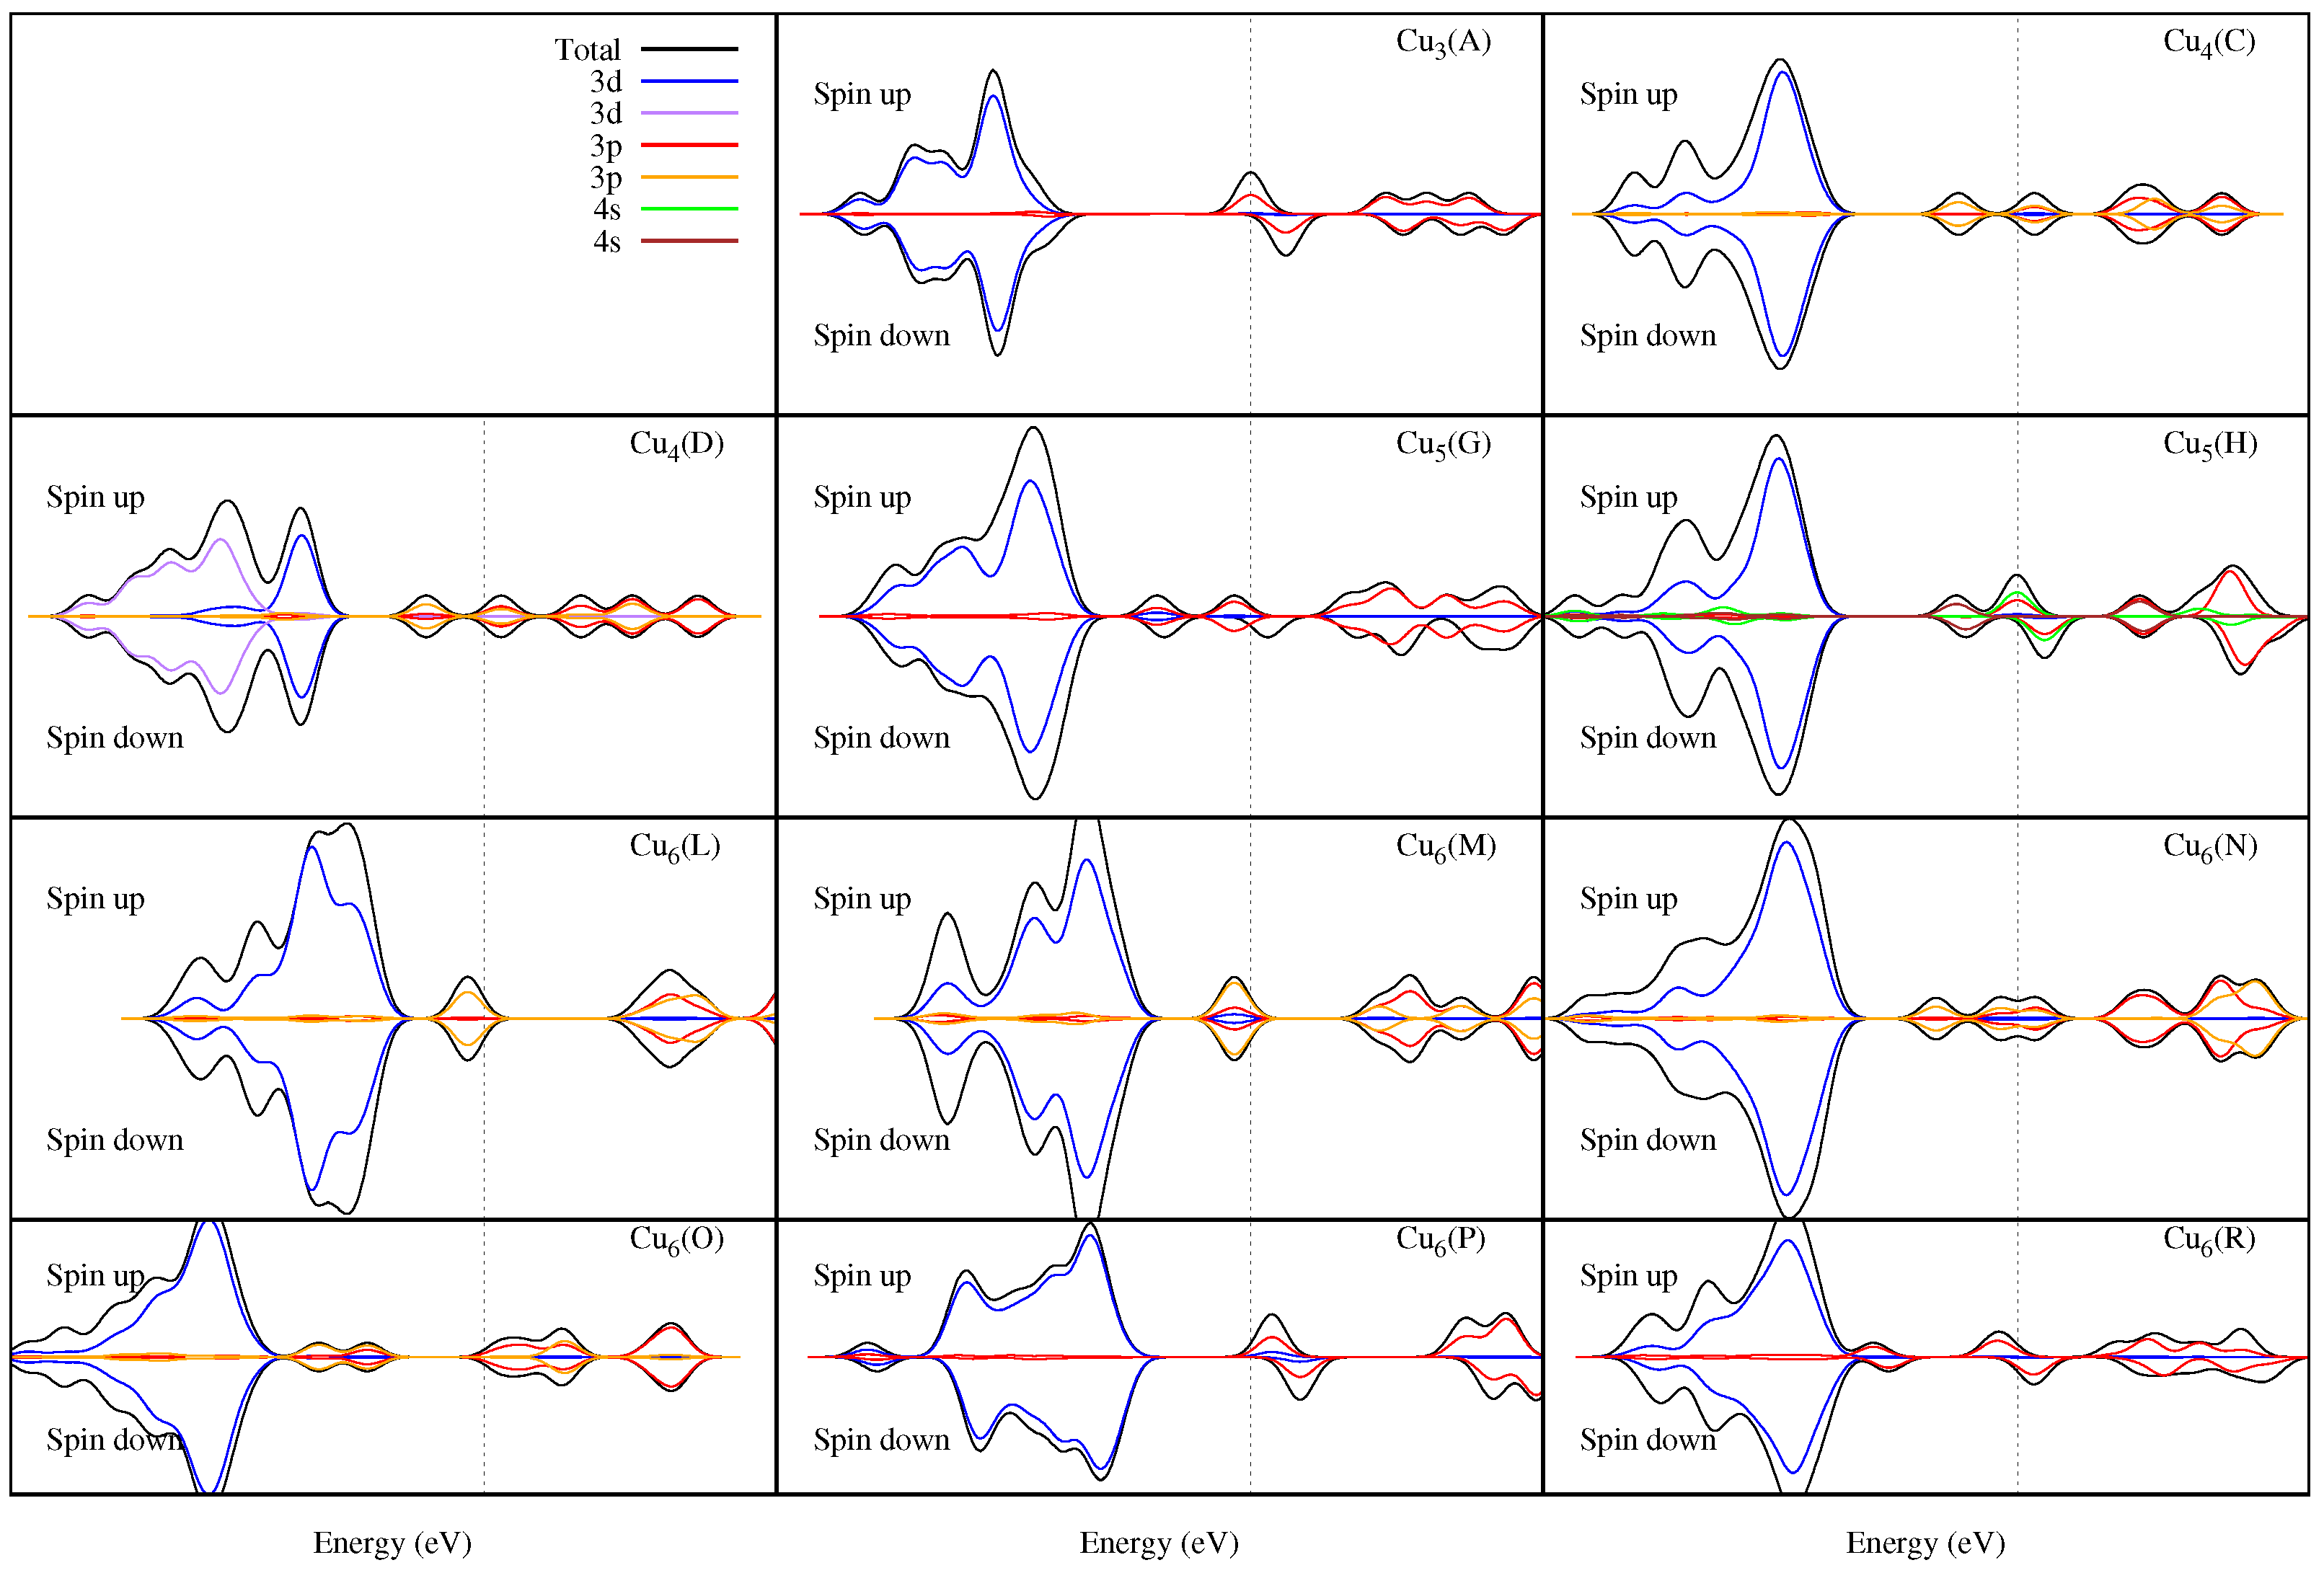
U term increases. We also calculated de density of states (DOS) of these isomers (see
Figure 5) and found that when the
U term increases, an intragap appears within the valence band (see the intragap values in
Table 7 and
Table 9). The latter is also associated with the decrease in the binding energies of the isomers when the
U term increases. The greatest intragaps occur for 3D structures such as Cu
(H), Cu
(N), and Cu
(P), so by increasing the
U term, they have a greater decrease in the binding energies (see
Table 2,
Table 3 and
Table 4).
On the other hand, regardless of the value of
U, we found the following property for the isomers in our study: the binding energies increase with the cluster size. The ground state of the Cu
and Cu
isomers exhibit a
symmetry, whereas the GS for the Cu
and Cu
structures exhibit
and
symmetries, respectively. The Cu
and Cu
copper clusters exhibit a magnetization close to 1 a.u. due to the polarization of their atoms (see
Table 7). Isomers with an even number of atoms exhibit no magnetization, but there is an interesting exception for the Cu
(P) and Cu
(R) isomers, which exhibit a magnetization of around 2 a.u., also due to the polarization of their atoms (see
Table 9). In
Figure 5, it can be seen that the isomers with magnetization do not exhibit a symmetric DOS around the Fermi level where the
and
orbitals of the copper atoms predominate.
