Abstract
Ferrofluid is a magnetic fluid that undergoes structural changes when subjected to a magnetic field, with the formation of arrays of nanoparticles aligned with the field. Using polarized light passing through the ferrofluid, we can observe the formation of light patterns for different magnetic field configurations. Using a device known as a Ferrocell, we present a study relating magnetic fields and complex functions. Our main issue here is to know what the relationship is between fundamental multipole expressions and light polarization patterns obtained with the ferrofluid. We have applied multipole fields to the Ferrocell, observed the light patterns, and compared them with multipoles of complex functions. We interpreted other luminous polarization patterns as the sum of these fundamental multipoles.
1. Introduction
The representation of the magnetic field is a conceptual exercise that has generated several advances in physics since its conception by Faraday, helping to resolve contradictions involving action at a distance, in addition to motivating the development of field theory. Looking at the more abstract side of the theory of complex functions, the poles of a complex function can be visualized as singularities of vector fields, and if we consider the vertical axis as representing the imaginary numbers and the horizontal axis as the real numbers, the singularities of vector fields can be thought of as poles and zeros of these complex functions [1]. Considering the complex functions of negative powers, we have the inner multipoles, while the complex functions with positive powers give us the outer multipoles.
With the device known as a Ferrocell [2], we can observe certain light patterns when the ferrofluid in this device reacts to light in the presence of a magnetic field generated by a magnet, as shown in Figure 1. The main concept here is magneto-optics, which is the use of magnetism to influence light propagation [3,4,5,6,7].
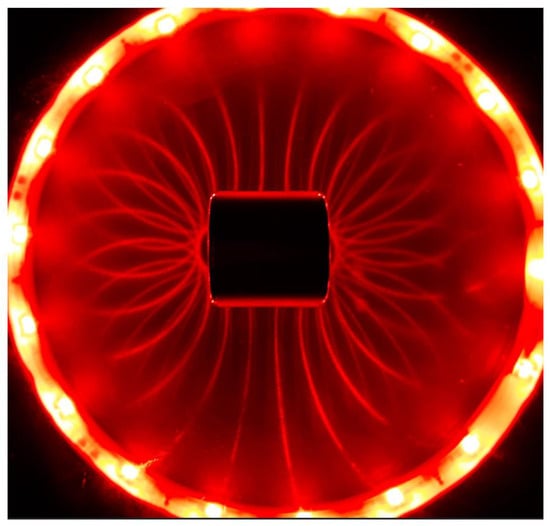
Figure 1.
Image of a Ferrocell illuminated with red light, with luminous patterns that are formed because of the magnet placed in the center.
The physical structure of the ferrofluid, through which light is traveling, changes, and some parameters, such as the polarization or the intensity of the light beam interacting with this device, can be controlled by the magnetic field [4]. In the case of solids, the most common effects of light transmission are the Faraday effect, the Voigt effect, and the magneto-optical Kerr effect [4,7,8,9,10]. In the case of liquids, we have the Cotton‒Mouton effect, which is attributed to the “lining up” of molecules by the magnetic field. In the case of ferrofluids that we are using, Figure 1 below represents the “lining up” of nanoparticles creating needle-like microstructures around 100 μm.
This work proposes to study the different configurations of magnetic fields [11] applied in a Ferrocell and compare them with the expression of complex multipolar functions, represented in the framework of light patterns associated with polarized light because this comparison of pole distribution between complex functions and polarized light is not found. As far as we know from our review of the literature, this is the first study on how we can represent magnetic field arrangements as the combination of different magnetic multipoles in Mueller matrices, which are used in the analysis of the observed experimental results of magneto-optics of light scattering in the Ferrocell. Thus, the results presented in this article influence the more general case of magneto-optical studies applied in ferrofluids, as well as the cases of structured light. In Section 2, we present the materials used in our experiments and the equations related to the subject. In Section 3, we list different types of multipolar magnetic fields and their respective light patterns. In Section 4, we analyze the details of changes in a light pattern, in which we change the configuration of the magnetic field and apply the Mueller matrix calculation to these data. In Section 5, we make our final conclusions.
2. Materials and Methods
Our experimental system is based on a system with two crossed polarizers, with the ferrofluid film between them [6]. When the magnetic field is applied to the ferrofluid, we can observe the formation of light patterns. The light source was generated by an LED panel, illuminating the entire surface of a square Ferrocell (22 mm × 22 mm) homogeneously, using a diffuser and backlighting technique. We have used glass microscope slides in the Ferrocell. The image is obtained directly from the system by photographing the Ferrocell with a digital camera. The ferrofluid type is a stable colloidal dispersion using light mineral oil, with a response time of around 200 ms, typically containing 5% magnetic solid, 10% surfactant, and 85% carrier (EFH1), obtained from Ferrotec. The nanoparticles are spheres of the order of 10 nm in diameter; the nominal saturation magnetization value is 440 G. We present in Figure 2 some images of the ferrofluid in the presence of different values of magnetic field intensity for the case of non-polarized light.
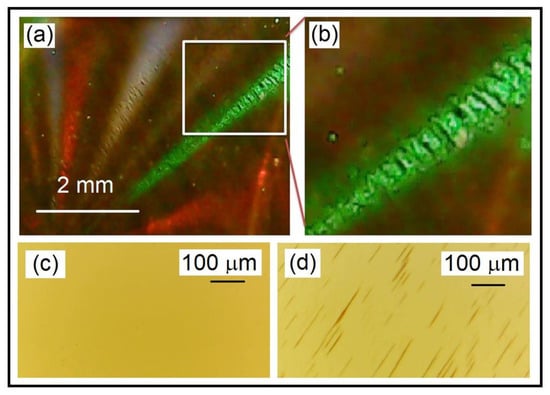
Figure 2.
(a) Image obtained from the Ferrocell under the effect of a magnetic field illuminated with red, green, and blue LEDs. Image (b)—magnification of part of the previous image in which we can see clusters of ferrofluid particles. Image obtained with a microscope of the ferrofluid without the presence of the magnetic field in (c). In (d), we present the image obtained with a microscope of ferrofluid with a magnetic field of 600 G.
The light intensity of these patterns is somehow correlated with the intensity of the magnetic field, as shown in Figure 3, and in this plot, we can see that the intensity of polarized light is maximum for larger field values that are at 45° with respect to the horizontal polarization of light. As the orientation of the particles and the polarization of light depend on the intensity of the magnetic field, this gray region at the bottom of the plot in Figure 3 is placed to emphasize that this limiting region of the polarization pattern can vary, but even so, we have an average curve that defines the luminous profile. Each curve represents one of the six magnet arrangements that give different magnetic field intensities that create the magneto-optical lobe patterns ranging from 1300 G up to 2250 G.
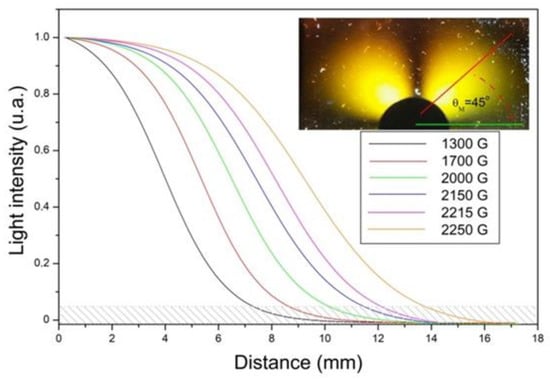
Figure 3.
The light intensity of light patterns is correlated with the intensity of the magnetic field, as shown in the formation of luminous lobes for different intensities of the magnetic field that is applied to the Ferrocell. The magnetic field is given by the dark disk with a diameter of 0.7 cm.
In order to simulate the amplitudes of the light patterns, we have used Mueller matrices [12,13,14], with values associated with poles given by the numbers lp and mp. A matrix representing the association of vector fields with the angle θ is shown below:
With this matrix, we can represent the superposition of two magnetic fields, with the number of lp and mp related to different types of multipoles with different intensities of the magnetic field given by the proportionality factor k. For example, considering the Stokes vector of a horizontal linear polarized light being operated by the matrix M, taking the following values for a dipolar field (lp = 0.5) and adding it to a sextupolar field (mp = 2), we will have the intensity graph in polar coordinates for different values of k from 0 to1 as shown in Figure 4c. Figure 4a represents the intensity parameter of the Stokes vector related to a dipole, and Figure 4b represents the intensity parameter of the Stokes vector related to a sextupole; the combination of these two intensities is shown in Figure 4c for different values of the parameter k. In the literature related to this type of system [12,13,14], we can find in more detail the application of the Jones calculus and the Mueller matrices to analyze the formation of magneto-optical light patterns obtained with a Ferrocell.
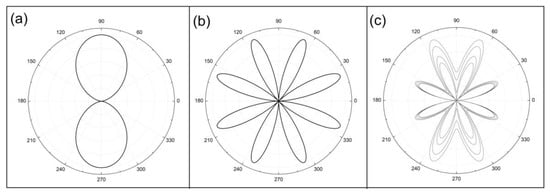
Figure 4.
Polar plots representing the intensity parameter of the Stokes vector associated with a dipole in (a) and with a sextupole in (b). Choosing different values of the parameter k, we have the plots shown in (c).
In this work, we consider two-dimensional fields because we study thin films of ferrofluid. This way, considering a region of space free of electric charges and currents, any magnetic field generated by magnets must satisfy:
These equations lead to the simplified scalar potential in polar coordinates (r, θ) represented by the infinite series of cylindrical harmonics that define the possible distributions of the B field in two dimensions in the absence of currents [4,5,11]:
where Pn and Qn are geometric parameters that define the orientation of the magnetic field, and n gives the order of the multipole, for example n = 1 is a dipolar field, n = 2 is a quadrupolar (tetrapolar) field, and n = 3 is a sextupolar (hexapolar) field. From this potential the components of the magnetic field in polar coordinates are given by:
3. Magnetic Fields and Polarized Light Patterns
Now we will explore the light patterns obtained with multipoles, and in this section, we intend to show how each magnetic field configuration represented by inner and outer multipoles is related to their respective polarization patterns. The important point we will investigate here is the connection between two different perspectives of the same phenomenon: (1) magnetic field line diagrams and (2) the magneto-optical polarization pattern of the same multipole field. The diagrams and the magneto-optical patterns are different from each other, but they represent the same phenomenon.
We start with the group of multipoles represented by Equations (10) and (11) for values of n equal to or greater than 1, which we call “internal multipoles” because they are similar to the case of the patterns observed within the arrangements of magnets in the plane. These magnetic fields are related to the polynomials of zns complex functions f(z) that represent vector fields for the cases where we have negative values of ns. In the sequence in Figure 5, Figure 6 and Figure 7, we have the magnetic field lines for three cases of a crescent number of poles: in Figure 5a we have n = 1 related to ns = 0; in Figure 5c–e, the case for n = 2 related to ns = −1; Figure 6 represents magnetic fields of Equations (10) and (11) with values of n = 3 related to ns = −2; and Figure 7 represents the case of magnetic fields for n = 4 related to ns = −3, for different values of Pn and Qn, which give the orientation of these magnetic fields.
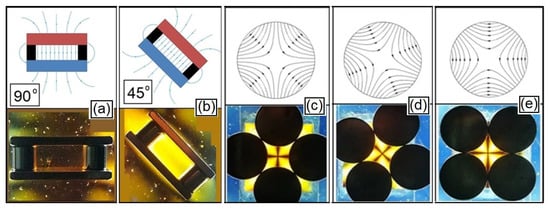
Figure 5.
Diagrams of magnetic fields and light patterns of a dipole (n = 1 or ns = 0) with the orientation of 90° in (a) and with the orientation of 45° in (b), with the distance between the plates of 5 mm. The case of a tetrapolar field n = 2 (ns = −1) with three different orientations of the magnetic field with 0° in (c), 22.5° in (d), and 45° in (e). The magnetic field is given by the dark disks with a diameter of 1.4 cm each.
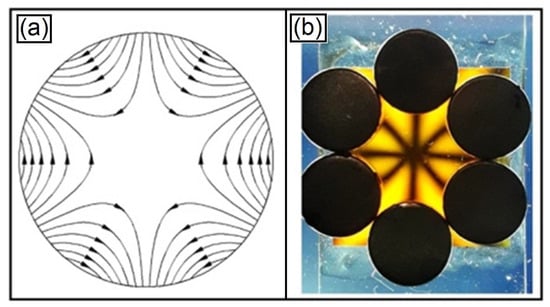
Figure 6.
The hexapolar field (sextupole) is shown in (a) with n = 3 and ns = −2 and its respective light pattern in (b). The magnetic field is given by the dark disks with a diameter of 1.0 cm each.
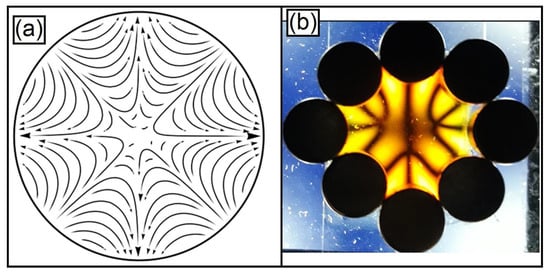
Figure 7.
Diagram of the magnetic field of the octopolar field in (a). Light polarization pattern of the octopolar field in (b). The magnetic field is given by the dark disks with a diameter of 1.0 cm each.
In order to clarify the experimental results, let us discuss the previous figures in more detail. We start with the examples of linearly polarized light passing through the magnetic field affecting the thin film of the ferrofluid shown in Figure 5. We have the dipolar magnetic field between two parallel plates for the case of n = 1 (ns = 0), and the light pattern with the dipolar field aligned with the orientation of the analyzer prevents the passage of light in Figure 5a. In Figure 5b the field is oriented at 45° in relation to the analyzer, and the light passes with the maximum intensity for this configuration between the two magnetic poles that are in parallel. Thus, the luminous intensity for the case of the internal magnetic dipole basically depends on the orientation of the parallel lines of the dipole in relation to the analyzer orientation axis, as already discussed in the Malus law case [12,13].
In Figure 5c–e we have the quadrupolar field (n = 2 or ns = −1) in three different positions and their respective light patterns. It is interesting to note that when we rotate the magnetic field by the angle θ, the isogyres of the light pattern rotate by 2θ. We presented the diagram of the magnetic field with 0° orientation in Figure 5c, 22.5° orientation in Figure 5d, and 45° orientation in Figure 5e, with the respective light patterns for these configurations.
Isogyre lines are the points of the tangent lines of these hyperbolas that are parallel or perpendicular to the crossed polarizers, which prevents the passage of polarized light. A mathematical property of these points is to rotate with an angle that is twice the angle of rotation of the hyperbolas that form the magnetic field with respect to the origin of the x-y axes, like a gearbox with a ratio of 1 to 2.
In the literature, we find a quote for another magneto-optical system that shows a relationship between isogyres and the magnetic field with the Faraday rotation [15] with an opposite relationship to the one we have observed (2 to 1). This case indicates the need to carry out future studies relating the patterns observed in our experiment with the concepts of angular momentum of light [16,17].
In the case of the sextupolar configuration of the magnetic field in Figure 6, n = 3 in Equations (11) and (12) or the complex function f(z) = z−2. The respective diagram of the magnetic field is presented in Figure 6a, while the light pattern in Figure 6b presents the crossing of three isogyre lines.
In the cases with n = 2 and n = 3, we have the formation of isogyres in the luminous patterns of polarization represented by the dark lines. In the case of n = 4, we have the magnetic field of an octupole represented in the diagram in Figure 7a. A property of multipoles is that the greater the degree of polarity of the symmetric multipole, the smaller the field at the center of the multipole, so we have a more irregular picture of the isogyre lines in the polarization pattern in Figure 7b associated with this magnetic field.
For the specific case of “internal multipoles”, we have the following relationship between the number n and the exponent ns:
We will now present the cases where we have the positive exponent of complex functions that are related to the case of “external multipoles”. We need to emphasize that the cases of the magnetic field related to the vector fields represented with the positive values of the exponent ns of the complex functions cannot be represented with Equations (10) and (11)—for example, the case of a monopole, where we have ns = 1, as shown in Figure 8. The diagram of the magnetic field vector associated with a monopole is represented by the complex function f(z) = z1 in Figure 8a, and the respective light pattern in Figure 8b has been obtained with the Ferrocell, with two isogyre lines forming a Maltese cross.
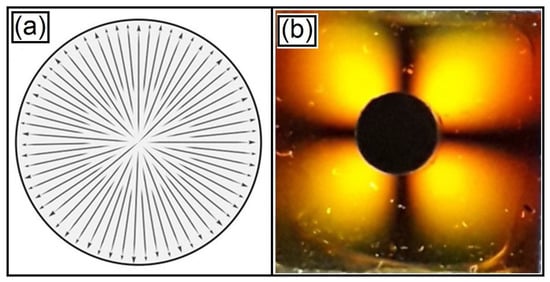
Figure 8.
(a) Diagram of the magnetic field of the monopolar field for the case ns = 1. (b) Light polarization pattern of the monopolar field. The magnetic field is given by the dark disk with a diameter of 0.7 cm.
Now we present the case of the vector field of the complex function f(z) = z2 in Figure 9a related to an external dipolar field and its respective light polarization pattern in Figure 9b with the formation of eight luminous lobes.
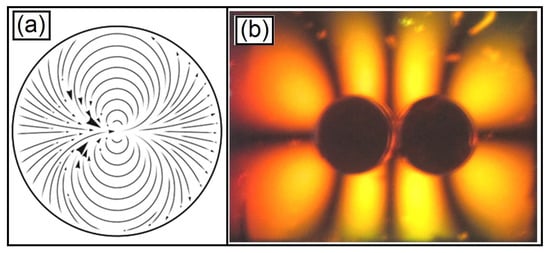
Figure 9.
Vector field of the complex function z2 related to an external dipolar field in (a), and in (b) its respective light polarization pattern. The magnetic field is given by the dark disks with a diameter of 0.7 cm each.
For the case of the vector field associated with the complex function f(z) = z3, we have the case of the external quadrupole in Figure 10.
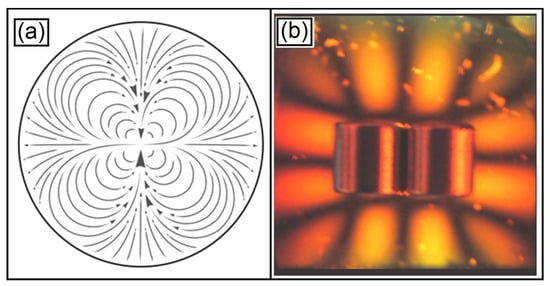
Figure 10.
External quadrupolar field related to the complex function f(z) = z3 in (a), and its respective light pattern obtained with the Ferrocell. Light polarization observed in the Ferrocell for the quadrupolar configuration (b). The magnetic field is given by the cylinders with a diameter of 0.7 cm each.
4. Evolution of Isogyres
From here, we will study the evolution of the isogyres, initially observing the pattern obtained with a field of one sextupole. A change in the symmetry of this magnetic field will change the configuration of the isogyres, as can be seen in Figure 11. Initially, the magnets are placed in a circular symmetry, forming straight isogyres that intersect. After that, this circular symmetry is changed to an elliptical symmetry, causing the diagonal isogyres to become curves that move away from the center of the light pattern.
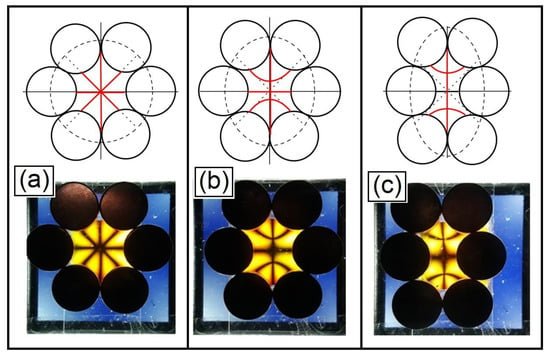
Figure 11.
Diagram of a sextupole configuration with the magnetic disks in a circular arrangement in (a) forming three intersecting straight isogyres. When the arrangement of the magnetic disks is changed slightly to an elliptical arrangement shown in the diagram in (b), the isogyres change into a pattern forming a cross with two parabolas opposite each other on the vertical axis. Increasing even more the difference between the semi-axes of the ellipse where the magnetic disks are located, we have the luminous pattern showing the isogyres in (c). The magnetic field is given by the dark disks with a diameter of 1.0 cm each.
Considering the pattern in Figure 11a, we will use the matrix MA of Equation (1) to reproduce the magnetic field of a sextupole; the luminous intensity of the Stokes vector is shown in Figure 12a, applying the Mueller calculus [13] to the case of incidence of a linearly polarized light represented by the Stokes vector VerP and with a linear analyzer represented by the matrix A1:
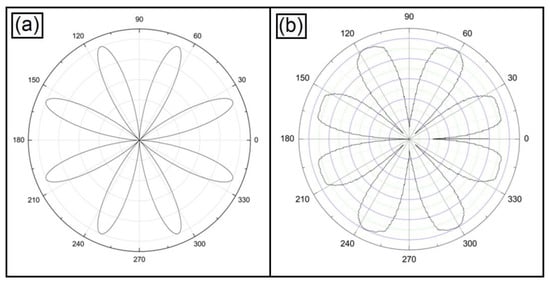
Figure 12.
Polar plots of the comparison between sextupole simulation using the Mueller matrix in (a) with the experiment in (b).
Considering k = 0.0, lp = 1.0, and mp = 4.0, the Mueller matrix MA used for the case of the sextupolar magnetic field is:
Considering the matrix MA, we have the following Stokes vector S1 as the answer:
In the case of the experiment related to the light pattern in Figure 11a, we have obtained the graph of the light pattern shown in Figure 12b.
Now considering Figure 11c, we will use the matrix that represents the combination of a dipole and a sextupole to simulate the magnetic field created by arranging the six magnets in an ellipse with the major axis vertical.
Considering k = 0.8, lp = 1.0, and mp = 4.0, the Mueller matrix MB used in this case:
Making this matrix operate on a Stokes vector that represents a linearly polarized light VerP, we will now have an intensity distribution of the Stokes vector S2 shown in Figure 13a.
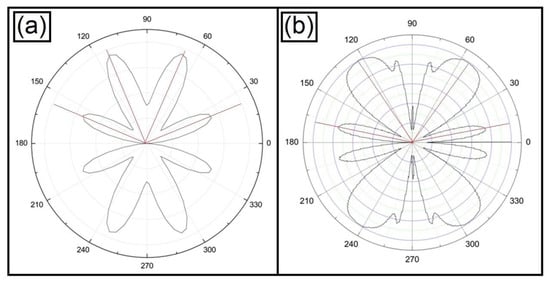
Figure 13.
Polar plots. Comparison between a combined sextupole (mp = 4) and dipole (lp = 1.0) simulation using the Mueller matrix in (a) with the experiment in (b). We are emphasizing here the similarity of some main polarization lobes marked with red lines.
In Figure 13b we present the graph in polar coordinates for the luminous pattern obtained with the experiment shown in Figure 11c.
Comparing the experimental results with the simulations of magnetic fields composed of weighted combinations of multipoles that were presented in Equations (10) and (11), we have a similar qualitative behavior. These examples show how different arrangements of magnetic fields can be represented as the combination of different magnetic multipoles in Mueller matrices that are used in the analysis of the observed experimental results of magneto-optics of light scattering in a Ferrocell.
5. Conclusions
In this study, we present how to build Mueller matrices for any magnetic field from a basis of multipoles that can be represented in two dimensions through complex polynomials with different orientations. In order to do this, we present our studies on how to represent different configurations of magnetic fields using complex functions, linking multipoles to the exponents of these functions that we classify as internal and external multipoles. Based on these representations, we built Mueller matrices to reproduce the polarization behavior of light passing through a thin layer of ferrofluid in the device known as a Ferrocell. Thus, when these matrices operate on Stokes vectors representing linearly polarized light, we obtain parameters that can be compared with experimental results observed in the Ferrocell with some arrangements of magnetic fields, such as the angular distribution of luminous intensity. By smoothly altering these magnetic arrangements, we observe that the field can be considered as a composition of an infinite harmonic series of multipoles (see Supplementary Materials).
Supplementary Materials
The following supporting information can be downloaded at: https://www.mdpi.com/article/10.3390/condmat8010027/s1, Video S1: Complex functions, Multipoles and Light Polarization in a Ferrocell.
Author Contributions
Conceptualization, A.T. and A.P.B.T.; methodology, A.T.; software, A.T.; validation, A.T. and A.P.B.T.; formal analysis, A.T.; investigation, A.T.; resources, A.T.; data curation, A.T.; writing—original draft preparation, A.T.; writing—review and editing, A.T.; visualization, A.T.; supervision, A.T.; project administration, A.T.; funding acquisition, A.T. and A.P.B.T. All authors have read and agreed to the published version of the manuscript.
Funding
This work was partially supported by Conselho Nacional de Desenvolvimento Científico e Tecnológico (CNPq), Instituto Nacional de Ciência e Tecnologia de Fluidos Complexos (INCT-FCx), and by Fundação de Amparo à Pesquisa do Estado de São Paulo (FAPESP) FAPESP/CNPq#573560/2008-0.
Data Availability Statement
Not applicable.
Acknowledgments
A.T. and A.P.B.T. thank Conselho Nacional de Desenvolvimento Científico e Tecnológico (CNPq), Instituto Nacional de Ciência e Tecnologia de Fluidos Complexos (INCT-FCx), and Fundação de Amparo à Pesquisa do Estado de São Paulo (FAPESP).
Conflicts of Interest
The authors declare no conflict of interest.
References
- Needham, T. Visual Complex Analysis; Claredon Press: Oxford, UK, 1997. [Google Scholar]
- Tufaile, A.; Vanderelli, T.A.; Tufaile, A.P.B. Light polarization using ferrofluids and magnetic fields. J. Adv. Condens. Matter Phys. 2017, 2017, 2583717. [Google Scholar] [CrossRef]
- Jing, D.; Sun, L.; Jin, J.; Thangamuthu, M.; Tang, J. Magneto-optical transmission in magnetic nanoparticle suspensions for different optical applications: A review. J. Phys. D Appl. Phys. 2020, 54, 013001. [Google Scholar] [CrossRef]
- Muray, J.J. Scattering of Polarized Light on Magnetically Aligned Particles in Multipole Magnetic Fields. Appl. Opt. 1965, 4, 1011–1016. [Google Scholar] [CrossRef]
- Tagawa, T.; Song, K. Stability of an Axisymmetric Liquid Metal Flow Driven by a Multi-Pole Rotating Magnetic Field. Fluids 2019, 4, 77. [Google Scholar] [CrossRef]
- Tufaile, A.; Snyder, M.S.; Tufaile, A.P.B. Horocycles of Light in a Ferrocell. Condens. Matter 2021, 6, 30. [Google Scholar] [CrossRef]
- Li, J.; Liu, X.D.; Lin, Y.Q.; Bai, L.; Li, Q.; Chen, X.M. Field modulation of light transmission through ferrofluid film. Appl. Phys. Lett. 2007, 91, 253108. [Google Scholar] [CrossRef]
- Yang, S.; Horng, H.; Shiao, Y.; Hong, C.-Y.; Yang, H. Photonic-crystal resonant effect using self-assembly ordered structures in magnetic fluid films under external magnetic fields. J. Magn. Mater. 2006, 307, 43–47. [Google Scholar] [CrossRef]
- Pu, S.; Liu, M. Magnetically tunable two-dimensional photonic crystal by self-assembling in magnetite magnetic fluid. In Proceedings of the 2008 2nd IEEE International Nanoelectronics Conference, Shanghai, China, 24–27 March 2008; pp. 210–213. [Google Scholar] [CrossRef]
- Zhao, Y.; Ying, Y.; Wang, Q.; Hu, H.F. Simulation on Microstructure and Optical Property of Magnetic Fluid Photonic Crystal. IEEE Trans. Magn. 2014, 50, 4601112. [Google Scholar] [CrossRef]
- Ramon, J.L.R. Maxwellian Interpolation of Magnetic Fields on a Grid. Bachelor’s Thesis, University of Groningen, Groningen, The Netherlands, 2018. Available online: https://fse.studenttheses.ub.rug.nl/17945/ (accessed on 27 November 2022).
- Tufaile, A.; Snyder, M.S.; Tufaile, A.P.B. Study of Light Polarization by Ferrofluid film using Jones Calculus. Condens. Matter 2022, 7, 28. [Google Scholar] [CrossRef]
- Tufaile, A.; Tufaile, A.P.B. Exploring the Polarization of Light in Ferrofluids with Mueller Matrices. Magnetochemistry 2022, 8, 121. [Google Scholar] [CrossRef]
- Mischchenko, M.I.; Travis, L.D.; Lacis, A.A. Scattering, Absorption, and Emission of Light by Small Particles; Cambridge University Press: Cambridge, UK, 2002. [Google Scholar]
- Ou, L.; Wang, J.; Xu, Q.; Kang, J.; Huang, Y. Faraday rotation angle measurement based on conoscopic interference pattern in optical current transducer. Energy Procedia 2012, 14, 1060–1066. [Google Scholar] [CrossRef]
- Allen, L.; Beijersbergen, M.; Spreeuw, R.; Woerdman, J. Orbital angular momentum of light and the transformation of Laguerre-Gaussian modes. Phys. Rev. A 1992, 45, 8185. Available online: https://journals.aps.org/pra/abstract/10.1103/PhysRevA.45.8185 (accessed on 27 November 2022). [CrossRef] [PubMed]
- Allen, L.; Padgett, M.; Babiker, M. IV The Orbital Angular Momentum of Light. Prog. Opt. 1999, 39, 291. Available online: https://www.sciencedirect.com/science/article/abs/pii/S0079663808703913 (accessed on 27 November 2022).
Disclaimer/Publisher’s Note: The statements, opinions and data contained in all publications are solely those of the individual author(s) and contributor(s) and not of MDPI and/or the editor(s). MDPI and/or the editor(s) disclaim responsibility for any injury to people or property resulting from any ideas, methods, instructions or products referred to in the content. |
© 2023 by the authors. Licensee MDPI, Basel, Switzerland. This article is an open access article distributed under the terms and conditions of the Creative Commons Attribution (CC BY) license (https://creativecommons.org/licenses/by/4.0/).