Article

Temperature Dependent Structural Evolution of WSe2: A Synchrotron X-ray Diffraction Study

1
NUSNNI-NanoCore, National University of Singapore, Singapore 117411, Singapore
2
Department of Physics, S.B College, Mahatma Gandhi University, Kerala 686101, India
3
Tata Institute for Fundamental Research, Centre for Interdisciplinary Sciences, Hyderabad 500107, India
4
Elettra Sincrotrone, Strada Statale 14–km 1635 in Area Science Park, Basovizza, 34149 Trieste, Italy
5
Department of Materials Science and Engineering, National University of Singapore, Singapore 117575, Singapore
*
Authors to whom correspondence should be addressed.
Condens. Matter 2020, 5(4), 76; https://doi.org/10.3390/condmat5040076
Submission received: 17 August 2020 / Revised: 2 November 2020 / Accepted: 15 November 2020 / Published: 19 November 2020
(This article belongs to the Special Issue Quantum Complex Matter 2020)

Abstract

:
A thorough investigation of the structural parameters of micromechanically exfoliated multilayer WSe2 flakes was undertaken between 400 K to 110 K. Crystal structure of WSe2 remains in the trigonal prismatic structure in this temperature range, however, with a clear difference in the temperature dependence of the in-plane a, and the out-of-plane c, lattice parameters. The linear coefficients of thermal expansion of a and c are 5.132 × 10⁻⁶/K and 8.105 × 10⁻⁶/K, respectively. The temperature dependence of the unit-cell volume is analyzed using zero-pressure equation-of-state which yielded the Debye temperature of the WSe2 to be 160 K. Following the temperature dependence of the W-Se and W-W bond distances, a nonlinear behavior is observed in the former in contrast to a rather regular behavior of the later. This significant difference in the temperature dependence of the a and c lattice parameters can have consequences in the macroscopic physical properties of the system. A good correlation between the temperature dependence of the W-Se bond distance and Raman E 2 g 1 mode has been observed.

1. Introduction

Transition-metal dichalcogenides (TMDC) are materials formed by stacking a layer of transition metal atom in between chalcogenide atoms. TMDC have a layered structure with MX2 formula where M is metal atom and X is chalcogenide atom; the hexagonally packed metal atoms M are in a trigonal prismatic coordination with X atoms [1]. The M-X bonds within a layer are strongly covalent in nature and the interlayer interaction is of van der Waals (vdW) type. The strong covalent intralayer bonding and weak interlayer vdW force leads to strong anisotropic properties (e.g., in optical and electronic properties) of transition-metal dichalcogenides [2]. TMDC layers can be exfoliated into monolayers because of the weak vdW interlayer bonding similar to the case of graphite [3]. The mono- and few layer TMDC show exceptional electrical and optical properties and are currently undergoing immense research scrutiny, both from fundamental and applied points of view [1,2,3,4,5,6,7].
Tungsten diselenide (WSe2) is one of the most promising candidates in TMDC family and has attracted a lot of attention recently due to its extraordinary electronic and optoelectronic properties [2,5,6,7]. The study of temperature-dependent structural evolution as manifested in the thermal expansion coefficients and phonon properties is of vital importance for the optical and electrical devices based on WSe2 [8]. The accumulated internal stress/strain and self-heating of the devices is crucial for the realization of high-performance electronic, optoelectronic and thermoelectric devices based on this material system [9].
Temperature dependent investigations of the structural properties of 2D materials provide critical information vital for understanding the temperature dependence of the electronic structure, optical and other macroscopic properties. Thermal expansion properties of WSe2 were investigated by Murray and Evans in 1979, however the temperature values, the quality of the data available and the number of temperature data points made those authors to quantify the structural evolution was limited [10]. Later, Raman studies were employed to understand the thermal expansion, however the attention was on monolayer and few layers samples [11]. To the best of our knowledge, to date, a rigorous structural investigation of WSe2 in the temperature range 110–400 K is missing. Here, we report such an investigation using synchrotron x-ray diffraction (XRD). Good quality data permit us to study the evolution of W-W and W-Se bond distances with temperature. Temperature dependence of the extracted W-Se bond length is found to have a correlation with the in-plane E 2 g 1 Raman active vibrational mode. Analysis of the temperature dependence of unit cell volume using equation of state at zero pressure is carried out and Debye temperature is extracted. Our results also shed light on the temperature dependent macroscopic properties such as Hall coefficient.

2. Results and Discussion

The crystal structure of WSe2 results from the stacking of sheets of hexagonally packed atoms in the sequence X-M-X (X-chalcogen atom Se and M-metal atom W, Figure 1). Within each X-M-X sandwich layer the M atom is bonded to six nearest-neighbor X atoms in trigonal prismatic coordination and the details are given in Figure 1. The bonding between sandwich layers is weak van der Waals which makes it possible to exfoliate layers [3].
The XRD spectrum of the WSe2 sample at 400 K together with the results of the Rietveld refinement are shown in Figure 2. The agreement factors for the presented refinement data in Figure 2 are χ2 = 4.93, Bragg R factor 5.69, Rp = 1.64, Rwp = 2.60 and Rexp = 1.17 (the latter three are not corrected for background) [12]. Rietveld refinement of the XRD spectrum revealed (Figure 2) the structural symmetry of the system to be hexagonal with space group P63/mmc (number 194, Schoenflies D46h) [1] which is generally referred as 2H-WSe2. The Rietveld refinements preferred orientation effects were included, without which there was a large discrepancy between the calculated and observed diffraction pattern. Such effects are common in several 2D systems [13]. We recall that the atomic positions in the unit-cell are determined through the diffraction intensity. This implies that to accurately determine the atomic positions in the unit-cell, it is important to have a precise measurement of the diffraction intensities as well as a good agreement between the observed and calculated intensities from the data analysis. Our results meet such criteria though affected by the preferred orientation effects, permitting us to extract lattice constants and bond-distances from the diffraction data analysis. At 300 K, the in-plane (a) and out-of-plane (c) lattice parameters of the pristine sample are found to be 3.287 Å and 12.983 Å, respectively, in good agreement with what has been reported in the literature [1,14].
To understand the structural evolution of WSe2 XRD spectrum from 400 K down to 110 K (see details given in the Section 3 materials and methods) were analyzed. Dense sampling (step size 5 K in the range of 340 K to 185 K and 10 K step in the remaining regime) permitted us to systematically trace the temperature dependent evolution of the lattice parameters. Examples of the Rietveld refinement data at six selected temperatures are given in Figure 3. Refinements yield similar levels of agreement in all the temperatures, permitting a discussion on the temperature dependence of the bond distances. As expected, all the lattice constants decrease with temperature, however the rate of compression is different for different directions. The in-plane and out-of-plane lattice constants extracted at various temperatures are given in Figure 4a,b respectively.
The experimental data were fitted by a second order polynomial
y(T) = y0 + MT + NT2
where y(T) is either a or c at a given temperature T, y0 is extrapolated 0 K lattice constant, and M and N are two fit parameters. It can be noticed that both the curves follow nonlinear temperature dependence (finite non-zero N coefficient) but their respective coefficients do not have the same magnitudes. The parameter M for the out-of-plane c is six times higher than the in-plane a, and the parameter N is about five times higher for c than a. This reveals that c has a more steep and nonlinear temperature variation compared to a. Studies of Murray and Evans in 1979 [10] indicated the in-plane behavior to be linear as compared to out-of-plane, and our data with shorter temperature intervals indicate both a and c have nonlinear temperature dependences and also it is consistent with those observations. The linear thermal expansion is computed from the above XRD analysis. The ratio M/y0 gives the principal linear coefficient of thermal expansion (α) in the a or c direction. The linear coefficient of thermal expansion in the a and c direction is found to be 5.132 × 10⁻⁶/K and 8.105 × 10⁻⁶/K, respectively. The lattice parameter for the c changes more rapidly with temperature than that of the a due to the weak vdW type inter-layer interaction which permits a larger compressibility compared to the strong covalent interaction in the intralayer governing the in-plane lattice parameter.
The variation of unit cell volume vs. temperature plot is given in Figure 5. Smooth temperature dependence is observed in this data. The temperature dependence of unit cell volume is analyzed using Gruneisen approximations to the zero pressure equation of state [15]. The first order Gruneisen approximation given in Equation (2) is most suitable for our temperature range since the variation of volume is small.
V T = γ U K 0 + V 0
where U is the internal energy, γ is a Gruneisen parameter, K 0 is the bulk modulus and V 0 is the volume near to 0 K. The internal energy U(T) can be calculated using Debye approximation as
U T = 9 N K B T ( T θ D ) 3 0 θ D T x 3 d x e x 1
where N is the number of atoms in the unitcell, K B is the Boltzmann constant and θ D is the Debye temperature. The U(T) given in Equation (3) is evaluated numerically using the Fortran library QUADPACK and is used to compute Equation (2) to obtain V(T). The best fit for our experimental V(T) data is obtained with parameters θ D = 160 K, V 0 = 120.79 Å 3 , and γ / K 0 = 1.1 × 10 11   P a 1 . Hu et al. also reported Debye temperature of 160 K from the temperature dependent photoconductivity measurements [16]. Considering K0 as 72 GPa [17,18] leads to a Gruneisen parameter γ = 0.792.
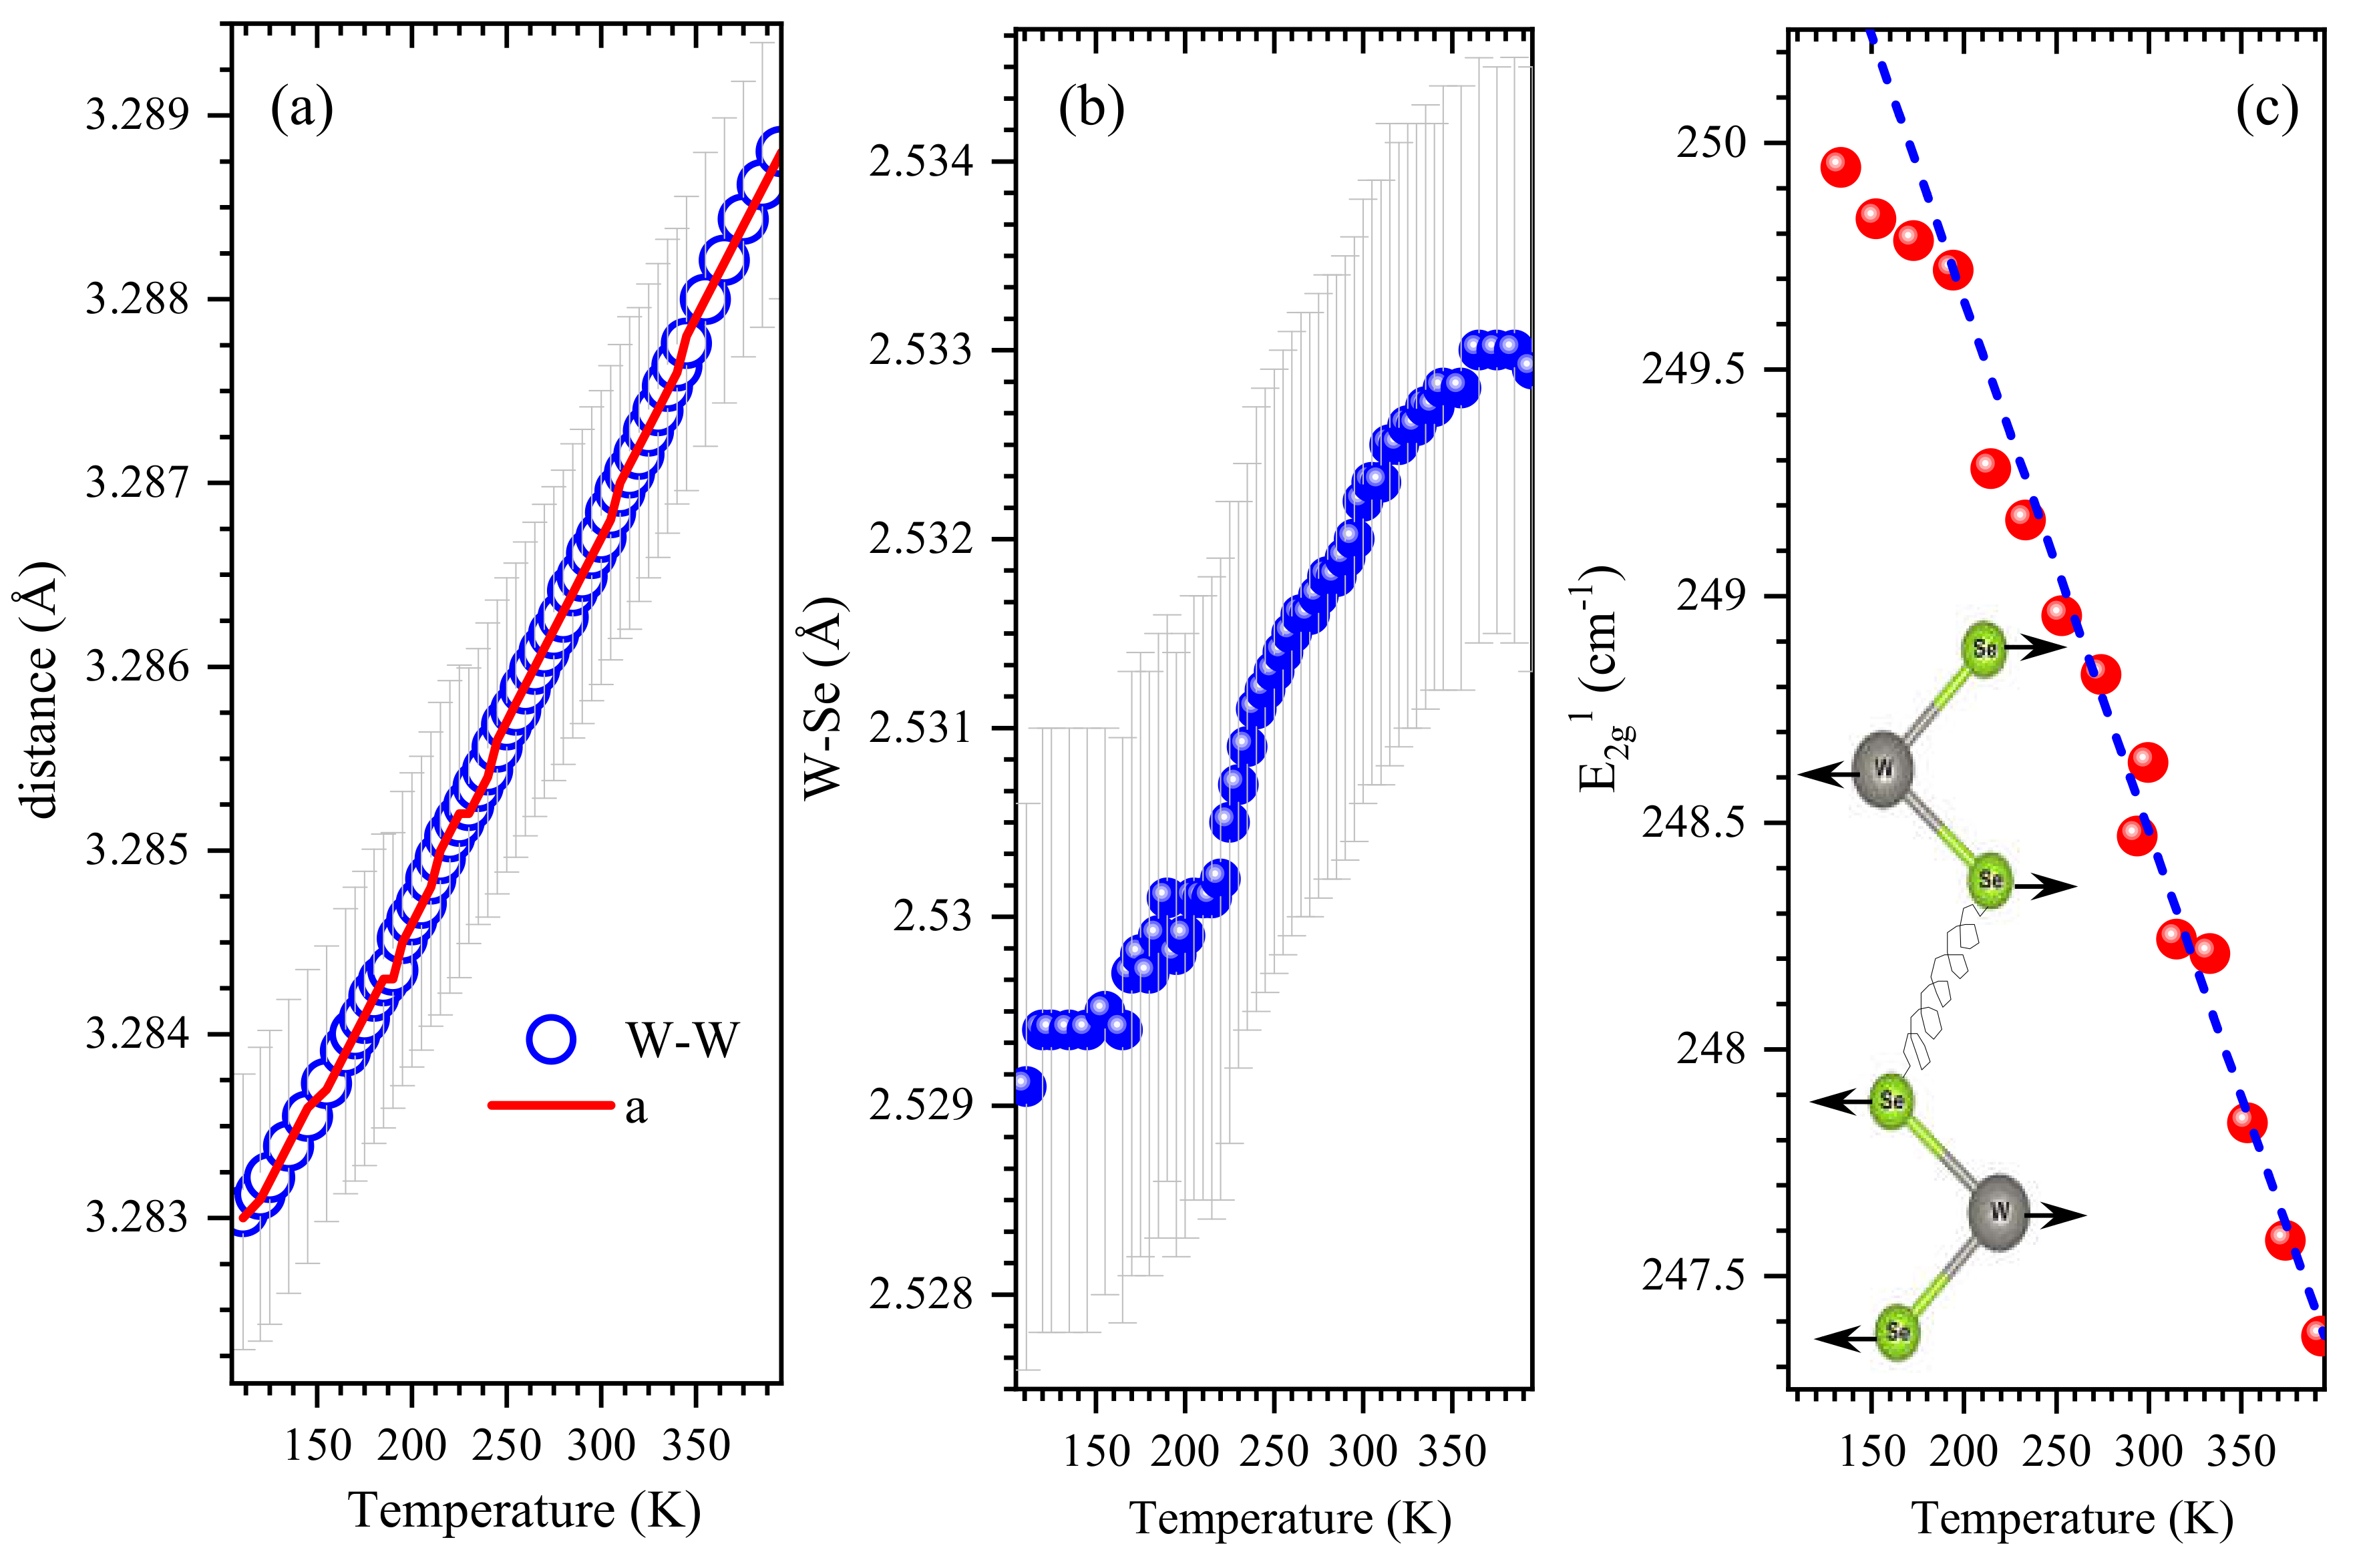
Furthermore, the bond distances W-W and W-Se were estimated from the Rietveld refinement data and are given in Figure 6a,b. The temperature dependence of the W-W distance along with the in-plane lattice constant a is given in Figure 6a and it can be noticed that the W-W distance follows a regular behavior similar to the in-plane lattice constant, while the W-Se distance shows a complex behavior. The W-W bonds are along the a/b directions as it can be readily seen from structural images shown in Figure 1a,b. The W-Se bond should be clearly affected by the temperature dependence of both a and c directions since the bonds are neither parallel to in-plane axes, nor to out-of-plane (see Figure 1c). The distinct bond distance variation of the W-Se, indicates a peculiar modulation of the hybridization involving the W 5d and Se 4p orbitals, which has a direct influence on the electronic properties of this system [1,2]
Most of the TMDC materials will have an in-plane Raman active mode ( E 2 g 1 ) and out-of-plane mode (A1g) and the layer number is characterized using the difference between the above mode positions [19]. The E 2 g 1 mode is due to the in-plane opposing motion of W and Se atoms while A1g mode is due to out-of-plane relative motion of Se atoms. A very recent work by Li et al. investigated the temperature dependence of the Raman modes and found that the volume effects play a major role for the temperature dependence of E 2 g 1 mode [20]. The position of the E 2 g 1 mode extracted from the above report is plotted in Figure 6c and it can be noticed that the nature of the W-Se bond length and position of E 2 g 1 follow similar behavior. The mode increases in wavenumber while W-Se bond contracts with the decrease of temperature as it can be seen in Figure 6b,c. It can be noticed that below 250 K both W-Se bond distance and Raman E 2 g 1 vibration deviate from a nearly linear behavior. The above observation could be attributed to the thermal expansion effects of in-plane bonds to accommodate the stress from the out-of-plane contraction. Further studies using extended X-Ray absorption fine structure (EXAFS) and atomic pair distribution function (PDF) analysis can shed light on these aspects.
In several cases, the macroscopic properties of materials are closely correlated to the underlining atomic arrangement. Such a relation indeed implies that a fine tuning of structural properties have a direct implication on the macroscopic properties. For example, Campi et al., showed that the geometry favoring the high-transition temperature superconducting state in HgBa2CuO4+y emerges from the coexistence of charge-density-wave order and quenched disorder [21]. Increase in the atomic disorder upon nanostructuring by ball-milling negatively affects the hydrogen sorption properties of LaNi5 [22]. Compared to such direct manipulation of the structural properties, modulation in the structural parameters with temperature even in absence of phase transitions also seems to be in close correlation with the temperature dependent macroscopic properties [23]. Such effects are often readily observable, even using bulk structural probes like diffraction. In 2D systems such effects can manifest more evidently [12]. In case of WSe2, nonlinear thermal contraction of the out-of-plane axis is due to the fact that the 2D layers are connected by weak vdW interaction. For example, the value of thermal expansion coefficients affects the electron-phonon interaction and thus the temperature dependence of an electron interband transition energy, as the energy of a transition is a function of the pressure, temperature and volume of the solid [24]. The variation of macroscopic properties such as Hall effect is found to show a nonlinear dependence on temperature [Supplementary Materials Figure S1]. The variation of Hall coefficient in 400 to 100 K given in Figure S1 also indicates different slopes−specifically, one can distinguish a region in 300 to 220 K [25]. Thus, the observed nonlinear variation of lattice constants and bond distances would shed light on macroscopic properties. To conclude, the present results of WSe2 demonstrate a clear correlation between the structural modulations and their macroscopic properties.

3. Materials and Methods

WSe2 (obtained from 2D Semiconductors USA) samples were prepared by micromechanical exfoliation using scotch tape. X-ray diffraction experiments were carried out at the recently commissioned dedicated high-pressure powder diffraction instrument, the Xpress beamline [26] of Elettra Sincrotrone-Trieste Italy. During the experiments, Xpress beamline was set to provide intense monochromatic X-ray beam of wavelength 0.495 Å. A custom-made pin-hole of diameter around 40 µm was used for defining the final beam. A MAR345 image plate detector was used for recording the diffraction pattern. Temperature dependent X-Ray powder diffraction (XRPD) measurements were performed at the X-ray diffraction beamline (XRD1) of the Elettra Synchrotron, Trieste (Italy). Temperature dependent measurements were carried out at the XRD1 beamline of Elettra using an Oxford Cryostream 700 series from Oxford Cryosystems. Data have been collected using a monochromatic wavelength of 0.700 Å (17.71 KeV) and 200 × 200 µm2 spot size, using a Dectris Pilatus 2M hybrid-pixel area detector. WSe2 flakes were carefully transferred to a quartz capillary of diameter 200 micron (10 µm wall thickness). Bi-dimensional powder patterns have been integrated using Fit2D [27] program after preliminary calibration of hardware setup, using a capillary filled with LaB6 standard reference powder (NIST 660a). Structural parameters were determined from the diffraction pattern by Rietveld refinements using Fullprof package [12].

Supplementary Materials

The following are available online at https://www.mdpi.com/2410-3896/5/4/76/s1.

Author Contributions

Project management: S.M., B.J. and T.V. Conception of experiments: B.J. and S.M. Execution of experiments: B.J. Data analysis S.M., A.R.A., S.C., S.S. and B.J. Results interpretation. B.J., S.M. and T.V.; All authors contributed to the manuscript preparation. All authors have read and agreed to the published version of the manuscript.

Funding

Authors thank Department of Science and Technology (DST) Govt. of India for financial support in executing proposal 20190139 at Xpress beamline.

Acknowledgments

Authors acknowledge the Elettra staffs, particularly Maurizio Polentarutti and Giorgio Bais for all supports during measurements and Department of Science and Technology (DST) Govt. of India for financial support in executing proposal 20190139 at Xpress beamline. S.M. acknowledges organizers of quantum complex matter (QCM 2020) conference, particularly Augusto Marcelli for the invitation.

Conflicts of Interest

The authors declare no conflict of interest.

References

  1. Wilson, J.A.; Yoffe, A.D. The transition metal dichalcogenides discussion and interpretation of the observed optical, electrical and structural properties. Adv. Phys. 1969, 18, 193–335. [Google Scholar] [CrossRef]
  2. Rao, C.N.R.; Waghmare, U.V. (Eds.) 2D Inorganic Materials beyond Graphene; World Scientific: Singapore, 2017. [Google Scholar]
  3. Mak, K.F.; Lee, C.; Hone, J.; Shan, J.J.; Heinz, T.F. Atomically Thin MoS2: A New Direct-Gap Semiconductor. Phys. Rev. Lett. 2010, 105, 136805. [Google Scholar] [CrossRef] [PubMed] [Green Version]
  4. Mathew, S.K.; Gopinadhan, K.; Chan, T.K.; Yu, X.J.; Zhan, D.; Cao, L.; Rusydi, A.; Breese, M.B.H.; Dhar, S.; Shen, Z.X.; et al. Magnetism in MoS2 induced by proton irradiation. Appl. Phys. Lett. 2012, 101, 102103. [Google Scholar] [CrossRef] [Green Version]
  5. Sarkar, S.; Goswami, S.; Trushin, M.; Saha, S.; Panahandeh-Fard, M.; Prakash, S.; Tan, S.J.R.; Scott, M.; Loh, K.P.; Adam, S.; et al. Polaronic Trions at the MoS2/SrTiO3 Interface. Adv. Mater. 2019, 31, 1903569. [Google Scholar] [CrossRef]
  6. Trushin, M.; Sarkar, S.; Mathew, S.; Goswami, S.; Sahoo, P.; Wang, Y.; Yang, J.; Li, W.; MacManus-Driscoll, J.L.; Chhowalla, M.; et al. Evidence of rotational Fröhlich coupling in polaronic trions. Phy. Rev. Lett. 2020, 125, 86803. [Google Scholar] [CrossRef]
  7. Chellappan, V.; Pang, A.L.C.; Sarkar, S.; Ooi, Z.E.; Goh, K.E.J. Effect of Phonons on Valley Depolarization in Monolayer WSe2. Electron. Mater. Lett. 2018, 14, 766–773. [Google Scholar] [CrossRef]
  8. Kristen, K.; Thygesen, K.S.; Jacobsen, K.W. Phonon-limited mobility in n-type single-layer MoS2 from first principles. Phys. Rev. B 2012, 85, 115317. [Google Scholar] [CrossRef] [Green Version]
  9. Hu, X.; Yasaei, P.; Jokisaari, J.; Öğüt, S.; Salehi-Khojin, A.; Robert, K.F. Mapping Thermal Expansion Coefficients in Freestanding 2D Materials at the Nanometer Scale. Phys. Rev. Let. 2018, 120, 055902. [Google Scholar] [CrossRef] [Green Version]
  10. Murray, R.; Evans, B. The thermal expansion of 2H-MoS2 and 2H-WSe2 between 10 and 320 K. J. Appl. Cryst. 1979, 12, 312–315. [Google Scholar] [CrossRef]
  11. Late, D.J.; Shirodkar, S.N.; Waghmare, U.V.; Dravid, V.P.; Rao, C.N.R. Thermal expansion, anharmonicity and temperature-dependent Raman spectra of single- and few-layer MoSe2 and WSe2. Chem. Phys. Chem. 2014, 15, 1592–1598. [Google Scholar] [CrossRef]
  12. Rodríguez-Carvajal, J. Commission on Powder Diffraction (IUCr). Newsletter 2001, 26, 12–19. [Google Scholar]
  13. Joseph, B.; Demitri, N.; Lotti, P.; Lausi, A.; Dore, P. Unraveling the Peculiarities in the Temperature-Dependent Structural Evolution of Black Phosphorus. Condens. Matter 2017, 2, 11. [Google Scholar] [CrossRef] [Green Version]
  14. Schutte, W.J.; de Boer, J.L.; Jellinek, F.J. Crystal structures of tungsten disulfide and diselenide. J. Solid State Chem. 1987, 70, 207–209. [Google Scholar] [CrossRef]
  15. Vočadlo, L.; Knight, K.S.; Price, G.D.; Wood, I.G. Thermal expansion and crystal structure of FeSi between 4 and 1173 K determined by time-of-flight neutron powder diffraction. Phys. Chem. Min. 2002, 29, 132–139. [Google Scholar] [CrossRef]
  16. Hu, S.Y.; Lee, Y.C.; Shen, J.J.; Chen, K.W.; Huang, Y.S. Urbach tail in the absorption spectra of 2H-WSe2 layered crystals. Phys. Status Solidi a 2007, 204, 2389–2395. [Google Scholar] [CrossRef]
  17. Selvi, E.; Aksoy, R.; Knudson, R.; Ma, Y. High-pressure X-ray diffraction study of tungsten diselenide. J. Phys. Chem. Solids 2008, 69, 2311–2314. [Google Scholar] [CrossRef]
  18. Bhatt, S.V.; Deshpande, M.P.; Sathe, V.; Rao, R.; Chakia, S.H. Raman spectroscopic investigations on transition-metal dichalcogenides MX2 (M = Mo, W; X = S, Se) at high pressures and low temperature. J. Raman Spectrosc. 2014, 45, 971–979. [Google Scholar] [CrossRef]
  19. Li, H.; Zhang, Q.; Yap, C.C.R.; Tay, B.K.; Edwin, T.H.T.; Olivier, A.; Baillargeat, D. From Bulk to Monolayer MoS2: Evolution of Raman Scattering. Adv. Funct. Mater. 2012, 22, 1385–1390. [Google Scholar] [CrossRef]
  20. Li, Z.; Wang, Y.; Jiang, J.; Liang, Y.; Zhong, B.; Zhang, H.; Yu, K.; Kan, G.; Zou, M. Temperature-dependent Raman spectroscopy studies of 1–5-layer WSe2. Nano Res. 2020, 13, 591–595. [Google Scholar] [CrossRef]
  21. Campi, G.; Bianconi, A.; Poccia, N.; Bianconi, G.; Barba, L.; Arrighetti, G.; Innocenti, D.; Karpinski, J.; Zhigadlo, N.D.; Kazakov, S.M.; et al. Inhomogeneity of Charge-Density-Wave Order and Quenched Disorder in a High-Tc Superconductor. Nature 2015, 525, 359–362. [Google Scholar] [CrossRef]
  22. Joseph, B.; Schiavo, B. Effects of ball-milling on the hydrogen sorption properties of LaNi5. J. Alloys Compd. 2009, 480, 912–916. [Google Scholar] [CrossRef]
  23. Joseph, B.; Marini, C.; Demitri, N.; Capitani, F.; Bernasconi, A.; Zhou, W.; Xing, X.; Shi, Z. Temperature dependent structural modulation in Ca0.82La0.18FeAs2 pnictide superconductors. Supercond. Sci. Technol. 2015, 28, 092001. [Google Scholar] [CrossRef]
  24. Grant, A.J.; Wilson, J.A.; Yoffe, A.D. Optical studies of transition metal dichalcogenide layer crystals at high pressures. Philos. Mag. A 1972, 25, 625–636. [Google Scholar] [CrossRef]
  25. EL-Mahalawy, S.H.; Evans, B.L. Temperature Dependence of the Electrical Conductivity and Hall Coefficient in 2H-MoS2, MoSe2, WSe2, and MoTe2. Phys. Status Solidi B 1977, 79, 713–722. [Google Scholar] [CrossRef]
  26. Lotti, P.; Milani, S.; Merlini, M.; Joseph, B.; Alabarse, F.; Lausi, A. Single-crystal diffraction at the high-pressure Indo-Italian beamline Xpress at Elettra, Trieste. J. Synchrotron. Rad. 2020, 25, 222–229. [Google Scholar] [CrossRef]
  27. Hammersley, A.P.; Svensson, S.O.; Hanfland, M.; Fitch, A.N.; Hausermann, D. Two-dimensional detector software: From real detector to idealized image or two-theta scan. High Press. Res. 1996, 14, 235–248. [Google Scholar] [CrossRef]
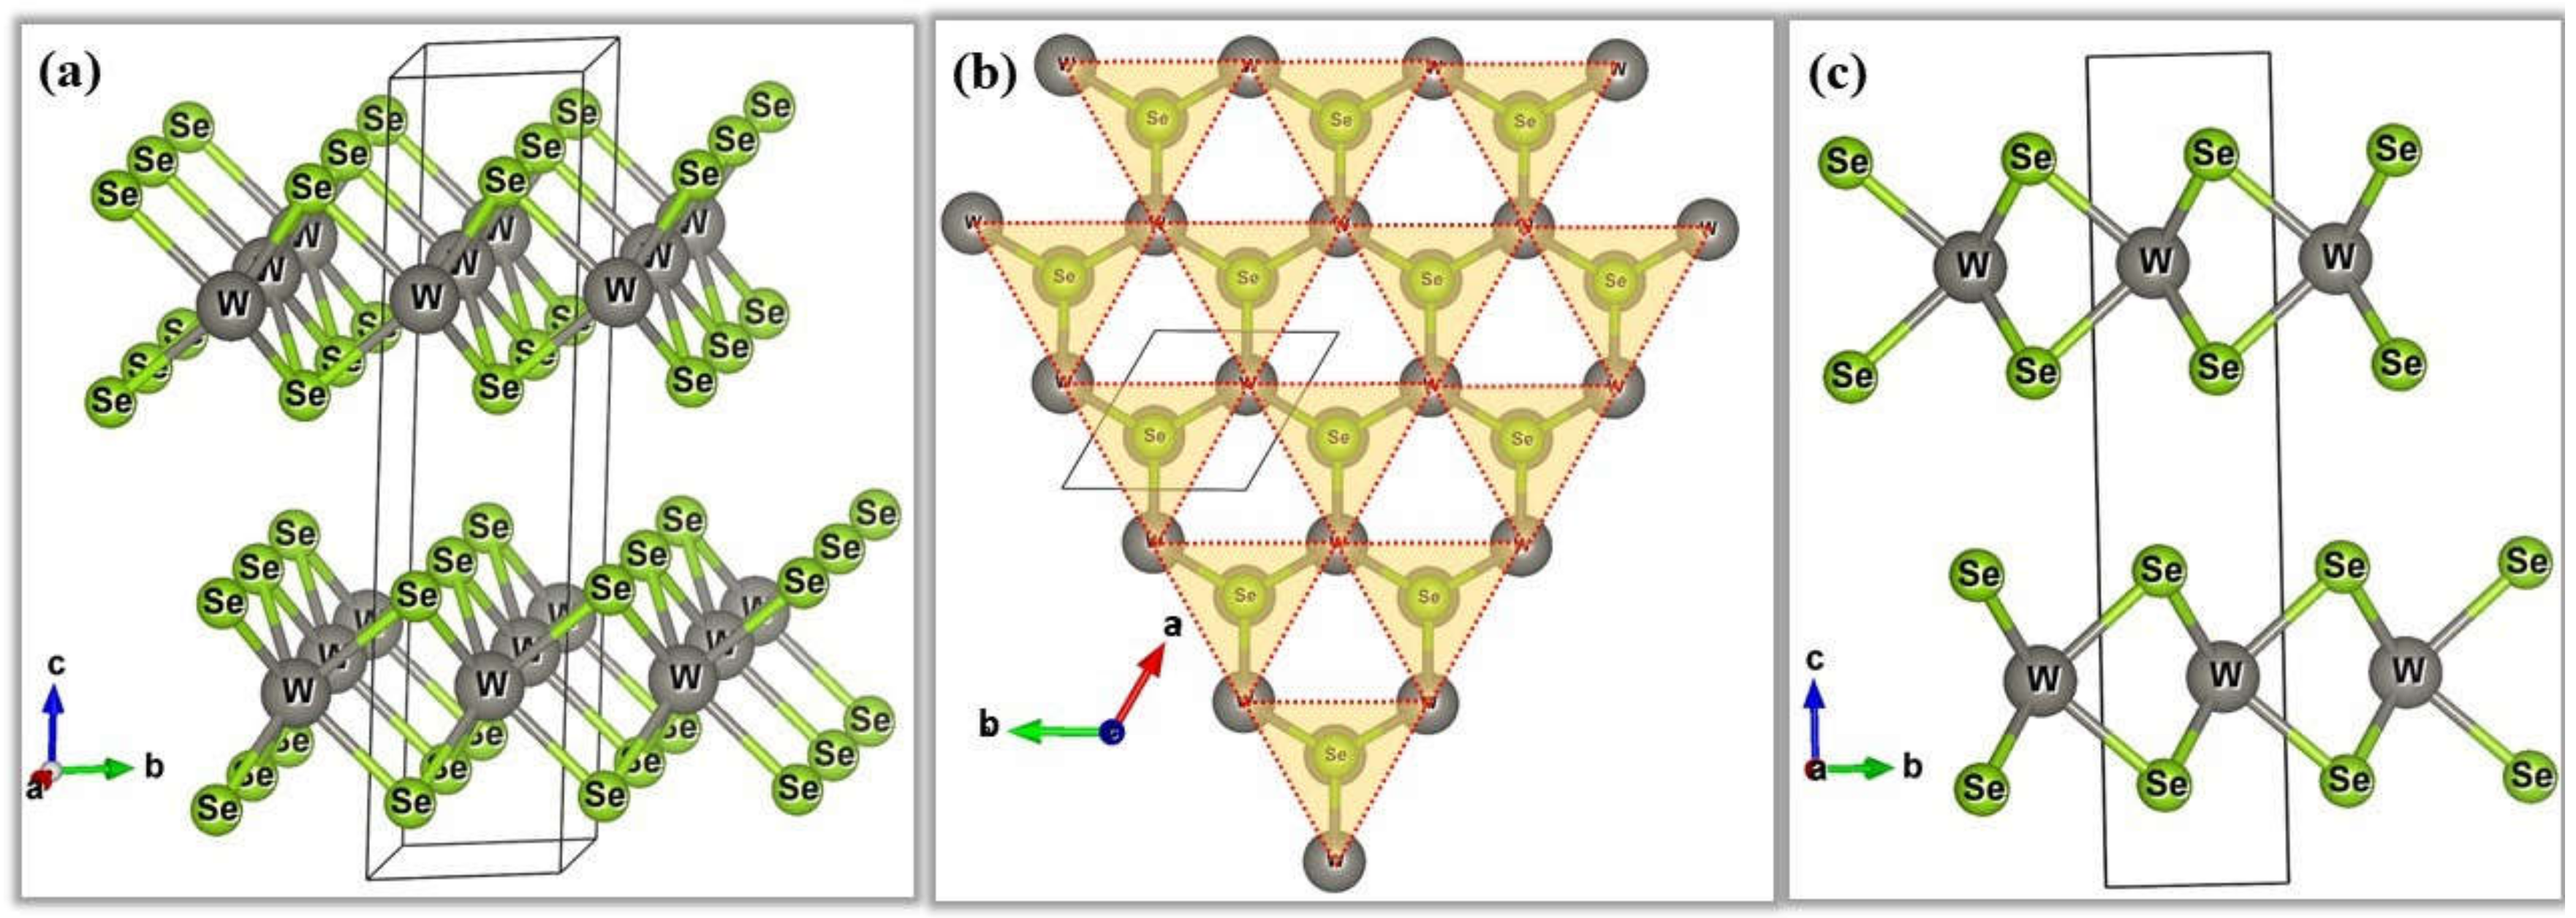
Figure 1. (a) A 3D view of the crystal structure of 2H-WSe2.The structure along a-b, b-c axes projections are given in panels (b,c), respectively. The hexagonal lattice is formed by two interpenetrating triangular sub-lattices of W and Se, the Se sub lattice is shown as red dotted lines in (b). A 2H unit cell of WSe2 consists of two sets of Se-W-Se layers separated by a large inter-layer separation as shown (c). The inter-layer interaction is the van der Waals type, unlike the intra-layer it is covalent.
Condensedmatter 05 00076 g001
Figure 2. X-ray powder diffraction data (open circles) together with results from the Rietveld refinement analysis (solid red lines) from a micromechanically exfoliated bulk WSe2 at 400 K. X-ray wavelength used for the measurements was 0.7 Å. Green vertical bars are Bragg peak positions, gray solid lines are the difference curve between the data and the model. An optical micrograph of exfoliated thick flake is given at the inset. Scale bar in optical micrograph is 100 µm.
Condensedmatter 05 00076 g002
Figure 3. (a) X-ray diffraction XRD data at different temperatures (symbols) together with the Rietveld refinement results (solid lines). Panel (b) shows a zoom over the high 2θ part. Text close to the curves indicates the temperature values in K.
Condensedmatter 05 00076 g003
Figure 4. The lattice constant vs. temperature plots for in-plane a (a) and the out-of-plane c (b) lattice constants. The blue spheres are experimental points and red line in (a,b) is the fit using Equation (1) with error bars in grey lines. The best fitted values are indicated also in the panels.
Condensedmatter 05 00076 g004
Figure 5. The unit cell volume vs. temperature plot, the blue spheres are the experimental points and the red line is the equation of state fit with error bars in grey lines. The function used and the best fitted parameters are indicated in the plot.
Condensedmatter 05 00076 g005
Figure 6. Temperature dependence of (a) W-W bond distance (symbols) together with that of the in-plane lattice parameter a (solid lines), (b) W-Se bond length (blue spheres with error bar in grey lines) and (c) the in-plane Raman vibrational mode E 2 g 1 (extracted from Ref. [19]). Dotted line in (c) is linear fit considering data points (red sphere) above 250 K. Atomic vibrations of the in-plane E 2 g 1 vibration is shown at the inset of (c).
Condensedmatter 05 00076 g006
Publisher’s Note: MDPI stays neutral with regard to jurisdictional claims in published maps and institutional affiliations.