Article

Role of H Distribution on Coherent Quantum Transport of Electrons in Hydrogenated Graphene

by
Luca Parisi
1,2,†,
Giuseppe G. N. Angilella
1,2,3,4,5,*,
Ioannis Deretzis
2,
Renato Pucci
1,2,5 and
Antonio La Magna
2
1
Dipartimento di Fisica e Astronomia, Università di Catania, Via S. Sofia 64, 95123 Catania, Italy
2
CNR-IMM Zona Industriale VIII Strada 5, 95121 Catania, Italy
3
Scuola Superiore di Catania, Università di Catania, Via Valdisavoia 9, 95123 Catania, Italy
4
Istituto Nazionale di Fisica Nucleare, Sez. di Catania, Via S. Sofia 64, 95123 Catania, Italy
5
CNISM, UdR Catania, Via S. Sofia 64, 95123 Catania, Italy
*
Author to whom correspondence should be addressed.
Current address: Dipartimento di Fisica, Università di Trento and CNR-INO BEC Center, 38123 Povo, Trento, Italy.
Condens. Matter 2017, 2(4), 37; https://doi.org/10.3390/condmat2040037
Submission received: 7 October 2017 / Revised: 28 November 2017 / Accepted: 29 November 2017 / Published: 4 December 2017

Abstract

:
Using quantum mechanical methods, in the framework of non-equilibrium Green’s function (NEGF) theory, we discuss the effects of the real space distribution of hydrogen adatoms on the electronic properties of graphene. Advanced methods for the stochastic process simulation at the atomic resolution are applied to generate system configurations in agreement with the experimental realization of these systems as a function of the process parameters (e.g., temperature and hydrogen flux). We show how these Monte Carlo (MC) methods can achieve accurate predictions of the functionalization kinetics in multiple time and length scales. The ingredients of the overall numerical methodology are highlighted: the ab initio study of the stability of key configurations, on lattice matching of the energetic configuration relation, accelerated algorithms, sequential coupling with the NEGF based on calibrated Hamiltonians and statistical analysis of the transport characteristics. We demonstrate the benefit to this coupled MC-NEGF method in the study of quantum effects in manipulated nanosystems.

1. Introduction

Graphene’s (G) discovery [1] opened the breakthrough perspective to use materials made of a single atomic layer (i.e., two-dimensional materials) for nanotechnologies, including quantum technology (QT). Indeed, this discovery has led to the discovery of a whole range of 2D materials [2], although graphene still remains probably the most interesting one for applications, due to its intrinsic chemical and mechanical stability. In addition, graphene’s electronic structure exhibits peculiar features, which makes graphene an extremely interesting material, both for fundamental and applied reasons in the QT field. Indeed, the linear dispersion allows one to the mimic quantum electrodynamics (QED) effects of ultra-relativistic particles with an effective limit Fermi velocity v F . Moreover, the proximity of magnetic instabilities of electron systems [3] makes graphene-based devices ideal candidates for the coherent spin manipulation procedures implemented in the spintronics field.
Anyhow, the proposed applications usually need to modify the pristine electron structure of graphene by nano-structuring or functionalizing the material. In this respect, probably the most direct method to achieve some of these goals is by using deposited hydrogen (H) adatoms to locally functionalize the graphene layer. The H adatoms can form bonds with the carbon atoms, changing their hybridization state from s p 2 to s p 3 , with a strong, but easy to formulate impact on the electronic structure of the material: one site of the G lattice is not accessible to the electron transport (i.e., an effective “vacancy” forms). Evidence of the modified electronic properties of graphene due to hydrogen adatoms or vacancies is already available from quantum-chemistry calculations for such impurities in large benzene-like molecules [4], as well as in their effect on the local density of states and conductivity of graphene [5].
Theoretical results show that adsorption of hydrogen adatoms on graphene can lead to a material, hydrogenated graphene (HG), with new intriguing electronic and magnetic properties [3]. In particular, controlled modifications of the space distribution of Hs can induce a peculiar magnetic state in the HG [6]. These computational results do not deal with the G hydrogenation process: in other words, they predict the spin and electron properties on the basis of a hypothetical fixed H distribution. The real manufacturing of HG is based on the exposition of G to H fluxes (atomic or molecular according to the particular used equipment) from moderate to high process temperatures [7], eventually using plasma sources to decouple the gas temperature from the substrate temperature. In these conditions, hydrogen adatoms are not immobile, but can move on the surface of graphene forming stable aggregates by effective H–H interactions [8]. As a consequence, it is interesting to study the dynamics of the hydrogen adatoms and how the evolution of the system under processing affects the properties of the final hydrogenated graphene.
Our study is also motivated by the extensive efforts towards understanding the unusual magnetic properties of hydrogenated graphene and their effect on electronic and spin transport. In this context, scanning tunneling microscopy (STM) experiments demonstrated that a spin-polarized state is created around an adsorbed hydrogen atom in graphene [9]. Local spin correlation can also be induced by proton or helium irradiation. Numerical evidence from density functional theory calculations has been provided for hydrogen and hydrogen-vacancy complexes [10], single carbon atom defects [11] and vacancies both in bulk graphene and in graphene nanoribbons [12]. This is complemented by experiments on point defects, such as fluorine adatoms, and radiation-induced vacancies in graphene [13], both being endowed with spin- 1 2 magnetic moments, as well as on hydrogen adatoms [14]. Nontrivial magnetic states have been found by STM in graphene nanoribbons, depending on the edge geometry [15]. The origin of magnetic states from adatoms in graphene has been partly attributed to itinerant electrons and could therefore be tunable by doping, thereby paving the way towards applications in spintronics [16]. Hydrogenated graphite surfaces have been studied theoretically [17,18,19,20,21,22]. The Curie temperature of an hydrogenated graphene layer or multilayer has been estimated [17], and the tendency towards the formation of H or D clusters has been predicted theoretically [23] and observed experimentally via STM [24]. Again, quantum chemical model calculations on large carbon clusters, such as coronene, have been instrumental to detect the onset of magnetism in these hydrogenated carbon systems [19,25] (see also [4,26]).
On the other hand, transport in hydrogenated graphene is expected to exhibit remarkable spin properties, depending on its underlying magnetic state. This has been evidenced within a mean-field approach to a self-consistent Hubbard model derived from first-principles calculations, where magnetotransport was studied via a Kubo transport methodology [27,28,29]. These results suggest that low temperature transport measurements could help with detecting the presence of a magnetic state in weakly hydrogenated graphene. Several experimental techniques pointed towards the possible occurrence of a metal-insulator transition in hydrogenated graphene, as a function of hydrogenation [30,31]. These results have been interpreted in terms of the crossover between different quantum transport regimes, triggered by hydrogenation-induced disorder [32,33]. In particular, both the existence of a minimum semiclassical conductivity and a crossover between a weak to strong localization regime has been discussed theoretically [34]. The behavior of a single defect has provided some insight into the resonant scattering taking place in these systems [35].
In this paper, we will study by the atomistic process simulations and quantum transport calculations the relationships among: process conditions, adatom kinetics, process results and electronic properties of the obtained structures. Preliminary results have been presented in [36,37]. The results of this computational analysis are discussed in Section 2. In particular, we have performed data analysis on configuration energies, evaluated within a first-principles framework, taking advantage of genetic algorithms to develop an effective model for the adatom interactions (Section 2 and Section 4). Then, we have used this model to perform lattice kinetic Monte Carlo (LKMC) simulations (Section 4) of the hydrogenation process. Finally, quantum transport properties of the LKMC simulated structures are then investigated using non-equilibrium Green’s function (NEGF) techniques [38] (Section 4).

2. Results

The final goal of this research is the use of a coupled methodology (MC-NEGF) to design the electronic features of HG systems (NEGF application) using reliable predictions for the micro-structure of the HG sample after the hydrogenation process (LKMC application). A prerequisite for the final goal is the derivation of a reliable energetic model to be implemented in the LKMC code for the simulations of interacting hydrogen adatoms. This procedure exploits accurate calculations performed with density functional theory (DFT) for H cluster energetics [39,40]. As is discussed in Section 2.1 immediately below, our derivation strategy substantially improves the one considered in [40], and these improvements result in a strongly different simulated evolution for the processed system and, thus, the final estimate of the HG electrical properties.

2.1. Adatoms Interactions

Effective H–H interactions arise from mutual changes of hybridization and relaxation of the G lattice induced by the chemisorbed H adatom. These interactions need to be taken into account when studying the kinetics of chemisorbed hydrogen adatoms. When two hydrogen adatoms are separated by just a few lattice positions, effective interactions between the adatoms become important, and adatoms can form effective distance-dependent bonds. In an Ising-like LKMC mapping of the configuration energetics [41], we can assume that the binding energy of a configuration is given by summing the energy gain of each bond and that the bonding energy only depends on the distance between the two bonded hydrogen adatoms. We also expect that the larger the distance between two adatoms, the weaker is their bonding energy. As a consequence, we may neglect all bonds formed beyond a certain limiting distance. In the lattice formulation of the LKMC, the distance between adatoms can only assume discrete values, and the binding energy of a given hydrogen adatom with all other atoms can be given by the Ising-like formula:
E = α 1 n 1 + α 2 n 2 + + α N n N ,
where α 1 ( 2 ) are real numbers and n j are the number of H adatoms present in the j-th nearest-neighbor lattice position, and the sum is extended to the N nearest-neighbor lattice positions. Equation (1) only considers the interaction energy of one single hydrogen adatom with all the others. In order to obtain the total interaction energy E T , we need to sum over all adatoms, as stated by the formula:
E T = 1 2 i E ( n 1 ( i ) , n 2 ( i ) , ) ,
where the sum is performed over all hydrogen adatoms, and the factor of 1 2 accounts for double counting. As the global energy E T can also be calculated through DFT calculations, a fitting procedure between the total energy predicted by the model and DFT calculations for different configurations can yield an estimate of the coefficients α 1 ( 2 ) . In [40], the authors used this Ising-like bound-counting model to account for H–H interactions, extended up to next-nearest neighbors ( N = 2 ), and considering only seven H-cluster configurations, they found the optimal values α 1 = 1.182 eV and α 2 = 0.484 eV. The former value is positive, indicating that first-nearest neighbors attract each other, while the latter value is negative, indicating that interactions between next-nearest neighbor adatoms are repulsive. We choose to test more LKMC models by collecting DFT results from the literature [39,40], where the authors report binding energies for many different configurations with small H adatom clusters, and compare them with the energies predicted by the model. In the Ising-like class, we also choose to extend the bound-counting model up to third-nearest-neighbor interactions (3N). Finally, while we continue to assume that binding energies only depend on the number of bonds formed with nearest, next-nearest, and third neighboring adatoms, regardless of their exact positions on the lattice, we do not impose that the relationship should be linear, leave the energies E ( n 1 , n 2 , n 3 ) undetermined and consider them as parameters of the model. We note that this generalization of an LKMC scheme does not result in an additional computational cost thanks to the use of tabular functions. Thus, we can write the binding energies for these three different models as:
E ( 1 ) = α 1 n 1 + α 2 n 2 ,
E ( 2 ) = β 1 n 1 + β 2 n 2 + β 3 n 3 ,
E ( 3 ) = γ ( n 1 , n 2 , n 3 ) ,
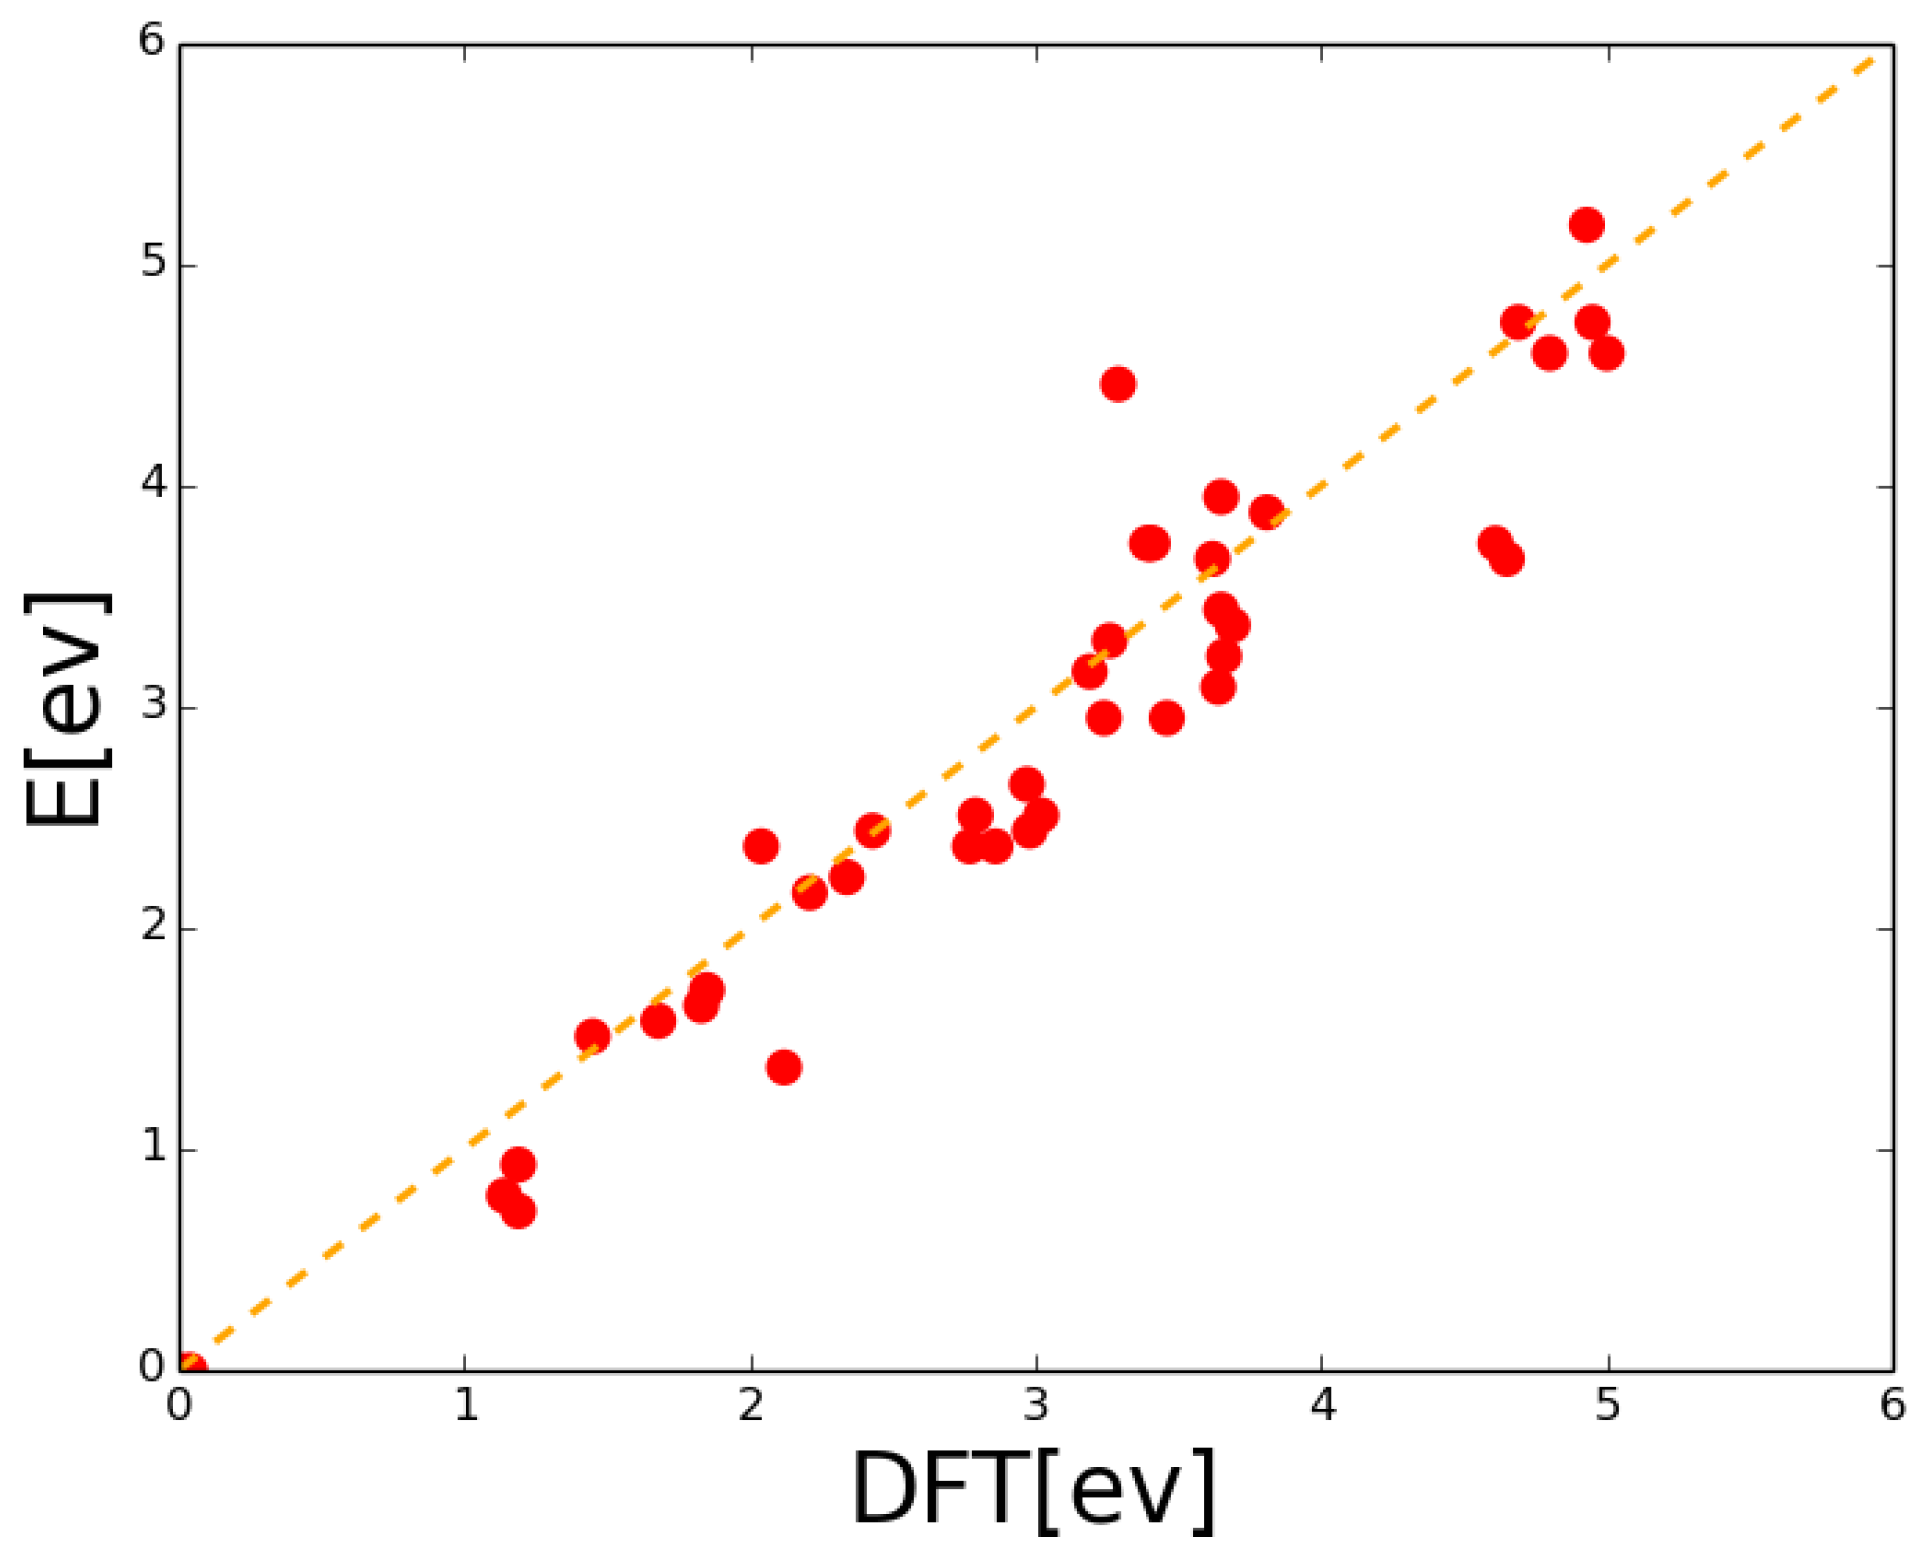
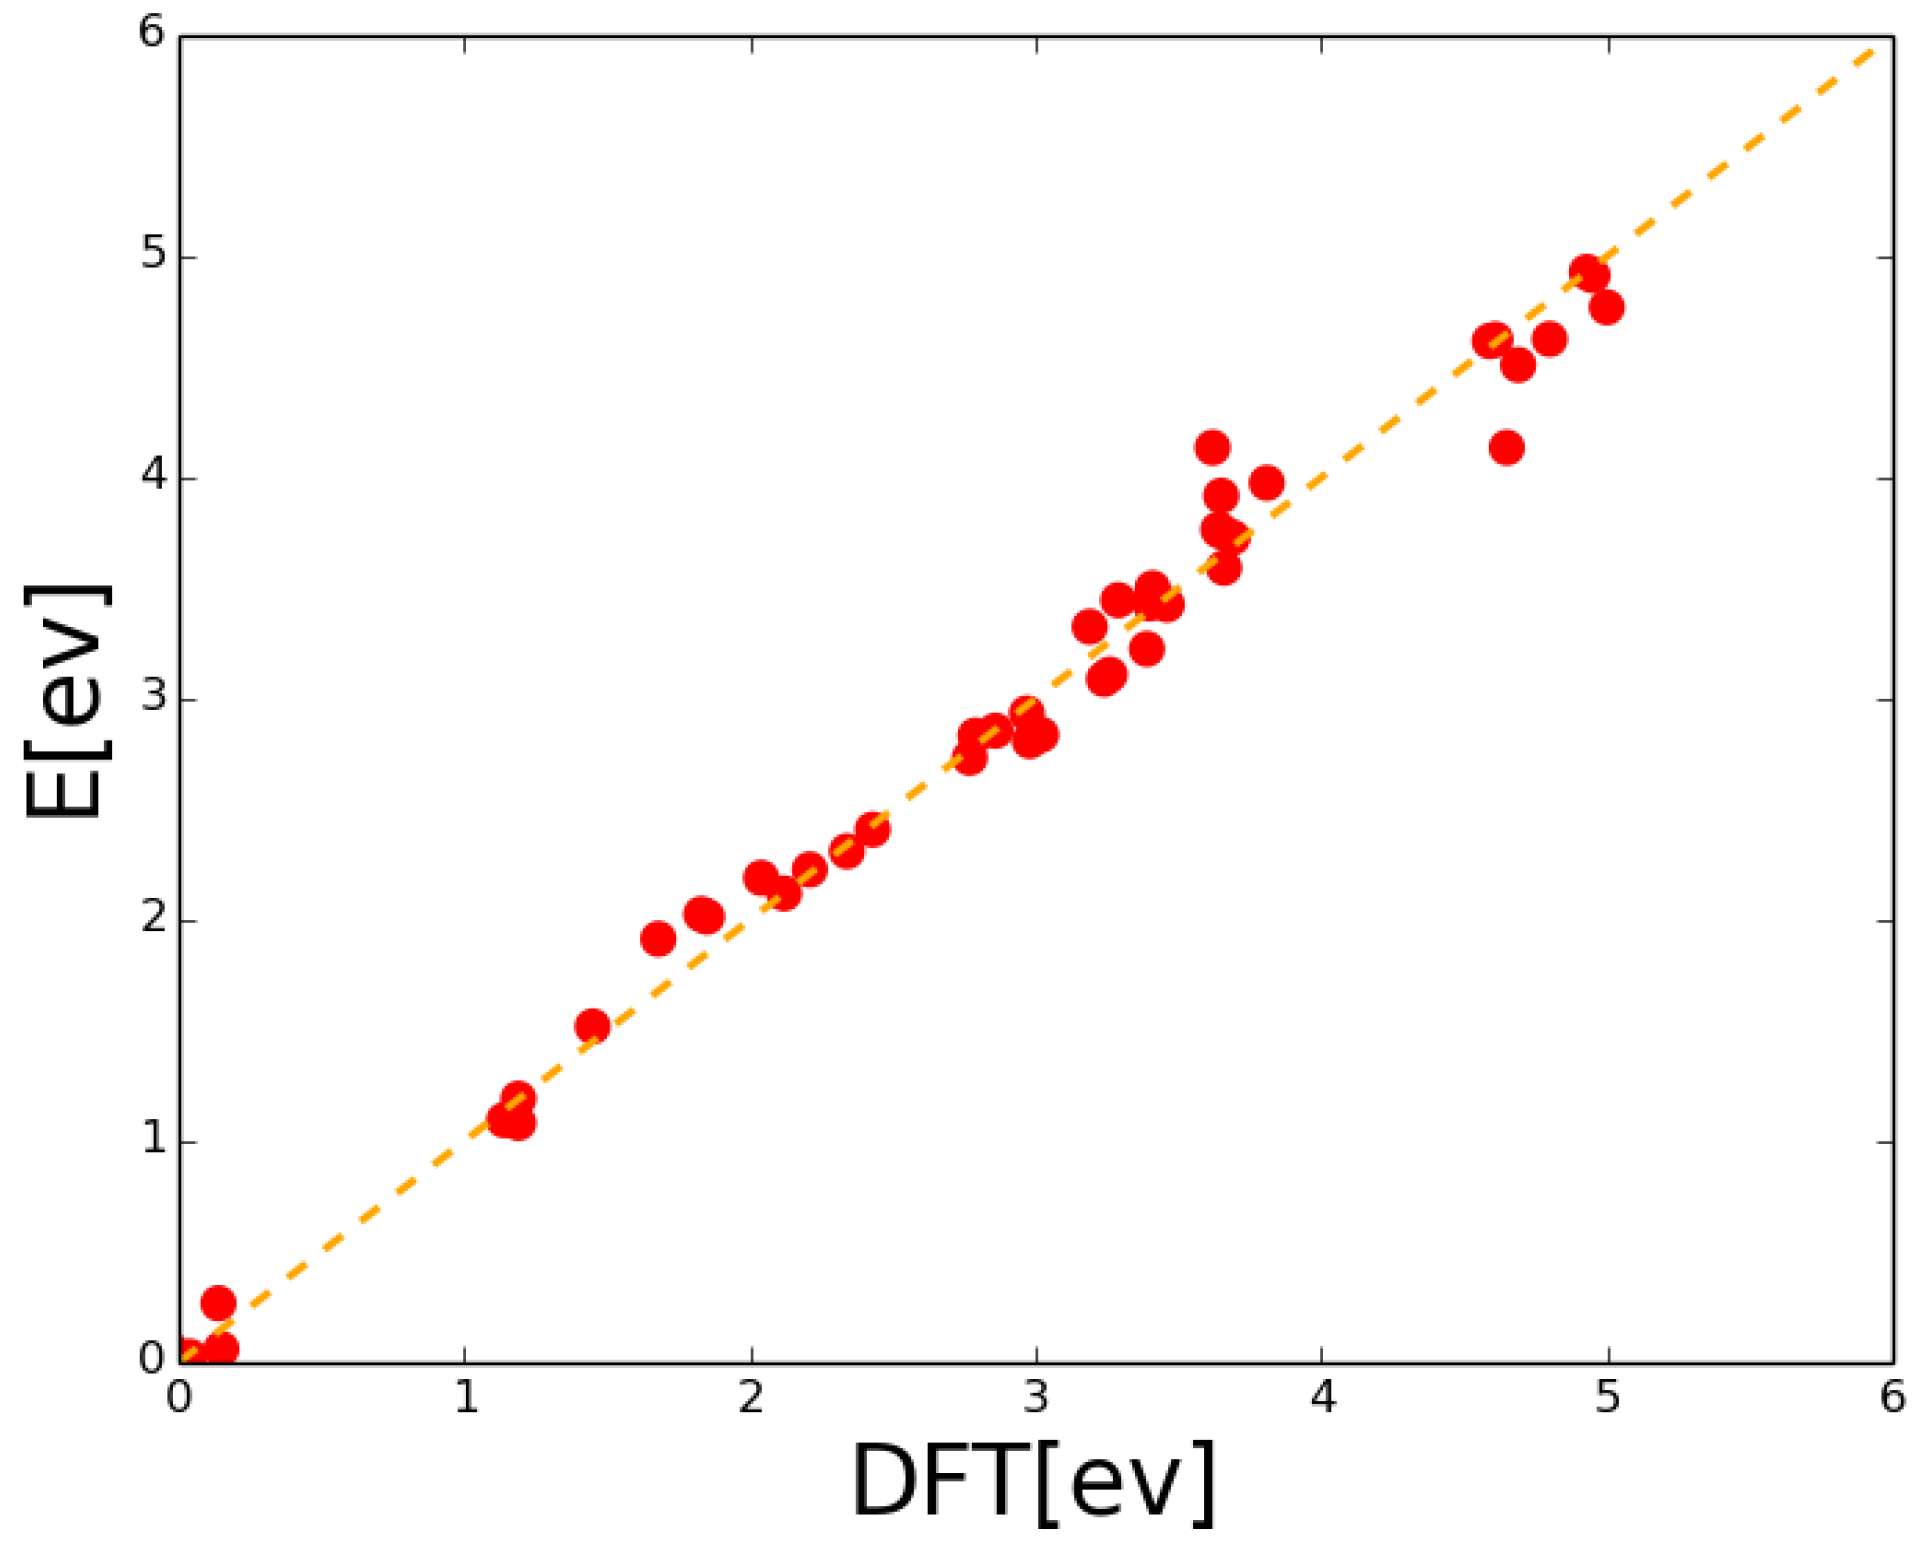
where n i denotes the number of the i-th nearest-neighbor adatom, and α i , β i , γ i are real coefficients, which can be determined through the comparison with DFT results, as previously described. While the first two models depend on two and three coefficients, respectively, the third model depends on 112 parameters. Such an abundance of parameters requires a wide initial pool of DFT results and an efficient optimization algorithm (cf. Section 4 and Appendix A). Figure 1, Figure 2, Figure 3 show LKMC versus DFT energies for a broad set of H clusters on graphene within the three models above, Equations (3a), (3b), (3c), respectively.
From this analysis, we can easily conclude that the next-nearest-neighbors model of Equation (3a) adopted in [40] provides a poor mapping of the DFT configuration energies when extending the configuration set beyond the one there considered, as only a very limited number of points fall close to the first bisector. The strong failure of the model is emphasized by the presence of configurations on the horizontal axis, for which DFT calculations predict high binding energies, while the model predicts zero energy (no interaction). This is due to the fact that the model, which does not include third-neighbor contributions, is not capable of reproducing the properties of para H–H configurations in G.
A significantly better agreement is obtained with the second model, when extending Ising-like interactions to third-nearest neighbors, according to Equation (3b) with parameters β 1 = 0.93 , β 2 = 0.21 and β 3 = 0.79 , where points are overall much closer to the first bisector, and of course, no point appears on the horizontal axis.
Finally, an excellent agreement is obtained with the third model, described by Equation (3c), with the coefficients { γ ( n 1 , n 2 , n 3 ) } , obtained using genetic algorithms and reported in Table A1 of Appendix A. In the following, we will adopt for LKMC H–H interaction energetics of the third model and compare the results with those obtained with the first model, which we will indicate from now on as the 3N and 2N models, respectively.

2.2. Lattice Kinetic Monte Carlo Energetic Effects

In order to discuss more properly the effect on the simulated evolution of the different LKMC energetics only, we initially compare the results obtained with the 2N Equation (3a) and 3N Equation (3c) models without considering adatom desorption events. In this case, the 2N simulations reproduce the same setting considered in [40]. The only relevant difference with the results discussed in the cited manuscript is that we can greatly extend the simulation time thanks to the use of the accelerated LKMC algorithm [42] (cf. Section 4 and Appendix B).
In Figure 4, we show a snapshot (in zoom view) of the simulated evolution using the 2N model, for a deposition process with an H flux of Φ = 10 10 atoms · cm 2 · s 1 at a temperature T = 300 K. The snapshot shows the system status when a coverage of 3% is reached, while the simulation is then stopped at a coverage of 5%.
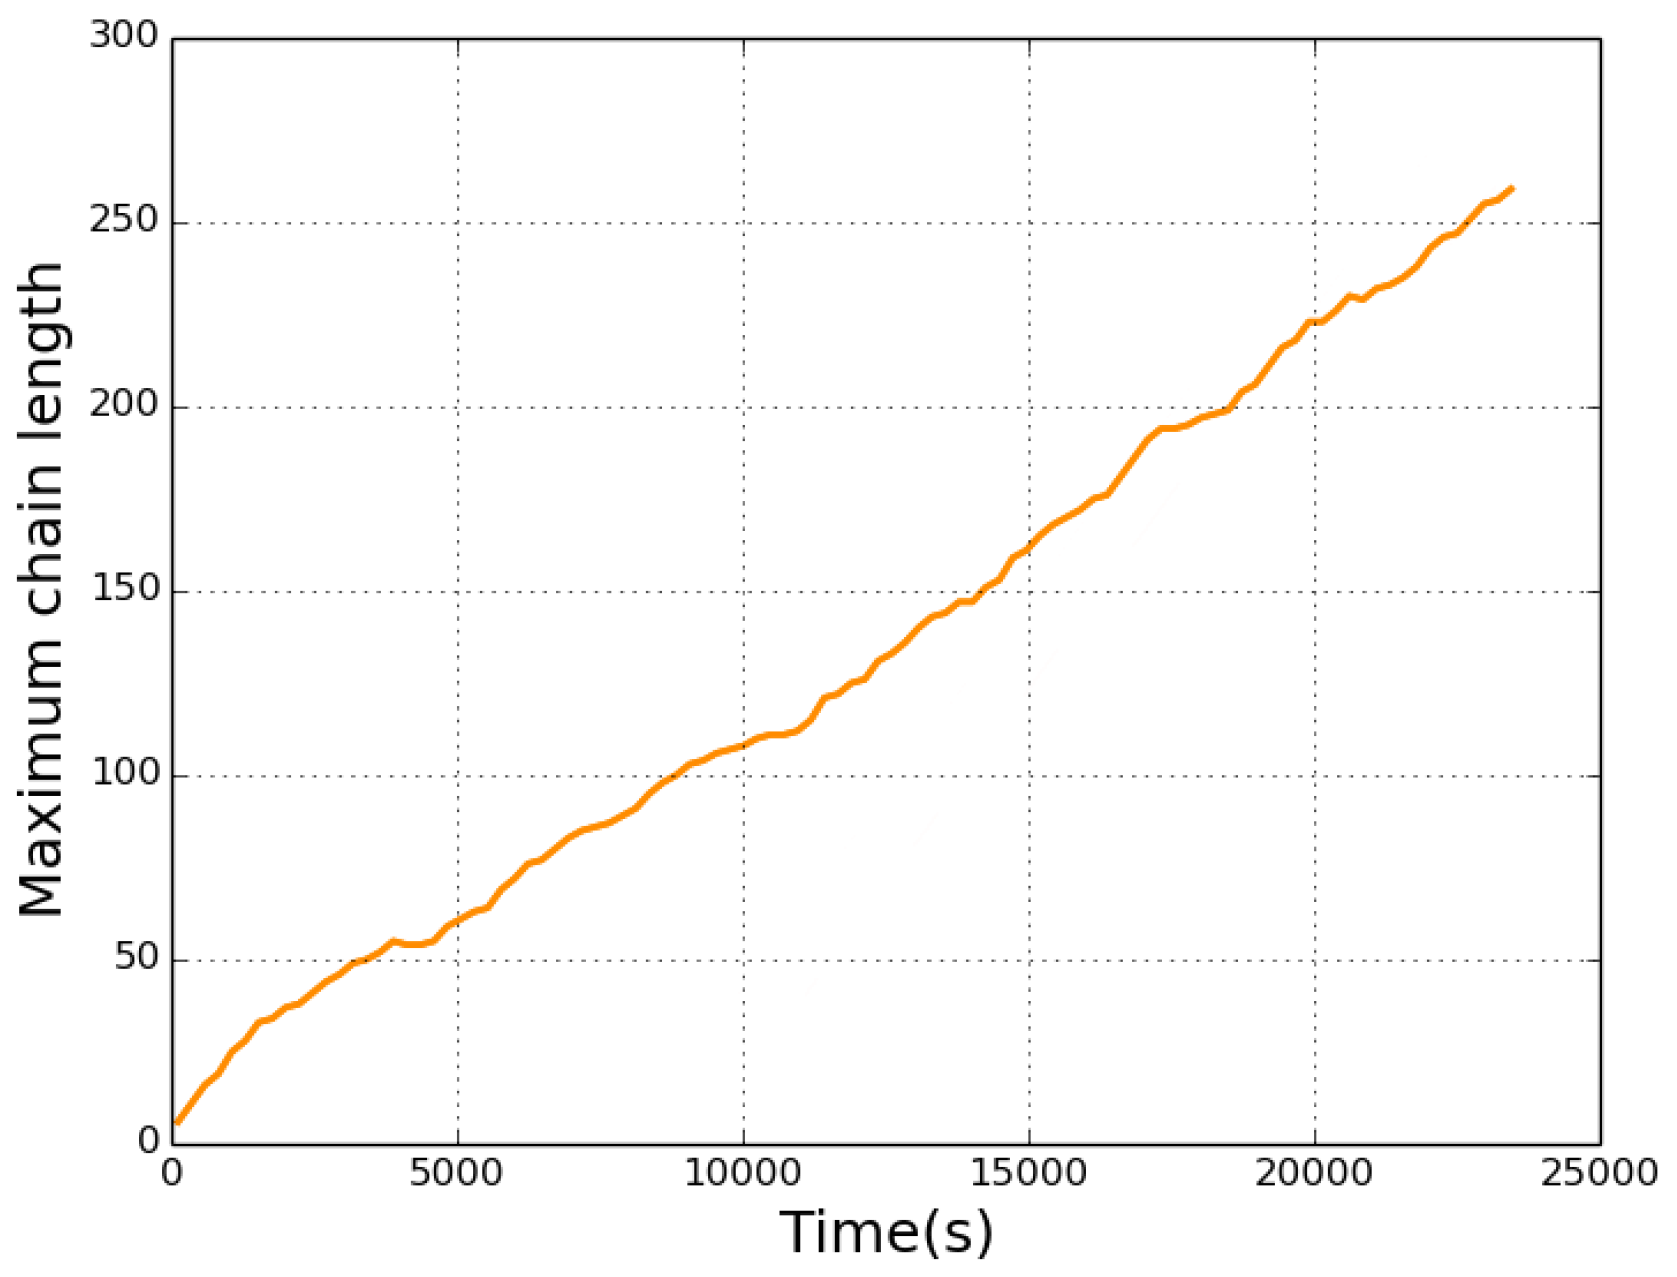
It is clear that the status of the simulated system is characterized by long chains of hydrogen adatoms, never experimentally observed. At a higher coverage, longer chains are formed (see, e.g., the maximum chain length over time plotted in Figure 4), but the scenario does not change qualitatively. This particular shape of the H clusters maximizes their binding energy according to the model Equation (3a) due to the presence of attractive first-neighbor (ortho H–H) and repulsive second neighbor (meta H–H) interactions. At higher temperatures, when the detachment of the adatoms from the chain is much more frequent, very long atomic chains can grow at the expense of the smaller ones by means of an Ostwald-type ripening mechanism (Figure 5) [41].
In Figure 6, we show the analogous simulation (same temperature and flux) using the 3N energetics (model Equation (3c)). As in the previous case, we did not consider desorption.
The space distribution of H adatoms obtained with the 3N model is very different with respect to the one obtained considering the 2N model. Indeed, instead of long chains, we observe the formation of flake-like configurations of hydrogen adatoms. The inclusion of an attractive (on average) interaction between adatoms sitting at a third-neighbor distance (related to the para H–H configuration) completely breaks off the landscape of bonded H on G. Considering the inner cluster bonding, while in the chains, two neighboring adatoms are at first-neighbor distances of the honeycomb lattice, for the clusters predicted by the 3N model, a relevant portion of them is composed by H adatoms with relative positions equal to the third nearest-neighbor distance. The main conclusion that we can draw from the considerations of the statics (Section 2.1) and kinetics (Section 2.2) of the LKMC model is that the 3N interaction represents a reliable approximation of the H–H interaction in G, while the use of the 2N model poorly approximates DFT results and provides a non-physical scenario of the evolving HG structure. As a consequence, we adopt this choice for the theoretical study (including also desorption events) of the full hydrogenation process topic of the next section.
It should be noted that within the LKMC model, the meta (M) dimer has a quite weak binding energy of 0.1327 eV (cf. Table A1, for n 1 = 0 , n 2 = 1 , n 3 = 0 ). This should be regarded as an improvement over the 2N model and is consistent, at the present level of approximation, with the result that an M dimer is bound [17,23]. Furthermore, Lieb’s rule [43,44], basically stating that magnetic clusters are less stable than nonmagnetic ones, is generally fulfilled by our ab initio calculations of the stability of H clusters, which is the starting point for the LKMC energetics and in the kinetic simulations.

2.3. Simulation of the Hydrogenation Process

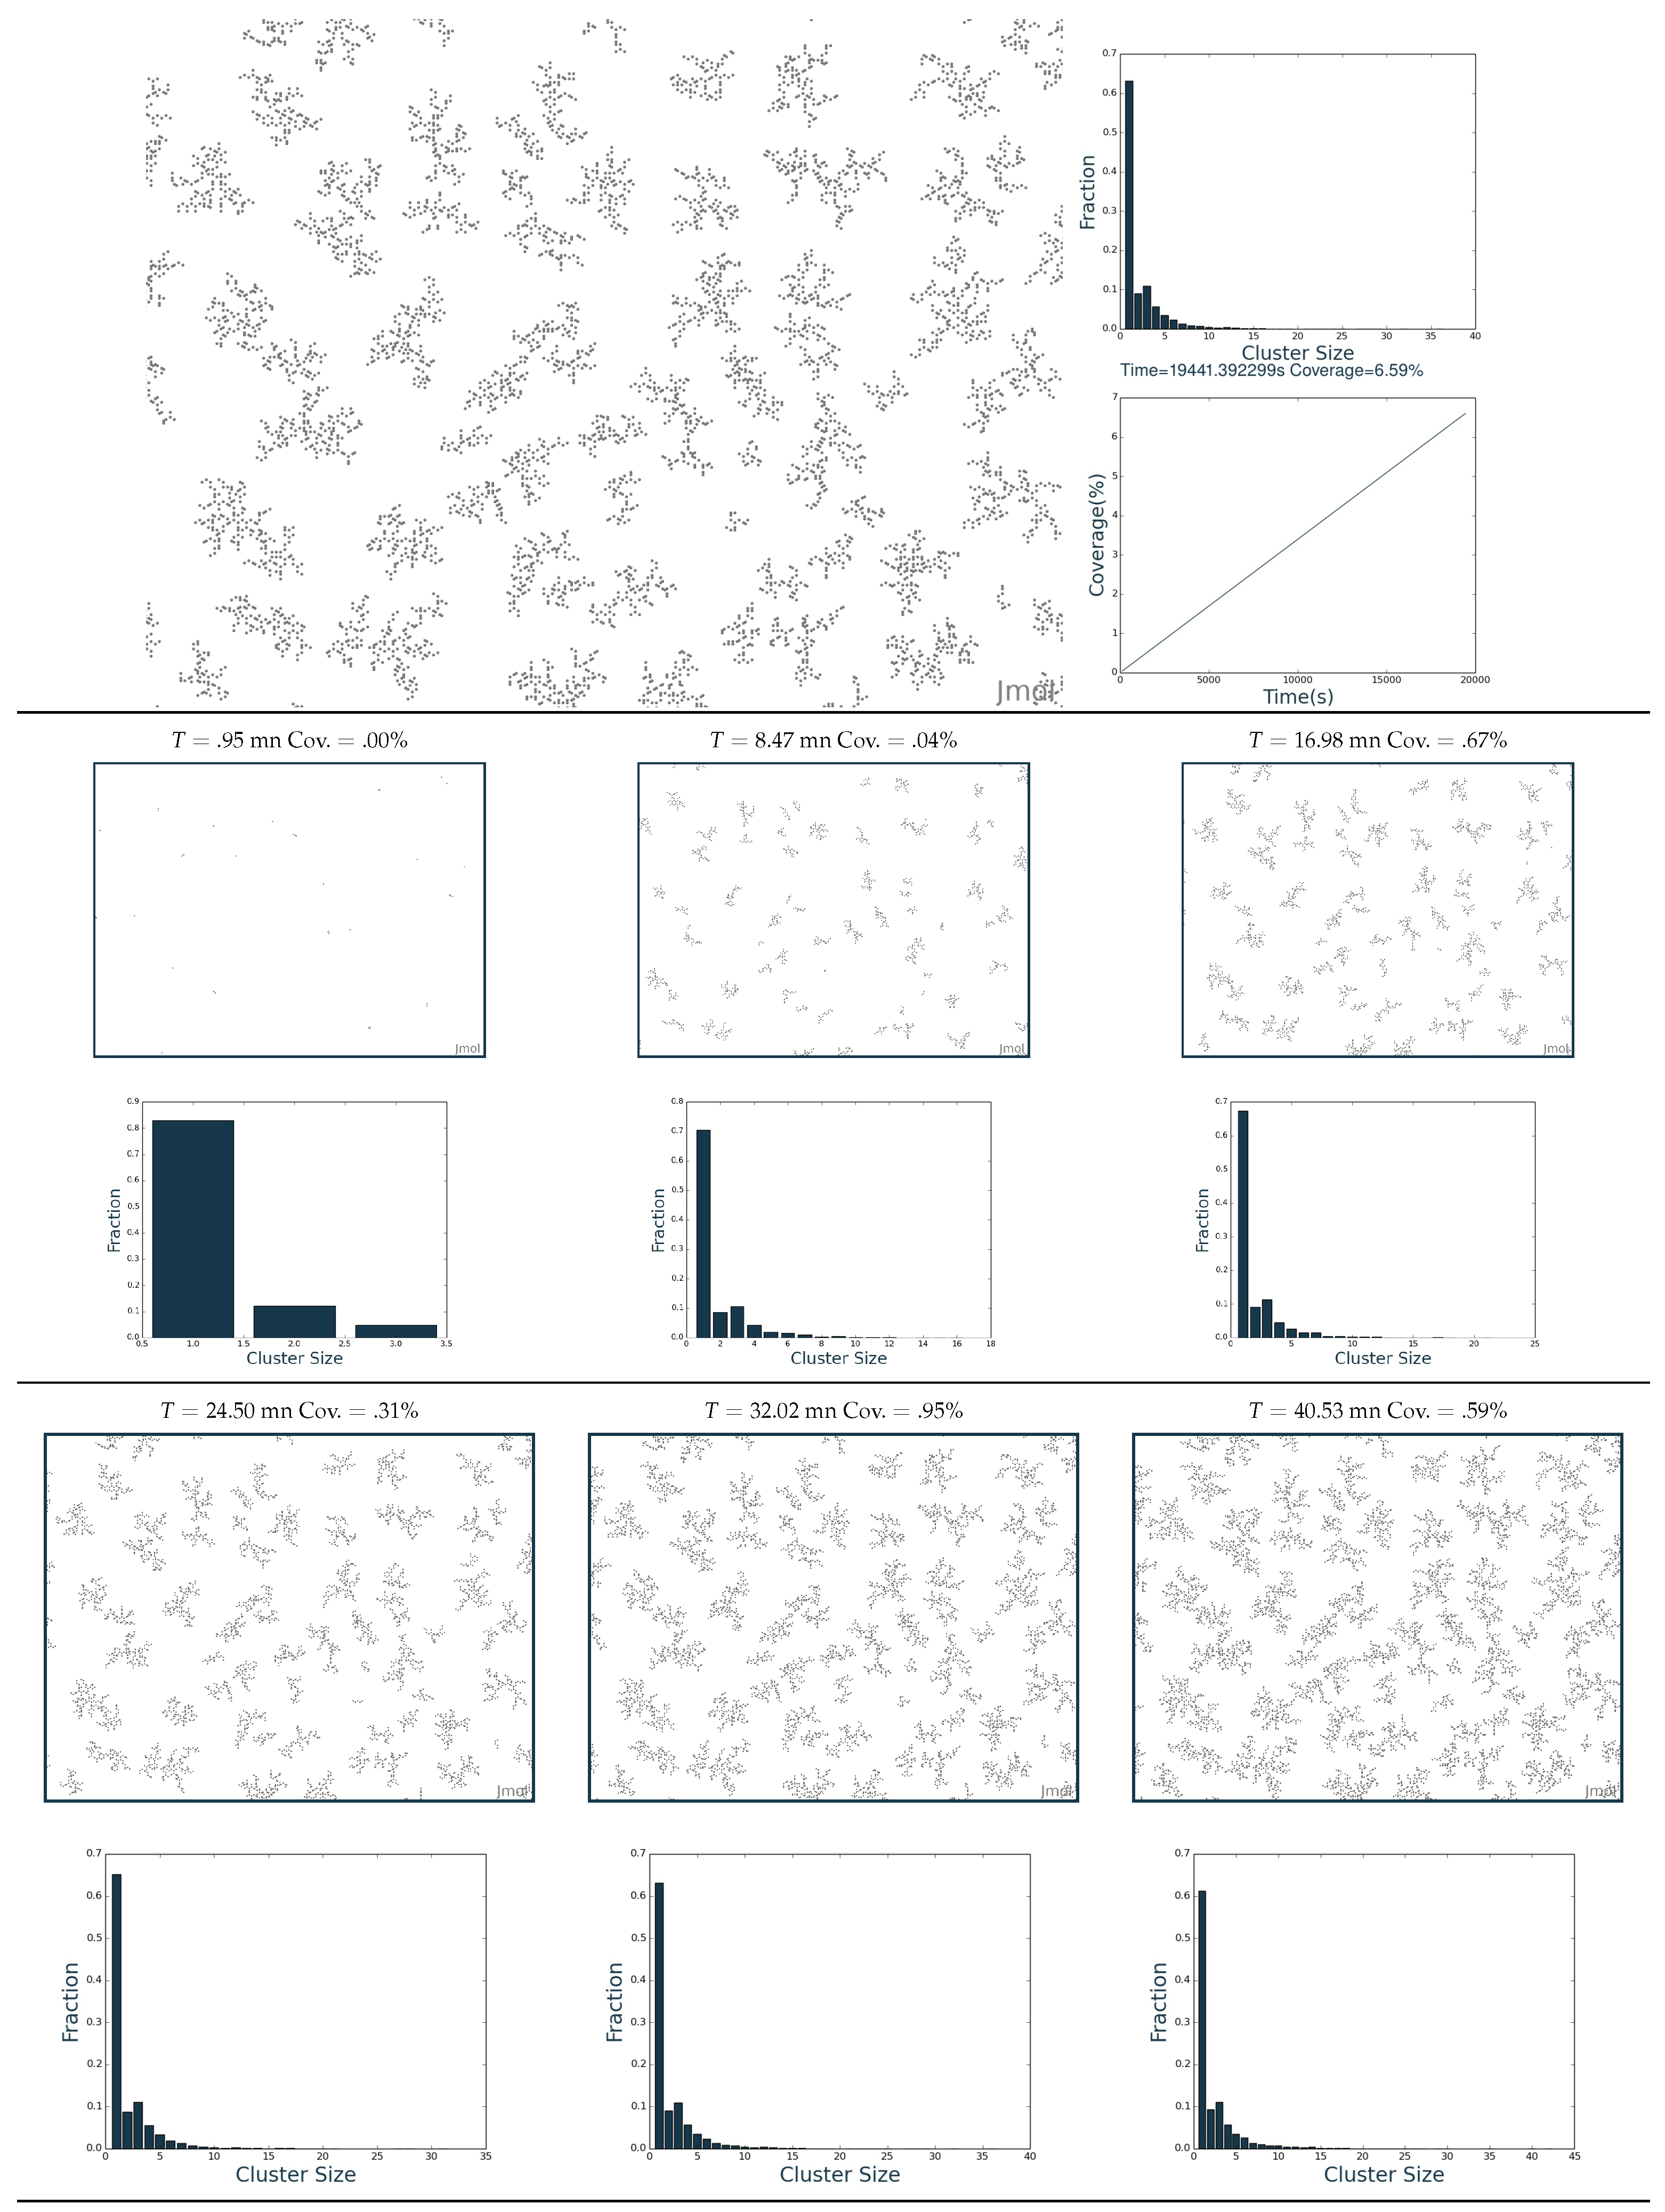
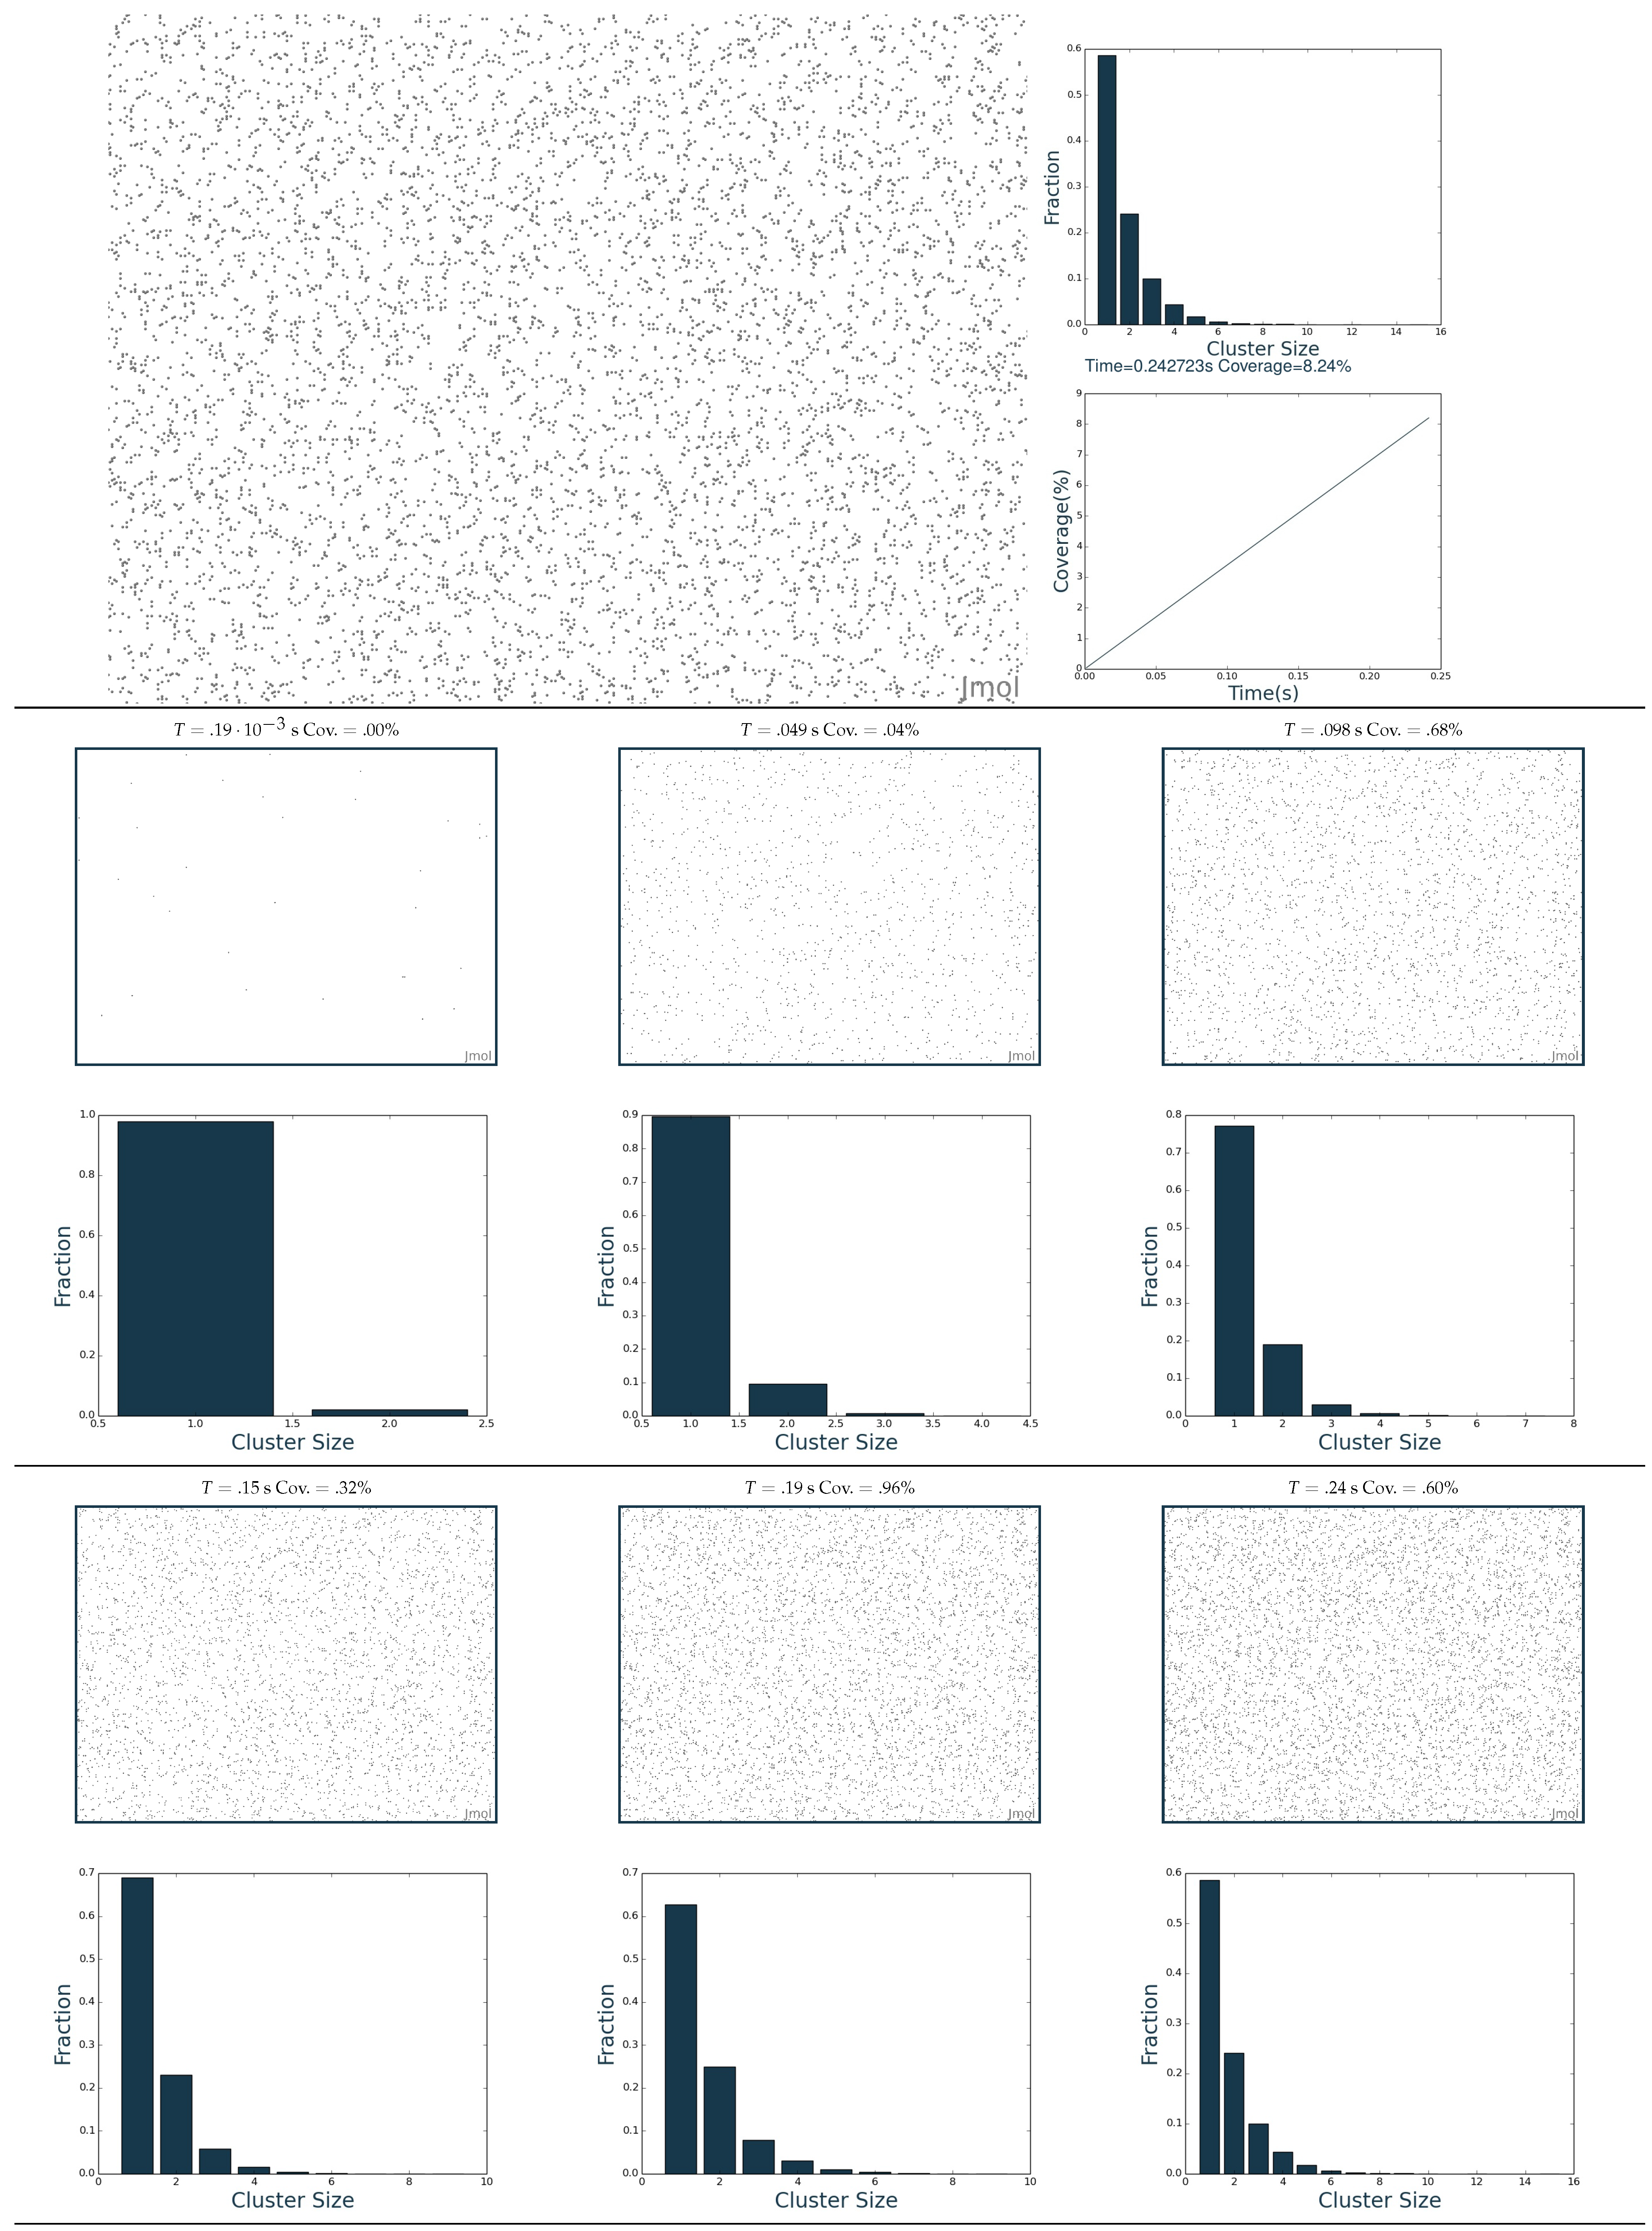
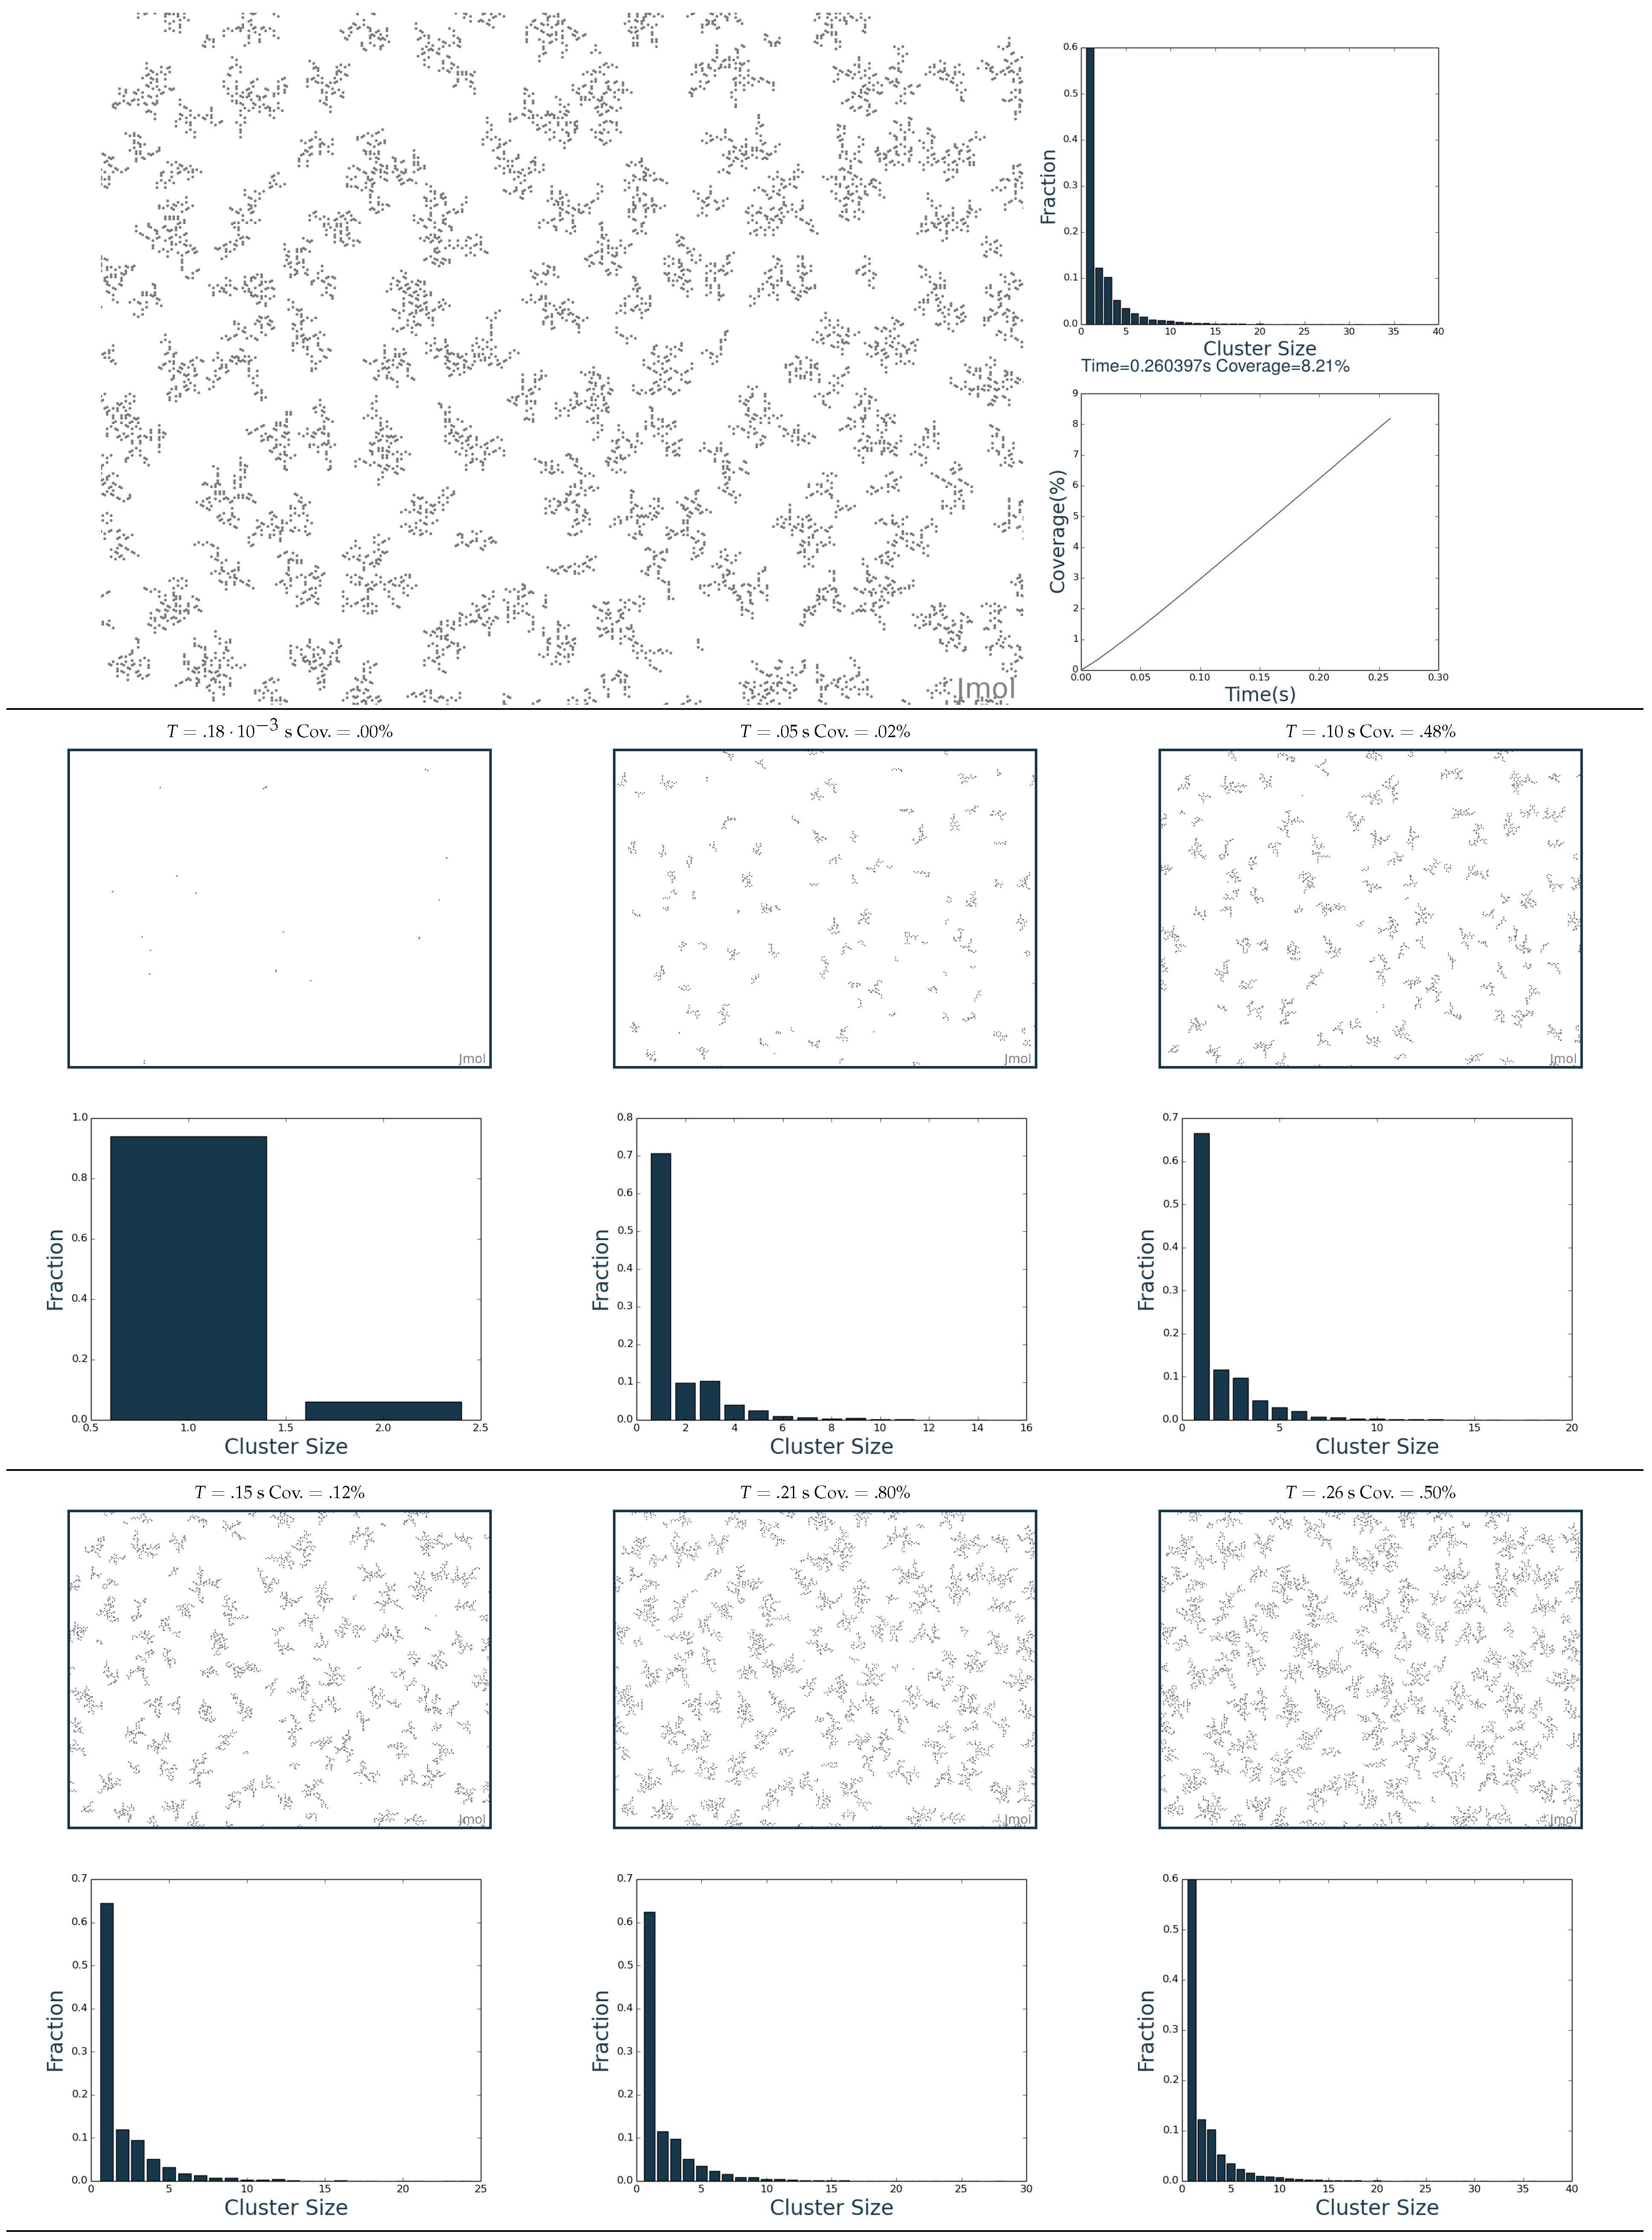
In order to obtain an immediate visual analysis of the simulation results, we summarize the time evolution of the system in Figure 7, Figure 8, Figure 9 and Figure 10. The larger image on the top left of each figure represents the state of the system at the final time of the simulation. The blue dots represent H adatoms on the sheet of graphene. The underlying lattice is not shown, and a blank layer is shown instead, as the size of the system is too big to clearly distinguish also the carbon atoms on the lattice. Close to the top left image, we also report a plot of the final cluster size distribution. Consistent with the interaction cutoff, two hydrogen adatoms are considered to be part of the same cluster if their relative distance is less than or equal to the third-nearest neighbor distance of the honeycomb lattice. In fact, beyond this distance, our model assumes two adatoms to be free. In the size distribution graphs, we plot the total number of clusters versus the size of each cluster. In the last figure on the top of the page, we also plot the hydrogen coverage as a function of the in time (right panel under the size distribution plot). For some cases, after a certain time (if the temperature is high enough), we expect that the simulations reach a stationary state, where the number of adsorption events is equal to the number of desorptions. Thus, we expect that coverage increases until it saturates to a limiting constant value. To represent the time evolution of the system, and in particular of the cluster size distribution, we also show different snapshots of the system taken at different times during the simulation along with their corresponding cluster size distribution.
In Figure 7, we show the results of a simulation at the temperature T = 300 K and flux Φ = 10 10 atoms · cm 2 · s 1 . For very small times, the few deposited adatoms are scattered on the graphene lattice randomly. At longer times, they start to pair up and form small clusters, first dimers and then bigger clusters. The topology of the obtained clusters is, also for a complete LKMC model (including desorption) of the hydrogenation, very different with respect to that obtained for the 2N model as we do not obtain chains of atoms, but 2D clusters with dendritic-like shapes. The cluster size distribution is monotonically decreasing with the cluster dimension, with a strongly relevant contribution related to the size = 1 , i.e., the free hydrogen adatoms. After some time, we can see that the cluster distribution reaches a steady state, although the coverage has not yet converged. At this time, the total number of clusters grows (see also the coverage versus time), but the normalized distribution in size remains constant within the statistical fluctuations. In this case, we see that coverage increases linearly with time without saturation in the simulated time scale (which exceeds substantially real deposition process time scales). In Figure 8, we show the results at a higher flux ( Φ = 10 15 atoms · cm 2 · s 1 ) and the same temperature T = 300 K of the one previously discussed (this simulation reaches a similar coverage in a strongly shorter time scale). In this case, we observe H adatoms randomly adsorbed on the graphene lattice with a limited tendency to form aggregation. This happens because adatoms do not have time to diffuse between two successive adsorption events, and the thermally-activated kinetics of H adatoms is hindered. As a consequence, the adatom distribution is dominated by the small cluster size due to the minimal action of the Ostwald-type ripening mechanism. In Figure 9, we run simulations with the same flux ( Φ = 10 15 atoms · cm 2 · s 1 ), but at the higher temperature T = 500 K. At this temperature, adatoms evolve under the action of a high thermal energy, and they diffuse on a time scale smaller than the one set by the time between two different adsorptions. In these conditions, we observe yet again the formation of large clusters and a similar cluster size distribution obtained at the room temperature and lower flux (see again Figure 7). Increasing the temperature to T = 600 K (again for a flux of Φ = 10 15 atoms · cm 2 · s 1 ), we obtain the results summarized in Figure 9. At this temperature, the desorption events break the clusters, resulting in a more spread-out space distribution of hydrogens. The coverage plot shows how after a certain time, within the statistical fluctuations, a limiting coverage is obtained. We also note that the clustering distribution reaches a stationary state (dominated by small clusters) well before the time scale needed for the coverage to reach its saturation level.
We conclude this analysis discussing the simulated global properties (i.e., the H coverage) of the system as a function of the deposition parameters. We collected data for different stationary states of ∼1000 replicas of simulated evolution and investigated the coverage dependence on hydrogen atomic flux and temperature.
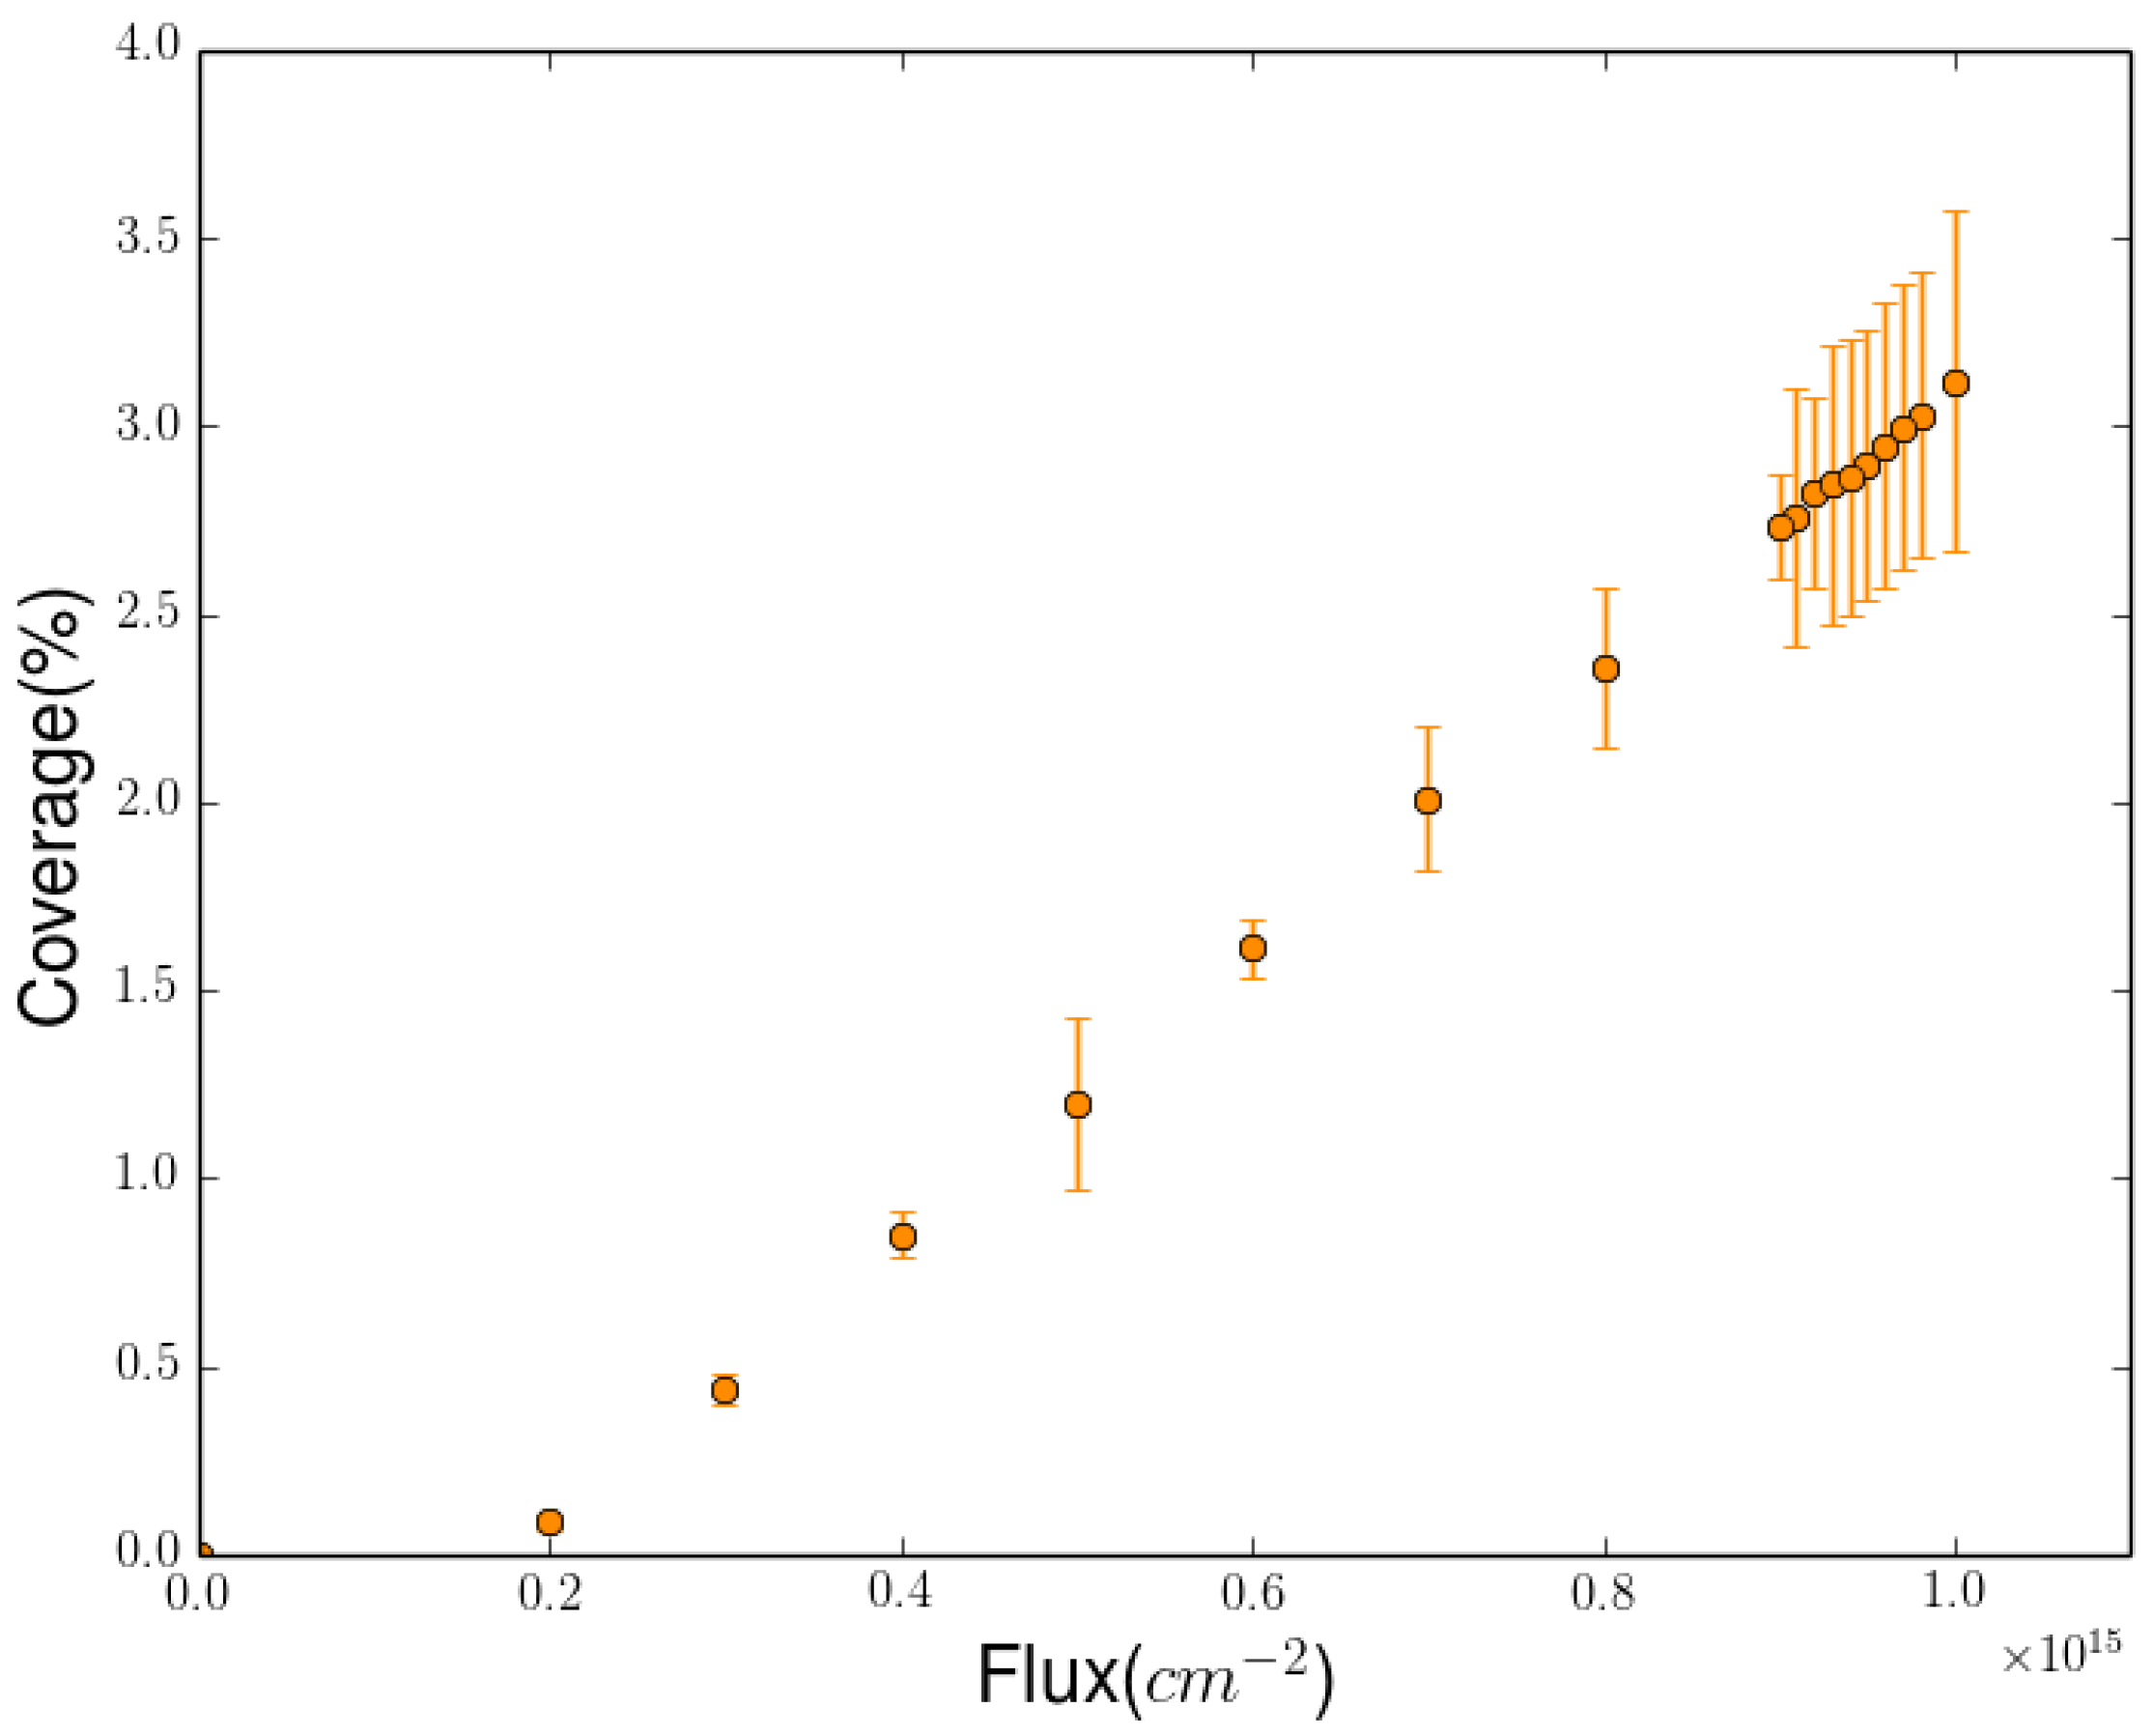
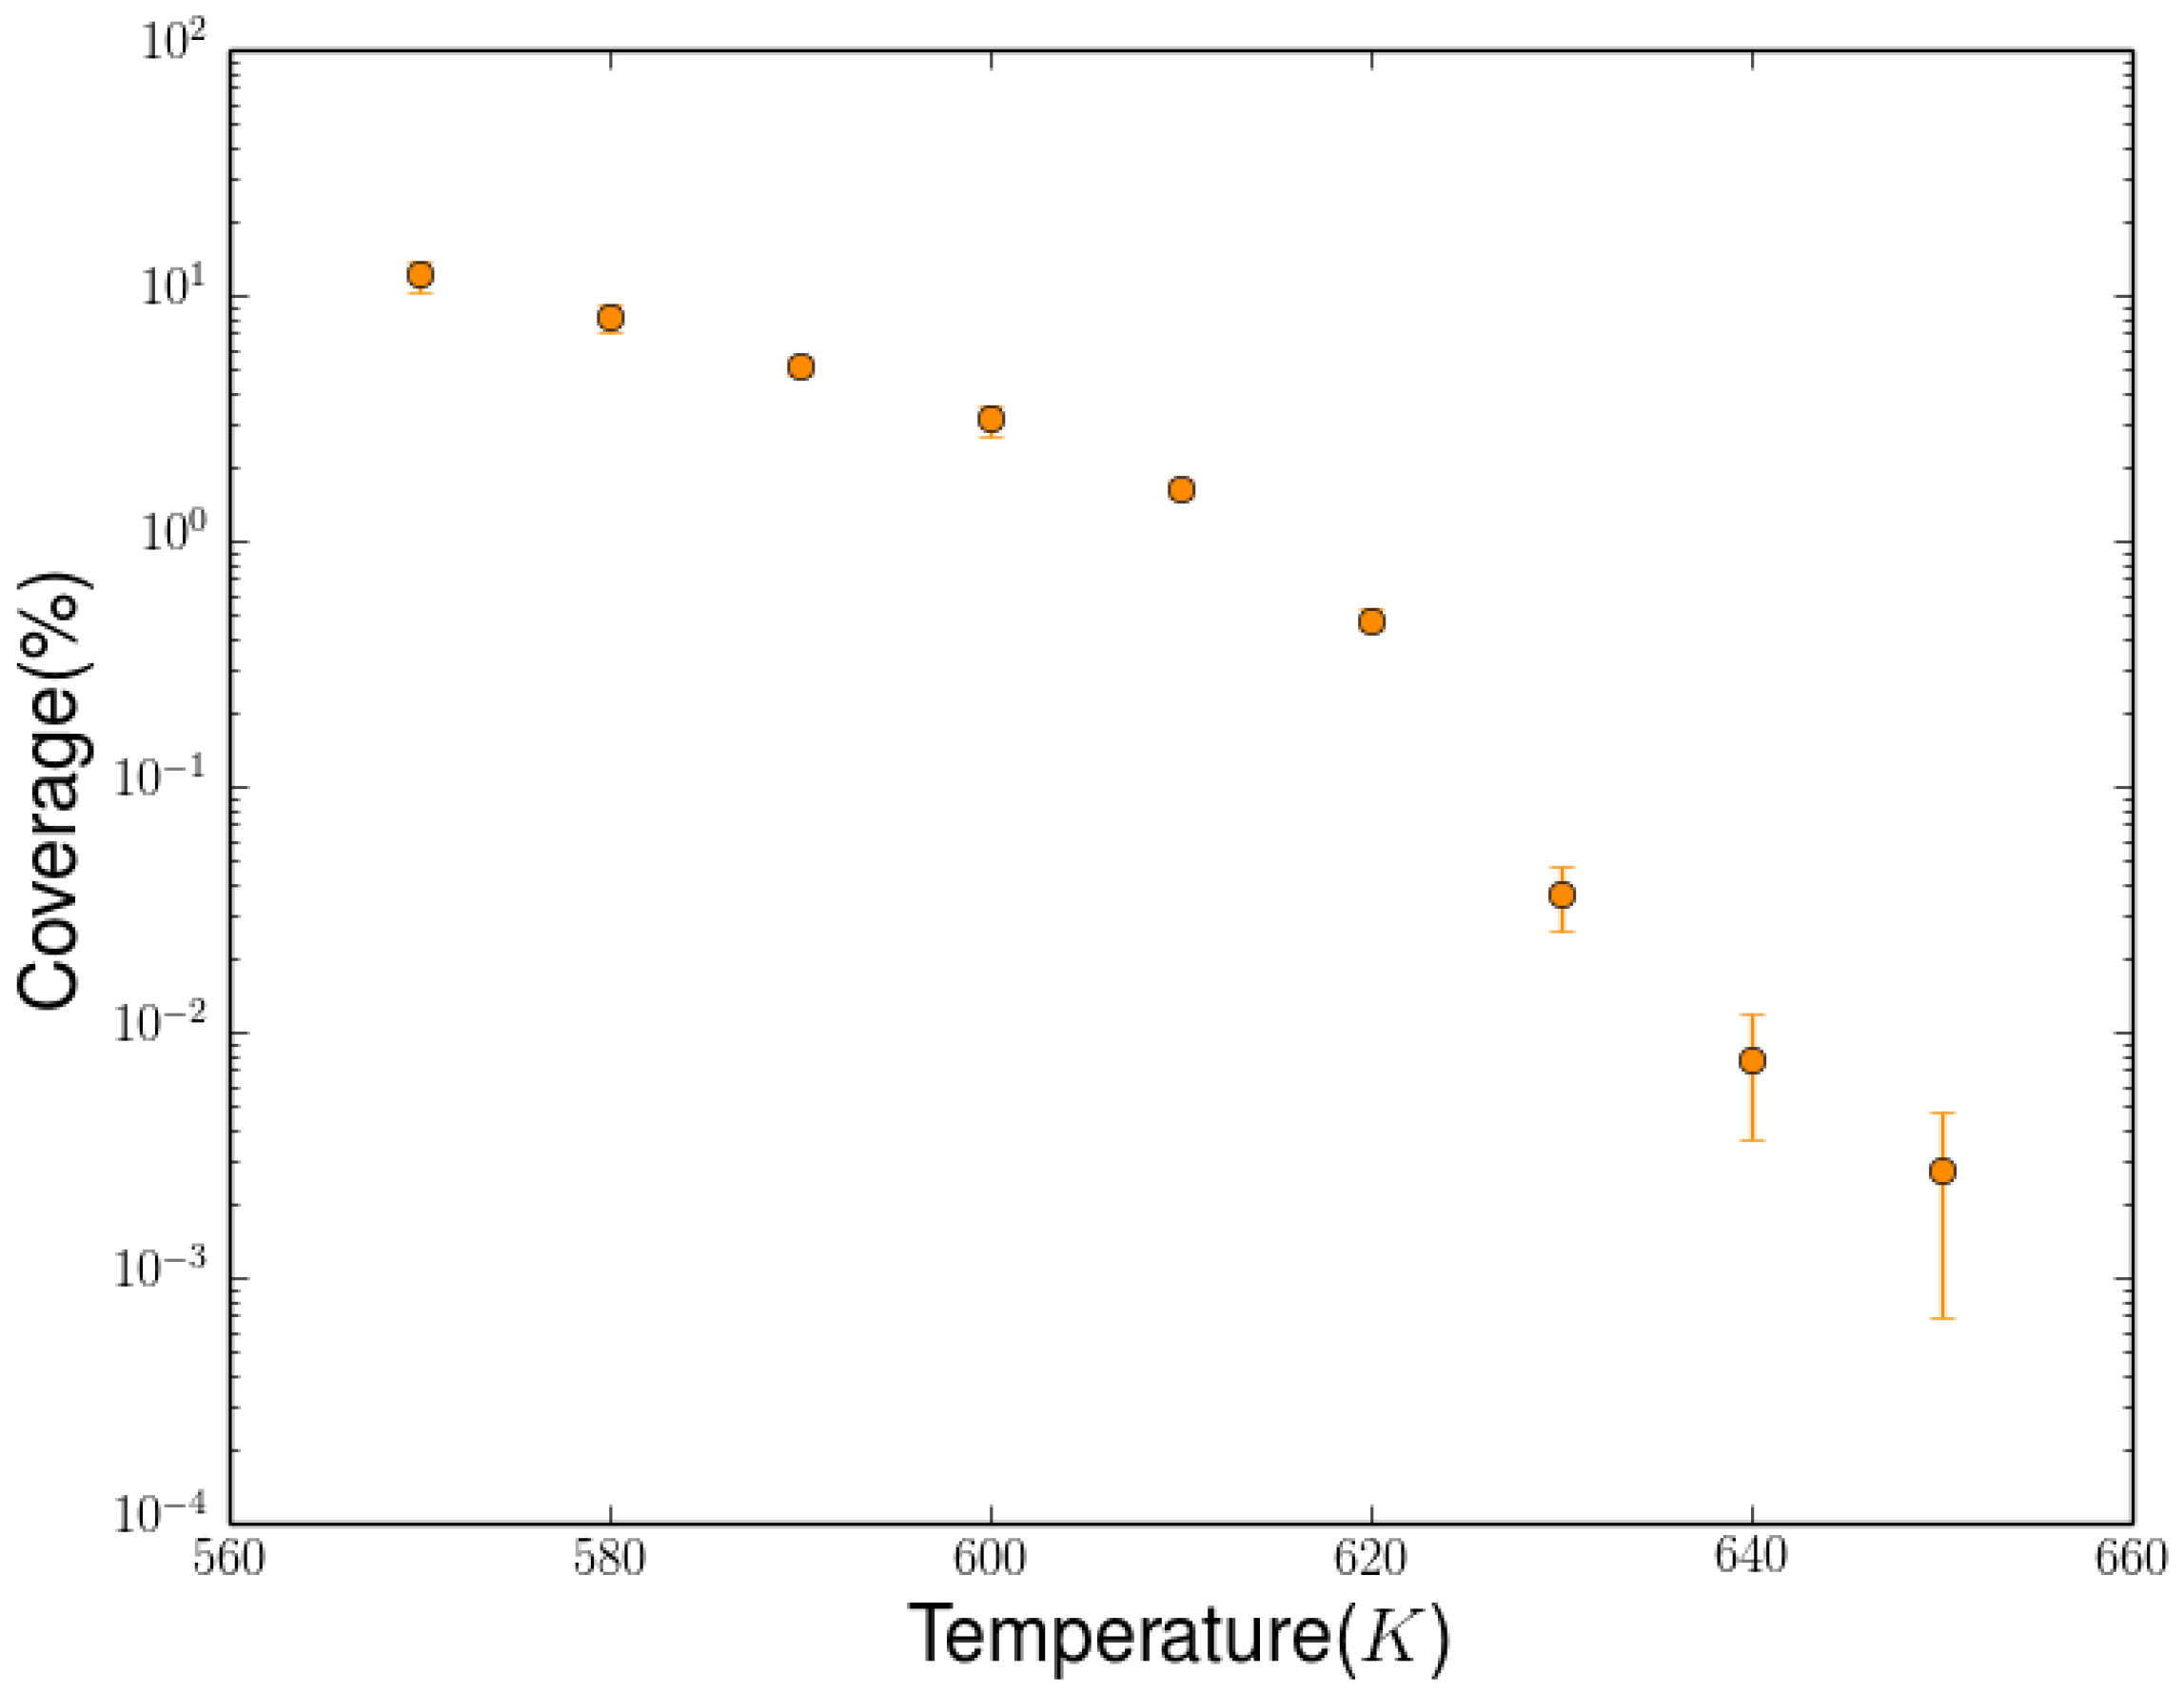
In Figure 11, we show the coverage of the steady state at fixed temperature T = 600 K as a function of the external effective flux of hydrogen adatoms. We see that the coverage increases linearly with the external flux. The error bars represent the uncertainty on the steady state coverage due to statistical fluctuations. In Figure 12, we fix the external flux instead and plot the steady-state coverage as a function of the temperature, revealing how strong the coverage’s temperature dependence is.

2.4. Quantum Conductance of Hydrogenated Graphene

The simulations of the hydrogenation processes predict final system configurations with a particular space distribution of the H adatoms. In this section, we discuss the conductance properties, in the quantum coherent limit, of virtual resistors made with these systems. Thus, the predictions of the LKMC process simulator are directly linked to the predictions of the electronic properties of the HG systems. We note that quantum transport in disordered, including hydrogenated, graphene has been the subject of thorough theoretical analysis (see, e.g., [27,28,29,30,31,32,33,34,35]). However, the impact of the H configurations, as they would emerge from the fabrication processes, on the transport features of the H-G samples has been a less studied topic. In this context, our contribution aims at demonstrating that any accurate analysis of transport in H-G systems could be barely useful if the system configurations are simply guessed by speculation. Of course, the accuracy of a full analysis of transport depends on the chain of process simulation and transport calculation, and the correlation between the two coupled method justifies our effort to assess further the relevance of LKMC models.
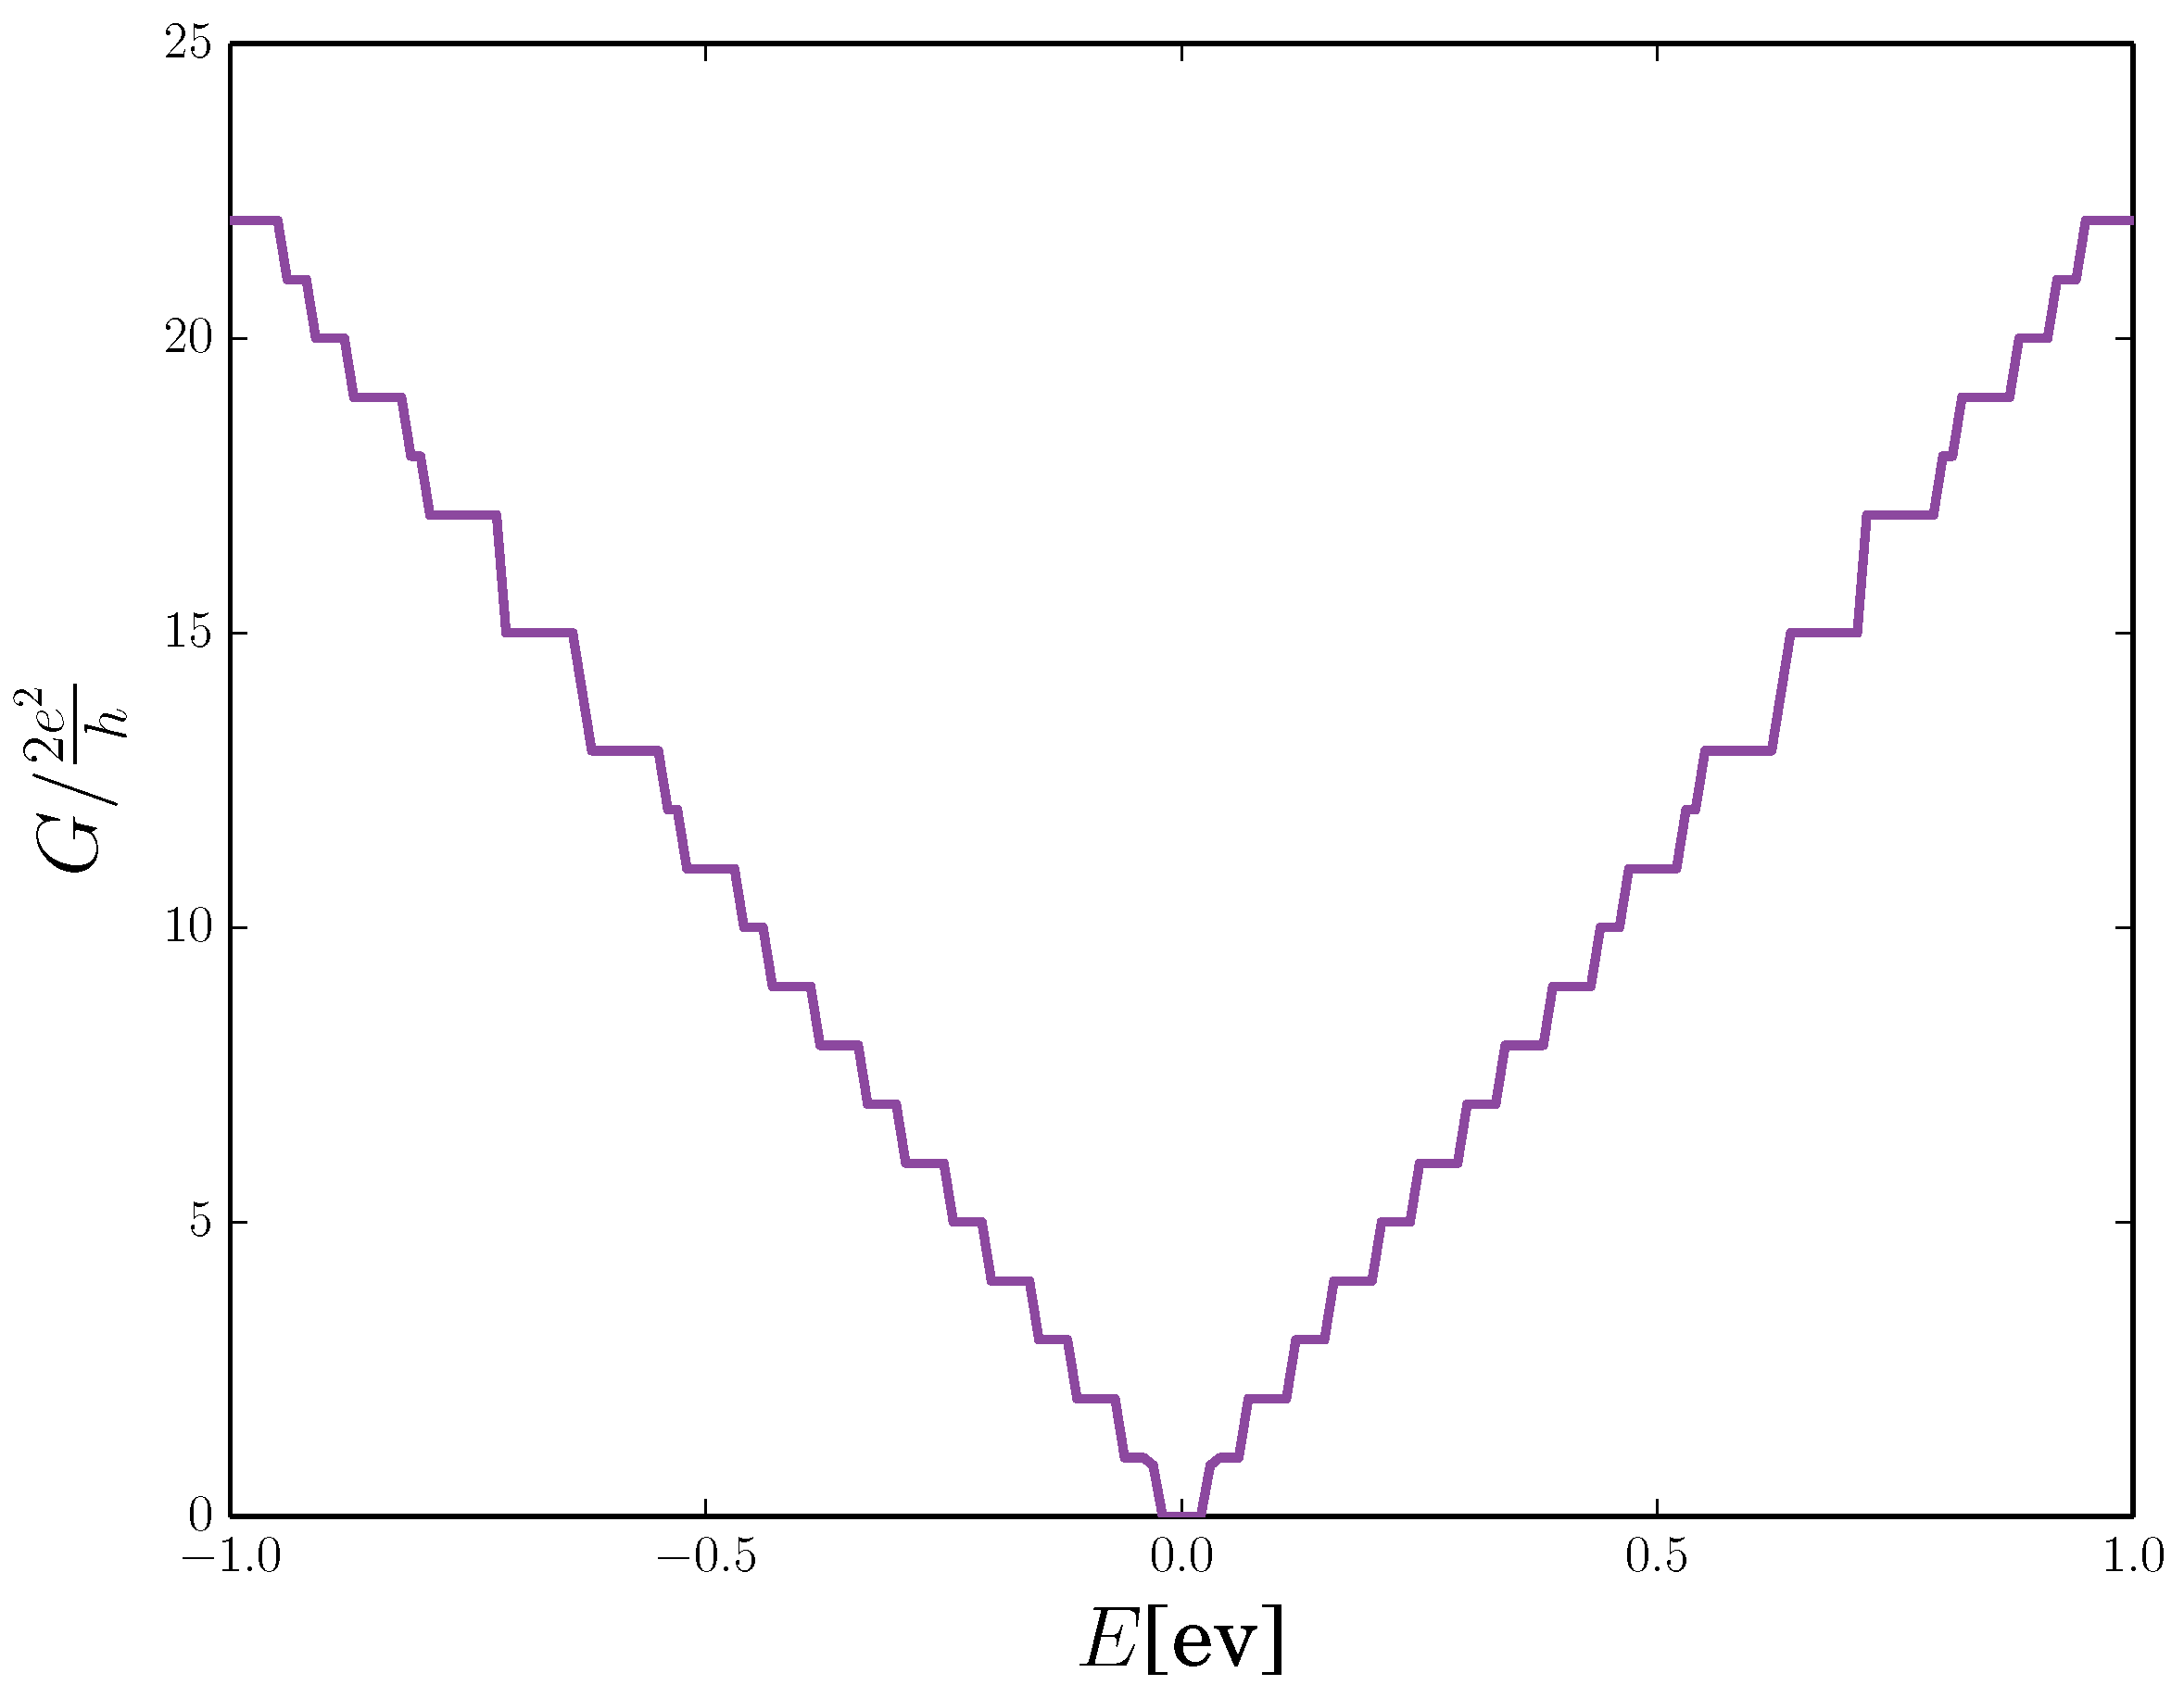
The quantum conductance calculations are performed within the NEGF scheme [38] presented in Section 4, where the electronic structure of the pristine graphene systems (large armchair ribbon) is modeled with the tight-binding Hamiltonian, Equation (10), which is a reliable approximation of the full electron Hamiltonian for transport calculation at energies close to the Dirac point. In the pristine graphene ribbon-like resistors, we obtain the quantized conductance (cf. Figure 13 and Figure 14, purple line) as a consequence of the quasi 1D character of this system. However, the size of the ribbon considered in this study (∼40 nm in width) is large enough to obtain conductance step widths of a few tens of meV and an effective V-shaped conductance (i.e., similar to two-dimensional graphene) in the eV range (see Figure 13).
In order to consider the presence of hydrogen adatoms on the device, we set to zero all hopping integrals of the tight-binding Hamiltonian from or to carbon atoms bonded to an H-adatom (see again Section 4). In this sense, adsorption of an H adatom is very similar, in terms of transport and electronic properties, to the introduction of an ideal vacancy within the tight-binding approximation. This approach is well-consolidated in the literature [3,40] and is justified by the change induced by the hydrogen bonding to the hybridization of the underling carbon atom (from s p 2 to s p 3 ), which cancels a delocalized p z orbital. Thus, all valence electrons of the carbon atoms are involved in the formation of atomic bonds and are localized around the atom, marginally contributing to the transport properties. We can use this modified tight-binding Hamiltonian to model hydrogenated graphene, with an arbitrary distribution of the hydrogen adatoms and link the transport calculation to the process simulation.
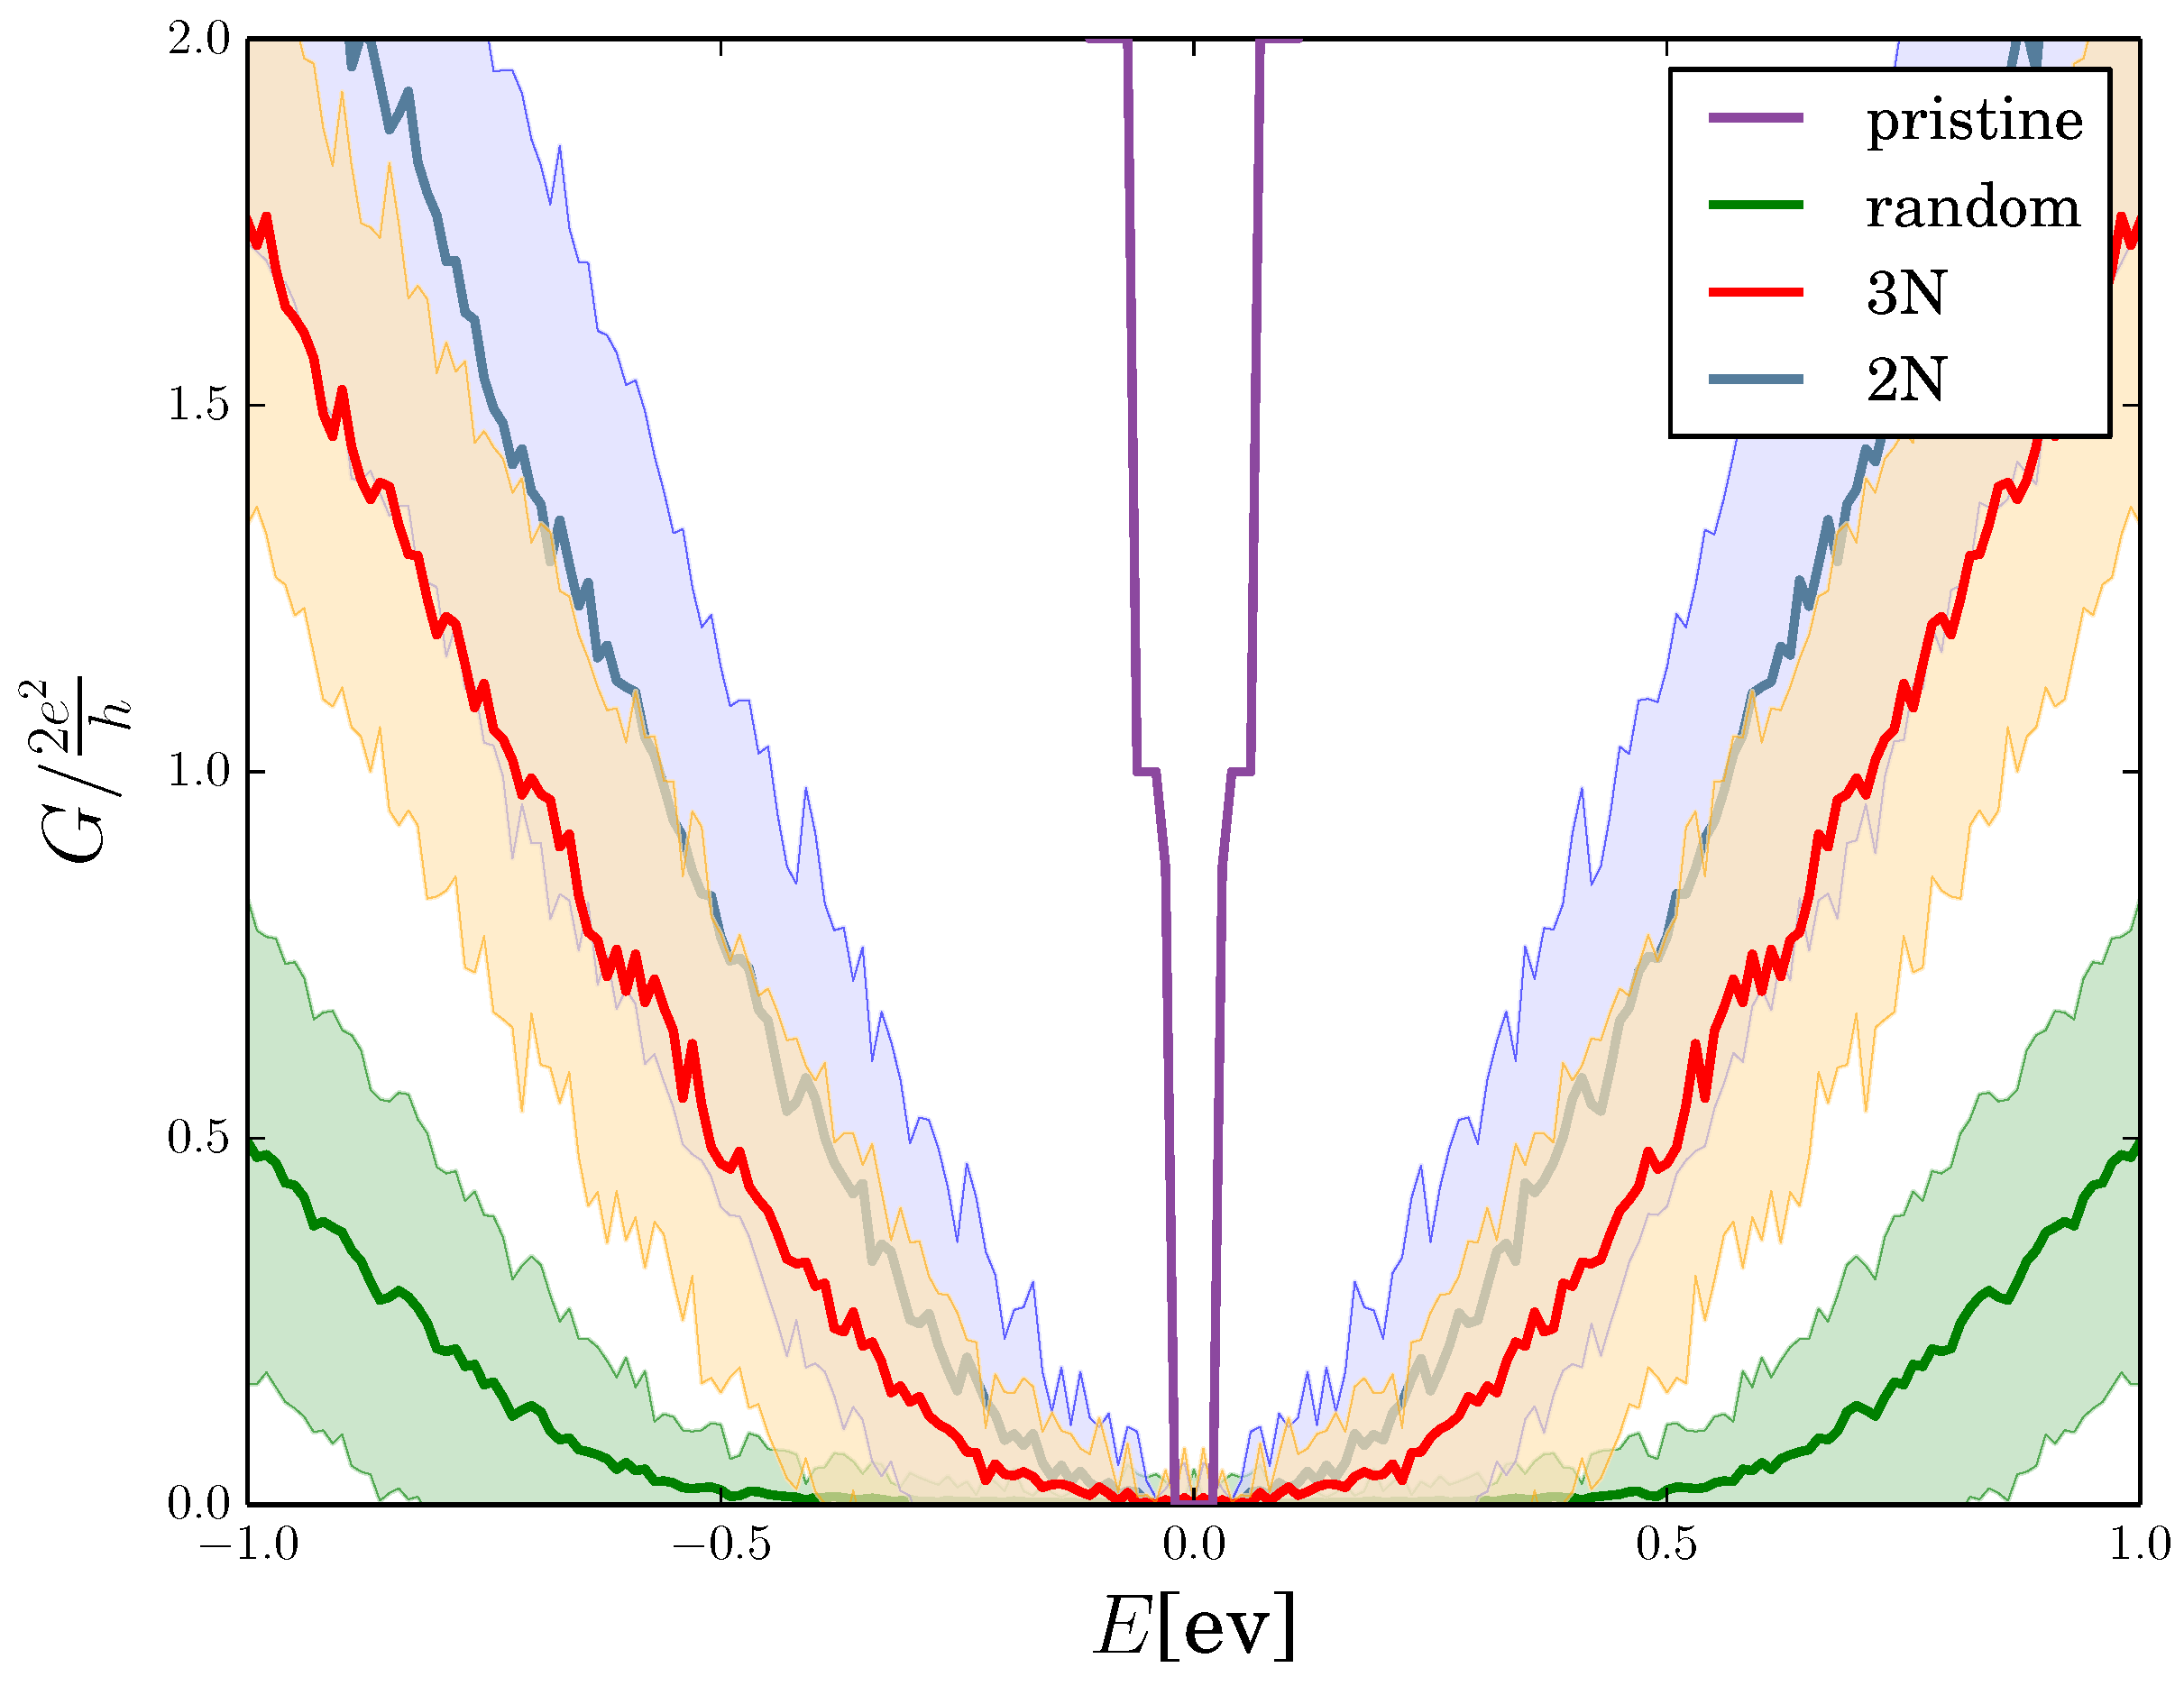
We now discuss the implemented procedure. Firstly, the system was made to evolve using the LKMC algorithm previously described, until a 3 % coverage of H adatoms was achieved. The size of the LKMC graphene lattice simulated was very big, and its quantum transport properties cannot directly be investigated as it would require too much computational time. Instead, we cut ribbons with size l = 52 nm, w = 40 nm from the simulation cell, a size chosen to be large enough to contain the organized structures we obtained, i.e., such that several different clusters are present in one ribbon. Then, the ribbons were used as an input for the quantum transport code, which yielded the conductance as a function of the energy. We note here that optimized numerical techniques [45] have been implemented in the computational code in order to account for the extended system dimensions (81,000 atoms within each graphene nanoribbon). Of course, as the LKMC algorithm evolves the system stochastically, different runs, with different pseudorandom values, will yield different configurations. To obtain meaningful results, we need to average on different configurations, obtained with different sets of pseudorandom numbers. In Figure 14, we show quantum transport computations for a fixed temperature T = 300 K and a fixed external flux Φ = 10 9 atoms · cm 2 · s 1 , comparing the structures obtained using the 3N model, the 2N model and with a random distribution of hydrogen adatoms. For all models, the solid line represents the mean conductance, while the surrounding shaded region indicates the fluctuations of the conductance evaluated in terms of the mean quadratic deviation of the energy-dependent conductance distribution [46]. The mean conductance for the 3N model (red line) is parabola-shaped and is not quantized any more, as this purely quantum effect is induced by the presence of disorder. We can also observe large fluctuations (shaded orange area), typical of the weak localization regime. The 2N model predicts a similar conductance (blue line), with a slightly higher mean and whose statistical distribution strongly overlaps with the statistical distribution predicted by the 3N model. The conductance due to a random distribution of hydrogen adatoms (green) is instead significantly smaller. This can be intuitively explained by the fact that hydrogen adatoms act as obstacles for the electrons flowing through the device. When adatoms self-organize to form ordered structures, they leave paths free of adatoms. Along these paths, electrons can propagate freely, without being scattered by hydrogen adatoms. In all cases, the conductance is much smaller than the one of pristine graphene (purple).
One word of caution should be added concerning possible finite temperature effects on coherent scattering. In the present analysis, we have neglected phonon scattering, which might be responsible for coherence loss of charge conduction at high temperatures. However, phonon scattering in graphene is strongly suppressed due to the selection rules imposed by its specific band structure. Moreover, impurity scattering is expected to have a larger influence on carrier transport in low dimensional systems than in conventional 3D conductors (see, e.g., [47]). Therefore, we expect that impurity scattering dominates over phonon scattering in graphene, at least at the relatively high concentration of H adatoms considered here.

3. Discussion

In this research, we have used an MC-NEGF multiscale approach to study the dynamics and quantum transport properties of hydrogen adatoms on graphene, DFT-calibrated lattice kinetic Monte Carlo simulations and the non-equilibrium Green’s function formalism. First, we have mapped DFT studies of hydrogenated graphene on the effective H–H interaction model on a G lattice. This effective interaction is due to the change of the local bonding network from s p 2 to s p 3 , causing a relaxation of the underlying graphene lattice. This relaxation creates effective bonds between neighboring hydrogen adatoms, affecting the migration and desorption properties of the adatoms. We use the conventional and generalized Ising-like bound-counting model demonstrating that a good fit between DFT energetics and the lattice model can only be obtained by considering at least up to third-neighbor interactions. We have then used DFT calibrated lattice kinetic Monte Carlo to study the dynamics of the hydrogen adatoms. Comparisons between simulation results obtained with different lattice model demonstrate that neglecting third-neighbor interactions leads to the formation of long chains of adatoms, incompatible with experimental observations. Including third-neighbor interactions, we instead see the formation of clusters of hydrogen adatoms. Finally, we study the effect of this aggregation on the quantum transport properties and show that aggregation leads to a higher conductance, when compared with hydrogen adatoms randomly adsorbed on the graphene lattice, as aggregation leaves free paths for the electrons to flow through. We believe that this fully-atomistic approach to the mass and electron transport should be the reference methodology for developing predictive simulations in emerging nanotechnology fields based on low dimensional materials.

4. Methods

Results of this paper are obtained by coupling kinetic simulations of the interaction between H fluxes and a graphene layer and quantum electron transport calculations. The two methods are implemented with in-house-developed tools, which will be described in the following subsections.

4.1. Lattice Kinetic Monte Carlo

The lattice kinetic Monte Carlo method we have implemented assumes that an activated kinetics approximates reliably the system evolution using lattices [41] or superlattices [48,49] for mapping atomic configurations and energetics. This assumption is consistent with the presence of multiple time scales (e.g., vibration and diffusive motion) in the evolution, which makes unfeasible and redundant the direct integration of the Newton equation of motion for the system’s constituents. Within a different context, kinetic Monte Carlo has proven useful to simulate the plasma etching of a solid substrate, i.e., the erosion of a crystalline surface by means of hot plasma constituents (both neutral and ionic), as it is capable of describing an evolving crystal structure at the atomic level with sufficient accuracy and over long time scales [50].
Without lack of generality, let us consider the problem of an adatom diffusing on a lattice. After a certain number of vibrations, we may assume that a quasi-equilibrium state is reached and the probability distribution to jump to a neighboring lattice position does not change in time, until the jump occurs. Once a diffusion event is triggered, the time needed for the atom to move from a lattice position to another is very short compared to the diffusion time scale. As such, a jumping event can effectively be considered instantaneous and rare. The same reasoning can by applied for a general instantaneous and rare event E i . Transition state theory (TST) demonstrates that the average rate ν i of occurrence for such an event has the form:
ν i = ν 0 , i e Δ E i / k B T ,
where ν 0 , i is a frequency prefactor, of the order of the vibration frequency (or more generally, the attempt frequency) of the atom, k B is Boltzmann’s constant, T is the temperature and Δ E i is the energy barrier.
A challenging issue for LKMC is finding optimal values for these parameters. Indeed, we have discussed in Section 2 how critical the choice of the activation energy may be. The frequency prefactor is less critical, but its choice can affect the global time scale of the simulation. A rough estimate may be derived assuming an average vibration energy of the order of the thermal energy Δ E k B T , and from the energy uncertainty principle, Δ E Δ t 0 , i , we have ν 0 , i k B T . However, ν 0 , i could be estimated using molecular dynamics simulations both with semiclassical and quantum schemes, and this is the strategy we have followed [51].
The time distribution for any event to occur is obtained from the total rate ν = i ν i , and it takes the form of a Poisson distribution, which allows one to compute the time between two successive events from the stochastic equation:
δ t = 1 ν ln ( r ) ,
where r is a random number generated between zero and one. The rejection-free LKMC algorithm is schematized in Figure 15. First, we need to compute all the rates ν i of the system and the time at which the next event will occur from Equation (5). Then, we select which event will happen from its conditional probabilities { ν i } . This selection is facilitated by the lattice formulation allowing the regrouping of events in classes, where each class c encloses n c events with the same rate ν c . The size of the set { ν c } is usually much smaller than the total number of particles. Thus, we may perform a sequential sampling to select a class c; then, as all events within a class have the same probability to occur, we can randomly select an event within the class, with uniform probability. Finally, the event is then made to occur, i.e., the configuration of the system is changed accordingly, and the whole procedure is iterated until a certain limiting time is reached.

4.2. Lattice Kinetic Monte Carlo Events

To complete the LKMC formulation, we need to fix all the possible events and how their relative rates depend on the energetics. We assume that the atomic flux of H interacts with the surface (the eventual dissociation of the H 2 molecule depends on the deposition machine operative modality). As a consequence, we consider that particles are adsorbed at fixed clock interval times t D ruled by the external effective flux:
t D = 1 Φ S ,
where S is the surface area of the simulation box. When an adsorption event is triggered, the H-atom is made to adsorb on a G lattice position chosen with uniform probability.
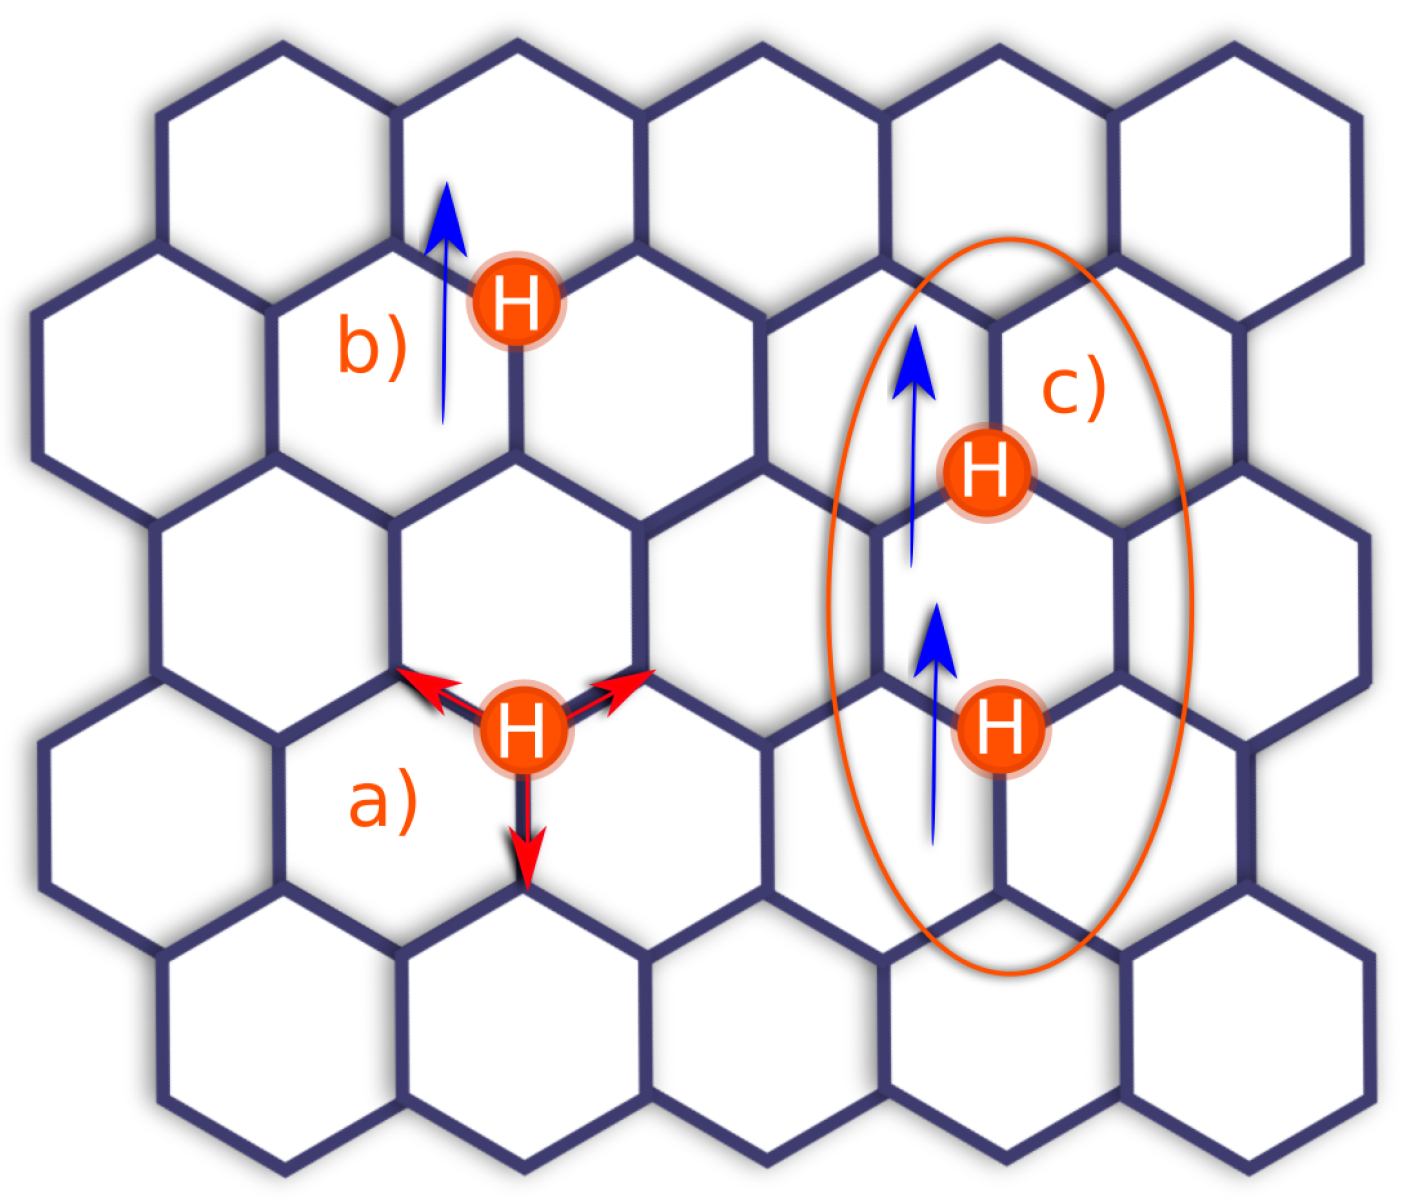
We model H diffusion through hopping to first-neighbor lattice positions with equal probability, given the honeycomb lattice symmetry, while the rate is given by the Boltzmann factor (see Equation (4) in Section 4). The prefactor and energy barrier for migration of single H adatoms were extrapolated from [51], yielding a prefactor ν M = 10 6 and a barrier to migration of E M = 0.6 eV. When more than one H adatom is present on the lattice, we need to take into account H–H interactions in the diffusion event. Thus, adatoms see an additional energy barrier, and the total energy barrier is given by E hop = E M + E b ; the sum of E b is the binding energy and E M , the energy barrier as seen by a free adatom, independent of the local configuration. While E b only depends on the initial configuration of hydrogen adatoms on the lattice, E M is a constant, independent of neighboring H adatoms.
The value of E M = 0.6 eV for the migration barrier is a parameter for the LKMC and might of course be changed. The value assumed here has been estimated from the calculations of [51], where path-integral molecular dynamics simulations were applied to the study of H diffusion in G at finite temperatures 200–1500 K. Such a question was also addressed by [22], where values in excess of 1.0 eV were obtained, but at T = 0 and for a single diffusion path. The model of [22] is similar to a 1N attractive Ising model and would therefore account for the H–H cluster energetics at a more basic level, possibly leading to an overstability of compact H clusters, in disagreement with several DFT results.
Finally, we also consider desorption, again with a rate of the form of Equation (4), with the same prefactor of H migration and with a different energy barrier. For the 2N model, the system was studied in the absence of desorption (infinite energy barrier). The inclusion of 3N interactions allows one to consider not only atomic desorption, but also associative desorption for H dimers, i.e., the desorption of two H adatoms from the graphene lattice, forming a molecule of H 2 . As nudged elastic band (NEB) simulations show that for clusters of more than one adatom, the most likely route to desorption is associative desorption [52] through embedded para dimers, we set the atomic desorption barrier for adatoms with no H neighbors in a radius equal to the third-neighbor lattice distance to 1 eV, while for other configurations, we set a high barrier of 3 eV to desorption, as for these configurations, migration or associative desorption is more likely to occur. Finally, we allow the possibility of desorption through para dimers embedded in clusters with a barrier of 1.4 eV, i.e., for all configurations where third-nearest neighbors are present (see Table 1 and Figure 16).

Configuration Redundancy

We have seen in Section 2 that the H–H meta configurations are highly unstable, with a very low associated event barrier, compared to the more stable ortho and para dimers. This introduces two time scales, one for the diffusion of unstable clusters and another for more stable clusters. It is well known that in LKMC simulations, the presence of multiple energy scales can lead the system to repetitively iterate between some sets of unstable configurations, wasting computer time. We do in fact run into redundant kinetics, which become more and more severe as the coverage increases. In the 2N model, this problem limits the accessible H-coverage to ≈30%, while in the 3N model, the problem is more severe and even a few percent coverage is difficult to reach. In the latter model, we mitigate the problem by using absorbing Markov chain (AMC) theory (for details, see Appendix B).

4.3. Non-Equilibrium Green’s Function

We use the Landauer–Büttiker formalism coupled to the NEGF to compute the quantum transport properties [38]. The conductance G, defined as the inverse of the resistance, is proportional to the transmission T.
G = 2 e 2 h T .
The transmission can be calculated through the formula:
T = Tr { Γ L G Γ R G } ,
with:
Γ L ( R ) = i Σ L ( R ) Σ L ( R ) ,
Σ L ( R ) = τ L ( R ) g L ( R ) τ L ( R ) ,
G = E H Σ L Σ R 1 ,
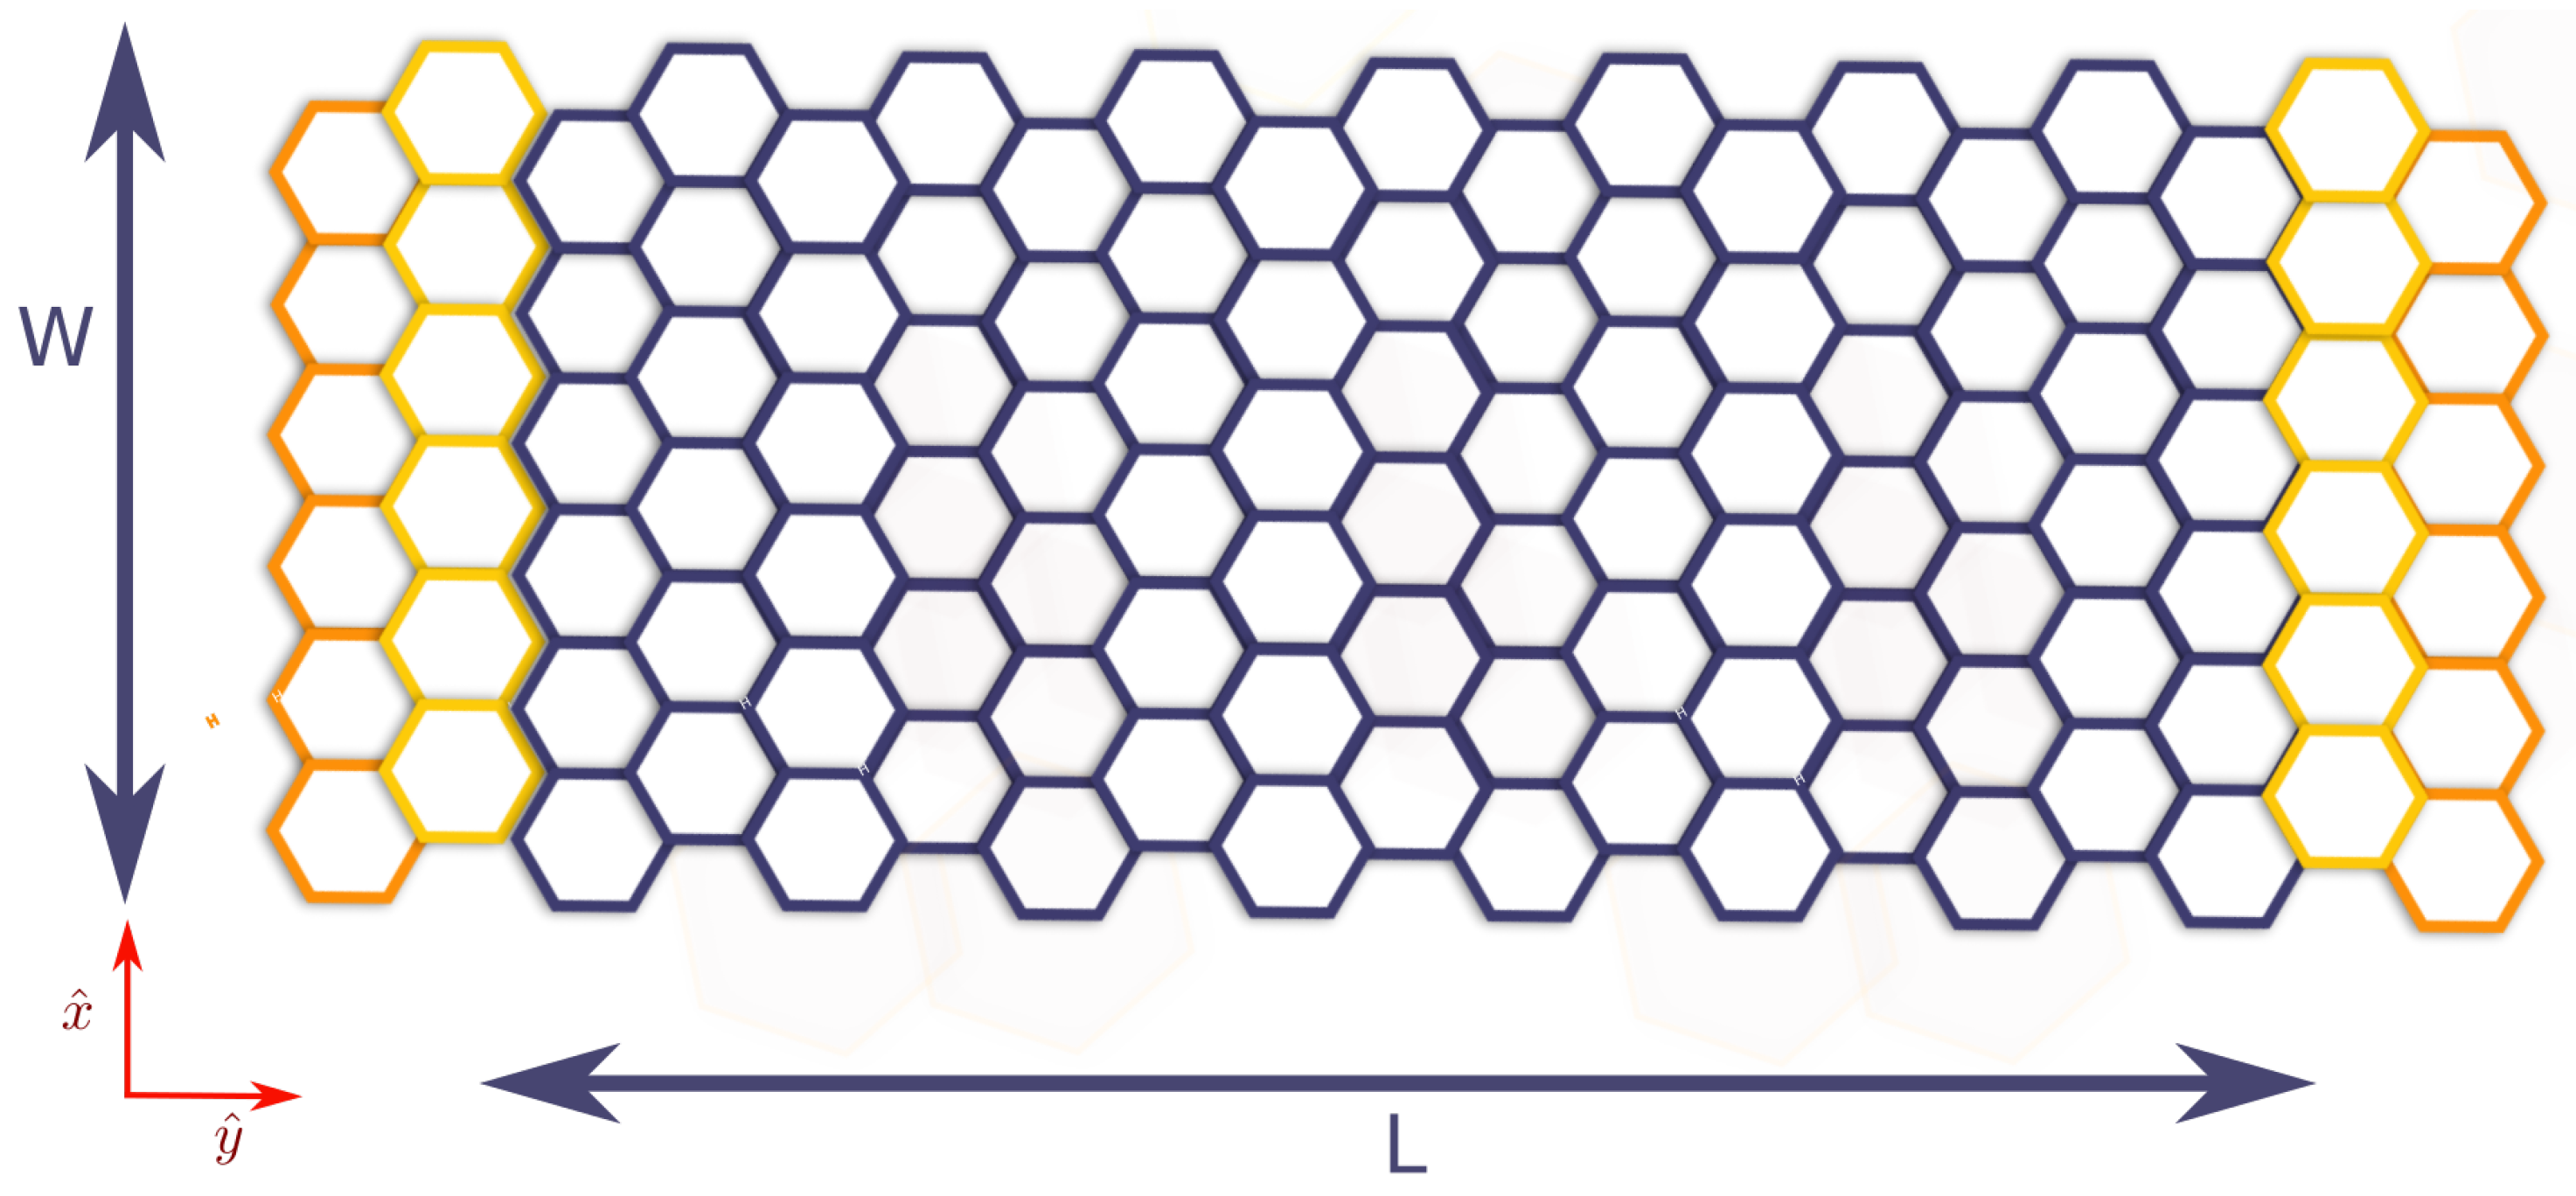
where τ L ( R ) is the part of the Hamiltonian describing the interactions between the left (right) contact and the device and g L ( R ) is the Green’s function of the left (right) contact, also called surface Green’s function (cf. Figure 17). G is the Green’s function of the system, describing the propagation of a particle in time, which depends on the interactions between the device and the contacts. The effects of these interactions are all included in the self-energy Σ = Σ L + Σ R , where the contribution from the left and right electrodes, indicated as Σ L and Σ R , respectively, can be computed once the surface Green’s function is known. Because of the interactions between the contact and the device, the particle energy levels on the left contact broaden and acquire a finite lifetime. Thus, the electrons decay from the energy levels of the left contact and fall in the device at a rate given by Γ L . Then, the propagation of the electron through the device is described by the Green’s function G. The same process occurs at the right electrode, but electrons now propagate in the opposite direction, from right to left, and thus are described by G .
In order to compute the Green’s function G and the surface Green’s function g L ( R ) , we need to choose a model Hamiltonian. In the case of pristine graphene, we choose to use the tight-binding model of graphene for the device. The Hamiltonian thus becomes:
H = t i , j a i a j + h . c . + 2 ϵ 0 i a i a i ,
where a i ( a i ) is the creation (annihilation) operator for an electron on lattice site i, t = 0.6 eV is the hopping parameter and ϵ 0 the on-site energy, and only nearest-neighbor hopping is retained. We also assume, for the sake of simplicity, ideal contacts, i.e., we suppose the contact to be made of the same material of the device prior to hydrogenation. We can use this Hamiltonian to compute the surface Green’s function of the system, which in turn allows one to compute the Green’s function of the device and hence the transmission. We consider a device with a rectangular shape, with width W along the x ^ direction, and length L along the y ^ direction. We also assume that y ^ is the direction of the quantum transport. The computation of the Green’s function G requires the inversion of a matrix of dimension N x × N y , where N W ( L ) are the number of sites in the x ^ ( y ^ ) direction. Standard matrix inversion requires O ( N x × N y ) 3 operations. However, a careful implementation of the algorithm allows us to avoid the inversion of the whole matrix and reduces our problem to inversion of smaller square sub-matrices of dimension N x [45]. This technique improves the efficiency of the algorithm, yielding a more advantageous scaling O ( L W 3 ) , linear in the length of the device and cubic on its width.

Author Contributions

A.L.M.and I.D. conceived of and designed the simulations. L.P., I.D. and A.L.M. performed the simulations. All authors analyzed the results. G.G.N.A., A.L.M. and I.D. supervised the work, which was submitted as a final MSc project by L.P. in partial fulfillment of the requirements for obtaining an MSc in Physics from the University of Catania.L.P., A.L.M., I.D. and G.G.N.A. wrote the paper.

Conflicts of Interest

The authors declare no conflict of interest.

Abbreviations

The following labbreviations are used in this manuscript:
2Nnext-nearest-neighbor (interactions)
3Nthird-nearest-neighbor (interactions)
AMCabsorbing Markov chain
DFTdensity functional theory
Ggraphene
HGhydrogenated graphene
LKMClattice kinetic Monte Carlo
MCMonte Carlo
NEBnudged elastic band
NEGFnon-equilibrium Green’s function
QEDquantum electrodynamics
QTquantum technology
TSTtransition state theory

Appendix A. Genetic Algorithms for the LKMC Calibration
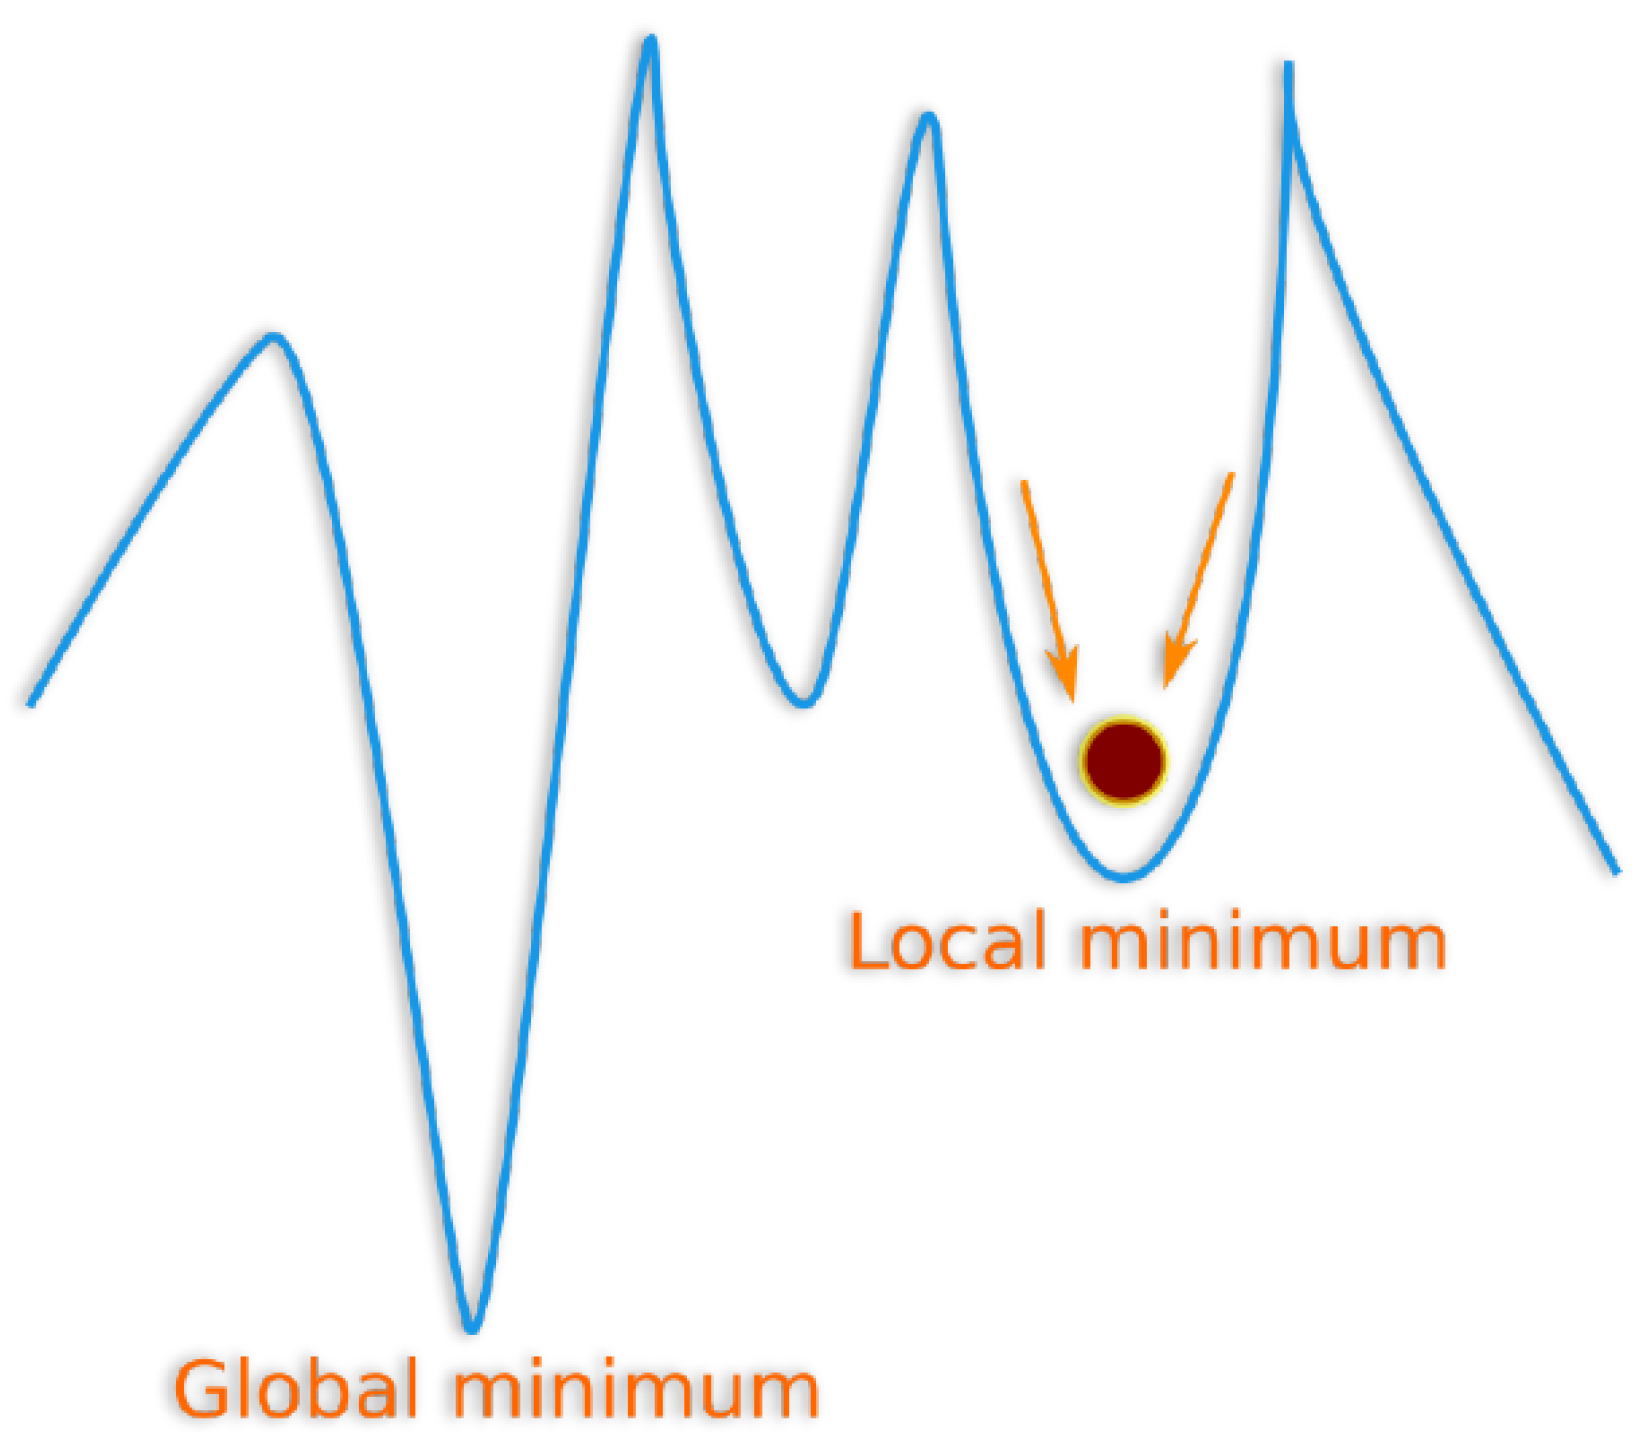
Let us discuss the problem of finding the optimal values of the coefficients of some LKMC model to reproduce available data from DFT calculations. We can now define a function, usually called a cost function, which maps possible solutions to a real positive value. The closer the trial solution is to the ideal solution, the smaller the value the cost function assumes. Ideally, we would like the cost function to assume the value of zero, but this may possibly not be always the case. In general, the global minimum will yield the optimal solution, the solution closer to the ideal one. In our case we can choose as a cost function χ 2 = i ( E DFT ( i ) E T ( i ) ) , the squared sum of the differences between the energy predicted by the model and the energy predicted by DFT calculations for a given configuration. The ideal solution would yield exact agreement between the model and DFT calculations. Of course, as the model is just an approximation, we do not expect that an ideal solution, i.e., a set of coefficients yielding χ 2 = 0 exists, and we have to settle for finding coefficients that minimize χ 2 , i.e., we need to find the optimal solution. Thus, the problem of searching an optimal solution through a huge number of combinations can be recast as a minimization problem (Figure A1). Many conventional algorithms exist to find the minimum of a given function. One of the most widely used is the down-hill algorithm. Starting from some initial solution, it samples neighboring solutions, and moves to a solution with a lower cost. From there, the algorithm repeats the same step, each time finding the minimum between neighboring solutions until no solution with a lower cost is found. This algorithm may be trapped in a local minimum, where all neighboring solutions have a higher cost, which may not coincide with the desired global minimum, the cheapest solution over the whole search space.
Figure A1. Example of a one- dimensional function to minimize. The minimization algorithm may remain trapped in a local minimum, far from the global minimum of the function.
Condensedmatter 02 00037 g0a1
The problem is that the algorithm only climbs “down-hill”, and never “up-hill”, discarding paths leading to a higher cost. This problem becomes especially important when the search space is large and complex, i.e., when we need to determine a large number of parameters. To overcome local minimum trapping, different algorithms are required.
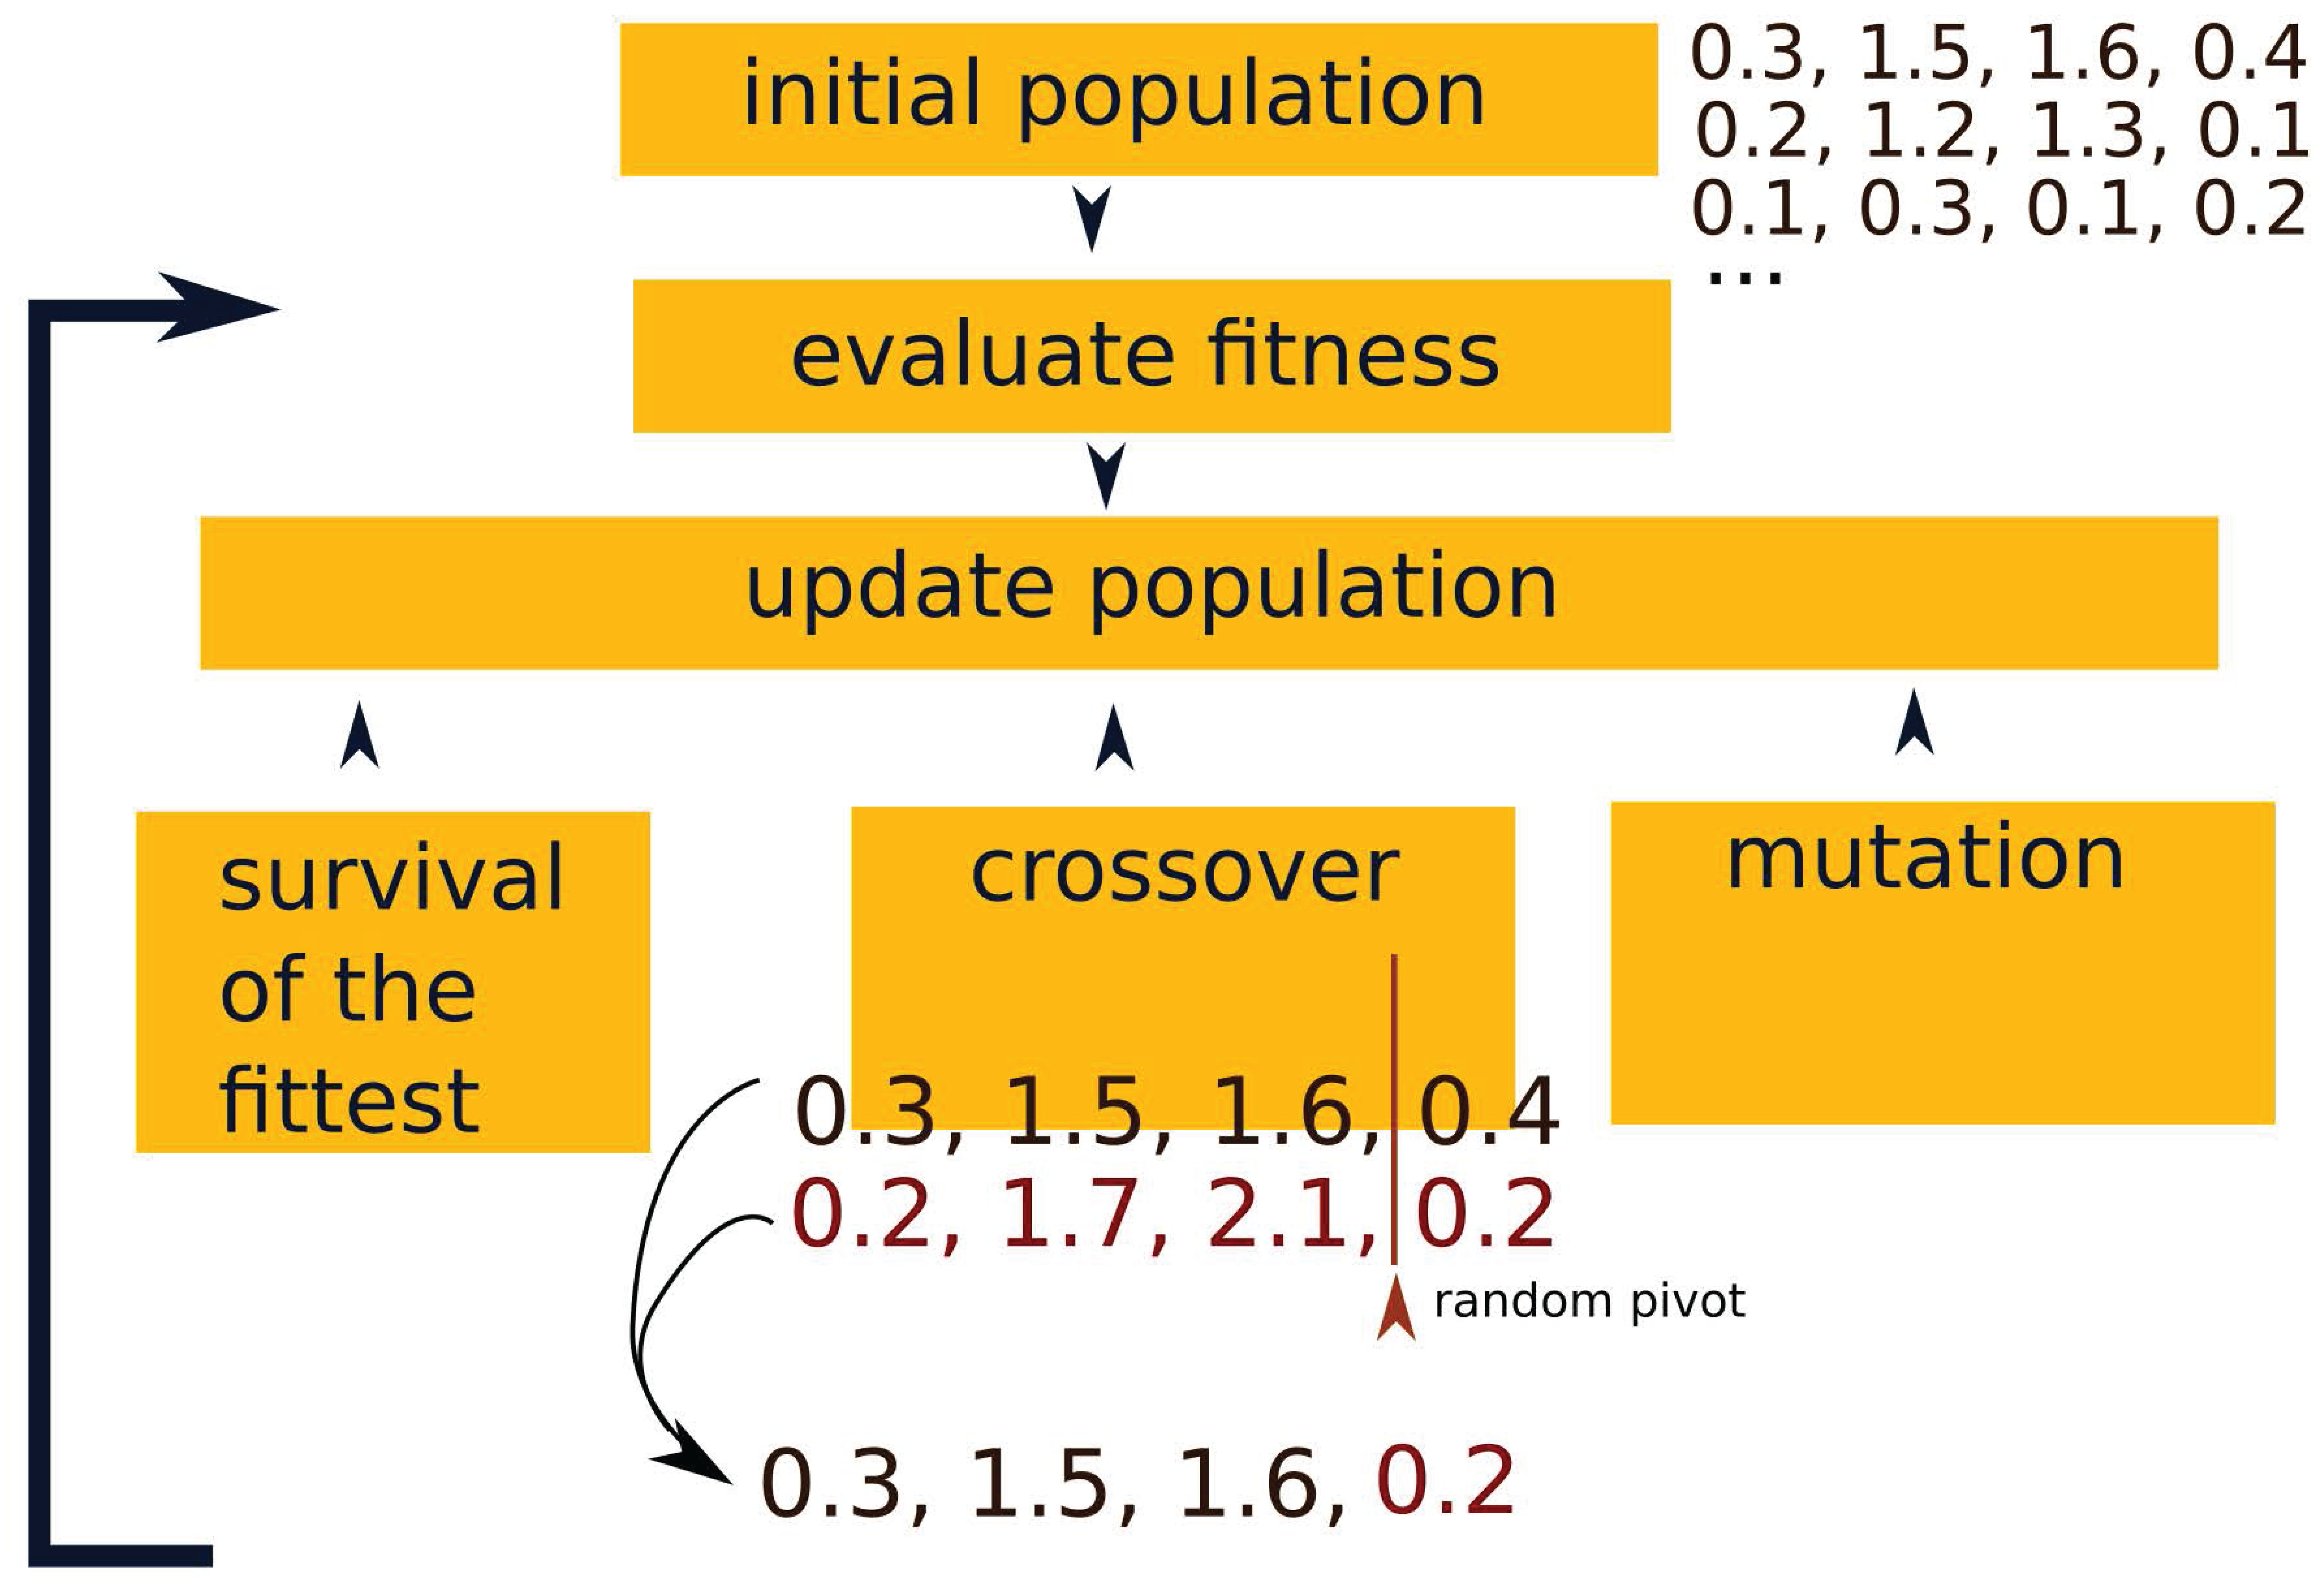
Genetic algorithms are a class of algorithms, inspired by natural selection laws, to solve optimization and search problems, overcoming the local minimum trapping problem (Figure A2). The earth ecosystem is large and complex, with many variables (such as environment resources, prey and predator populations, etc.) which need to be correctly balanced for the system not to collapse. We may thus see the evolution of a species as a giant optimization problem and an efficient one, considering the complexity of living systems and how robust the global ecosystem is, able to overcome changes in the environment and even able to recover from catastrophic events, given enough time. The idea of genetic algorithms is to apply Darwin’s natural selection laws, so efficient in Nature, to the problem of minimization of a cost function. It is common to use a nomenclature close to biology, by calling a trial solution an individual and a set of individual solutions a population. In our case an individual is a row of real numbers, the coefficients of the model, while the population is a × N matrix, where N is the number of individuals in the population.
Figure A2. Illustration of genetic algorithms.
Condensedmatter 02 00037 g0a2
First, we start for some initial population of N individuals. These individuals may be chosen randomly or close to the expected solution. In any case, if the algorithm performs well, final results should not depend on the initial population. We define for each individual a level of fitness, identifying how good that solution is. The smaller the cost function for some individual, the higher its fitness. We then sort the population by level of fitness, placing first individuals with an higher fitness. The first n individuals, the fittest, are kept in the new population, as they are the most likely to survive, according to the principle of survival of the fittest, ensuring that the best solutions are always kept. The remaining members of the population are chosen by crossover and mutation. Crossover and mutations events are performed, respectively with probability p cross and p mut , until the new population reach N individuals. A new population is also called a generation. During a crossover, a new solution is found by merging two existing solutions. Two individuals of the old population reproduce and form an individual of the new population, by crossover, a term imported from the field of genetics. We choose a random pivot p, an integer number between zero and . Then the new solution will be composed of the first numbers of the first individual and the remaining numbers from the second individual. As fitter individuals are more likely to reproduce, when a crossover event is triggered, two parents are selected from the old population with a probability proportional to their fitness, using the tower sampling algorithm (see Section 4.1). The second method to produce a new individual is mutation. The new individual is formed by selecting an old individual, with probability proportional to its fitness and changing one of its real numbers, chosen randomly, by adding or subtracting, with equal probabilities, some small number δ . The algorithm iterates, creating a new population from the previous one. After G generations, the algorithm stops. For efficient simulations the probability of mutations p mut should be small (≈0.01%). We way expect that increasing the population size increases the efficiency of the algorithm, but it is actually found that a large population only slows the algorithm down with very small increase in efficiency and a populations of ≈20 individuals is enough in most systems [53].
Table A1. Table of the coefficients γ ( n 1 , n 2 , n 3 ) of the third model, obtained with genetic algorithms.
n 1 n 2 n 3 γ ( n 1 , n 2 , n 3 ) n 1 n 2 n 3 γ ( n 1 , n 2 , n 3 ) n 1 n 2 n 3 γ ( n 1 , n 2 , n 3 )
0000.02691210.66182420.7802
0011.08361220.86642430.5641
0021.58751230.25232500.6506
0031.00281300.46922510.5304
0100.13271310.05122520.7571
0110.42471320.41642530.3987
0121.93311330.73042600.2445
0130.16191400.45832610.9874
020 0.0156 1410.66922620.1629
0210.79181420.70612630.0280
0220.63471430.13113006.4501
0230.17061500.14623010.6706
0300.31601510.68723020.7434
0310.26041520.23353030.2740
0320.55451530.33793104.9250
0330.91671600.59913110.4324
0400.61871610.63793120.3590
0410.40001620.74743130.2727
0420.01571630.91523203.1747
0430.06172002.19573210.0603
050 0.1458 2010.61593220.8733
0510.36092020.03503230.2785
052 0.0184 2030.74253300.9470
0510.36092101.99773310.9201
0530.38212111.92633320.9011
0600.05572120.30833330.8078
0610.64022131.15713400.8892
0620.35672201.73973410.1157
0630.32892211.54193420.3957
1001.20792220.80533430.5538
1011.69662230.72303500.1971
1020.6769230−0.00813510.0778
1030.46412310.98473520.1401
1100.85492320.30083530.5883
1111.36692330.32983600.3159
1121.36452400.24103610.2322
113 0.1316 2410.34603620.2416
120 0.6 3630.0972

Appendix B. Accelerating Kinetic Monte Carlo
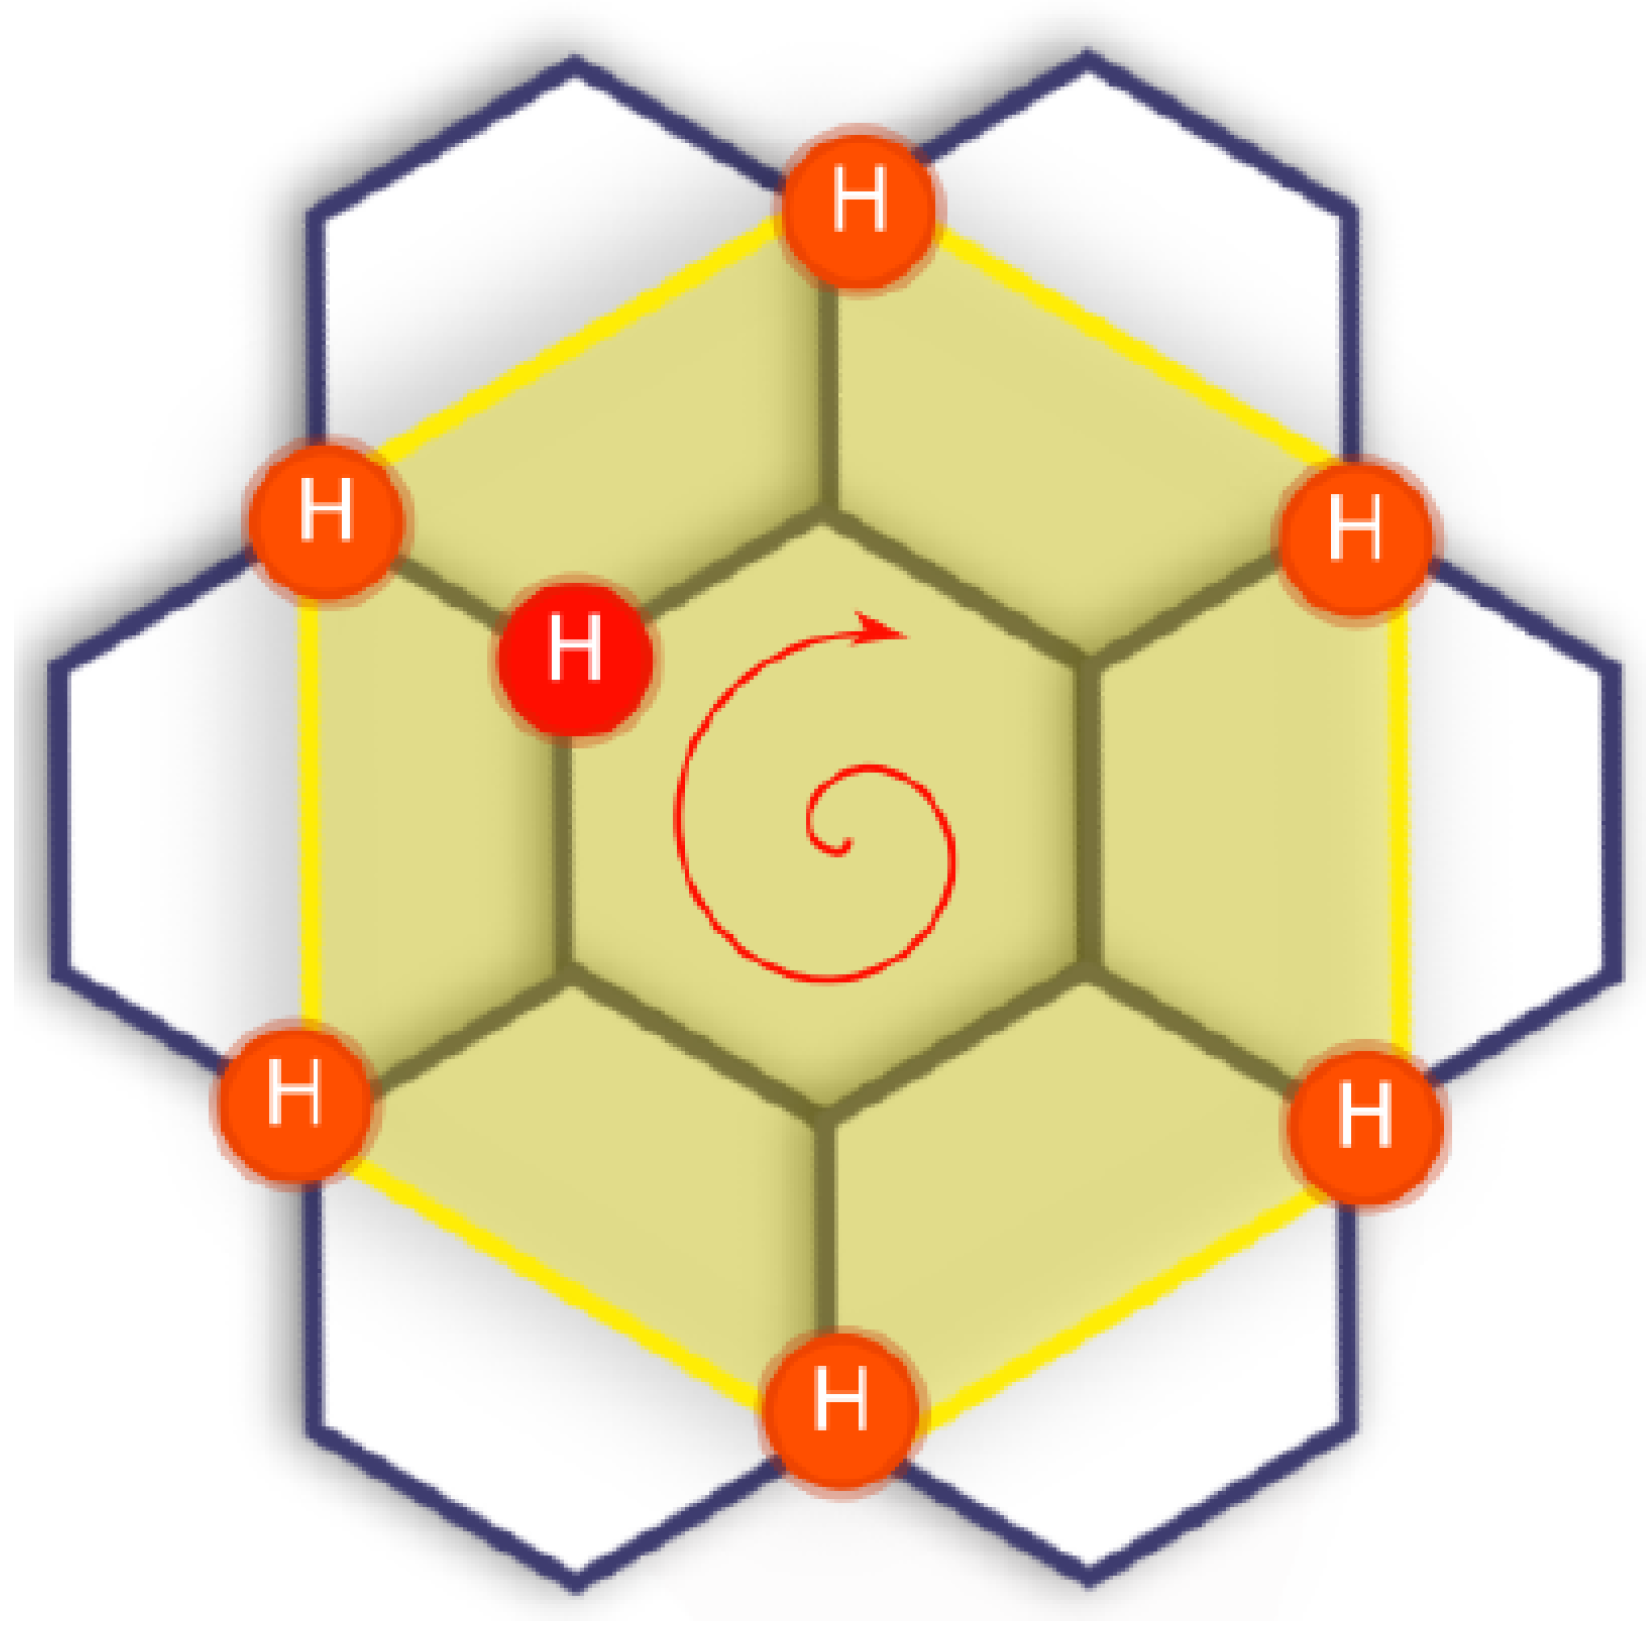
Our model predicts that meta dimers and all configurations embedding meta dimers are highly unstable. At high coverage, when adatoms are close together, it is more likely for these meta states to occur. An unstable configuration means that during a single Monte Carlo step, the simulation time is updated by a very small quantity, while of course the CPU time is always the same, regardless of the stability of the configuration. It may happen that the system bounces between two or more unstable configurations a very large number of times as the LKMC algorithm keeps selecting the same events, which have a much higher probability to occur than any other event on the surface. While a lot of CPU time is employed to simulate these redundant kinetics, only very little real time is simulated. This can drastically limit the simulation time accessible to the LKMC algorithm. In our simulations, we run into redundant kinetics of the type shown in Figure A3. One hydrogen adatom is free to loop on a hexagonal cell, enclosed by hydrogen adatoms disposed on a bigger hexagon, effectively forbidding the inner H adatom from quitting the inner hexagon. The H adatom can escape only when one of the outer hydrogen adatoms hops to some other position. Unfortunately the inner atom is highly unstable, as it has two second neighbors (i.e., it forms two meta dimers). This means that the H-adatom will be able to escape only after a very great number of hopping events within the inner hexagon, after a small real simulation time but a long CPU time.
Figure A3. The H adatom loops on the inner hexagon, trapped by the H adatoms on the outer hexagon.
Condensedmatter 02 00037 g0a3
To mitigate this problem we can accelerate the LKMC code using AMC theory. The idea is that simulating each step in these redundant configurations is too expensive and of little interest as the same moves are repeated over and over. All we are interested in is the final configuration when the inner H adatom finally escapes the trap and how long it takes to do so, which we can try to estimate using an analytic theory, instead of an atomistic simulation.
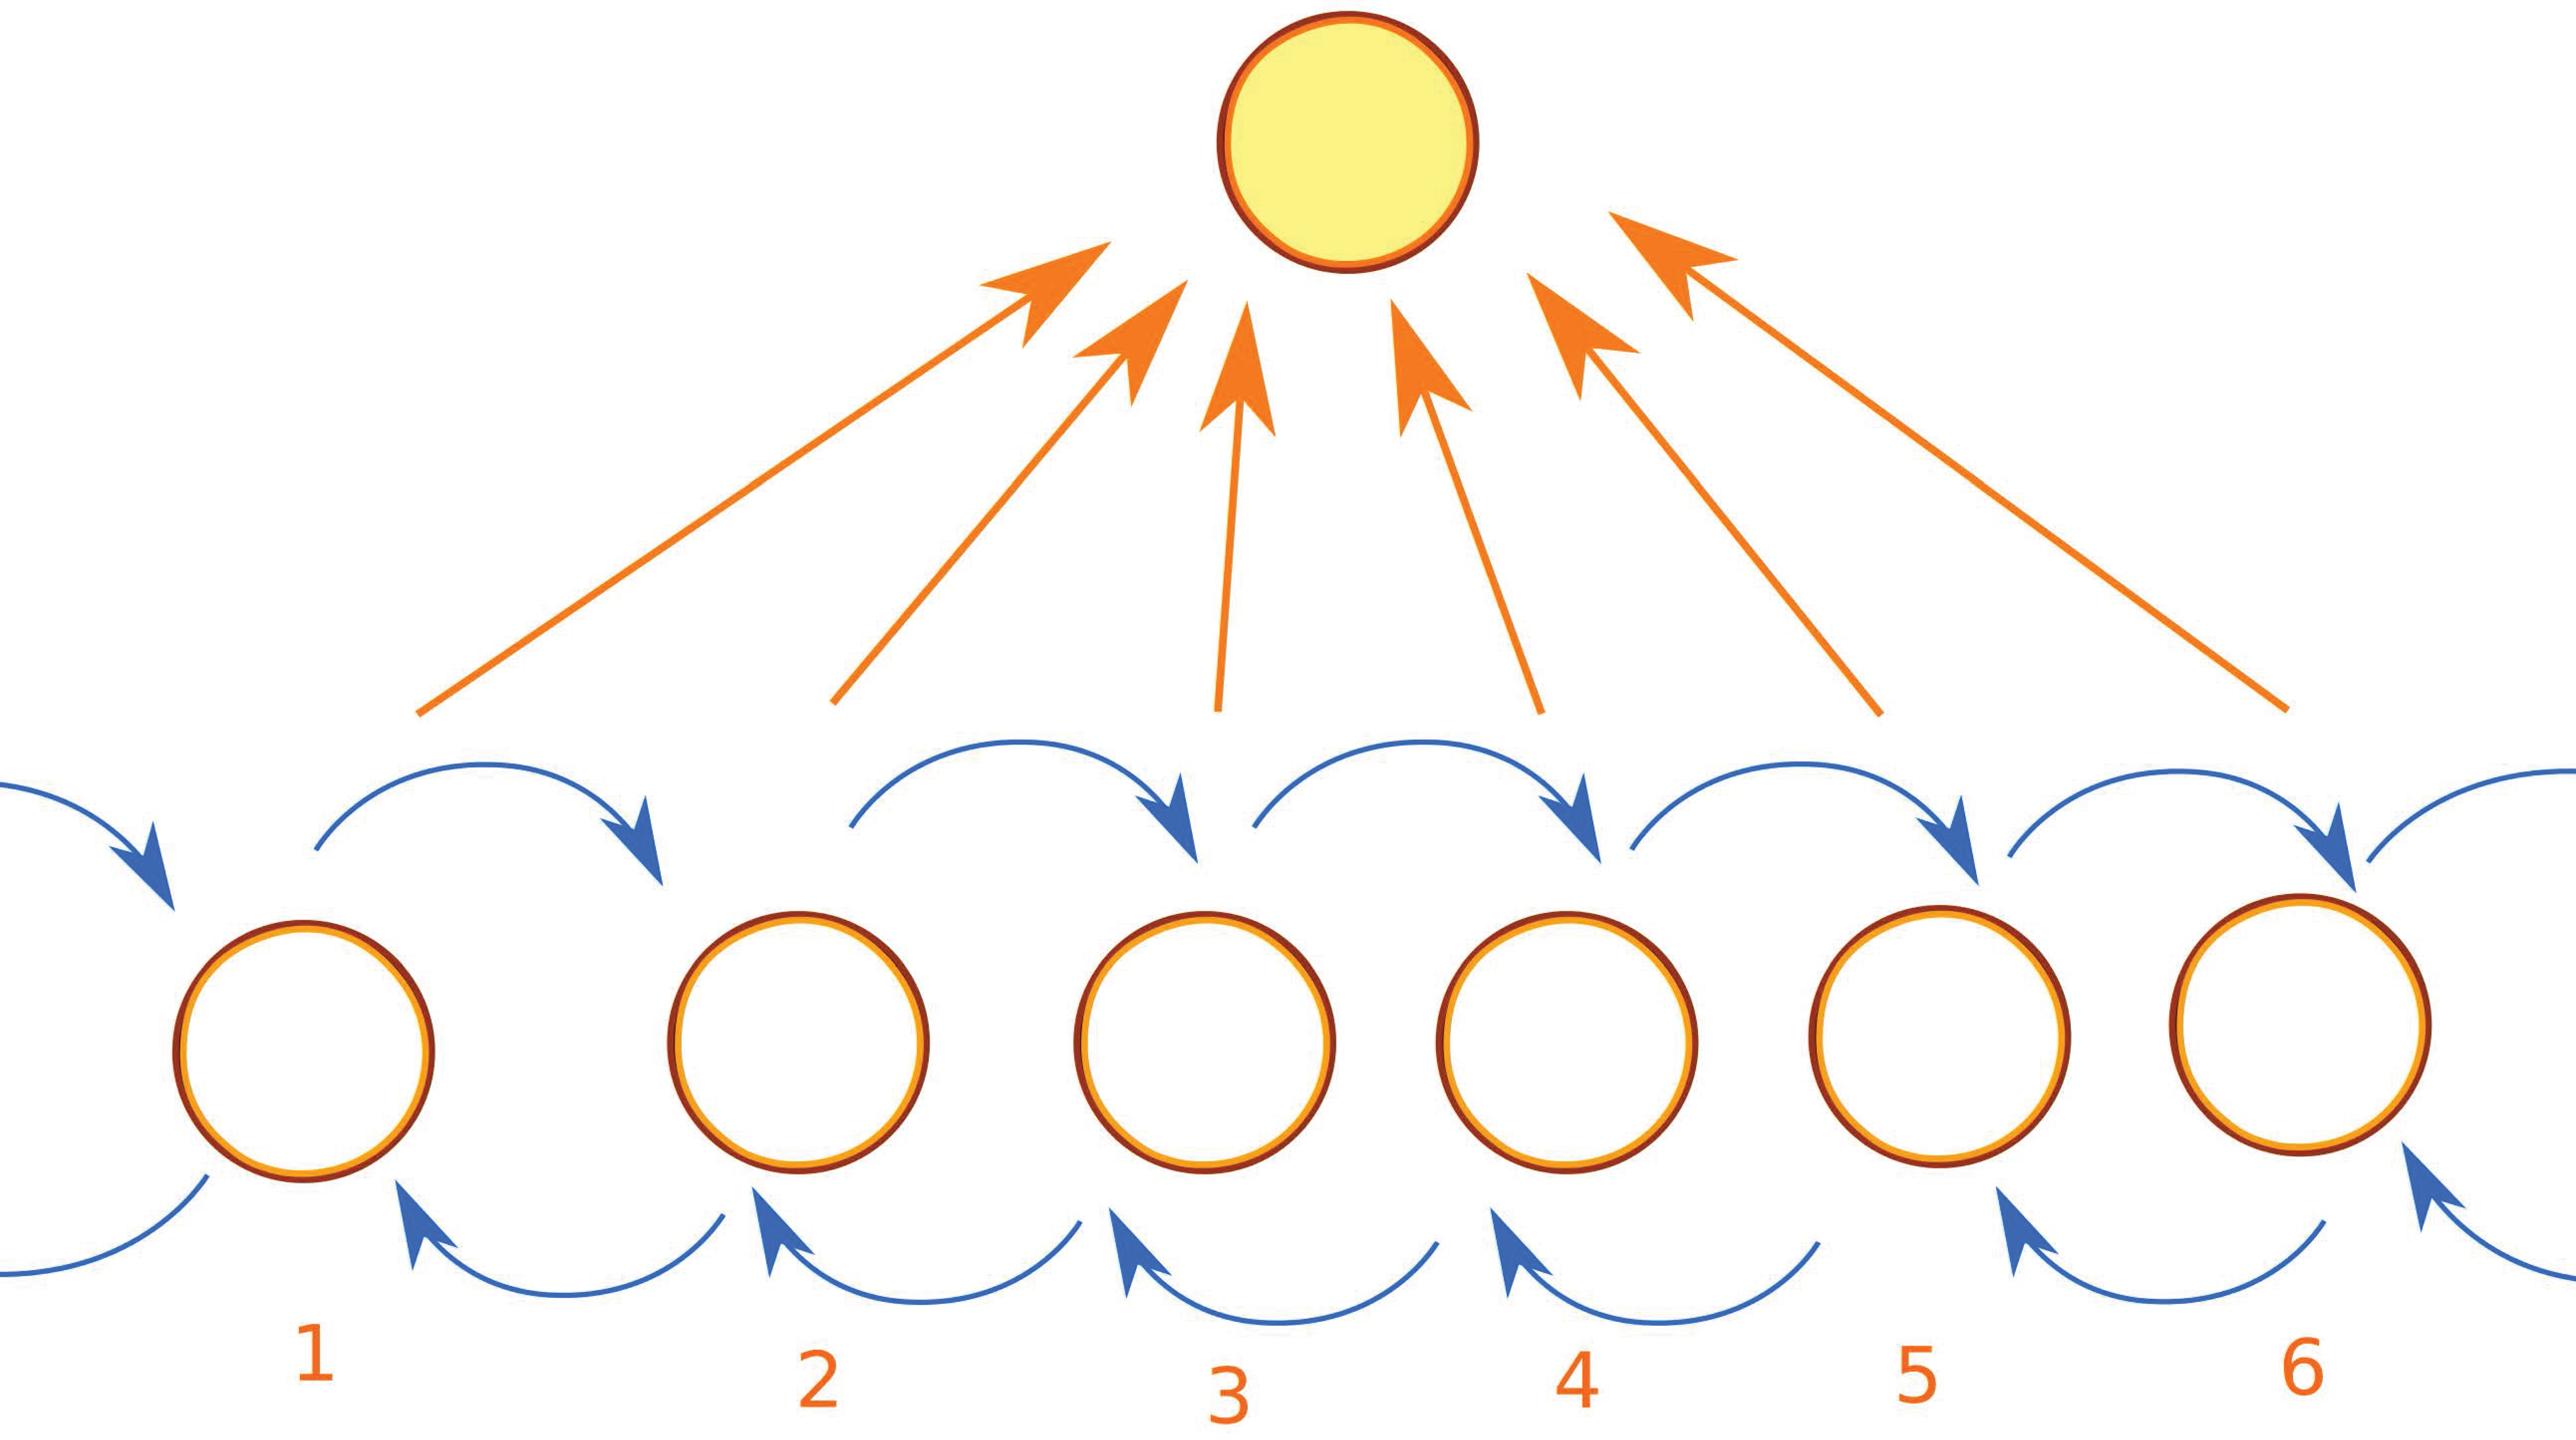
In a Markov chain a state is said to be absorbing if once the system reaches that state, it remains there for all successive steps. A Markov chain is an absorbing Markov chain if (i) it has at least an absorbing state, and (ii) from any state it is possible to reach any absorbing state in a finite number of steps (Figure A4). Thus the absorbing Markov chain ends when the system gets into one of the absorbing states. We already known that a succession of LKMC steps form a Markov chain. When trapped in the configuration of Figure A3, the H adatoms keep looping through a set of six global configurations. We can consider this sub-chain as a Markov chain which ends when a new stable configuration is reached. Then we can consider as an absorbing state the set of all configurations, except the 6 unstable configurations of the loop.
Figure A4. Illustration of the AMC used to accelerate LKMC for the configuration of Figure A3.
Condensedmatter 02 00037 g0a4
We now define as transition states all states of the AMC except the absorbing states. We suppose our AMC has N transient states and a absorbing states. We can now define the transition matrix T of dimension N × N whose matrix elements T i , j gives the probability to pass from state i to state j. Then the probability to go from state i to state j in exactly k steps is given by ( T k ) i , j . Summing over all possible steps k we obtain the fundamental matrix:
N = k T k = ( I T ) 1 ,
whose matrix element N i , j yields the expected number of steps between states i and j. Starting in the state i, by summing over all states j, we get the expected number of steps before reaching an absorbing state after a time t i = j N i , j . We now define the matrix R of dimension N × a , whose matrix elements R i , j yields the probability to pass from a transient state i to an absorbing state j. Then, the probability, starting from state i, to be absorbed by a state j is given by the ( i , j ) element of the matrix [54]:
B = N R .
In our case we only have one absorbing state and the R matrix becomes a vector. Then, starting from state i, the probability to reach this absorbing state by directly hopping from a transient state j is given by b i , j = N i j R j , the expected number of times the AMC visits the transient state j multiplied by the probability of passing from the state j to the absorbing state. The quantities b i j and t i are all we need to accelerate the LKMC algorithm.
In our practical implementation, inspired by [55], we:
  • recognize when the LKMC algorithm revisits the same configurations many times;
  • when some configuration is repeated too many times, we pause the regular LKMC algorithm; we then proceed as in the regular LKMC algorithm, but performing all possible events with a barrier less than some limiting barrier E m i n , instead of just selecting the most probable move, allowing us to build the matrix T and the vector R;
  • estimate the time and configuration when the system exits the basin using AMC theory;
  • accordingly update the simulation time and the current configuration;
  • resume the regular LKMC algorithm.
Steps 1 and 2 require the ability to recognize when configurations are repeated. In order to do so efficiently, we map all possible configuration to an index, the Zobrist key [56], first developed for remembering moves in chess. This index can be calculated in constant time during a kinetic simulation. The Zobrist key is not unique as more than one configuration may map to the same index, although the probability for such a collision to occur is very low.

References

  1. Novoselov, K.S.; Geim, A.K.; Morozov, S.V.; Jiang, D.; Zhang, Y.; Dubonos, S.V.; Grigorieva, I.V.; Firsov, A.A. Electric Field Effect in Atomically Thin Carbon Films. Science 2004, 306, 666–669. [Google Scholar] [CrossRef] [PubMed]
  2. Butler, S.Z.; Hollen, S.M.; Cao, L.; Cui, Y.; Gupta, J.A.; Gutiérrez, H.R.; Heinz, T.F.; Hong, S.S.; Huang, J.; Ismach, A.F.; et al. Progress, Challenges, and Opportunities in Two-Dimensional Materials Beyond Graphene. ACS Nano 2013, 7, 2898–2926. [Google Scholar] [CrossRef] [PubMed]
  3. Boukhvalov, D.W.; Katsnelson, M.I.; Lichtenstein, A.I. Hydrogen on graphene: Electronic structure, total energy, structural distortions and magnetism from first-principles calculations. Phys. Rev. B 2008, 77, 035427. [Google Scholar] [CrossRef]
  4. Forte, G.; Grassi, A.; Lombardo, G.M.; La Magna, A.; Angilella, G.G.N.; Pucci, R.; Vilardi, R. Modeling vacancies and hydrogen impurities in graphene: A molecular point of view. Phys. Lett. A 2008, 372, 6168–6174. [Google Scholar] [CrossRef]
  5. Pellegrino, F.M.D.; Angilella, G.G.N.; Pucci, R. Effect of impurities in high-symmetry lattice positions on the local density of states and conductivity of graphene. Phys. Rev. B 2009, 80, 094203. [Google Scholar] [CrossRef]
  6. Ulybyshev, M.V.; Katsnelson, M.I. Magnetism and Interaction-Induced Gap Opening in Graphene with Vacancies or Hydrogen Adatoms: Quantum Monte Carlo Study. Phys. Rev. Lett. 2015, 114, 246801. [Google Scholar] [CrossRef] [PubMed] [Green Version]
  7. Aréou, E.; Cartry, G.; Layet, J.M.; Angot, T. Hydrogen-graphite interaction: Experimental evidences of an adsorption barrier. J. Chem. Phys. 2011, 134, 014701. [Google Scholar] [CrossRef] [PubMed]
  8. Šljivančanin, Ž.; Rauls, E.; Hornekaer, L.; Xu, W.; Besenbacher, F.; Hammer, B. Extended atomic hydrogen dimer configurations on the graphite(0001) surface. J. Chem. Phys. 2009, 131, 084706. [Google Scholar] [CrossRef] [PubMed]
  9. González-Herrero, H.; Gómez-Rodríguez, J.M.; Mallet, P.; Moaied, M.; Palacios, J.J.; Salgado, C.; Ugeda, M.M.; Veuillen, J.Y.; Yndurain, F.; Brihuega, I. Atomic-scale control of graphene magnetism by using hydrogen atoms. Science 2016, 352, 437–441. [Google Scholar] [CrossRef] [PubMed]
  10. Lehtinen, P.O.; Foster, A.S.; Ma, Y.; Krasheninnikov, A.V.; Nieminen, R.M. Irradiation-Induced Magnetism in Graphite: A Density Functional Study. Phys. Rev. Lett. 2004, 93, 187202. [Google Scholar] [CrossRef] [PubMed]
  11. Yazyev, O.V.; Helm, L. Defect-induced magnetism in graphene. Phys. Rev. B 2007, 75, 125408. [Google Scholar] [CrossRef]
  12. Palacios, J.J.; Fernández-Rossier, J.; Brey, L. Vacancy-induced magnetism in graphene and graphene ribbons. Phys. Rev. B 2008, 77, 195428. [Google Scholar] [CrossRef]
  13. Nair, R.R.; Sepioni, M.; Tsai, I.L.; Lehtinen, O.; Keinonen, J.; Krasheninnikov, A.V.; Thomson, T.; Geim, A.K.; Grigorieva, I.V. Spin-half paramagnetism in graphene induced by point defects. Nat. Phys. 2012, 8, 199–202. [Google Scholar] [CrossRef]
  14. McCreary, K.M.; Swartz, A.G.; Han, W.; Fabian, J.; Kawakami, R.K. Magnetic Moment Formation in Graphene Detected by Scattering of Pure Spin Currents. Phys. Rev. Lett. 2012, 109, 186604. [Google Scholar] [CrossRef] [PubMed]
  15. Tao, C.; Jiao, L.; Yazyev, O.V.; Chen, Y.C.; Feng, J.; Zhang, X.; Capaz, R.B.; Tour, J.M.; Zettl, A.; Louie, S.G.; et al. Spatially resolving edge states of chiral graphene nanoribbons. Nat. Phys. 2011, 7, 616–620. [Google Scholar] [CrossRef]
  16. Nair, R.R.; Tsai, I.L.; Sepioni, M.; Lehtinen, O.; Keinonen, J.; Krasheninnikov, A.V.; Castro Neto, A.H.; Katsnelson, M.I.; Geim, A.K.; Grigorieva, I.V. Dual origin of defect magnetism in graphene and its reversible switching by molecular doping. Nat. Commun. 2013, 4, 2010. [Google Scholar] [CrossRef] [PubMed] [Green Version]
  17. Moaied, M.; Alvarez, J.V.; Palacios, J.J. Hydrogenation-induced ferromagnetism on graphite surfaces. Phys. Rev. B 2014, 90, 115441. [Google Scholar] [CrossRef]
  18. Sha, X.; Jackson, B. First-principles study of the structural and energetic properties of H atoms on a graphite (0001) surface. Surf. Sci. 2002, 496, 318–330. [Google Scholar] [CrossRef]
  19. Chen, L.; Cooper, A.C.; Pez, G.P.; Cheng, H. Mechanistic Study on Hydrogen Spillover onto Graphitic Carbon Materials. J. Phys. Chem. C 2007, 111, 18995–19000. [Google Scholar] [CrossRef]
  20. Denis, P.A.; Iribarne, F. On the hydrogen addition to graphene. J. Mol. Struct. 2009, 907, 93–103. [Google Scholar] [CrossRef]
  21. Kerwin, J.; Jackson, B. The sticking of H and D atoms on a graphite (0001) surface: The effects of coverage and energy dissipation. J. Chem. Phys. 2008, 128, 084702. [Google Scholar] [CrossRef] [PubMed]
  22. Moaied, M.; Moreno, J.A.; Caturla, M.J.; Ynduráin, F.; Palacios, J.J. Theoretical study of the dynamics of atomic hydrogen adsorbed on graphene multilayers. Phys. Rev. B 2015, 91, 155419. [Google Scholar] [CrossRef]
  23. Casolo, S.; Løvvik, O.M.; Martinazzo, R.; Tantardini, G.F. Understanding adsorption of hydrogen atoms on graphene. J. Chem. Phys. 2009, 130, 054704. [Google Scholar] [CrossRef] [PubMed]
  24. Hornekær, L.; Rauls, E.; Xu, W.; Šljivančanin, Ž.; Otero, R.; Stensgaard, I.; Lægsgaard, E.; Hammer, B.; Besenbacher, F. Clustering of Chemisorbed H(D) Atoms on the Graphite (0001) Surface due to Preferential Sticking. Phys. Rev. Lett. 2006, 97, 186102. [Google Scholar] [CrossRef] [PubMed]
  25. Jeloaica, L.; Sidis, V. DFT investigation of the adsorption of atomic hydrogen on a cluster-model graphite surface. Chem. Phys. Lett. 1999, 300, 157–162. [Google Scholar] [CrossRef]
  26. Forte, G.; Grassi, A.; Lombardo, G.M.; Pucci, R.; Angilella, G.G.N. From molecules and clusters of atoms to solid state properties. In Many-Body Approaches at Different Scales: A Tribute to Norman H. March on the Occasion of His 90th Birthday; Angilella, G.G.N., Amovilli, C., Eds.; Springer: New York, NY, USA, 2018; Chapter 19; pp. 239–248. [Google Scholar]
  27. Soriano, D.; Leconte, N.; Ordejón, P.; Charlier, J.C.; Palacios, J.J.; Roche, S. Magnetoresistance and Magnetic Ordering Fingerprints in Hydrogenated Graphene. Phys. Rev. Lett. 2011, 107, 016602. [Google Scholar] [CrossRef] [PubMed]
  28. Leconte, N.; Soriano, D.; Roche, S.; Ordejon, P.; Charlier, J.C.; Palacios, J.J. Magnetism-Dependent Transport Phenomena in Hydrogenated Graphene: From Spin-Splitting to Localization Effects. ACS Nano 2011, 5, 3987–3992. [Google Scholar] [CrossRef] [PubMed]
  29. Soriano, D.; Van Tuan, D.; Dubois, S.M.M.; Gmitra, M.; Cummings, A.W.; Kochan, D.; Ortmann, F.; Charlier, J.C.; Fabian, J.; Roche, S. Spin transport in hydrogenated graphene. 2D Mater. 2015, 2, 022002. [Google Scholar] [CrossRef]
  30. Jayasingha, R.; Sherehiy, A.; Wu, S.Y.; Sumanasekera, G.U. In Situ Study of Hydrogenation of Graphene and New Phases of Localization between Metal–Insulator Transitions. Nano Lett. 2013, 13, 5098–5105. [Google Scholar] [CrossRef] [PubMed]
  31. Cresti, A.; Louvet, T.; Ortmann, F.; Van Tuan, D.; Lenarczyk, P.; Huhs, G.; Roche, S. Impact of Vacancies on Diffusive and Pseudodiffusive Electronic Transport in Graphene. Crystals 2013, 3, 289–305. [Google Scholar] [CrossRef] [Green Version]
  32. Roche, S.; Leconte, N.; Ortmann, F.; Lherbier, A.; Soriano, D.; Charlier, J.C. Quantum transport in disordered graphene: A theoretical perspective. Solid State Commun. 2012, 152, 1404–1410. [Google Scholar] [CrossRef]
  33. Chuang, C.; Puddy, R.K.; Lin, H.D.; Lo, S.T.; Chen, T.M.; Smith, C.G.; Liang, C.T. Experimental evidence for Efros–Shklovskii variable range hopping in hydrogenated graphene. Solid State Commun. 2012, 152, 905–908. [Google Scholar] [CrossRef]
  34. Leconte, N.; Lherbier, A.; Varchon, F.; Ordejon, P.; Roche, S.; Charlier, J.C. Quantum transport in chemically modified two-dimensional graphene: From minimal conductivity to Anderson localization. Phys. Rev. B 2011, 84, 235420. [Google Scholar] [CrossRef]
  35. Saloriutta, K.; Uppstu, A.; Harju, A.; Puska, M.J. Ab initio transport fingerprints for resonant scattering in graphene. Phys. Rev. B 2012, 86, 235417. [Google Scholar] [CrossRef]
  36. Deretzis, I.; Giannazzo, F.; Angilella, G.G.N.; Parisi, L.; Magna, A.L. Atom by atom simulations of nano-materials processing. In Proceedings of the 2016 IEEE Nanotechnology Materials and Devices Conference (NMDC), Toulouse, France, 9–12 October 2016; pp. 1–2. [Google Scholar]
  37. Parisi, L.; Di Giugno, R.; Deretzis, I.; Angilella, G.G.N.; La Magna, A. Kinetic Monte Carlo simulations of vacancy evolution in graphene. Mater. Sci. Semicond. Process. 2016, 42, 179–182. [Google Scholar] [CrossRef]
  38. Datta, S. Electronic Transport in Mesoscopic Systems; Cambridge University Press: Cambridge, UK, 1995. [Google Scholar]
  39. Šljivančanin, Ž.; Andersen, M.; Hornekaer, L.; Hammer, B.; Andersen, M. Structure and stability of small H clusters on graphene. Phys. Rev. B 2011, 83, 205426. [Google Scholar] [CrossRef]
  40. Gargiulo, F.; Autés, G.; Virk, N.; Barthel, S.; Rösner, M.; Toller, L.R.M.; Wehling, T.O.; Yazyev, O.V. Electronic Transport in Graphene with Aggregated Hydrogen Adatoms. Phys. Rev. Lett. 2014, 113, 246601. [Google Scholar] [CrossRef] [PubMed]
  41. La Magna, A.; Coffa, S.; Colombo, L. Role of extended vacancy-vacancy interaction on the ripening of voids in silicon. Phys. Rev. Lett. 1999, 82, 1720. [Google Scholar] [CrossRef]
  42. La Magna, A.; Coffa, S. Accelerated Monte Carlo algorithms for defect diffusion and clustering. Comput. Mater. Sci. 2000, 17, 21–33. [Google Scholar] [CrossRef]
  43. Lieb, E.H. Two Theorems on the Hubbard Model. Phys. Rev. Lett. 1989, 62, 1201–1204. [Google Scholar] [CrossRef] [PubMed]
  44. Lieb, E.H. Two Theorems on the Hubbard Model. Phys. Rev. Lett. 1989, 62, 1927. [Google Scholar] [CrossRef]
  45. Petersen, D.E.; Sørensen, H.H.B.; Hansen, P.C.; Skelboe, S.; Stokbro, K. Block tridiagonal matrix inversion and fast transmission calculations. J. Comput. Phys. 2008, 227, 3174–3190. [Google Scholar] [CrossRef]
  46. La Magna, A.; Deretzis, I.; Forte, G.; Pucci, R. Conductance distribution in doped and defected graphene nanoribbons. Phys. Rev. B 2009, 80, 195413. [Google Scholar] [CrossRef]
  47. Deretzis, I.; Fiori, G.; Iannaccone, G.; La Magna, A. Effects due to backscattering and pseudogap features in graphene nanoribbons with single vacancies. Phys. Rev. B 2010, 81, 085427. [Google Scholar] [CrossRef]
  48. Camarda, M.; La Magna, A.; La Via, F. A kinetic Monte Carlo method on super-lattices for the study of the defect formation in the growth of close packed structures. J. Comput. Phys. 2007, 227, 1075–1093. [Google Scholar] [CrossRef]
  49. Deretzis, I.; La Magna, A. Interaction between hydrogen flux and carbon monolayer on SiC(0001): Graphene formation kinetics. Nanoscale 2013, 5, 671–680. [Google Scholar] [CrossRef] [PubMed]
  50. Campo, A.; Lombardo, S.F.; Deretzis, I.; Garozzo, G.; Angilella, G.G.N.; La Magna, A. Atom by Atom simulation of nano-materials manipulation: The plasma etching case. IEEE Trans. Nanotechnol. 2017, 16, 790–797. [Google Scholar] [CrossRef]
  51. Herrero, C.P.; Ramírez, R. Vibrational properties and diffusion of hydrogen on graphene. Phys. Rev. B 2009, 79, 115429. [Google Scholar] [CrossRef]
  52. Tozzini, V.; Pellegrini, V. Prospects for hydrogen storage in graphene. Phys. Chem. Chem. Phys. 2013, 15, 80–89. [Google Scholar] [CrossRef] [PubMed]
  53. Goldberg, D.E. Genetic Algorithms in Search, Optimization and Machine Learning; Addison-Wesley: Boston, MA, USA, 1989. [Google Scholar]
  54. Novotny, M.A. Monte Carlo Algorithms with Absorbing Markov Chains: Fast Local Algorithms for Slow Dynamics. Phys. Rev. Lett. 1995, 74, 1–5. [Google Scholar] [CrossRef] [PubMed]
  55. Fichthorn, K.A.; Lin, Y. A local superbasin kinetic Monte Carlo method. J. Chem. Phys. 2013, 138, 164104. [Google Scholar] [CrossRef] [PubMed]
  56. Mason, D.; Hudson, T.; Sutton, A. Fast recall of state-history in kinetic Monte Carlo simulations utilizing the Zobrist key. Comput. Phys. Commun. 2005, 165, 37–48. [Google Scholar] [CrossRef]
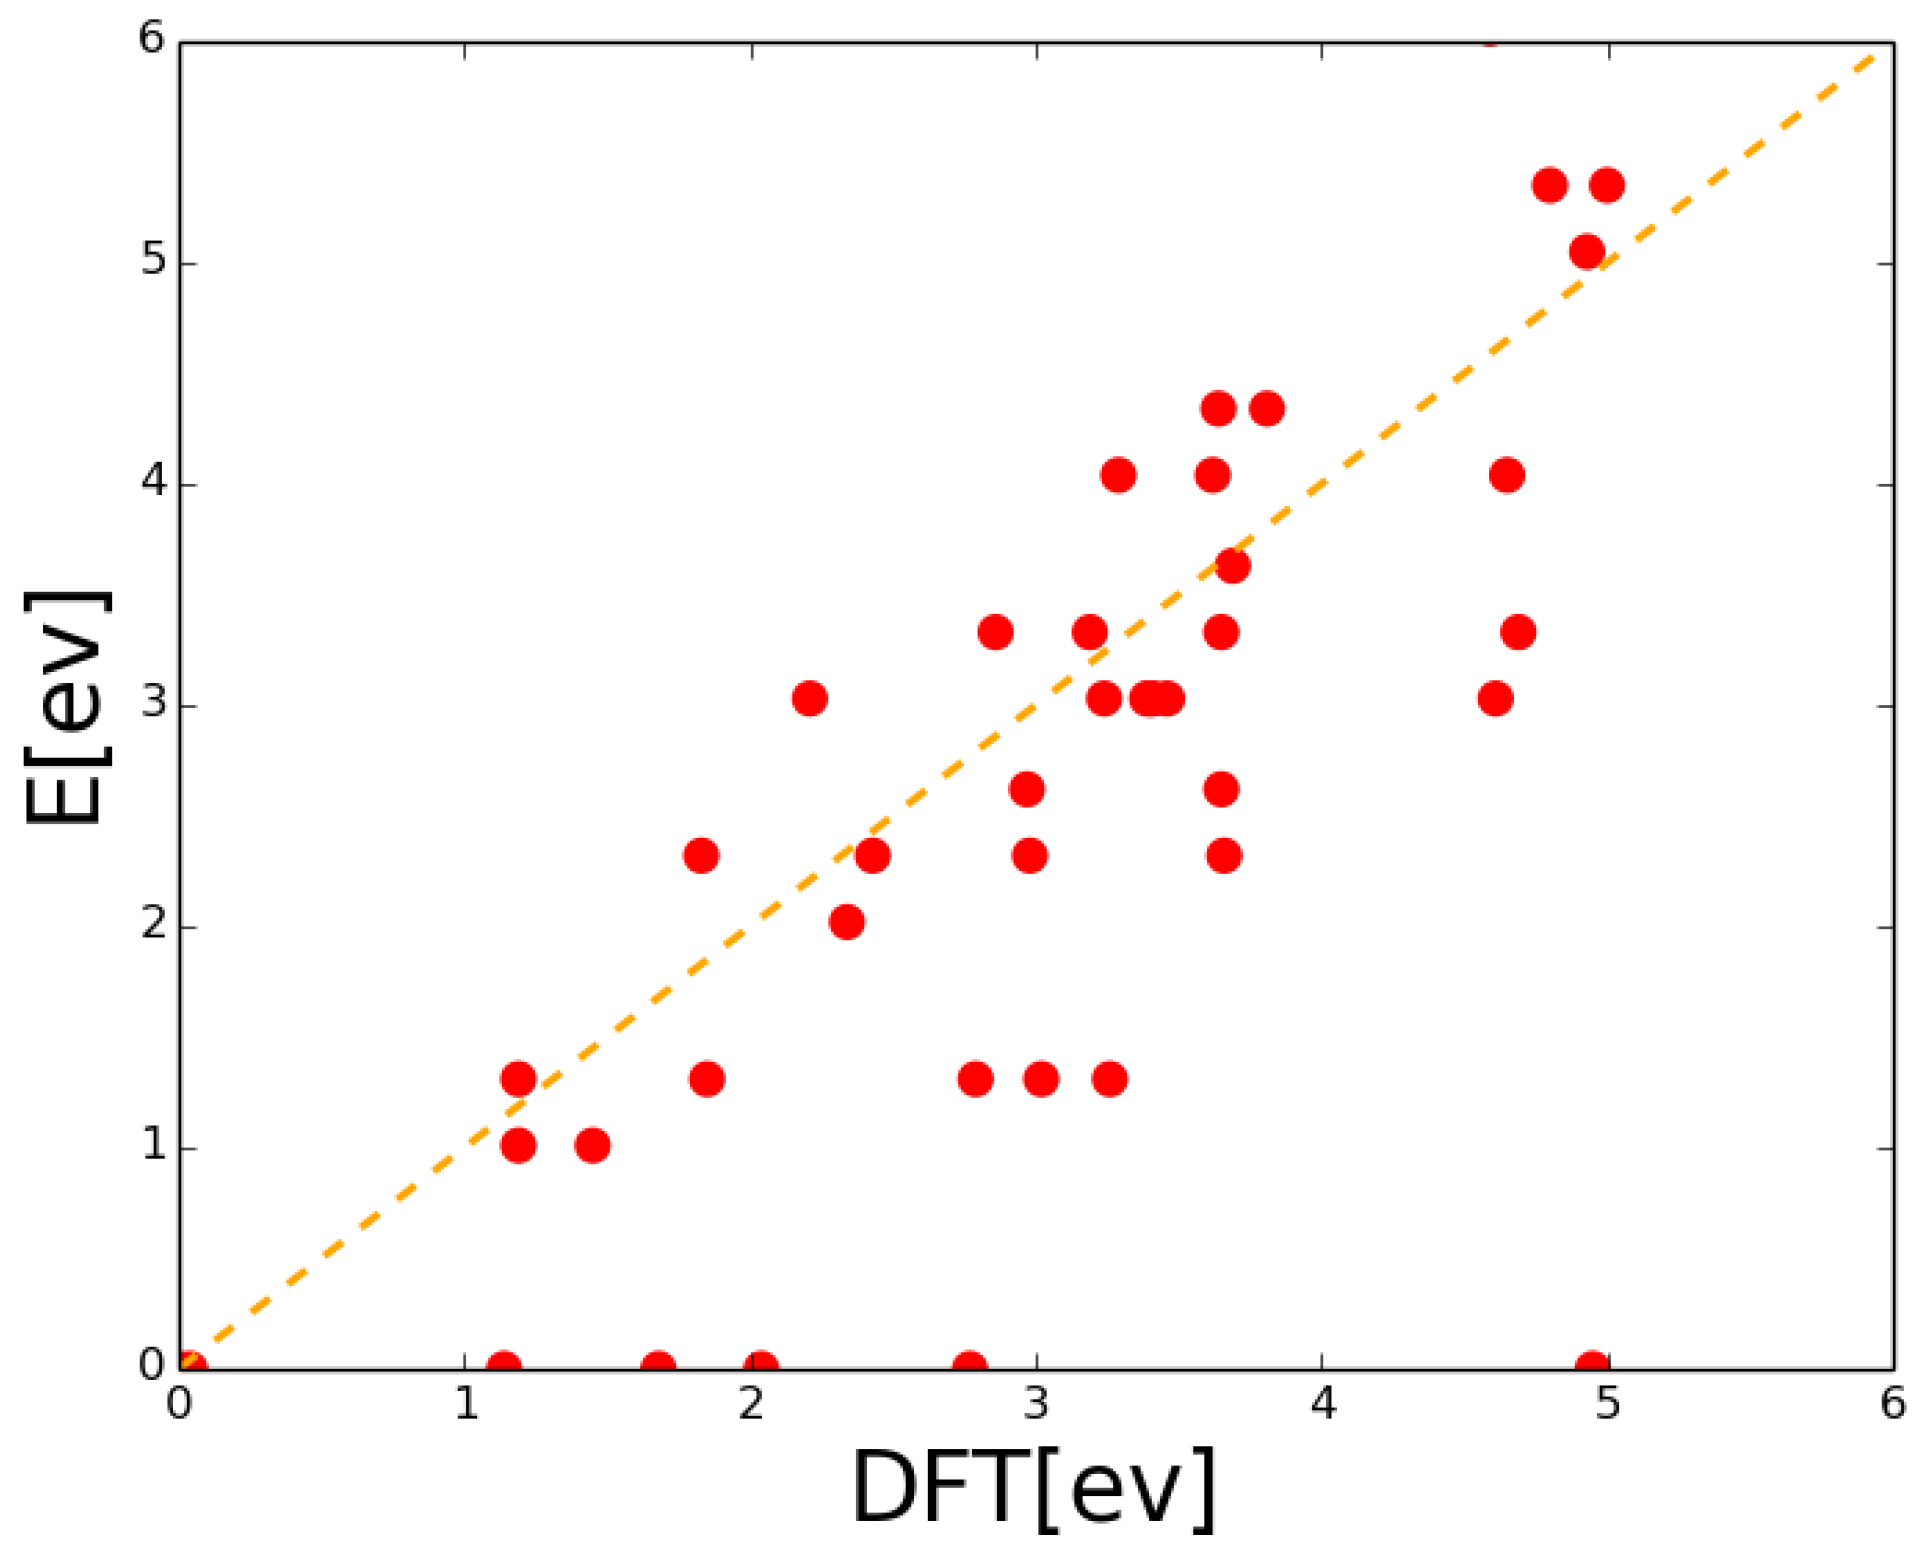
Figure 1. Scatter plot for the model Equation (3a): α 1 = 1.31 , α 2 = 0.3 . Red points depict lattice kinetic Monte Carlo (LKMC) energy versus the Density Functional Theory (DFT)-calculated energy for a broad set of H clusters on graphene (G). The closer the red points are to the first bisector (orange line), the better is the agreement.
Condensedmatter 02 00037 g001
Figure 2. Scatter plot for the model Equation (3b): β 1 = 0.93 , β 2 = 0.21 , β 3 = 0.79 . Red points depict LKMC energy versus the DFT-calculated energy for a broad set of H clusters on G. The closer the red points are to the first bisector (orange line), the better is the agreement.
Condensedmatter 02 00037 g002
Figure 3. Scatter plot for the model Equation (3c). Red points depict LKMC energy versus the DFT-calculated energy for a broad set of H clusters on G. The closer the red points are to the first bisector (orange line), the better is the agreement.
Condensedmatter 02 00037 g003
Figure 4. Snapshot of a simulation taken at 3% coverage. The 2D model is used without desorption ( Φ = 10 10 atoms · cm 2 · s 1 , T = 300 K).
Condensedmatter 02 00037 g004
Figure 5. Maximum chain length as a function of time for T = 300 K and Φ = 10 10 atoms · cm 2 · s 1 .
Condensedmatter 02 00037 g005
Figure 6. Snapshot of a simulation taken at 3% coverage. The 3N model is used without desorption ( Φ = 10 10 atoms · cm 2 · s 1 , T = 300 K).
Condensedmatter 02 00037 g006
Figure 7. Analysis of the simulation for the hydrogenation process of graphene at T = 300 K and Φ = 10 10 atoms · cm 2 · s 1 .
Condensedmatter 02 00037 g007
Figure 8. Analysis of the simulation for the hydrogenation process of graphene at T = 300 K and Φ = 10 15 atoms · cm 2 · s 1 .
Condensedmatter 02 00037 g008
Figure 9. Analysis of the simulation for the hydrogenation process of graphene at T = 500 K and Φ = 10 15 atoms · cm 2 · s 1 .
Condensedmatter 02 00037 g009
Figure 10. Analysis of the simulation for the hydrogenation process of graphene at T = 600 K and Φ = 10 15 atoms · cm 2 · s 1 .
Condensedmatter 02 00037 g010
Figure 11. Hydrogen coverage as a function of the H flux at temperature T = 600 K.
Condensedmatter 02 00037 g011
Figure 12. Hydrogen coverage for varying temperature at hydrogen flux F H = 10 15 atoms · cm 2 · s 1 .
Condensedmatter 02 00037 g012
Figure 13. Quantum transport of a pristine armchair graphene nanoribbon with a width of ∼40 nm. The conductance quantization is evident.
Condensedmatter 02 00037 g013
Figure 14. Quantum transport of hydrogenated graphene at T = 300 K and Φ = 10 10 atoms · cm 2 · s 1 .
Condensedmatter 02 00037 g014
Figure 15. Illustration of the lLKMC algorithm.
Condensedmatter 02 00037 g015
Figure 16. Illustration of the possible events: (a) migration; (b) atomic desorption of single atoms; (c) associative desorption of para dimers.
Condensedmatter 02 00037 g016
Figure 17. Illustration of the device (in blue) with ideal contacts on the left and right (yellow and orange).
Condensedmatter 02 00037 g017
Table 1. Events table of the LKMC algorithm.
EventConfigurationPrefactorBarrier
Migration ( n 1 , n 2 , n 3 ) 10 6 0.6  eV + E ( n 1 , n 2 , n 3 )
Atomic desorption ( 0 , 0 , 0 ) 10 6 1 eV
Associative desorption ( n 1 , n 2 , n 3 > 0 ) 10 6 0.4  eV