Article

Experimental Study of Particle Interactions in Moderate to Dense Granular Shear Flows of Disks

Department of Geology, Tribhuvan University, Tri-Chandra Campus, Kathmandu 44600, Nepal
Condens. Matter 2017, 2(1), 2; https://doi.org/10.3390/condmat2010002
Submission received: 14 September 2016 / Revised: 10 December 2016 / Accepted: 21 December 2016 / Published: 28 December 2016

Abstract

:
To find the status of multiple collisions in transitional granular flow, moderate to densely packed monosized plastic disks were sheared in experimental 2D shear flow apparatus by applying shear strain rate in the range of 14.8 s−1 to 34.6 s−1. Application of high speed video camera and subsequent image processing techniques precisely measure the spatial positions of the particles involved in making the flow. Collision detection and contact duration finding algorithms were formulated to detect inter particle collision in each time step. The proportion of binary and multiple collisions was quantified in each time step. It is found that the contribution of multi particle collision is 13% for the lowest normalized solid fraction ( ν * = 0.50) and 68% for the highest normalized solid fraction ( ν * = 0.85) under consideration. The inter particle collision time is also found greater than binary collision time in all the flows under consideration. The group size is determined for each time step as an additional length scale associated with multi-particle interactions. Number of groups was made of more than two particles in all the flows under consideration, and the amount of such groups increased on increasing the solid fraction irrespective of the shear rate. In the dense cases (solid fraction > 0.60), rapid increase in the group size and the formation of occasional force chains should be attributed for the change in the stress generation pattern.

1. Introduction

A granular material is an assembly of a large number of discrete solid particles where the interstices are generally filled with fluids like air or water. These materials could be quite inhomogeneous and generally characterized by similarities or dissimilarities in properties with fluids under different conditions of loading and packing. Because of such unusual behavior, some researchers have suggested to consider granular medium as an additional form of the substance existence [1,2]. Since the flow involving granular materials has a quite wide range of application in the industry and the terrestrial processes, understanding of the micromechanics of these processes is most important. However, many of the phenomena related with the interaction between particles are still not understood completely. Many past studies are yet to be refined both in terms of study approach and flow regime studied. Numerical simulations and theoretical studies have been the dominant study approaches in the past because of the difficulty in getting grain-scale information from the physical experiments. Possible difficulties and limitations of the physical experiments on getting particle scale details are nicely presented by Drake [3]. Numerical simulations and theoretical studies rely mostly on one of the two approaches: Bagnold’s approach [4] or the kinetic theory model [5]. Bagnold’s approach considers the collisions to be instantaneous binary. The assumption in this approach is that in the grain inertia region, stress is dominantly generated from particle-particle interactions and it results in the momentum transfer. Both the change in momentum during collision and the rate at which collisions occur, are proportional to the relative velocity of particles, which in turn is proportional to the shear rate, γ ˙ . Therefore, both the normal and shear stresses are proportional to the square of the shear rate, γ ˙ 2 .
The kinetic theory models also consider the collision frequency as the major mechanism of stress generation where the rapid flow of granular materials is compared with random molecular motion within the dense gases. The collision frequency is generally calculated with the consideration of instantaneous binary collision although there can be long time frictional contacts. Assumption of only instantaneous (binary) collision impacts for stress generation in both the Bagnold’s model and kinetic theory models have provided reasons to question about their validity as such assumptions are clearly violated in many of the practical granular flows [6], especially in cases where the solid fraction is moderate to dense. Additionally, many of the past studies were focused mostly on the “quasi-static regime”, and the “inertia-dominant flow regime” although most granular flows are neither purely quasi-static nor purely inertia-dominant; rather, they are of transitional type [7]. This is still most challenging regime of granular flow. Many researchers tried to overcome these research gaps [7,8,9,10,11,12,13] and verify them with experimental or theoretical results. Luding and Goldshtein [8] studied collisional cooling via multi-particle interactions by extending the kinetic theory and hydrodynamic models and have shown that in the presence of multi-particle collisions, existing kinetic theory models are to be modified; and therefore quantification of multiple collisions can be important. Hwang and Hutter [9] formulated a relationship describing an encounter between two spherical particles by incorporating the contact time of inter-particle collisions as well. However, the contact time was considered equivalent to binary collision time. Zhang and Rauenzahn [10] provided a detailed analysis of the probabilistic distribution of contact duration. They introduced the visco-plastic constitutive law by using the relaxation time of multiple collisions. In the numerical study of dense particle concentrations, Zhang [11] investigated the relaxation of contacts and its relation with the relaxation of stress generation. However, both of these studies did not quantify the multiple collisions so that its probable effect in the flow can be estimated.
In their numerical simulations of dense granular shear flow, Shen and Sankaran [7] found that if multiple collisions are the major mode of inter-particle interactions, additional length and time scales must be considered to understand the flow dynamics. They considered group size as the additional length scale and contact duration as the additional time scale and estimated these quantities’ relationships with shear rate and the solid fraction. Ji and Shen [12] investigated the transitional behavior of the granular shear flow in 3-D numerical simulation for wide range of solid fractions and shear rate. They have demonstrated the variation of various internal parameters with the solid fractions and the stiffness. Azanza et al. [13], on his experimental study down an inclined plane, found that kinetic theory remains valid near the top of the flow at low solid fraction whereas it is not valid in other parts and high solid fraction. All these past studies indicated that in the transitional granular flow, quantification of binary collision and multiple collision as well as the changes in micro-structural patterns of such flows with respect to the solid fraction and shear rate is important. The primary objective of the present study is to quantify the multiple collisions in intermediately to densely packed granular flow, both temporally and spatially, in terms of contact duration and percentage of multi-particle collisions, respectively. In addition, assessment of the internal microstructure associated with multiple collisions is another concern of this study, which are considered irrelevant in conventional kinetic theory models. To meet these objectives, assembly of idealized disk particles with different solid fractions was sheared by applying varying shear deformation rates in a newly designed experimental shear cell. This shear cell permits capturing digital video of the flow surrounding all the particles. Video of each experimental run is taken via high-speed video camera, and the spatial positions of each particle are obtained through a subsequent image processing technique. The advantage of the current image processing method over the similar approaches of Blair and Kudrolli [14], Mueth [15] and Elliot et al. [16] is that here, the frame rate and resolution of the high speed video camera are higher. Ability of even visual inspections of collision time and partners via particle tracking velocimetry (PTV) software made this study more effective.

2. Materials and Methods

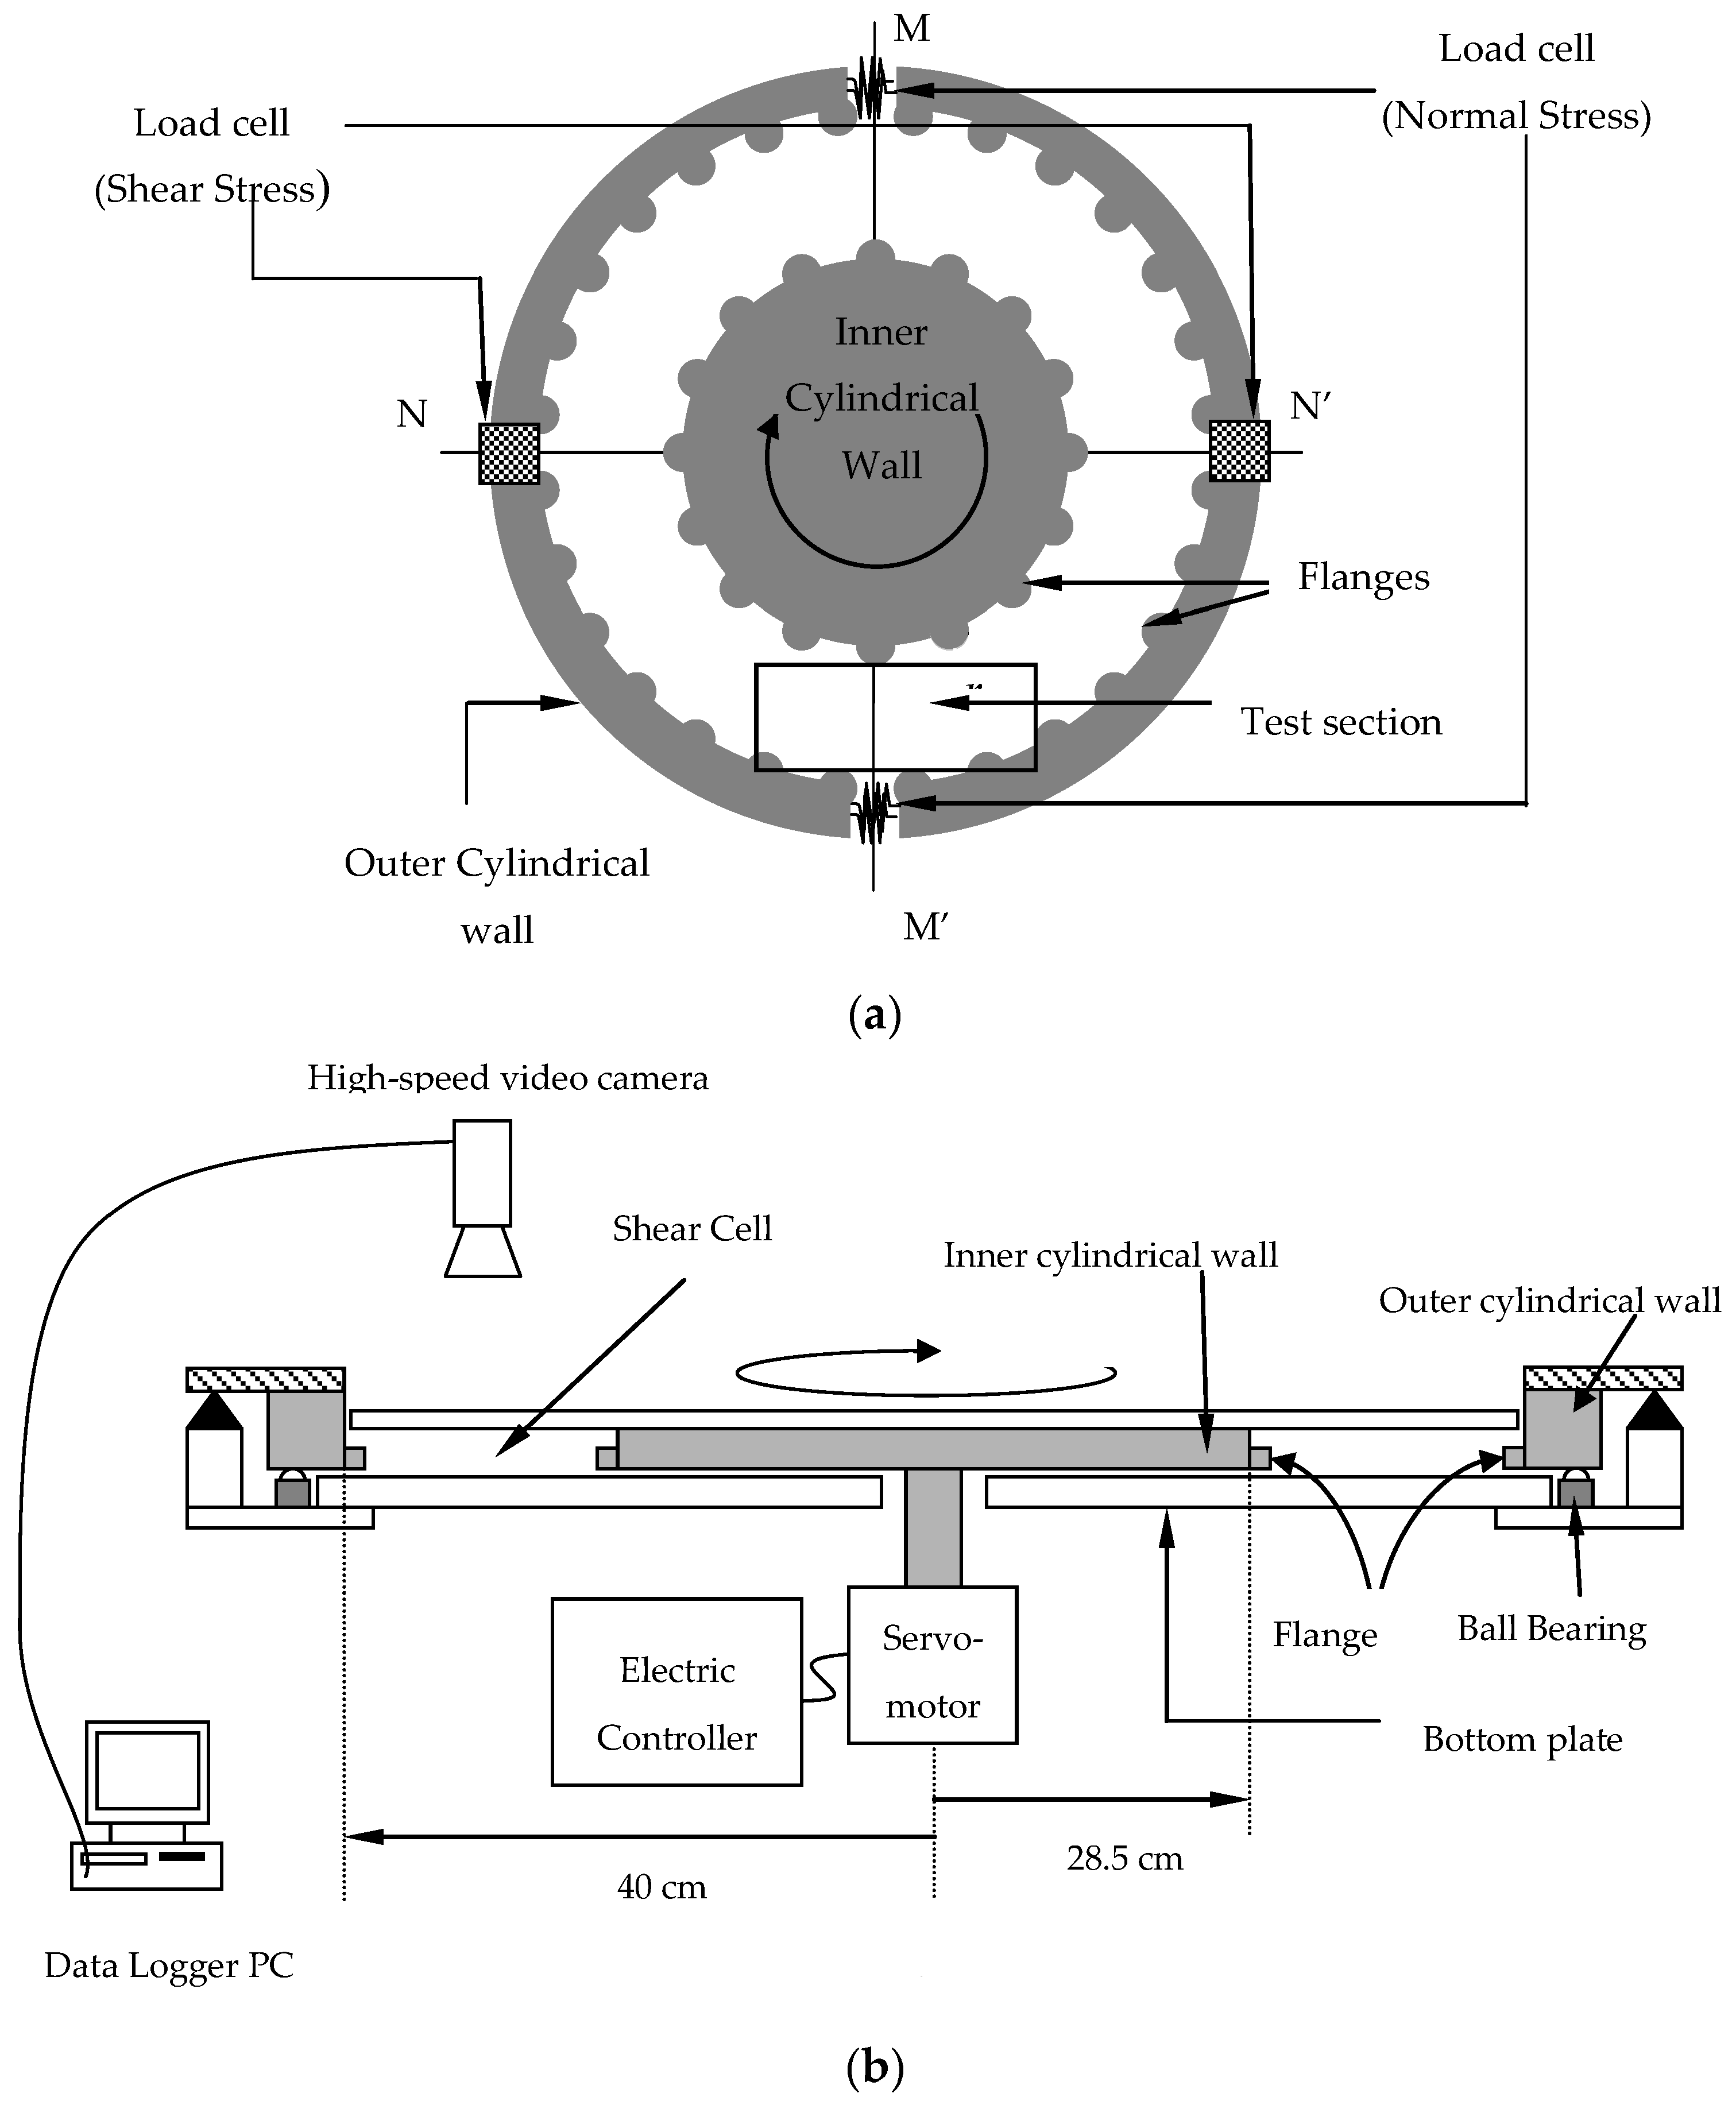
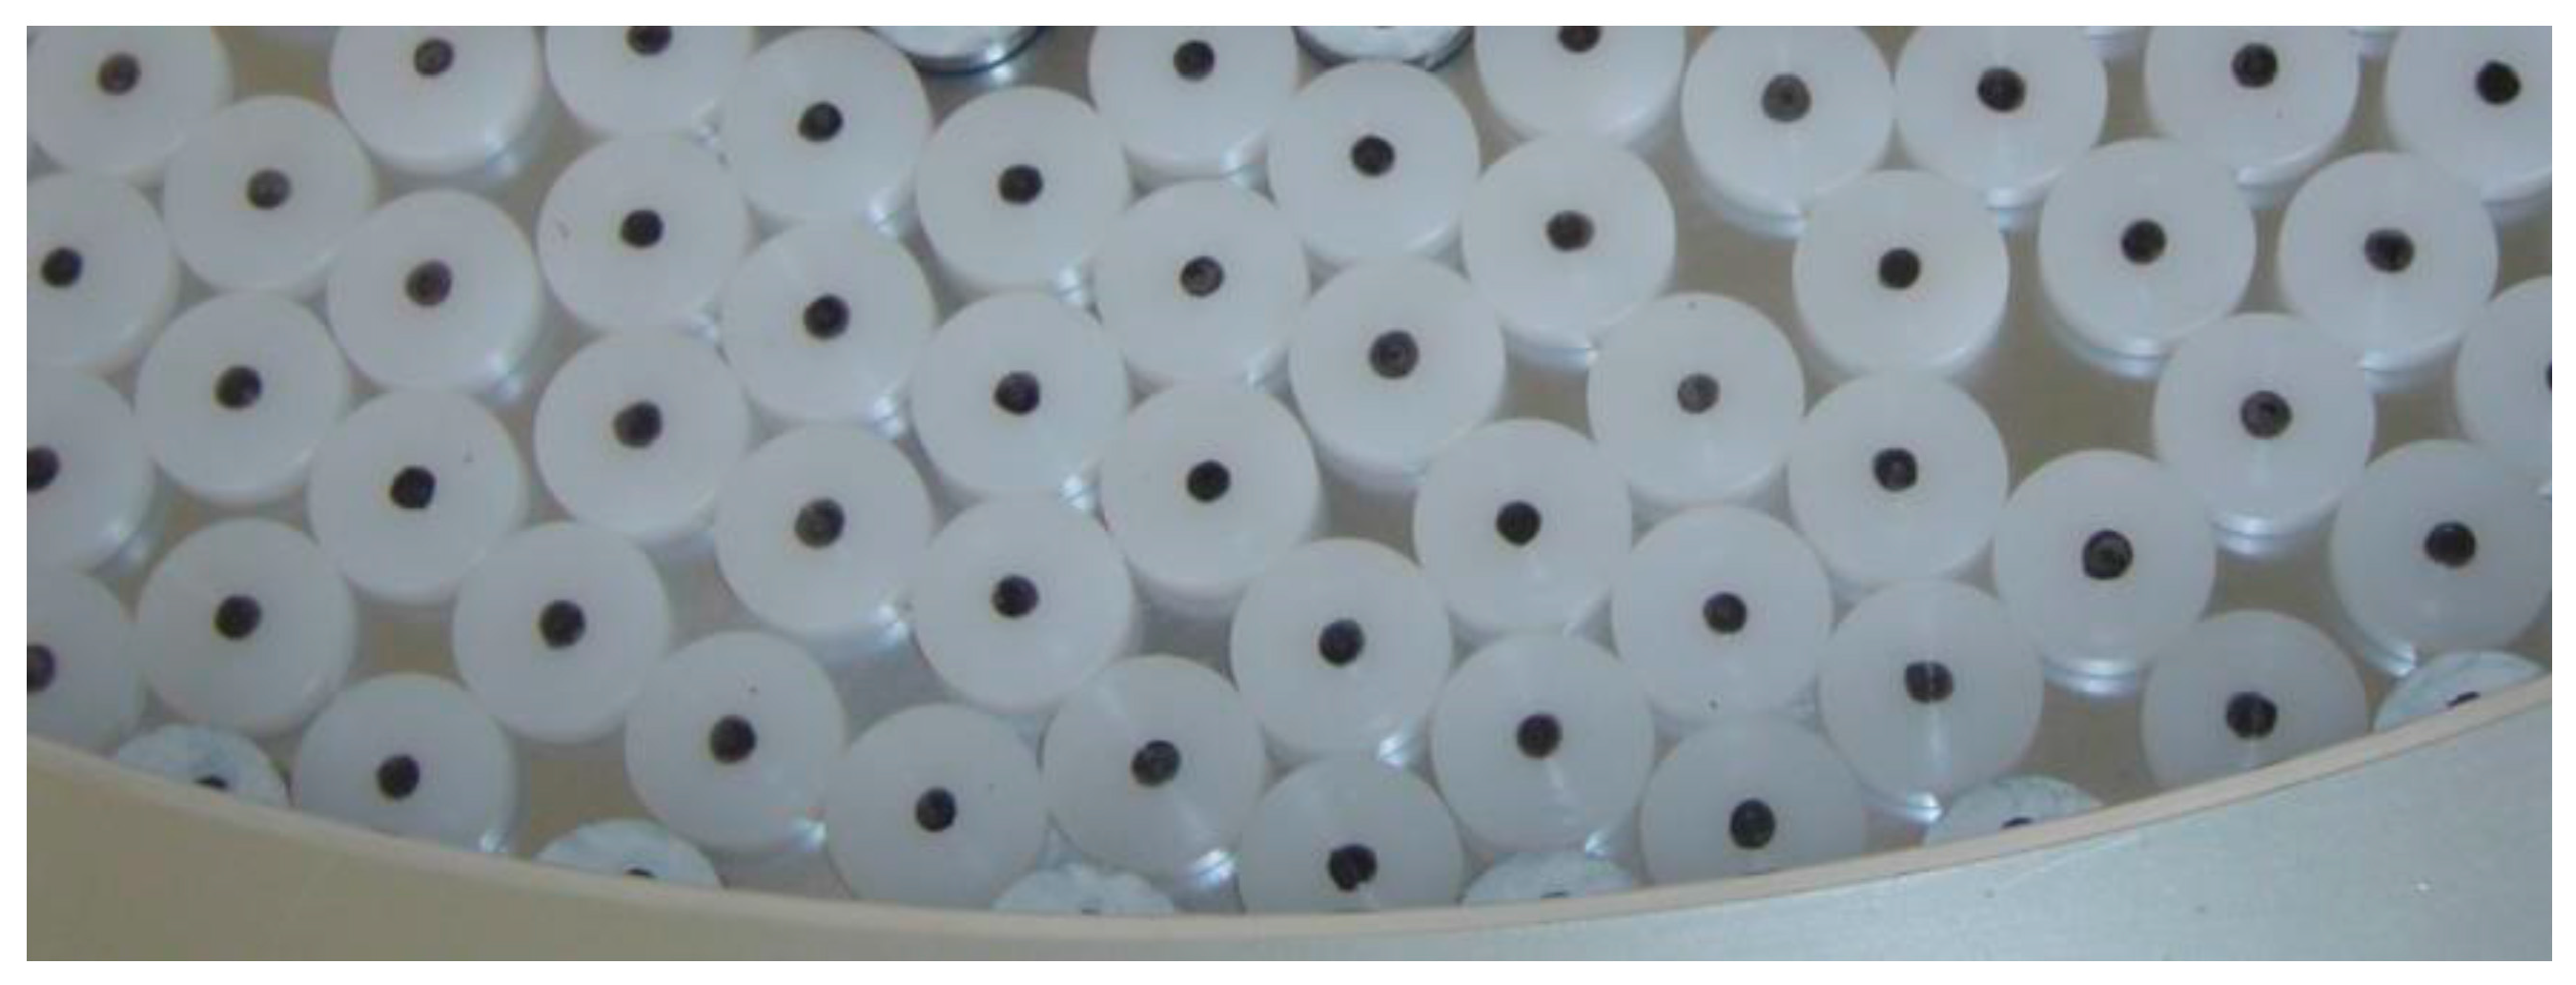
2.1. Shear Cell and Particles

Experimental set up consists of three components: apparatus to generate shear flow, setup to capture the video and the apparatus to record the generated stress. The effectiveness of the shear flow apparatus that was used in this study had been tested by previous researchers [17,18,19,20,21]. This apparatus can generate two-dimensional flow that has capacity and can measure the generated normal and shear stresses at the same time, for which the outer wall is divided along MM’ and NN’ respectively and the load cells are installed (Figure 1a). The effectiveness of the setup is increased with the application of high speed video camera instead of simple video camera used by Iwashita et al. [17]. The shear flow apparatus consists of an inner movable wall and the outer stationary wall that rest on the bottom horizontal plate (Figure 1). Apparatus details and its capacity are given in Table 1.
The radius of the inner wall is 28.5 cm and that of the outer wall is 40 cm. The spacing between the outer and the inner wall, called shear cell, is 11.5 cm which is equivalent to five particle diameters, and the distance between the upper and lower plates is 8 mm, which is somewhat larger than the particle thickness. The inner and outer walls both are roughened by gluing the circular flanges of same radius as the particles so that they become part of the shear flow as well. The outer wall is placed on a horizontal steel plate through several ball bearings to minimize the friction between them. The velocity of inner wall can be freely controlled by changing the speed of DC Motor joined with it.
Uniformly sized plastic disks with diameter of 2.3 cm and marked at the center were used in the experiment to permit evaluating spatial coordinates of the particle. Friction reducing silicone spray was used in the experiments to reduce friction between particles and the shear cell. In order to estimate the particle-particle friction coefficient, experiments were conducted by shearing the particles on the floor made of same material as the particle, and their movement is tracked in particle tracking software so as to get the tangential force given by the product of mass and acceleration averaged over time for several particles. Only the difference in the experiment for finding particle-floor friction co-efficient is that the actual floor of the shear cell (steel plate) is used to shear the particles instead of the floor of same material as the particle. The value of co-efficient of friction is then estimated by the ratio of tangential force on the surface to the normal force (i.e., weight of the particle). The coefficient of friction between the particles and the shear cell floor is estimated about 0.30, whereas that between particle and particle is 0.265 (Table 2).
To find the restitution co-efficient, the method of comparing the pre- and post-collision velocities of the particles was followed [22,23]. For this purpose, particles were sheared in the shear cell and the colliding pairs were observed in the particle tracking software. The pre- and post-collision velocities of those particles at the inspected time steps were calculated using the position data of the center of particles. The restitution co-efficient is then estimated by taking an average of the ratio of the relative velocities of those colliding particles along the line joining the centres after collision with that before collision [22] for several colliding particles. The advantage of the experimental shear cell and other accessories used in this study is that particle movement can be tracked, and the collided particles and contact durations can be visually observed with reasonable accuracy. In this paper, the mean normalized solid fraction, ν * is used primarily while relating particle concentration to other micro and macro-mechanical properties instead of the solid fraction, ν . The maximum possible solid fraction v max permitted by the disk particles’ geometry is initially estimated ( v max = 0.80) by packing the particles to the highest possible limit. It is defined as the ratio of the area of the maximum number of particles which can occupy the shear cell to the total area of the shear cell. The normalized solid fraction ν * is then estimated as the ratio of the solid fraction ν to the maximum possible solid fraction v max as given in Equation (1).
ν * = v v max
The normalized solid fraction analyzed in this study ranges from 0.50 to 0.85, which corresponds to a solid fraction of 0.40 to 0.68. The shear rate, γ ˙ = V w / H (defined as the inner wall velocity V w divided by the shear cell height H ), is changed by varying the velocity of the inner wall. The shear rate is varied in the range of 14.8 s−1 to 34.6 s−1, which is the only possible range that could be effectively used with the current shear flow apparatus. The shear rate range analyzed in this study produces an effective average velocity of about 1 to 4 m·s−1 in the particle level. This is the real-life range of debris avalanches, high density debris flows, and grain flows [24].

2.2. Particle Tracking

The shear flow is given ample time to come to the stable state before the recording of digital video, which takes about 2 min after the initiation of shearing. The stable state is judged by observing that every particle has become part of the shear flow and the flow is homogeneous without stoppage at any moment. The stable shear flow is recorded by the high-speed video camera (FASTCAM-X 1280 PCI, Photron Ltd., Tokyo, Japan) which is connected with a frame grabber. The detail capacity of the high-speed video camera is given in Table 3. Each experimental run consisted of 2048 digital video frames at the precision of 1000 frames per second and the resolution of 1280 × 512 pixels. The digital video of each experimental run captured by the FASTCAM-X 1280 PCI is transferred to the Dipp-Motion 2D motion analysis and particle tracking software produced by DITECT Co., Ltd. (Tokyo, Japan). A picture of the shear cell along with the plastic disk particles in the test section is shown in Figure 2. The particle tracking software determines the coordinates of the particles’ centers, marked in black. It first recognizes a black circular geometric shape in the image and looks for the closest matching shape to track in the following time steps. To achieve the maximum possible contrast between the floor of the shear cell and the particles, white colored plastic disks were used. The black circular marks in the center of the particles create the highest possible contrast, and the software can follow the circular mark even if the particle undergoes rotation.
The particle-tracking methodology is such that it records the coordinates ( x 1 i , y 1 i ) of the i-th particle from frame 1 and maps them to frame 2, where their new coordinates are recorded as ( x 2 i , y 2 i ), and so on. After tracking the positions of this particle for all the time frames, the next particle is tracked in a similar fashion. After making necessary adjustments in the software and applying a conversion factor to calculate physical coordinates from pixels as given in Table 3, the spatial coordinates of the center of each particle at each frame are obtained. Other parameters, including the velocity vectors and collision time are determined using these spatial coordinates.

2.3. Algorithms to Find Contact Properties

2.3.1. Collision-Detection Algorithm

Different researchers have used the image processing techniques to find the positions and velocities of particles by direct imaging the experimental run and tracking their movement [14,16,19,20,25]. Based on these positions, the collisions can be detected. Collision-detection algorithms in the past applied only the distance between particles to find the potential contacts [26,27,28]. McNamara and Young [29] used free path cut off (LC) model to find the contacts in the presence of multiple particle contacts where preventing the dissipation of contact potential energy is essential. This model considers that if the particles are in contact with each other, their distance is below a certain cut off length, λc. However, this type of model which considers only the distance between particles as criterion to identify collision is not sufficient when we want to use it in the physical experiment. This is because the experimental apparatus and the accessories used often have limitations especially when particle scale information is required, and only one criterion might not be accurate. The methodology followed in [19] is slightly modified to detect collisions and to find contact durations. The methodology described in [20] is followed where the applicability of the collision detection and contact detection methodologies have been discussed. This method utilized the distance between the particles, velocity direction changes and the velocity magnitude changes as the velocity magnitude and directions can also be changed after collision because of the momentum transfer. The algorithm to detect collisions has three major components: finding potential candidates of collision, detecting collision partners, and checking the continuity of contacts. The criteria of changes in velocity vectors sorts out potential candidates of collision, and the criteria of distance between particle centers confirms the collision partners (Appendix A). Once collision is detected, relative velocity of collision partners and the distance between their centers in the next time step is considered to check whether contact is lost or continues.
To find potential candidates of collision, velocity vectors are first calculated using the spatial coordinates of the centers of the particles obtained from the particle tracking method. Potential candidates of collision are those particles for which velocity magnitude change Δ V is greater than a threshold velocity ε v , or direction change Δ ψ is greater than a threshold angle ε ψ when compared between two successive time steps. The magnitude of ε v and ε ψ are optimized for the sparse and dense cases (Table 4) based on observations of post collision velocity from several test experiments so that no potential partners are left unnoticed.
After detecting potential candidates of collision, the collision partners at any time step are confirmed by checking the distance d i j between each of the potential collision candidates at the same time step. If the difference of the distance between the potential collision candidates d i j and the particle diameter d is less than threshold distance ε d , they are considered collision partners. The magnitude of ε d is optimized for different concentrations based on observations from several test experiments and by considering the temporal resolution of position data. To know the status of collision partners in the next time step, the relative velocity along their contact normal directions, defined by the dot product of the relative velocity vector V i j and the unit normal vector n i j is checked at this time step. The dot product greater than zero implies that the particles move away from each other, and the contact is lost at this time step. For the particles to be in continuous contact, relative velocity along the contact normal direction should vanish or should be negative. For the pairs with negative or zero relative velocity, if the distance between their centers is within the limit of the threshold distance ε d defined before, the contact should be still continuing; otherwise the contact should have been lost at this time step. This process continues until the pair separates. Same methodology is repeated for all the pairs in the shear flow at each time step. Only the collisions that could be missed from this method is the possibility when both the velocity direction and velocity magnitude change after collision are very small.

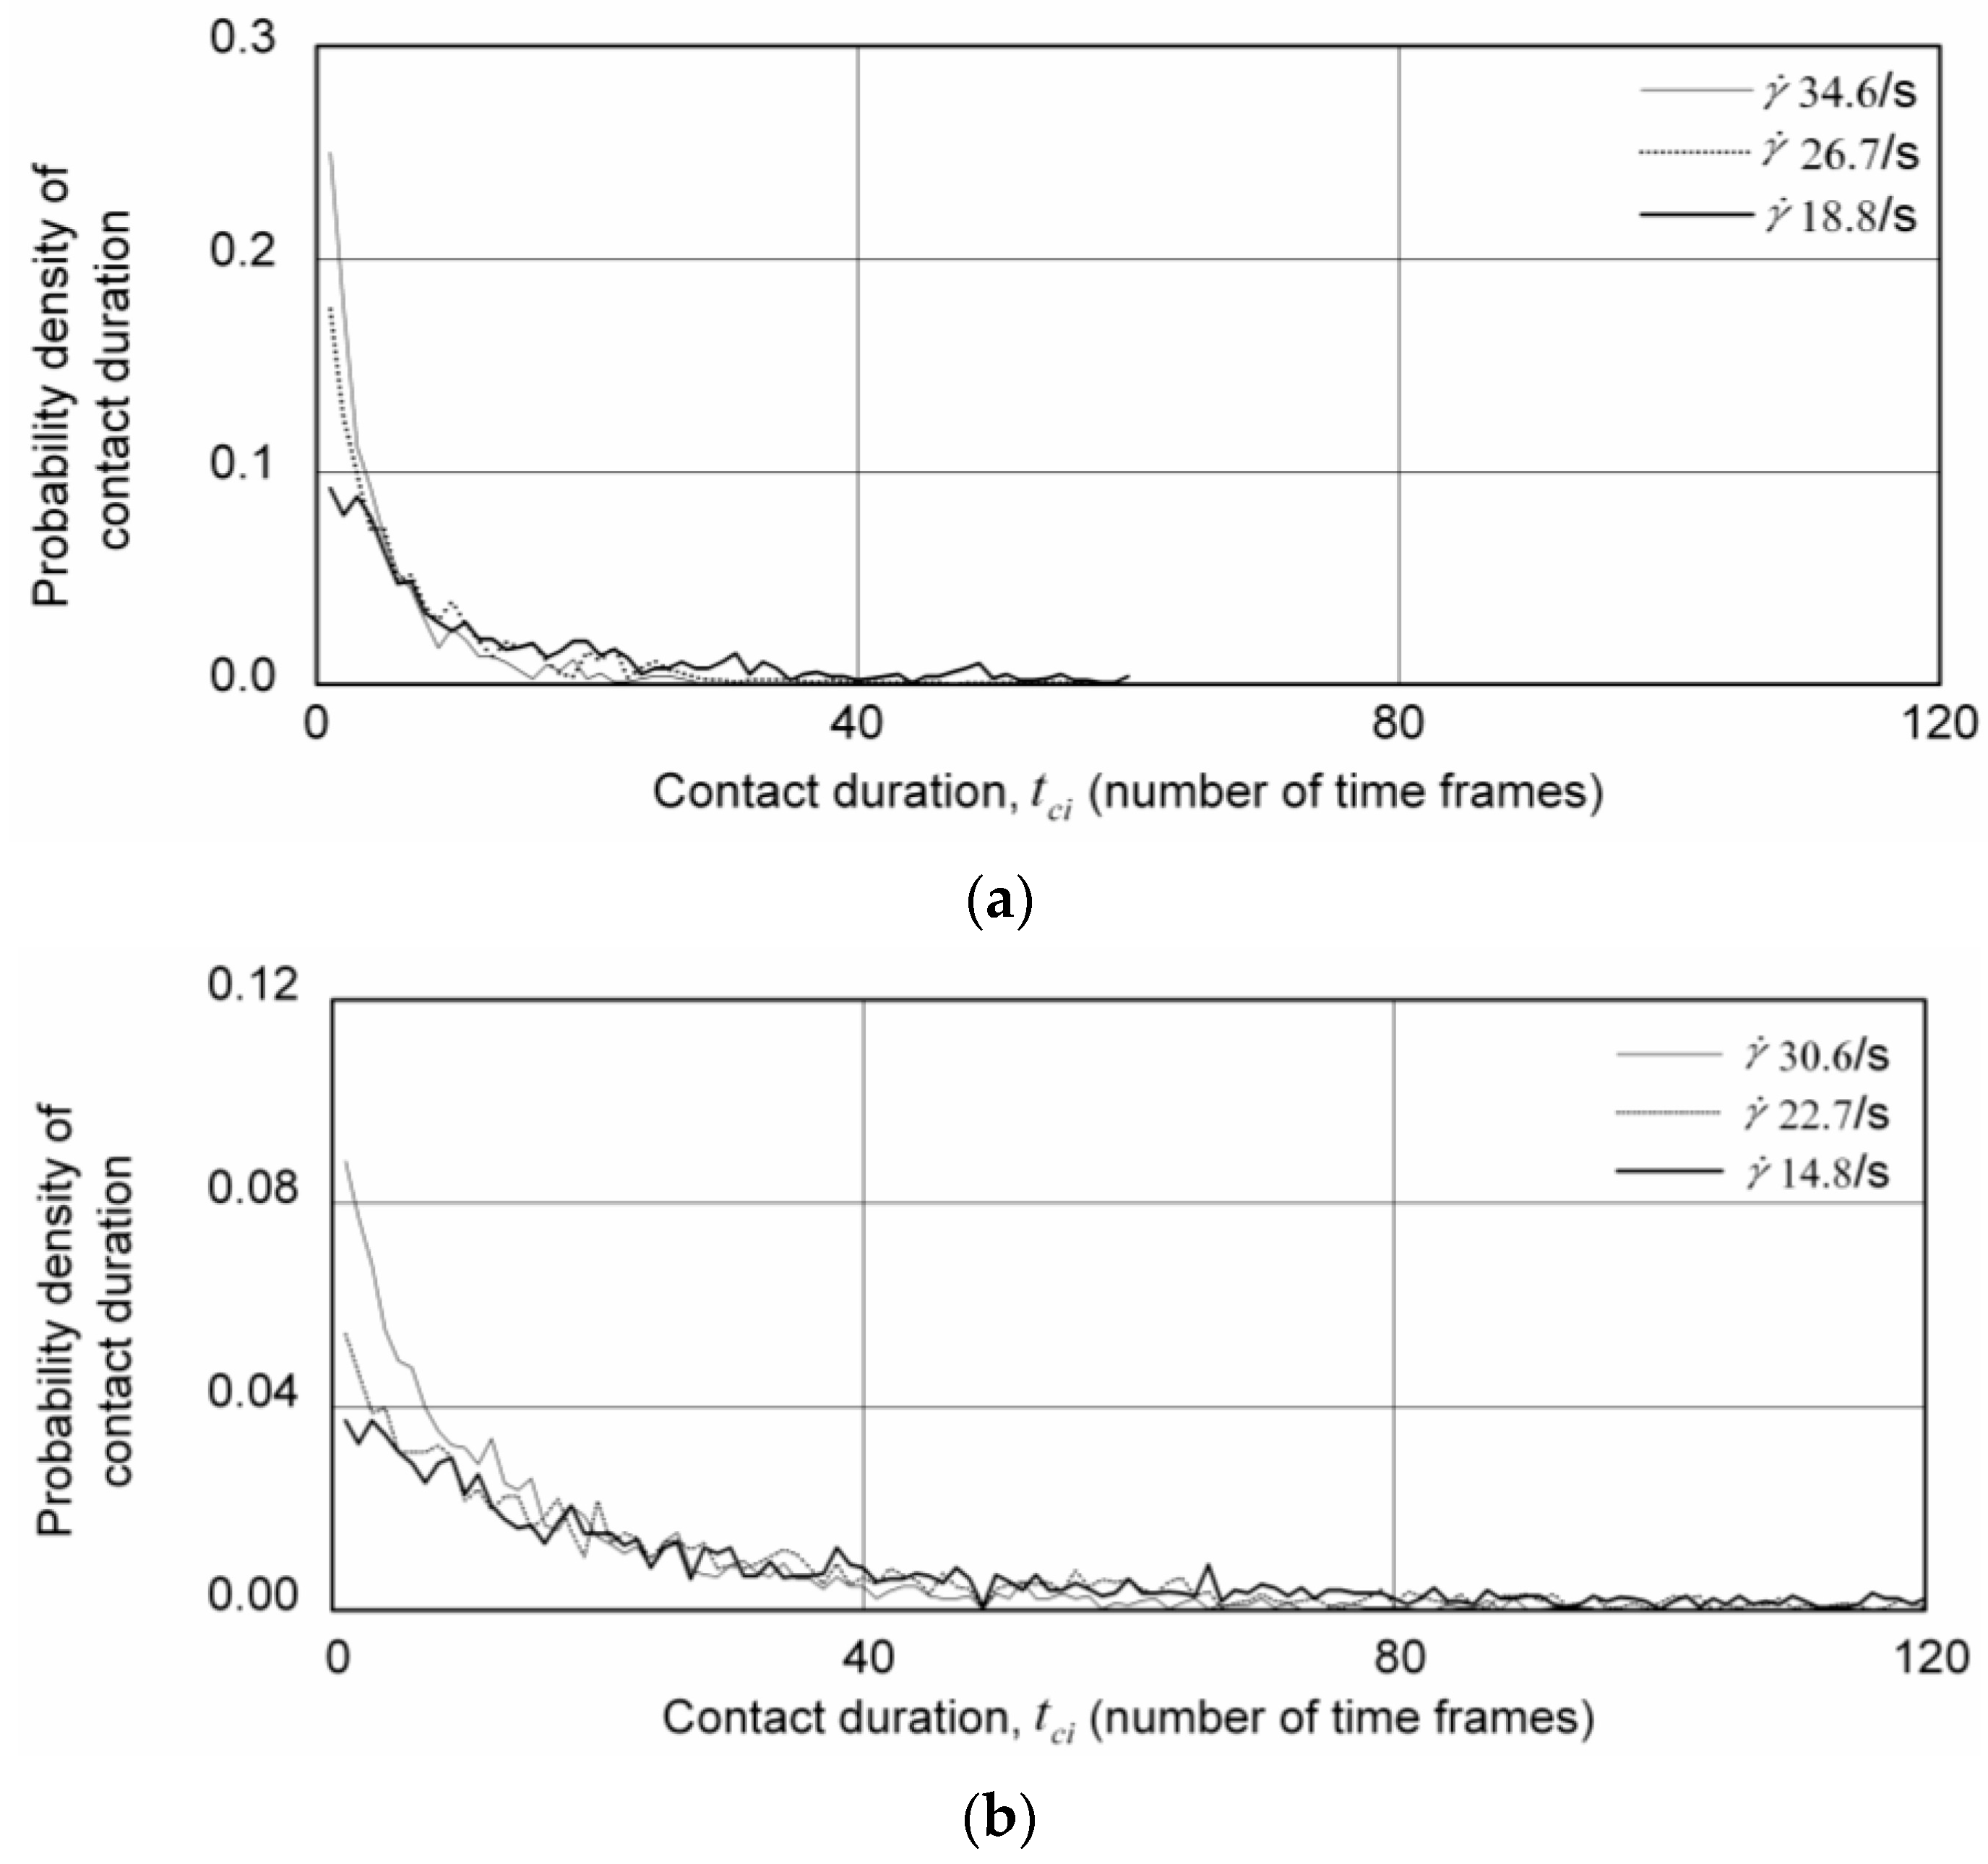
2.3.2. Contact Duration

Contact duration is defined as the duration of encounter or total duration for which particles move together since their first encounter. The record of the time of first collision and that of separation is kept for all the collision pairs using the collision-detection algorithm (Appendix A). The difference between the separation time ( t e n d ) and the time of first collision ( t s t a r t ) gives the contact duration t c i of that particular pair (Equation (2)). The average contact duration of all the pairs in all the time frames calculated using Equation (3) gives the average contact duration t c of that particular flow.
t c i = ( t s t a r t t e n d )
t c = 1 N × i = 1 N t c i
where N is the total number of pairs counted for all the time frames under consideration.

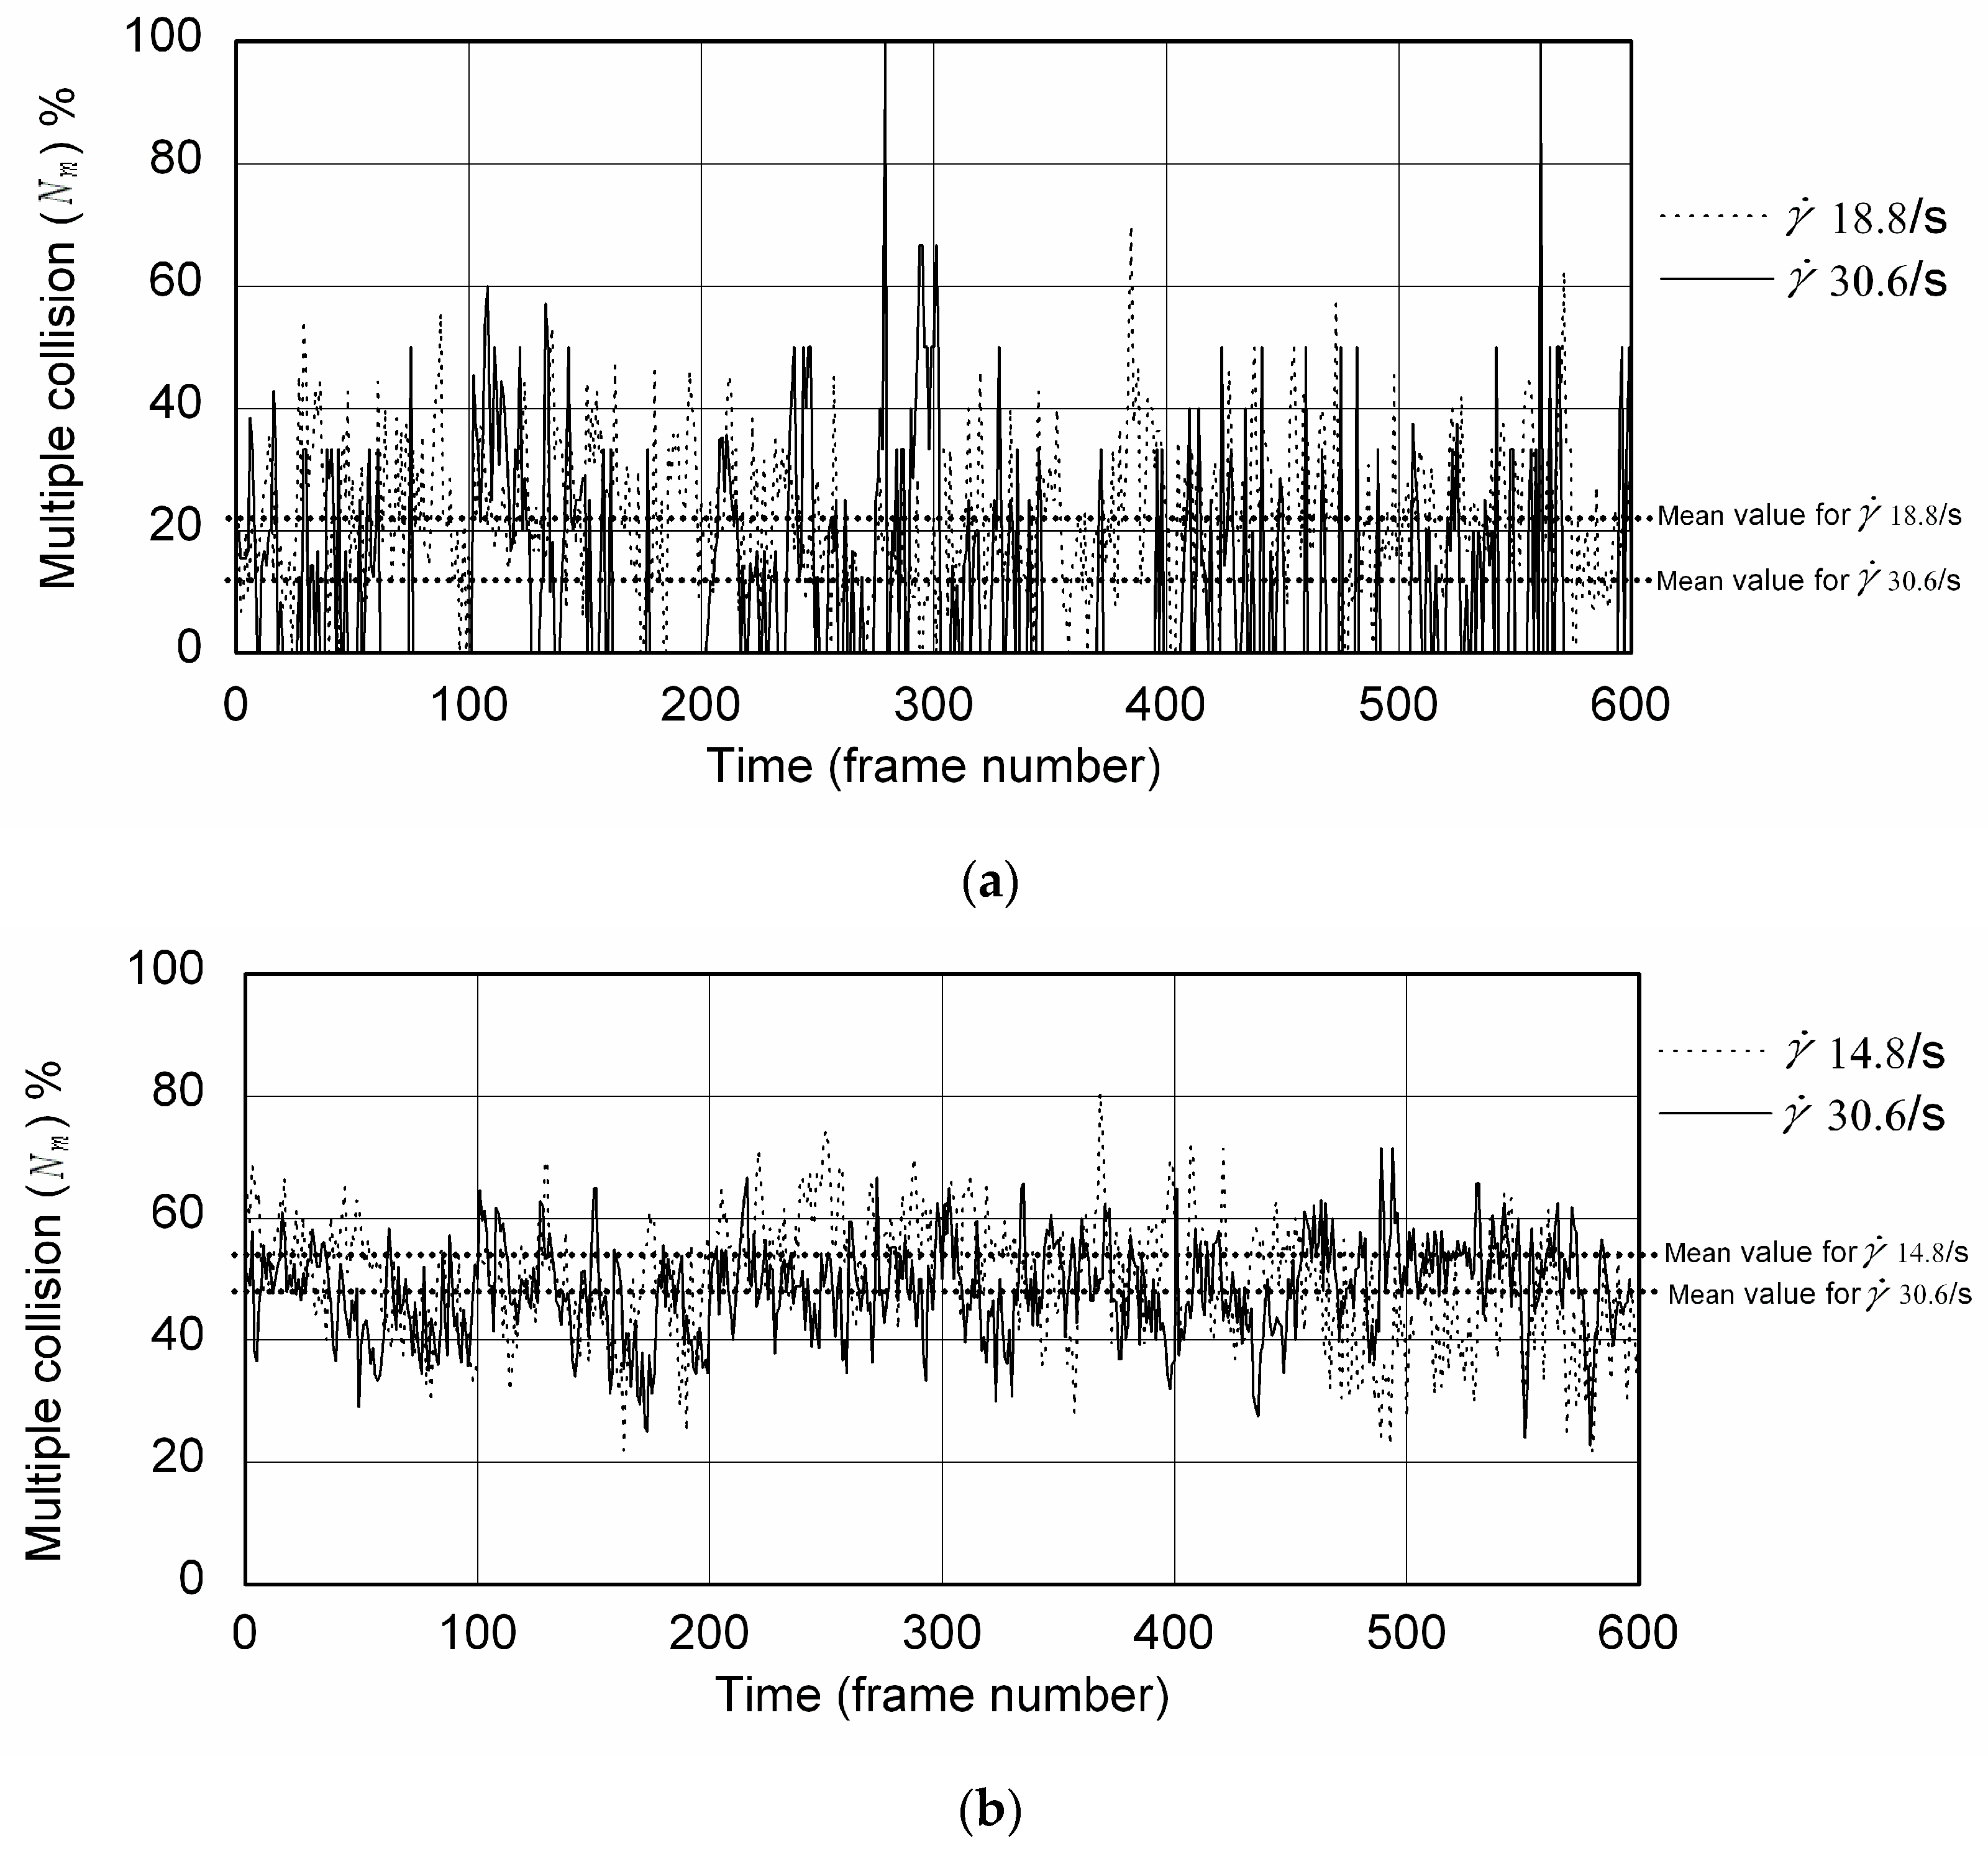
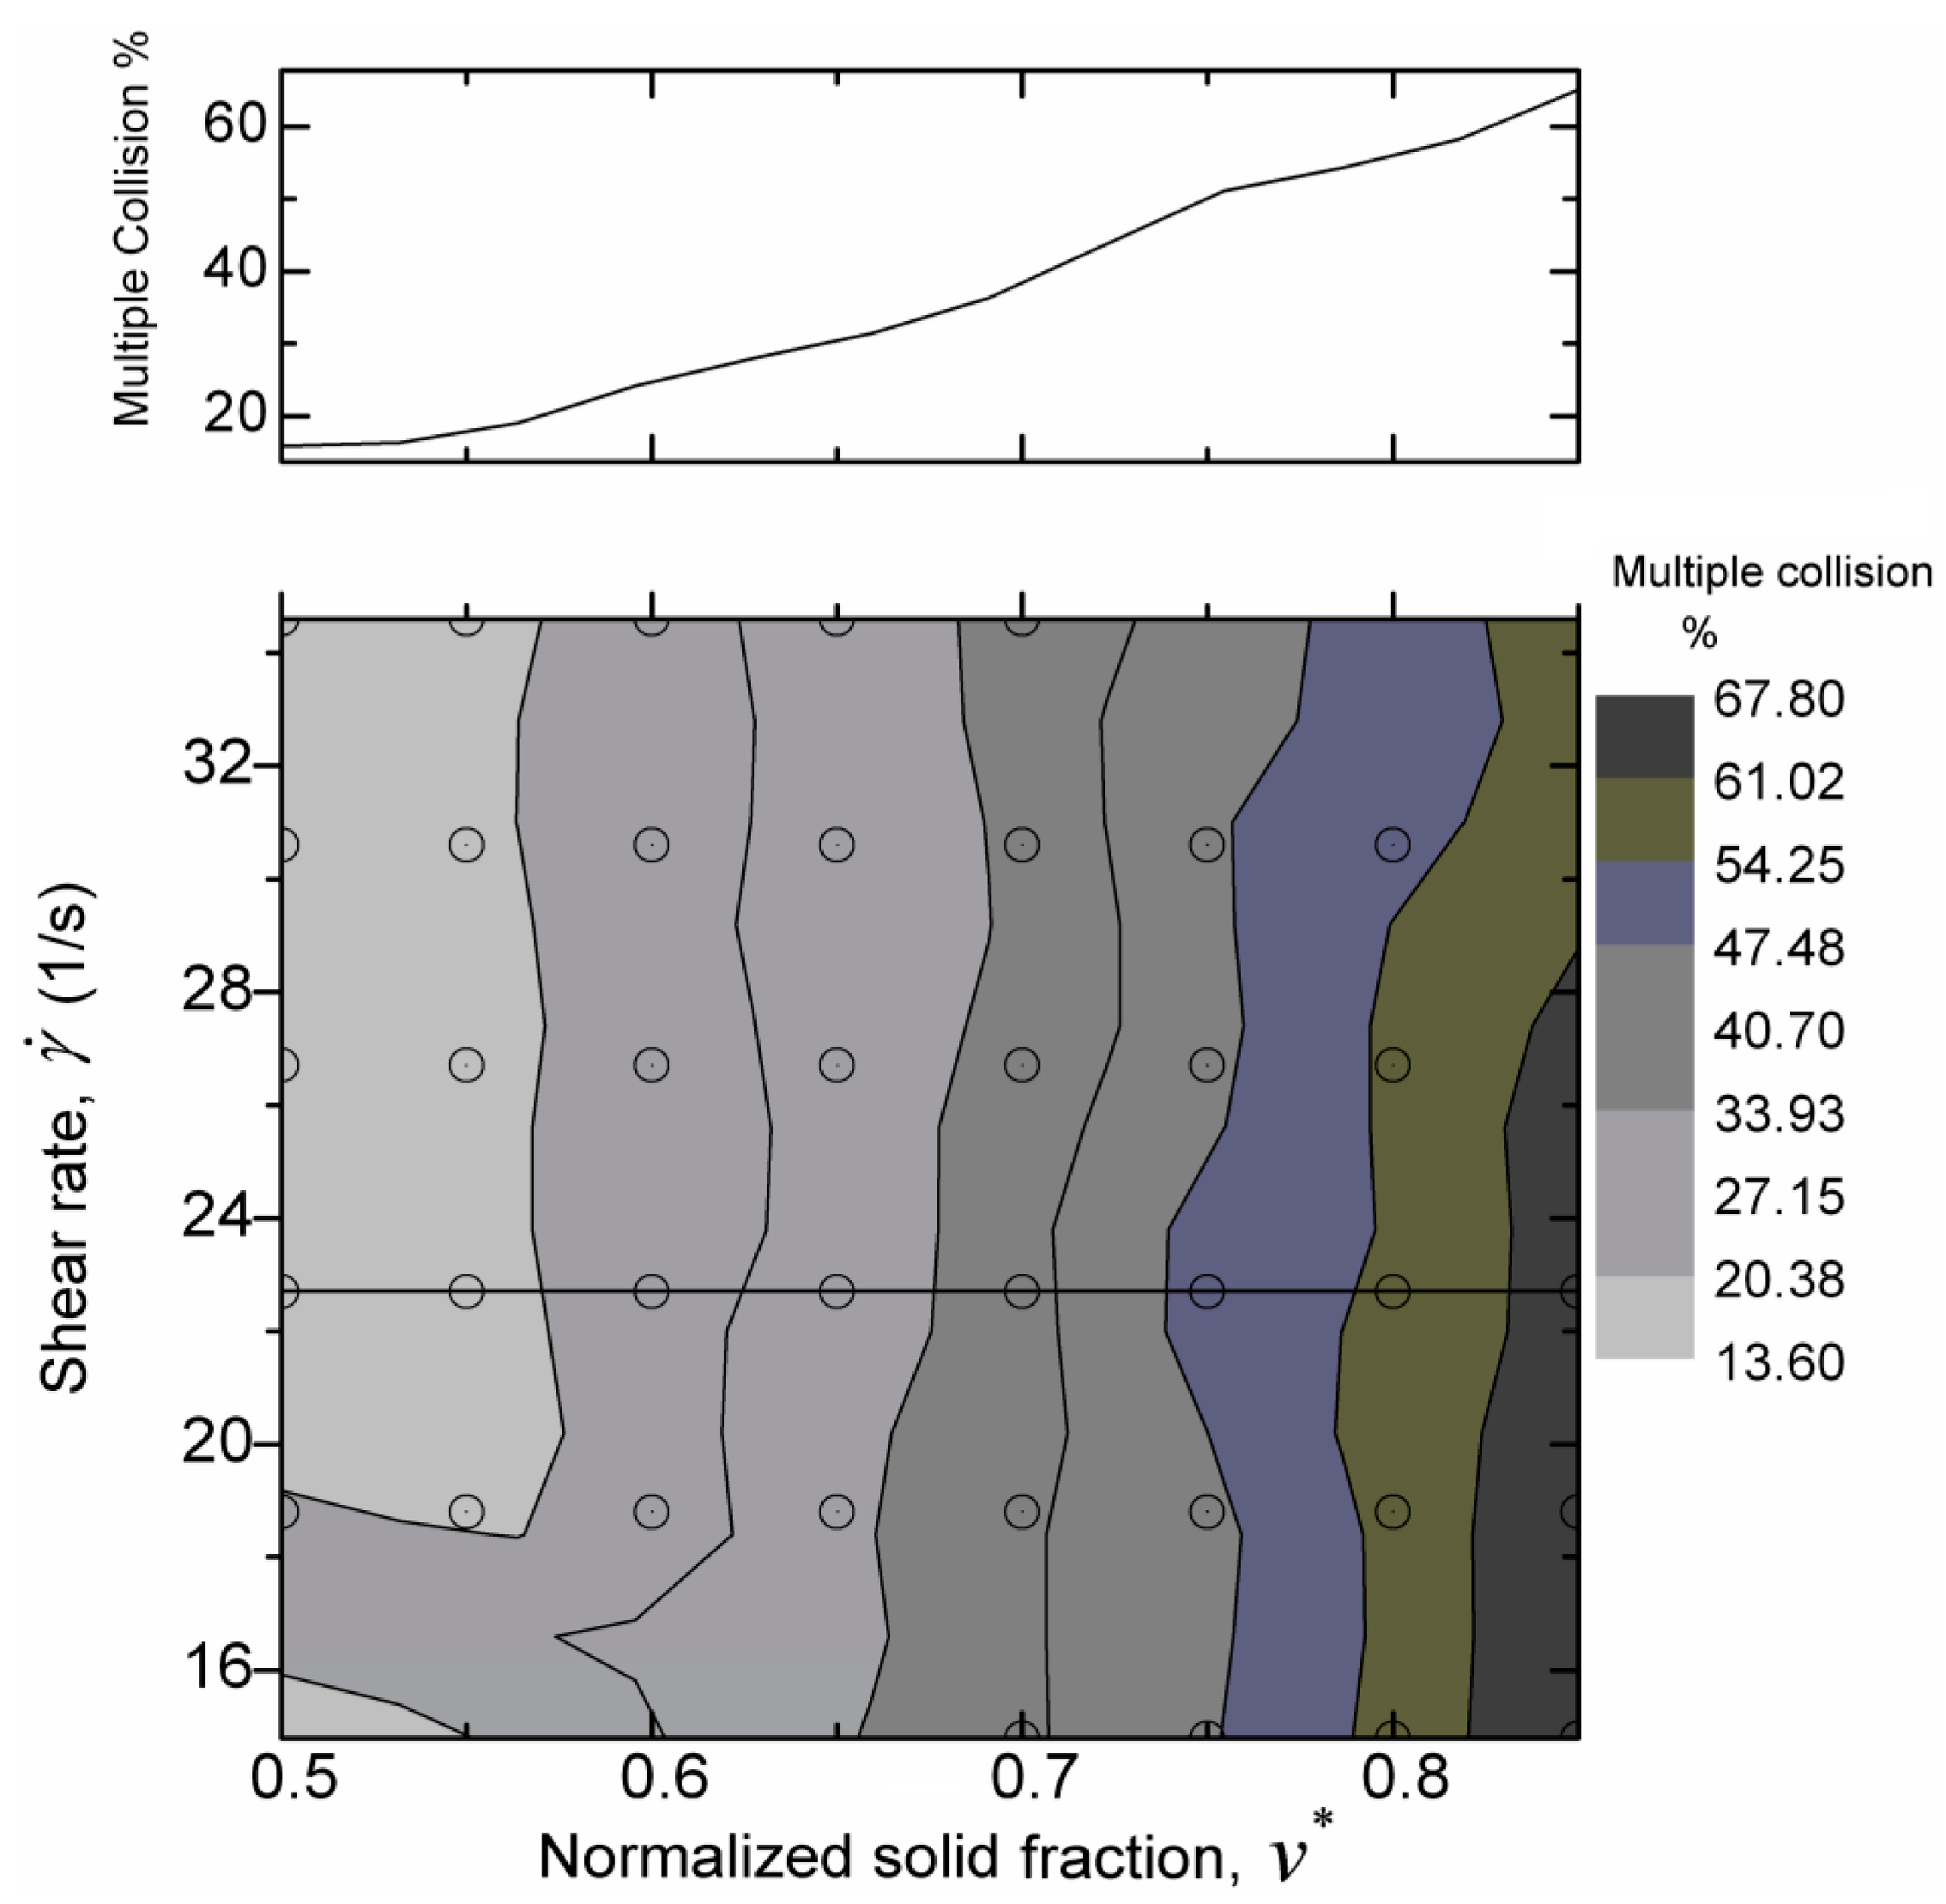
2.3.3. Multiple Collision Percentage
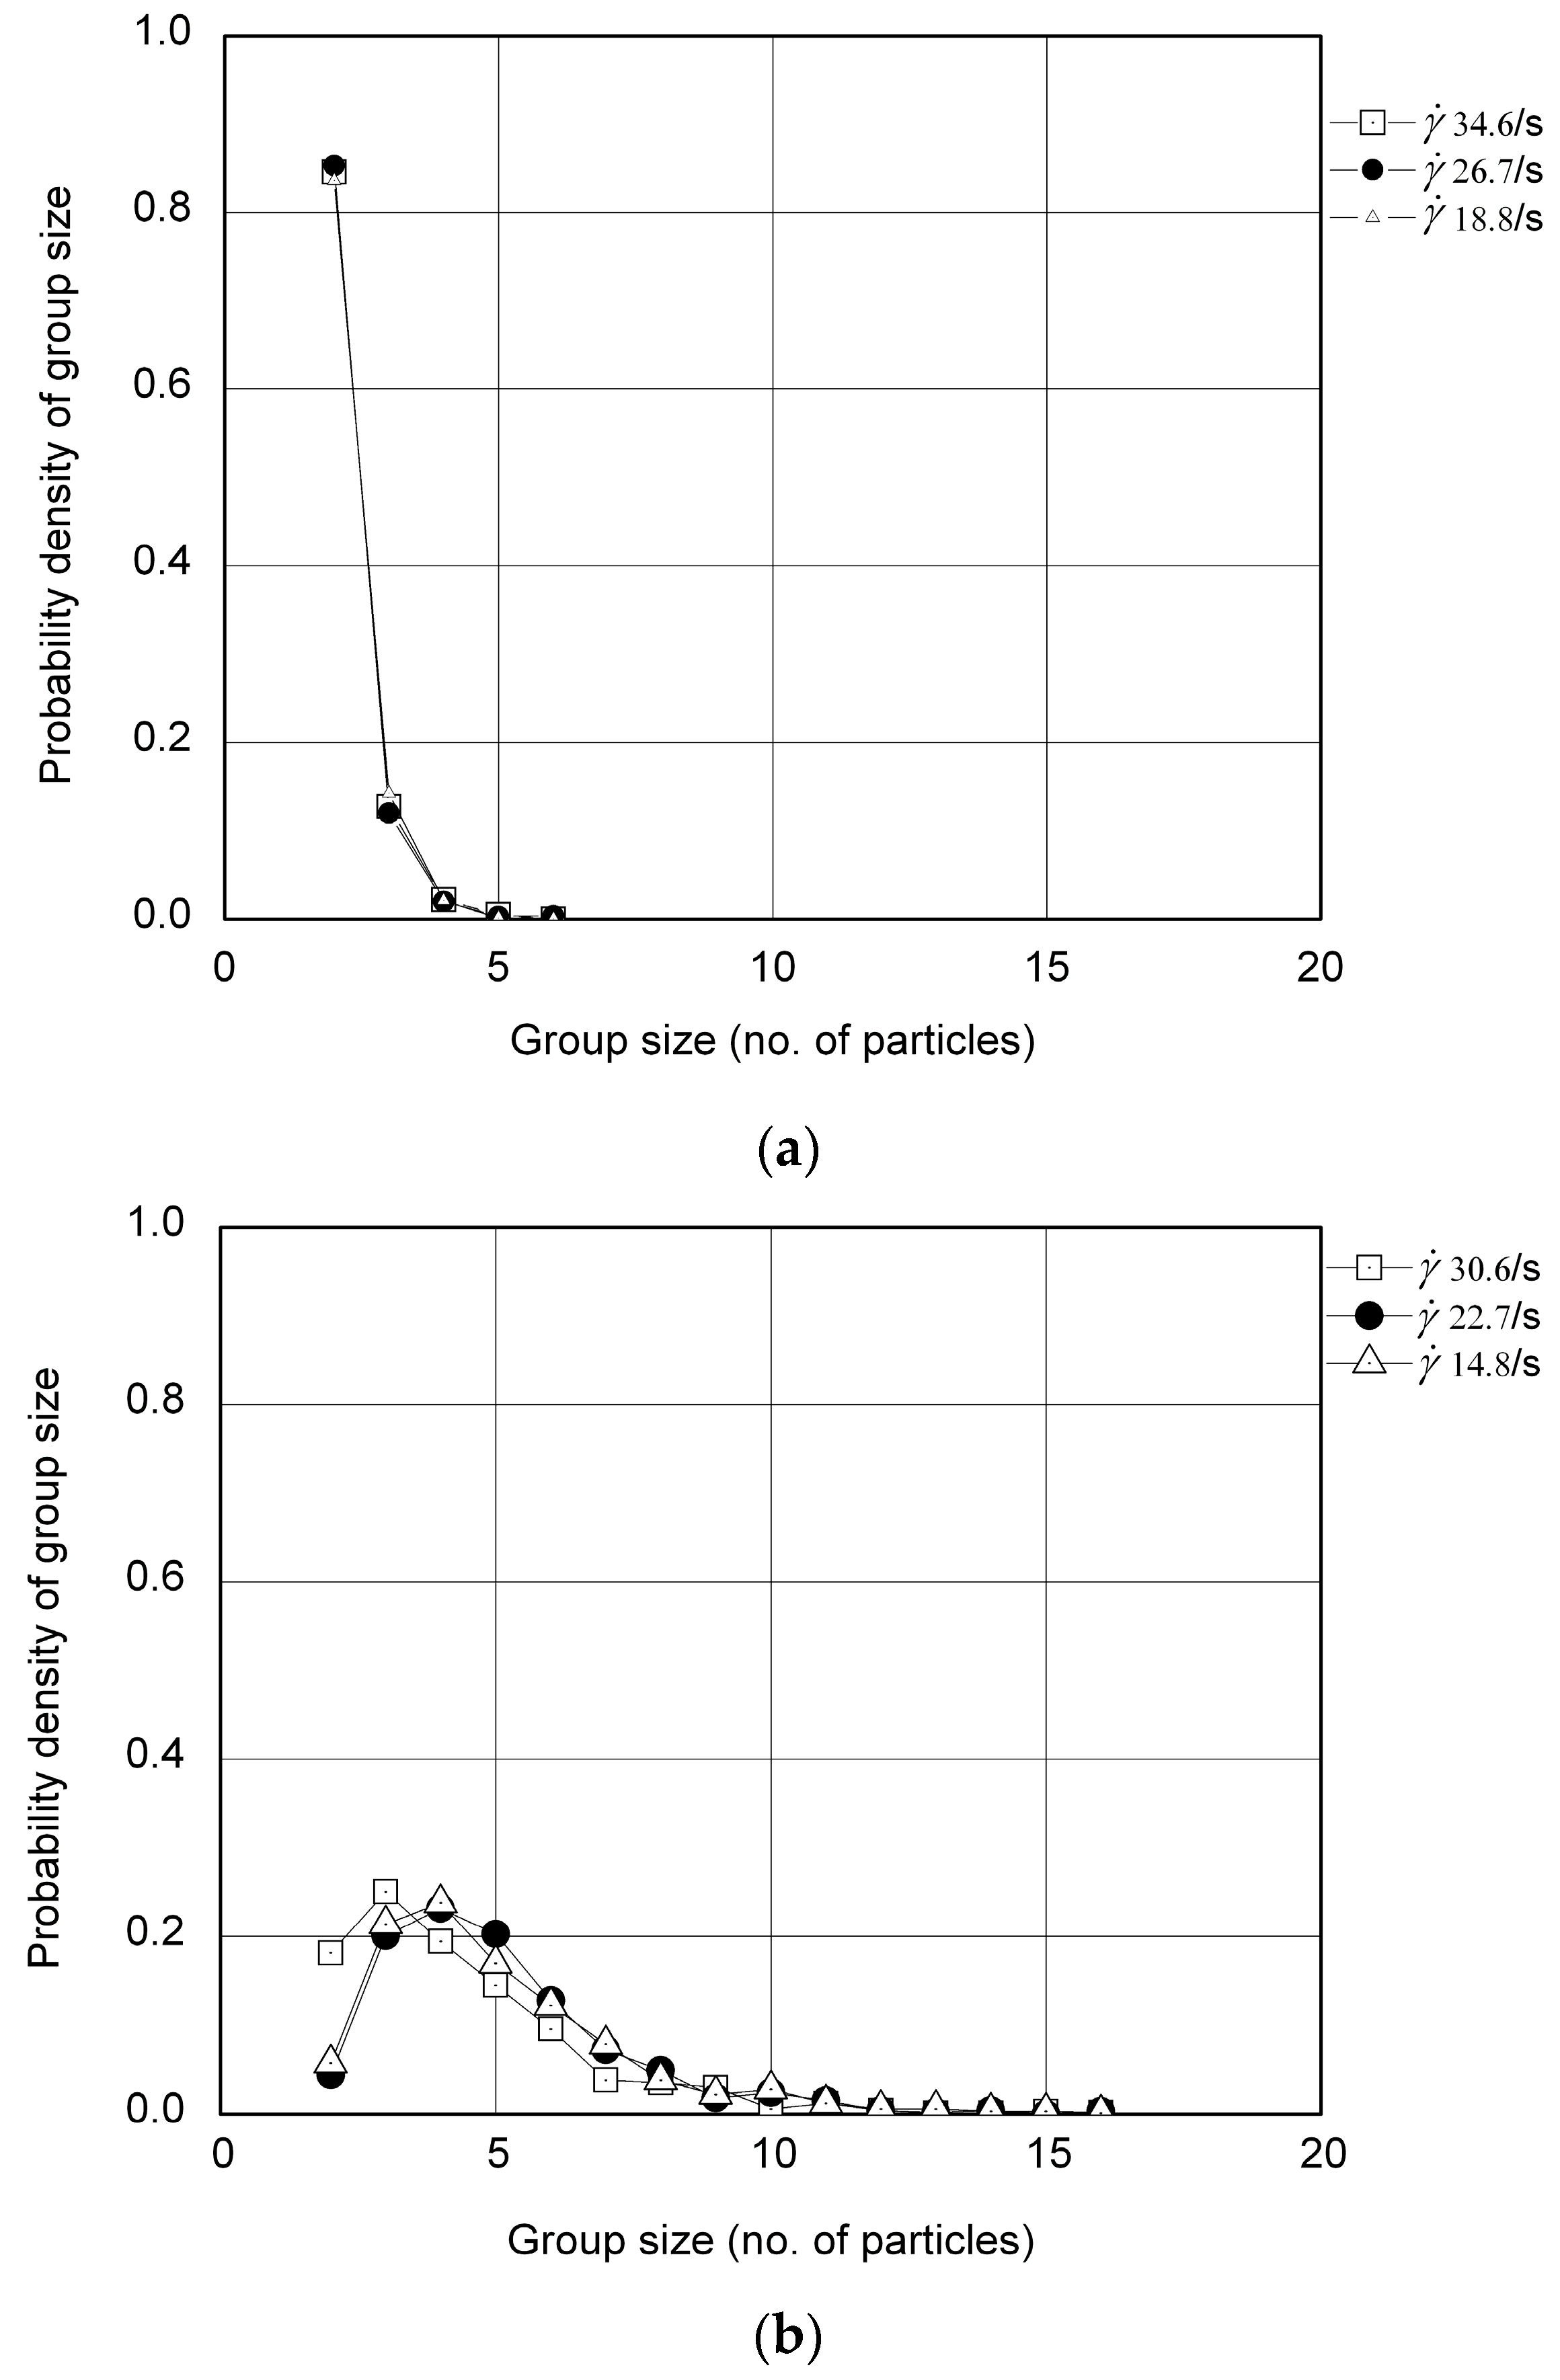
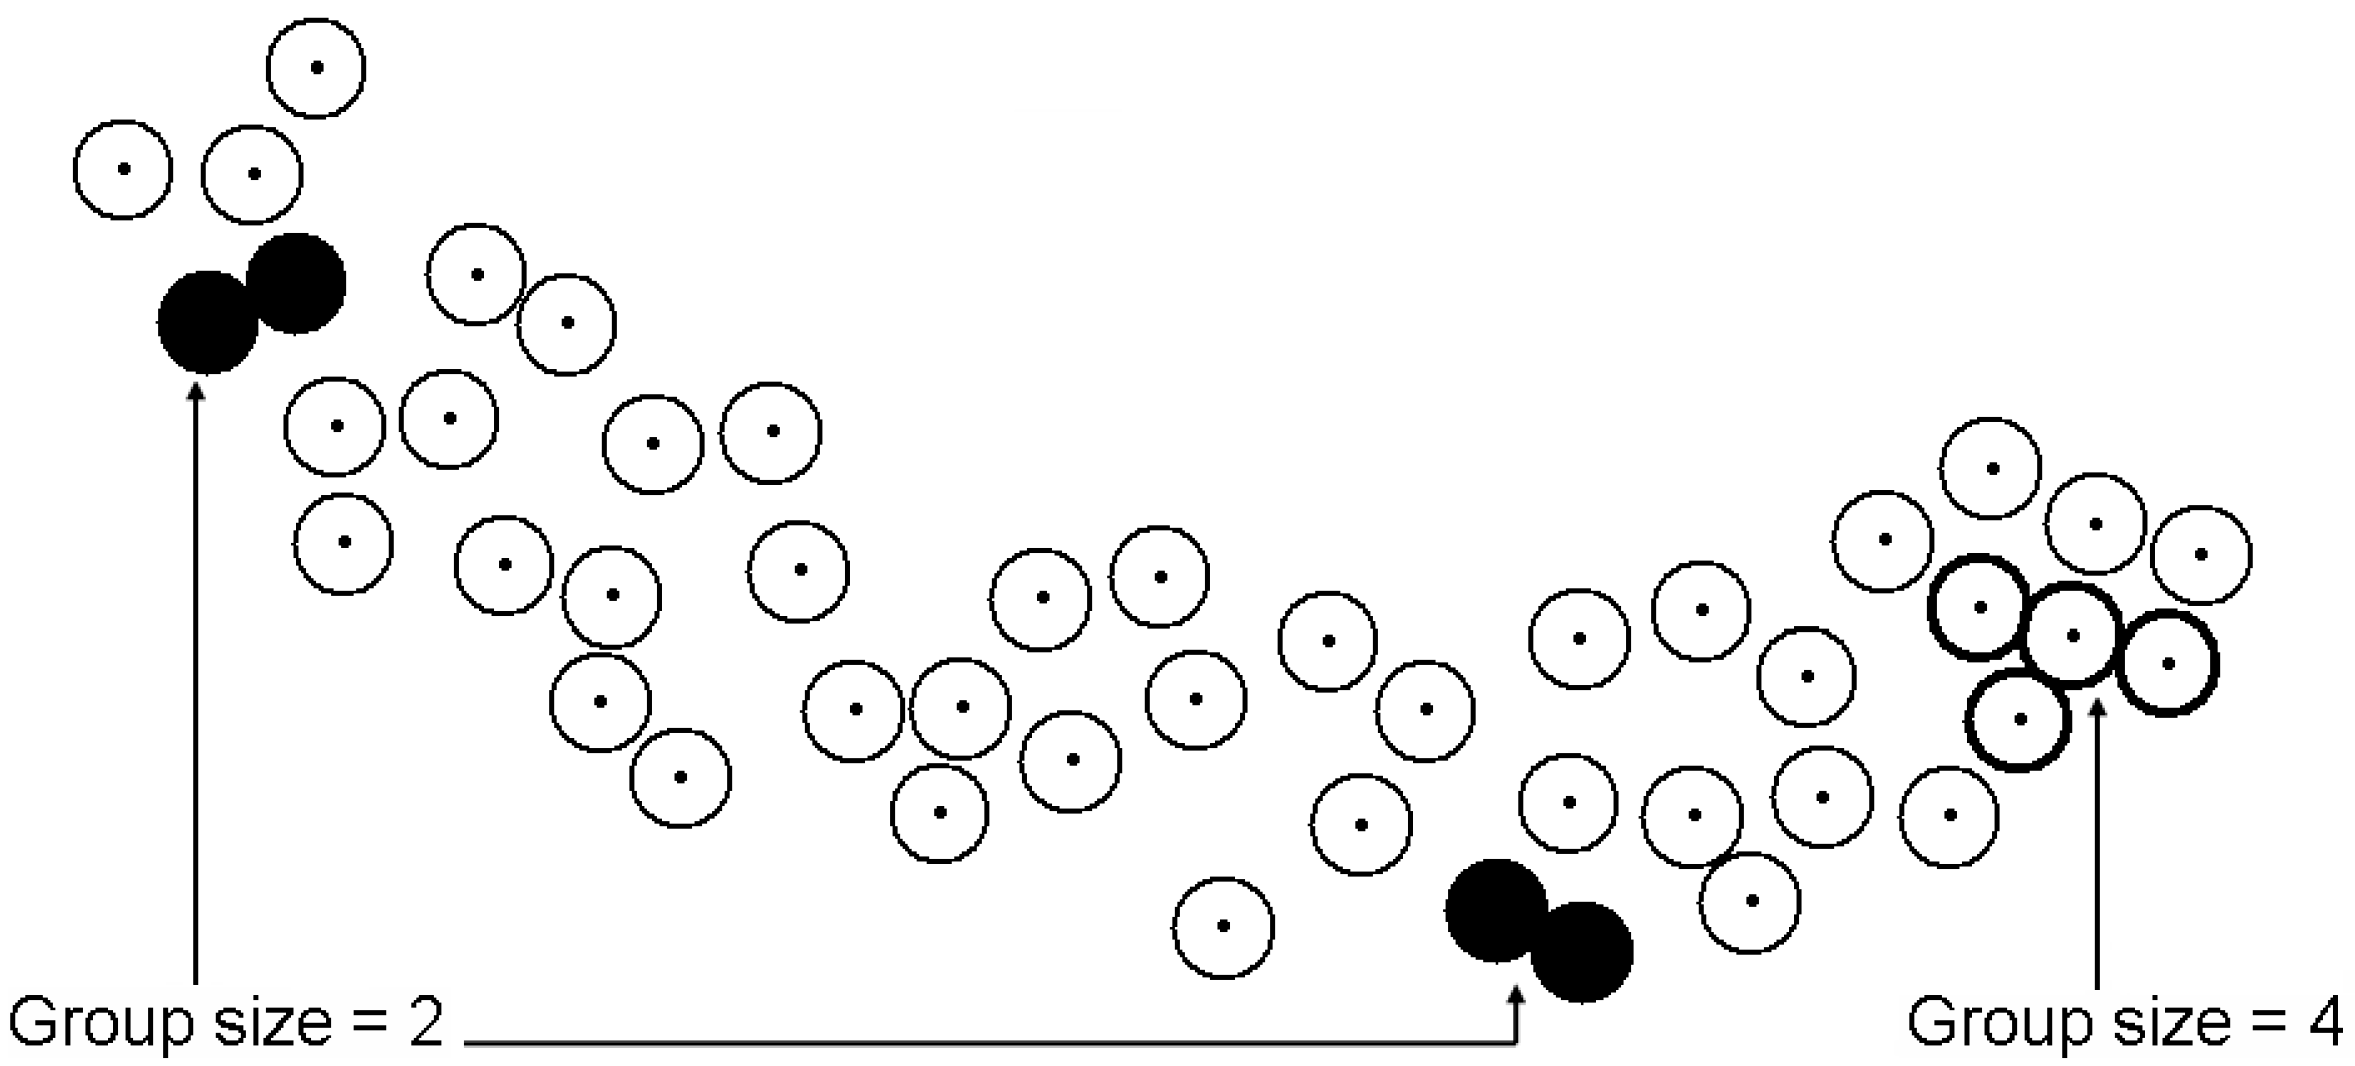
A multiple collision is defined as a collision between more than two particles at a particular time frame, in contrast to a binary collision, where a collision occurs between only two particles at a time. To determine the multiple collision percentage, the collision partners at each time frame are first determined using the collision detection method (Appendix A), and then those partners having more than one contact (multiple collision) are counted. The sums of total contacts and multiple collision contacts are determined separately for all the time frames. The multiple collision percentage N m at each time step is then determined using Equation (4).
N m = N m i N i × 100 %
where N i is the number of total contacts at each time step and N m i is the number of multiple collision contacts at each time step. The multiple collision percentage of the flow averaged over time N m ( a v g . ) is calculated using Equation (5).
N m ( a v g . ) = i = 1 n N m i N i × 100 %
where n is the total number of time frames under consideration.

2.3.4. Group Size

The group size is defined as the number of particles that are simultaneously in contact (Figure 3). Two distinct groups do not have any particles in contact with each other; however, all the particles that belong to the same group are connected via force networks.
The total number of particles involved in making all the groups in a particular time step divided by the number of groups at that particular time step gives the number averaged group size. The group with the maximum number of member particles throughout all the time steps gives the maximum group size. The group size averaged over all the time steps gives the average group size of the flow.

3. Experimental Results

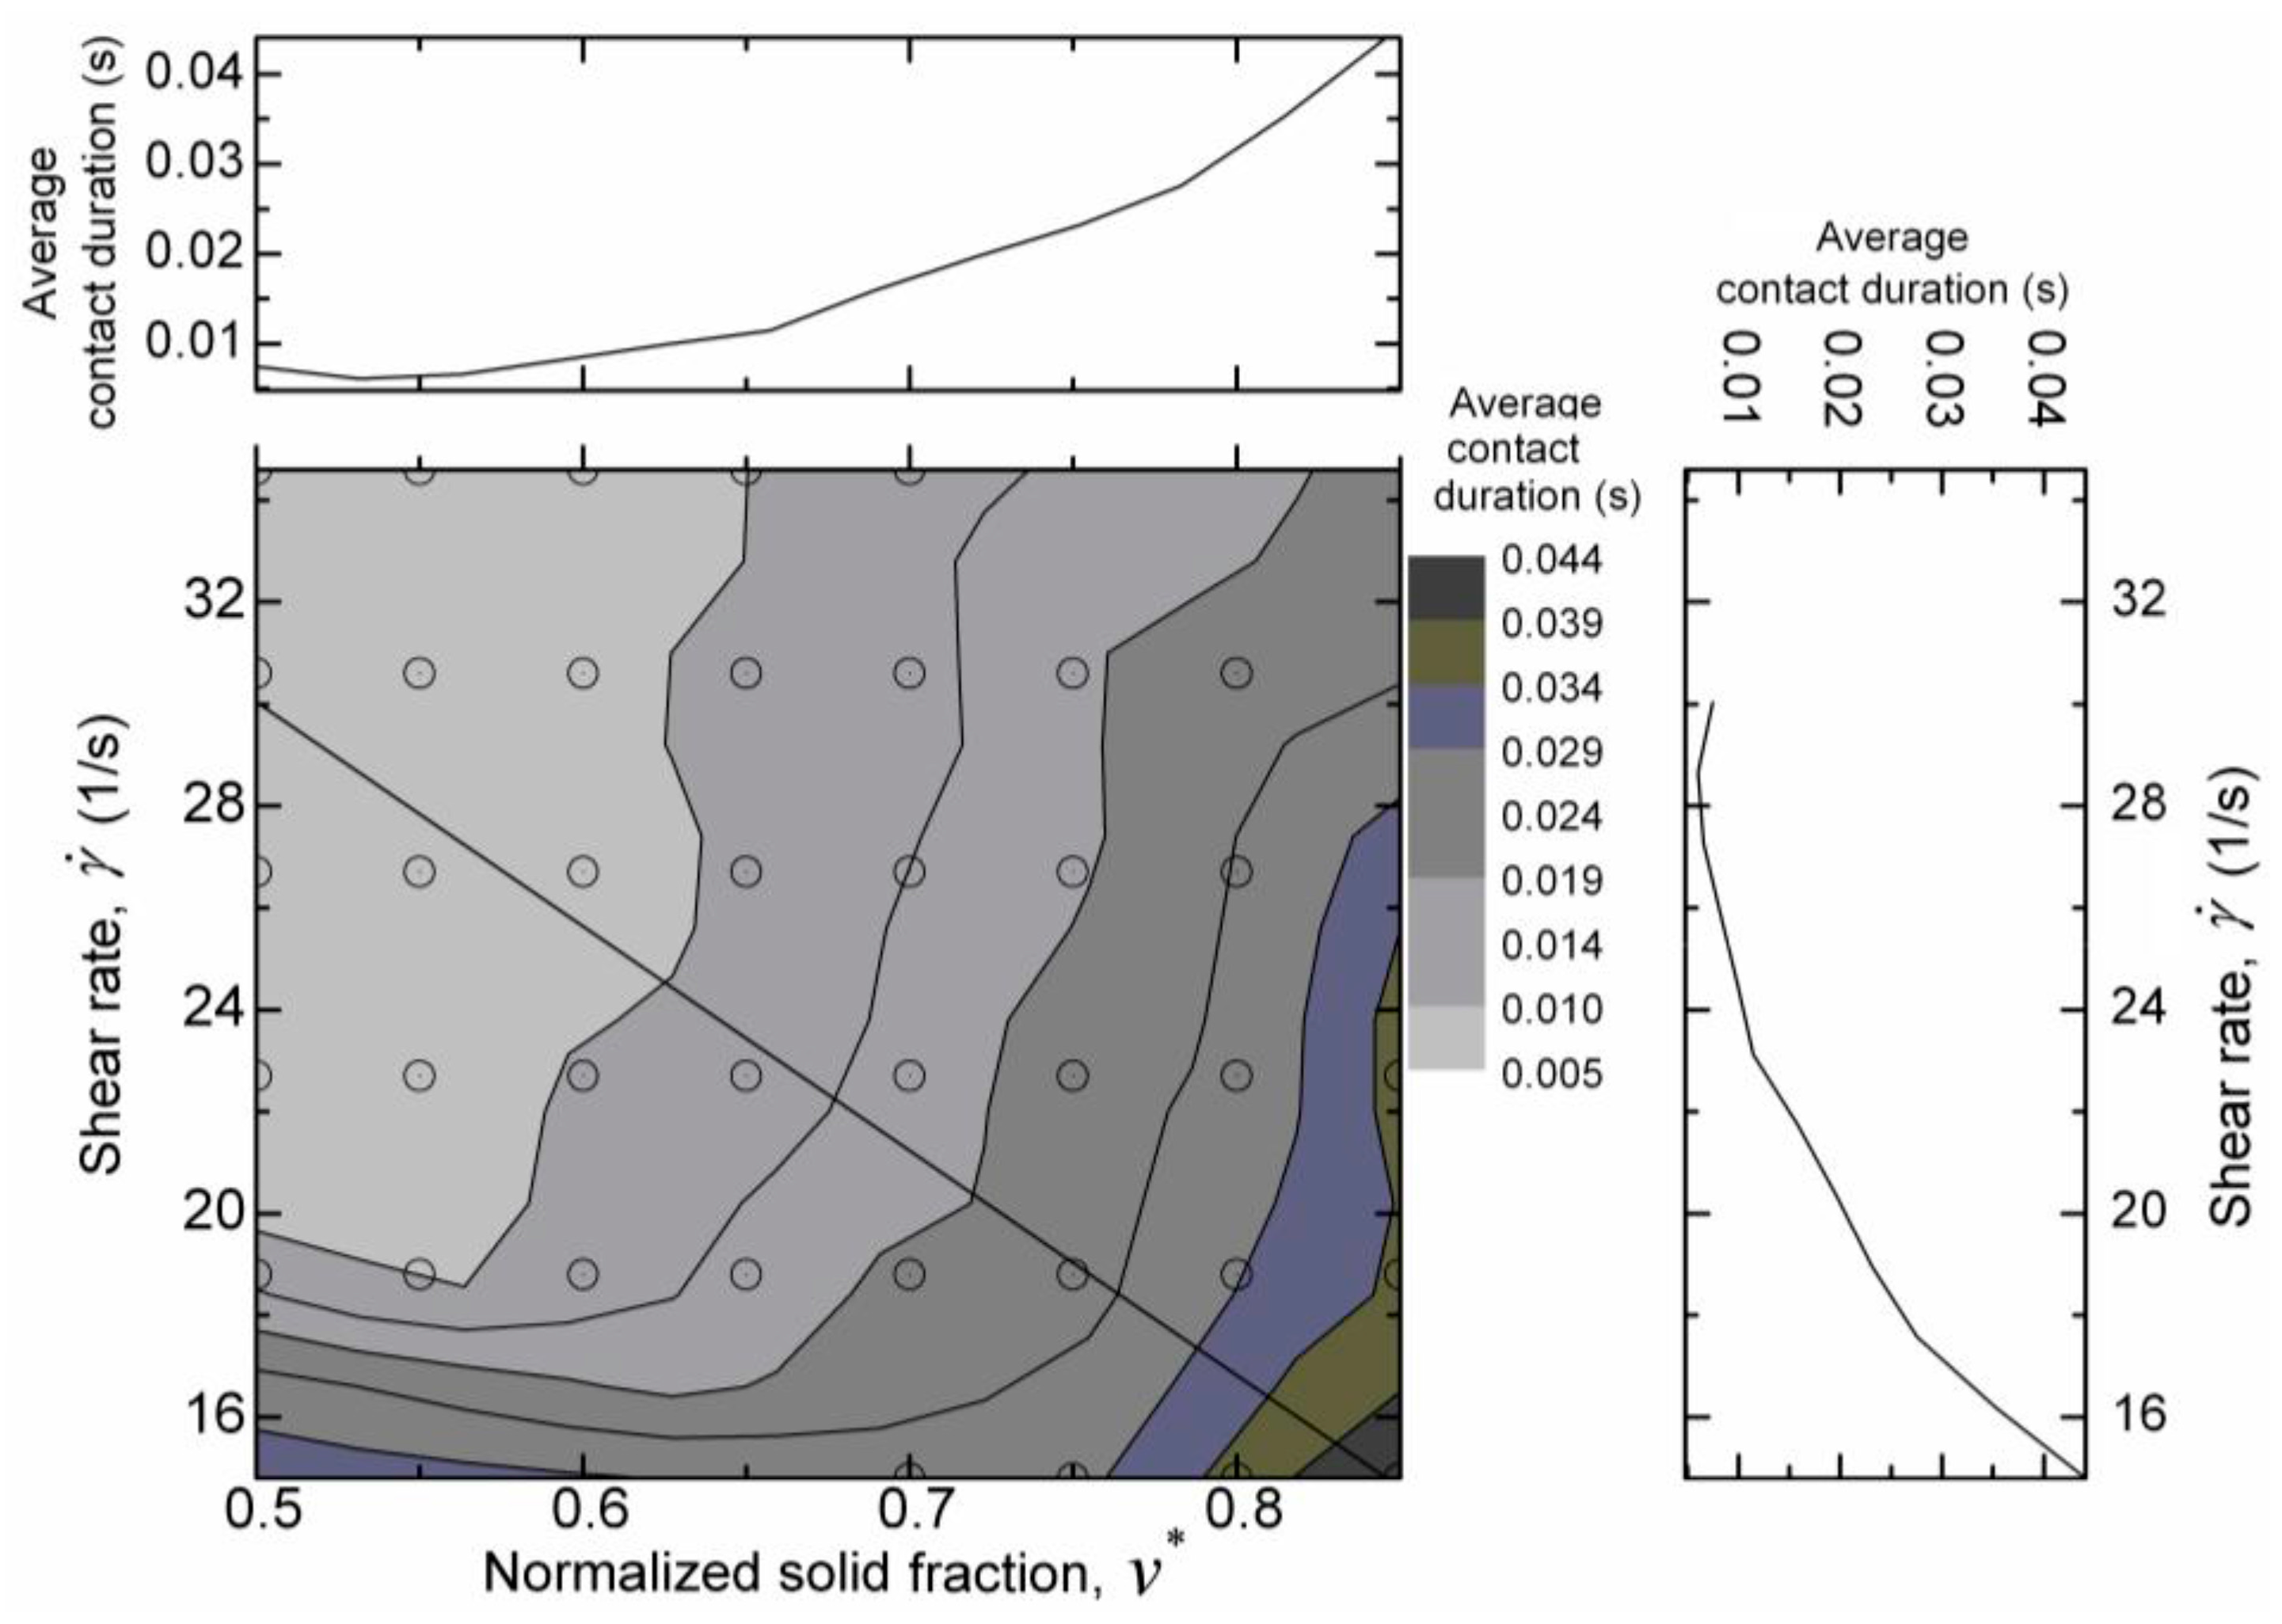
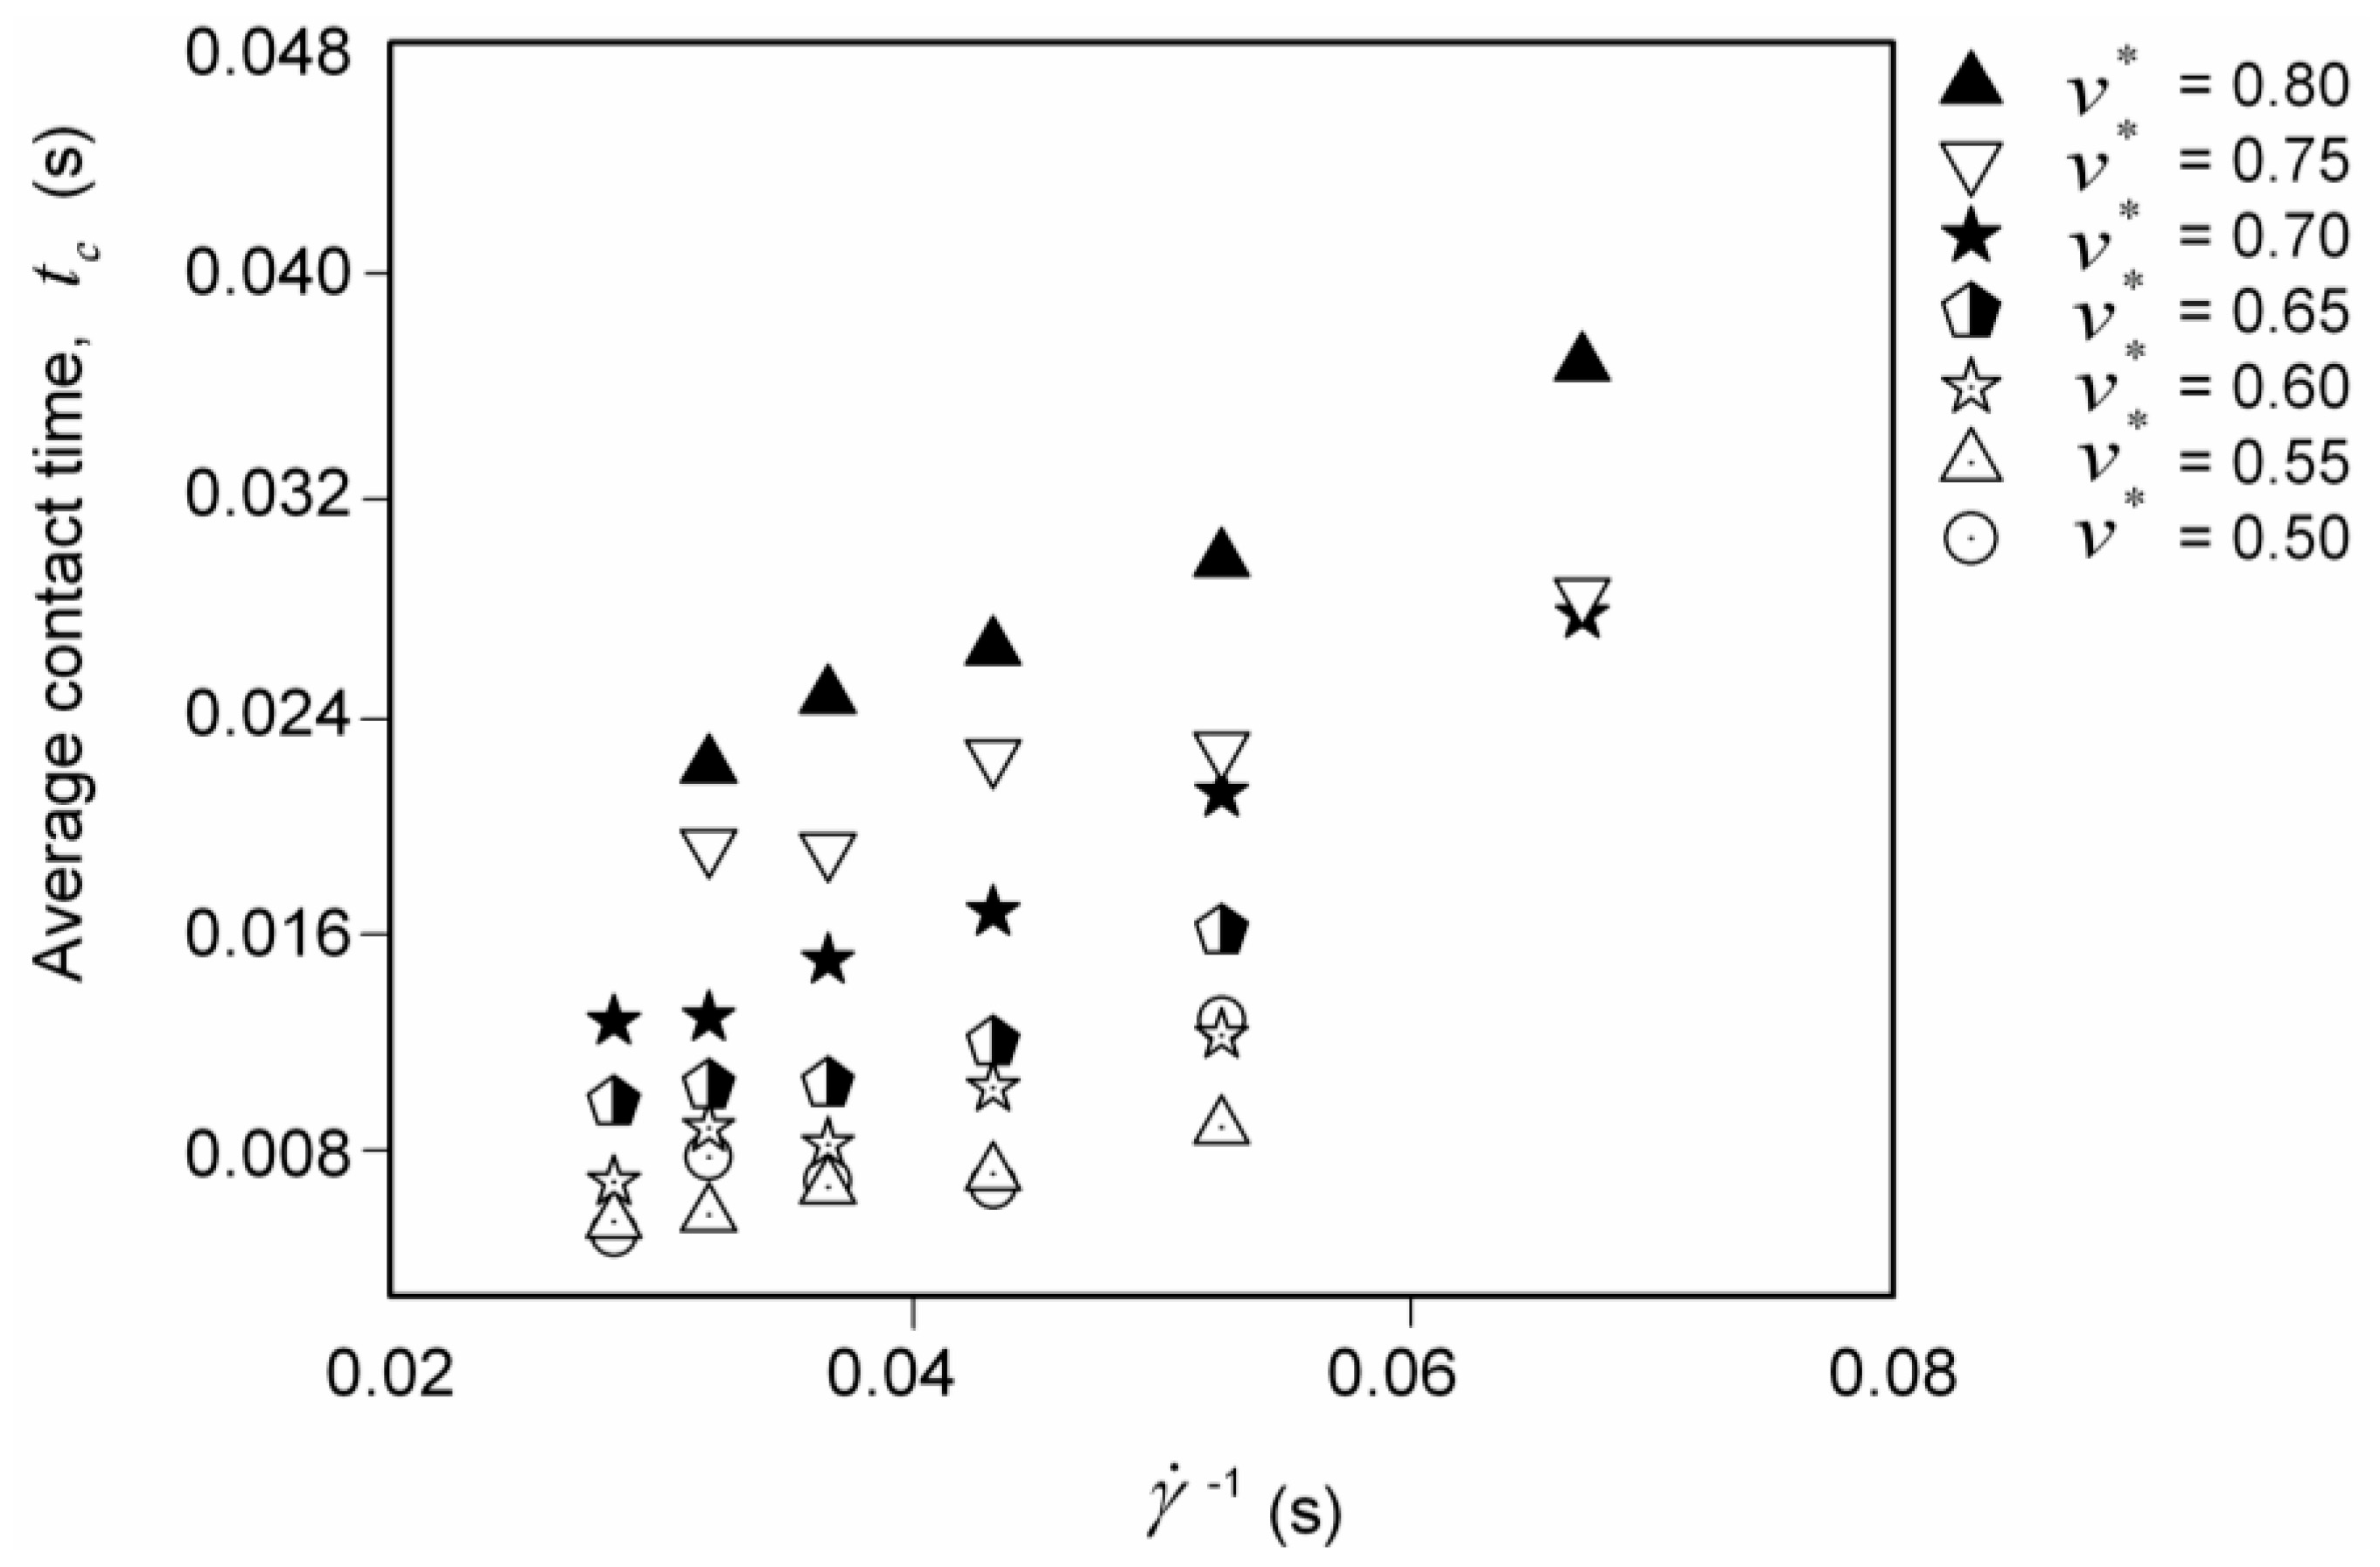
3.1. Particle-Particle Interaction Time

In binary collisions, only two particles interact at a time and interactions last for a very short moment; hence, they are called instantaneous. In this condition, a precise calculation of contact duration is unnecessary as it is negligible compared to the free flight time. For the normalized solid fraction equal to or greater than 0.50 used in this study, it was speculated that many collisions are greater than binary both in temporal and spatial terms but there were no means to judge it. Hence it is important to know the status of contact duration for the range of solid fractions and shear rates under investigation. In the present study, the lowest recordable collision duration is 0.001 s and therefore the contact durations lasting for more than one time frame are considered greater than binary collision time. To show the distribution of contact durations t c i , each of the contact durations recorded for all the colliding particles within the time of experimental run are counted and are normalized by the total numbers of colliding pairs under investigation. Such distributions for lowest and highest solid fractions covered in this study for varying shear rates are shown in Figure 4a,b. These figures imply that when the shear rate decreases, more contacts lasting longer than the lowest measurable contact duration are occurring irrespectively of the solid fractions. The long-lived contacts grow rapidly on increasing the solid fraction and decreasing the shear rate. There are distinct peaks of the binary contact time in all the cases but the size of the peaks reduces and tail portions grow rapidly on increasing the solid fraction. The probability density distribution is well fitted by exponential function for all the fractions and shear rate cases. This figure also implies that on decreasing the shear rate, the exponential tail becomes broader indicating an increasing density of enduring contacts.
The experimental result for the average contact duration is plotted as a function of shear rate and normalized solid fraction in Figure 5. The contours in this figure are generated using Renka–Cline Method of gridding in OriginPro 7.5 software and the profile is taken along the solid line running South East to North West. Figure 5 depicts that average contact time increases when the solid fraction increases and it increases when the shear rate decreases. It is also supported by the variation of contact time with the shear rate for different solid fractions as shown in Figure 6.

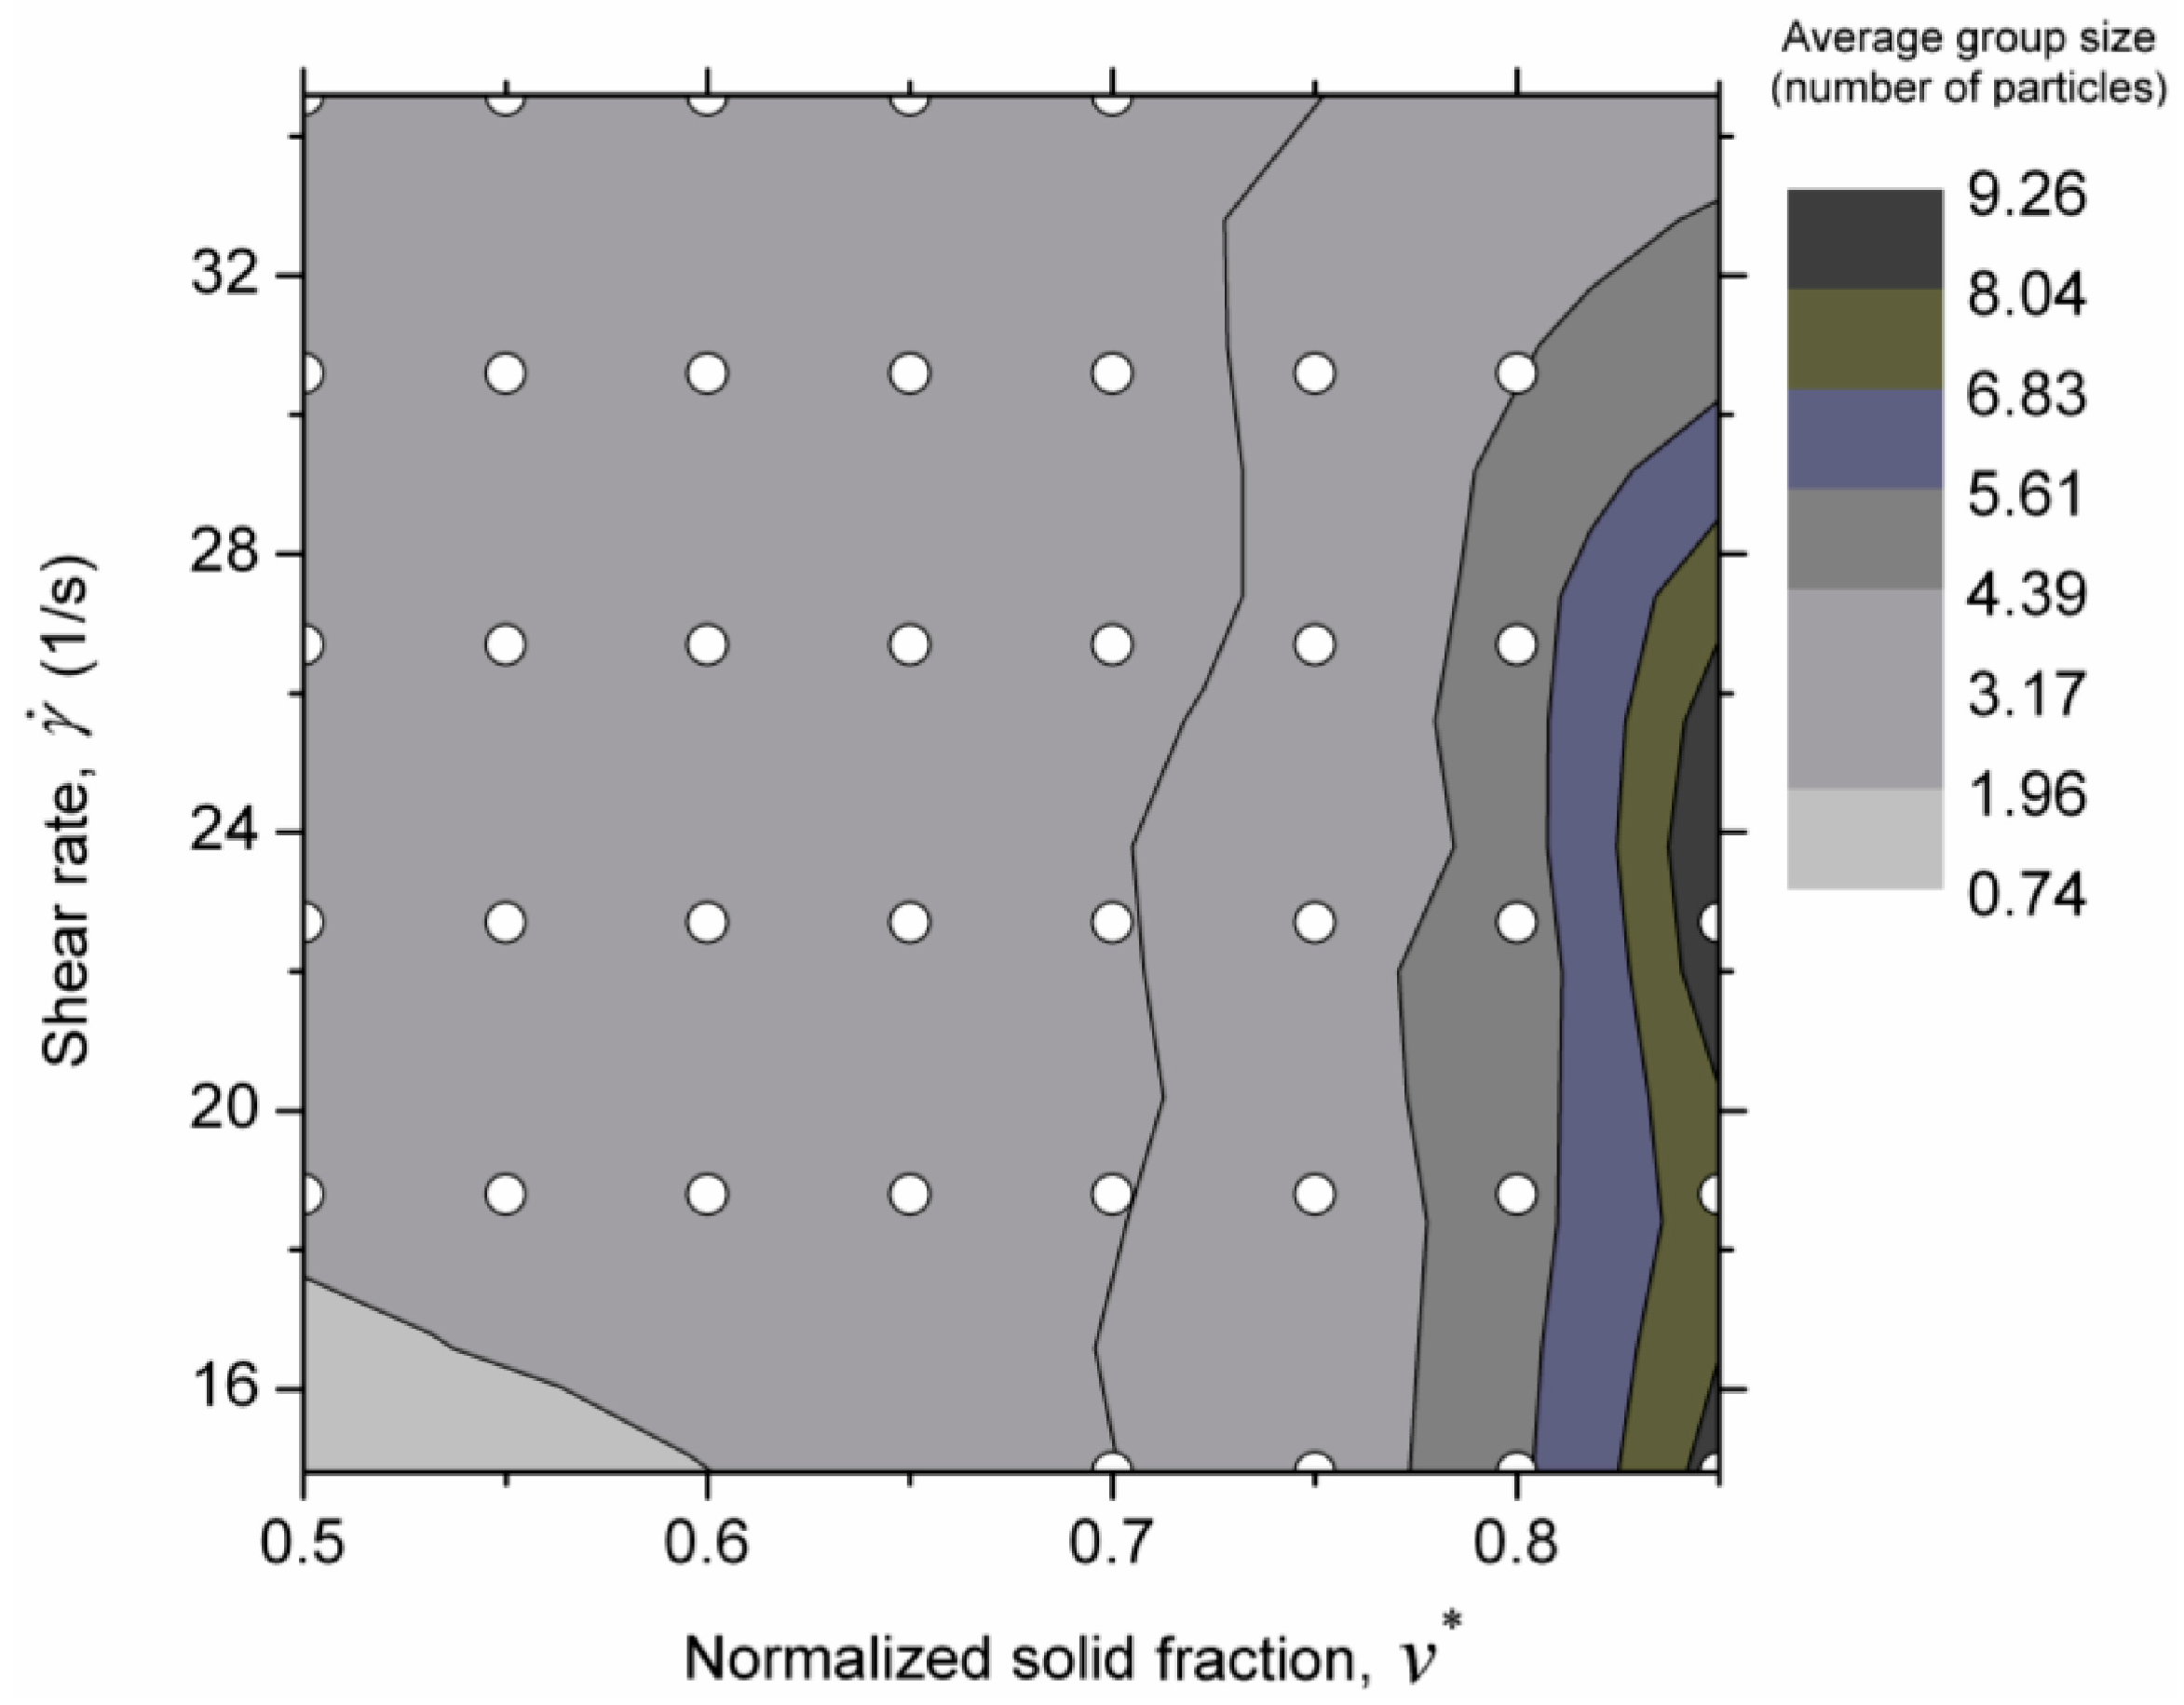
3.2. Length Scale of Multi-Particle Interaction

To determine whether the flow is dominated by two-particle interactions or by multi-particle interactions, the type of contacts is first studied spatially, and the results are described in terms of the multiple collision percentage N m as described in Equation (4). The temporal variation of the multiple collision percentage is shown in Figure 7.
Figure 7 implies that as the solid fraction increases, multi-particle collisions increases for all the shear rates. The formation and breakdown of multi-particle contacts is more frequent in lower fraction cases compared to the higher fractions. However, it is possible that the shear rate reduces the multiple collisions by frequently breaking such collisions as shown by the lower mean values for the higher shear rate in both fraction cases. For the lower solid fractions and higher shear rates, there are many cases without multi-particle collisions. In the lowest fraction case ( v * = 0.50), such events comprised about 60% of the total recorded events, whereas they are only about 0.02% in the highest shear rate case for v * = 0.80.
In Figure 8, the multiple collision percentage averaged over time calculated using Equation (5) is plotted against the solid fraction and the shear rate in the form of contour map and the profile along East West direction. The contours are generated using Renka–Cline Method of gridding in OriginPro 7.5 software. Quantitatively, even for the lowest normalized solid fraction used in this study ( v * = 0.50), multiple collisions are greater than 13% of the total collisions, regardless of the shear rate. The multiple collision reaches 68% for v * = 0.85. Nearly vertical contours and the profile across the contour map along East West direction in the same figure reveal that solid fraction controls the multiple collision percentage more than the shear rate. The profile also shows that multiple collision increases almost linearly on increasing the solid fraction.
The additional length scale associated with multiple collisions can be described in terms of group size, defined as the number of particles that are simultaneously in contact. The probability density of the group size averaged in each time step is plotted in Figure 9. It can be seen that there are highest peaks for the group size equivalent to binary collision in sparse to dense cases, and low to high shear rate cases; but on increasing the solid fractions, groups far greater than binary are frequently formed. While more than 80% of the groups are formed of only two particles for v * = 0.50 irrespective of shear rate, such groups represent less than 5% of the groups formed at v * = 0.80 for lower shear rate cases ( γ ˙ less than or equal to 22.7 s−1). For v * = 0.80, group size up to 12 are also found considerable. The distribution of group size for the intermediate v * cases remains between these two extremes. It is also found that the group size density distribution is dependent with shear rate, γ ˙ for higher solid fractions but it is almost unchanged with γ ˙ for small fractions. In higher fraction cases, the peak of the probability density distribution reduces and the tail portions widened indicating that larger groups formed when increasing solid fractions. Another observation is that the peak of the probability density shifts slightly towards higher group size on decreasing γ ˙ .
The contour plot of the average group size with respect to solid fraction and shear rate is given in Figure 10. This figure clearly indicates that the average group size in the flow is dictated most by the solid fraction and that the shear rate has little role in it as shown by the nearly vertical contours. For normalized solid fraction less than 0.75, which falls in the area where, on average, more than 50% are binary collisions in terms of spatial sense, there is not significant change in the average group size for any shear rate. However, for the normalized solid fraction greater than 0.75, it is highly sensitive as shown by very dense contours towards this area. This coincides with the area where the multiple collision percentage is greater than 50% in an average. This signifies that as the multiple collisions exceed certain threshold, group size starts to increase tremendously. Figure 11 is a contour diagram of maximum group size, defined as the largest group of particles that form a single group throughout all the time steps and shown as the percentage of total recorded particles in that time step. This figure implies that maximum group size increases with the solid fraction. However, shear rate does not have a clear monotonic relation with the maximum group size. It is remarkable to see that for the normalized solid fraction greater than 0.80, more than 80% of the recorded particles can form one single group when the shear rate is less than about 24 s−1. As seen in Figure 11, the increase in group size is such that, for v * > 0.75, 82 to 100% particles, that make the shear flow for the particular shear rate, fall in the same group. This is the condition of force chains development. However, this type of big group with associated force chains is short lived, as the flow is not fully stable as shown by the fluctuation in the multiple collision percentage with time like in Figure 7.

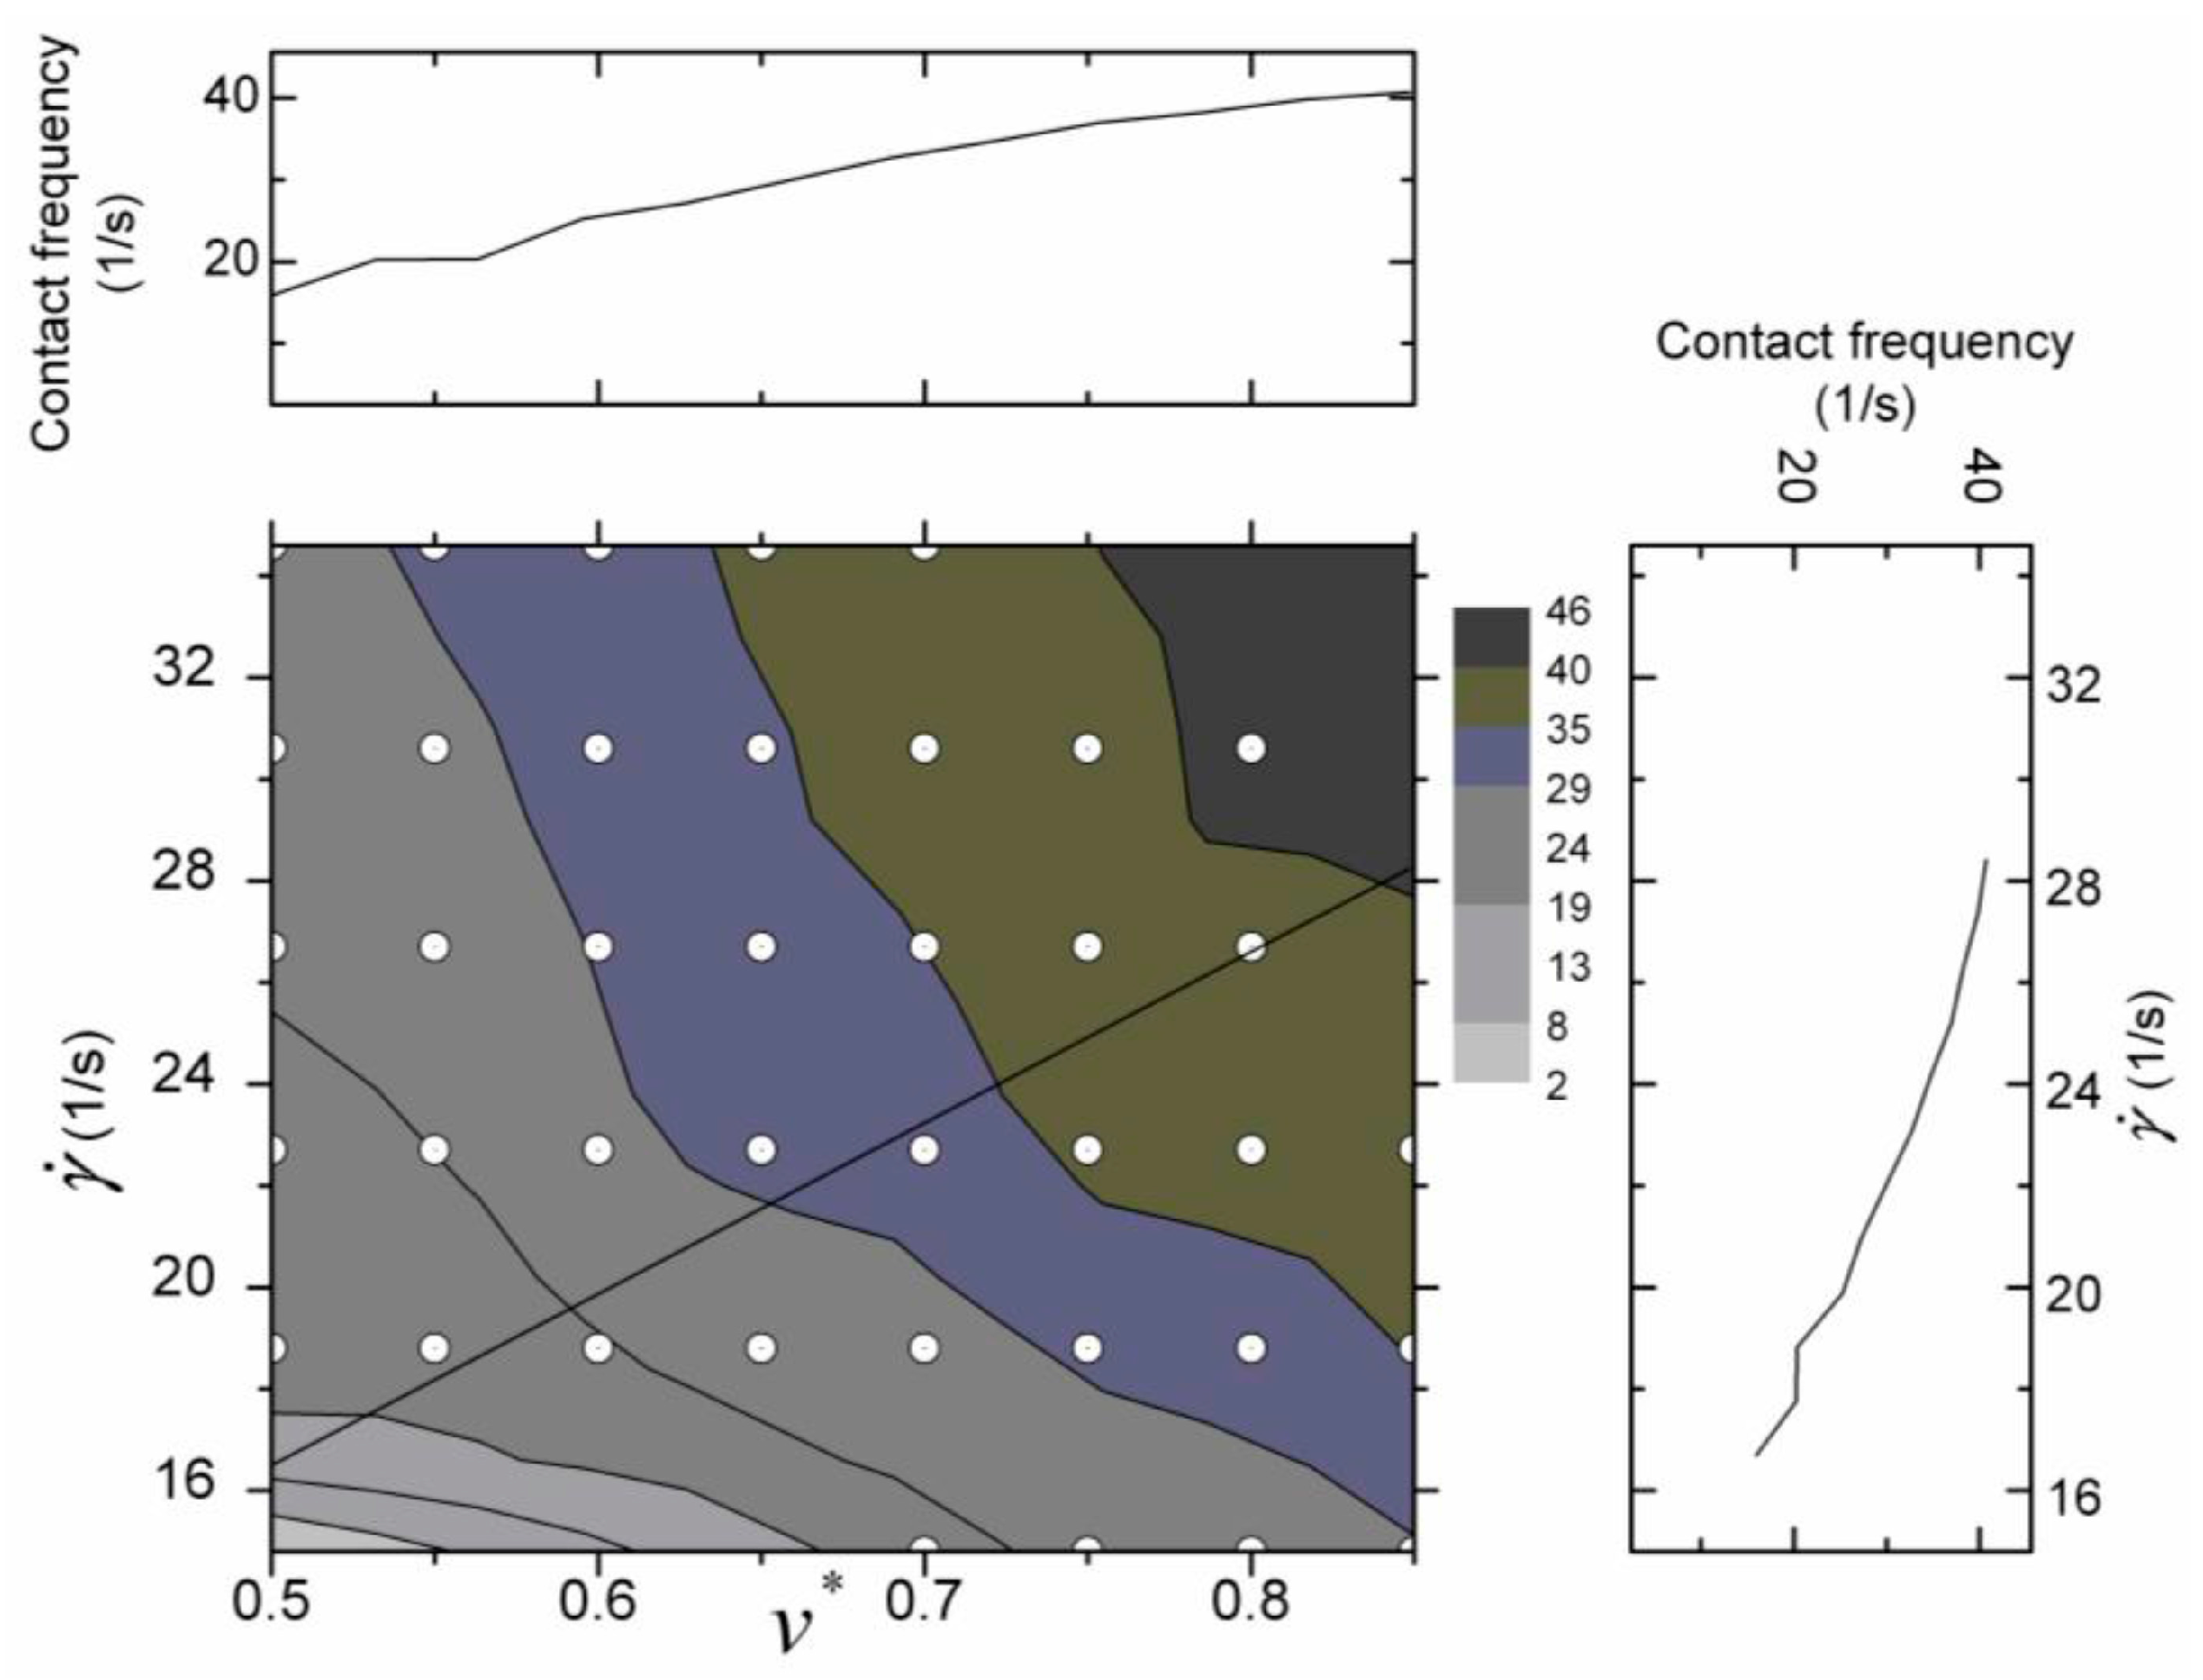
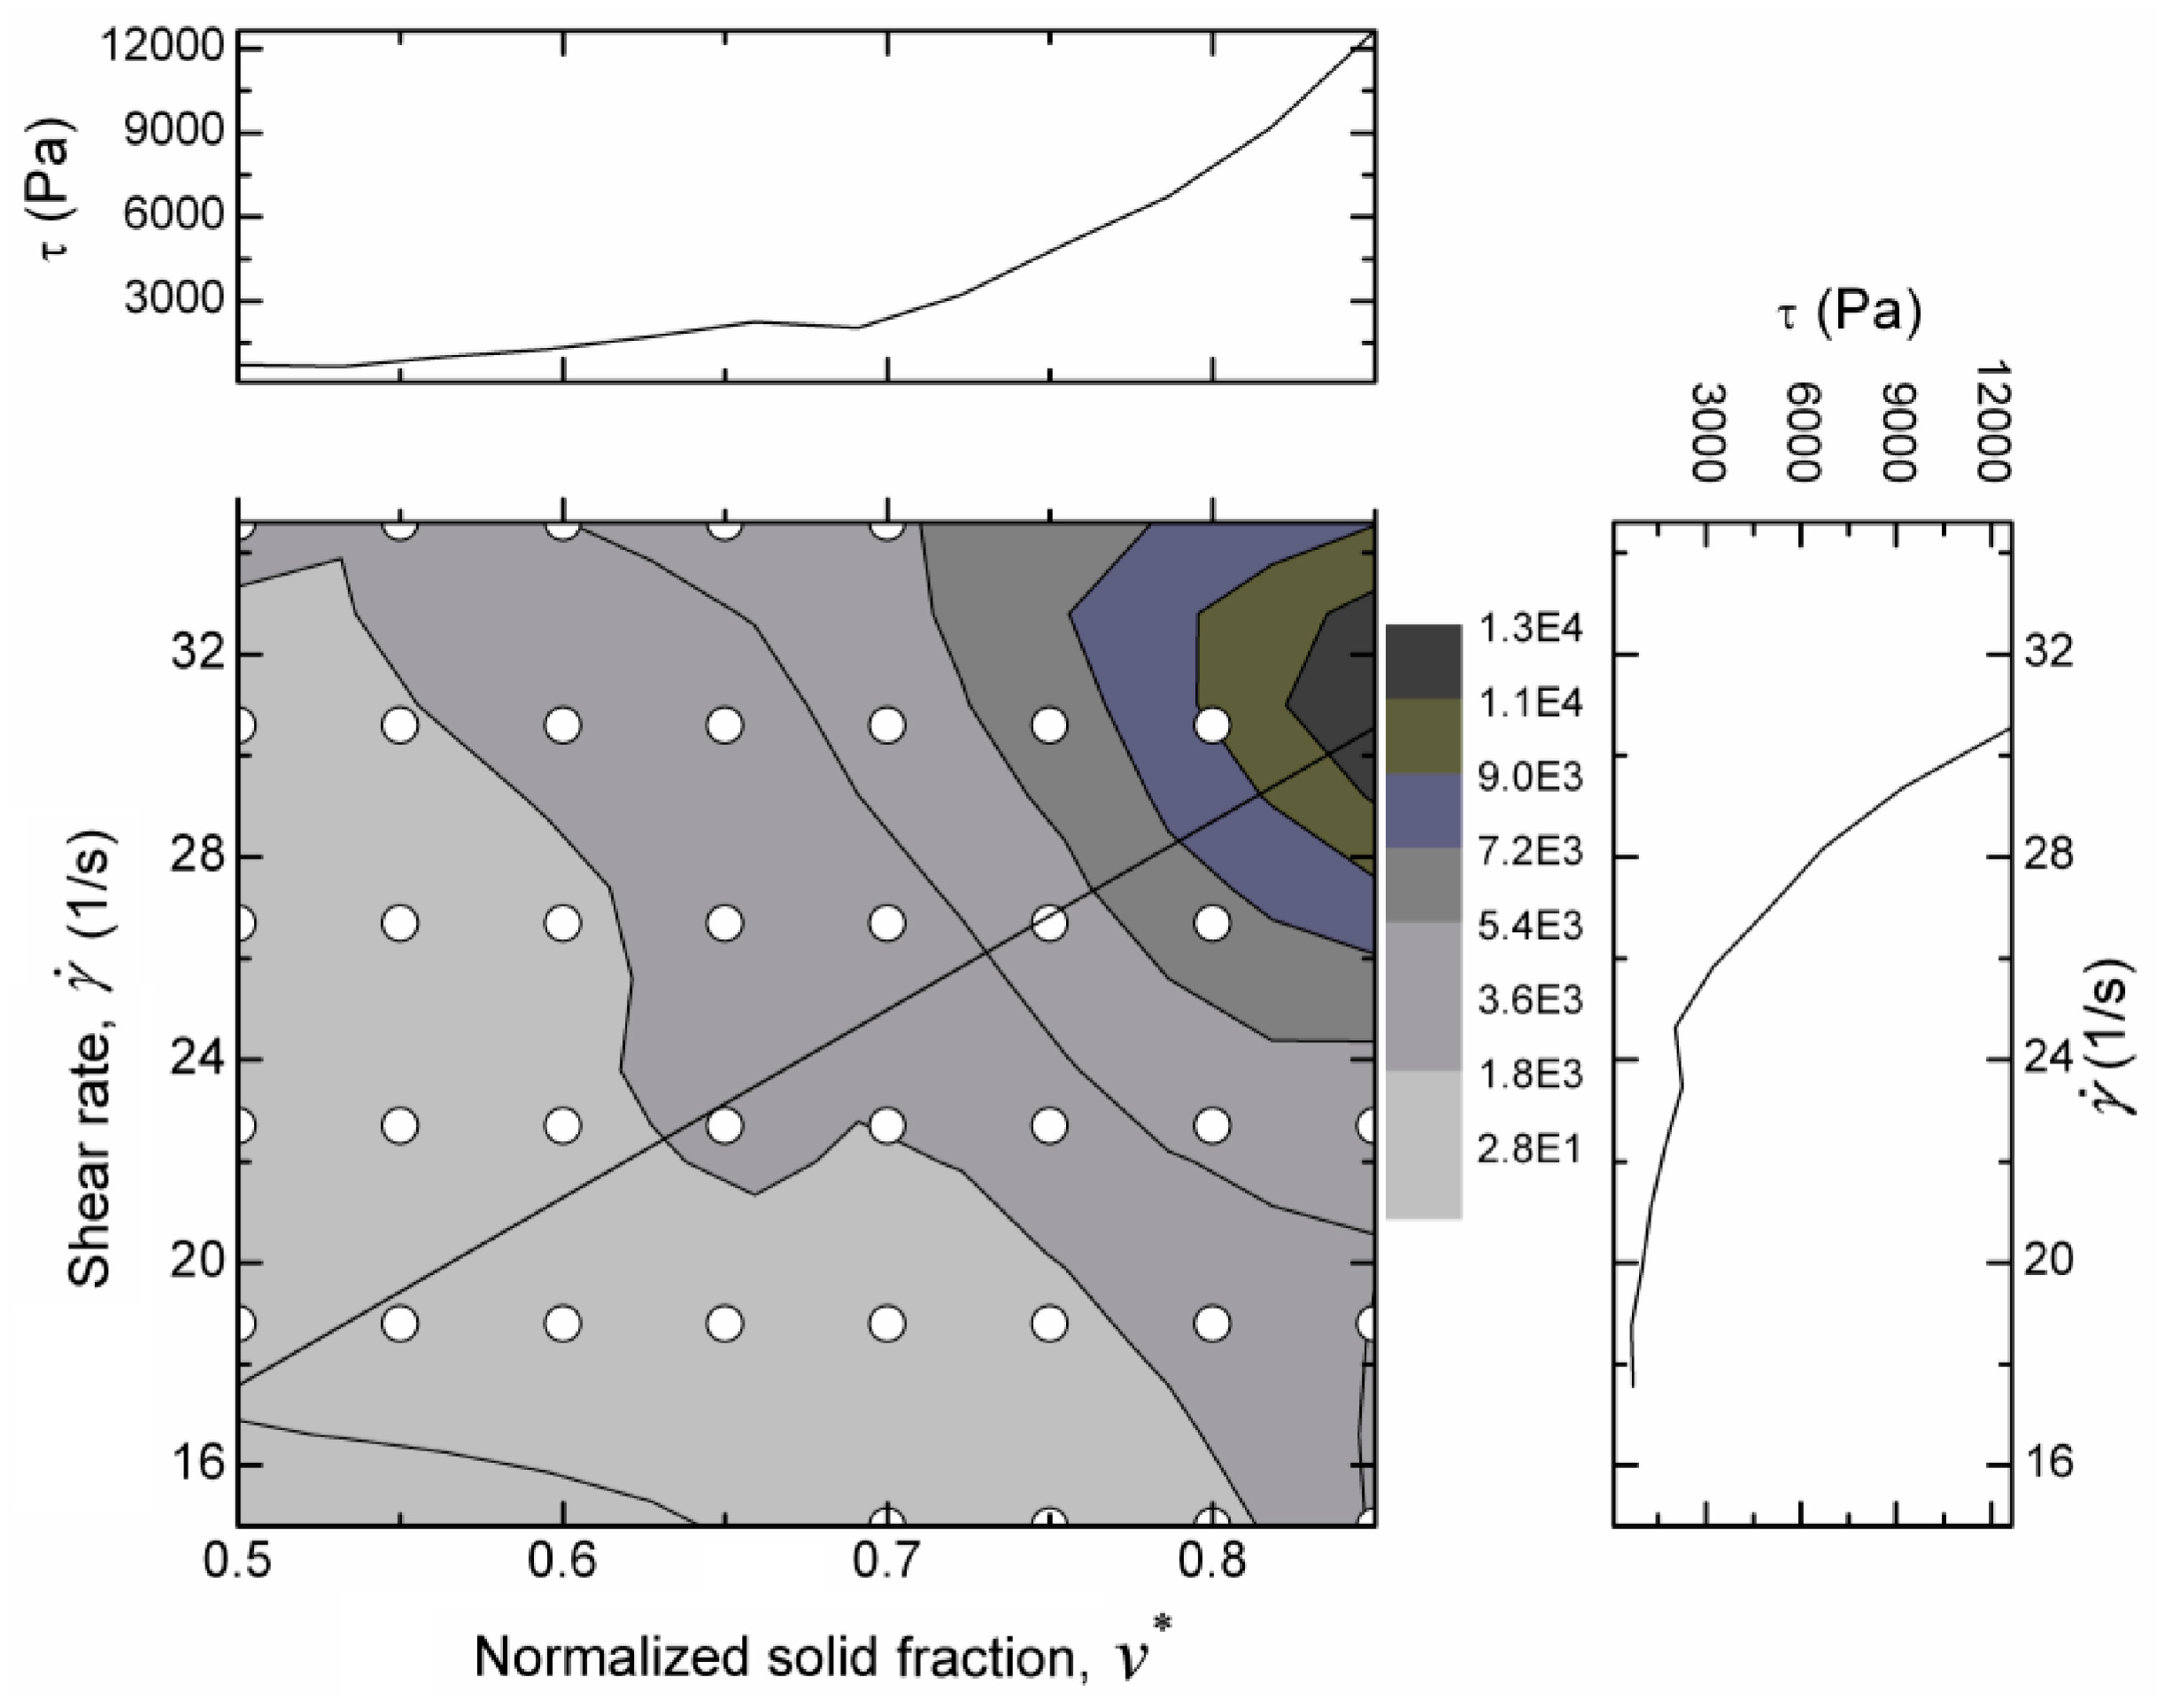
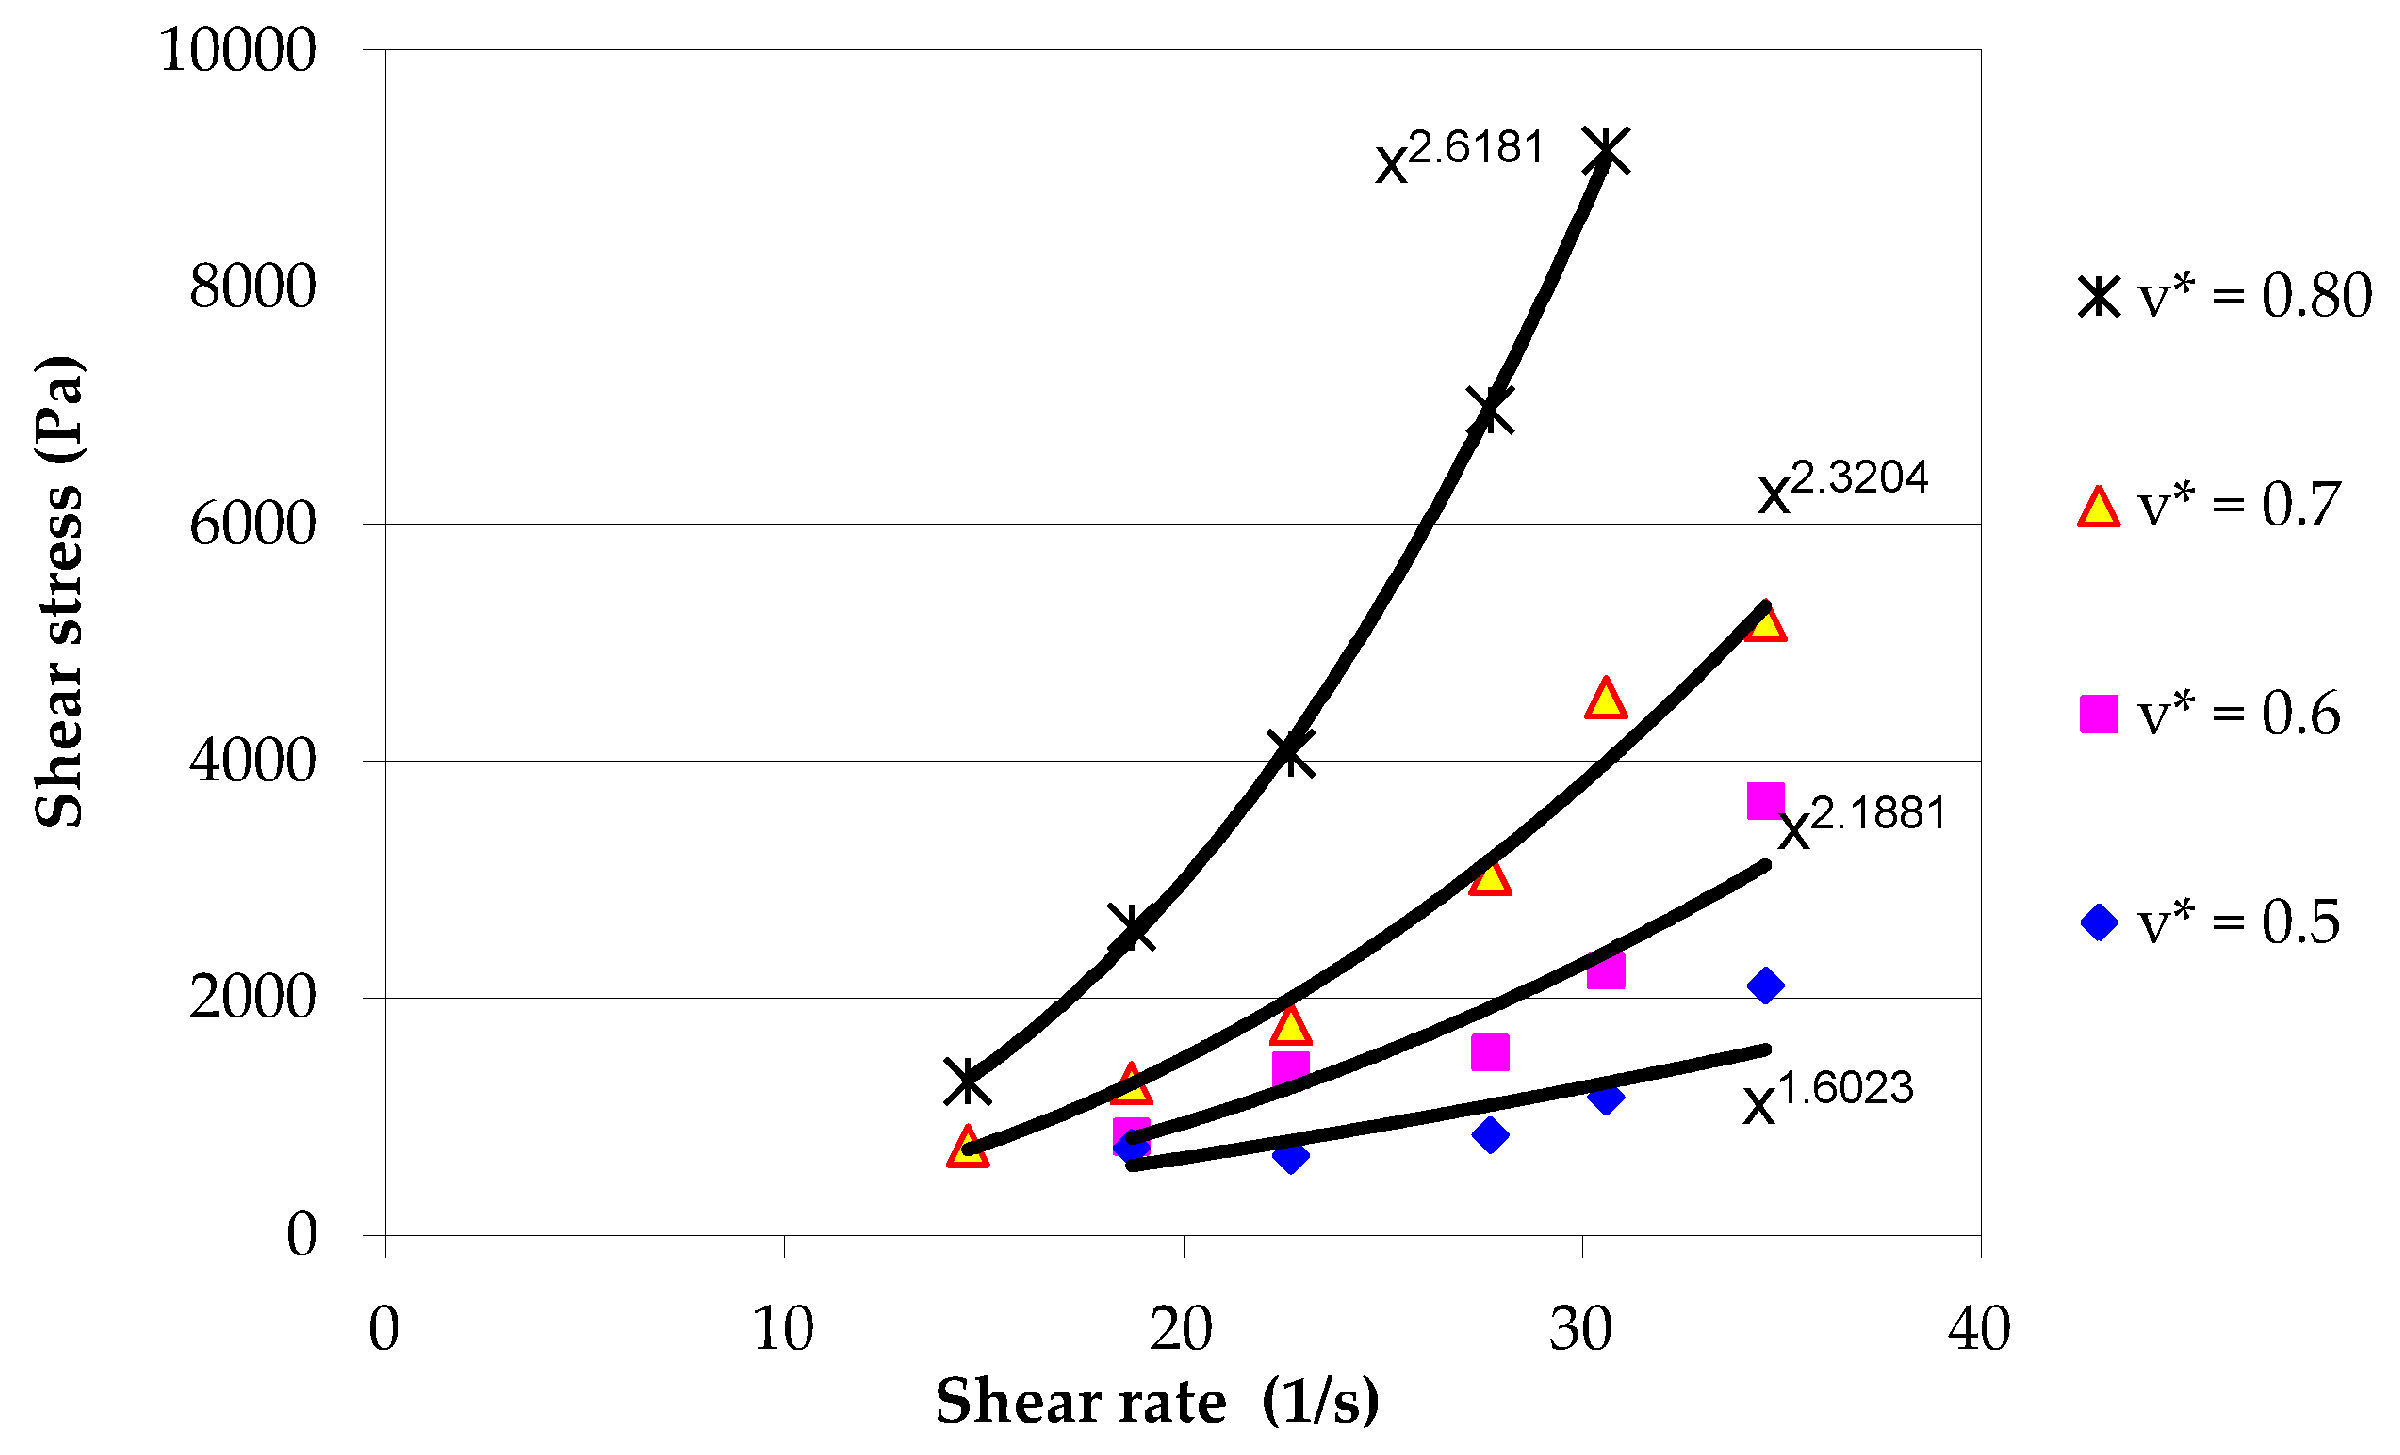
3.3. Contact Frequency and Generated Shear Stress

The effect of the additional time and length scales associated with multiple collisions is expected to be reflected in the generated stress. Since the shear flows under consideration are characterized by the frequent collision between the particles due to the moderate particle concentrations and shear rates, contact frequency, defined as the number of collisions per unit particle per unit time, is very important for finding the generated stress. When the solid fraction is such that interactions occur between more than two particles, the shear rate takes control over the contact frequency by breaking the interaction time between particles. However, if the solid fraction is in the maximum possible concentration range, all the particles will be in continuous contact and the contact frequency will become saturated in any shear rate. In this condition, there will be no change in contact frequency even after increasing the shear rate. The range of solid fraction investigated in this study is less than the maximum possible concentration, and the contact frequency cannot be saturated. The experimental result for the variation of contact frequency with the normalized solid fraction and the shear rate is shown in Figure 12. This figure reveals that contact frequency increases with the shear rate and the solid fractions but the rate of increase is comparatively small.
The shear stress generated in each experimental run is measured in the experiment using load cells. This experimentally generated shear stress is plotted in Figure 13 as a function of shear rate and solid fraction. It can be seen that generated shear stress is also maximum for the flow with maximum solid fraction and maximum shear rate, however unlike contact frequency; the rate of increase in shear stress accelerated for higher shear rate and higher normalized solid fractions (remarkably for the combinations of v * greater than 0.75 and shear rate greater than 22.7 s−1) as shown by denser contours in this part in Figure 13. The shear rate versus shear stress curves for different solid fractions is shown in Figure 14. The shear stress follows the power law of the shear rate, however, it is found that the power of the fitting curve is considerably greater than 2 for the normalized solid fraction equal or greater than 0.75.
The power of the fitting curves are 2.5 and 2.7 respectively for v * = 0.75 and 0.80. This result indicates that the shear stress estimated using the kinetic theory based on binary collision assumptions will underestimate the generated shear stress for v * equal or greater than 0.75. Therefore, the generated stress cannot be explained only on the basis of contact frequency and momentum transfer as it is done in binary collision considerations. In such shear flows, force chains are occasionally formed and the rate of increase in average group size is quite high as can be seen from Figure 10. The high rate of increase in the shear stress for v * = 0.75 and v * = 0.80 should be attributed to the combine effect of increase in contact frequency, increase in group size and the formation of occasional force chains. This experimental study signifies that it is necessary to include the effect of microstructures like increase in group size and formation of force chains in transitional granular flow to find the stress generation pattern in addition to the contact frequency and momentum transfer.

4. Discussions

The quantification of contact durations in physical experiments is quite new and such studies in the similar range of solid fractions and shear rate as done in this study is lacking. Quantitative comparison of the results with the previous studies was therefore not possible. However, the results can be compared in a broader qualitative range. Present study shows that both the shear rate and the solid fraction control the contact durations of each collision but the considerable numbers of contact durations are greater than binary even in the lowest solid fractions. The results of contact durations of the present study are consistent with the conceptual description of Campbell [6], where he explained that in the dense cases, one would expect the contact time to be inversely proportional to the shear rate. The results of contact durations of the present study coincides qualitatively with the numerical simulation result of Zhang [11] where it was found that the relaxation time of contact durations is inversely proportional to the macroscopic strain rate. That means the contact durations decrease with the shear rate similar to our results shown in Figure 4, Figure 5 and Figure 6. In their numerical simulations, Shen and Sankaran [7] also found that the average contact durations decrease with the shear rate for dense concentrations. Ji and Shen [12] investigated the transitional behavior of the granular shear flow in 3-D numerical simulation, which also includes variation of contact durations with the particle concentration and the shear rate. Multiple collisions were identified in all the experiments from low to high solid fractions and low to high shear rate. The percentage of multiple collision increases on increasing the solid fractions and it is found to increase when the solid fraction is increases. This implies that the micromechanics related to multiple collisions is important to understand the transitional granular shear flow.
The kinetic theory concept of granular materials is that stresses are proportional to the product of contact frequency and momentum transfer in each collision, each of which is proportional to the shear rate [12] leading to quadratic relation of the generated stress with the shear rate γ ˙ . The shear stress follows the power law of the shear rate in our study too, however it is found that the power of the fitting curve is considerably greater than 2 for the normalized solid fraction equal or greater than 0.70. The power of the fitting curves are 2.5 and 2.7 respectively for v * = 0.75 and v * = 0.80 (see Figure 14). Such a distinct anomaly in the shear stress increase rate for higher fractions ( v * > 0.70) can be attributed to the increase in average group size as shown in Figure 10, and occasional formation of force chains as shown in Figure 11, both of which are evolved due to the increased multi-particle interactions and prolonged contacts. It can be further explained from the results shown in Figure 12, where it can be seen that the contact frequency increase rate is comparatively less for the high solid fraction and high shear rate. All these results imply that consideration of binary collision and the relations based on this assumption could easily mislead the understanding of micromechanics of granular shear flows and ultimately to the stress generation pattern. Therefore, it may be crucial to consider such microstructure effects of multiple collisions; like the prolonged contacts, increase in group size and the formation of force chains even in the transitional granular flow in order to correctly predict the generated stress and to understand the micromechanics of granular shear flows. Detail analysis and the formulation of stress generation formula is the concern of future study. This experimental study signifies the usefulness of the inclusion of the effect of microstructure changes in transitional granular flow to find the stress generation formula in addition to the contact frequency and momentum transfer.

5. Conclusions

The transitional granular flow with normalized solid fraction in the range of 0.50 to 0.80 and shear rate of 14.8 s−1 to 34.6 s−1 is studied in the experiment using a 2D shear flow apparatus and with the help of image processing technique. Inter-particle collisions, defined by the encounter of particles within the close proximity of each other, are detected for each particle and at each time step by formulating the collision detection method. The multi particle interaction phenomena like the contact durations, multiple collisions and the group size are also studied and are described in terms of shear rate and the normalized solid fraction. It is found that the average contact duration, defined as average duration of encounter or total duration for which particles move together since their first encounter, decreases on increasing the shear rate and increases on increasing the solid fraction. Contact durations much greater than binary collision times are obtained for higher solid fractions. The multiple collision percentage in spatial terms is controlled by the solid fraction, whereas its relation with the shear rate is not much clear. Occasional force chains are developed for the dense range of solid fractions. The contact frequency increases on increasing the shear rate and the solid fraction, but the rate of increase diminishes for the higher solid fractions when a higher shear rate is applied. The shear stress also increases with shear rate and solid fraction, but the rate of increase accelerates when the normalized solid fraction is roughly greater than 0.70. In such cases, shear stress varies with more than square of the shear rate. This is attributed to the increase in prolonged contacts, and the development of occasional force chains in these flows because of increased interactions between more than two particles at a time. These observations therefore imply that the shear stress generation pattern differs from the existing models like that obtained from the kinetic theory of gases for transitional granular flows if the shear deformation rates are moderate to high.

Acknowledgments

The author would like to tribute this paper to late Kazuyoshi Iwashita who supervised his Ph.D. thesis. The author wants to thank Zafar Mahmood and Eric Augustus for valuable suggestions, discussions during experiment and while writing the collision-detection algorithm. The author is also thankful to Saitama University, Japan for providing laboratory and office space to conduct this research. The financial support to the author is provided by Ministry of Education, Science, Sports and Culture, Japan. This research was partially supported by the Japan Society for the Promotion of Science (JSPS).

Conflicts of Interest

The author declares no conflict of interest.

Appendix A

Figure A1. Flow chart of the contact detection algorithm (modified after [16]).
Condensedmatter 02 00002 g015

References

  1. Campbell, C. Rapid Granular Flows. Annu. Rev. Fluid Mech. 1990, 22, 57–90. [Google Scholar] [CrossRef]
  2. Jaeger, H.M.; Nagel, S.R.; Behringer, R.P. The Physics of Granular Materials. Phys. Today 1996, 1, 32–38. [Google Scholar] [CrossRef]
  3. Drake, T.G. Granular flow: Physical experiments and their implications for microstructural theories. J. Fluid Mech. 1991, 225, 121–152. [Google Scholar] [CrossRef]
  4. Bagnold, R.A. Experiments on a gravity-free dispersion of large solid spheres in a Newtonian fluid under shear. Proc. R. Soc. Lond. A 1954, 225, 49–63. [Google Scholar] [CrossRef]
  5. Savage, S.B.; Jeffrey, D.J. The stress tensor in a granular flow at high shear rates. J. Fluid Mech. 1981, 110, 255–272. [Google Scholar] [CrossRef]
  6. Campbell, C. Granular shear flows at the elastic limit. J. Fluid Mech. 2002, 465, 261–291. [Google Scholar] [CrossRef]
  7. Shen, H.H.; Sankaran, B. Internal length and time scales in a simple shear granular flow. Phys. Rev. E 2004, 70, 051308. [Google Scholar] [CrossRef] [PubMed]
  8. Luding, S.; Goldshtein, A. Collisional cooling with multi-particle interactions. Granul. Matter 2003, 5, 159–163. [Google Scholar] [CrossRef]
  9. Hwang, H.; Hutter, K. A new kinetic model for rapid granular flow. Contin. Mech. Thermodyn. 1995, 7, 357–384. [Google Scholar] [CrossRef]
  10. Zhang, D.Z.; Rauenzahn, R.M. Stress relaxation in dense and slow granular flows. J. Rheol. 2000, 44, 1019–1041. [Google Scholar] [CrossRef]
  11. Zhang, D.Z. Evolution of enduring contacts and stress relaxation in a dense granular medium. Phys. Rev. E 2005, 71, 041303. [Google Scholar] [CrossRef] [PubMed]
  12. Ji, S.; Shen, H.H. Internal Parameters and Regime Map for Soft Polydispersed granular materials. J. Rheol. 2008, 52, 87–103. [Google Scholar] [CrossRef]
  13. Azanza, E.; Chevoir, F.; Moucheront, P. Experimental study of collisional granular flows down an inclined plane. J. Fluid Mech. 1999, 400, 199–227. [Google Scholar] [CrossRef]
  14. Blair, D.L.; Kudrolli, A. Collision statistics of driven granular materials. Phys. Rev. E 2003, 67, 041301. [Google Scholar] [CrossRef] [PubMed]
  15. Mueth, D.M. Measurements of particle dynamics in slow, dense granular Couette flow. Phys. Rev. E 2003, 67, 011304. [Google Scholar] [CrossRef] [PubMed]
  16. Elliot, K.E.; Ahmadi, G.; Kvasnak, W. Couette flows of a granular monolayer—An experimental study. J. Non-Newton. Fluid Mech. 1998, 74, 89–111. [Google Scholar] [CrossRef]
  17. Iwashita, K.; Ichiba, K.; Oda, M. Observations of rapidly sheared granular materials. J. JSCE 2004, 764, 147–156. (In Japanese) [Google Scholar] [CrossRef]
  18. Ichiba, K.; Iwashita, K.; Oda, M. Experimental study on stress ratio in rapid granular shear flow. In Proceedings of the 5th International Conference on Micromechanics, Powder and Grains, II, Stuttgart, Germany, 18–22 July 2005; pp. 751–755.
  19. Mahmood, Z.; Dhakal, S.; Iwashita, K. Measurement of Particle Dynamics in Rapid Granular Shear Flows. J. Eng. Mech. 2009, 135, 285–294. [Google Scholar] [CrossRef]
  20. Dhakal, S.; Iwashita, K.; Oda, M. Detecting collisions and finding contact durations in experimental granular flow. J. Appl. Mech. 2008, 11, 477–486. [Google Scholar] [CrossRef]
  21. Dhakal, S. Shear flow characteristics of densely packed granular material subjected to slow deformations. J. Nepal Geol. Soc. 2013, 46, 163–170. [Google Scholar]
  22. Kumaran, V. Dynamics of dense sheared granular flows. Part 1. Structure and diffusion. J. Fluid Mech. 2009, 632, 109–144. [Google Scholar] [CrossRef]
  23. Alam, M.; Luding, S. First normal stress difference and crystallization in a dense sheared granular fluid. Phys. Fluids 2003, 15, 2298–2312. [Google Scholar] [CrossRef]
  24. Pierson, T.C.; Costa, J.E. A Rheologic Classification of Subaerial Sediment–Water Flows. Geol. Soc. Am. Rev. Eng. Geol. 1987, 7, 1–12. [Google Scholar]
  25. You, C.; Zhao, H.; Cai, Y.; Qi, H.; Xu, X. Experimental investigation of inter-particle collision rate in particulate flow. Int. J. Multiph. Flow 2004, 30, 1121–1138. [Google Scholar] [CrossRef]
  26. Hockney, R.W.; Eastwood, J.W. Computer Simulation Using Particles; McGraw–Hill: New York, NY, USA, 1981. [Google Scholar]
  27. Allen, M.P.; Tildesley, D.J. Computer Simulation of Liquids; Clarendon Press: Oxford, UK, 1987. [Google Scholar]
  28. Vemuri, B.C.; Chen, L.; Vu-Quoc, L.; Zhang, X.; Walton, O. Efficient and Accurate Collision Detection for Granular Flow Simulation. Graph. Models Image Process. 1998, 60, 403–422. [Google Scholar] [CrossRef]
  29. McNamara, S.; Young, W.R. Dynamics of a freely evolving, two-dimensional granular medium. Phys. Rev. E 1996, 53, 5089–5100. [Google Scholar] [CrossRef]
Figure 1. The sketch of shear flow apparatus: (a) plan view; and (b) cross section.
Condensedmatter 02 00002 g001
Figure 2. The white plastic disks marked by black color in the center.
Condensedmatter 02 00002 g002
Figure 3. Illustrative shear flow to define a group size at a particular time step. The black filled particles made group size of 2 whereas the thick edged particles made group size of 4. Remaining particles do not collide with each other and hence did not make any group.
Condensedmatter 02 00002 g003
Figure 4. Probability density distribution of non dimensional contact duration: (a) v * = 0.50; (b) v * = 0.80. The lines just make it easy to follow the data points. For the reasons of visible clarity, the contact durations greater than 120 time frames are not shown in (b) and (c).
Condensedmatter 02 00002 g004
Figure 5. Contour plot and profile of average contact duration in seconds, against normalized solid fraction and the shear rate. The open circles denote points where data were measured. The solid line running South East to North West in the figure is the profile line.
Condensedmatter 02 00002 g005
Figure 6. Change in average contact time with respect to shear rate for varying solid fractions.
Condensedmatter 02 00002 g006
Figure 7. The variation of multiple collision percentage with respect to time: (a) v * = 0.50, and (b) v * = 0.80. The lesser fluctuations for high solid fraction indicate more stable contacts.
Condensedmatter 02 00002 g007
Figure 8. Contour diagram of multiple collision percentage, C m ( a v g . ) against the normalized solid fraction and shear rate. The open circles are data measured points. The solid line running east to west is the profile line, the profile is in the top of this figure.
Condensedmatter 02 00002 g008
Figure 9. Probability density distribution of group size: (a) v * = 0.50, and (b) v * = 0.80. The lines are drawn just to make it easy to follow the data points.
Condensedmatter 02 00002 g009
Figure 10. Contour plot of average group size (numbers of particles) against shear rate and normalized solid fraction. The white circles are data measured points.
Condensedmatter 02 00002 g010
Figure 11. The contour diagram of maximum group size shown in percentage of the total particles plotted against the shear rate and normalized solid fraction. The white circles are data measured points.
Condensedmatter 02 00002 g011
Figure 12. Contour plot and the profile of contact frequency (1/s) against normalized solid fraction and shear rate. The white circles are data measured points. Comparatively sparse contours towards high shear rate and high solid fraction indicates smaller rate of increase in contact frequency.
Condensedmatter 02 00002 g012
Figure 13. Contour plot and the profile of generated shear stress (Pa) against normalized solid fraction and shear rate. The white circles are data measured points. Denser contours and steeper profiles towards high shear rate and high fraction indicates higher rate of increase in shear stress.
Condensedmatter 02 00002 g013
Figure 14. Variation of generated shear stress (Pa) against γ ˙ for different v * . The solid lines are the fitting curves. It can be seen that the power of the fitting curves vary from 1.6 to 2.6 for lowest to highest fractions used in this study.
Condensedmatter 02 00002 g014
Table 1. Capacity of experimental shear cell apparatus.
ParametersValues
Motor speed3−180 rpm
Shear range, γ ˙ 5–120 s−1
Maximum torque of motor15 N·m
Radius of inner wall28.5 cm
Radius of outer wall40 cm
Shear cell height (H)11.5 cm
Diameter of flange2.47 cm
No. of flanges attached to inner wall37
No. of flanges attached to outer wall52
Table 2. Physical properties of plastic disks.
ParametersValues
Diameter, D (mm)23
Thickness (mm)6
Mass (g)2.306
Density (g/cm3)0.934
Maximum packing factor, ν 2 D M 0.795
Coefficient of restitution, e0.870
Particle-particle coefficient of friction0.265
Particle-floor coefficient of friction0.30
Young’s Modulus (MPa)980
Material stiffness (N/m)1.9944 × 106
Poisson’s ratio0.2
Tensile strength44.1
Table 3. Capacity of high speed video camera.
ParametersValues
Frame rate60–1000 Hz
Shutter speed30–10,000 Hz
Pixel resolution1280 × 512
Number of frames possible2048
Size of the test section20 × 11.5 cm2
Number of pixels in one particle41.4
Type of colorMonochrome
Table 4. Different thresholds used in the collision detection methodology.
Solid Fraction ε d (% of Particle Diameter) ε v ε ψ
0.488%20%10°
> 0.48 and < 0.565%15%
0.562%8%

