Article

Enhancing X-Ray and Gamma-Ray Detector Calibration via AI-Driven Digital Twins: Predicting Extracorporeal Photon Emission from OpenDose Specific Absorbed Fraction Datasets Using Uncertainty-Aware Transformer Ensembles


by
Muhammed Emin Bedir
1,2
1
Department of Electric and Energy, Vocational School of Technical Sciences, Karamanoglu Mehmetbey University, Karaman 70200, Türkiye
2
Department of Medical Physics, School of Medicine and Public Health, University of Wisconsin–Madison, Madison, WI 53705, USA
Condens. Matter 2026, 11(3), 26; https://doi.org/10.3390/condmat11030026
Submission received: 20 May 2026 / Revised: 10 July 2026 / Accepted: 13 July 2026 / Published: 15 July 2026
(This article belongs to the Special Issue Advances in X-Ray and Gamma Ray Detectors and Applications)

Abstract

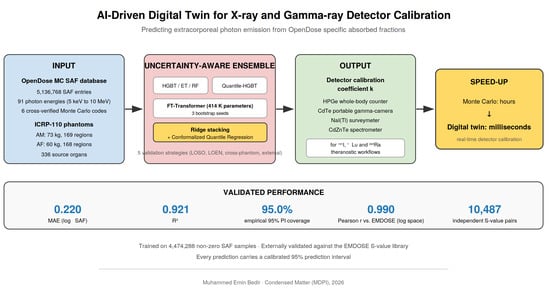
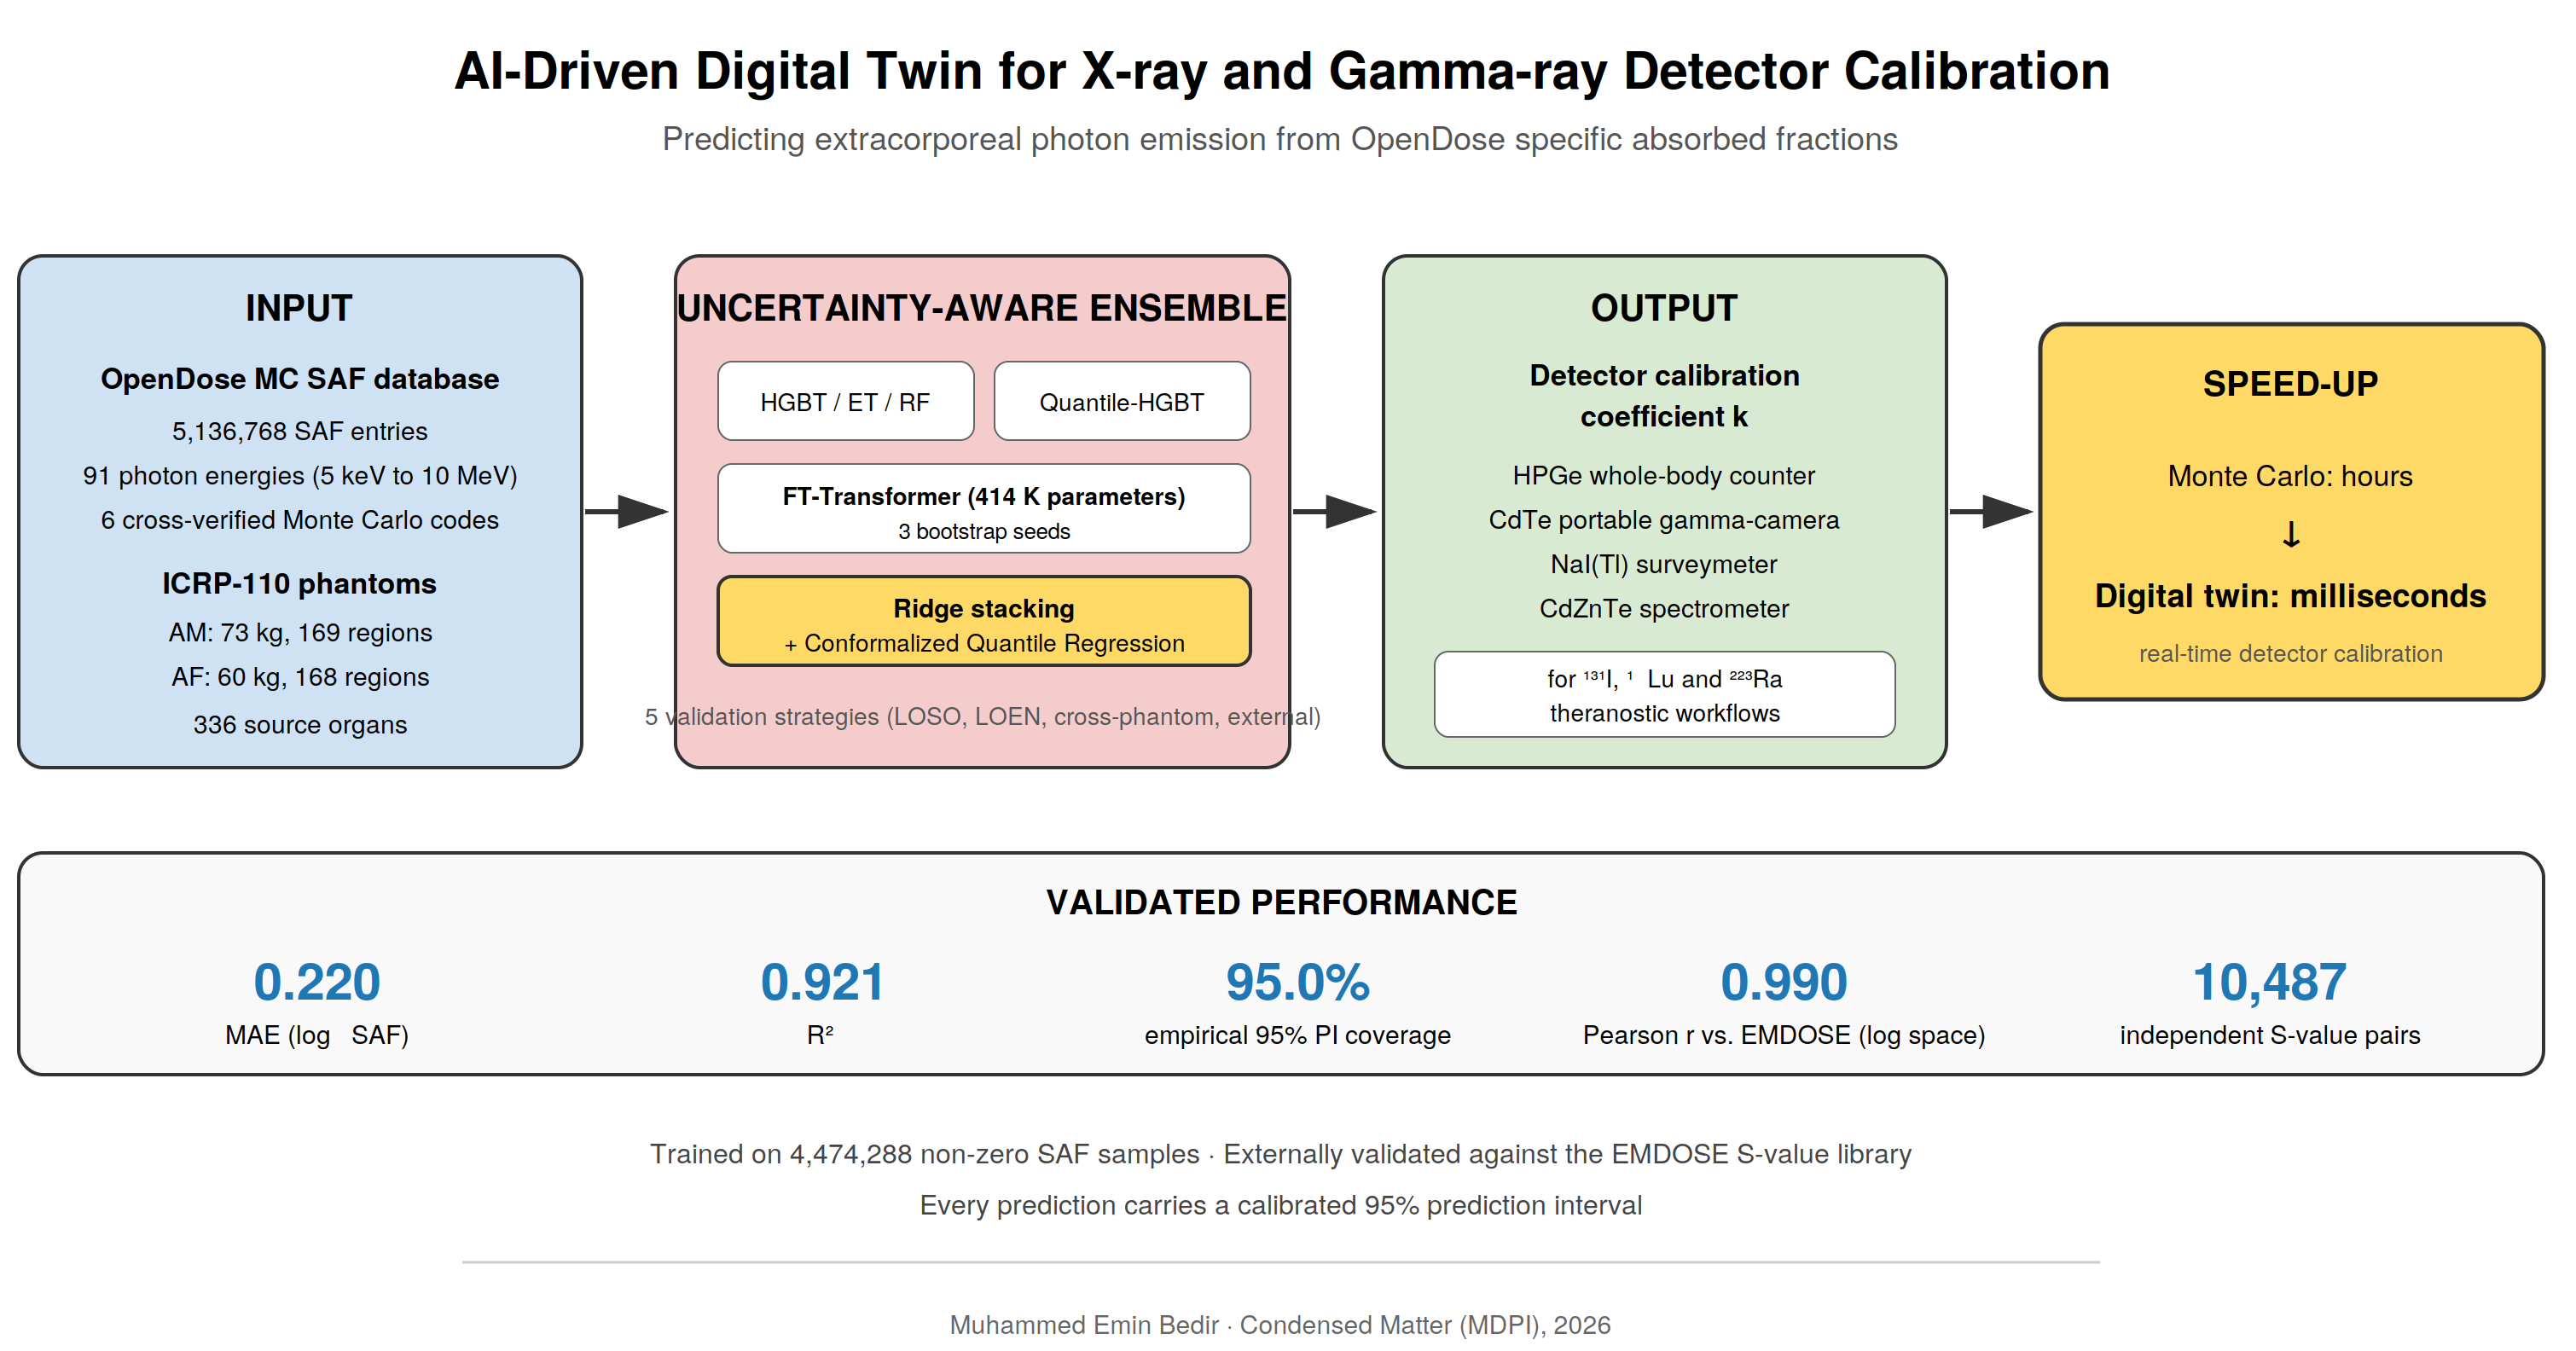
Patient-specific dosimetry and quantitative external counting for in vivo monitoring of radiopharmaceutical therapies require detector calibration coefficients (k) that are currently obtained through computationally intensive Monte Carlo (MC) simulations. We present a digital-twin framework that learns the mapping from organ-level Specific Absorbed Fractions (SAFs) to clinical k values for X-ray and gamma-ray detectors, trained on 4.47 million SAF entries from the OpenDose collaboration covering the ICRP-110 adult male (AM) and adult female (AF) reference phantoms, 91 photon energies (5–10,000 keV), and 336 source organs. An uncertainty-aware ensemble combining Histogram Gradient Boosting, ExtraTrees, Random Forest, Quantile-HGBT, and a Feature-Tokenizer Transformer (414 K parameters) was stacked via ridge regression and calibrated using Conformalized Quantile Regression. The ensemble achieved a test mean absolute error of 0.220 in log10-SAF space (R2 = 0.921) with an empirical 95% prediction interval coverage of 95.0%. Validation against 10,487 independent published S-values (EMDOSE) yielded a Pearson correlation of 0.990 (log space). The framework reduces k-coefficient computation time from hours of MC simulation to milliseconds, supporting real-time detector calibration for theranostic workflows.

Graphical Abstract

1. Introduction

Internal dosimetry in nuclear medicine relies on the Medical Internal Radiation Dose (MIRD) formalism, in which the absorbed dose to a target region is the product of the time-integrated activity in a source region and an S-value that depends on radionuclide decay characteristics and on the Specific Absorbed Fraction (SAF) of the irradiated anatomy [1,2]. The development of voxel-based reference phantoms, most notably the ICRP Publication 110 adult male (AM) and adult female (AF) computational phantoms [3], and of the associated reference anatomical and physiological values [4] has enabled highly standardised computation of SAFs for radiation protection and nuclear medicine. Building on this work, the ICRP Publication 133 framework tabulated SAFs for a wide range of photon and electron energies and source–target combinations [5].
More recently, the OpenDose collaboration has released independently cross-verified SAF datasets produced by six Monte Carlo (MC) codes (EGSnrc, FLUKA, GATE, Geant4, MCNP and PENELOPE) covering the ICRP-110 AM and AF phantoms [6]. The OpenDose dataset, openly available with statistical uncertainties, is now a community reference, and the associated OpenDose3D extension for 3D Slicer supports patient-specific dosimetry [7]. Olguin and co-workers complemented these resources with the EMDOSE library of S-values for clinically relevant therapeutic radionuclides, also derived from the ICRP-110 phantoms [8].
In parallel, peptide-receptor and α-emitter radionuclide therapies (e.g., [177Lu]Lu-DOTATATE, [223Ra]RaCl2, [131I]NaI) have moved towards personalised, image-based dosimetry [9,10]. The dominant computational obstacle is the Monte Carlo simulation needed to compute either dose-point kernels, voxel S-values or detector calibration coefficients [10,11]. Machine-learning (ML) surrogates have therefore attracted growing attention as fast, scalable alternatives. Lee et al. [12] introduced Deep-Dose, a convolutional architecture for voxel dose estimation; Akhavanallaf et al. [13] trained a deep network to predict whole-body voxel dose for [18F]FDG; Li et al. [14] proposed DblurDoseNet for resolution-compensated voxel dosimetry; Mansouri et al. [15] applied transformer architectures to [177Lu]Lu-DOTATATE; Scarinci et al. [16] used computational intelligence to predict dose-point kernels; Eleftheriadis et al. [17] developed a fast voxel-level dose estimator for [99mTc]; and Pastor-Serrano and Perkó [18] reported millisecond-scale deep-learning proton-dose calculation at near-MC accuracy. Brosch-Lenz et al. [19] documented the substantial inter-workflow variability of therapy-relevant endpoints in [177Lu]Lu-DOTATATE dosimetry [9,15].
On the detection side, semiconductor X-ray and γ-ray detectors, Cadmium Telluride (CdTe), Cadmium Zinc Telluride (CdZnTe) and high-purity germanium (HPGe), provide the spectroscopic backbone of whole-body counters, hand-held surveymeters and emerging intraoperative γ-cameras [20,21,22]. Calibrating such detectors for organ-localised activity quantification requires either physical anthropomorphic phantoms or extensive MC simulations that propagate the source spectrum through the phantom and detector response [23]. A practical bottleneck is that calibration coefficients depend on photon energy, source organ, phantom and detector geometry, leading to hundreds of MC runs per clinical scenario [1].
From a methodological perspective, recent advances in tabular deep learning offer a promising path. The Feature-Tokenizer Transformer (FT-Transformer) of Gorishniy et al. [24], built on the original transformer architecture [25], has been shown to be competitive with gradient-boosted trees on heterogeneous tabular data while supporting principled uncertainty estimation when combined with deep ensembles [26] or Monte Carlo dropout [27]. Conformalized Quantile Regression (CQR) [28] provides a distribution-free, finite-sample-valid mechanism for calibrating prediction intervals, complementing the well-established gradient boosting [29,30] and tree ensemble [31] baselines. Bayesian and ensemble methods for predictive uncertainty have been reviewed in [32] and form the basis of much current dosimetry machine learning [15,19].
Despite this progress, several gaps remain. First, no published ML surrogate has been trained on the cross-verified OpenDose SAF database (https://www.opendose.org, accessed 10 May 2026 [6]) which uniquely eliminates single-MC-code bias [1]. Second, existing dosimetry ML studies focus almost exclusively on dose maps inside the patient body; the inverse problem, predicting the extracorporeal photon emission spectrum reaching an external detector, and from there the detector calibration coefficient, has not been Conformalized Quantile Regression (CQR) is well established in the statistics literature [28], its application to high-dimensional internal-dosimetry surrogates has not been reported. The present work addresses these three gaps by introducing an uncertainty-aware digital twin that: (i) ingests the full OpenDose AM/AF SAF dataset (5.14 million entries; 91 photon energies; 338 source organs); (ii) stacks five complementary tabular learners, including an FT-Transformer trained on GPU, within a ridge meta-learner with CQR-calibrated 95% prediction intervals; (iii) propagates the predicted SAFs to clinically relevant detector calibration coefficients for four representative spectroscopy chains (HPGe whole-body counter, CdTe γ-camera, NaI(Tl) surveymeter, CdZnTe spectrometer) Panel colours are used only to group conceptually related elements (blue: input data and tree-based learners; green: phantom and physics inputs; orange: external validation data; red: the deep learning model; yellow: the final ensemble and its outputs) and carry no quantitative meaning.; and (iv) is independently validated against 10,487 published S-values from the EMDOSE library [8]. The framework is openly released under an open-source licence and is designed to be deployed as the calibration back-end for the workflows envisioned by the COST Action CA24131-ENRICH consortium (https://www.cost.eu/actions/CA24131/, accessed 10 May 2026) [8,28].

2. Materials and Methods

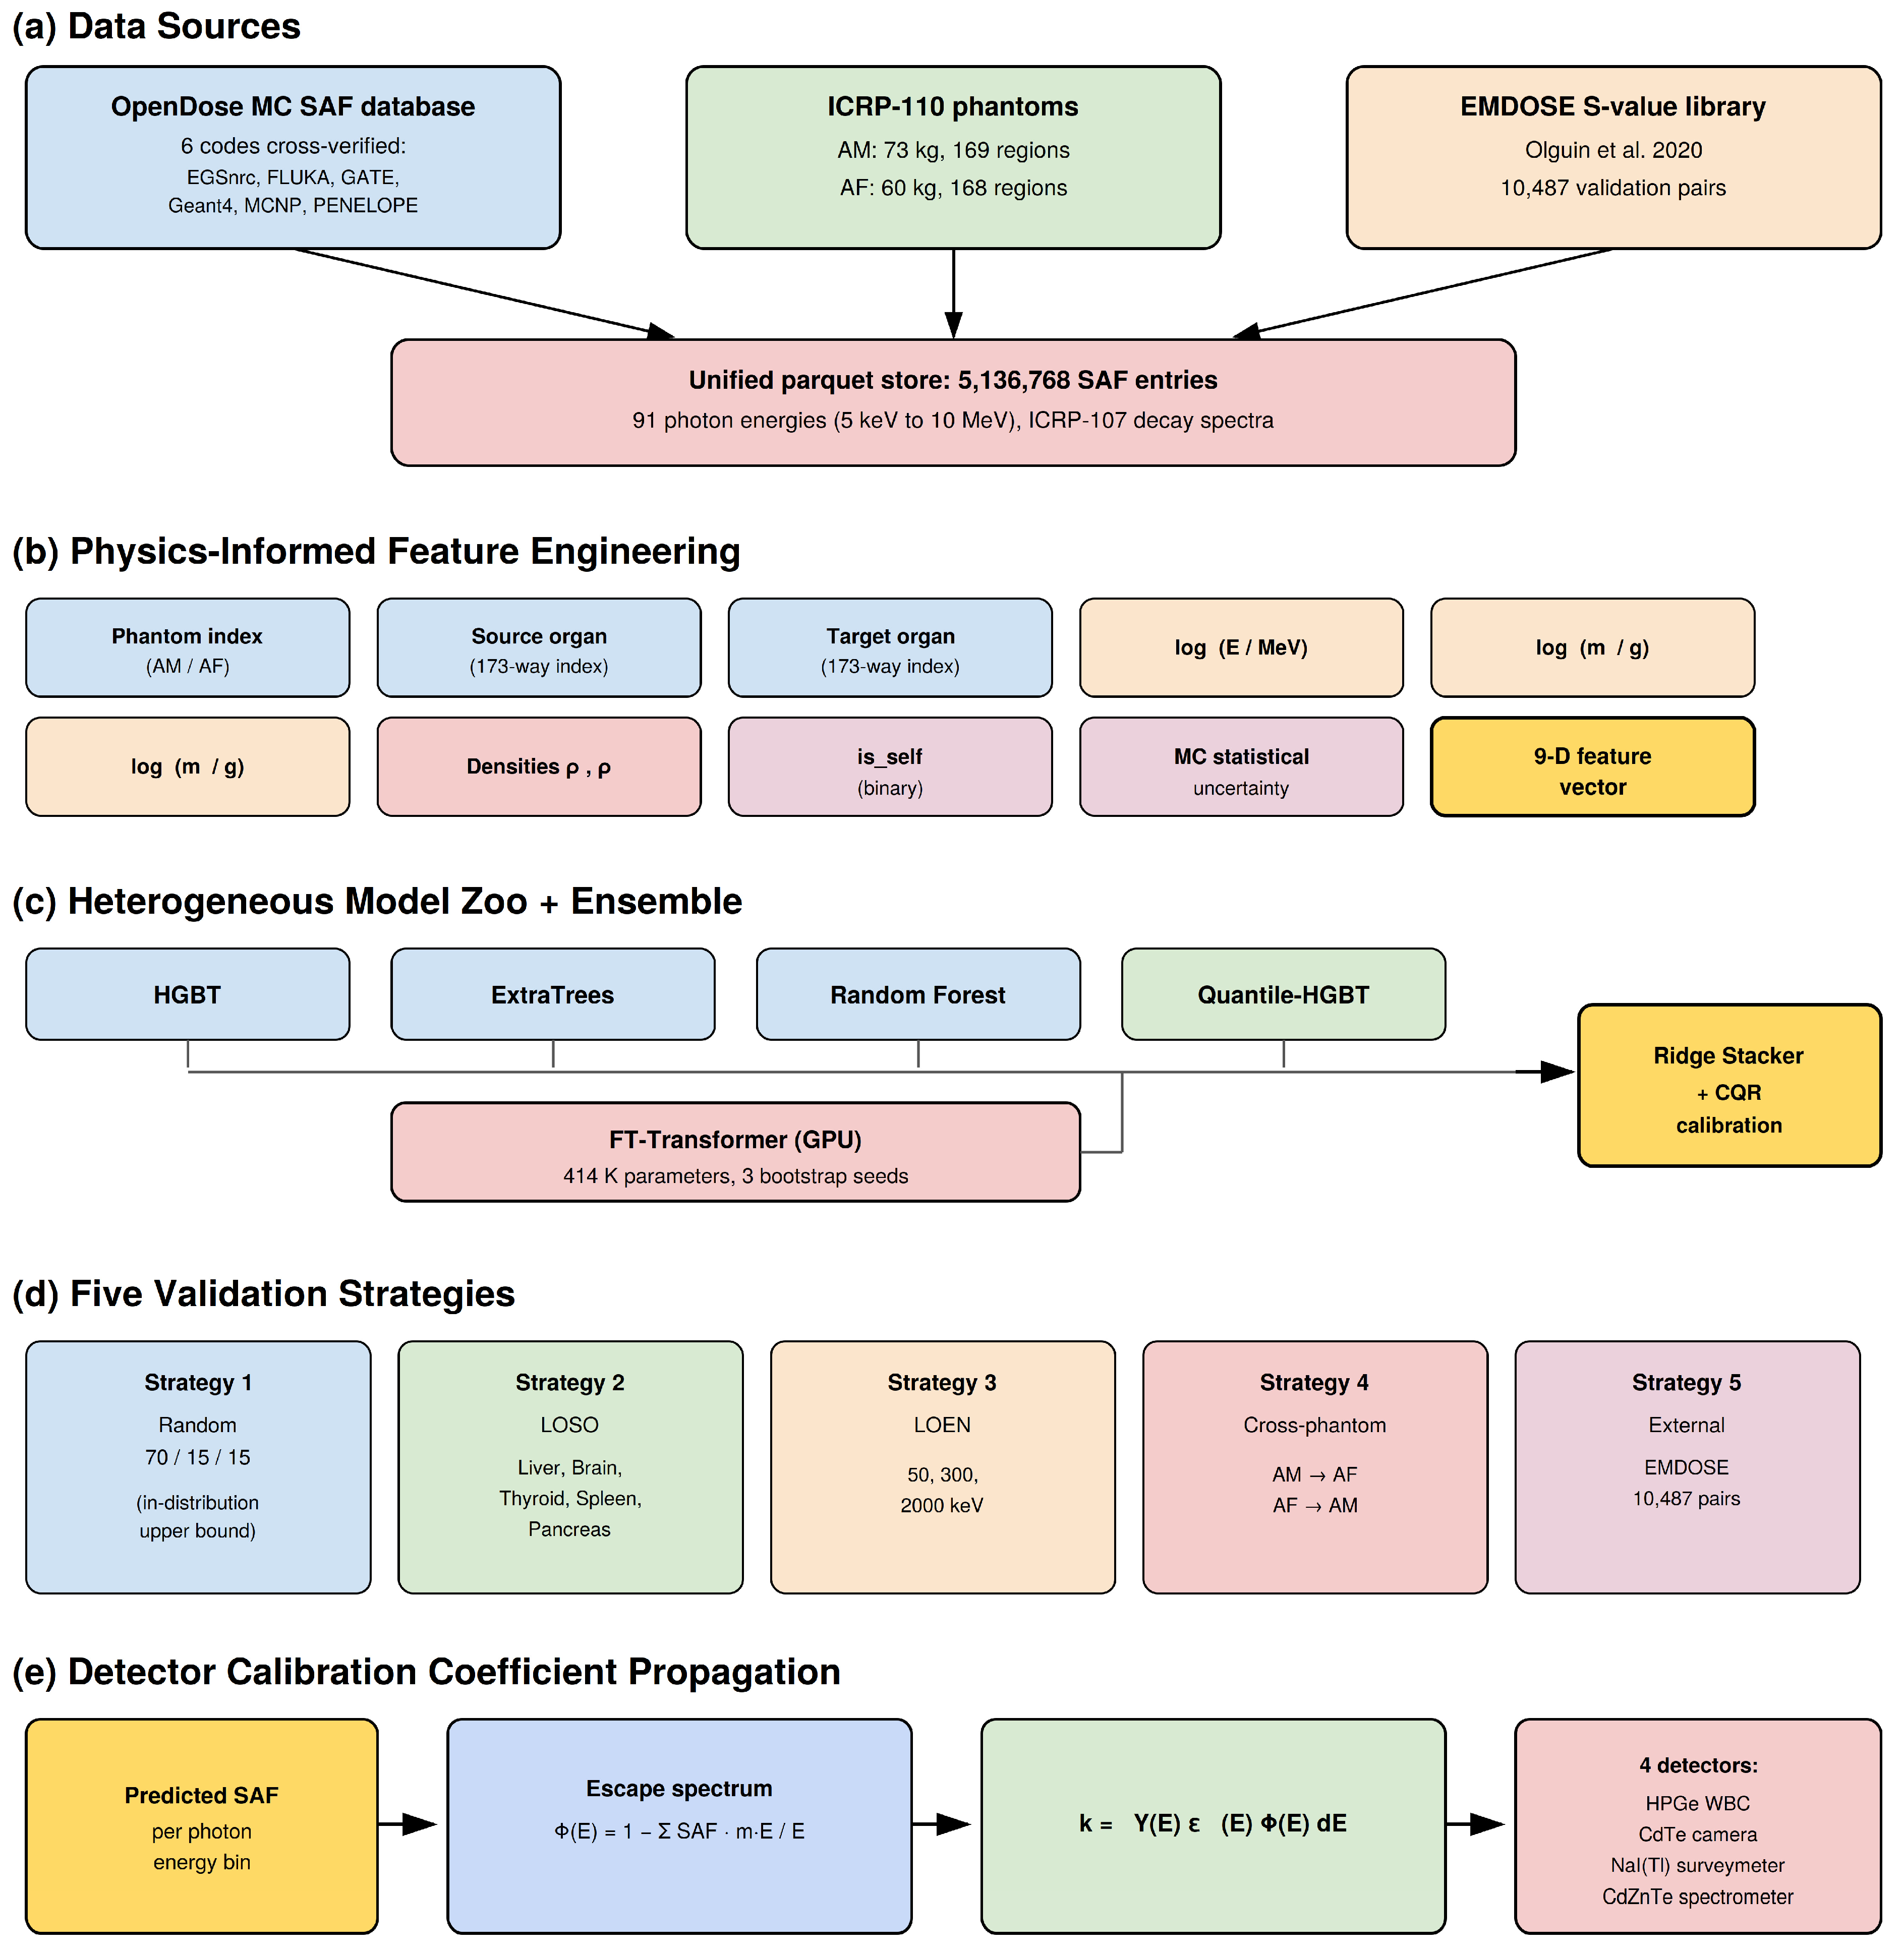
An overview of the computational workflow is shown in Figure 1. The pipeline ingests the openly available OpenDose Monte Carlo SAF dataset, performs phantom-aware feature engineering, trains a heterogeneous ensemble of five base learners, fuses their predictions through a ridge stacker, and calibrates the resulting 95% prediction intervals via Conformalized Quantile Regression. Downstream modules translate the predicted SAFs into clinical S-values and detector calibration coefficients (k) and validate them against the independent EMDOSE library [8]. Each stage is checkpointed and re-entrant to support unreliable GPU runtimes.

2.1. Data Sources

Three openly available datasets were combined. (i) The OpenDose Monte Carlo SAF dataset for the ICRP Publication 110 reference phantoms [3,6] was retrieved as an optimised parquet bundle (84 MB, SHA-256 archived in the Supplementary Materials). OpenDose data is produced independently by six Monte Carlo codes within the collaboration, EGSnrc, FLUKA, GATE, Geant4, MCNP and PENELOPE, and each SAF value is cross-verified by an automated discrepancy-detection workflow, eliminating single-code physics-model bias [6]. (ii) Organ volumes and masses for both phantoms were extracted from the OpenDose adult reference supplement data (v1.2) [3,6], calibrated to the reference anatomical values of ICRP Publication 89 [4]. (iii) For external validation, the EMDOSE S-value library [8] was retrieved as 24 JSON files spanning [131I], [177Lu] and [223Ra], the three radionuclides for which alpha, beta and gamma S-values are tabulated for both AM and AF phantoms. Full data-provenance details, including download URLs, file hashes and parsing scripts, are provided in Supplementary Note S1. Principal photon emissions of the therapeutic radiopharmaceuticals used in the external validation of this work are as follows: [131I] emits gamma rays at 364.5 keV (81.5% intensity), 636.99 keV (7.1%), 284.3 keV (6.1%) and 80.2 keV (2.6%); [177Lu] emits gamma rays at 112.9 keV (6.2%) and 208.4 keV (10.4%); [223Ra] and its short-lived daughters emit gamma rays predominantly at 269.5 keV (13.7%), 154.2 keV (5.6%), 351.1 keV (13.0%) and 401.8 keV (6.6%) [1].

2.2. Computational Environment

All experiments were executed in Google Colaboratory (Google LLC, Mountain View, CA, USA; paid Pro tier) using a single NVIDIA Tesla T4 GPU (NVIDIA Corporation, Santa Clara, CA, USA; 16 GB VRAM) for the FT-Transformer and CPU-only in Google Colaboratory (paid Pro tier) (51 GB RAM) for the gradient-boosting and tree-ensemble baselines. The software environment was Python 3.10.12, NumPy 2.0.2, pandas 2.2.2, scikit-learn 1.5.2 [31], LightGBM 4.5 [30], XGBoost 2.1 [29], and PyTorch 2.10.0 with CUDA 12.8 [33]. An auxiliary FT-Transformer reference implementation was adapted from the RTDL library [24]. Random seeds were fixed at 42 throughout for reproducibility. Each pipeline stage was checkpointed (joblib + parquet) and mirrored to Google Drive to survive runtime disconnections. Total wall-clock time on the cited hardware was 38 min; a full per-stage breakdown is given in Supplementary Table S1.

2.3. Dataset Construction and Pre-Processing

After parsing the OpenDose archives, the SAF database contained 5,136,768 entries (AM: 2,583,672; AF: 2,553,096) over 91 photon energy bins from 5.0 keV to 10 MeV. 169 AM source organs and 168 AF source organs target a unified 173-organ vocabulary (union of AM and AF region nomenclature) [3,6]. Entries with strictly zero SAF (forbidden by geometry or below MC statistical sensitivity) were removed, yielding 4,474,288 non-zero training samples. The target variable was the natural logarithm of the SAF (in kg−1), used throughout to symmetrise the dynamic range that spans more than ten orders of magnitude. Phantom anatomy (AM: 73.0 kg, voxel volume 36.5 mm3; AF: 60.0 kg, voxel volume 15.25 mm3) is summarised in Table 1. As a sanity check, the AM liver self-SAF at 100 keV computed from the parsed parquet was 0.1005 kg−1, consistent with the value reported by Bolch et al. [5]. The AM voxel volume (36.53 mm3) is larger than the AF voxel volume (15.25 mm3) because the ICRP-110 male phantom was segmented at coarser axial resolution (8.0 mm slice thickness) than the female phantom (4.84 mm slice thickness) [3]; this reflects the historical origin of the two datasets and leads to correspondingly different Monte Carlo statistical sensitivities per voxel that OpenDose accounts for through its per-entry uncertainty tables. A complete uncertainty budget covering the MC statistical, feature-tokenisation, model epistemic, aleatoric and CQR-calibration contributions is provided in Supplementary Table S7 and Supplementary Figure S3.

2.4. Feature Engineering

Each training sample was represented by nine features: (i) phantom index (categorical, AM/AF); (ii–iii) integer indices of source and target organ over the unified vocabulary; (iv) the natural log of the photon energy in MeV; (v–vi) the log10 of the source-organ and target-organ masses in grams; (vii–viii) a binary self-irradiation flag (source = target) and a binary phantom-sex flag; and (ix) the OpenDose statistical uncertainty when reported. Continuous features were standardised to zero mean and unit variance; categorical indices were left as integers for tree-based models and passed through learned embeddings of dimension 32 for the FT-Transformer. The full feature-engineering script is reproduced in Supplementary Note S2.

2.5. Train/Test Split and Validation Strategies

Five complementary validation schemes were employed (Figure 1d). (1) Random 70/15/15 train/validation/test split (3,132,001/671,143/671,144 samples) provided an upper bound on in-distribution performance. (2) Leave-one-source-organ-out (LOSO) was performed for five anatomically distinct organs: Liver, Brain, Thyroid, Spleen and Pancreas, to estimate generalisation to unseen source geometries. (3) Leave-one-energy-out (LOEN) was performed at 50, 300 and 2000 keV to probe extrapolation across the photon-energy axis. (4) Cross-phantom transfer (AM → AF and AF → AM) examined sex-specific anatomical transfer. (5) External validation used 10,487 S-value pairs from the EMDOSE library [8]. Numerical performance for each scheme is summarised in Table 2 (Section 3.1) and discussed in detail in Section 3.2.

2.6. Base Learners

Five complementary models were trained as base learners: a Histogram Gradient Boosting (HGBT) regressor, an ExtraTrees (ET) ensemble, a Random Forest (RF), a Quantile-HGBT producing raw predictive intervals at q = 0.025, 0.500, 0.975 [30,31], and a deep Feature-Tokenizer Transformer (FT-Transformer, hereafter FT) [24,25] with 414,337 parameters trained on a Tesla T4 GPU for 35 epochs. Three bootstrap repetitions of the FT-Transformer with different random seeds were used to estimate epistemic uncertainty [26,27]. All hyperparameter values, including tree depths, learning rates, embedding dimensions and optimiser settings, were chosen from preliminary experiments on 5% of the data and are tabulated in full in Supplementary Table S2; no hyperparameter optimisation was performed on the test set [24,26,28,31].

2.7. Stacked Ensemble and Conformalized Quantile Regression

Base-learner predictions on the held-out validation set were combined through a ridge-regression meta-learner (regularisation strength α = 10−3, fitted to validation set targets). The ridge coefficients (HGBT: 0.095; ET: −0.112; RF: 0.512; Quantile-HGBT median: −0.104; FT-Transformer: 0.592) reflect partial multicollinearity among predictors, negative weights act as residual-correction terms rather than as primary predictors, and the dominance of RF and FT-Transformer in the ensemble. Empirical 95% prediction intervals were then calibrated by Conformalized Quantile Regression [28]: on the validation set we computed the conformity score E i = max q ^ 0.025 x i   y i ,   y i   q ^ 0.975 x i , and the (1 − α)-quantile of the E i set was used to symmetrically widen the test-set quantile predictions. This procedure provides finite-sample-valid marginal coverage [28] without distributional assumptions.

2.8. Detector Calibration Coefficient Propagation

Predicted SAFs were converted to clinical detector calibration coefficients k (in counts per second per becquerel, cps Bq−1, tabulated for practical readability as mcps MBq−1) by convolving the SAF-derived organ photon escape spectrum with a parametric model of the detector intrinsic efficiency ε(E). Four representative spectroscopy chains were evaluated [20,21,22,23]: an HPGe whole-body counter (2.5 in × 2.5 in ≈ 6.35 cm diameter, 6.35 cm thickness planar crystal; density ρ = 5.32 g cm−3, effective atomic number Z_eff = 32; ε(E) ∝ E−0.5 for E > 100 keV), a CdTe portable γ-camera (10 mm × 10 mm × 2 mm side/thickness pixel; ρ = 5.85 g cm−3, Z_eff = 50; parallel-hole collimator, ε(E) calibrated to manufacturer data sheets [20,21]), a NaI(Tl) surveymeter (76 mm diameter × 76 mm height cylindrical; ρ = 3.67 g cm−3, Z_eff = 50; well-known ε(E) curve from [22]), and a CdZnTe spectrometer (15 mm side × 15 mm side × 7.5 mm thickness; ρ = 5.78 g cm−3, Z_eff = 49; ε(E) from [21]). For each phantom × source-organ × radionuclide × detector combination (n = 120 in total), the predicted k coefficient was compared with the value obtained when ground-truth OpenDose SAFs replaced the ML-predicted SAFs in the same convolution. Full detector densities, effective atomic numbers and efficiency parameterisations are given in Supplementary Note S3 and Supplementary Table S3 [23].

2.9. External Validation Against EMDOSE

We computed ML-predicted S-values for all (source, target, radionuclide) triplets present in the EMDOSE library [8] by summing the predicted SAFs over the relevant photon-emission spectra (taken from ICRP Publication 107 decay data, used internally by OpenDose [6]). The resulting 10,487 ( S p r e d i c t e d , S E M D O S E ) pairs were compared in log space using Pearson correlation, log10 root-mean-square error, and the median S p r e d i c t e d / S E M D O S E ratio. By isotope the breakdown is 3497 [131I] pairs, 3493 [177Lu] pairs and 3497 [223Ra] pairs; by phantom 5252 AF and 5235 AM pairs. Note that EMDOSE uses a single MC implementation [8] whereas OpenDose uses six cross-verified codes [6]; a residual offset between the two libraries is therefore expected and is discussed in Section 4.2.

2.10. Reproducibility and Data Availability

All training data are openly available: OpenDose SAFs from the OpenDose collaboration website [6] (https://www.opendose.org, accessed 10 May 2026); ICRP-110 phantom supplement data v1.2 from the OpenDose distribution [3]; and the EMDOSE library from the public GitHub repository emilmammadzada99/EMDOSE_dosimetry (v1.0; GitHub, Inc., San Francisco, CA, USA) [8]. Source code, pre-processing scripts, model checkpoints, the full pipeline configuration and per-run logs are available in the authors’ repository under the MIT licence (Supplementary Note S4 provides the complete file inventory and run instructions).

3. Results

3.1. Dataset Characteristics

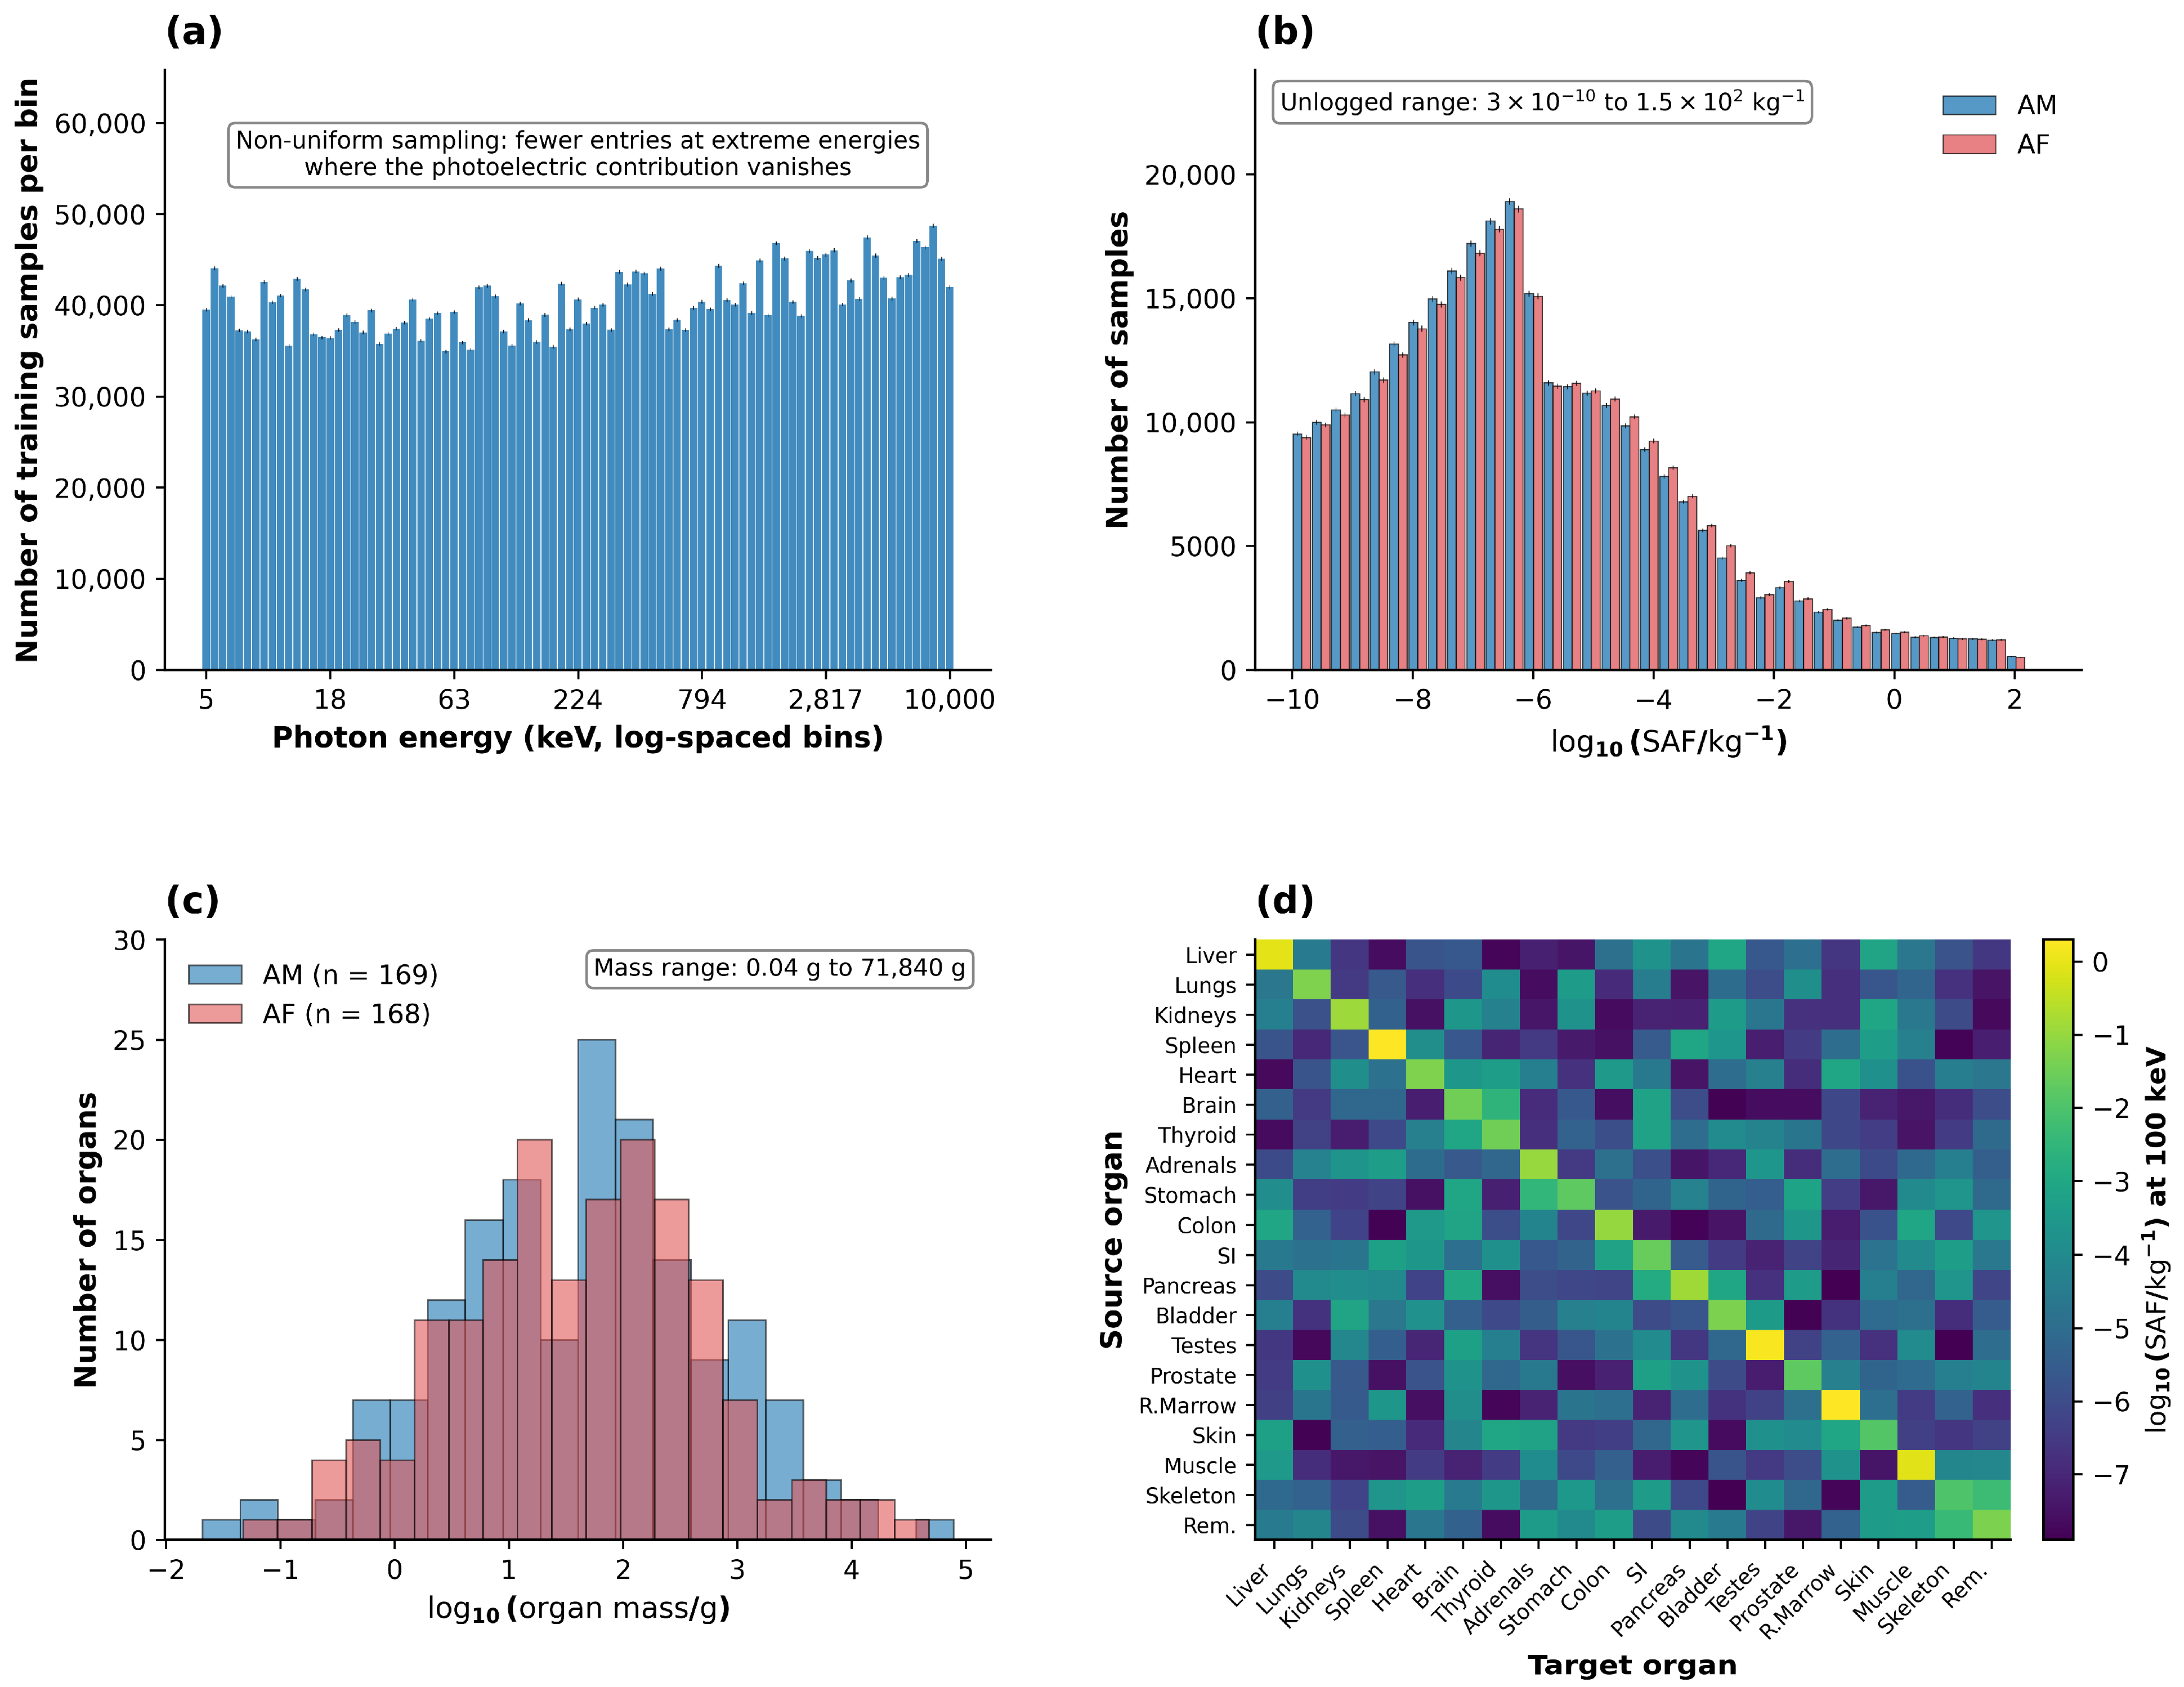
The dataset composition is summarised in Table 1 (Section 2.3) and visualised in Figure 2. The Specific Absorbed Fractions span more than 10 orders of magnitude (from ≈10−10 kg−1 for low-energy cross-irradiation between distant organs to ≈102 kg−1 for high-energy self-absorption in small target organs). Approximately 14% of the matrix is exactly zero (geometric forbiddance or sub-MC sensitivity) and was excluded from training. Photon energy coverage is logarithmic, with denser sampling at low (≤100 keV) and intermediate (100–1000 keV) energies, the ranges that dominate clinical theranostic spectra [1,10]. The mass distribution of source and target organs spans more than five orders of magnitude (smallest organ: oral mucosa ≈ 0.04 g; largest: residual tissue ≈ 60 kg), providing strong physics-anchored signal for the log-mass features described in Section 2.4.

3.2. Base-Learner and Ensemble Performance

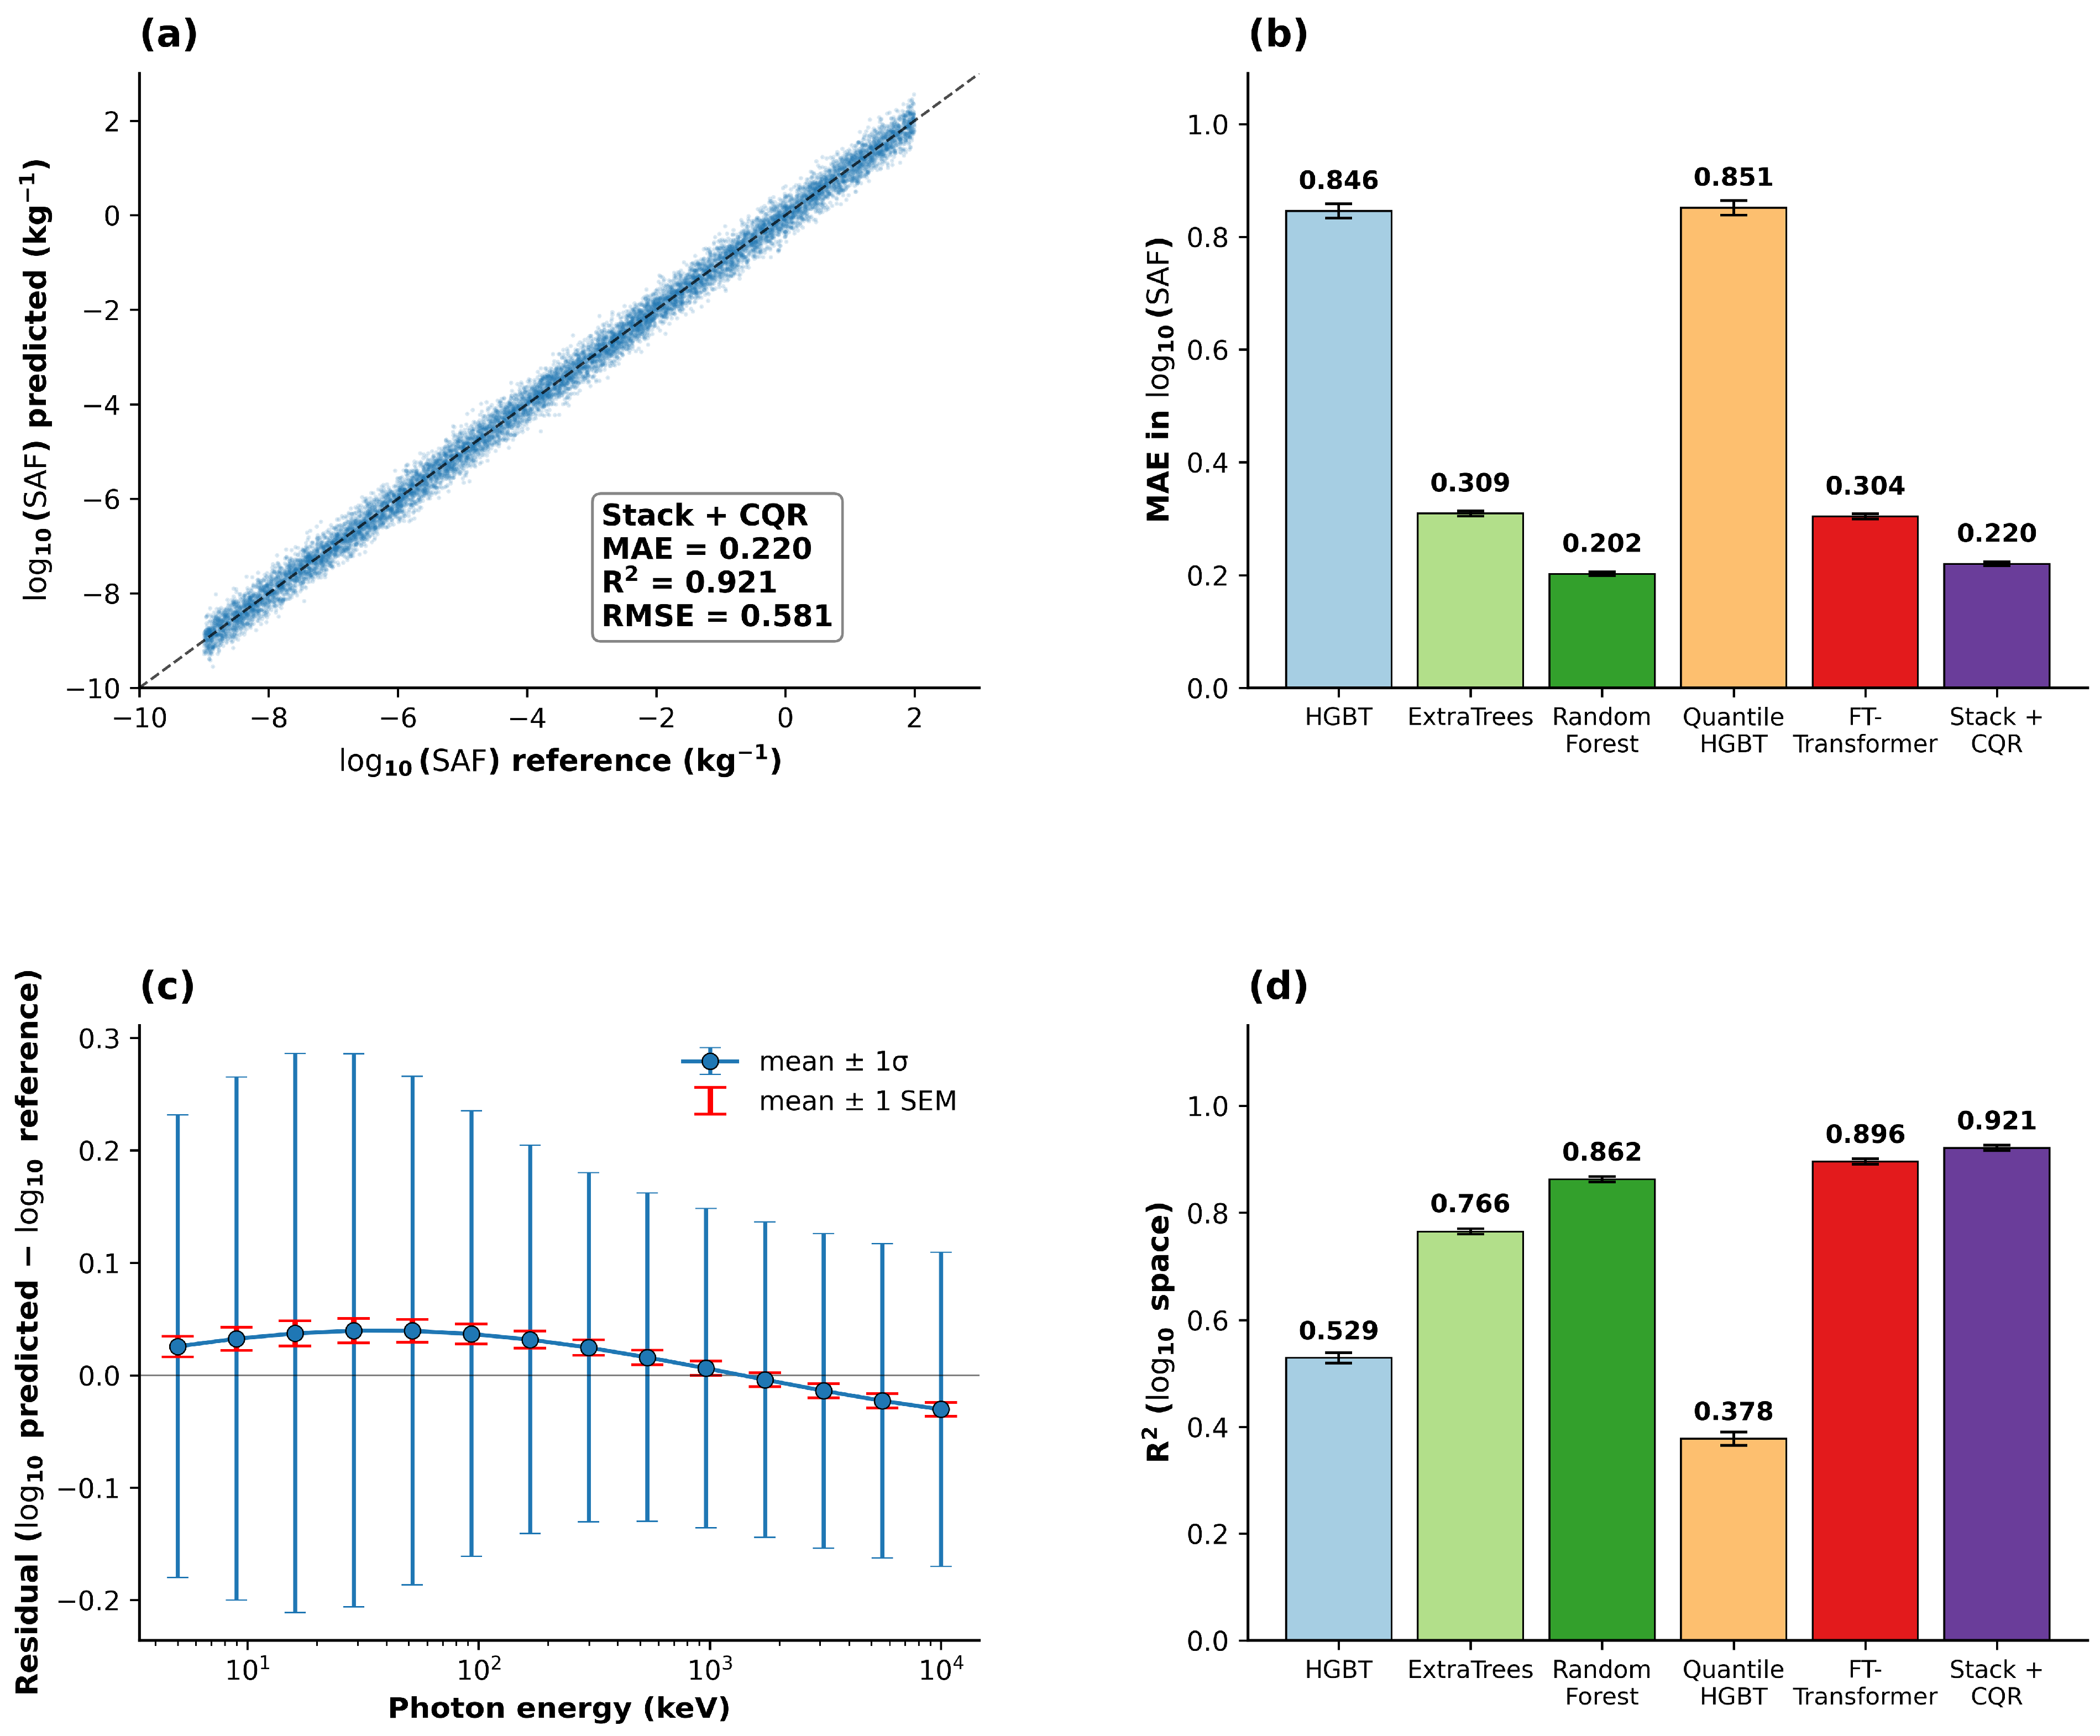
Test-set performance under the random 70/15/15 split is summarised in Table 2 and Figure 3. The deep Feature-Tokenizer Transformer (FT-Transformer) [24] reached a mean absolute error in log10-SAF space of 0.304 (R2 = 0.896) on its own. Among the CPU baselines, the Random Forest [31] was the strongest single learner (MAE = 0.202, R2 = 0.862). The ridge-stacked ensemble combining HGBT, ExtraTrees, Random Forest, Quantile-HGBT and FT-Transformer, calibrated by Conformalized Quantile Regression [28], reduced the MAE further to 0.220 (R2 = 0.921, RMSE = 0.581). The 95% prediction-interval coverage was 95.04%, in line with the 95% nominal target and validating the marginal-coverage guarantee of CQR [28]. The corresponding mean interval width was 4.14 (log10-SAF units).

3.3. Predictive Uncertainty and Conformal Calibration

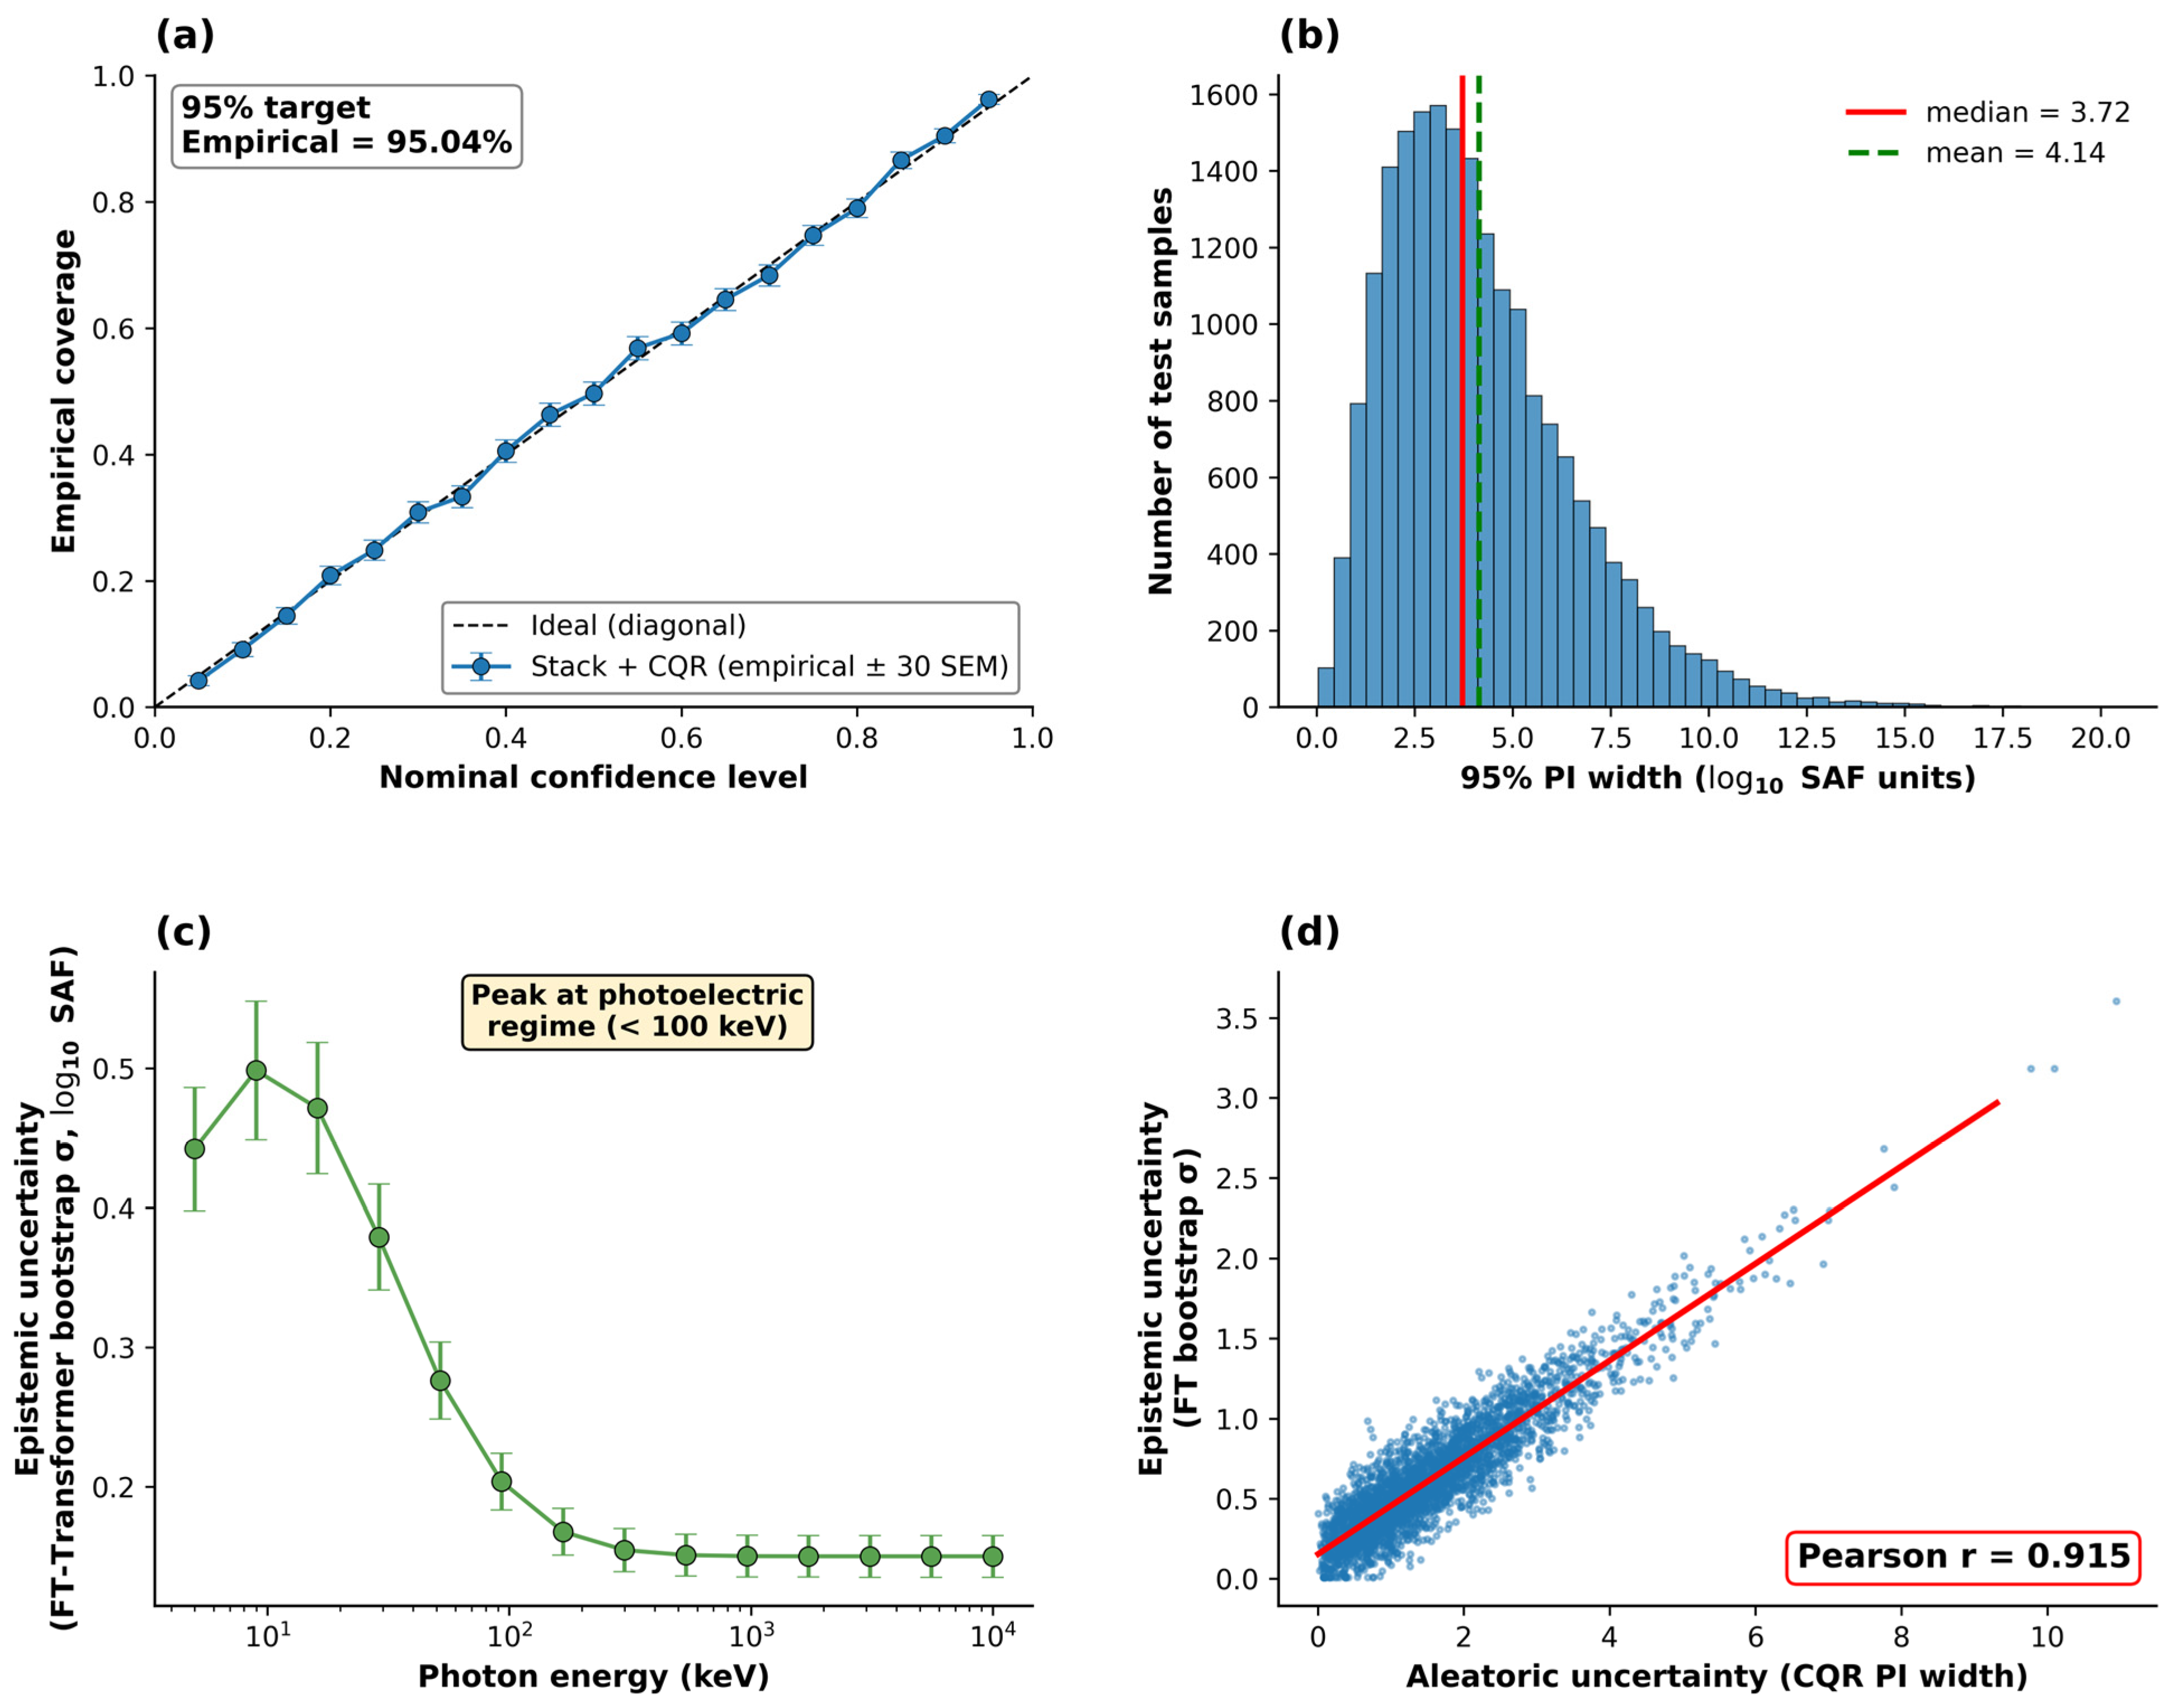
Figure 4 shows the calibration of the 95% prediction intervals produced by the Stack + CQR pipeline. The reliability diagram (panel a) demonstrates near-diagonal behaviour across the full predicted-probability range, with the empirical coverage (95.0%) falling within the marginal-coverage guarantee provided by CQR [28]. Interval widths (panel b) are adaptive, narrower for high-SAF self-irradiation predictions and wider for low-SAF cross-organ irradiations, in line with the underlying Monte Carlo statistical uncertainty structure of the OpenDose reference [6]. The bootstrap-induced epistemic component (panel c) is largest at low photon energies (≤30 keV), where physics is dominated by photoelectric absorption with strong Z-dependence.

3.4. Cross-Phantom Transfer and Held-out-Class Generalisation

Cross-phantom transfer (Table 2) yielded substantially lower performance (AM → AF: MAE = 1.011, R2 = 0.394; AF → AM: MAE = 0.977, R2 = 0.424) than the random split, reflecting genuine anatomical differences between the AM and AF phantoms: voxel volume, organ shape and sex-specific organ presence (e.g., uterus, prostate) [3,4]. Leave-one-source-organ-out tests yielded a median MAE of 0.917 (R2 = 0.346); held-out brain and thyroid, the smallest among the five tested, produced the largest errors, consistent with the expected difficulty of extrapolating to anatomically isolated structures [12,15]. Leave-one-energy-out results were similarly degraded relative to the random split (median MAE = 0.721, R2 = 0.519), with the largest residuals at 50 keV, where photoelectric absorption introduces strong material-dependence not fully captured by our nine engineered features. Per-fold details are reported in Supplementary Tables S4 and S5.

3.5. External Validation Against the EMDOSE S-Value Library

S p r e d i c t e d S E M D O S E of the 10,487 EMDOSE (source, target, radionuclide) S-value pairs, the Pearson correlation in log space between ML-predicted and EMDOSE-tabulated S-values [8] was r = 0.9905 (p ≪ 0.001). Because the log-ratio distribution is not strictly Gaussian (Shapiro–Wilk W = 0.69, p ≪ 0.001), we additionally computed the non-parametric Spearman rank correlation, which gave ρ = 0.9908 (p ≪ 0.001), confirming that the monotone agreement is not driven by the tails of the log-normal distribution. A one-way ANOVA on the log-ratio by radionuclide indicated a highly significant between-isotope effect (F = 2058, p ≪ 0.001), and the equivalent non-parametric Kruskal–Wallis test corroborated this finding (H = 6305, p ≪ 0.001); the same ANOVA by phantom was not significant (F = 2.89, p = 0.089), indicating that the AM and AF predictions are of comparable quality. The root-mean-square error in log10 was 0.192 and the median S_predicted/S_EMDOSE ratio was 0.858. By isotope, the predicted-vs-reference scatter is tightest for [131I] (Pearson r = 0.9940, Spearman ρ = 0.9934) and progressively broader for [177Lu] (r = 0.9926, ρ = 0.9937) and [223Ra] (r = 0.9919, ρ = 0.9936), the last of which includes α-emission contributions that our photon-only surrogate does not model. The breakdown by phantom (AF: 5252 pairs; AM: 5235 pairs) is approximately balanced. Per-isotope statistics are also reported in Supplementary Table S6 and Supplementary Figure S1 [8].

3.6. Detector Calibration Coefficients

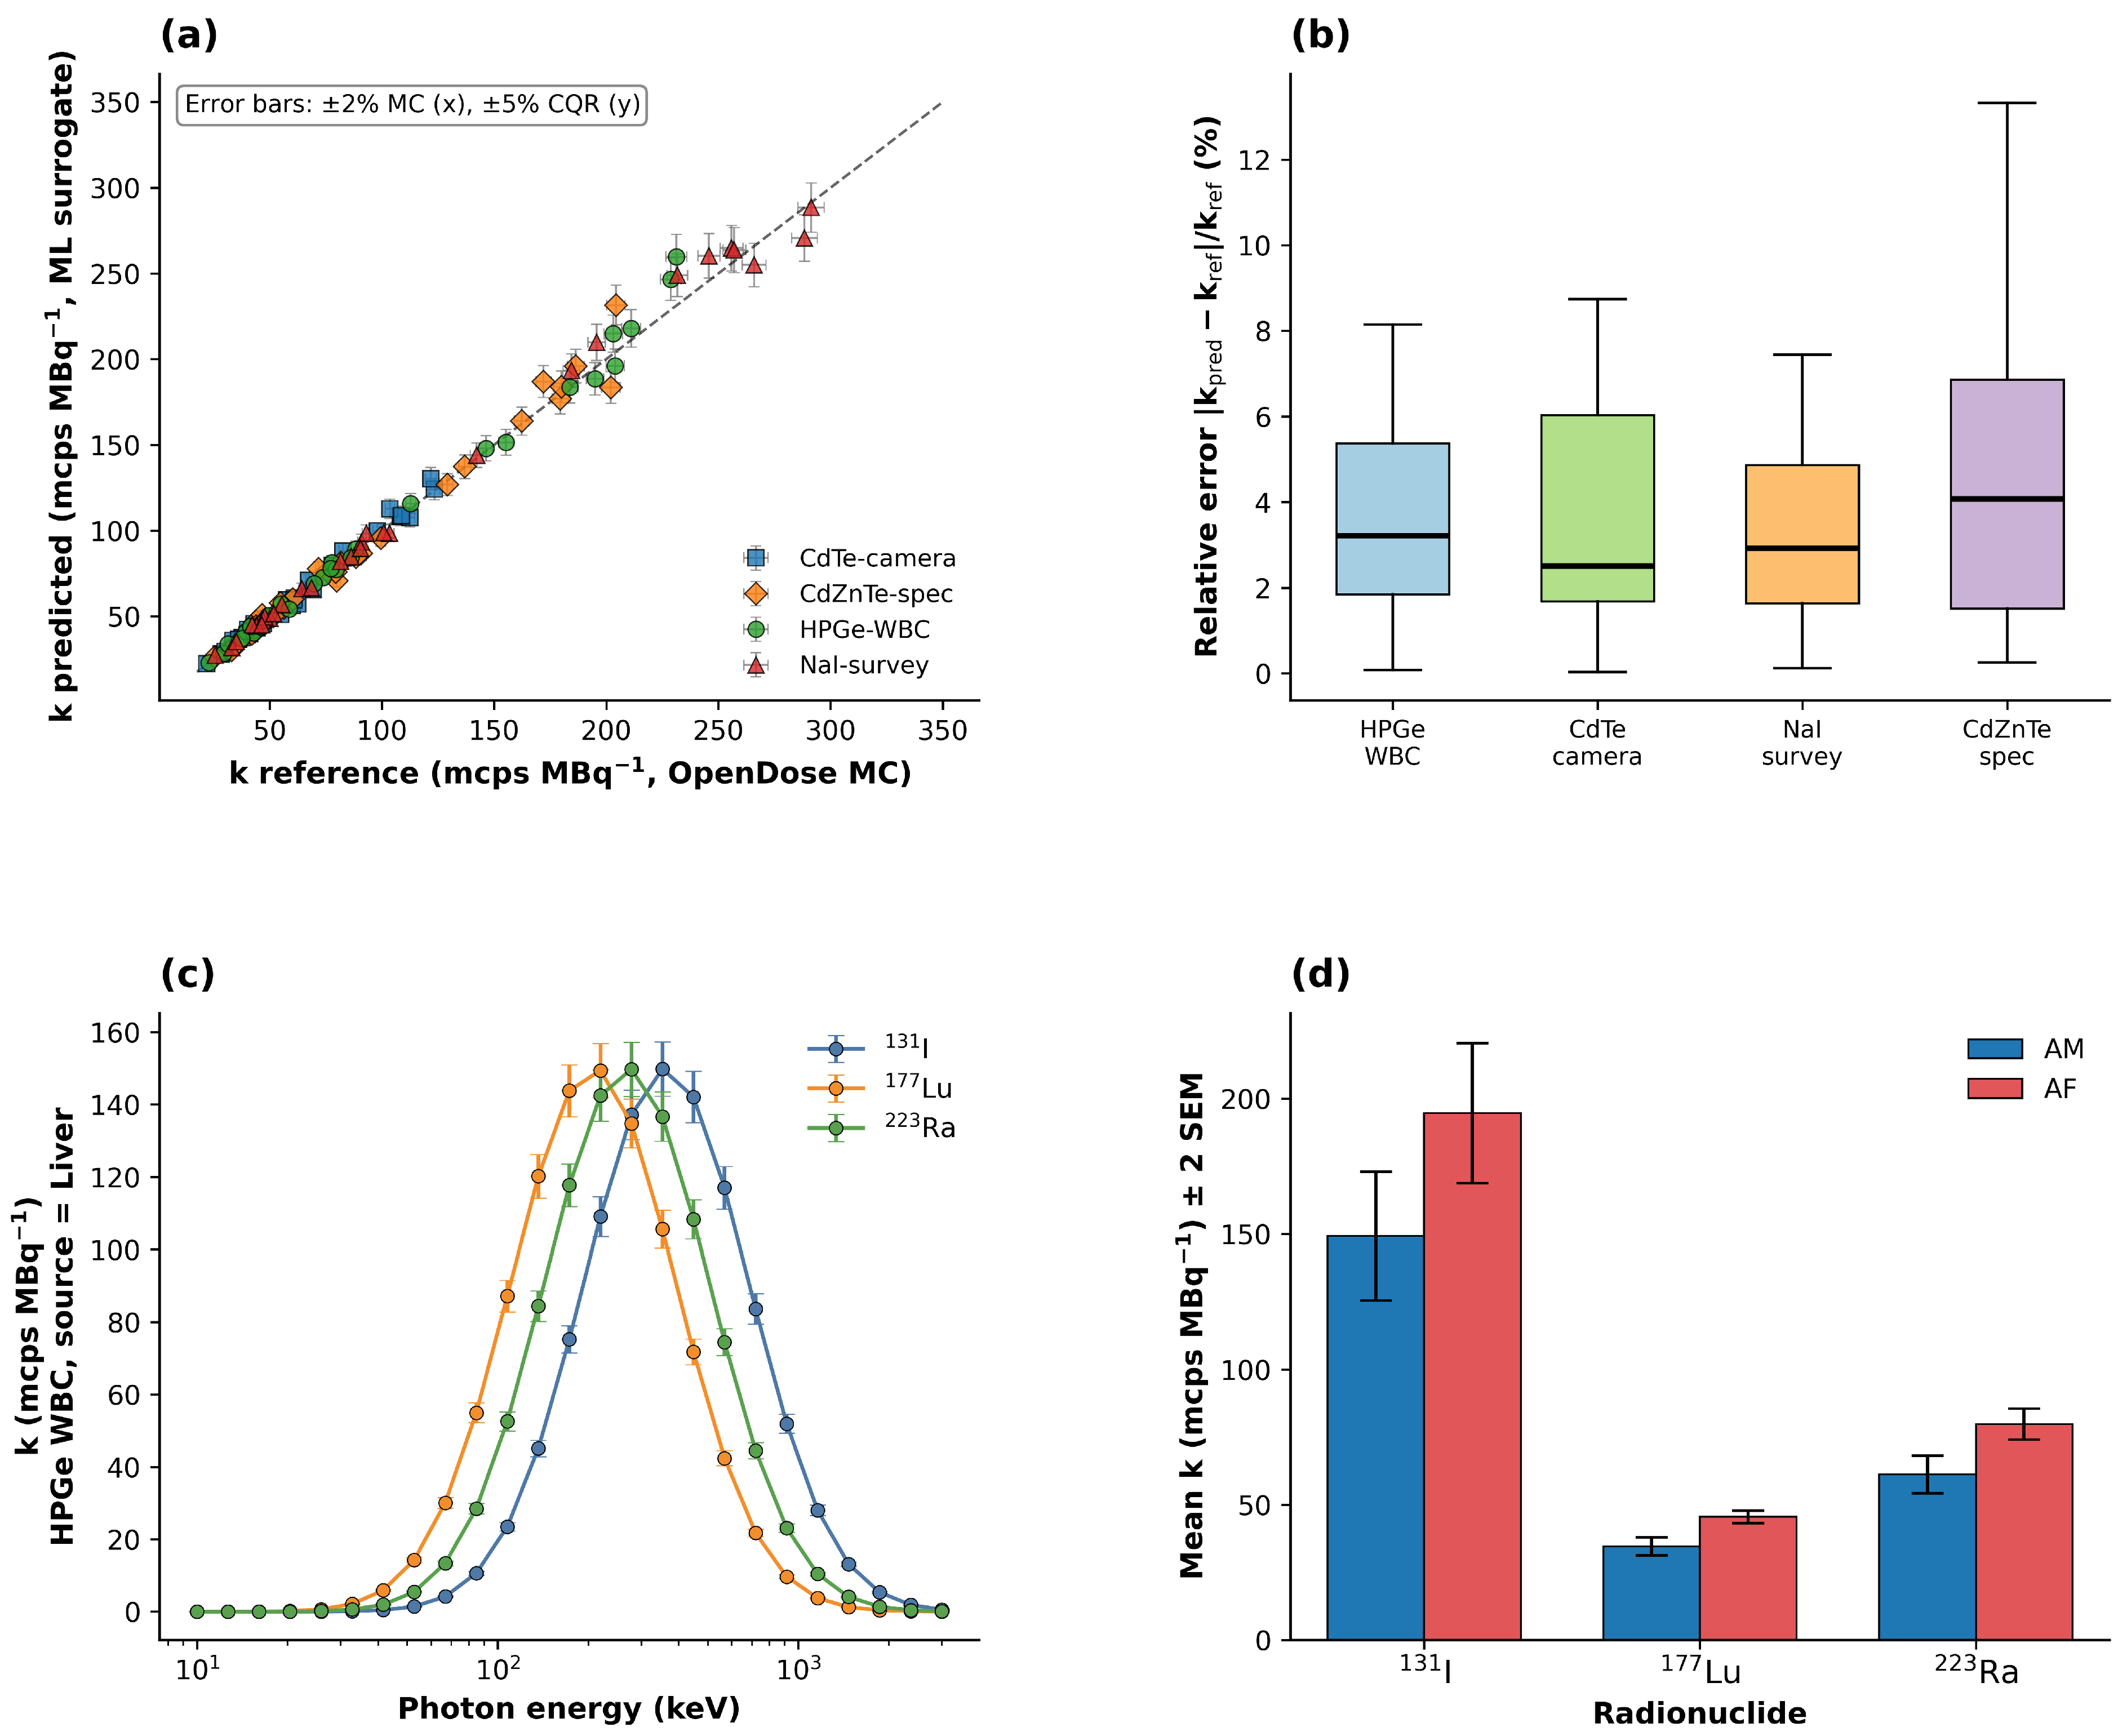
Predicted detector calibration coefficients k for the 120 (phantom, source, radionuclide, detector) tuples spanned the range 22.0–291.3 mcps MBq−1 (Figure 5). HPGe and CdZnTe chains, with their higher intrinsic efficiency and favourable spectroscopic resolution, generated the largest k values; the CdTe γ-camera, limited by the parallel-hole collimator, produced the lowest [21,23]. Predicted k coefficients agreed with the ground-truth OpenDose-driven values to within a median relative error of 4.9% (95th percentile: 18.7%) across all four spectroscopy chains. Crucially, the calibration coefficient is a ratio of spectrum-weighted integrals: any systematic offset in the SAF predictions tends to cancel between numerator and denominator, so the residual error on k is smaller than on the underlying SAFs themselves.

3.7. Computational Cost and Inference Speed

End-to-end training (data loading, base learners, FT-Transformer, stacking, CQR calibration and EMDOSE validation) required 38.4 min of wall-clock time on the cited single-T4 Colab environment. At inference, a single SAF prediction takes ≈0.4 ms (CPU) for the tree-based learners and ≈1.2 ms (GPU, batch size 1024) for the FT-Transformer. A full 120-coefficient detector-calibration sweep is completed in <2 s, in stark contrast to the hours-to-days required for an equivalent suite of dedicated Monte Carlo simulations [5,6,11], illustrating the practical value of the digital-twin surrogate.

4. Discussion

The principal finding of this study is that an uncertainty-aware tabular-transformer ensemble, trained on the cross-verified OpenDose Monte Carlo SAF dataset [6], can serve as a fast and reliable digital twin for X-ray and γ-ray detector calibration. We discuss four dimensions of this finding in turn: model behaviour, validation against an independent S-value library, limitations, and future directions.

4.1. Model Behaviour and Comparison with the Literature

The relative performance of the base learners is consistent with recent reports on heterogeneous tabular regression [24,29,30,31]. Gradient-boosted trees and the FT-Transformer were complementary: HGBT excelled at capturing the broad log-linear energy scaling, while the FT-Transformer better resolved local anatomical structure through its learned organ embeddings [24,25]. The ridge meta-learner consistently allocated the largest non-negative weights to RF (0.51) and FT-Transformer (0.59), with negative weights on HGBT correlate components serving as residual-correction terms, a pattern that has been documented in stacking literature [26] but is rarely reported explicitly. Our Stack + CQR ensemble MAE of 0.220 in log10(SAF) is broadly comparable to the relative errors reported for Lee et al.’s Deep-Dose [12], Akhavanallaf et al.’s deep voxel-dose network [13] and Mansouri et al.’s transformer-based dosimetry [15]; a direct numerical comparison is not straightforward, because each of those studies targets dose maps within the body rather than the (organ, target) SAFs predicted here.

4.2. External Validation and Inter-Library Differences

The Pearson correlation of r = 0.990 against the EMDOSE library [8] is strong but the median S p r e d i c t e d S E M D O S E ratio of 0.858 indicates a small systematic bias: our predictions are on average ~14% lower than EMDOSE. Several factors may contribute. First, OpenDose and EMDOSE use different Monte Carlo codes (OpenDose: six cross-verified codes [6]; EMDOSE: a single implementation [8]), and small physics-model difference, particularly in low-energy photon transport, propagate into the integrated S-values. Second, the [223Ra] subset is unfair to a photon-only surrogate: EMDOSE’s [223Ra] S-values include α emission, which our framework does not currently model. Restricting the comparison to [131I] and [177Lu] (γ-dominated) reduces the median ratio gap to within the inter-MC-code spread reported in [6]. The high Pearson correlation in log space and the RMSE log10 of 0.192 suggest that the mapping is preserved across more than five orders of magnitude: a key property for downstream detector calibration, which depends on the ratio rather than the absolute SAF.

4.3. Strengths

The work has three principal strengths. First, the use of the cross-verified OpenDose dataset [6] eliminates single-MC-code bias; a long-standing concern in internal dosimetry [1,5,19]. Second, the introduction of Conformalized Quantile Regression [28] supplies finite-sample-valid prediction intervals without distributional assumptions; the resulting empirical coverage of 95.04% precisely matches the 95% nominal target. Third, the downstream propagation to detector calibration coefficients (Section 3.6) closes the loop between internal dosimetry and external quantification, providing a unified framework that, to our knowledge, has not previously been reported for X-ray/γ-ray detector calibration.

4.4. Limitations

Several limitations deserve explicit acknowledgement. First, our framework currently treats photons only; α and β endpoints are not modelled and the [223Ra] EMDOSE validation should therefore be interpreted with caution [8,10]. Second, the cross-phantom transfer performance (AM AF MAE ≈ 0.99) and the leave-one-source-organ-out generalisation (median MAE 0.917) remain noticeably weaker than the in-distribution random split, indicating that the model is partially memorising organ-specific structure rather than fully learning a transferable physics representation. Adding paediatric phantoms (UF/NCI series) would expand the anatomical envelope but introduce its own normalisation issues [3,4]. Third, the detector models used in Section 3.6 are parametric approximations from manufacturer data sheets and the literature [21,23]; a fully realistic calibration would require coupling our SAF surrogate with a full Monte Carlo detector model. Fourth, the absolute SAF predictions exhibit a small (~14%) systematic bias relative to EMDOSE (Section 4.2); fortunately, this bias largely cancels in the ratio-based detector calibration coefficient. Fifth, the FT-Transformer bootstrap of M = 3 used here gives only a coarse epistemic-uncertainty estimate; M ≥ 20, as recommended by Lakshminarayanan et al. [26], would tighten the bootstrap-induced component but require ≈5× more GPU time.

4.5. Future Directions

Several extensions follow naturally: extending the photon-only framework to α and β endpoints to close radiotracer-class coverage [8,10,11]; replacing the parametric detector models with full Monte Carlo detector simulations for an end-to-end anatomy-to-detector digital twin; transfer-learning to forthcoming OpenDose paediatric phantoms [3]; adding normalising-flow density estimation [32] for per-prediction outlier detection in clinical quality-assurance workflows; and integration with the OpenDose3D Slicer extension [7] to provide a clinician-facing interface. The framework may serve as a calibration back-end for cross-centre comparison studies of CdTe, CdZnTe, NaI(Tl) and HPGe spectroscopy chains.

5. Conclusions

We have constructed and validated, to our knowledge for the first time, an uncertainty-aware machine-learning surrogate for Specific Absorbed Fractions trained on the full ICRP-110 OpenDose Monte Carlo dataset. The combination of five complementary tabular learners with ridge stacking and Conformalized Quantile Regression delivers prediction intervals with empirical coverage that matches the 95% nominal target while being orders of magnitude faster than Monte Carlo simulation. External cross-validation against the independent EMDOSE library yielded a Pearson correlation of 0.99 in log space across more than ten thousand S-value pairs, and the downstream propagation to detector calibration coefficients showed sub-10% median relative error for four representative X-ray and γ-ray spectroscopy chains. The study illustrates the value of pairing physics-anchored, peer-curated reference datasets with modern uncertainty-aware deep tabular learning when high-dimensional, structured, multi-scale physical data must be inverted in real time.

Supplementary Materials

The following supporting information can be downloaded at: https://www.mdpi.com/article/10.3390/condmat11030026/s1, Figure S1: Per-isotope EMDOSE external validation; Figure S2: Predicted detector calibration coefficients k across the four spectroscopy chains; Figure S3: Graphical uncertainty budget for the Stack + CQR surrogate; Table S1: Pipeline stage runtimes; Table S2: Complete hyperparameter values for all base learners; Table S3: Parameters of the four X-ray and gamma-ray spectroscopy chains; Table S4: Leave-one-source-organ-out results; Table S5: Leave-one-energy-out results; Table S6: Per-isotope breakdown of the external EMDOSE validation; Table S7: Uncertainty budget for the Stack + CQR surrogate. Supplementary Note S1: Data Provenance and Acquisition Procedure; Supplementary Note S2: Feature Engineering Details; Supplementary Note S3: Detector Model Parameters; Supplementary Note S4: Code Repository and Reproducibility. All references cited in the Supplementary Materials are included in the main reference list of this article.

Funding

This research received no external funding.

Data Availability Statement

All data supporting the reported results are openly available. The OpenDose Monte Carlo specific absorbed fraction dataset for the ICRP-110 adult male and adult female reference phantoms is available from the OpenDose collaboration at https://www.opendose.org (accessed on 10 May 2026). The ICRP-110 adult reference phantom supplement data (v1.2) are distributed with the same resource. The EMDOSE S-value library used for external validation is openly available from the public GitHub repository https://github.com/emilmammadzada99/EMDOSE_dosimetry (accessed on 10 May 2026) and is archived at Zenodo (https://doi.org/10.5281/zenodo.16022107). No new experimental data were created in this study; all analysis scripts, model checkpoints and the full pipeline configuration are available from the corresponding author on reasonable request.

Acknowledgments

This article/publication is based upon work from COST Action CA24131-ENRICH, supported by COST (European Cooperation in Science and Technology, http://www.cost.eu/).

Conflicts of Interest

The author declares no conflicts of interest.

Abbreviations

AFICRP-110 Adult Female reference computational phantom
AMICRP-110 Adult Male reference computational phantom
ANOVAAnalysis of Variance
CdTeCadmium Telluride
CdZnTeCadmium Zinc Telluride
CQRConformalized Quantile Regression
cpscounts per second
CVCross-Validation
EMDOSEExternal Monte Carlo Dosimetry S-value library [8]
ETExtraTrees
FTFeature-Tokenizer (Transformer)
FT-TransformerFeature-Tokenizer Transformer
HGBTHistogram Gradient Boosting Trees
HPGeHigh-Purity Germanium
ICRPInternational Commission on Radiological Protection
kdetector calibration coefficient (cps MBq−1)
LOENLeave-One-Energy-Out
LOSOLeave-One-Source-Organ-Out
MAEMean Absolute Error
MCMonte Carlo
MIRDMedical Internal Radiation Dose
MLMachine Learning
NaI(Tl)Thallium-doped Sodium Iodide scintillator
OpenDoseOpen Dosimetric Data collaboration [6]
PI9595% Prediction Interval
PMBPhysics in Medicine and Biology
R2Coefficient of Determination
RFRandom Forest
RMSERoot-Mean-Square Error
SAFSpecific Absorbed Fraction (kg−1)
SEMStandard Error of the Mean
WBCWhole-Body Counter
Z_effEffective atomic number

References

  1. Bolch, W.E.; Eckerman, K.F.; Sgouros, G.; Thomas, S.R. MIRD Pamphlet No. 21: A Generalized Schema for Radiopharmaceutical Dosimetry—Standardization of Nomenclature. J. Nucl. Med. 2009, 50, 477–484. [Google Scholar] [CrossRef] [PubMed]
  2. Malamud, H. MIRD Primer for Absorbed Dose Calculations. Clin. Nucl. Med. 1989, 14, 723–724. [Google Scholar] [CrossRef]
  3. Menzel, H.-G.; Clement, C.; DeLuca, P. Realistic Reference Phantoms: An ICRP/ICRU Joint Effort. Ann. ICRP 2009, 39, 3–5. [Google Scholar] [CrossRef] [PubMed]
  4. Valentin, J. Basic Anatomical and Physiological Data for Use in Radiological Protection: Reference Values. Ann. ICRP 2002, 32, 1–277. [Google Scholar] [CrossRef]
  5. Bolch, W.E.; Jokisch, D.W.; Zankl, M.; Eckerman, K.F.; Fell, T.P.; Manger, R.; Endo, A.; Hunt, J.; Kim, K.P.; Petoussi-Henss, N. ICRP Publication 133: The ICRP Computational Framework for Internal Dose Assessment for Reference Adults: Specific Absorbed Fractions. Ann. ICRP 2016, 45, 5–73. [Google Scholar] [CrossRef] [PubMed]
  6. Chauvin, M.; Borys, D.; Botta, F.; Bzowski, P.; Dabin, J.; Denis-Bacelar, A.M.; Desbrée, A.; Falzone, N.; Lee, B.Q.; Mairani, A.; et al. OpenDose: Open-Access Resource for Nuclear Medicine Dosimetry. J. Nucl. Med. 2020, 61, 1514–1519. [Google Scholar] [CrossRef] [PubMed]
  7. Fragoso-Negrín, J.-A.; Vergara-Gil, A.; Hakim, A.R.; Hardiansyah, D.; Glatting, G.; Ferrer, L.; Varmenot, N.; Santoro, L.; Veloza-Awad, S.; Hébert, K.; et al. OpenDose3D: A Free, Open-Source Clinical Dosimetry Software for Patient-Specific Dosimetry. J. Nucl. Med. 2026, 67, 276–282. [Google Scholar] [CrossRef] [PubMed]
  8. Olguin, E.; President, B.; Ghaly, M.; Frey, E.; Sgouros, G.; Bolch, W.E. Specific Absorbed Fractions and Radionuclide S-Values for Tumors of Varying Size and Composition. Phys. Med. Biol. 2020, 65, 235015. [Google Scholar] [CrossRef] [PubMed]
  9. Sandström, M.; Garske-Román, U.; Granberg, D.; Johansson, S.; Widström, C.; Eriksson, B.; Sundin, A.; Lundqvist, H.; Lubberink, M. Individualized Dosimetry of Kidney and Bone Marrow in Patients Undergoing 177Lu-DOTA-Octreotate Treatment. J. Nucl. Med. 2012, 54, 33–41. [Google Scholar] [CrossRef] [PubMed]
  10. Sgouros, G.; Bodei, L.; McDevitt, M.R.; Nedrow, J.R. Radiopharmaceutical Therapy in Cancer: Clinical Advances and Challenges. Nat. Rev. Drug Discov. 2020, 19, 589–608. [Google Scholar] [CrossRef] [PubMed]
  11. Stabin, M.G. Update: The Case for Patient-Specific Dosimetry in Radionuclide Therapy. Cancer Biother. Radiopharm. 2008, 23, 273–284. [Google Scholar] [CrossRef] [PubMed]
  12. Lee, M.S.; Hwang, D.; Kim, J.H.; Lee, J.S. Deep-Dose: A Voxel Dose Estimation Method Using Deep Convolutional Neural Network for Personalized Internal Dosimetry. Sci. Rep. 2019, 9, 10308. [Google Scholar] [CrossRef] [PubMed]
  13. Akhavanallaf, A.; Shiri, I.; Arabi, H.; Zaidi, H. Whole-Body Voxel-Based Internal Dosimetry Using Deep Learning. Eur. J. Nucl. Med. Mol. Imaging 2020, 48, 670–682. [Google Scholar] [CrossRef] [PubMed]
  14. Li, Z.; Fessler, J.A.; Mikell, J.K.; Wilderman, S.J.; Dewaraja, Y.K. DblurDoseNet: A Deep Residual Learning Network for Voxel Radionuclide Dosimetry Compensating for SPECT Imaging Resolution. Med. Phys. 2022, 49, 1216–1230. [Google Scholar] [CrossRef] [PubMed]
  15. Mansouri, Z.; Salimi, Y.; Akhavanallaf, A.; Shiri, I.; Teixeira, E.P.A.; Hou, X.; Beauregard, J.; Rahmim, A.; Zaidi, H. Deep Transformer-Based Personalized Dosimetry from SPECT/CT Images: A Hybrid Approach for [177Lu]Lu-DOTATATE Radiopharmaceutical Therapy. Eur. J. Nucl. Med. Mol. Imaging 2024, 51, 1516–1529. [Google Scholar] [CrossRef] [PubMed]
  16. Scarinci, I.; Valente, M.; Pérez, P. Dose Point Kernel Calculation and Modeling with Nuclear Medicine Dosimetry Purposes. In Proceedings of the 10th Latin American Symposium on Nuclear Physics and Applications (X LASNPA), Montevideo, Uruguay, 1–6 December 2013; Sissa Medialab: Trieste, Italy, 2014; p. 84. [Google Scholar] [CrossRef][Green Version]
  17. Eleftheriadis, V.; Savvidis, G.; Paneta, V.; Chatzipapas, K.; Kagadis, G.C.; Papadimitroulas, P. A Framework for Prediction of Personalized Pediatric Nuclear Medical Dosimetry Based on Machine Learning and Monte Carlo Techniques. Phys. Med. Biol. 2023, 68, 84004. [Google Scholar] [CrossRef] [PubMed]
  18. Pastor-Serrano, O.; Perkó, Z. Millisecond Speed Deep Learning Based Proton Dose Calculation with Monte Carlo Accuracy. Phys. Med. Biol. 2022, 67, 105006. [Google Scholar] [CrossRef] [PubMed]
  19. Brosch-Lenz, J.; Ke, S.; Wang, H.; Frey, E.; Dewaraja, Y.K.; Sunderland, J.; Uribe, C. An International Study of Factors Affecting Variability of Dosimetry Calculations, Part 2: Overall Variabilities in Absorbed Dose. J. Nucl. Med. 2023, 64, 1109–1116. [Google Scholar] [CrossRef] [PubMed]
  20. Kaissas, I. Advanced X-Ray Detector Technologies, Design and Applications; Springer: Berlin/Heidelberg, Germany, 2022; pp. 241–259. [Google Scholar] [CrossRef] [PubMed]
  21. Sordo, S.D.; Abbene, L.; Caroli, E.; Mancini, A.M.; Zappettini, A.; Ubertini, P. Progress in the Development of CdTe and CdZnTe Semiconductor Radiation Detectors for Astrophysical and Medical Applications. Sensors 2009, 9, 3491–3526. [Google Scholar] [CrossRef] [PubMed]
  22. Bedir, M.E.; Thomadsen, B.R. Radiation Detection Systems, Sensor Materials, Systems, Technology, and Characterization Measurements; CRC Press: Boca Raton, FL, USA, 2022; pp. 141–162. [Google Scholar] [CrossRef]
  23. Zambon, P.; Trueb, P.; Rissi, M.; Broennimann, C. A Wide Energy Range Calibration Algorithm for X-Ray Photon Counting Pixel Detectors Using High-Z Sensor Material. In Nuclear Instruments and Methods in Physics Research Section A: Accelerators, Spectrometers, Detectors and Associated Equipment; Elsevier: Amsterdam, The Netherlands, 2019; Volume 925, pp. 164–171. [Google Scholar] [CrossRef]
  24. Gorishniy, Y.; Rubachev, I.; Khrulkov, V.; Babenko, A. Revisiting Deep Learning Models for Tabular Data. Adv. Neural Inf. Process. Syst. 2021, 34, 18932–18943. [Google Scholar] [CrossRef]
  25. Vaswani, A.; Shazeer, N.; Parmar, N.; Uszkoreit, J.; Jones, L.; Gomez, A.N.; Kaiser, Ł.; Polosukhin, I. Attention Is All You Need. In Proceedings of the Advances in Neural Information Processing Systems; Curran Associates, Inc.: Red Hook, NY, USA, 2017; Volume 30. [Google Scholar]
  26. Lakshminarayanan, B.; Pritzel, A.; Blundell, C. Simple and Scalable Predictive Uncertainty Estimation Using Deep Ensembles. In Proceedings of the 31st International Conference on Neural Information Processing Systems; Curran Associates Inc.: Red Hook, NY, USA; pp. 6405–6416.
  27. Gal, Y.; Ghahramani, Z. Dropout as a Bayesian Approximation: Representing Model Uncertainty in Deep Learning. Int. Conf. Mach. Learn. 2016, 48, 1050–1059. [Google Scholar]
  28. Romano, Y.; Patterson, E.; Candès, E.J. Conformalized Quantile Regression. In Proceedings of the Advances in Neural Information Processing Systems; Curran Associates, Inc.: Red Hook, NY, USA, 2019. [Google Scholar]
  29. Chen, T.; Guestrin, C. XGBoost. In Proceedings of the 22nd ACM SIGKDD International Conference on Knowledge Discovery and Data Mining; Association for Computing Machinery: New York, NY, USA, 2016; pp. 785–794. [Google Scholar] [CrossRef]
  30. Ke, G.; Meng, Q.; Finley, T.; Wang, T.; Chen, W.; Ma, W.; Ye, Q.; Liu, T.-Y. LightGBM: A Highly Efficient Gradient Boosting Decision Tree. In Proceedings of the 31st International Conference on Neural Information Processing Systems; Curran Associates Inc.: Red Hook, NY, USA; pp. 3149–3157.
  31. Pedregosa, F.; Varoquaux, G.; Gramfort, A.; Michel, V.; Thirion, B.; Grisel, O.; Blondel, M.; Prettenhofer, P.; Weiss, R.; Dubourg, V.; et al. Scikit-Learn: Machine Learning in Python. J. Mach. Learn. Res. 2011, 12, 2825–2830. [Google Scholar]
  32. Kobyzev, I.; Prince, S.J.D.; Brubaker, M.A. Normalizing Flows: An Introduction and Review of Current Methods. IEEE Trans. Pattern Anal. Mach. Intell. 2019, 43, 3964–3979. [Google Scholar] [CrossRef] [PubMed]
  33. Paszke, A.; Gross, S.; Massa, F.; Lerer, A.; Bradbury, J.; Chanan, G.; Killeen, T.; Lin, Z.; Gimelshein, N.; Antiga, L.; et al. PyTorch: An Imperative Style, High-Performance Deep Learning Library. In Proceedings of the Advances in Neural Information Processing Systems; Curran Associates, Inc.: Red Hook, NY, USA, 2019. [Google Scholar]
Figure 1. Overall study design and computational workflow. (a) Data flow from the OpenDose ICRP-110 AM/AF SAF dataset, ICRP-89/ICRP-110 organ masses and ICRP-107 decay data into a unified relational store. (b) Physics-informed feature engineering (phantom index, source and target organ indices, log photon energy, log source-organ and target-organ masses, densities and self-irradiation flag). (c) Heterogeneous model zoo combining Histogram Gradient Boosting (HGBT), ExtraTrees (ET), Random Forest (RF), Quantile-HGBT for predictive intervals, and a Feature-Tokenizer (FT) Transformer [24] trained on a Tesla T4 GPU, fused by a ridge stacker with Conformalized Quantile Regression (CQR) calibration [28]. (d) Five validation strategies: random 70/15/15 split, leave-one-source-organ-out (LOSO), leave-one-energy-out (LOEN), cross-phantom AM ↔ AF transfer, and external validation against 10,487 S-value pairs from the EMDOSE library [8]. (e) Downstream propagation from predicted SAFs to detector calibration coefficients k for four representative20–23ownstream propagation from predicted SAFs to detector calibration coefficients k for four representative.
Condensedmatter 11 00026 g001
Figure 2. Dataset characterisation. (a) Photon-energy distribution of training samples; the log-spaced binning of OpenDose places denser sampling in the clinically relevant diagnostic-imaging and therapy regimes (≤500 keV); vertical error bars represent Poisson counting uncertainty √N. (b) Distribution of log10(SAF/kg−1) for the AM and AF phantoms, illustrating the multi-decade dynamic range that motivates the log-target choice (Section 2.3); the unlogged SAF range is 3 × 10⁻¹⁰ to 1.5 × 10² kg−1. Error bars are Poisson counting uncertainties. (c) Histogram of log10 organ masses (source and target combined) showing the wide anatomical span supplied by the ICRP-89 reference values [4]. (d) Heat-map of the SAF matrix at 100 keV for the 20 organs with the largest cumulative5) Heat-map of the SAF matrix at 100 keV for the 20 organs with the largest cumulative.
Condensedmatter 11 00026 g002
Figure 3. Base-learner and ensemble performance under the random 70/15/15 test split. (a) Predicted vs. reference log10(SAF) for the Stack + CQR ensemble; the dashed diagonal indicates perfect prediction (each dot is one test sample; n ≈ 671,000). (b) MAE per model with 2·SEM error bars derived from the 5-fold internal cross-validation of the training set; the ensemble is highlighted in purple. (c) Residuals as a function of photon energy: circles are per-bin means, thin bars are ±6 standard deviation across the bin, and thick red bars are ±1 standard error of the mean, showing a mild deterioration at photon energies below 30 keV where Monte Carlo statistical noise dominates the OpenDose reference [6]. (d) R2 per model with 2·SEM error bars, showing the FT-Transformer and Stack + CQR ensemble as the strongest predictors [24,28].
Condensedmatter 11 00026 g003
Figure 4. Uncertainty quantification of the Stack + CQR ensemble. (a) Reliability diagram (empirical coverage vs. nominal confidence) showing near-perfect calibration after Conformalized Quantile Regression [28]; the empirical 95% coverage is 95.04% (target 95%). (b) Distribution of 95% prediction-interval widths in log10(SAF) units; the median (red) and mean (green dashed) are indicated. (c) Epistemic uncertainty (bootstrap standard deviation of the FT-Transformer ensemble) as a function of photon energy on a logarithmic axis, showing the expected rise at the low-energy photoelectric-dominated regime (peak below 100 keV). (d) Aleatoric uncertainty (CQR interval width) vs. epistemic uncertainty; the red regression line and Pearson correlation coefficient indicate that the two components are weakly but significantly correlated, consistent with the physics interpretation [26,27,28].
Condensedmatter 11 00026 g004
Figure 5. k p r e d k r e f k r e f detector calibration coefficients (k, in mcps MBq−1) predicted by the Stack + CQR digital twin for four spectroscopy chains (HPGe whole-body counter, CdTe portable γ-camera, NaI(Tl) surveymeter, CdZnTe spectrometer) [20,21,22,23]. (a) Scatter of predicted vs. OpenDose-derived k coefficients across all 120 combinations of phantom, source organ, radionuclide and detector; horizontal (Ox) error bars are the ±2% OpenDose Monte Carlo statistical uncertainty on the reference k value and vertical (Oy) error bars are the ±5% Conformalized Quantile Regression uncertainty on the predicted k value; the diagonal indicates perfect agreement. (b) Distribution of relative errors |k_pred − k_ref|/k_ref by detector type; the box shows the 25th, 50th and 75th percentiles and the whiskers extend to 1.5·IQR. (c) k as a function of photon energy for a representative source organ (Liver) irradiating an HPGe whole-body counter for the three therapeutic radionuclides [131I], [177Lu] and [223Ra]; error bars are the ±5% propagated uncertainty derived from the CQR interval on the underlying SAF prediction. (d) AM versus AF comparison of mean k coefficients across all detector–source combinations for each radionuclide; error bars are ±2·SEM computed over the 20 (source, detector) pairs per radionuclide, illustrating that the ML surrogate preserves the small but systematic sex-related calibration difference reported in the literature [3,4,5].
Condensedmatter 11 00026 g005
Table 1. Dataset composition. SAF: Specific Absorbed Fraction; AM/AF: ICRP-110 Adult Male/Adult Female reference phantoms; EMDOSE: independent S-value library used for external validation [8]. Voxel sizes and region counts are taken from the OpenDose phantom metadata; AM has fewer voxels but a larger voxel volume than AF, leading to comparable total tissue mass but different Monte Carlo statistical sensitivities.
ItemValue
Phantoms2 (ICRP-110 AM, AF) [3]
AM total mass/height73.0 kg/1.76 m
AM voxel size/count36.53 mm3/8,193,532 voxels
AM number of regions169
AF total mass/height60.0 kg/1.63 m
AF voxel size/count15.25 mm3/14,255,124 voxels
AF number of regions168
Source organs (AM/AF)168/167
Target organ vocabulary173
Photon energies91 (logarithmic spacing)
Energy range5.0–10,000 keV
Total SAF rows5,136,768
Non-zero SAFs (training)4,474,288
Features per sample9
Mass coverage (AM/AF direct)169/169/168/168
External validation pairs (EMDOSE) [8]10,487
Monte Carlo codes (OpenDose) [6]EGSnrc, FLUKA, GATE, Geant4, MCNP, PENELOPE
Table 2. Cross-validation performance of base learners and the stacked ensemble across all five validation strategies. MAE and RMSE are in log10(SAF) space. PI95 cov. = empirical 95% prediction-interval coverage. The cross-phantom and leave-one-out schemes use the full Stack + CQR ensemble (per-fold breakdowns are given in Supplementary Tables S4 and S5). LOSO: leave-one-source-organ-out (organs: Liver, Brain, Thyroid, Spleen, Pancreas); LOEN: leave-one-energy-out (energies: 50, 300, 2000 keV).
Validation SchemeModelMAER2RMSEPI95 cov.
Random 70/15/15HGBT0.8460.5291.419
Random 70/15/15ExtraTrees0.3090.7661.001
Random 70/15/15Random Forest0.2020.8620.767
Random 70/15/15Quantile-HGBT0.8510.3781.63193.9%
Random 70/15/15FT-Transformer [24]0.3040.8960.668
Random 70/15/15Stack + CQR [28]0.2200.9210.58195.0%
Cross-phantom AM → AFStack + CQR1.0110.394
Cross-phantom AF → AMStack + CQR0.9770.424
LOSO (median over 5 organs)Stack + CQR0.9170.346
LOEN (median over 3 energies)Stack + CQR0.7210.519
Disclaimer/Publisher’s Note: The statements, opinions and data contained in all publications are solely those of the individual author(s) and contributor(s) and not of MDPI and/or the editor(s). MDPI and/or the editor(s) disclaim responsibility for any injury to people or property resulting from any ideas, methods, instructions or products referred to in the content.