Article

Piezoelectric Double Layer Pressure Sensors: An Analytical Study and Multiphysics Simulation

by
Moirangthem Shamjit Singh
1,
Pradip Kumar Kalita
1 and
Maibam Sanju Meetei
2,*
1
Department of Physics, Rajiv Gandhi University, Papum Pare 791112, Arunachal Pradesh, India
2
Department of Electronics and Communication Engineering (ECE), Rajiv Gandhi University, Papum Pare 791112, Arunachal Pradesh, India
*
Author to whom correspondence should be addressed.
Condens. Matter 2026, 11(3), 24; https://doi.org/10.3390/condmat11030024
Submission received: 16 April 2026 / Revised: 10 June 2026 / Accepted: 23 June 2026 / Published: 30 June 2026
(This article belongs to the Section Physics of Materials)

Abstract

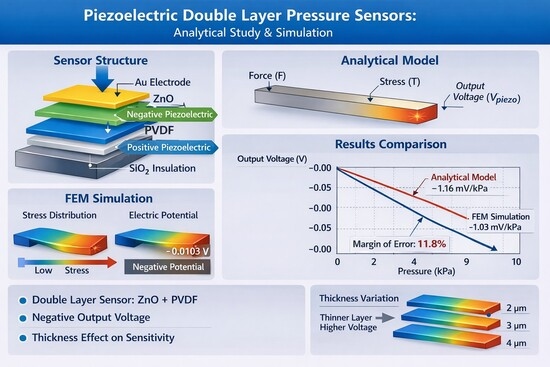
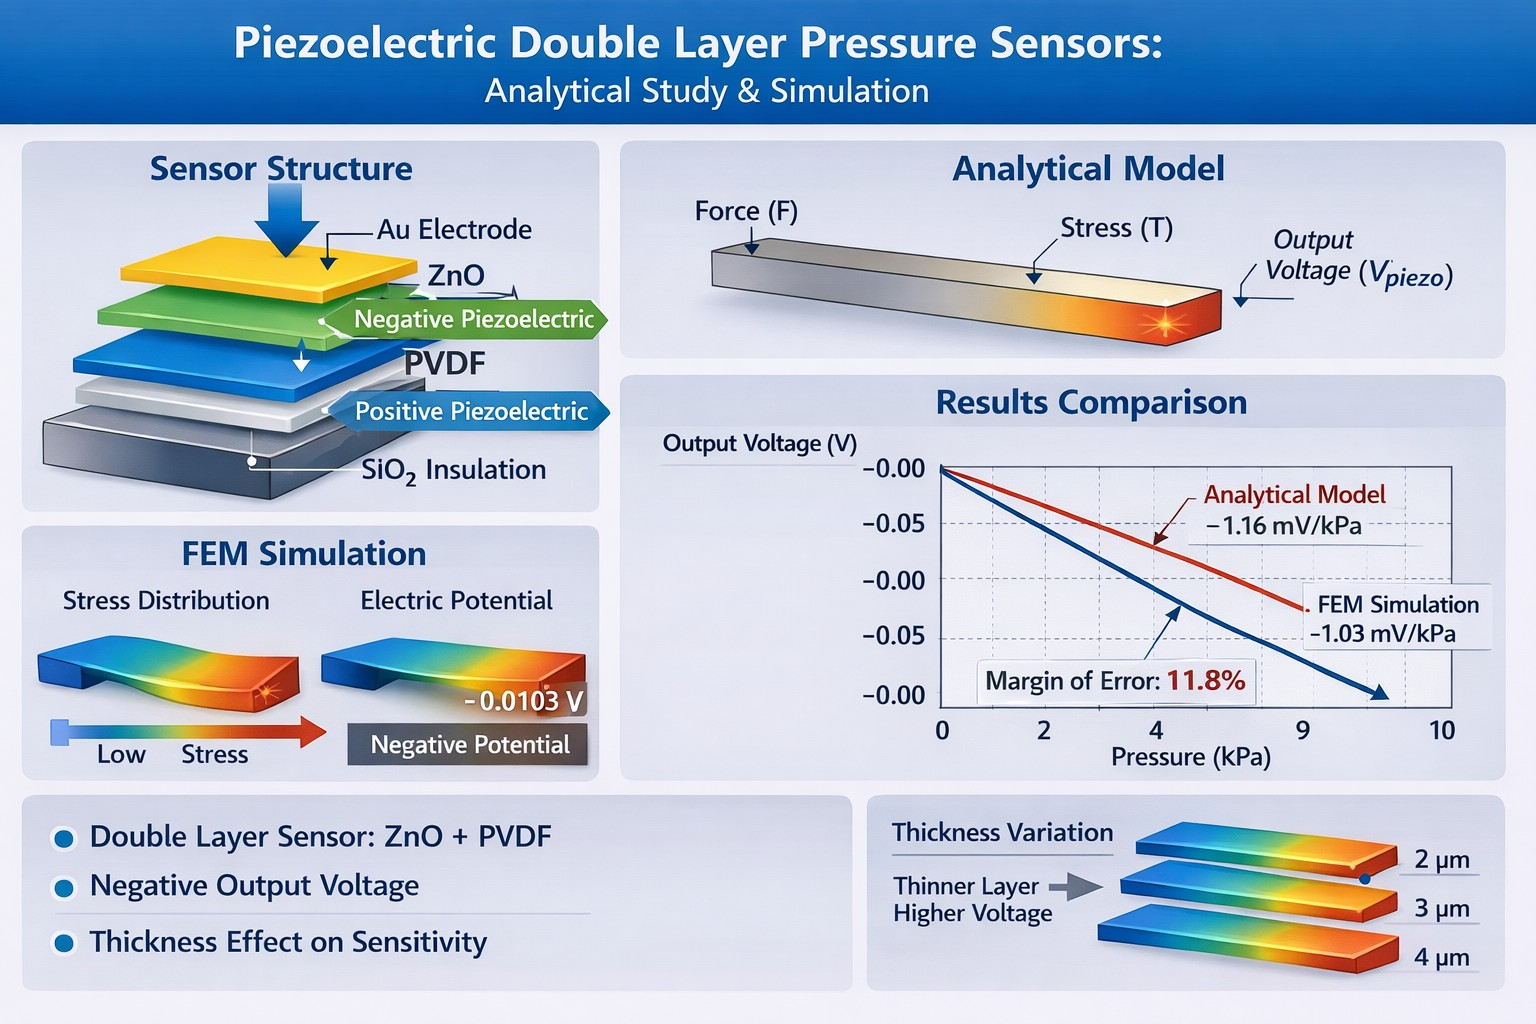
This study presents both the analytical modeling and simulation of a cantilever pressure sensor with double-layer piezoelectric materials, specifically ZnO and PVDF, which have negative and positive voltage coefficients, in order to investigate the performance of the sensor and to validate the analytical model with simulation. A detailed three-dimensional sensor model was developed in FEM, comprising gold (Au) as electrodes, silicon dioxide (SiO2) as an insulating layer, and silicon (Si) as a substrate. Simulations performed across a pressure range of 0–10 kPa revealed a linear output voltage response, and the average margin of error (MoE) between the calculated and simulated values is approximately 11.8%. The observed net potential difference exhibited a negative polarity, primarily due to the dominant effect of ZnO, which has negative piezoelectric voltage coefficients. Comparison of analytical and simulated results shows close agreement, with slope values of −1.16 mV/kPa and −1.03 mV/kPa, respectively, validating the FEM model’s accuracy. From the analytical model, it is observed that the sensitivity of the sensor varies with piezoelectric voltage coefficients, stress produced on the piezoelectric surface and the thickness of the piezoelectric material. Various simulation results show that the output voltage increases as the thickness of ZnO and PVDF decreases.

Graphical Abstract

1. Introduction

Piezoelectric pressure sensors use the special properties of piezoelectric materials, which can transform mechanical pressure into computable electrical signals, thereby fusing cutting-edge material science with precise engineering. Certain crystalline materials, including quartz, aluminum nitrate (AlN), zinc oxide (ZnO), lead zirconate titanate (PZT) and polymer material polyvinylidene fluoride (PVDF), produce electric charge when mechanical stress is applied [1,2,3]. This phenomenon is known as the piezoelectric effect, and it is the basis for how these sensors work.
Piezoelectric pressure sensors are widely used where dynamic performance and transient detections are required because they generate an electric charge directly in response to time-varying mechanical strain and therefore respond inherently to AC and transient stimuli without the need for an external DC bias or slow conditioning circuitry. This intrinsic electromechanical coupling gives piezoelectric devices very fast response times and broad usable bandwidths (often extending to kHz or higher in practical transducers), enabling reliable capture of rapid pressure transients and vibrations [4,5]. Additionally, modern piezoelectric thin-film and nanocomposite designs combine high electromechanical coefficients with engineered microstructures to deliver high sensitivity down to small pressure changes and millisecond (or sub-millisecond) response times in flexible and MEMS implementations [6,7,8]. For these reasons, while capacitive and piezoresistive sensors excel in many static and low-frequency sensing roles (and can achieve very high static sensitivity in optimized chips), piezoelectric sensors continue to be preferred for broadband, high-frequency, and transient pressure measurement tasks.
Conventional pressure sensors, particularly piezoresistive and capacitive types, are mature technologies but exhibit inherent limitations when subjected to highly dynamic or transient pressure environments. Piezoresistive sensors operate based on resistance variation, typically implemented in a Wheatstone bridge configuration, and offer high sensitivity with straightforward signal conditioning; however, they require continuous excitation, are prone to temperature-induced drift, and may exhibit long-term hysteresis and stability issues [9,10]. Capacitive sensors, which detect diaphragm deflection as a change in capacitance, generally provide low-power operation and fine resolution but face challenges such as slower mechanical response, susceptibility to parasitic capacitances, and the need for complex linearization circuitry [10,11].
In contrast, piezoelectric pressure sensors convert applied mechanical stress directly into electric charge without the need for external biasing, giving them intrinsically fast transient response and wide operational bandwidth [12]. According to sensor technology references, commercial piezoelectric devices can achieve microsecond-level rise times and operate effectively over broad frequency ranges, enabling reliable detection of rapid or high-frequency pressure fluctuations encountered in combustion monitoring, structural vibration analysis, and explosion characterization [10,13]. Because the generated charge is directly proportional to instantaneous strain, piezoelectric sensors are capable of detecting extremely small dynamic pressure variations, providing high sensitivity in fast-changing environments even though their ability to measure dynamic pressure is limited.
Piezoelectric sensors provide superior dynamic response, high sensitivity and the capacity to detect even the smallest changes in pressure throughout a broad frequency range, in contrast to traditional pressure sensors that depend on resistive or capacitive changes [14]. This makes them especially well-suited for uses where there are frequent changes in pressure, including in industrial monitoring systems, biomedical instruments, and automotive and aerospace applications.
In a piezoelectric material, there are various piezoelectric voltage coefficients. Among all the piezoelectric voltage coefficients, g33, g31, and g15 are the most significant coefficients for understanding piezoelectric materials [15,16]. These coefficients are correlated to the piezoelectric output voltage produced due to the applied mechanical stress in different directions provided by the applied force or pressure. The g33 piezoelectric voltage coefficient measures the electric field produced by the piezoelectric per unit of applied mechanical stress along the polarization axis. The g31 piezoelectric voltage coefficient measures the electric field produced by the piezoelectric per unit of applied mechanical stress perpendicular to both the polarization axis. The g15 piezoelectric voltage coefficient measures the electric field produced by the piezoelectric per unit shear stress applied or incline to the polarization [17,18].
So, these piezoelectric voltage coefficients depend on the mechanical structure, the direction of the applied stress, the direction of the polarization, the placement of the piezoelectric material on the mechanical structure, and the deformation of the piezoelectric material. The understanding of these factors is very important for optimizing the performance of the devices. After carefully selecting the appropriate coefficients, the output voltage of the sensor can be enhanced; it can also enhance the efficiency and sensitivity of the sensor, which can be used in various applications.
The mechanical structures used for sensors designed for various applications are cantilever, bridge, and diaphragm structures. In these mechanical structures, the placement of the piezoelectric sensing material for sensing the applied force or pressure is generally in the direction of induced stress that is perpendicular to the polarization axis, which is the g31 configuration [19,20,21]. Therefore, g31 is the most used piezoelectric voltage coefficient.
The piezoelectric materials are divided into two categories according to piezoelectric voltage coefficients. They are positive voltage coefficient piezoelectric materials and negative voltage coefficient piezoelectric materials; these two types of voltage coefficients are on account of the different polarities of the d31 [22,23]. The positive voltage coefficient piezoelectric materials are those materials that produce positive polarity when there is tensile stress on the surface and produce negative polarity when there is compressive stress on the surface, e.g., PVDF [24,25]. The negative voltage coefficient piezoelectric materials are those materials that produce negative polarity when there is tensile stress on the surface and produce positive polarity when there is compressive stress on the surface, e.g., ZnO.
In this work, a two-layer structure with positive and negative voltage coefficient piezoelectric material is taken for the study of the analytical model and simulated to see the performance of the pressure sensor by keeping the negative voltage coefficient piezoelectric material, ZnO, on the positive voltage coefficient piezoelectric material, PVDF. The analytical results indicate that the combination of these two materials is close to the simulated results. Additionally, the analytical model provides valuable insights into optimizing the design for improved performance under different operating conditions.

2. Sensor Structure and Its Equivalent Circuit

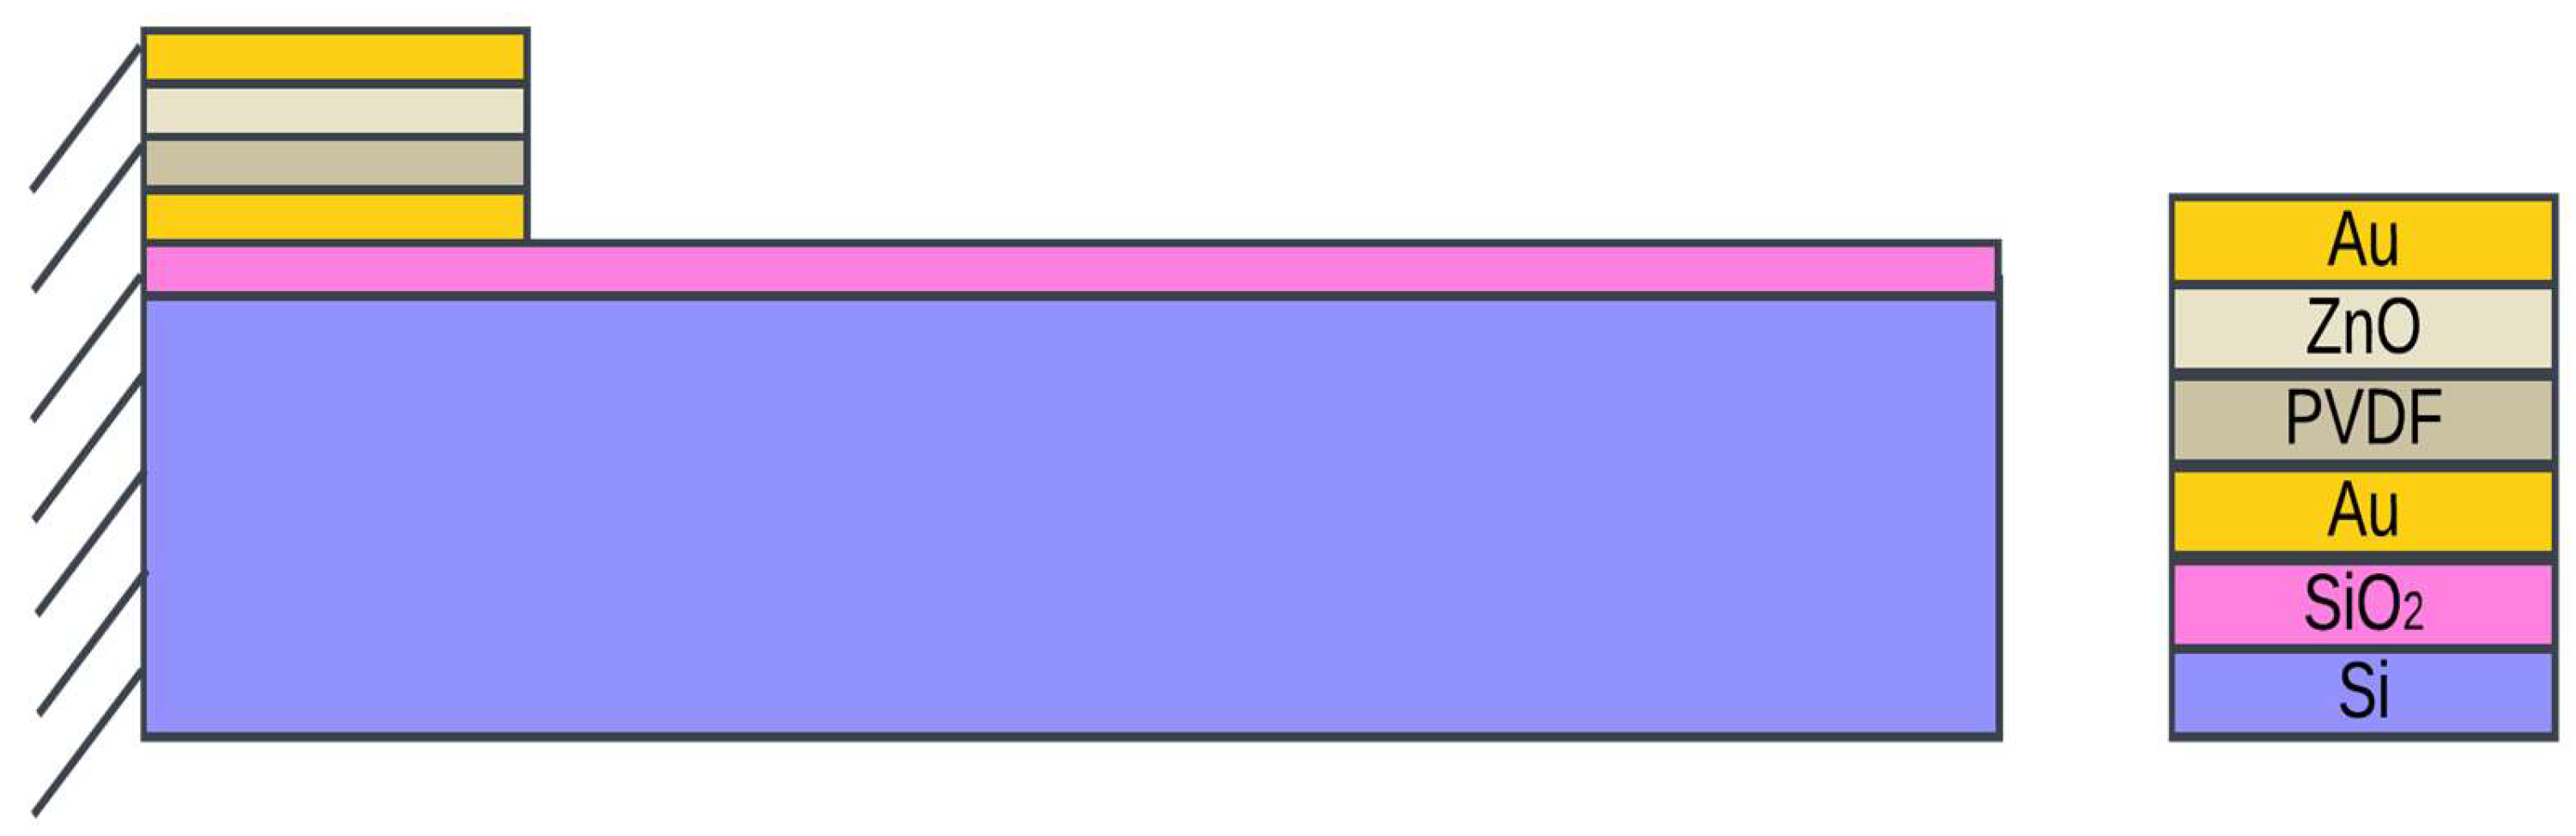
This structure, as shown in Figure 1, consists of a layer of Si as the mechanical structure, SiO2 as the insulator, Au as the electrodes, and ZnO piezoelectric and PVDF piezoelectric as the piezoelectric sensing materials. The details of the mechanical and piezoelectric properties of the materials used in the design are described in Table 1.
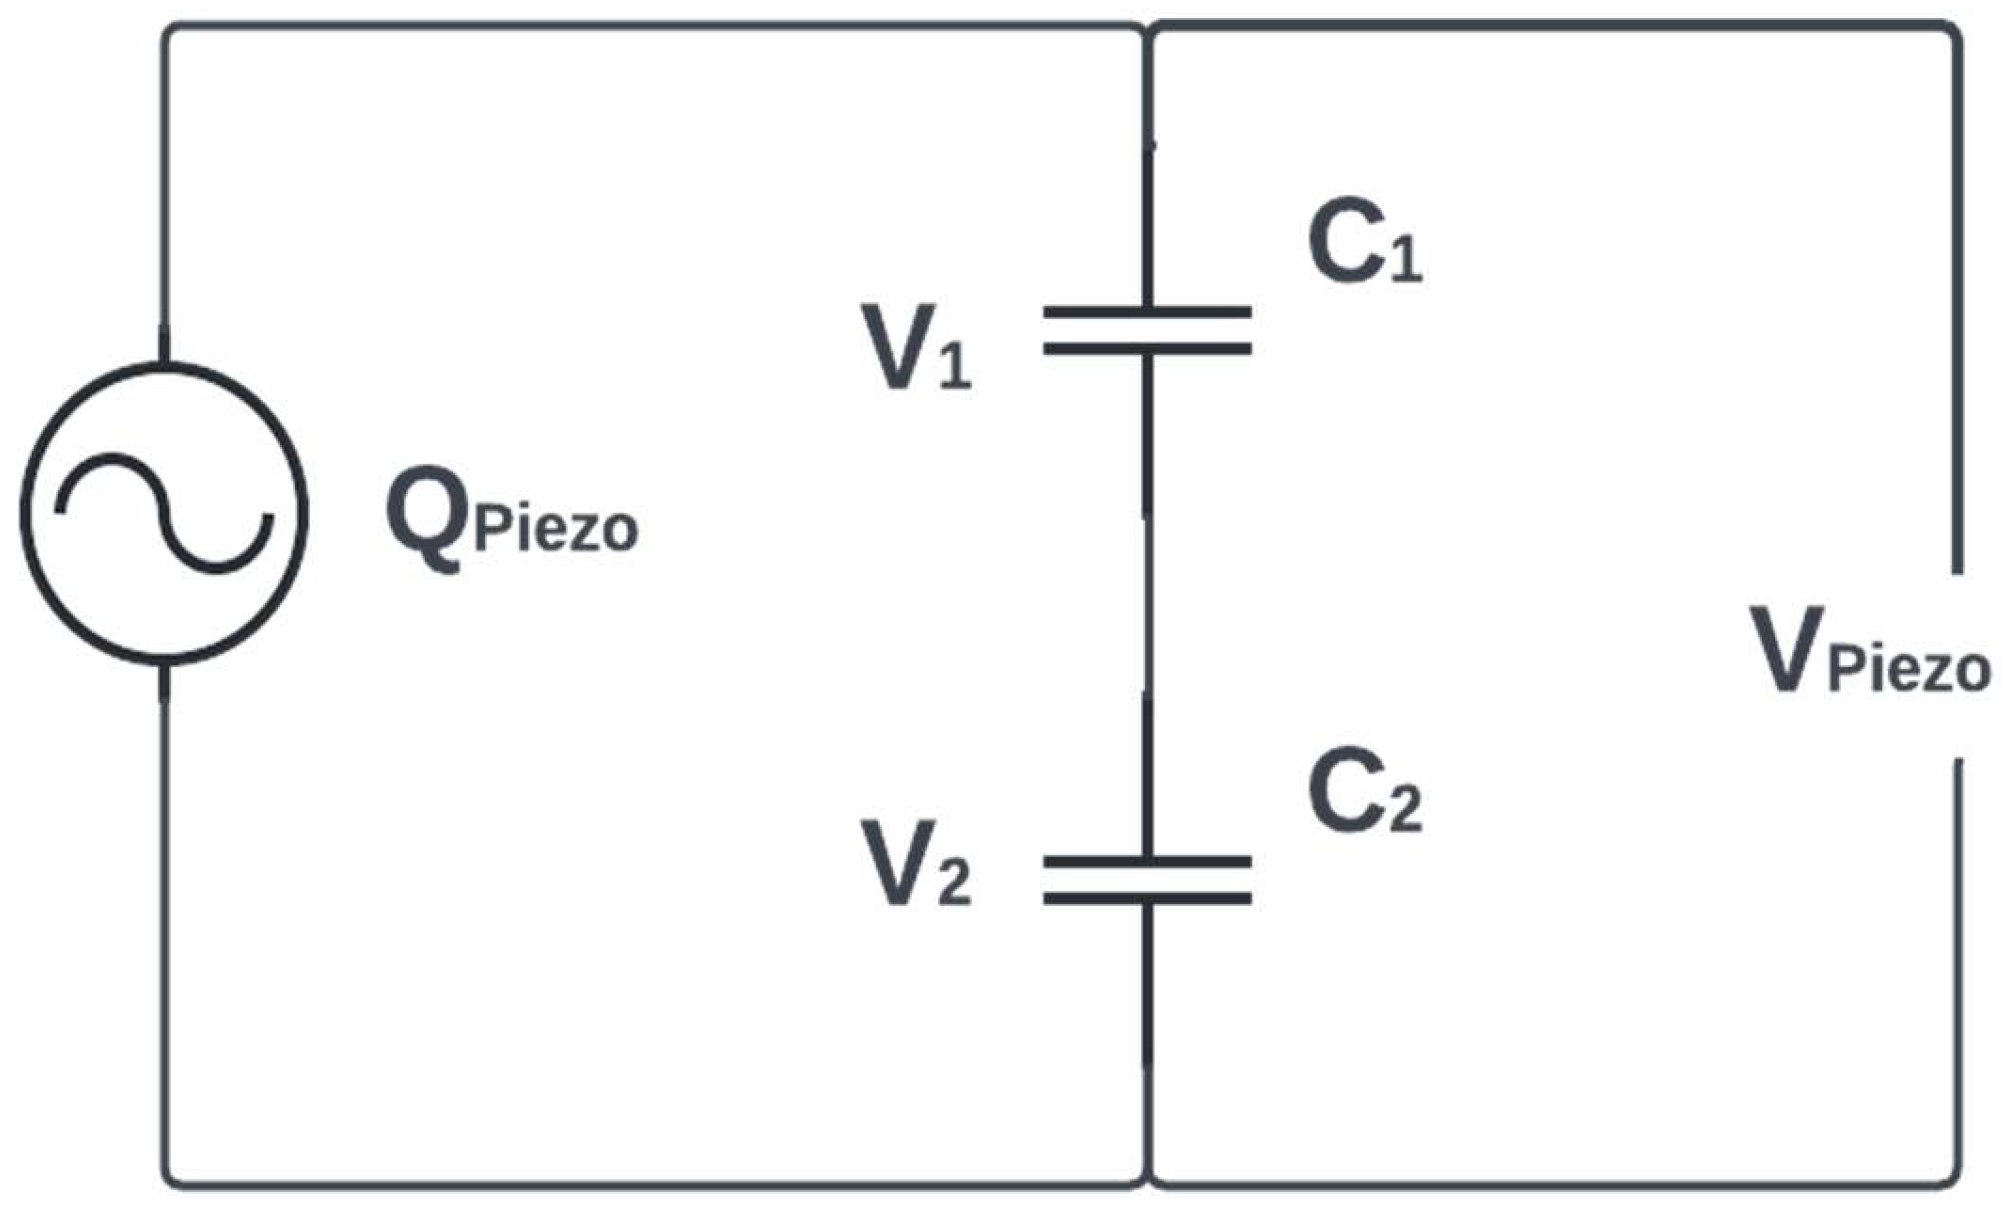
Figure 2 shows the equivalent circuit diagram of a piezoelectric sensor, consisting of two layers of piezoelectric material. The electric charges produced on the surfaces of the piezoelectric material are represented by Qpiezo. C1 and C2 are the capacitances of the ZnO and PVDF piezoelectric materials.
The voltages produced across C1 and C2 by the ZnO and PVDF piezoelectric materials are represented by V1 and V2 respectively. The overall output voltage across the ZnO and PVDF layers is represented by Vpiezo.

3. Analytical Model

In this study, a cantilever-based mechanical structure is employed to analyze dual-layer piezoelectric materials exhibiting both positive and negative g31 coefficients. The cantilever’s dimensions of length (l), thickness (h), and width (b) are considered, with a uniform downward force (F) applied to its top surface. The position (s) is the small shift in position from the position (x) along the cantilever’s length, where s ranges from 0 (fixed end) to x and x ranges from 0 (fixed end) to l (free end), and the stress (T) is a function of x. The moment of equilibrium expressed is as follows [27,28]:
E I 2 w ( x ) x 2 = F x m 0 0 x F l ( x s ) d s
where m0 is the bending moment, E is the Young’s modulus, w(x) is the deflection, and I is the moment of inertia.
E I 2 w x 2 = F x m 0 F x 2 2 l
The values of m0 and I are given as follows:
m 0 = F l 2
I = h 3 b 12
After inputting the value of m0, the equation of the moment of equilibrium can be written as follows:
2 w ( x ) x 2 = 1 E I ( F x F l 2 F x 2 2 l )
Following the insertion of the value of I in the above equation, the equation can now be written as follows:
2 w x x 2 = 6 E l b h 3 F l 2 + F x 2 2 F x l
The stress on the surface of a cantilever in a plane parallel to the natural plane is given by the equation as follows:
T ( x ) = E z 2 w ( x ) x 2
where z is the distance of the plane from the natural plane of the cantilever.
The general expression for the stress of a plane parallel to the natural plane of a cantilever can be expressed as follows:
T ( x ) = z 6 l b h 3 F l 2 + F x 2 2 F x l
T ( x ) = z 6 F l b h 3 l 2 + x 2 2 x l
For a uniformly distributed load, the value of F can be expressed as follows:
F = P A
where P is the applied pressure and A is the area of the surface. The value of A is given as follows:
A = l b
Through inserting the value of F into the general stress equation, the equation can be written as:
T ( x ) = z 6 P h 3 l 2 + x 2 2 x l
Polymers like PVDF use d31 (charge coefficient) in cantilever systems because their mechanical flexibility allows strain along the polarizing direction, while stiff ceramics or metal oxides like PZT and ZnO primarily activate d31 (charge coefficient) due to their deformation behavior.
After this, the electrostatic charge q(x) per unit area that develops on the ZnO piezoelectric surface due to the stress is given as follows:
q ( x ) Z n O = d 31 Z n O T ( x ) Z n O
Now the electrostatic charge q(x) per unit area that develops on the PVDF piezoelectric surface due to the stress is given as follows:
q ( x ) P V D F = d 31 P V D F T ( x ) P V D F
g 31 = d 31 ε 0 ε r
The total charge developed on the surface of the piezoelectric material is given as follows:
Q ( x ) Z n O = q ( x ) Z n O A p i e z o
Q ( x ) P V D F = q ( x ) P V D F A p i e z o
where Apiezo is the surface area of the piezoelectric material.
Considering a square plate of piezoelectric material, the capacitance of the square plate is given as follows:
C Z n O = ε Z n O l 2 Z n O t Z n O
C P V D F = ε P V D F l 2 P V D F t P V D F
where , lpiezo and tpiezo are the permittivity, length and thickness of the piezoelectric material.
Now the potential difference produced on the surface of the piezoelectric material is given as follows:
V = q ( x ) Z n O t Z n O ε Z n O l 2 Z n O + q ( x ) P V D F t P V D F ε P V D F l 2 P V D F A p i e z o
where lZnO and lPVDF are the lengths of the ZnO and PVDF piezoelectric materials.
V = g 31 T ( x ) Z n O t Z n O + g 31 P V D F T ( x ) P V D F t P V D F
ZnO is mainly used in transverse g31 mode since the cantilever bending causes the dominant in-plane stresses along the beam length, whereas the polarization is in the direction of the thickness. Therefore, electric field is produced in the direction perpendicular to the applied stress. Conversely, PVDF, being flexible, is capable of taking large strain along the polarization direction, allowing the transverse to be exploited g31 mode. Thus, the response of ZnO is primarily due to g31 and PVDF also has to capitalize on g31 when properly loaded. The general expression of the voltage produced by piezoelectric in a g31 configuration is given by the above equation.

4. FEM Model Simulation

Several experimental and modeling studies are reported for ZnO or ZnO-based piezoelectric cantilevers and thin-film devices with different thicknesses in layers and lateral dimensions comparable to the present design (50 µm lateral size; ZnO/PVDF thickness ≈ 0.3–4 µm). For example, Bhatia et al. reported a ZnO micro-cantilever with a ZnO piezoelectric of thickness ≈300 nm, length 500 µm and width 100 µm, demonstrating practical MEMS fabrication and resonant behavior for ZnO thin films on Si substrates [29]. Other MEMS modeling and COMSOL applications summarize the simulation of ZnO layers in the 2–4 µm thickness range on cantilevers with widths of 50–100 µm, showing that a few-micron ZnO film combined with a tens-of-micrometers beam width yields effective electromechanical coupling in cantilever geometries [30].
Optimization and growth studies also document ZnO thin films of ~1 µm used as active piezoelectric coatings for micro-cantilevers, confirming that sub-µm to micron-scale ZnO films produce measurable piezoelectric output in MEMS structures [29]. For material systems closely related to our double-layer choice, recent work on PVDF/ZnO composite and nanofiber sensors demonstrates a strong piezoelectric response in micron-scale film architectures for micro-pressure sensing applications, providing a direct pattern for combining PVDF and ZnO in thin-film devices [31].
Finally, survey and fabrication reports reveal that the study of ZnO coatings on cantilevers explicitly deliberates coating thicknesses and mechanical behavior across similar geometric ranges, supporting the technical feasibility of a 50 µm × 50 µm active area with few-micron piezoelectric layers [32]. Collectively, these sources validate that the chosen lateral dimensions and layer thicknesses lie within the established design space for thin-film piezoelectric MEMS and flexible piezoelectric sensors and therefore justify fixing the geometry to isolate material-layer effects in the present study.
The Finite Element Method (FEM)-based simulation tool enables the analysis of various physical phenomena, including the operation of piezoelectric sensors. In this study, a three-dimensional (3D) model of a cantilever-type piezoelectric sensor with two different sensing layers is created in COMSOL Multiphysics for analysis with the dimensions as tabulated in Table 2.
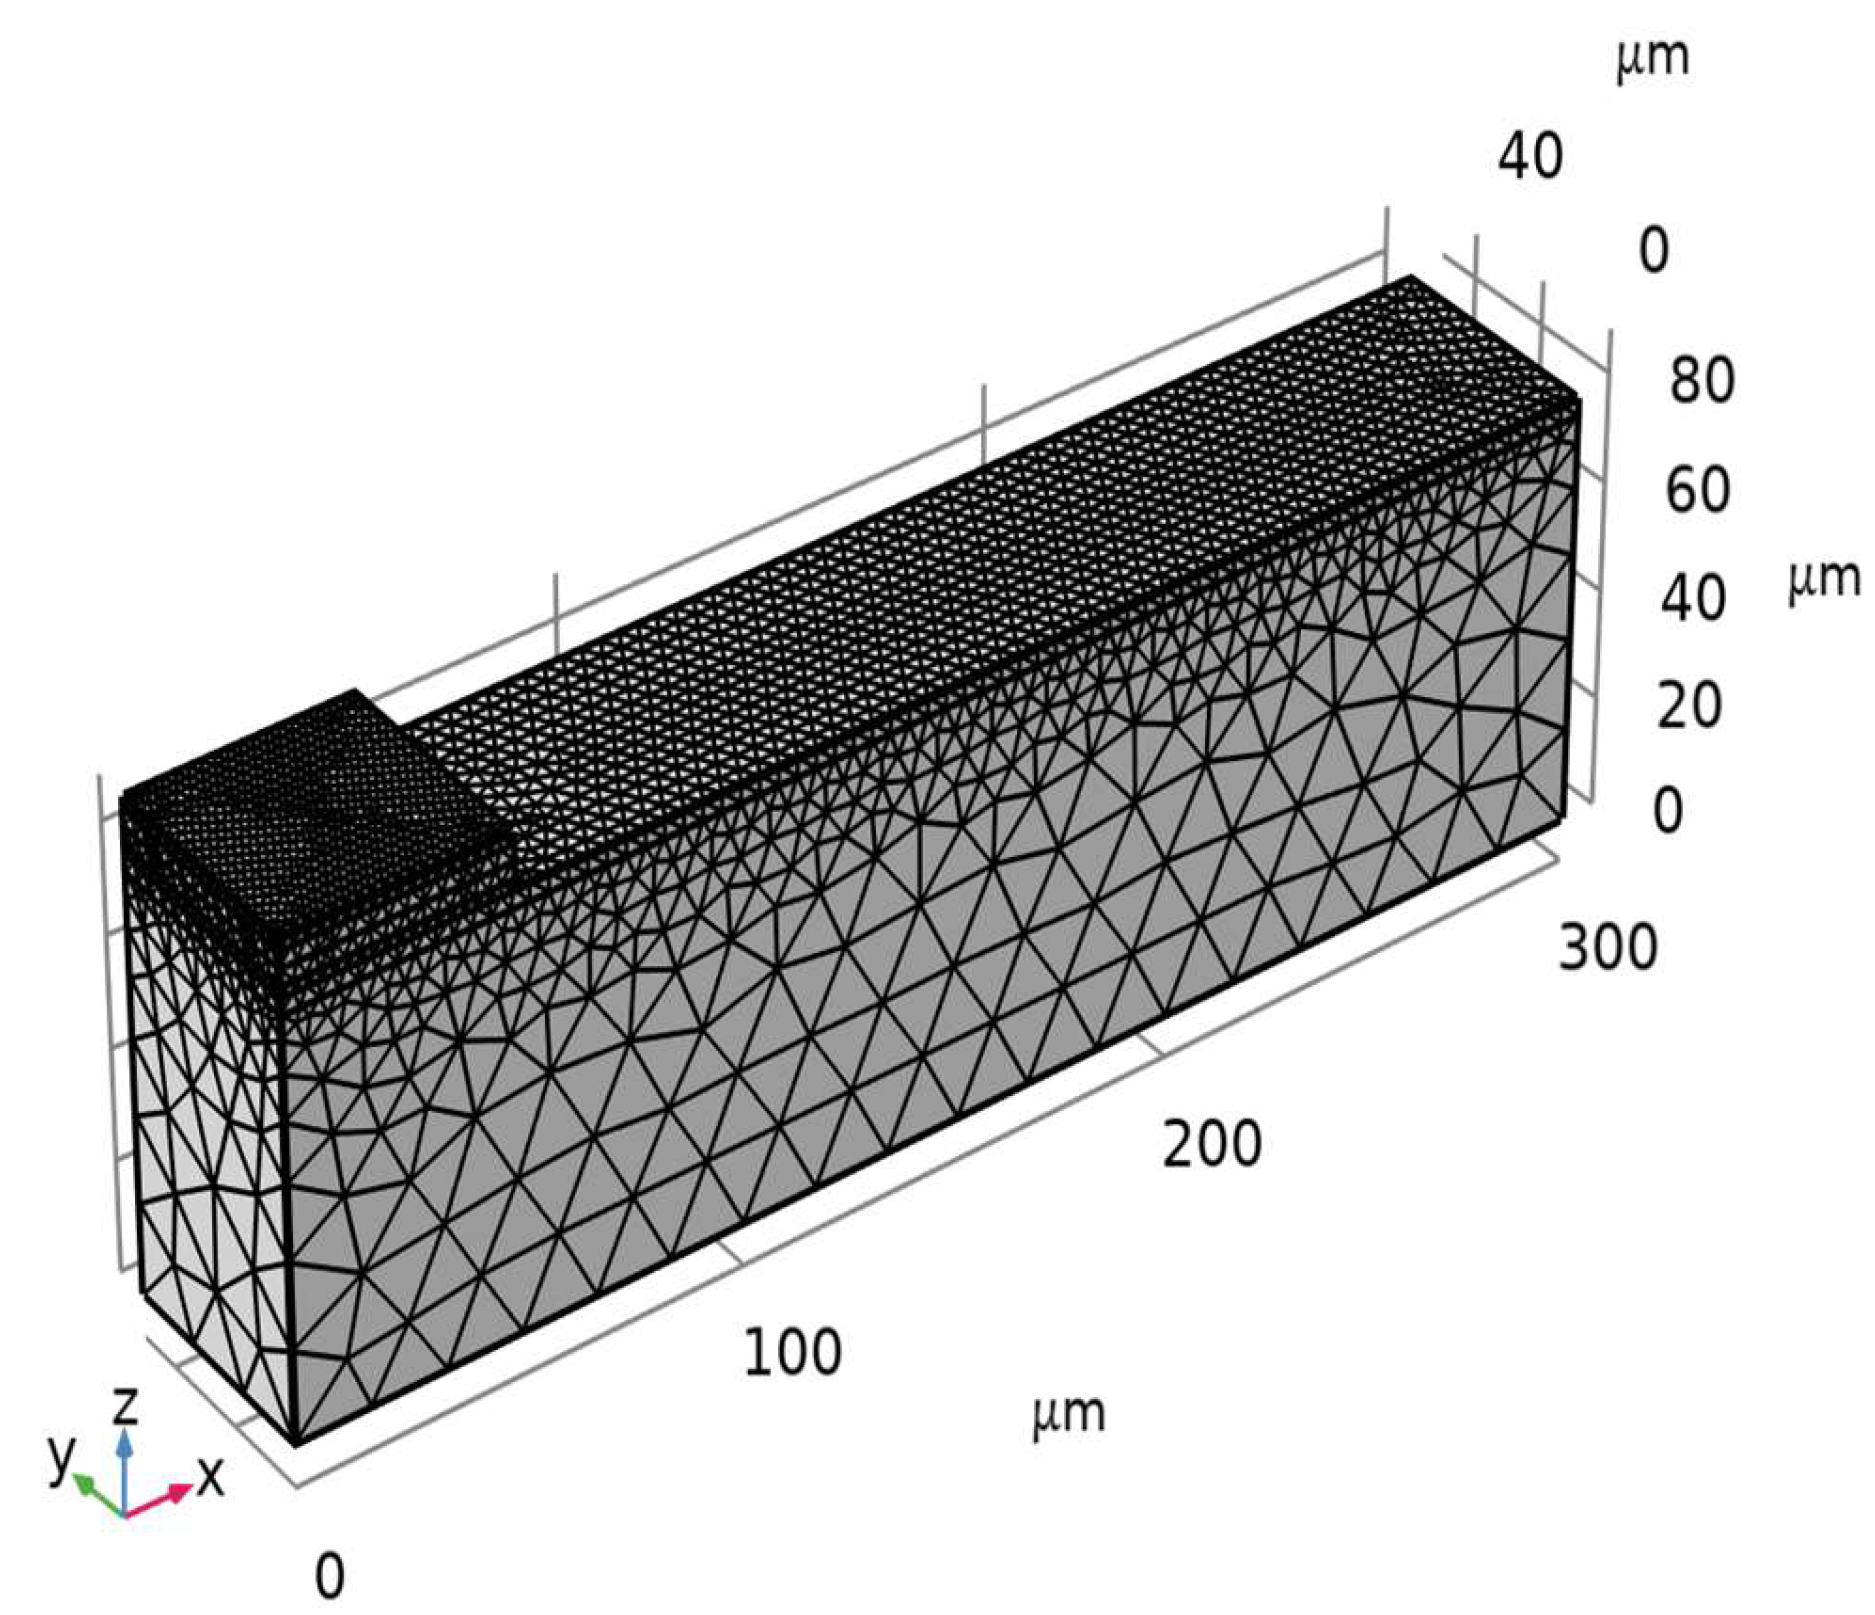
The FEM simulations were performed under stationary (quasi-static) conditions using a parametric pressure sweep from 0 to 10 kPa, without any time-dependent dynamic analysis. The reported voltages correspond to ideal open-circuit quasi-static potentials, neglecting charge leakage, dielectric losses, and external readout circuit effects. Further, it is acknowledged that the dynamic behavior, charge decay, and time-dependent circuit effects are beyond the scope of the present work and represent an important direction for future investigations. The lower electrode is assigned to the ground and the upper electrode is assigned as terminal with initial zero charge. The fixed constraints are the surfaces on the left most side of Figure 3.
The meshed style used is 3D tetrahedral (first-order) elements, and the size used for meshing the model is finer. The physics module used for the simulation of the piezoelectric effect is combined with electrostatics and solid mechanics. This configuration of boundary conditions, like fixed constraints, variable load, ground and terminal, is done properly. The important components, like the electrodes, the insulating layer, the sensor base, and the piezoelectric sensing films, are all included in the model. In particular, Si is used for the mechanical structure, Au is used for the electrodes, SiO2 for the insulation between the electrode and mechanical structure, and ZnO and PVDF piezoelectrics are used for the sensing layers. After configuring all the conditions, the model is meshed using a tetrahedral shape with finite size to ensure precision in the simulation results. The meshing diagram of the 3D model of the sensor is shown in Figure 3.
The simulation is carried out for an applied pressure range from 0 to 10 kPa to evaluate the performance of the sensor. The output of the simulation is studied with the stress distribution on the surface, electric potential distribution on the surface, and change in potential due to change in applied pressure, which gives a better understanding of the sensor’s behavior in response to various stimuli.

5. Result and Discussion

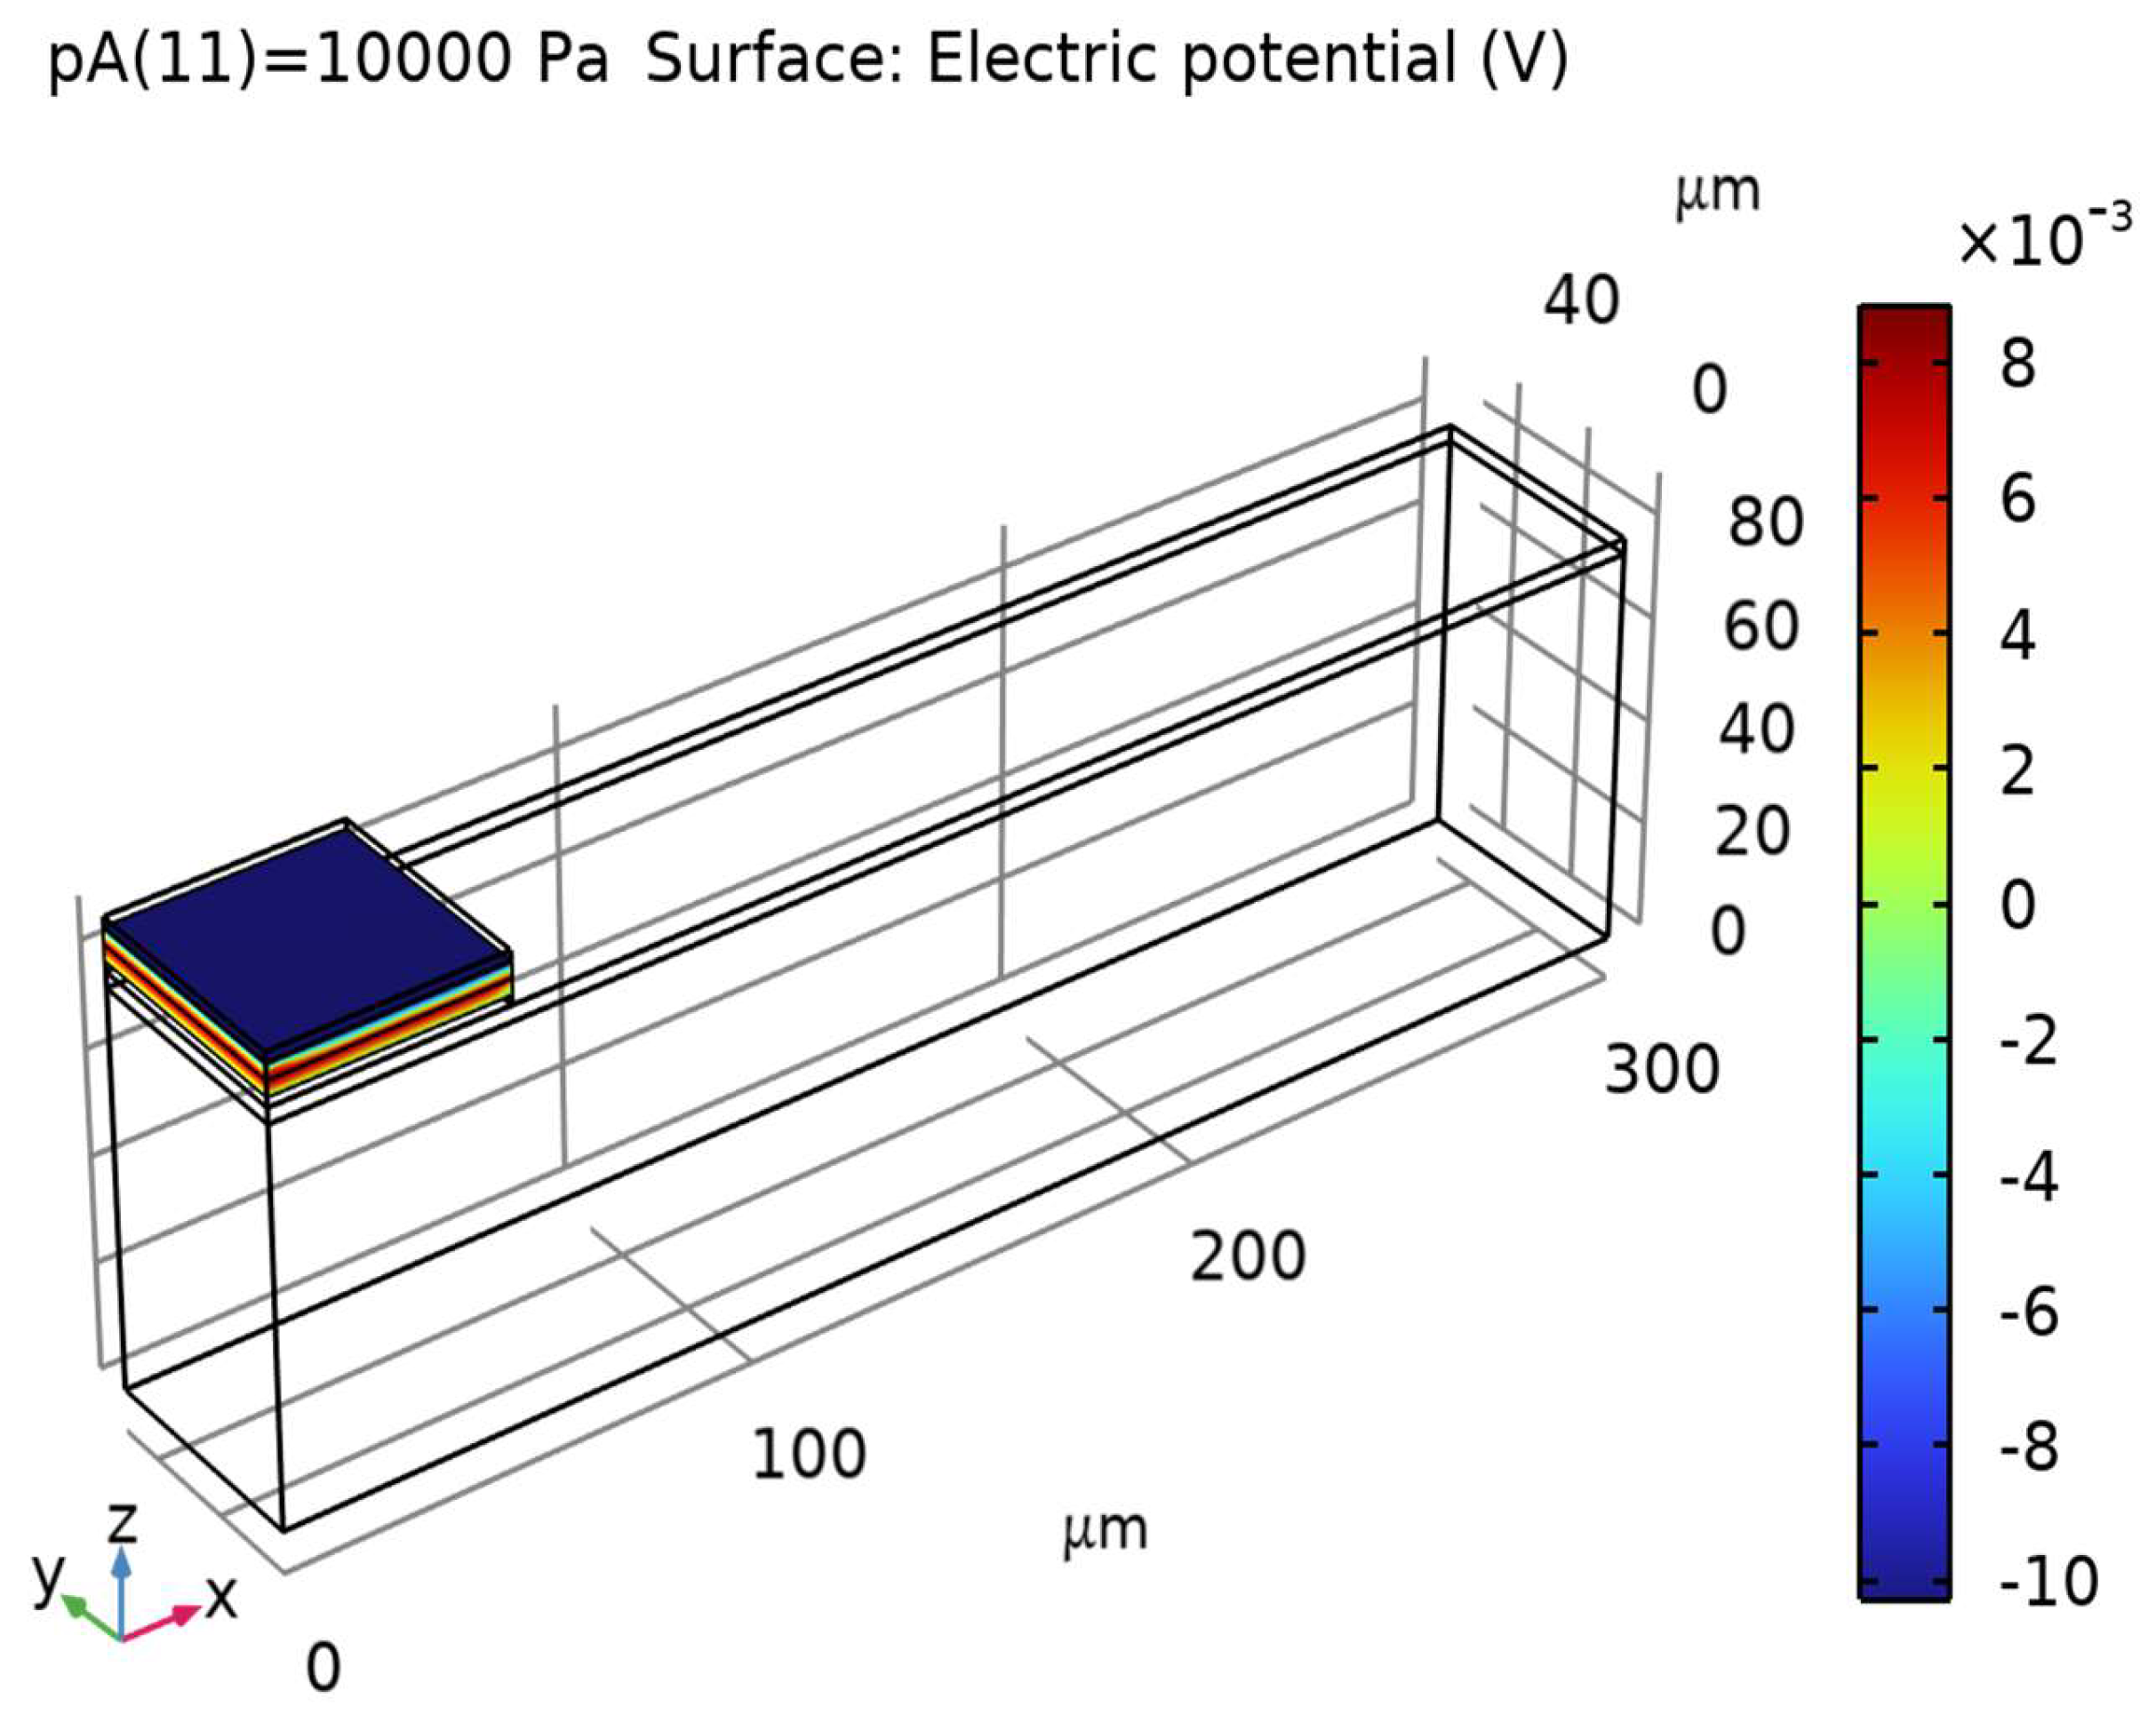
In this study, the performance of the piezoelectric sensor with two layers of ZnO and PVDF piezoelectric materials as sensing materials is analyzed by comparing the analytical values and simulation output values. This study gives the performance of two-layer piezoelectric materials with opposite piezoelectric voltage coefficients. This study provides a comprehensive analysis of the sensor’s response to a range of applied pressures. The simulated output electric potential difference developed on the sensing material at 10 kPa is shown in Figure 4. It is observed that the potential difference developed across the surfaces of the piezoelectric materials is −0.0103 V for the applied pressure at 10 kPa.
The variation in the potential difference due to the variation in applied pressure is shown in Table 3 for the analytical and simulated values. This table shows that the potential difference increases in magnitude with an increase in applied pressure with negative polarity.
For a comparative study of the analytical and simulated results, the calculated values and simulated values of potential difference between the upper and lower surfaces of the sensing materials are tabulated in Table 3. From Table 3, it is observed that both the simulated and calculated values are varying with the applied pressure, but there is a margin of error (MoE) in between them. The pointwise deviation between simulated and calculated potentials across 0–10 kPa yields an average margin of error of approximately 11.8%.
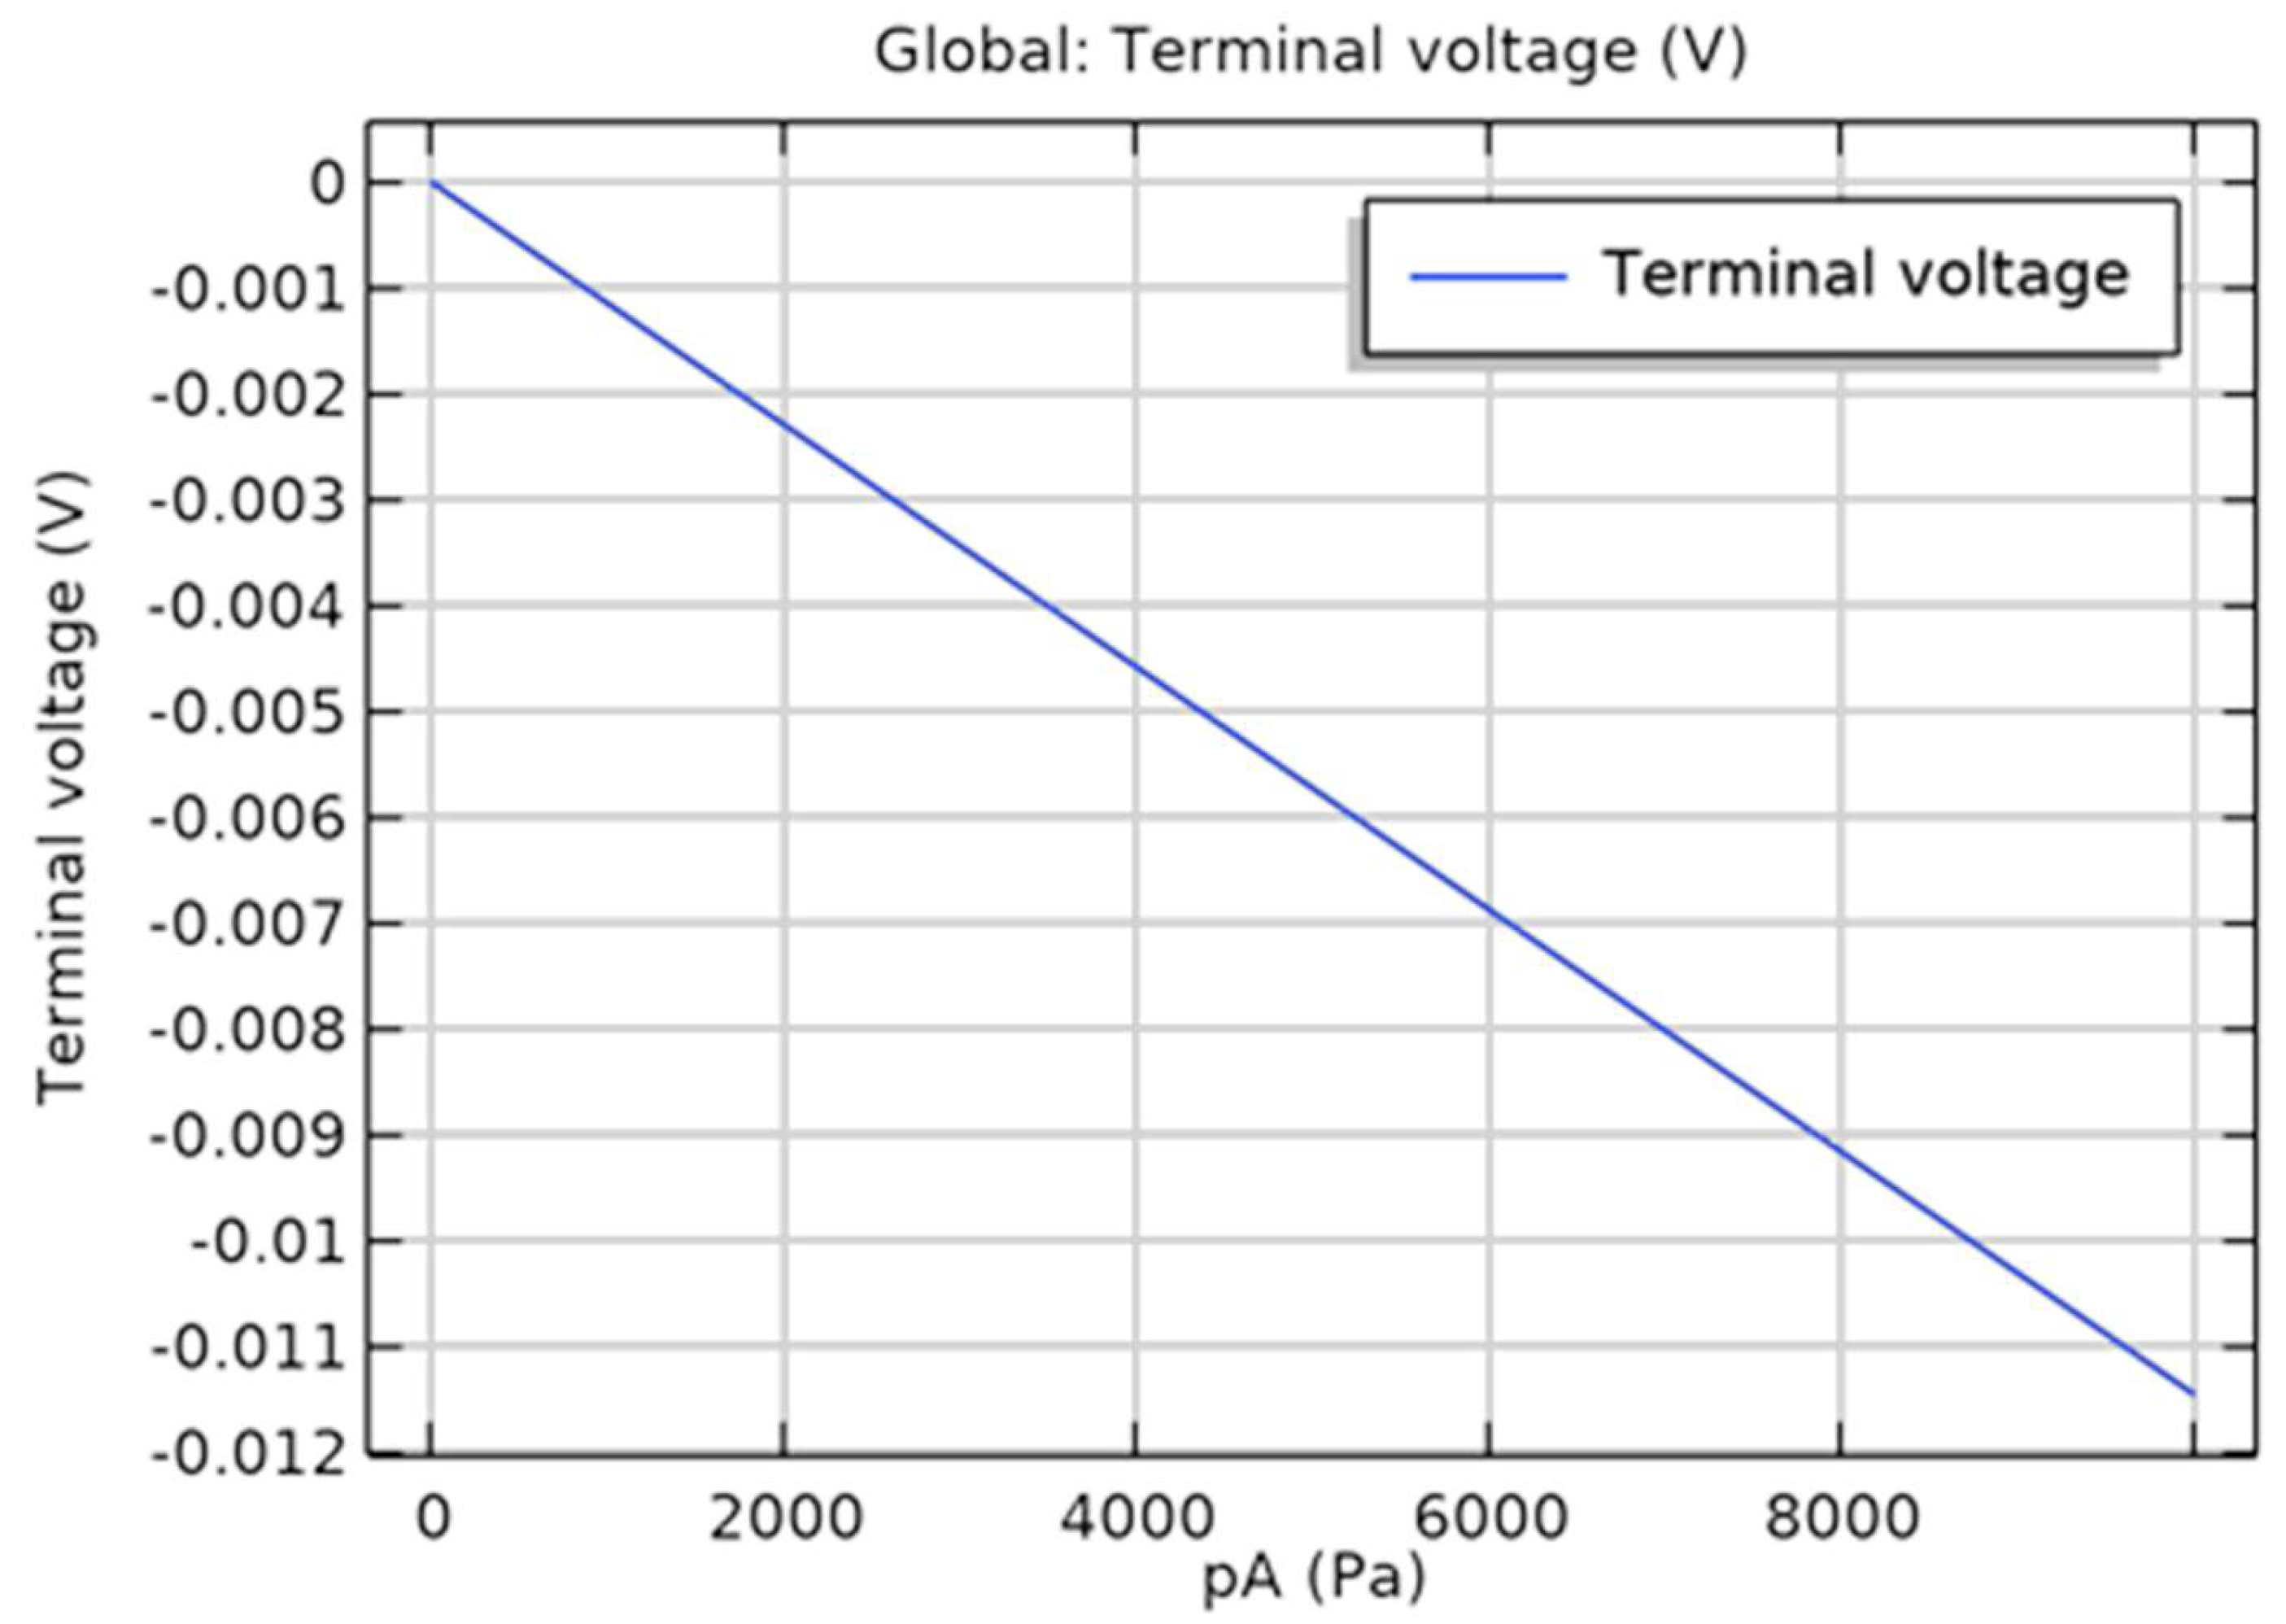
As the applied pressure increases, the potential difference also increases in magnitude with a negative slope. It is also observed that the calculated values are slightly higher than the simulated values at each pressure point. The slopes of the calculated and simulated values are −0.00116 mV/kPa and −0.00103 mV/kPa, respectively. Since the calculated and simulated values are very close to each other, this validates that both the simulation and analytical models are reliable and can be implemented for further studies. Form the Table 4, it is observed that the highly linear with non-linearity values of 0.68% and 0.52% for simulated and calculated, respectively.
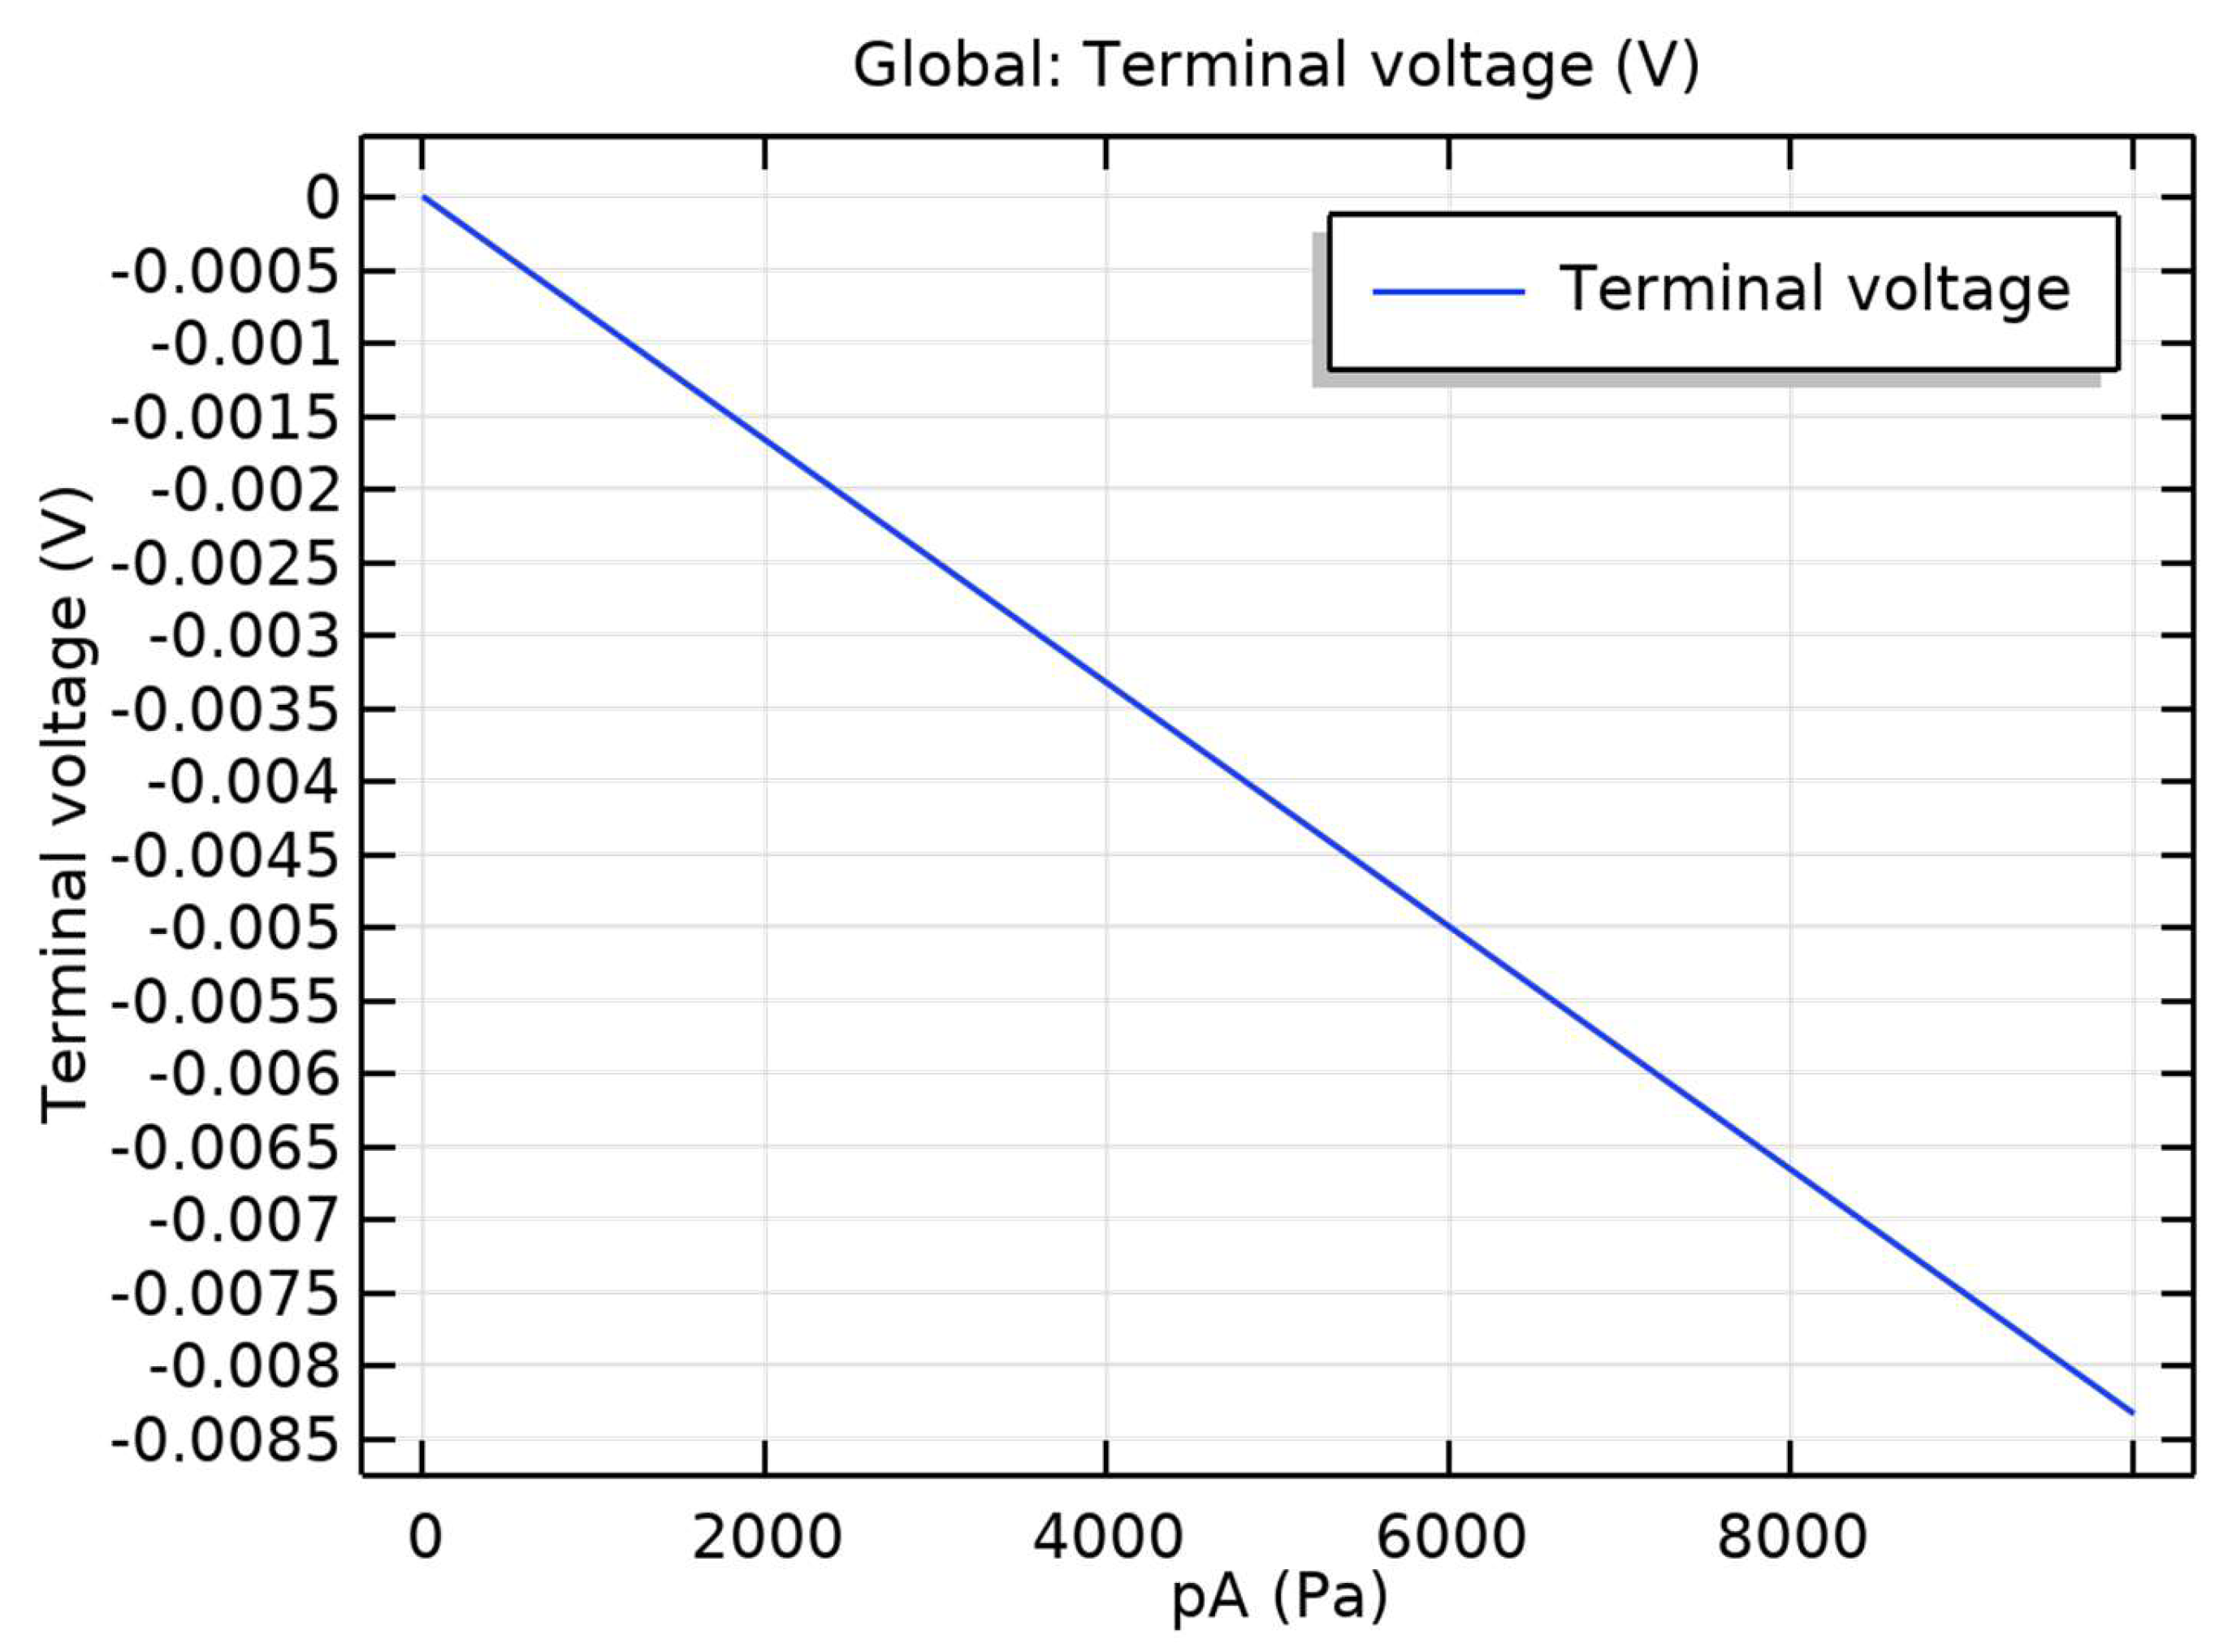
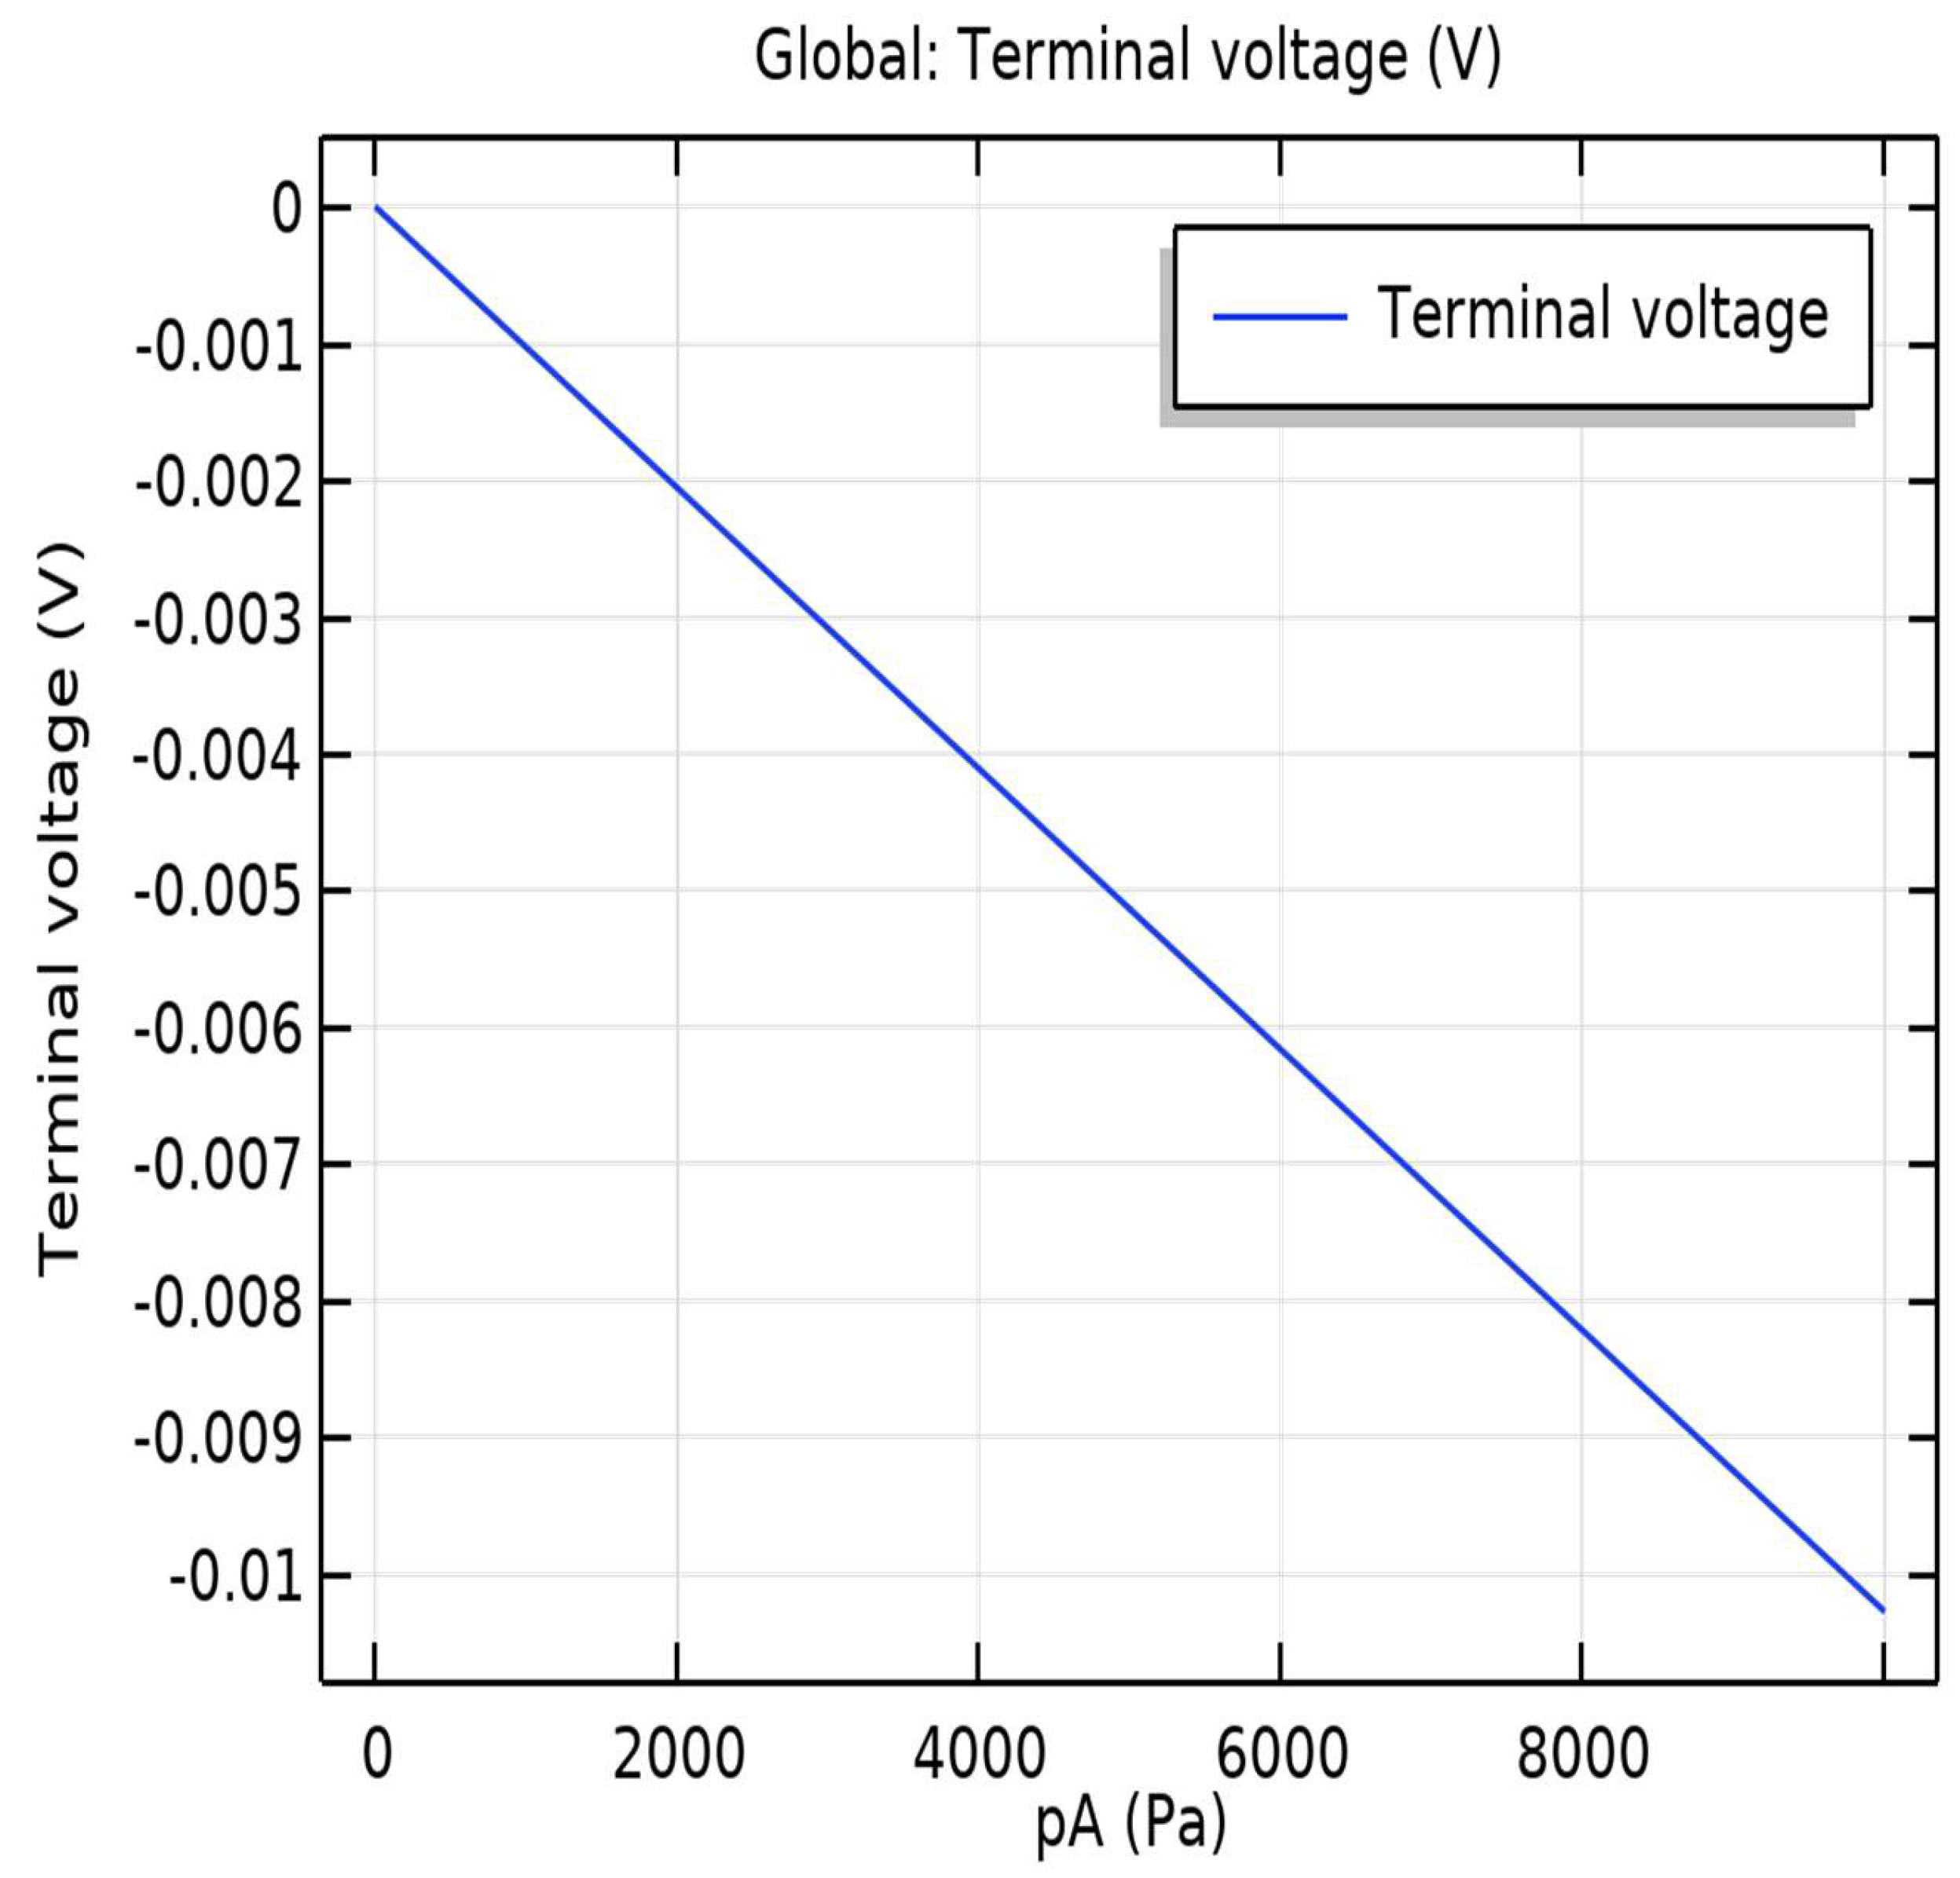
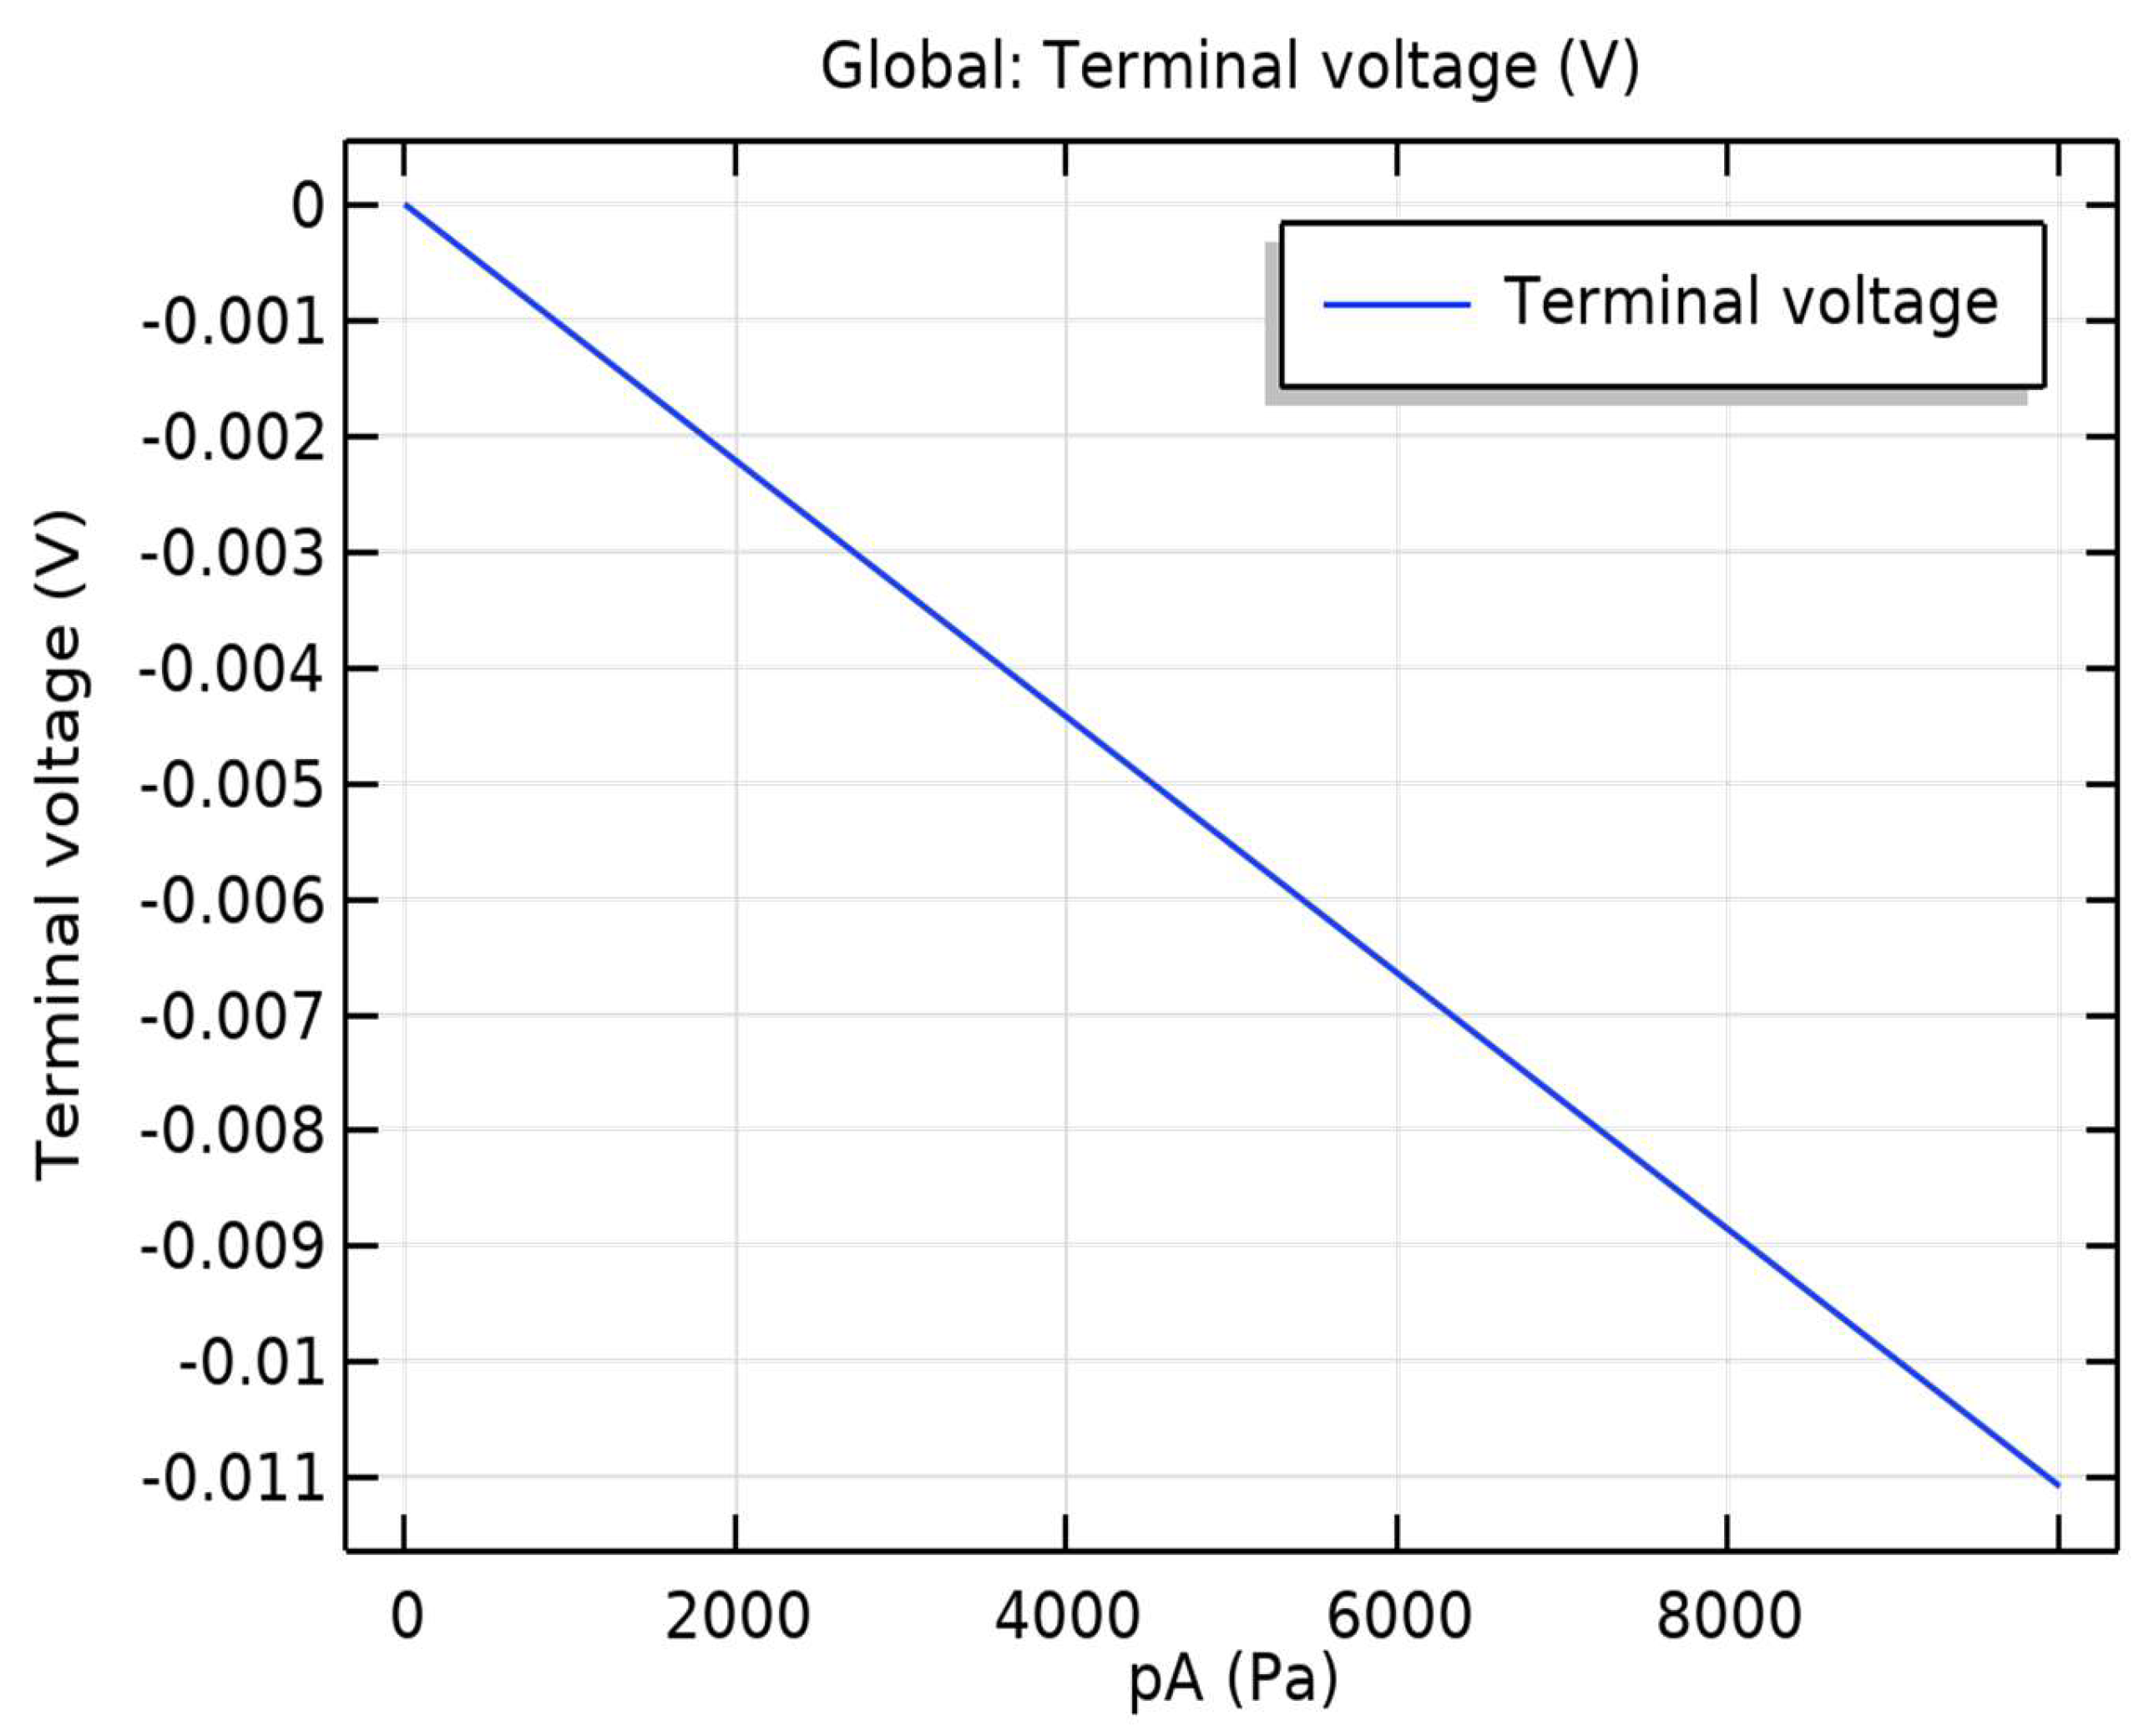
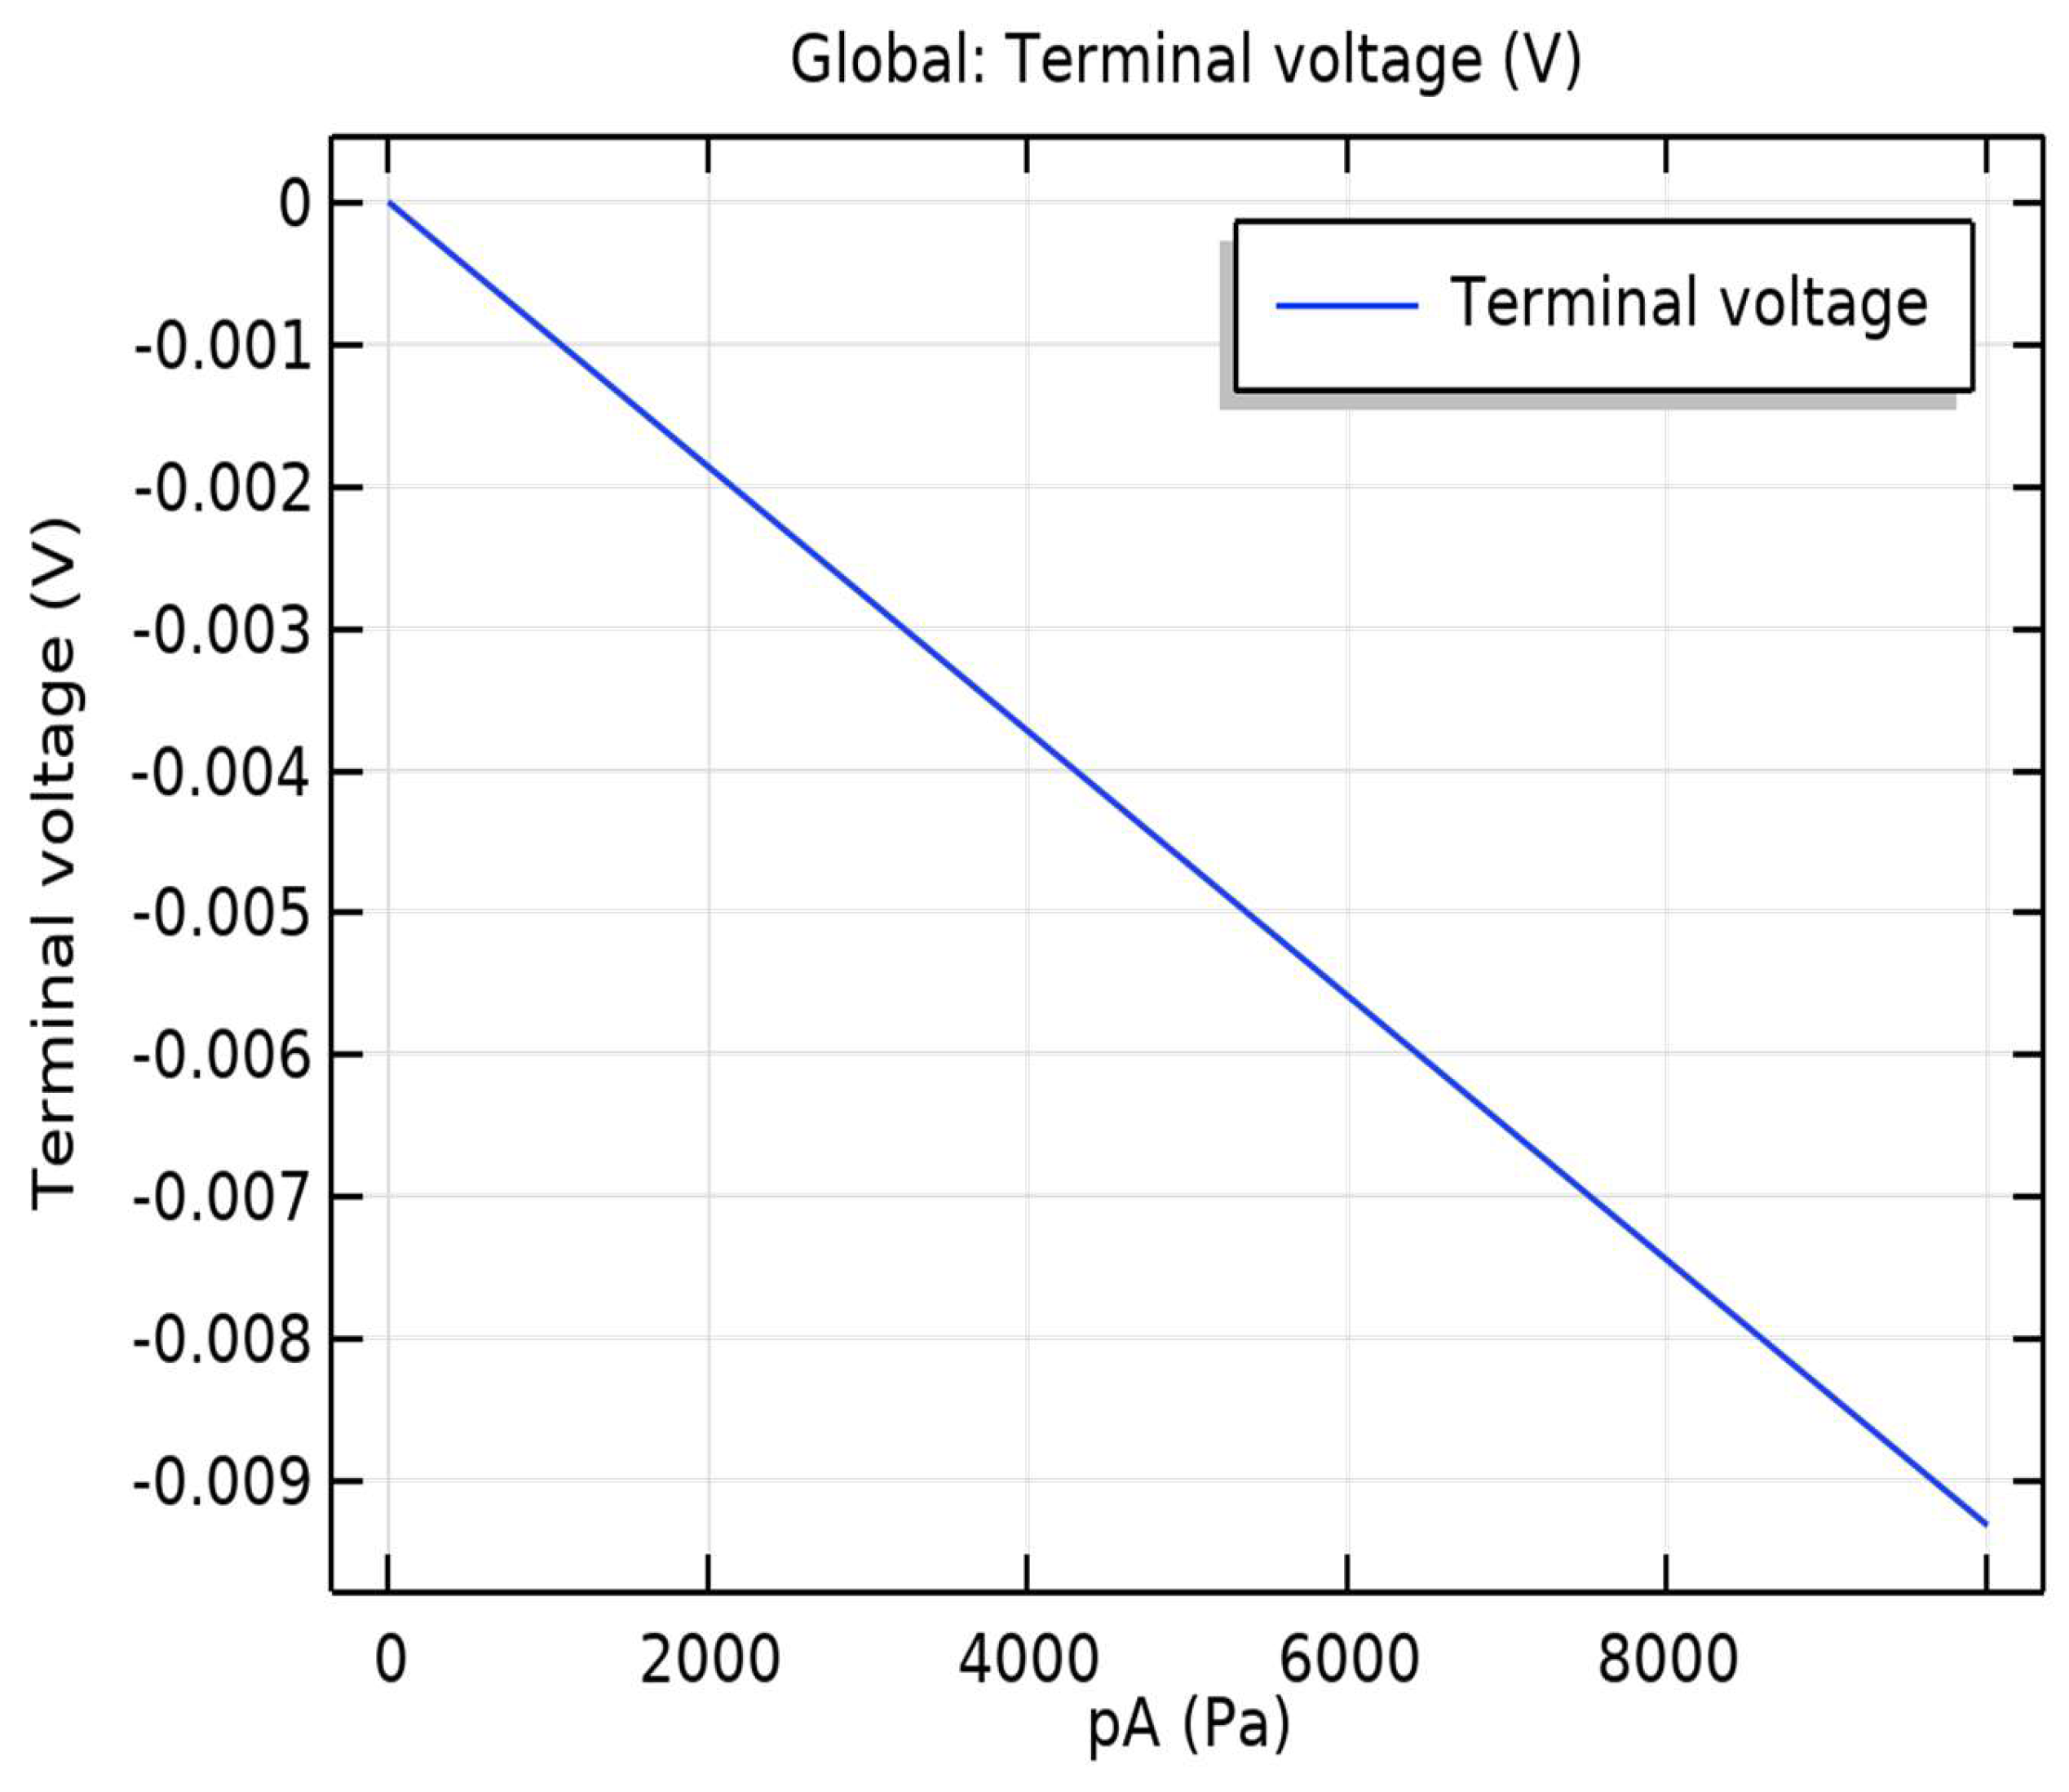
Further simulations were conducted by varying the thicknesses of the piezoelectric materials while keeping equal thicknesses for both ZnO and PVDF layers. The thickness values considered were 2 µm, 2.5 µm, 3.5 µm, and 4 µm for both ZnO and PVDF piezoelectric materials. The simulated results are as follows:
From Figure 5, Figure 6, Figure 7, Figure 8 and Figure 9, it is observed that a decrease in the thickness of the piezoelectric material results in a slight increase in the output values. This is because the induced stress is directly proportional to the value of z (distance from the natural plane), which increases as the thickness of the piezoelectric layer decreases.

6. Conclusions

In this study, a Finite Element Method (FEM)-based simulation and mathematical analysis were carried out to evaluate the performance of a cantilever-type piezoelectric pressure sensor with ZnO and PVDF as sensing layers. The sensor’s 3D model with precise dimensional and material configurations, incorporating essential layers such as the electrode (Au), insulating layer (SiO2), and structural substrate (Si), is modeled in the FEM simulator. The simulation was done for the applied pressure range of 0 to 10 kPa with a step size of 1 kPa. This simulation of the sensor analyzes the response to applied pressure on the output voltage of the two-layer piezoelectric pressure sensor.
This response of the sensor exhibits a linear increase in output potential difference in magnitude with increasing applied pressure. This behavior of the response is consistent with both calculated and simulated values. The resultant of the potential difference has negative polarity because the piezoelectric voltage coefficients of ZnO are negative with a higher value than the positive piezoelectric voltage coefficients of PVDF. A minor deviation is observed between the simulated and calculated values; this validates the accuracy of the FEM model with calculated values. The slopes of the calculated and simulated responses for 3 µm of both ZnO and PVDF were found to be −1.16 mV/kPa and −1.03 mV/kPa, respectively, further confirming a near-linear relationship.
There is a slight increase in the magnitude of the simulated output voltage with a decrease in the thickness of the piezoelectric. This is because of the increase in the z value, which is directly proportional to the stress. The slope of the simulated value for a 2 µm thickness of both ZnO and PVDF is −1.1 mV/kPa. This FEM simulation approach captures the electromechanical behavior of the sensor, making it a valuable tool for designing, optimizing and predicting the performance of the sensor.

Author Contributions

Conceptualization, M.S.S.; methodology, M.S.S.; validation, P.K.K. and M.S.M.; formal analysis, P.K.K. and M.S.M.; writing—review and editing, M.S.S., P.K.K. and M.S.M. All authors have read and agreed to the published version of the manuscript.

Funding

This research received no external funding.

Data Availability Statement

Data are contained within the article.

Conflicts of Interest

The authors declare no conflict of interest.

References

  1. Vrtagic, S.; Hoxha, M.; Abdelgalil, A.; Ferko, N.; Abdallah, M.; Potams, A.; Lushi, A.; Turan, H.I.; Mourched, B. Design and evaluation of a piezoelectric pressure sensor for mass detection with COMSOL and machine learning modeling. Measurement 2025, 254, 117945. [Google Scholar] [CrossRef] [Scilit]
  2. Dileena, L.; Sreeja, S.D.B.; Sreekala, C.O. A comparative study on piezoelectric and piezoresistive pressure sensor using COMSOL simulation. Mater. Today Proc. 2021, 46, 3121–3126. [Google Scholar] [CrossRef] [Scilit]
  3. Cao, C.; Zhou, P.; Wang, J.; Liu, M.; Wang, P.; Qi, Y.; Zhang, T. Ultrahigh sensitive and rapid-response self-powered flexible pressure sensor based on sandwiched piezoelectric composites. J. Colloid Interface Sci. 2024, 664, 902–915. [Google Scholar] [CrossRef] [Scilit] [PubMed]
  4. Ju, M.; Dou, Z.; Li, J.-W.; Qiu, X.; Shen, B.; Zhang, D.; Yao, F.-Z.; Gong, W.; Wang, K. Piezoelectric materials and sensors for structural health monitoring: Fundamental aspects, current status, and future perspectives. Sensors 2023, 23, 543. [Google Scholar] [CrossRef] [Scilit] [PubMed]
  5. Chen, Z.; Wang, Z.; Li, X.; Lin, Y.; Luo, N.; Long, M.; Zhao, N.; Xu, J.-B. Flexible piezoelectric-induced pressure sensors for static measurements based on nanowires/graphene heterostructures. ACS Nano 2017, 11, 4507–4513. [Google Scholar] [CrossRef] [Scilit] [PubMed]
  6. Liu, J.; Tan, H.; Zhou, X.; Ma, W.; Wang, C.; Tran, N.M.A.; Lu, W.; Chen, F.; Wang, J.; Zhang, H. Piezoelectric thin films and their applications in MEMS: A review. J. Appl. Phys. 2025, 137, 020702. [Google Scholar] [CrossRef] [Scilit]
  7. Jin, L.; Song, J.; Liu, L.; Jia, Y. PZT-based flexible piezoelectric sensors for real-time condition monitoring. AIP Adv. 2024, 14, 025213. [Google Scholar] [CrossRef] [Scilit]
  8. Reverter, F. A tutorial on mechanical sensors in the 70th anniversary of the piezoresistive effect. Sensors 2024, 24, 3690. [Google Scholar] [CrossRef] [Scilit] [PubMed]
  9. Avnet Abacus. Capacitive vs. Piezoresistive vs. Piezoelectric Pressure Sensors. Available online: https://my.avnet.com/abacus/solutions/technologies/sensors/pressure-sensors/core-technologies/capacitive-vs-piezoresistive-vs-piezoelectric/ (accessed on 16 April 2026).
  10. Avnet Abacus. Piezoelectric Pressure Sensors. Available online: https://my.avnet.com/abacus/solutions/technologies/sensors/pressure-sensors/core-technologies/piezoelectric/ (accessed on 16 April 2026).
  11. Balavalad, K.B.; Sheeparamatti, B.G. A critical review of MEMS capacitive pressure sensors. Sens. Transducers 2015, 187, 120–128. [Google Scholar]
  12. Pereira, J.D. Pressure sensors: Working principles of static and dynamic calibration. Sensors 2024, 24, 629. [Google Scholar] [CrossRef] [Scilit] [PubMed]
  13. Xu, J.; Shi, H.; Sun, F.; Tang, Z.; Li, S.; Chen, D.; Ma, T.; Kuznetsova, I.; Nedospasov, I.; Zhang, C. High-frequency vibration analysis of piezoelectric array sensor under lateral-field-excitation based on crystals with 3 m point group. Sensors 2022, 22, 3596. [Google Scholar] [CrossRef] [Scilit] [PubMed]
  14. Almassri, A.M.; Hasan, W.Z.W.; Ahmad, S.A.; Ishak, A.J.; Ghazali, A.M.; Talib, D.N.; Wada, C. Pressure sensor: State of the art, design, and application for robotic hand. J. Sens. 2015, 2015, 846487. [Google Scholar] [CrossRef] [Scilit]
  15. Li, F.; Xu, Z.; Wei, X.; Yao, X. Determination of temperature dependence of piezoelectric coefficients matrix of lead zirconate titanate ceramics by quasi-static and resonance method. J. Phys. D Appl. Phys. 2009, 42, 095417. [Google Scholar] [CrossRef] [Scilit]
  16. Tressler, J.F.; Uchino, K. Piezoelectric composite sensors. In Comprehensive Composite Materials; Talreja, R., Månson, J.A.E., Eds.; Elsevier Science: Oxford, UK, 2000; Volume 5, pp. 493–505. [Google Scholar] [CrossRef] [Scilit]
  17. Meetei, M.S.; Sihgh, A.D.; Majumder, S. A novel design approach for beam bridge structure pressure sensor based on PZT5A piezoelectric. J. Eng. Sci. Technol. Rev. 2021, 14, 193–199. [Google Scholar] [CrossRef] [Scilit]
  18. Meetei, M.S.; Singh, M.S.; Kalita, P.K.; Basumatari, B. Analyzing the performance of various piezoelectric materials in transverse mode: A comprehensive study. Int. J. Electron. Commun. Eng. 2024, 11, 163–168. [Google Scholar] [CrossRef] [Scilit]
  19. Hu, Z.; Hedley, J.; Keegan, N.; Spoors, J.; Waugh, W.; Gallacher, B.; Boillot, F.-X.; Collet, J.; McNeil, C. Design, fabrication and characterization of a piezoelectric MEMS diaphragm resonator mass sensor. J. Micromech. Microeng. 2013, 23, 125019. [Google Scholar] [CrossRef] [Scilit]
  20. Aabid, A.; Raheman, M.A.; Ibrahim, Y.E.; Anjum, A.; Hrairi, M.; Parveez, B.; Parveen, N.; Zayan, J.M. A systematic review of piezoelectric materials and energy harvesters for industrial applications. Sensors 2021, 21, 4145. [Google Scholar] [CrossRef] [Scilit] [PubMed]
  21. Sivakumar, N.; Kanagasabapathy, H.; Srikanth, H.P. Analysis of perforated piezoelectric sandwich smart structure cantilever beam using COMSOL. Mater. Today Proc. 2018, 5, 12025–12034. [Google Scholar] [CrossRef] [Scilit]
  22. John, D.M.; Annamalai, P.K.; Hosseinmardi, A.; Mahadeva, S.K.M.; Ramanujam, K.; Chetty, R.; Patel, R.; Raghava, R.B.T.S.; Nanjundan, A.K. Progress in Zinc Oxide-Based Polymer Nanocomposites for Advancing Piezoelectric Energy Harvesting and Self-Powered Devices. Macromol. Mater. Eng. 2025, 310, e00239. [Google Scholar] [CrossRef] [Scilit]
  23. Gusarov, B.; Gusarova, E.; Viala, B.; Gimeno, L.; Cugat, O. PVDF piezoelectric voltage coefficient in situ measurements as a function of applied stress. J. Appl. Polym. Sci. 2016, 133, 43248. [Google Scholar] [CrossRef] [Scilit]
  24. Kuehne, I.; Marinkovic, D.; Eckstein, G.; Seidel, H. A new approach for MEMS power generation based on a piezoelectric diaphragm. Sens. Actuators A Phys. 2008, 142, 292–297. [Google Scholar] [CrossRef] [Scilit]
  25. Fulay, P.; Lee, J.-K. Ferroelectrics, piezoelectrics, and pyroelectrics. In Electronic, Magnetic, and Optical Materials, 2nd ed.; CRC Press: Boca Raton, FL, USA, 2016. [Google Scholar] [CrossRef] [Scilit]
  26. Putra, P.P.; Akasaka, S.; Konosu, Y.; Zhang, S.; Tanioka, A.; Matsumoto, H. Structure–Piezoelectric Property Relationships of Thin Films Composed of Electrospun Aligned Poly(vinylidene fluoride) Nanofibers. Nanomaterials 2024, 14, 491. [Google Scholar] [CrossRef] [Scilit] [PubMed]
  27. Senturia, S.D. Microsystem Design; Springer: Boston, MA, USA, 2000. [Google Scholar]
  28. Bao, M. Analysis and Design Principles of MEMS Devices; Elsevier Science: Oxford, UK, 2005. [Google Scholar]
  29. Bhatia, D.; Sharma, H.; Meena, R.S.; Palkar, V.R. A novel ZnO piezoelectric microcantilever energy scavenger: Fabrication and characterization. Sens. Bio-Sens. Res. 2016, 9, 45–52. [Google Scholar] [CrossRef] [Scilit]
  30. Khan, A.A.J.; Shanmugaraja, P.; Kannan, S. Design and simulation of MEMS piezoelectric cantilever array for fully cochlear implantable sensor. Ann. Rom. Soc. Cell Biol. 2021, 25, 618–639. Available online: http://annalsofrscb.ro/index.php/journal/article/view/2495 (accessed on 4 February 2025).
  31. Polewczyk, V.; Magrin Maffei, R.; Vinai, G.; Lo Cicero, M.; Prato, S.; Capaldo, P.; Dal Zilio, S.; Di Bona, A.; Paolicelli, G.; Mescola, A.; et al. ZnO thin films growth optimization for piezoelectric application. Sensors 2021, 21, 6114. [Google Scholar] [CrossRef] [Scilit] [PubMed]
  32. Chang, G.; Pan, X.; Hao, Y.; Du, W.; Wang, S.; Zhou, Y.; Yang, J.; He, Y. PVDF/ZnO piezoelectric nanofibers designed for monitoring of internal micro-pressure. RSC Adv. 2024, 14, 11775–11783. [Google Scholar] [CrossRef] [Scilit] [PubMed]
Figure 1. Side view of the proposed cantilever-based pressure sensor.
Condensedmatter 11 00024 g001
Figure 2. Schematic diagram of a piezoelectric sensor.
Condensedmatter 11 00024 g002
Figure 3. Meshing of the 3D model of the sensor.
Condensedmatter 11 00024 g003
Figure 4. Potential difference developed across the surfaces of the piezoelectric materials.
Condensedmatter 11 00024 g004
Figure 5. The variation in potential difference due to variation in applied pressure.
Condensedmatter 11 00024 g005
Figure 6. Variation in potential difference with applied pressure for 2 µm-thick ZnO and PVDF layers.
Condensedmatter 11 00024 g006
Figure 7. Variation in potential difference with applied pressure for 2.5 µm-thick ZnO and PVDF layers.
Condensedmatter 11 00024 g007
Figure 8. Variation in potential difference with applied pressure for 3.5 µm-thick ZnO and PVDF layers.
Condensedmatter 11 00024 g008
Figure 9. Variation in potential difference with applied pressure for 4 µm-thick ZnO and PVDF layers.
Condensedmatter 11 00024 g009
Table 1. Mechanical and piezoelectric properties of the materials used in the design [22,23,26].
Types of MaterialYoung’s Modulus
[GPa]
Poisson’s Ratioε33d31
pC/N
g31
Vm/N
ZnO1200.3612.65−5.43−4.85 × 10⁻²
PVDF2.5 to 3.50.356 to 123 to 222.8 × 10⁻² to 41.4 × 10⁻²
Au700.44
SiO2700.17
Table 2. Dimensions of the piezoelectric sensor components.
Types of MaterialLengthBreathThickness
ZnO50 µm50 µm3 µm
PVDF50 µm50 µm3 µm
Au50 µm50 µm2 µm
SiO2300 µm50 µm3 µm
Si300 µm50 µm75 µm
Table 3. Comparisons of simulated and calculated values of potential difference developed across the sensing layers.
Applied Pressure (kPa)Simulated Value of Potential Difference (V)Calculated Value of Potential Difference (V)Margin of Error
(%)
0−0.00−0.000.00
1−0.001−0.001216.67
2−0.0021−0.00238.70
3−0.0031−0.003511.43
4−0.0041−0.004610.87
5−0.0051−0.005812.07
6−0.0062−0.007011.43
7−0.0072−0.008111.11
8−0.0082−0.009311.83
9−0.0092−0.010512.38
10−0.0103−0.011611.21
Table 4. Non-linearity table of the simulated and calculated values.
Data TypeMax Deviation (V)FS Output (V)Non-Linearity (%)
Simulated7.0 × 10−50.01030.68%
Calculated6.0 × 10−50.01160.52%
Disclaimer/Publisher’s Note: The statements, opinions and data contained in all publications are solely those of the individual author(s) and contributor(s) and not of MDPI and/or the editor(s). MDPI and/or the editor(s) disclaim responsibility for any injury to people or property resulting from any ideas, methods, instructions or products referred to in the content.