
Article

Measurements of Electronic Band Structure in CeCoGe3 by Angle-Resolved Photoemission Spectroscopy

1
Department of Physics and Astronomy, University of California Davis, Davis, CA 95616, USA
2
Materials Sciences Division, Lawrence Berkeley National Lab, Berkeley, CA 94720, USA
3
Department of Physics, Virginia Tech, Blacksburg, VA 24061, USA
4
Virginia Tech National Security Institute, Blacksburg, VA 24060, USA
5
Virginia Tech Center for Quantum Information Science and Engineering, Blacksburg, VA 24061, USA
*
Author to whom correspondence should be addressed.
Condens. Matter 2026, 11(1), 8; https://doi.org/10.3390/condmat11010008
Submission received: 12 January 2026 / Revised: 7 February 2026 / Accepted: 10 February 2026 / Published: 25 February 2026

Abstract

In this paper, we present a comprehensive study of the electronic structure of CeCoGe3 throughout the entire Brillouin zone in the non-magnetic regime using angle-resolved photoemission spectroscopy (ARPES). The electronic structure agrees in large part with first principles calculations, including predicted topological nodal lines. Two new features in the band structure are also observed, namely a surface state and folded bands, the latter of which is argued to originate from a unit cell reconstruction.

1. Introduction

The field of unconventional superconductivity was invigorated by the discovery of superconducting phases in materials lacking inversion symmetry. The lack of parity as a good quantum number permits the existence of anti-symmetric spin–orbit coupling interactions that can lead to unexpected behavior in the superconducting state. These interactions result in superconducting pairings that are a mixture of singlet and triplet states, as well as complex structures of the superconducting gap that can include point nodes and line nodes [1,2,3].
Electronic correlations and band topology add further richness to the potential pairing mechanisms and phenomenologies in superconductors that lack inversion symmetry. It was recently demonstrated [4] that these constituents coexist in non-centrosymmetric heavy fermion materials with chemical formula CeTX3 (T = transition metal, X = Si or Ge) and a tetragonal BaNiSn3 crystal structure. Collectively, these compounds span the full Doniach phase diagram from localized magnetism to heavy fermion physics without magnetic order [5,6]. CeCoGe3, the compound of interest in this manuscript, is in the intermediate regime, featuring enhanced carrier mass and magnetic ordering [7,8,9]. This competition between magnetism and Kondo physics was demonstrated via the temperature dependence of spectral weight measured by ARPES [10]. Recent studies have also investigated predicted Weyl nodes near the Fermi energy ( E F ) [4,11,12] large field-induced anomalous Hall conductivity reported [13].
CeCoGe3 is susceptible to superconductivity under hydrostatic pressure [14] and can be driven to the magnetic quantum phase transition via chemical substitution [7,15]. In the superconducting state, CeCoGe3 and related compounds are distinguished by extremely high upper critical magnetic fields along the c-axis [16,17]. This, together with the broken inversion symmetry, topological band structure, and the appearance of superconductivity at the endpoint of magnetic order, has been cited in the proposal of unconventional, possibly triplet, superconductivity in this and related compounds [18]. Experimental fermiology is one of the ingredients for evaluating unconventional superconducting mechanisms.
Here we report a comprehensive ARPES study of the non-magnetic electronic structure of CeCoGe3 throughout the three-dimensional (3D) Brillouin zone. There is overall agreement with first-principles calculations that assume localized f electrons. However, two additional features are seen experimentally: a two-dimensional (2D) surface-like band and band folding that appears to be most consistent with a unit cell doubling.

2. Materials and Methods

Single crystals of CeCoGe3 were synthesized using the solution growth method [19,20,21]. First, the stoichiometric composition of CeCoGe3 was arc-melted, flipped upside-down and arc-melted again multiple times to ensure a homogeneous mixture. It was then combined with bismuth in a ratio of Ce8Co8Ge24Bi60. The entire mixture was initially heated to 1150 °C within 6 h, followed by a dwell time of 72 h. The temperature was then slowly decreased to 750 °C over 90 h, after which the remaining molten bismuth flux was removed by centrifugation [20,21,22,23].
ARPES and XPS measurements were performed at the MERLIN endstation (Beamline 4.0.3) at the Advanced Lightsource and Beamline 5.2 at the Stanford Synchrotron Radiation Lightsource (SSRL) using photon energies between 26 and 150 eV. Beam spot size at SSRL was ≈15 × 8 μ m , and the analyzer energy resolution was ≈18 meV. MERLIN data were collected with spot size ≈50 × 70 μ m and energy resolution ≈25 meV. All photoemission spectra were collected at 30 K, above any of the magnetic ordering transitions [19].
First-principles calculations were carried out using the full potential linear muffin tin orbital method including spin–orbit coupling [24]. The effects of Ce 4 f orbital electronic correlations are captured within the Local Density Approximation + Gutzwiller (LDA+G) formalism [25,26]. The local crystal field effects on the Ce 4 f 7 / 2 1 and Ce 4 f 5 / 2 1 multiplets were captured using a band-dependent double-counting scheme [4]. Topological features within the Brillouin zone (BZ) were identified recursively using a Berry curvature link-variable approach [27].

3. Results

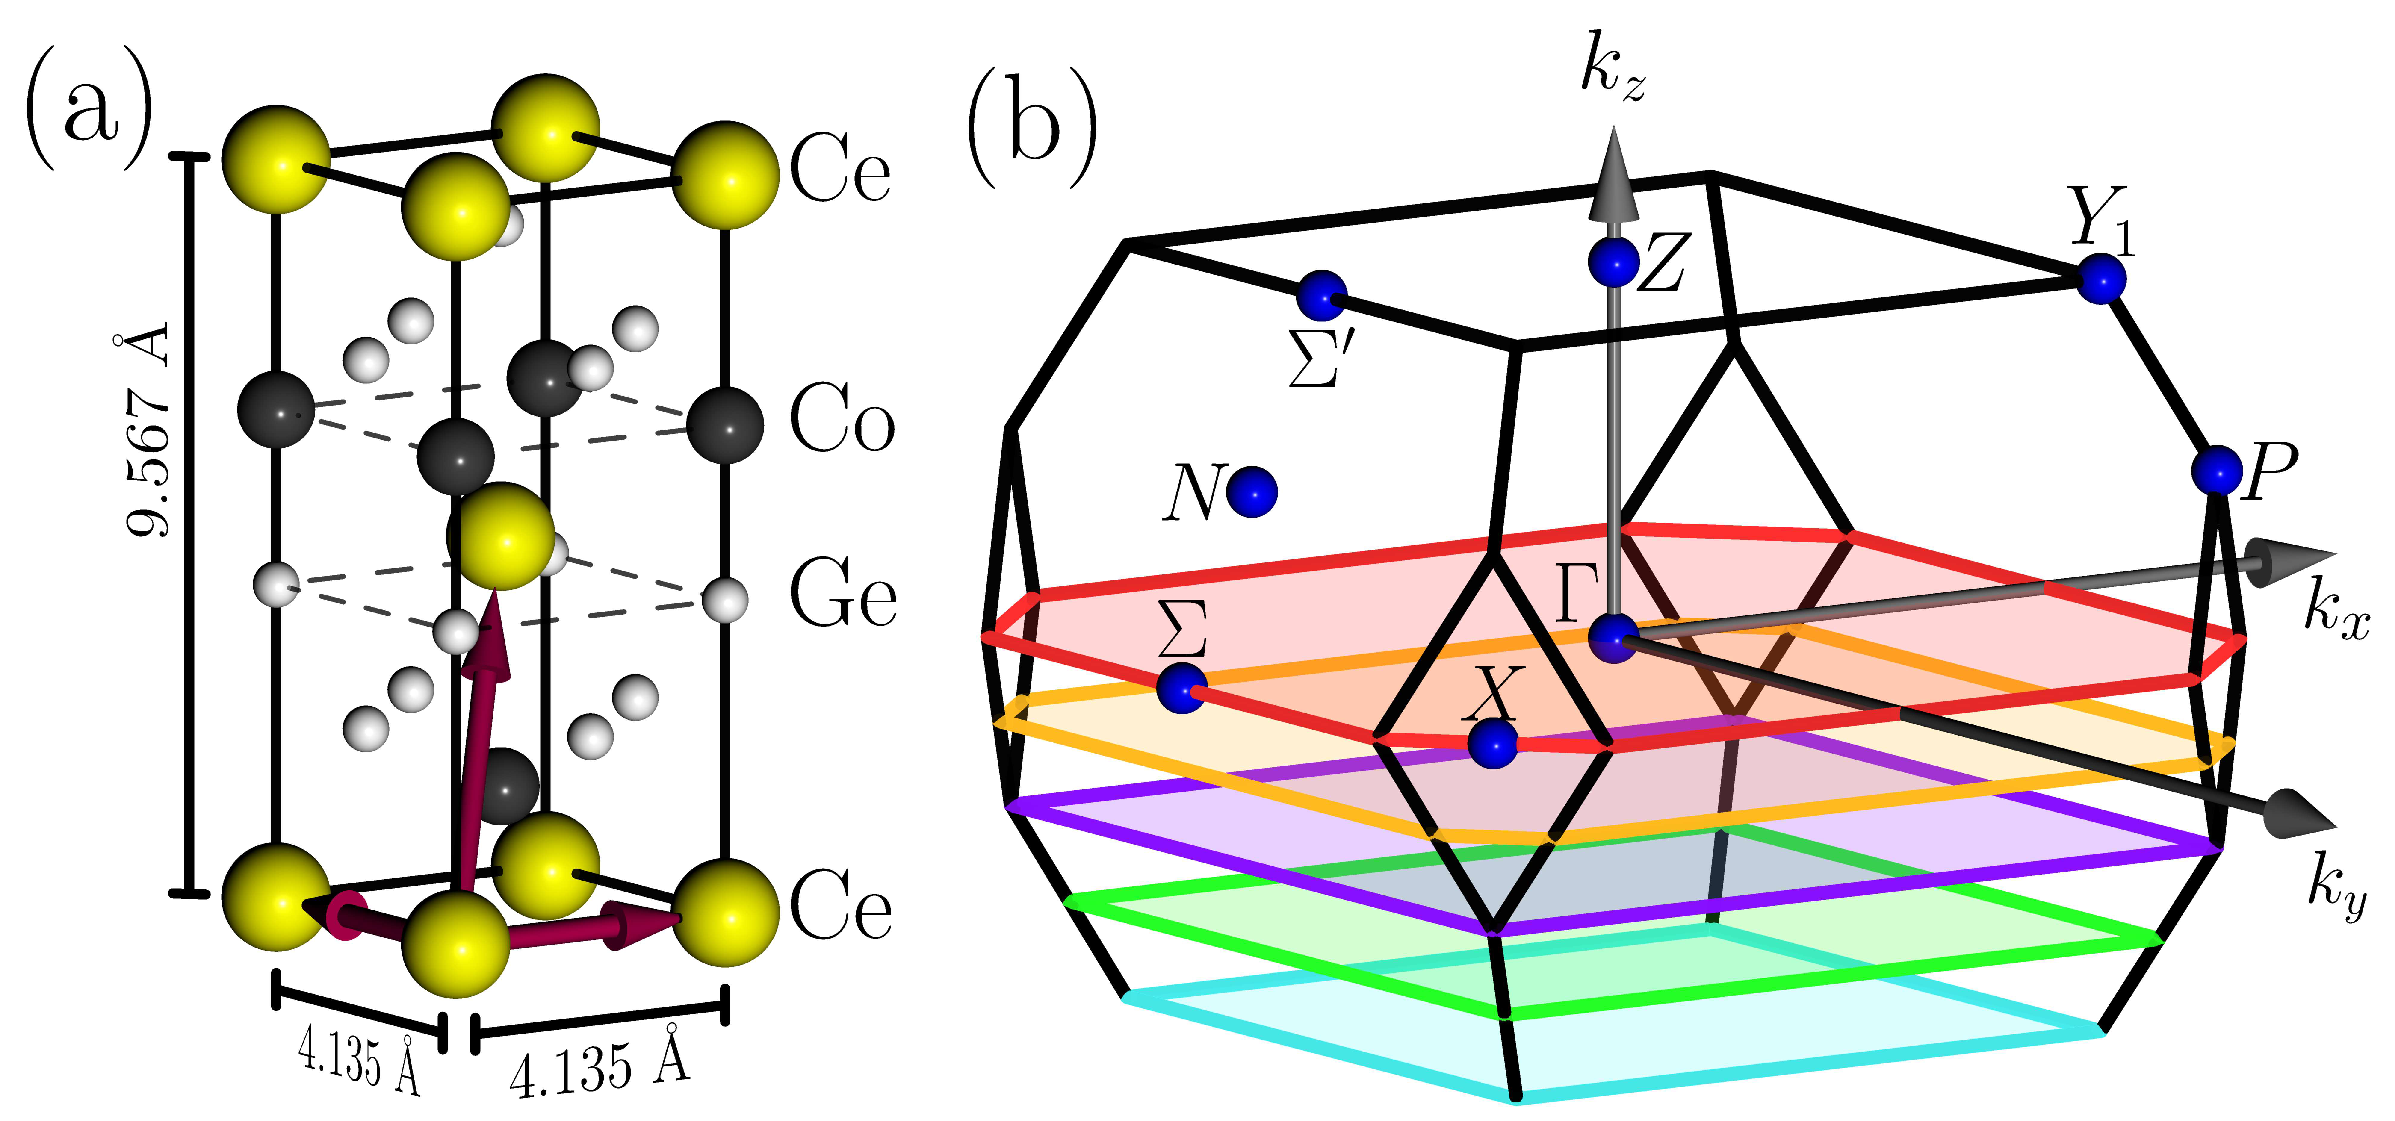
CeCoGe3 crystallizes in a non-centrosymmetric tetragonal crystal structure with the space group I4mm (No. 107); the structural (conventional) unit cell is shown in Figure 1a, but the primitive cell is used to define the BZ and for performing calculations. The conventional unit cell can be viewed as a layered structure with Ce, Co, and two adjacent non-equivalent Ge layers. The 3D BZ is shown in Figure 1b, with high-symmetry points marked. Throughout the text, energy vs. momentum cuts are taken either parallel to Γ Σ or parallel to Γ X at different values of k z . The Γ plane, Z plane, and N P plane refer to planes through these high symmetry points and parallel to k x k y . Γ Z ¯ refers to the line between Γ and Z along the k z axis. In Figure 1b, the colored planes indicate planes of corresponding color in later figures.
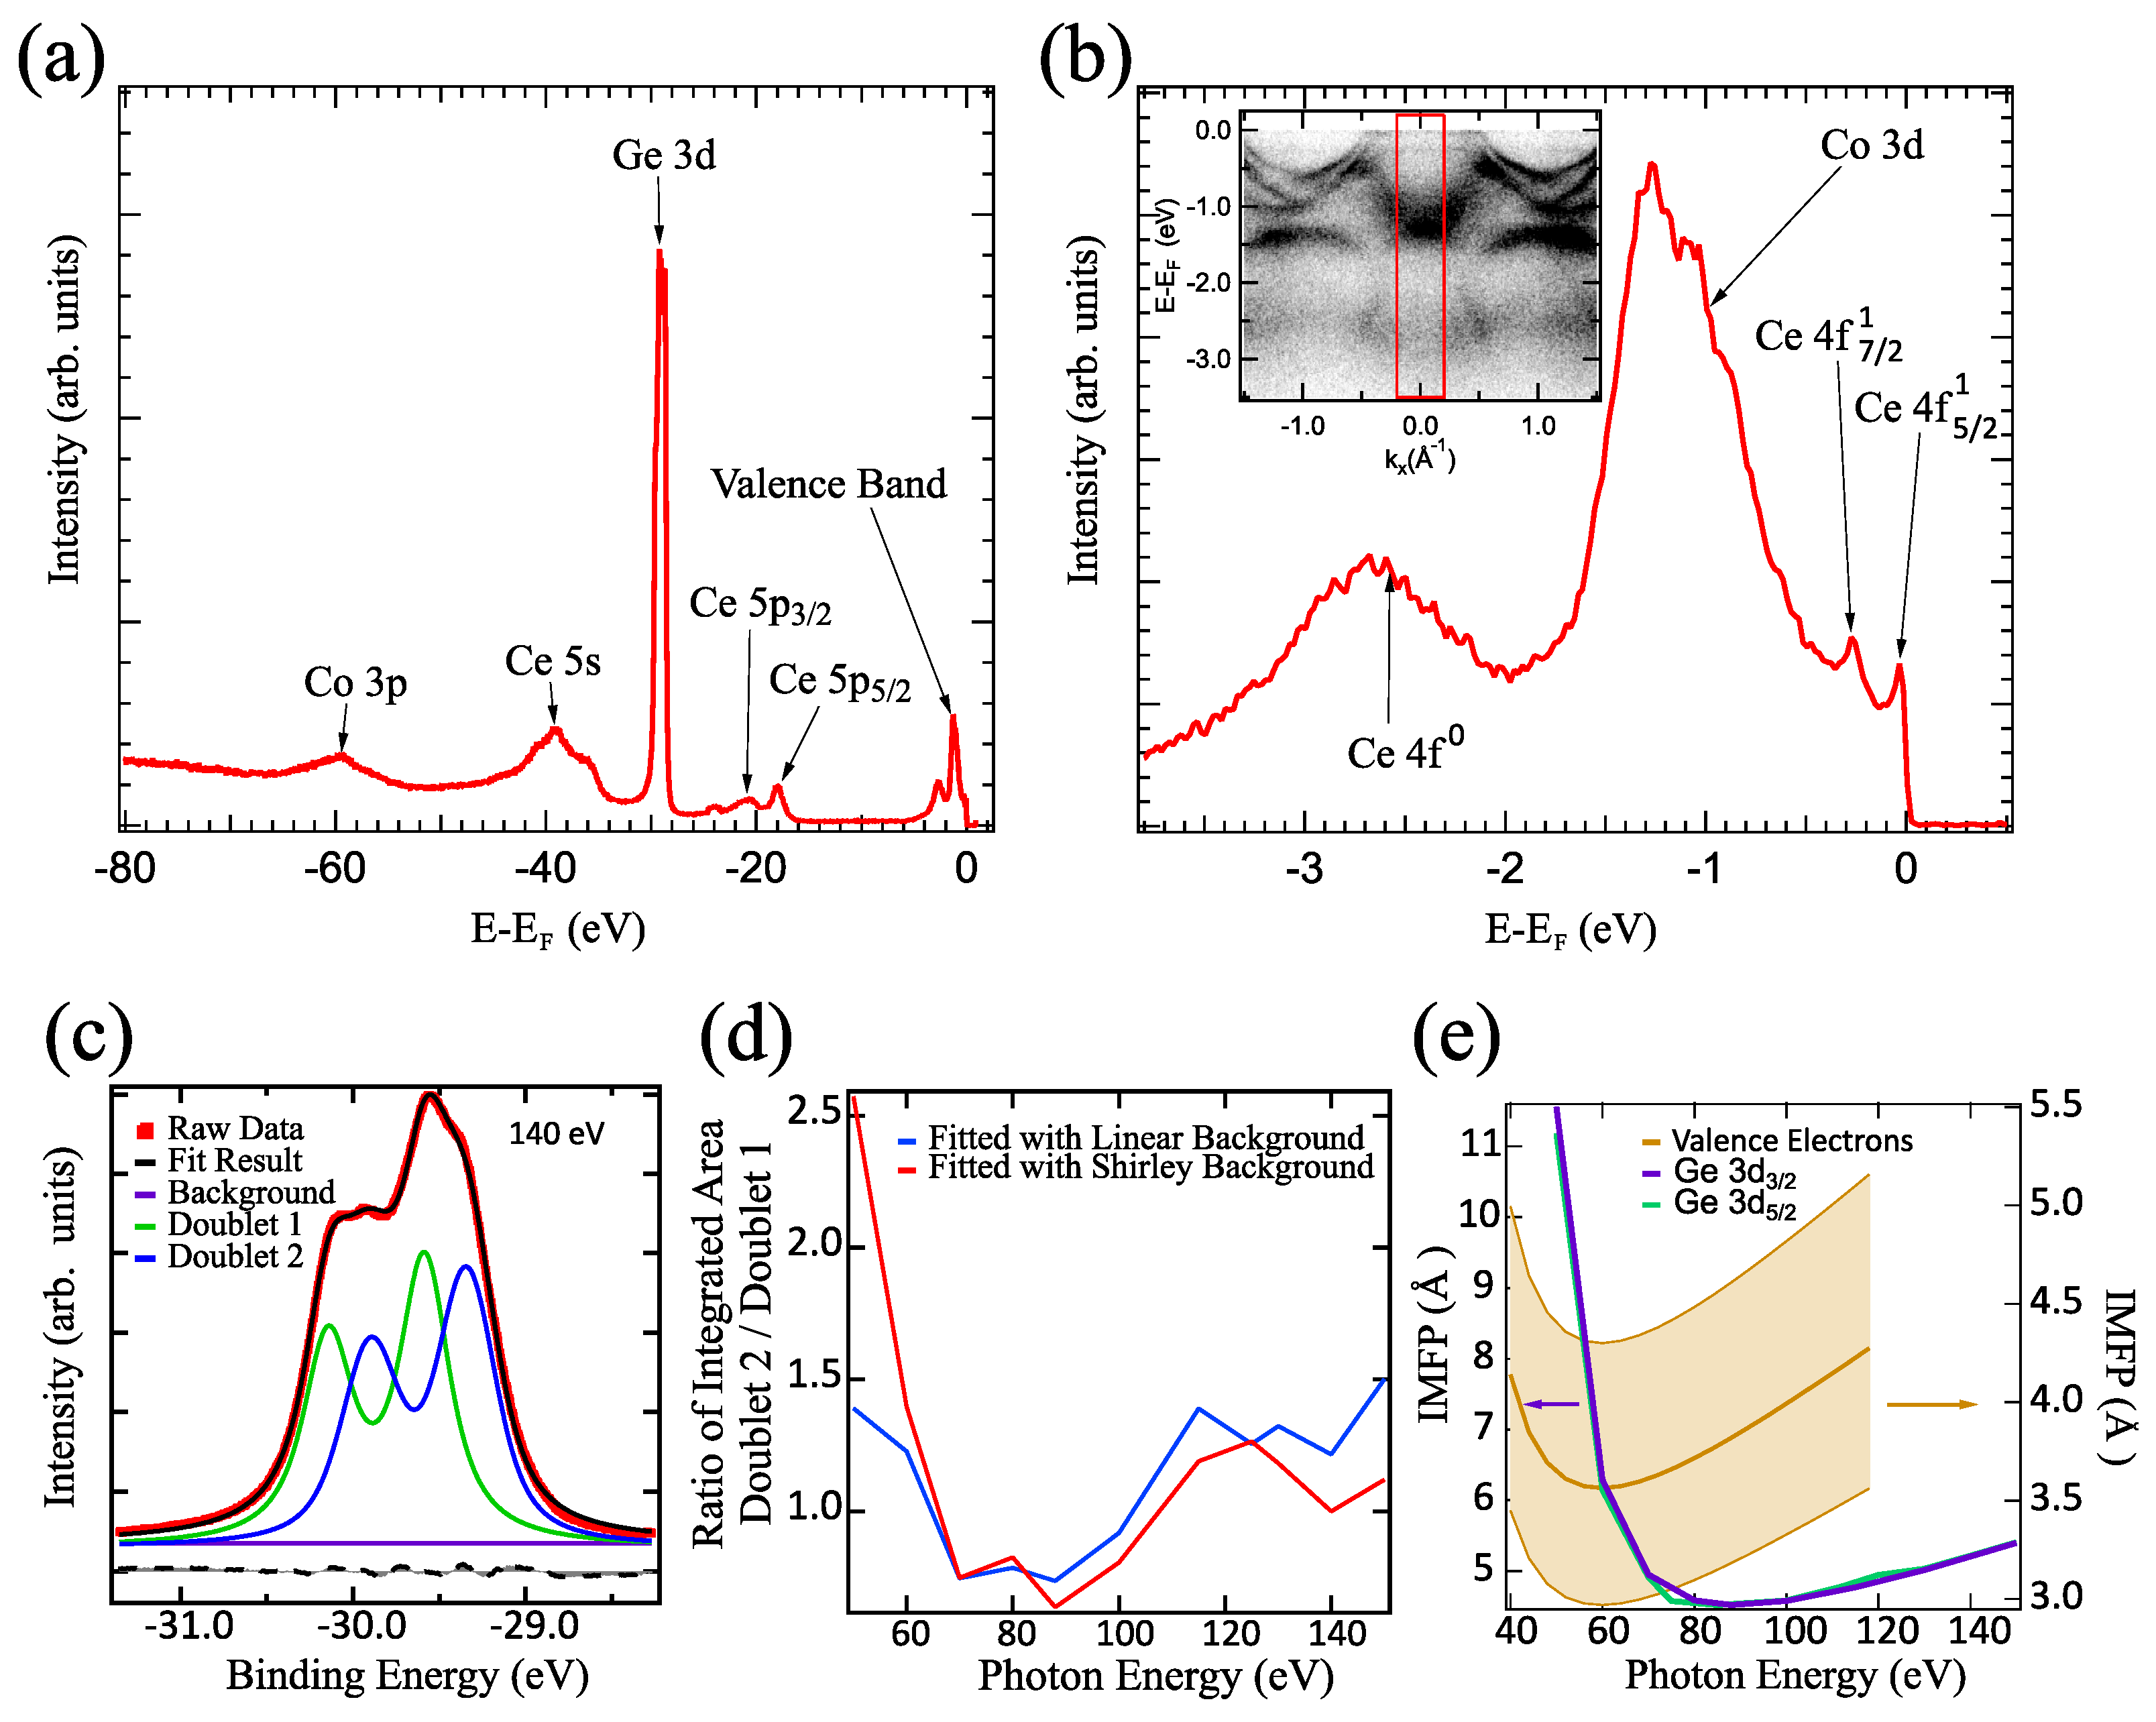
Figure 2a shows a survey XPS spectrum. All elements of the compound are present, and no extraneous peaks are observed, which indicates a cleave without contamination from Bi flux. An example spectrum for a sample with residual flux is included in the Supplementary Materials; samples such as these tend to yield poor-quality ARPES spectra. Figure 2b highlights the valence bands, with an emphasis on Ce levels. In Figure 2c, we focus on the Ge- 3 d states, which clearly show at least four peaks. These spectra were measured in the 50–150 eV photon energy range and fitted using a background plus two Voigt-profile spin–orbit-split doublets from which the integrated area of each component was extracted. Both linear and Shirley background functions were tested in the fitting (See Supplementary Materials). The results of this fit are summarized in Figure 2d, which plots the area ratio of the two doublets. Though the results are background-dependent at low photon energy, the doublet at higher binding energy (doublet 1) is strongest at a photon energy of ≈90 eV, where the inelastic mean free path (IMFP) for Ge- 3 d electrons is the smallest (Figure 2e). For the Ge- 3 d core levels, IMFPs were calculated with SESSA v2.2.2 [28], yielding the two core-level curves (3d5/2 and 3d3/2), which differ slightly due to their different kinetic energies at a given photon energy. For valence band photoelectrons (Figure 2e), a reference IMFP was computed using the semi-empirical Gries G1 expression [29]. In this model, the effective electron number Z* represents the number of electrons that most strongly contribute to inelastic scattering. The envelope spans Gries-G1 results using Z = Z eff ( Z eff = ( i f i Z i 2.94 ) 1 / 2.94 = 43.44 ) [30] and Z* = 30 (valence-electron count [31]), while the central curve uses the direct atomic-number average. IMFP values for Ge- 3 d levels and valence bands are calculated only over the measurement range of these quantities in this manuscript.
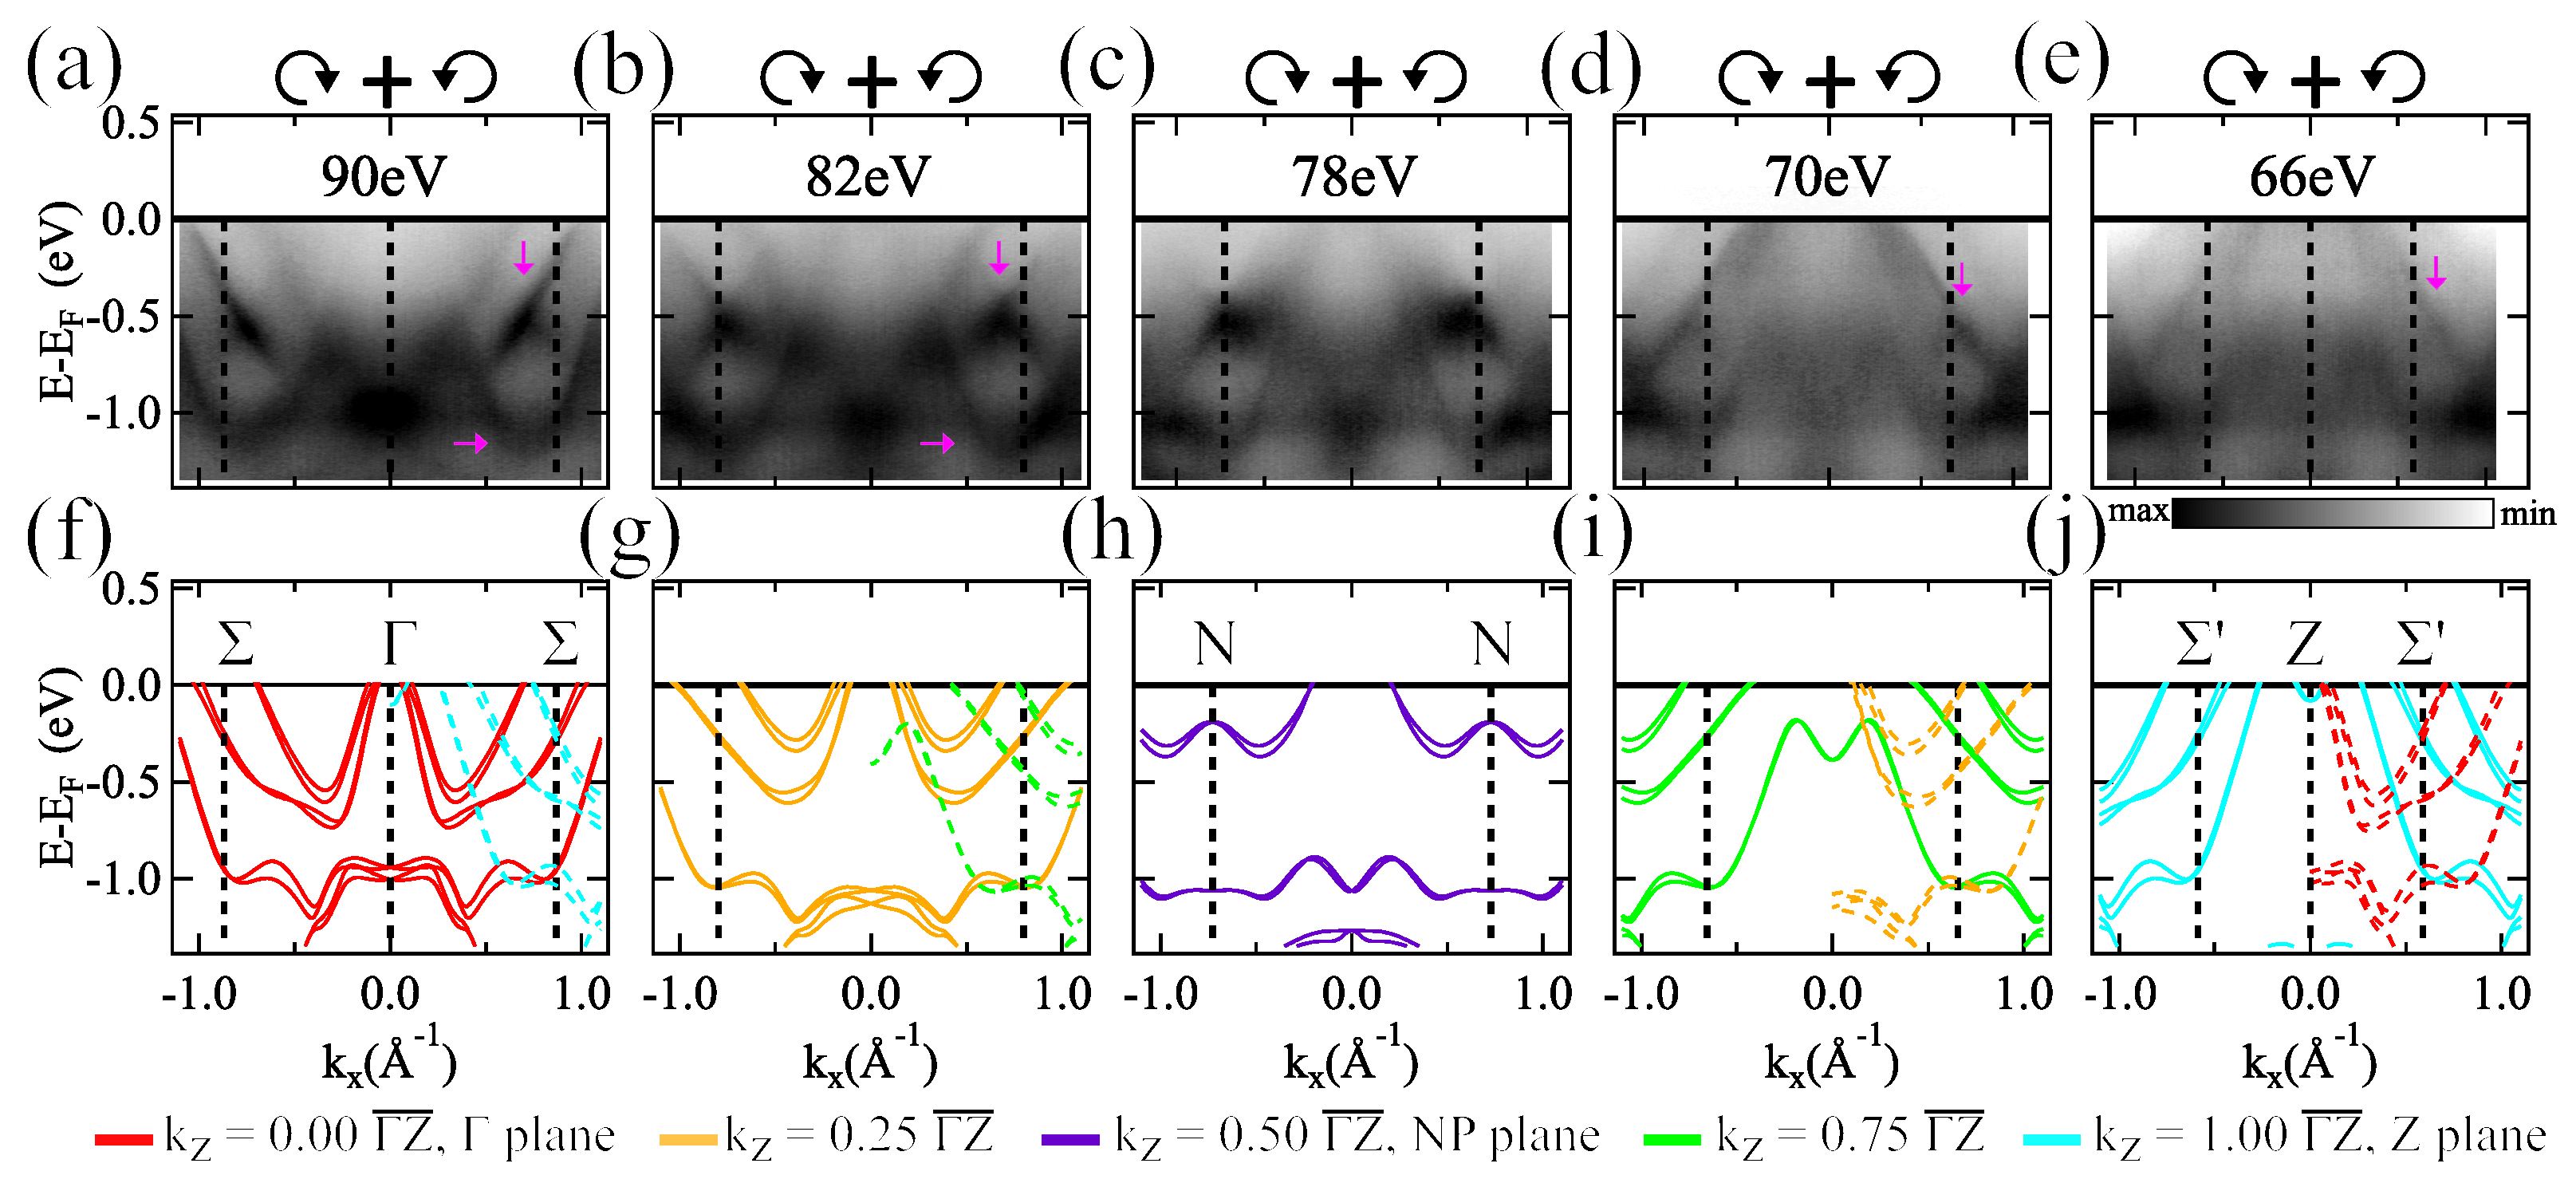
ARPES spectra were collected throughout the BZ, and most of the detailed spectra focus near planes cutting through the Γ Z line ( Γ Z ¯ ) at 5 roughly equidistant positions: Γ plane ( k z = 0.0 Γ Z ¯ , red), k z = 0.25 Γ Z ¯ (orange), 0.5 Γ Z ¯ (also called N P plane, purple), 0.75 Γ Z ¯ (green), and the Z plane ( 1.0 Γ Z ¯ , cyan). Figure 3 shows high-symmetry cuts parallel to Γ Σ at these values of k z . The spectra shown are a sum of spectra collected with left circularly polarized (LCP) and right circularly polarized (RCP) light at the photon energy indicated in each panel. These energy vs. momentum spectra are energy distribution curve (EDC) normalized by taking each momentum channel and dividing it by the integrated area of that channel. The spectra tend to have weaker intensity close to E F , which is also seen in previously published data [10]. Qualitatively, our spectra show good agreement with LDA+G calculations in Ref. [4], albeit with several differences. First, experimental spectra show a rigid shift of 180 meV relative to the calculation. All calculations shown in this manuscript employ this rigid shift relative to Ref. [4]. We note that a rigid shift does not give perfect agreement, especially in the NP plane (Figure 3c,h) (see Supplementary Materials for overlays of calculations on ARPES data). Additionally, there are measured bands that are absent in the calculation. When these additional bands cross the predicted bands, they form ‘x-shaped’ features at low binding energy, and some examples are marked by vertical arrows in Figure 3a–e (See Supplementary Materials for zoomed-in images of this feature). Additional extra features are marked by horizontal arrows in some panels. At most planes in the BZ, the position and dispersion of these addition features is captured by calculated bands half the Γ Z ¯ distance; for example, extra bands near the Γ plane agree well with bands near the Z plane. Examples of these offset bands are plotted in dashed lines in Figure 3f,g,i,j. Panel (h) corresponds to the NP plane, and half a BZ away in k z is still the NP plane.
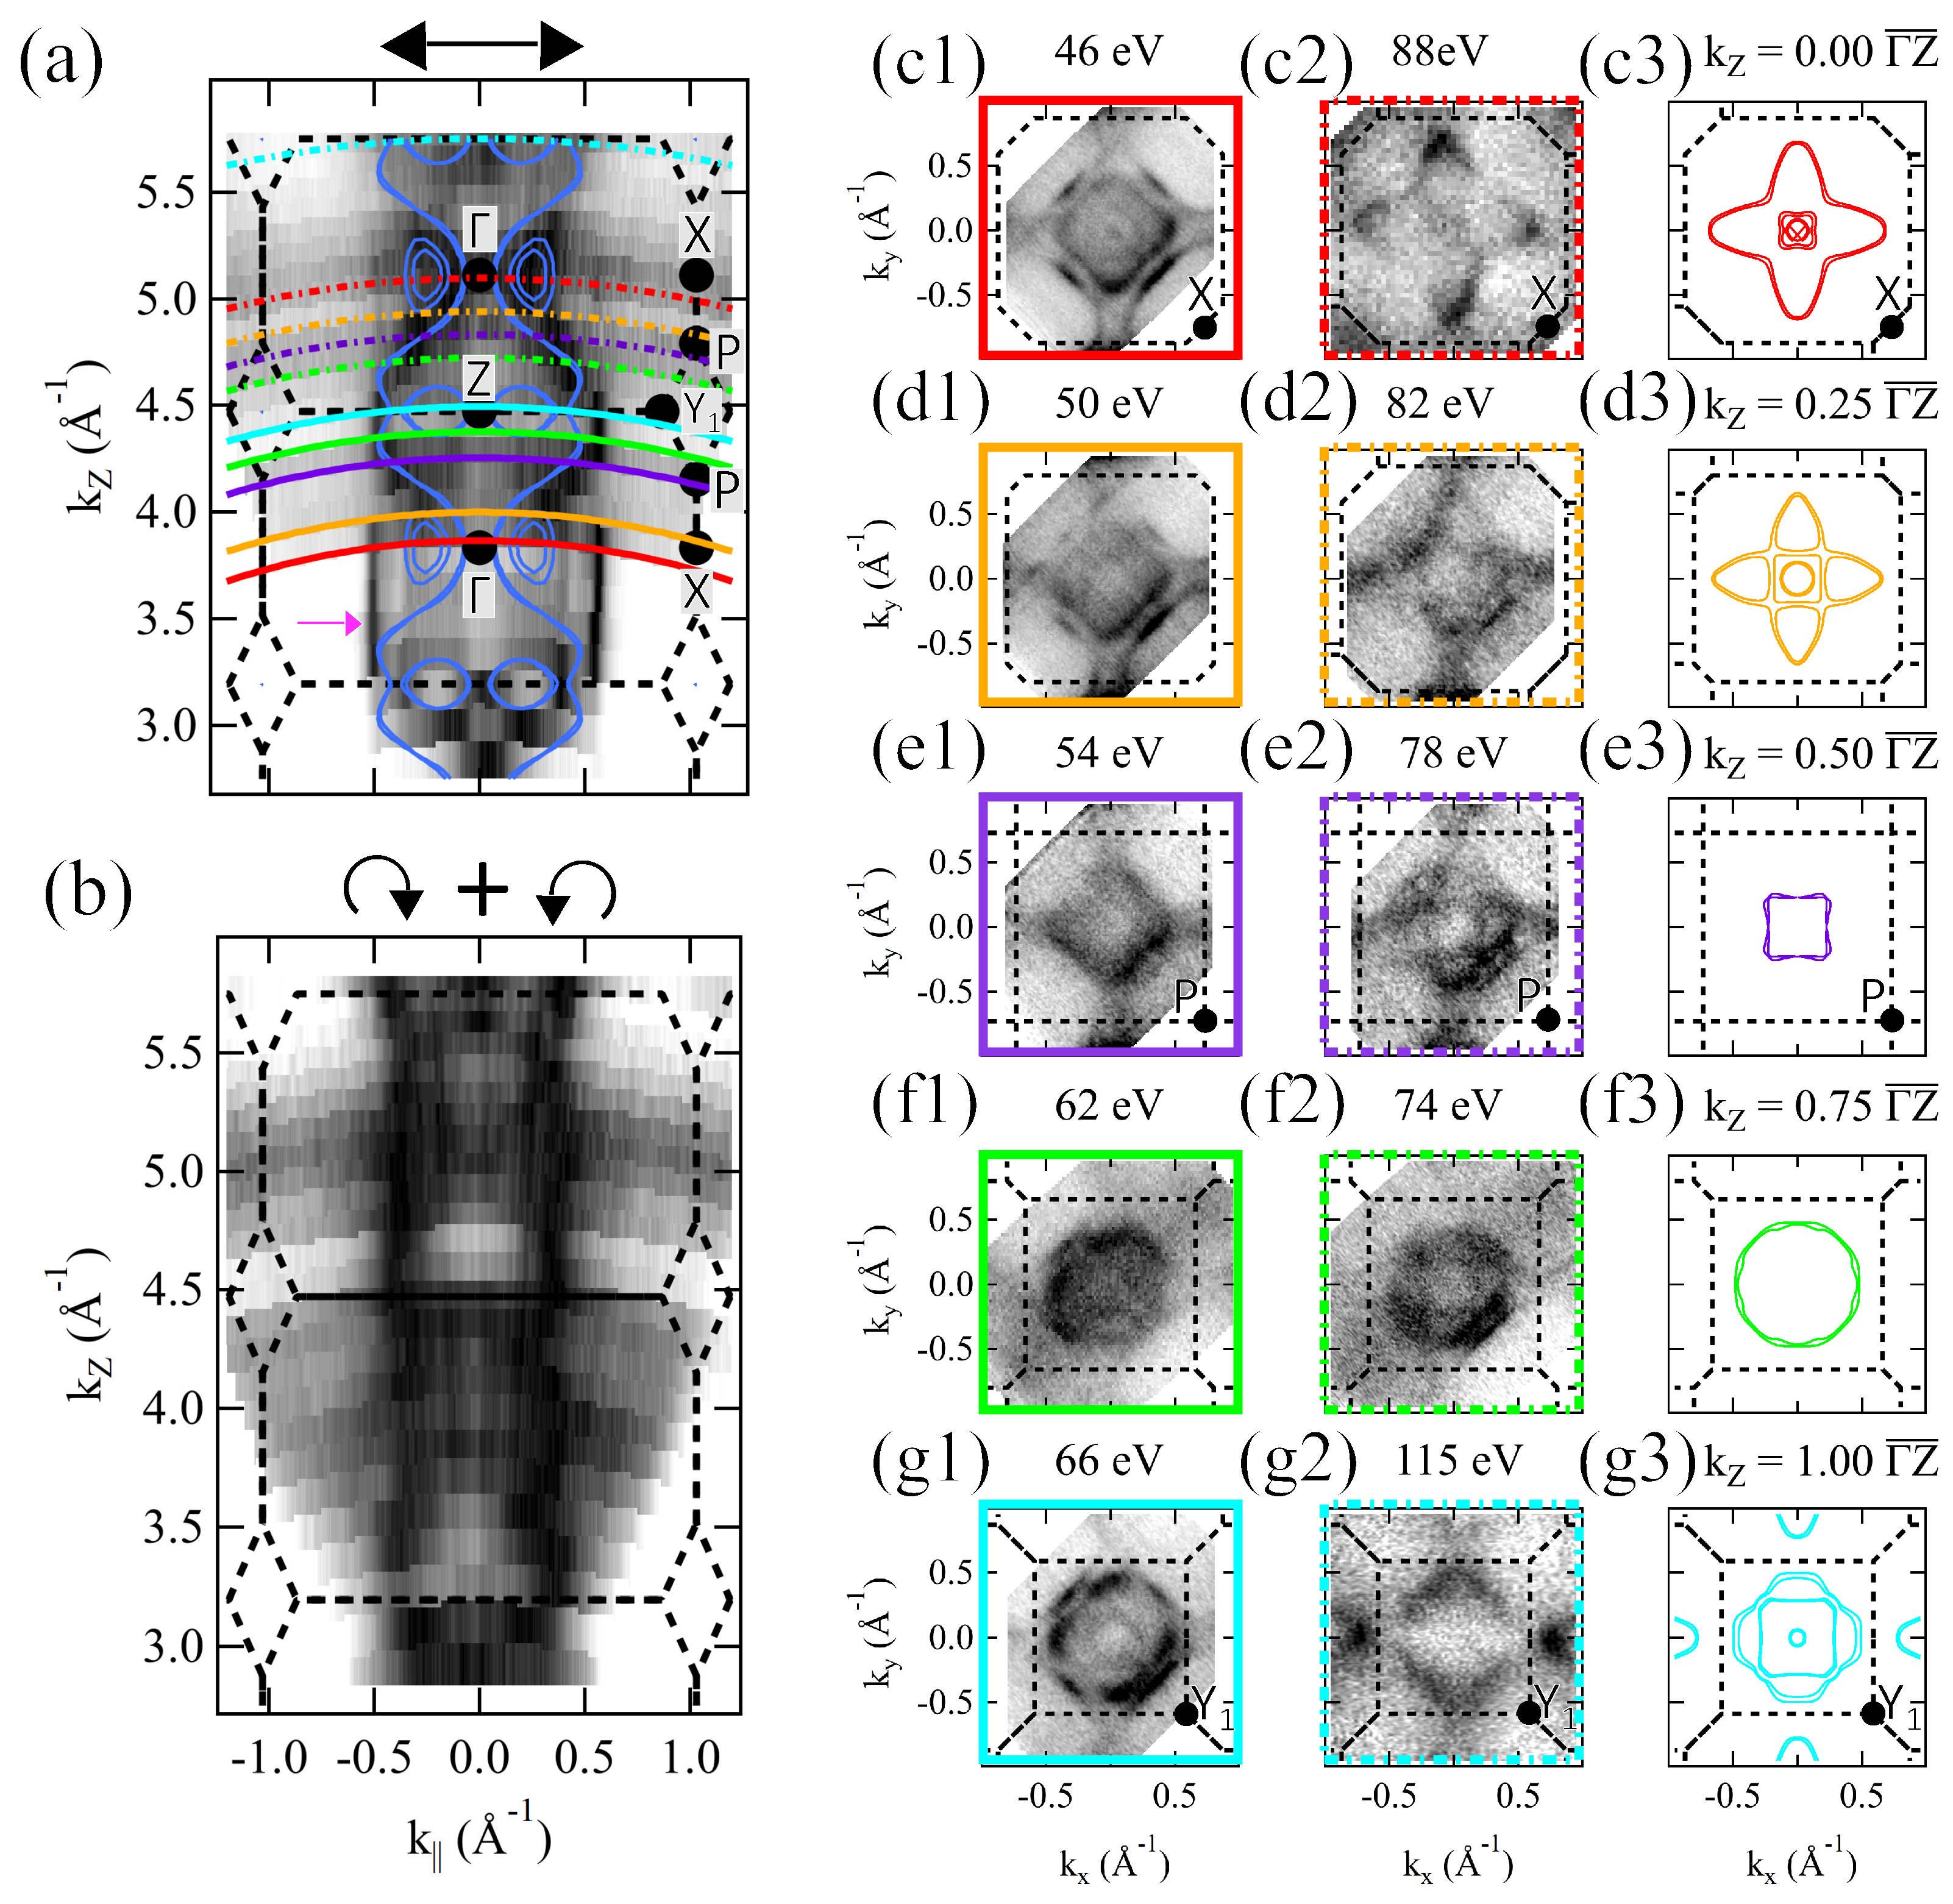
Figure 4 explores constant energy maps at E F (Fermi surface maps) both along k z and perpendicular to k z . All maps are generated with a 60 meV integration window centered around E F . Figure 4a,b were collected in the Γ X Z plane, where photon energy was tuned between 26 and 118 eV to access different values of k z . An inner potential value of 15.5 eV was used, as determined from the periodicity of the spectra and from matching Fermi surface maps to calculations [32]. Different polarizations were used in panels (a) (linear horizontal, LH) and (b) (RCP+LCP) to capture different band features. Figure 4a,b were taken on the same cleave. Panel (a) shows some features that agree with overlaid calculated Fermi surfaces, such as near the BZ boundary at Z, but other experimental features not captured in calculation, such as near Γ where the measured Fermi surface is further away from the zone center than the calculation. Additionally, there are ‘vertical’ features prominent in the bottom half of Figure 4a, one of which is marked with pink arrow. As these features are very sharp and do not disperse as a function of k z , they are presumed to be surface states. These features are not visible in panel (b). In those data, the Fermi surface in the Γ X Z plane appears to have a periodicity twice that of the BZ in k z .
In Figure 4c1–g3 we examine Fermi surface maps as a function of k x k y for different values of k z located at momentum planes roughly equivalent to those indicated in Figure 1b. All of these maps are collected with LH polarization. For each measured plane of the BZ, Fermi surface maps collected at different photon energies are shown in columns 1 and 2 in order to disambiguate effects of matrix elements and differing surface sensitivity. Calculated Fermi surfaces are shown in column 3. While the calculations are exactly at the planes indicated in the figure, data are collected along the trajectories indicated in (a) which are not planar and not located exactly equidistantly along the k z axis. The surface bands discussed in Figure 4a are seen most clearly as sharp quarter-circles furthest from the center of the zone in (c1), (d1), (e1), (e2), and (g1). Panels (c2), (d2), and (g2) agree reasonably well with their accompanying calculation. Meanwhile, some of the other measurements agree better with calculations elsewhere in the BZ: (c1), ignoring the surface band, has a diamond-shape surrounding a square similar to (g3); (d1) has a prominent diamond-shaped feature lacking in (d3); (e2) has bands additional to the predicted square; (f2) has bands other than the predicted circle.
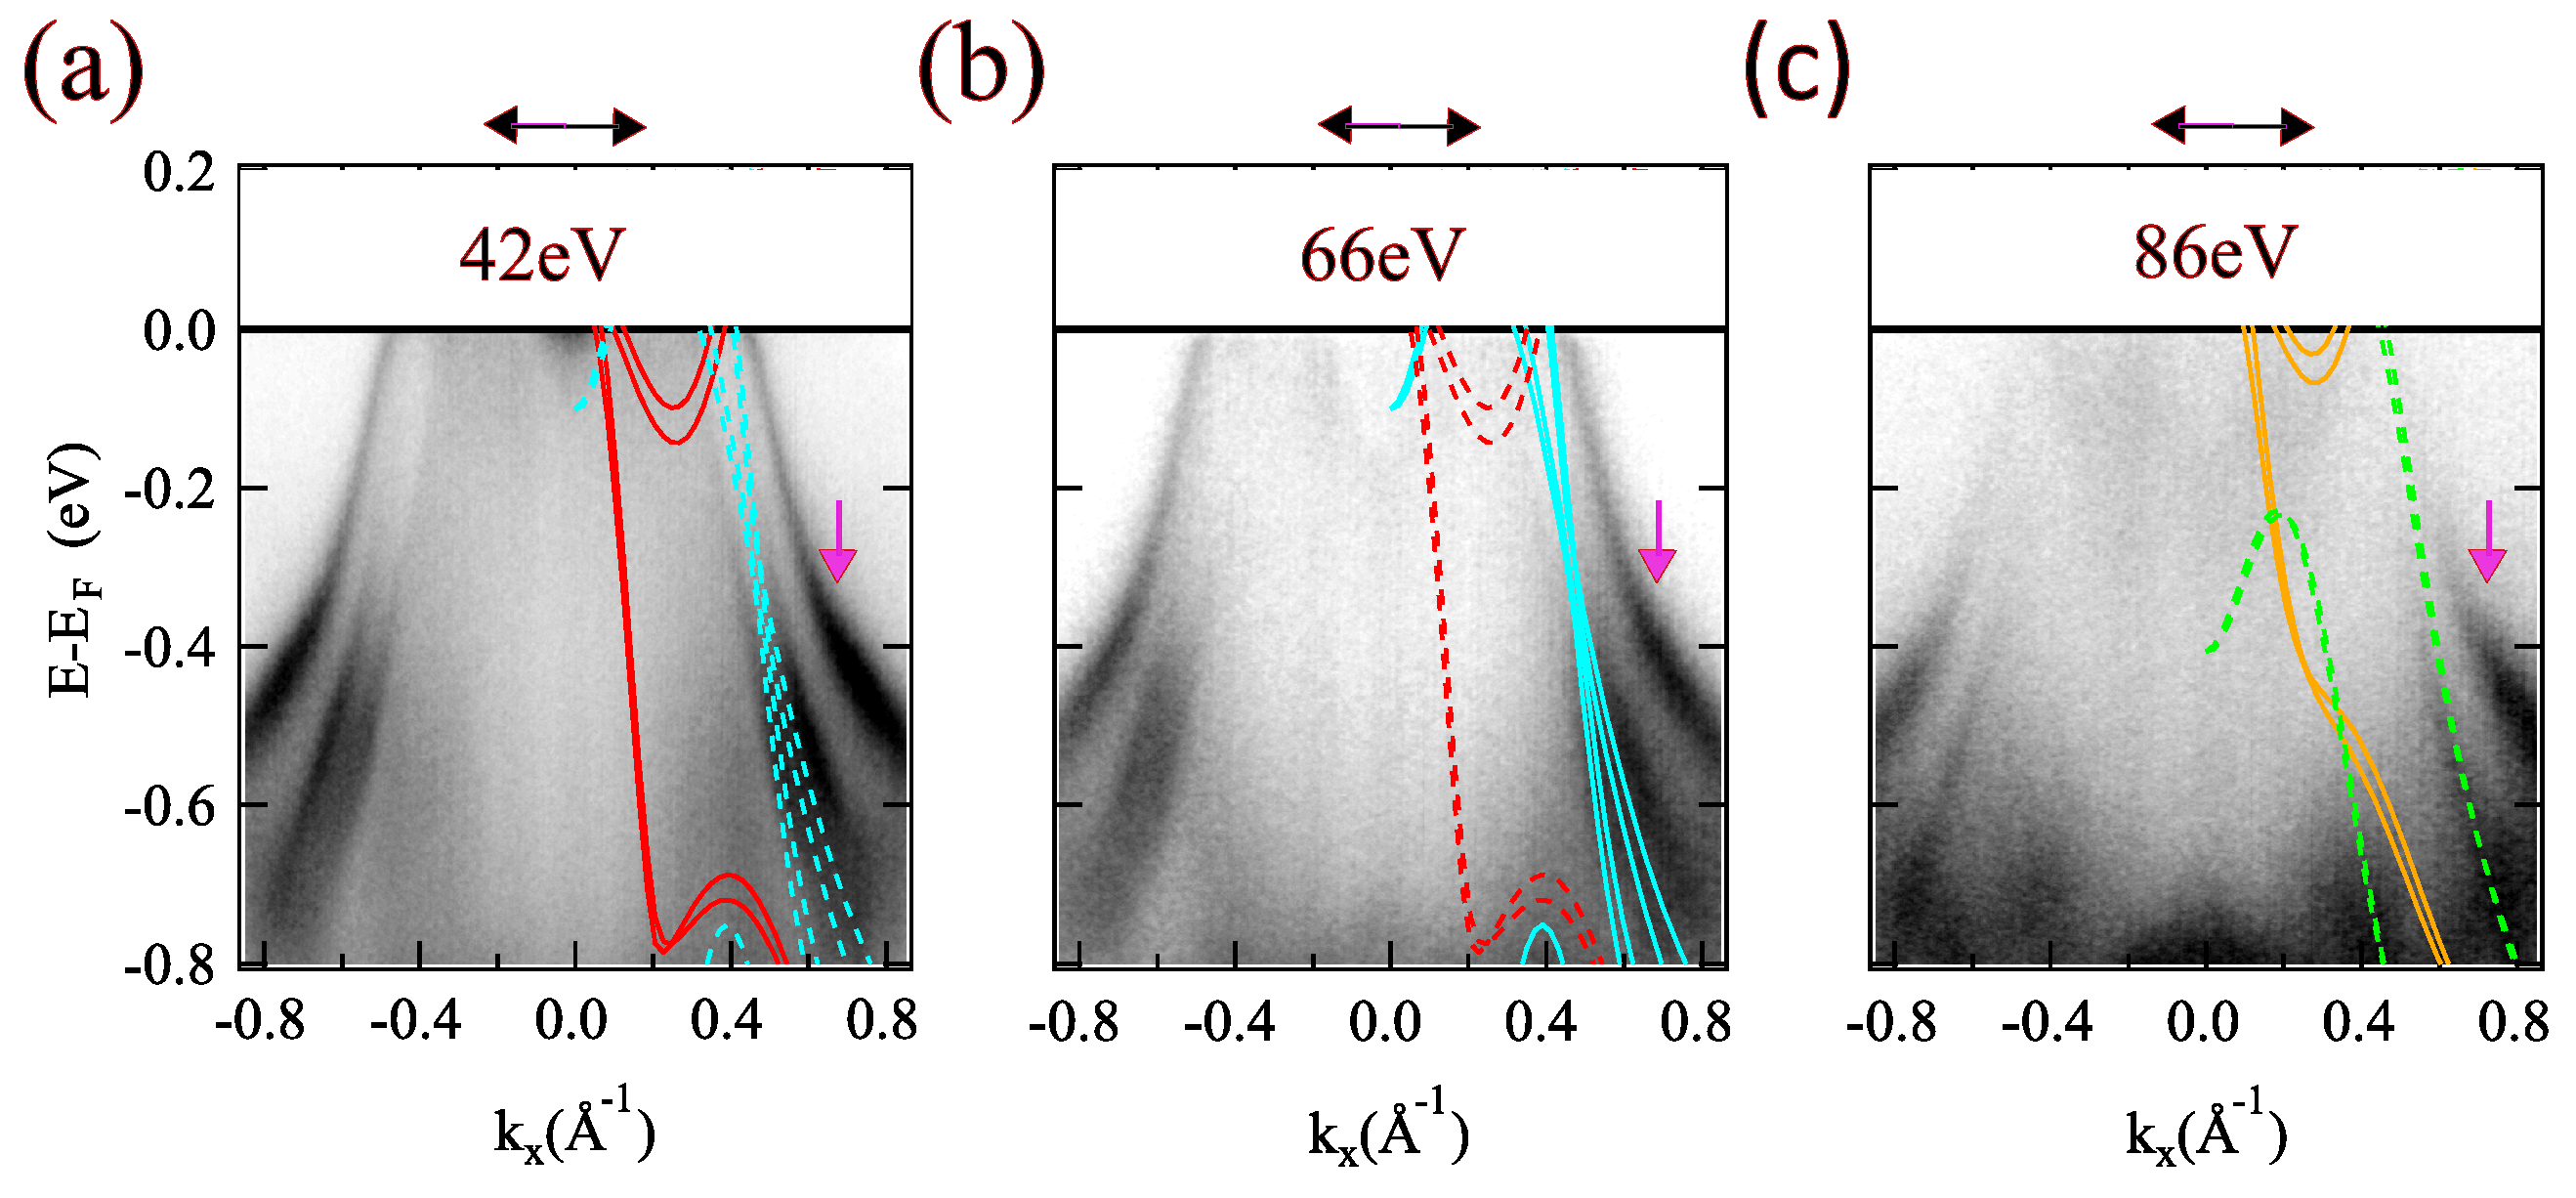
In Figure 5 we provide more details about the surface-like bands prominent for measurements with LH polarization. The dispersing bands closer to the zone center agree well with calculated bands. However, the additional band marked by the pink arrow differs substantially, especially at deeper binding energy. These extra features have a Fermi crossing around k | | = 0.44 Å, and the Fermi velocity is ≈2 eV · Å. At some photon energies, these surface bands have weak intensity at E F and stronger intensity at deeper binding energy (e.g., Figure 5c), while others show strong intensity at E F (e.g., Figure 5a,b), contributing to the sharp ’vertical’ features in Figure 4a.
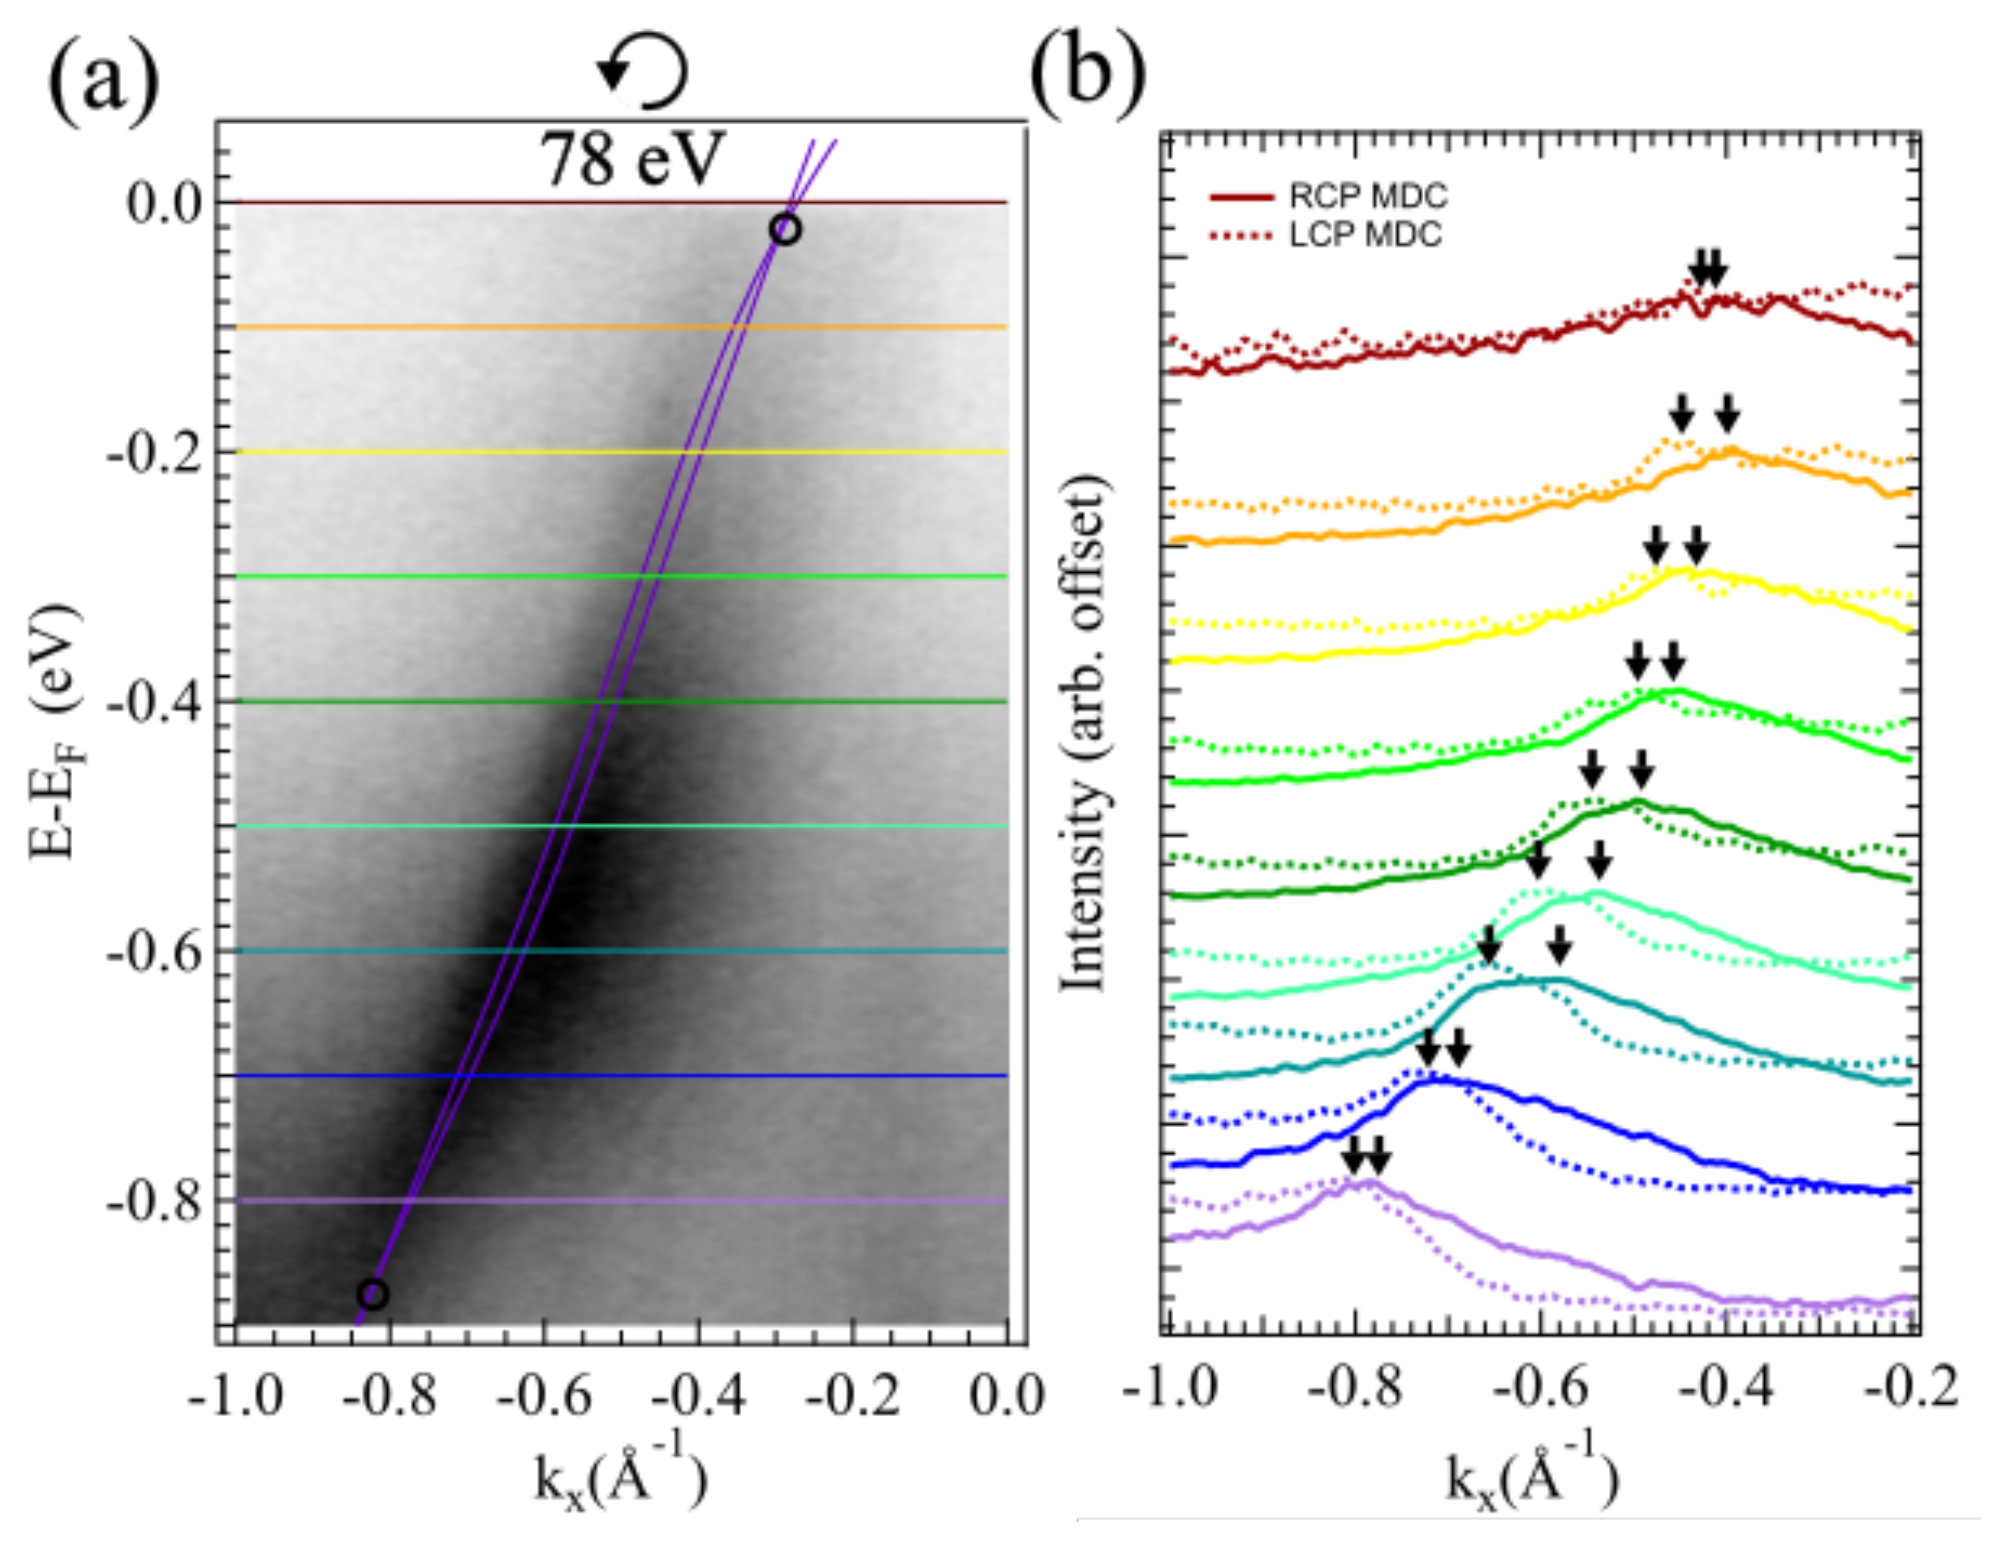
In the non-magnetic state where the present measurements are performed, calculations have predicted that CeCoGe3 is a topological metal, featuring multiple Weyl points and Weyl nodal lines throughout the BZ [4]. Figure 6 explores some support for these features, which are challenging to observe because the band splitting in the vicinity of the nodes tends to be small. Different momentum distribution curves (MDCs) are examined with LCP and RCP light, and the peak position is identified as the band position. Figure 6b shows the splitting and re-joining of bands between two predicted topological crossings, where each band is highlighted with a different polarization.

4. Discussion

The agreement between LDA+G in Ref. [4] and ARPES data is quite good throughout most of the BZ, as long as only weak hybridization with 4-f electrons is considered. This localized Ce- 4 f electron character is supported by the Ce 4 f 0 peak appearing at binding energies deeper than 2 eV as well as a relatively high intensity of 4 f 7 / 2 1 as compared to 4 f 5 / 2 1 [33]. The strongest indicator in the present data is the overall energy shift between calculations involving hybridized 4 f electrons (Ref. [4]) and measured band structure (Figure 3). This shift is well captured by performing calculations absent hybridized Ce electrons (Supplementary Materials and Ref. [10]). Weak hybridization between f electrons and conduction elections was also reported in studies on polycrystalline specimens [34]. The measured fermiology in Figure 4 is also qualitatively consistent with reported quantum oscillations measurements [9], except for the extra features from surface bands and reconstruction discussed below.
This compound is predicted to have topological band features in the non-magnetic state that are interesting in the context of this material’s moderate electronic correlations and tendency towards superconductivity under pressure. There is support for these nodal features via slight differences in dispersion for spectra taken with different polarization, in a manner that is consistent with predicted energy-dependent splitting and re-joining of bands (Figure 6). The example shown in that figure has a predicted Weyl crossing near E F , with relevance to low energy phenomena like transport and superconducting pairing. When evaluating which Weyl crossings are relevant to transport, the rigid shift between measured band structure and predictions in Ref. [4] needs to be considered.
The crystal structure of CeCoGe3 has two in-equivalent Ge positions [35], and it is thought that this compound cleaves with a Ge termination [10]. Both of these statements could be consistent with the two sets of Ge- 3 d doublets that are shown in Figure 2c, and the relative intensity of the two doublets as a function of photon energy helps disambiguate between these scenarios. When measured at around 90 eV photon energy (Figure 2d), the relative intensity of the higher-binding-energy doublet (doublet 1) is highest. Although the detailed energy dependence is influenced by the choice of background at low photon energy, the general photon energy dependence is robust. This energy is also near the value where the IMFP is minimum for Ge- 3 d electrons. Together this suggests, assuming the observation is primarily from initial-state effects, that the doublet at higher binding energy originates from the surface, and the relatively large (≈0.5 eV) chemical shift of the surface Ge species can be concomitant with the appearance of surface electronic states or surface structural reconstruction.
One new experimental feature in the present data is a surface state that appears around the corners of the BZ. This feature manifests as dispersionless states as a function of photon energy in Figure 4a and Figure 5, and these bands are extremely polarization dependent, being almost entirely absent with circularly polarized light, but very strong with LH light. We note that some LH spectra simultaneously show these surface states and reconstruction features from unit cell reconstruction (Figure 5b,c), indicating that they are not mutually exclusive. These surface states may be associated with topological band features, or they may be topologically trivial surface bands related to the strong surface effects exhibited by terminating Ge atoms (Figure 2).
The other new experimental observation is the additional band features shown in Figure 3 and Figure 4 which show strong similarity with bands that are half a BZ away in k z for most cuts where they are observed. These extra features are interpreted as originating from a reconstruction of the unit cell from some incipient order. The discussion below assumes a c-axis reconstruction because known magnetic orders in this material are along c [8,19,36]. The evidence for this ordering wavevector ( q = ( 0 , 0 , 1 / 2 ) ) in our data is (1) strong mixing of Γ -plane and Z-plane spectra, (2) the Γ Z ¯ / 2 periodicity of FS maps in Figure 4b, as well as (3) large discrepancies between calculation and experiment in the N P plane, where bands would cross and hybridize under a doubled unit cell. The presumed unit cell doubling has the same periodicity as the ground state bulk magnetic order [36]. One might argue that the highest-temperature magnetic order may be most relevant at the measurement temperature of 30K. Below T N 1 = 21 K , the magnetic ordering vector is q = ( 0 , 0 , 2 / 3 ) , and we do not fully rule out this ordering vector. The aspect of the data that more favors a q = ( 0 , 0 , 2 / 3 ) order is the observation that many of the FS maps outside of the Γ and Z planes in Figure 4c1–g3 show strong Z-plane features of a square inside of a diamond (c1, d1, e2). A q = ( 0 , 0 , 2 / 3 ) order would repeat Z-plane spectra more times along k z even before considering the effects of perpendicular momentum resolution. Perpendicular momentum uncertainty/broadening originates from a short IMFP, and this can both broaden spectra and oversample extremal momenta of a dispersing band [37,38]. In the present experiments, momentum uncertainty is estimated to be Δ k = 1 / IMFP 0.2   Å 1 , or ≈17% of the BZ height. This amount of perpendicular momentum broadening could partially convolve spectra comparatively nearby to each other in k z , such as those originating from a q = ( 0 , 0 , 2 / 3 ) reconstruction.
We propose that the folded bands originate from an additional reconstruction in the non-magnetic state due to bond distortion, charge disproportionation, or surface-stabilized magnetism, though our results do not directly distinguish between these proposals. This reconstruction may be primarily near the surface, as found in polar materials existing near magnetic phases [39,40]. The present measurements focus on photon energies where ARPES is extremely surface sensitive, with an IMFP varying by 10 % around 4 Å; information depth is typically considered to be 2–3× the IMFP. A surface reconstruction would dominate our surface-sensitive measurements but be imperceptible to bulk probes which have dominated existing literature. However, our data do not rule out a weak bulk incipient order, and if such features are found, particularly under pressure, it may be relevant for the superconducting mechanism, both as a candidate wavevector for interactions related to pairing and as an origin of a significantly different fermiology.

5. Conclusions

We have mapped out the electronic structure of CeCoGe3 over the entire 3D BZ in the non-magnetic state at 30 K. The measured electronic structure agrees in large part with band structure calculations. Two new features in the band structure—a surface state and folded bands tentatively attributed to a unit cell doubling stabilized by the surface—are also discussed.

Supplementary Materials

The following supporting information can be downloaded at: https://www.mdpi.com/article/10.3390/condmat11010008/s1, The Supplementary Materials contains extended theoretical and experimental data, as well as Refs. [41,42,43,44,45,46,47,48,49], Figure S1: “Fit results of Ge-3d core-level spectra with Linear and Shirley background.”; Figure S2: “Comparison of survey spectrum with and without Bi flux contamination”; Figure S3: “Comparison of LDA calculations with and without inclusion of hybridized Ce electrons”; Figure S4: “Cuts and overlays”; Figure S5: “Close up of the ‘x-shaped’ feature referenced in the main text”; Figure S6: “Out-of-plane constant energy maps at various binding energies”; Figure S7: “Circular Dichroism (CD)”; Figure S8: “Circular Dichroism for cuts showing strong reconstruction from band folding, two examples”.

Author Contributions

Conceptualization, I.V., V.T., V.I. and S.Y.S.; software, M.S.; Performing experiments, R.P., M.C., S.S. and J.B.; Sample synthesis, Z.S. and V.T.; Data analysis, R.P., M.C., M.S. and I.V.; Band structure calculations, V.I. and S.Y.S.; writing—original draft preparation, R.P., V.I., M.C. and I.V.; writing—review and editing, I.V., V.T., V.I. and R.P.; supervision, I.V., V.T. and S.Y.S.; funding acquisition, I.V., V.I., V.T. and S.Y.S. All authors have read and agreed to the published version of the manuscript.

Funding

This research was supported by Grant No. 2020067 from the United States–Israel Binational Science Foundation (BSF). M.C. acknowledges support by the National Science Foundation (US) Division of Materials Research Award. No. 2428464. Use of the Stanford Synchrotron Radiation Lightsource, SLAC National Accelerator Laboratory is supported by the U.S. Department of Energy, Office of Science, Office of Basic Energy Sciences under Contract No. DE-AC02-76SF00515. This research used resources of the Advanced Light Source, a U.S. Department of Energy Office of Science User Facility under Contract No. DE-AC02-05CH11231. VI acknowledges support from Virginia Tech startup funds. S.S acknowledges support from US DOE grant No. DE-SC0026106.

Data Availability Statement

The data that support the findings of this manuscript are openly available: https://doi.org/10.5281/zenodo.18645433.

Acknowledgments

The authors acknowledge helpful discussions with Jonathan Denlinger, Jamie Moya, and Ittai Sidilkover.

Conflicts of Interest

The authors declare no conflicts of interest.

References

  1. Sigrist, M. Introduction to unconventional superconductivity in non-centrosymmetric metals. AIP Conf. Proc. 2009, 1162, 55–96. [Google Scholar] [CrossRef]
  2. Smidman, M.; Salamon, M.B.; Yuan, H.Q.; Agterberg, D.F. Superconductivity and spin–orbit coupling in non-centrosymmetric materials: A review. Rep. Prog. Phys. 2017, 80, 036501. [Google Scholar] [CrossRef]
  3. Fischer, M.H.; Sigrist, M.; Agterberg, D.F.; Yanase, Y. Superconductivity and Local Inversion-Symmetry Breaking. Annu. Rev. Condens. Matter Phys. 2023, 14, 153–172. [Google Scholar] [CrossRef]
  4. Ivanov, V.; Wan, X.; Savrasov, S.Y. Renormalized quasiparticles, topological monopoles, and superconducting line nodes in heavy-fermion CeTX3 compounds. Phys. Rev. B 2021, 103, L041112. [Google Scholar] [CrossRef]
  5. Weng, Z.F.; Smidman, M.; Jiao, L.; Lu, X.; Yuan, H.Q. Multiple quantum phase transitions and superconductivity in Ce-based heavy fermions. Rep. Prog. Phys. 2016, 79, 094503. [Google Scholar] [CrossRef] [PubMed]
  6. Rai, B.K.; O’Rourke, P.; Roy, U.N. Review on crystal structures and magnetic properties of RTX3 materials. J. Physics Condens. Matter 2022, 34, 273002. [Google Scholar] [CrossRef]
  7. Eom, D.; Ishikawa, M.; Kitagawa, J.; Takeda, N. Suppression of Antiferromagnetism by Kondo Effect and Quantum Critical Behavior in CeCoGe3-xSix ( 0≤x≤ 3). J. Phys. Soc. Jpn. 1998, 67, 2495–2500. [Google Scholar] [CrossRef]
  8. Pecharsky, V.K.; Hyun, O.B.; Gschneidner, K.A. Unusual magnetic properties of the heavy-fermion compound CeCoGe3. Phys. Rev. B 1993, 47, 11839–11847. [Google Scholar] [CrossRef]
  9. Thamizhavel, A.; Shishido, H.; Okuda, Y.; Harima, H.; D. Matsuda, T.; Haga, Y.; Settai, R.; Ōnuki, Y. Fermi Surface Property of CeCoGe3 and LaCoGe3 without Inversion Symmetry in the Tetragonal Crystal Structure. J. Phys. Soc. Jpn. 2006, 75, 044711. [Google Scholar] [CrossRef]
  10. Li, P.; Ye, H.; Hu, Y.; Fang, Y.; Xiao, Z.; Wu, Z.; Shan, Z.; Singh, R.P.; Balakrishnan, G.; Shen, D.; et al. Photoemission signature of the competition between magnetic order and Kondo effect in CeCoGe3. Phys. Rev. B 2023, 107, L201104. [Google Scholar] [CrossRef]
  11. Furuhashi, T.; Hozawa, K.; Kozuka, Y.; Tsujimoto, Y.; Yamaura, K.; Fujioka, J. Doping-induced variation of anomalous Hall effect in the magnetic Weyl-Kondo metal candidate CeCo1-xFexGe3. Phys. Rev. B 2025, 112, 245116. [Google Scholar] [CrossRef]
  12. Moya, J.M.; Voyemant, A.; Chatterjee, S.; Lee, S.B.; Skorupskii, G.; Pollak, C.J.; Schoop, L.M. Measuring the Hall effect in hysteretic materials. arXiv 2025, arXiv:2512.19427. [Google Scholar] [CrossRef]
  13. Shen, Z.; Borkowski, L.A.; Menon, A.; Austin, A.; Klavins, P.; Savrasov, S.; Taufour, V. Giant field induced unconventional anomalous Hall conductivity in the noncentrosymmetric Weyl metal CeCoGe3. Phys. Rev. B 2026, 113, L081107. [Google Scholar] [CrossRef]
  14. Settai, R.; Sugitani, I.; Okuda, Y.; Thamizhavel, A.; Nakashima, M.; Ōnuki, Y.; Harima, H. Pressure-induced superconductivity in CeCoGe3 without inversion symmetry. J. Magn. Magn. Mater. 2007, 310, 844–846. [Google Scholar] [CrossRef]
  15. Skokowski, P.; Synoradzki, K.; Toliński, T. Comprehensive studies of the transformation between antiferromagnetic CeCoGe3 and heavy fermion CeFeGe3 compounds. J. Alloy. Compd. 2019, 810, 151850. [Google Scholar] [CrossRef]
  16. Kimura, N.; Ito, K.; Aoki, H.; Uji, S.; Terashima, T. Extremely High Upper Critical Magnetic Field of the Noncentrosymmetric Heavy Fermion Superconductor CeRhSi3. Phys. Rev. Lett. 2007, 98, 197001. [Google Scholar] [CrossRef]
  17. Méasson, M.A.; Muranaka, H.; Matsuda, T.; Kawai, T.; Haga, Y.; Knebel, G.; Aoki, D.; Lapertot, G.; Honda, F.; Settai, R.; et al. Huge upper critical field in the superconductor with non-centrosymmetric crystal structure CeCoGe3. Phys. C Supercond. Appl. 2010, 470, S536–S538. [Google Scholar] [CrossRef]
  18. Kawai, T.; Muranaka, H.; Measson, M.A.; Shimoda, T.; Doi, Y.; D. Matsuda, T.; Haga, Y.; Knebel, G.; Lapertot, G.; Aoki, D.; et al. Magnetic and Superconducting Properties of CeTX3 (T: Transition Metal and X: Si and Ge) with Non-centrosymmetric Crystal Structure. J. Phys. Soc. Jpn. 2008, 77, 064716. [Google Scholar] [CrossRef]
  19. Thamizhavel, A.; Takeuchi, T.; D Matsuda, T.; Haga, Y.; Sugiyama, K.; Settai, R.; Ōnuki, Y. Unique Magnetic Phases in an Antiferromagnet CeCoGe3. J. Phys. Soc. Jpn. 2005, 74, 1858–1864. [Google Scholar] [CrossRef]
  20. Canfield, P.C.; Fisk, Z. Growth of single crystals from metallic fluxes. Philos. Mag. B 1992, 65, 1117–1123. [Google Scholar] [CrossRef]
  21. Ribeiro, R.A.; Canfield, P.C. Solution Growth of Intermetallic Single Crystals. In Fundamentals of Quantum Materials; World Scientific: Singapore, 2021; pp. 49–66. [Google Scholar] [CrossRef]
  22. Canfield, P.C.; Kong, T.; Kaluarachchi, U.S.; Jo, N.H. Use of frit-disc crucibles for routine and exploratory solution growth of single crystalline samples. Philos. Mag. 2016, 96, 84–92. [Google Scholar] [CrossRef]
  23. Canfield, P.C.; Slade, T.J. Use of Frit-Disc Crucible Sets to Make Solution Growth More Quantitative and Versatile. Z. FüR Anorg. Und Allg. Chem. 2025, 651, e202500007. [Google Scholar] [CrossRef]
  24. Savrasov, S.Y. Linear-response theory and lattice dynamics: A muffin-tin-orbital approach. Phys. Rev. B 1996, 54, 16470–16486. [Google Scholar] [CrossRef] [PubMed]
  25. Ho, K.M.; Schmalian, J.; Wang, C.Z. Gutzwiller density functional theory for correlated electron systems. Phys. Rev. B 2008, 77, 073101. [Google Scholar] [CrossRef]
  26. Dong, R.; Wan, X.; Dai, X.; Savrasov, S.Y. Orbital-dependent electronic masses in Ce heavy-fermion materials studied via Gutzwiller density-functional theory. Phys. Rev. B 2014, 89, 165122. [Google Scholar] [CrossRef]
  27. Ivanov, V.; Savrasov, S.Y. Monopole mining method for high-throughput screening for Weyl semimetals. Phys. Rev. B 2019, 99, 125124. [Google Scholar] [CrossRef]
  28. Smekal, W.; Werner, W.; Powell, C.J. Simulation of Electron Spectra for Surface Analysis (SESSA): A Novel Software Tool for Quantitative Auger-electron Spectroscopy and X-ray Photoelectron Spectroscopy. Surf. Interface Anal. 2005, 37, 1059–1067. [Google Scholar] [CrossRef]
  29. Gries, W.H. A Universal Predictive Equation for the Inelastic Mean Free Pathlengths of X-ray Photoelectrons and Auger Electrons. Surf. Interface Anal. 1996, 24, 38–50. [Google Scholar] [CrossRef]
  30. MURTY, R.C. Effective Atomic Numbers of Heterogeneous Materials. Nature 1965, 207, 398–399. [Google Scholar] [CrossRef]
  31. Tanuma, S.; Powell, C.J.; Penn, D.R. Calculation of electron inelastic mean free paths (IMFPs) VII. Reliability of the TPP-2M IMFP predictive equation. Surf. Interface Anal. 2003, 35, 268–275. [Google Scholar] [CrossRef]
  32. Damascelli, A. Probing the Electronic Structure of Complex Systems by ARPES. Phys. Scr. 2004, T109, 61. [Google Scholar] [CrossRef]
  33. Chen, Q.Y.; Feng, W.; Xie, D.H.; Lai, X.C.; Zhu, X.G.; Huang, L. Localized to itinerant transition of f electrons in ordered Ce films on W(110). Phys. Rev. B 2018, 97, 155155. [Google Scholar] [CrossRef]
  34. Skokowski, P.; Synoradzki, K.; Werwiński, M.; Bajorek, A.; Chełkowska, G.; Toliński, T. Electronic structure of CeCo1Fe Ge3 studied by Xray photoelectron spectroscopy and first-principles calculations. J. Alloy. Compd. 2019, 787, 744–750. [Google Scholar] [CrossRef]
  35. Rogalev, A.; Wilhelm, F.; Ovchinnikova, E.; Enikeev, A.; Bakonin, R.; Kozlovskaya, K.; Oreshko, A.; Aoki, D.; Dmitrienko, V.E. Anisotropy of X-ray Absorption Cross Section in CeCoGe3 Single Crystal. Crystals 2021, 11, 544. [Google Scholar] [CrossRef]
  36. Smidman, M.; Adroja, D.T.; Hillier, A.D.; Chapon, L.C.; Taylor, J.W.; Anand, V.K.; Singh, R.P.; Lees, M.R.; Goremychkin, E.A.; Koza, M.M.; et al. Neutron scattering and muon spin relaxation measurements of the noncentrosymmetric antiferromagnet CeCoGe3. Phys. Rev. B 2013, 88, 134416. [Google Scholar] [CrossRef]
  37. Bansil, A.; Lindroos, M.; Sahrakorpi, S.; Markiewicz, R.S. Influence of the third dimension of quasi-two-dimensional cuprate superconductors on angle-resolved photoemission spectra. Phys. Rev. B 2005, 71, 012503. [Google Scholar] [CrossRef][Green Version]
  38. Strocov, V. Intrinsic accuracy in 3-dimensional photoemission band mapping. J. Electron Spectrosc. Relat. Phenom. 2003, 130, 65–78. [Google Scholar] [CrossRef]
  39. Chikina, A.; Höppner, M.; Seiro, S.; Kummer, K.; Danzenbächer, S.; Patil, S.; Generalov, A.; Güttler, M.; Kucherenko, Y.; Chulkov, E.V.; et al. Strong ferromagnetism at the surface of an antiferromagnet caused by buried magnetic moments. Nat. Commun. 2014, 5, 3171. [Google Scholar] [CrossRef]
  40. Mazzola, F.; Sunko, V.; Khim, S.; Rosner, H.; Kushwaha, P.; Clark, O.J.; Bawden, L.; Marković, I.; Kim, T.K.; Hoesch, M.; et al. Itinerant ferromagnetism of the Pd-terminated polar surface of PdCoO2. Proc. Natl. Acad. Sci. USA 2018, 115, 12956–12960. [Google Scholar] [CrossRef]
  41. Pulkkinen, A.; Kremer, G.; Strocov, V.N.; Weber, F.; Minár, J.; Monney, C. Revealing electronic correlations in YNi2B2C using photoemission spectroscopy. Commun. Phys. 2025, 8, 256. [Google Scholar] [CrossRef]
  42. Sidilkover, I.; Yen, Y.; D’Souza, S.W.; Schusser, J.; Pulkkinen, A.; Rotundu, C.R.; Hashimoto, M.; Liu, D.; Shen, Z.X.; Minár, J.; et al. Reexamining circular dichroism in photoemission from a topological insulator. Phys. Rev. Res. 2025, 7, 033027. [Google Scholar] [CrossRef]
  43. Ryu, H.; Song, I.; Kim, B.; Cho, S.; Soltani, S.; Kim, T.; Hoesch, M.; Kim, C.H.; Kim, C. Photon energy dependent circular dichroism in angle-resolved photoemission from Au(111) surface states. Phys. Rev. B 2017, 95, 115144. [Google Scholar] [CrossRef]
  44. Zabolotnyy, V.B.; Borisenko, S.V.; Kordyuk, A.A.; Inosov, D.S.; Koitzsch, A.; Geck, J.; Fink, J.; Knupfer, M.; Büchner, B.; Drechsler, S.L.; et al. Disentangling surface and bulk photoemission using circularly polarized light. Phys. Rev. B 2007, 76, 024502. [Google Scholar] [CrossRef]
  45. Seong, S.; Kim, H.; Kim, K.; Min, B.I.; Kwon, Y.S.; Han, S.W.; Park, B.G.; Stania, R.; Seo, Y.; Kang, J.S. Angle-resolved photoemission spectroscopy study of a system with a double charge density wave transition: ErTe3. Phys. Rev. B 2021, 104, 195153. [Google Scholar] [CrossRef]
  46. Cho, S.; Park, J.H.; Huh, S.; Hong, J.; Kyung, W.; Park, B.G.; Denlinger, J.D.; Shim, J.H.; Kim, C.; Park, S.R. Studying local Berry curvature in 2H-WSe2 by circular dichroism photoemission utilizing crystal mirror plane. Sci. Rep. 2021, 11, 1684. [Google Scholar] [CrossRef]
  47. Schüler, M.; De Giovannini, U.; Hübener, H.; Rubio, A.; Sentef, M.A.; Werner, P. Local Berry curvature signatures in dichroic angle-resolved photoelectron spectroscopy from two-dimensional materials. Sci. Adv. 2020, 6, eaay2730. [Google Scholar] [CrossRef] [PubMed]
  48. Min, C.H.; Bentmann, H.; Neu, J.N.; Eck, P.; Moser, S.; Figgemeier, T.; Ünzelmann, M.; Kissner, K.; Lutz, P.; Koch, R.J.; et al. Orbital Fingerprint of Topological Fermi Arcs in the Weyl Semimetal TaP. Phys. Rev. Lett. 2019, 122, 116402. [Google Scholar] [CrossRef] [PubMed]
  49. Ünzelmann, M.; Bentmann, H.; Figgemeier, T.; Eck, P.; Neu, J.N.; Geldiyev, B.; Diekmann, F.; Rohlf, S.; Buck, J.; Hoesch, M.; et al. Momentum-space signatures of Berry flux monopoles in the Weyl semimetal TaAs. Nat. Commun. 2021, 12, 3650. [Google Scholar] [CrossRef]
Figure 1. CeCoGe3 (a) crystal structure (conventional unit cell). Ce (yellow), Co (black), and Ge (gray) atoms are labeled on right. Arrows indicate primitive lattice vectors. (b) Brillouin zone with high-symmetry points labeled. Colored planes indicate the momentum regions where calculations and ARPES spectra focus.
Condensedmatter 11 00008 g001
Figure 2. Core level spectroscopy. (a) Core level survey. (b) Momentum-integrated valence band and localized contributions from the Ce- 4 f derived states. Inset shows original energy vs. momentum cut, together with integration window. Panels (a,b) taken at 125 eV. (c) Ge- 3 d level taken at 140 eV, together with fitting to two doublets. Dashed line is residual of fit. (d) Photon energy dependence of intensity ratio of two fitted doublets. (e) Calculated IMFP as a function of photon energy for Ge 3 d 1 / 2 and 3 d 3 / 2 (left axis) as well as valence electrons (right axis).
Condensedmatter 11 00008 g002
Figure 3. Cuts parallel to Γ Σ at different k z . (ae) Energy vs. momentum cuts at photon energies indicated in each panel. Spectra collected with RCP+LCP light at photon energies indicated. Pink vertical arrows point to ‘x−shaped’ feature and horizontal pink arrow points to dispersing feature not directly captured in calculation. (fj) LDA+G calculations from Ref. [4] corresponding to each data panel above. Calculations have been shifted to lower binding energy (towards E F ) by 180 meV for better agreement with data. Vertical dashed lines denote high-symmetry points in (f,h,j), and the edge of the BZ at that value of k z otherwise. Right half of panels (f,g,i,j) shows overlay of calculation from half a BZ away along k z , with the color of these dashed lines corresponding to legend labels below. Color bar below panel (e) applies to all ARPES image plots in the manuscript.
Condensedmatter 11 00008 g003
Figure 4. Constant energy maps at E F . (a) Fermi surface map in Γ X Z plane taken with LH light in photon energy range 26–118 eV. Black dots mark high symmetry points. Solid and dashed lines correspond to locations of maps in panels (c1g3), following color convention from Figure 1b. Blue curves are calculated Fermi surface in Γ X Z plane. Pink arrow marks surface band. (b) Fermi surface map in same momentum space region as (a) but taken with LCP+RCP light. k | | label on x -axis denotes momentum parallel to sample surface, which for panels (a,b) is along the Γ X line. (c1g3) Constant energy maps in k x k y plane, taken with LH light. Data taken at selected photon energies, indicated above each panel, in order to closely match to the following planes along Γ Z ¯ : Γ plane, k z = 0.25 Γ Z ¯ , 0.5 Γ Z ¯ , 0.75 Γ Z ¯ , and the Z plane. Column 1 is taken at lower photon energies (solid lines in (a)). Second column is taken at higher photon energy (dashed lines in (a)), but closely matching locations in BZ. Third column is calculated Fermi surfaces for the k z values probed by data. Panels (c1c3,e1e3,g1g3) mark X, P, and Y 1 high-symmetry points.
Condensedmatter 11 00008 g004
Figure 5. Surface−like features in CeCoGe3. All cuts are taken parallel to Γ Σ at different photon energies with LH polarization. Calculations are shown in measured plane (solid) and half a BZ away in k z (dashed). Pink arrow marks one instance of this surface band in each panel. (a) 42 eV (b) 66 eV (near Z plane) (c) 86 eV.
Condensedmatter 11 00008 g005
Figure 6. Support for nodal lines. (a), spectra taken from the N P plane ( k z = 0.5 Γ Z ¯ ) with LCP light at 78 eV. Purple: overlay of calculated bands with black circles indicating the crossing point which forms the nodal lines. (b) MDCs at energies indicated in (a) collected with RCP (solid) and LCP (dashed) light. Arrows are guide−to−eye for MDC peak positions.
Condensedmatter 11 00008 g006
Disclaimer/Publisher’s Note: The statements, opinions and data contained in all publications are solely those of the individual author(s) and contributor(s) and not of MDPI and/or the editor(s). MDPI and/or the editor(s) disclaim responsibility for any injury to people or property resulting from any ideas, methods, instructions or products referred to in the content.