Article

Impact of Overdeposition on Magnetic Behavior in Ferromagnetic Nanowire Arrays

by
Oleksandr Pastukh
Institute of Nuclear Physics Polish Academy of Sciences, PL-31342 Krakow, Poland
Condens. Matter 2025, 10(4), 57; https://doi.org/10.3390/condmat10040057
Submission received: 23 September 2025 / Revised: 7 November 2025 / Accepted: 9 November 2025 / Published: 12 November 2025

Abstract

Owing to their dimensions and high aspect ratio, magnetic nanowires possess distinctive physical and chemical properties and are of great importance in building nanoelectronics devices. Nanowires are traditionally produced by electrochemical deposition methods using alumina or polycarbonate membranes, and their parameters (porosity, size, and arrangement of pores) strongly influence the magnetic properties of nanowires. However, very often, the effect that cannot be neglected during synthesis is overdeposition. The influence of overdeposition on the magnetic properties of nanowires is often overlooked, but it can strongly alter the magnetic behavior of the system. In this study, we use micromagnetic simulations to investigate how different levels of overdeposition affect the hysteretic behavior of nanowires and their magnetization switching mechanism. It was shown that the formation of hemispherical caps on the ends of the nanowires may alter the out-of-plane magnetic anisotropy of the nanowires and strongly influence the squareness of the hysteresis loop. The demagnetizing field distribution for nanowires with overdeposition was also investigated, showing a strong influence of its spatial distribution change on the reversal mechanism and interaction between nanowires. The obtained results were compared to existing experimental observations, showing good agreement with the magnetic behavior of the system. Performed research can be of great interest to experimental groups, as it highlights the importance of controlling overdeposition during nanowire synthesis and its potential influence on magnetic performance.

1. Introduction

Magnetic nanowire (NW) arrays have attracted considerable attention because of their unique combination of properties, which distinguish them from other nanostructured materials, including high aspect ratio, large surface area, and tunable magnetic properties [1,2,3]. These features make NW arrays promising candidates for a broad range of applications in nanotechnology, including high-density magnetic storage [4,5], spintronic devices [6], magnetic sensors [7], and biomedical technologies such as targeted drug delivery and hyperthermia treatment [8]. Among different approaches developed for fabricating NW arrays, the template-assisted electrodeposition remains the most widely employed. This approach enables precise control over nanowire geometry and their distribution through the use of anodic aluminum oxide (AAO) and polycarbonate (PC) membranes, being the two most common types [9,10,11]. While AAO templates provide highly ordered arrays with narrow pore size distributions, PC membranes are advantageous due to their commercial availability, ease of handling, and tunable pore parameters.
The magnetic properties of nanowires are influenced by different factors, including more significant ones, like chemical composition, geometry (i.e., aspect ratio), and interwire spacing (which affects dipolar interactions), as well as lesser ones like point and line defects or surface roughness [12]. However, the additional parameter that is often overlooked but may directly influence the magnetic behavior of the system is overdeposition (OD)—the growth of the nanowire beyond the membrane surface during electrodeposition. As literature studies show, overdeposition is difficult to control and, even under optimized conditions, cannot be completely avoided. For example, Rousse et al. investigated the growth of Ni–Fe alloyed nanowires in polycarbonate membranes and demonstrated that precise control of the deposition current is essential; a sudden increase in cathodic current promotes the formation of hemispherical caps on top of the nanowires [13]. Similarly, as Schonenberger et al. showed for Ni nanowires, even under strictly constant deposition rates, a sharp transition to three-dimensional bulk growth above the membrane surface can occur during electrodeposition [14]. Ersching et al. attributed such effects in FeNi nanowires to differences in pore filling rates, which result in inhomogeneous nanowire growth across the membrane [15]. Furthermore, side reactions such as hydrogen evolution may hinder uniform pore filling and thus promote external nanowire growth, as demonstrated by Ilavona et al. [16].
Overdeposition can have a direct impact on the magnetic behavior of nanowire arrays, as it effectively transforms the system from one-dimensional objects into a three-dimensional magnetic structure. Even at the level of individual nanowires, morphological changes at the wire ends can strongly affect the internal magnetization processes. For instance, the formation of magnetic end textures modifies the local demagnetizing field distribution [17], or can act as a local modulation of the wire diameter, thereby altering the magnetization reversal mechanism (e.g., the nucleation of vortices, the pinning or displacement of domain walls) [18]. Moreover, if the overdeposition becomes more pronounced and leads to the physical connection of neighboring wires, it may influence the effective shape anisotropy of the system, e.g., favoring an in-plane orientation of the magnetic easy axis rather than the axial alignment of nanowires [11]. The resulting interwire connections can change the collective magnetic response of the array, which may influence the coercivity and remanence, or bring on a modification of the hysteresis loop shape [19]. Understanding how this phenomenon influences the collective magnetic behavior of nanowire arrays is therefore essential for their reliable design and applications.
Micromagnetic simulations have proven to be a powerful tool for investigating the magnetic properties of both individual nanowires and nanowire arrays [20,21]. Therefore, in this work, we employ the micromagnetic approach to study the influence of overdeposition on the magnetic behavior of nanowires. Both isolated nanowires and arrays are considered, with regular and modified geometry to account for the presence of overdeposition. The analysis focuses on calculated magnetization curves for different orientations of the applied magnetic field relative to the nanowire axis. In addition, the magnetization reversal mechanisms and the distribution of the demagnetizing field are examined, providing a deeper understanding of the changes in magnetic behavior induced by overdeposition.

2. Magnetic Nanowires Modelling

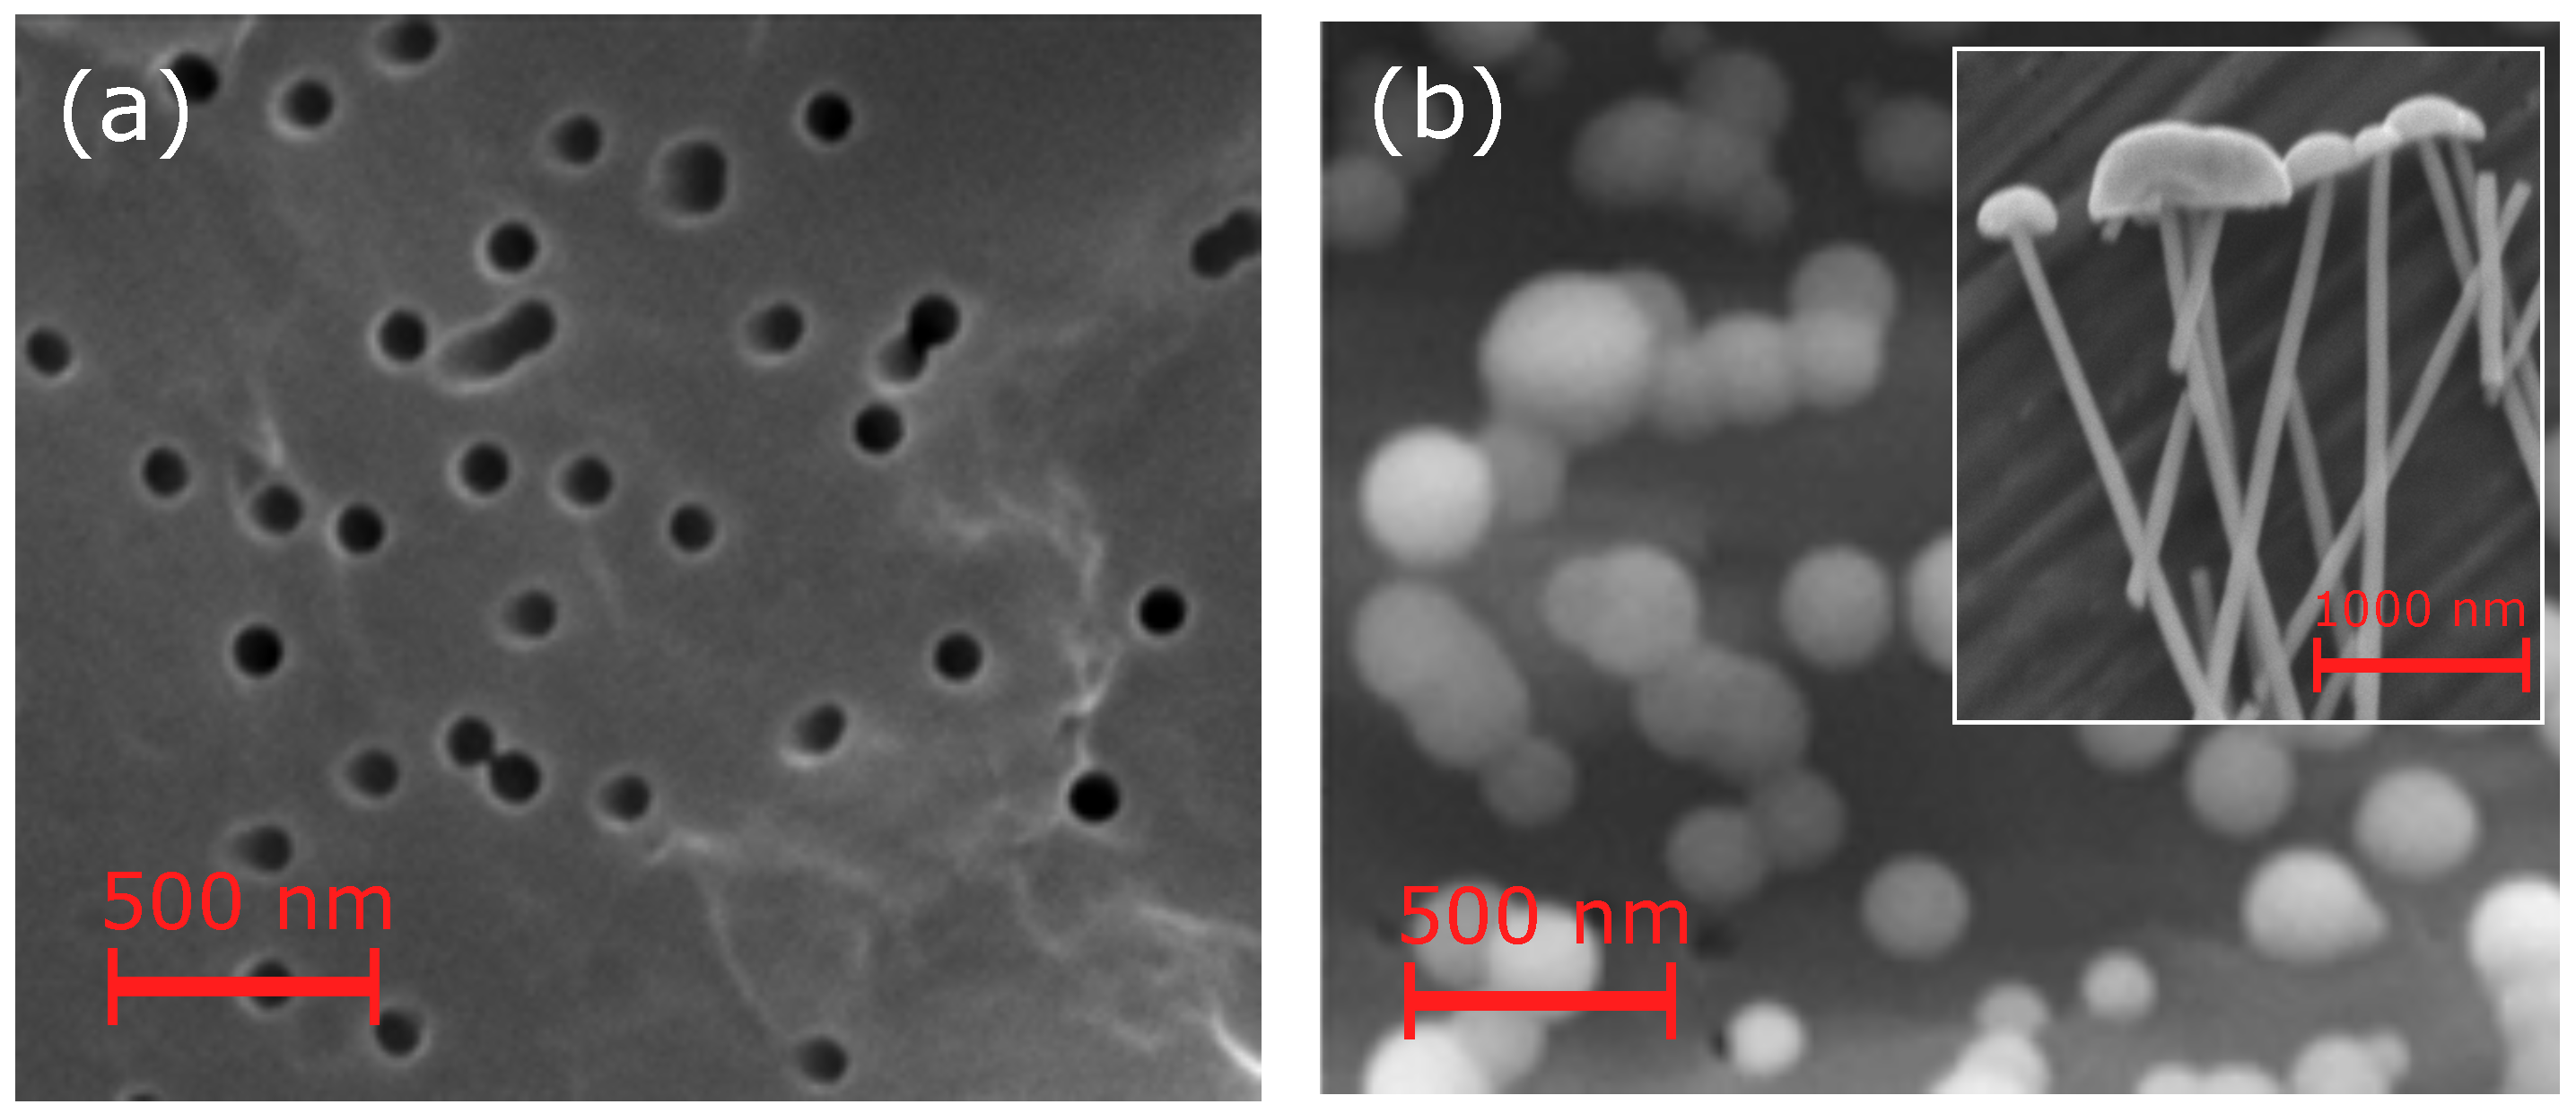
In this study, we will focus on the nanowire array with an arrangement that corresponds to the polycarbonate membrane, as shown in Figure 1a. PC membranes are characterized by several key parameters, including pore diameter, their distribution, thickness, and porosity, which defines the interwire distance. The latter parameter, in turn, governs the strength of dipolar interactions between neighboring nanowires. In general, PC membranes exhibit relatively low porosity compared with anodic aluminum oxide matrices; therefore, interwire interactions in this case are typically weak. However, aiming to include such a factor into our study (as it may become important considering the overdeposition effect on the magnetic properties in the NW array), we model nanowires with a diameter of 100 nm, for which the magnetostatic interactions are not negligible [22,23]. The nanowire length was set to 1 µm, yielding an aspect ratio of 10. This geometry ensures a dominant shape anisotropy, as is the case in experimental nanowires [12].
To model the nanowire structure under overdeposition, the experimental observations were followed. According to the literature, hemispherical caps form on top of nanowires during the overdeposition process [11,15,24]. This morphology is confirmed by the SEM image as seen in Figure 1b (top view) and the inset of Figure 1b (lateral view). The corresponding geometry was modeled using the finite-difference method implemented in Mumax3 software [25] (see Figure 2). The diameter of the hemispherical cap (defined as the diameter of the base plane) was set to d c a p = 200 nm, twice the nanowire diameter. In arrays, such nanowires remain well separated and do not form direct contact with each other, as seen from Figure 2b. However, as literature reports, an extended electrodeposition process can lead to further growth of the overdeposited caps and their eventual coalescence on the membrane surface [14]. To simulate this effect, an additional structure was considered with an increased hemispherical cap diameter of d c a p = 400 nm, resulting in a partial connection between adjacent nanowires (Figure 2c).
The magnetic behavior of the nanowire arrays was investigated using the Mumax3 micromagnetic simulation package, which numerically solves the Landau–Lifshitz–Gilbert (LLG) equation for the time evolution of the magnetization [25]. Hysteresis loops were computed by minimizing the total magnetic energy, accounting for exchange, magnetostatic, and Zeeman contributions. For the simulations, standard material parameters of permalloy were used: saturation magnetization M s = 8.0 × 10⁵ A/m, exchange stiffness A e x c h = 1.3 × 10⁻¹¹ J/m, and Gilbert damping constant α = 0.01, in agreement with values reported in the literature [26]. The computational geometry was discretized into cells of 5 × 5 × 5 nm3.

3. Results and Discussion

3.1. Individual Nanowire

On the first step of the study, the magnetic behavior of an individual nanowire was considered. To investigate how the overdeposition may affect the magnetic properties of such a nanowire, the calculation of the hysteresis loop was done for the external field applied along the long axis of the nanowire (i.e., along the z-axis (Bext = Bz z ^ ).
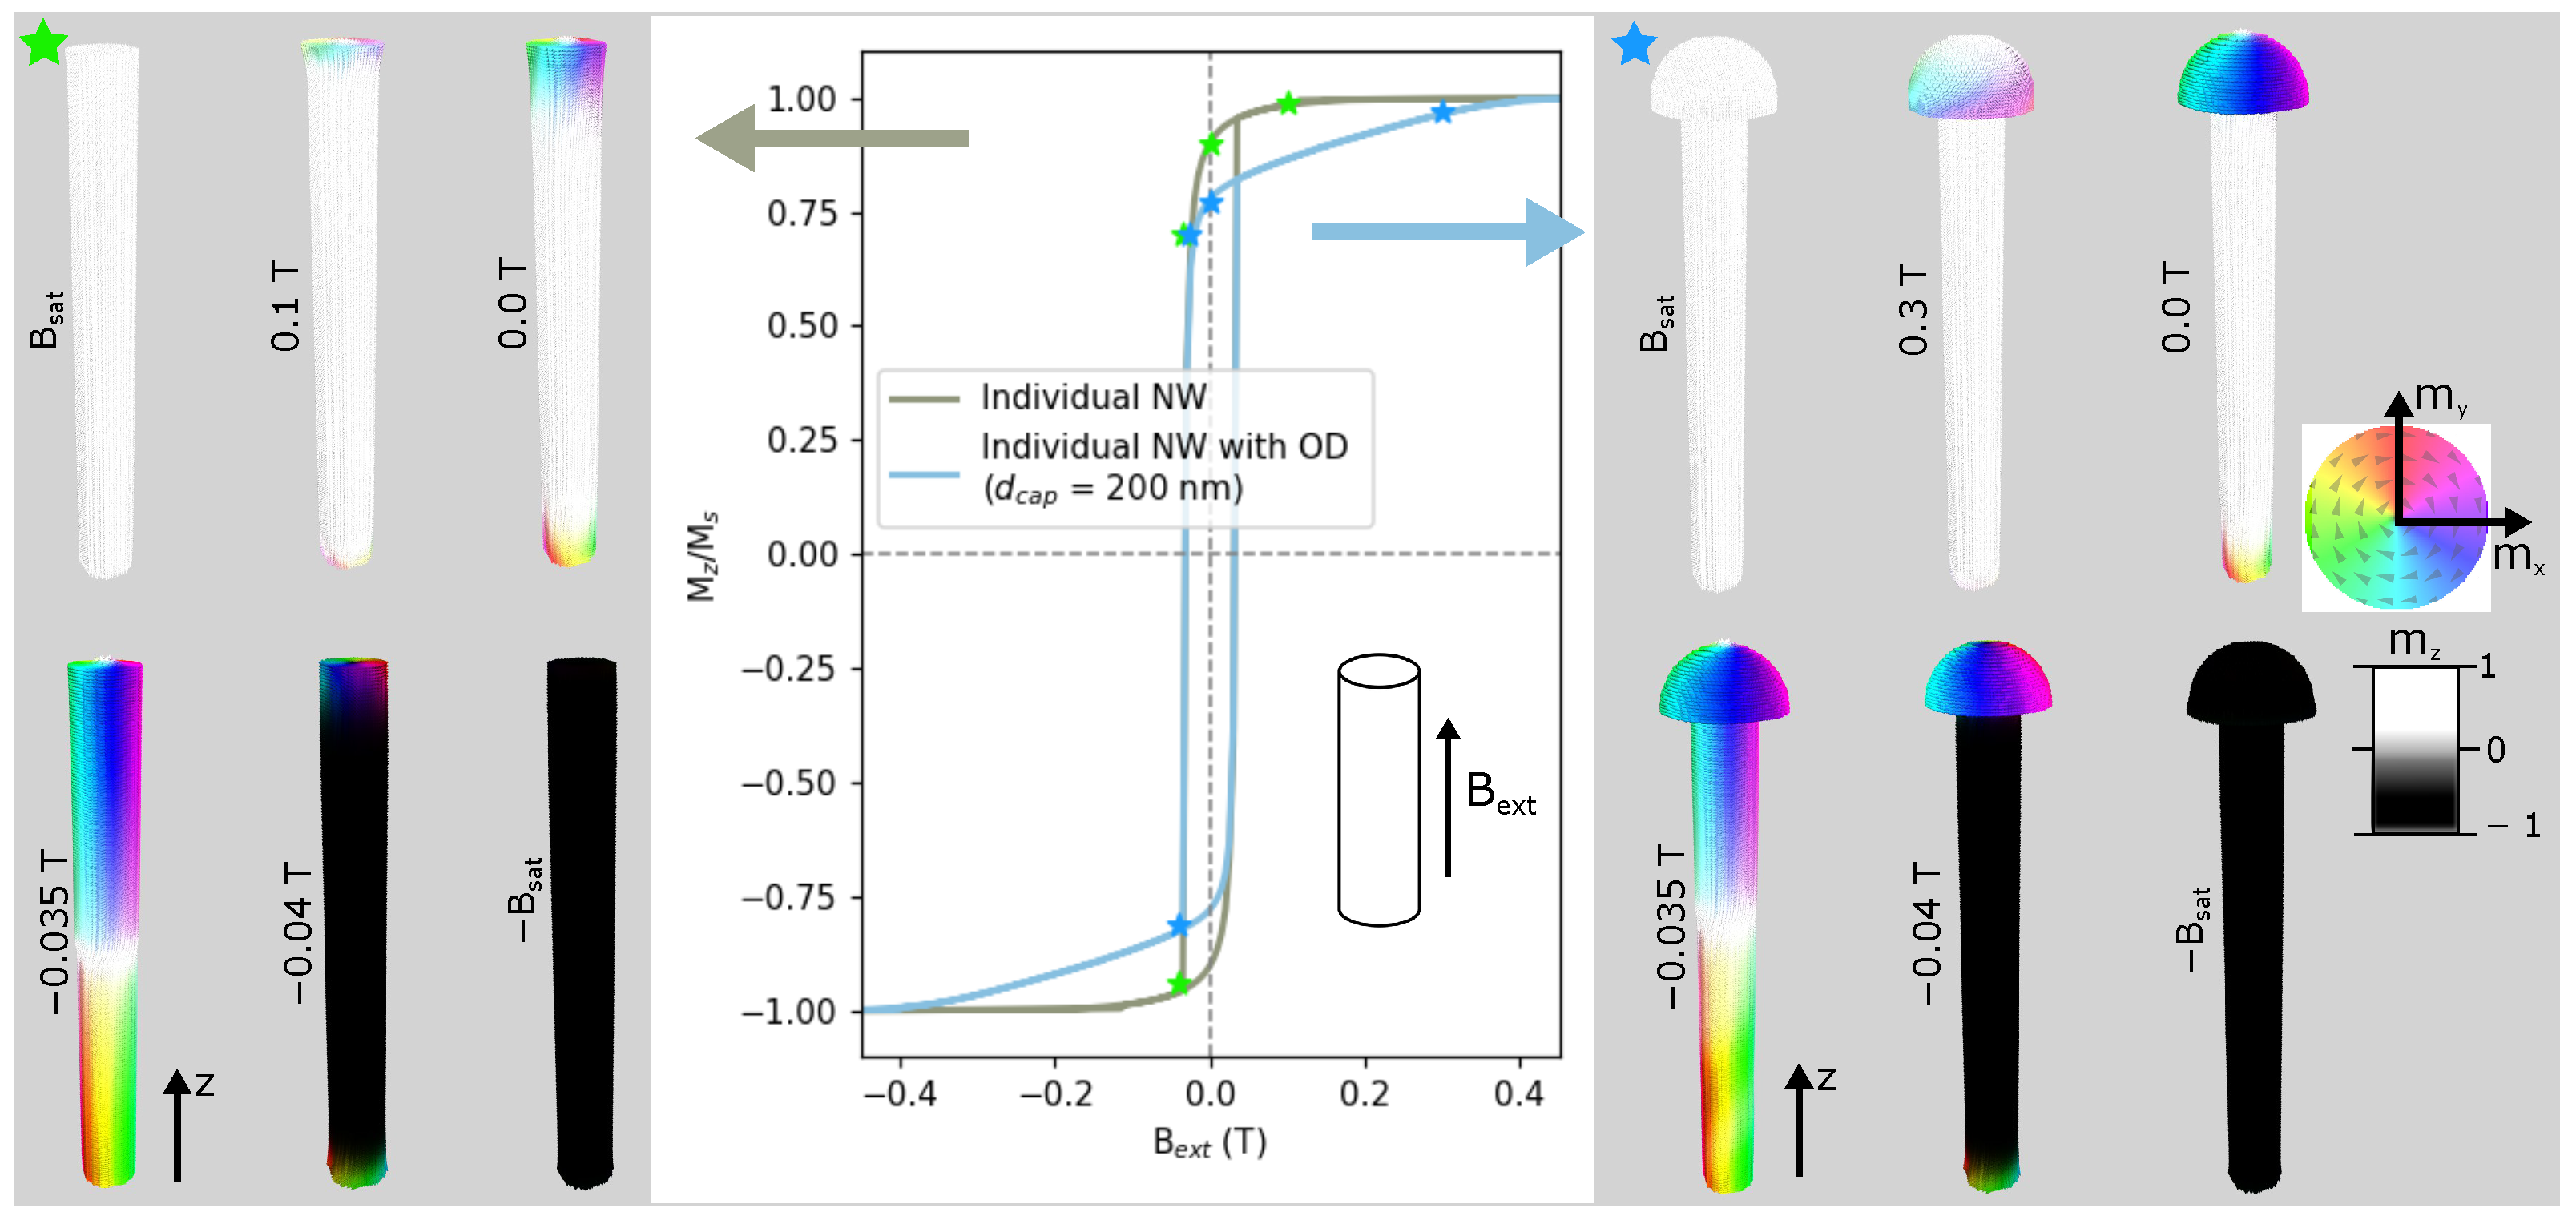
Figure 3 shows easy axis loops for a single nanowire with and without OD and corresponding representations of the magnetic configuration during the reversal. Let us first consider NW without an overdeposition cap. As expected for such a diameter of Py nanowire [20], the magnetization reversal process appears via the vortex domain wall (DW) propagation. Namely, two vortices of opposite chirality are formed at each end (as seen for zero-field magnetization state in Figure 3) and propagate toward each other, leading to magnetization switching (along the z -axis) of the whole nanowire. A bit different magnetization reversal scenario observed for the nanowire with OD. The vortex is formed at the hemisphere more initially than for the regular nanowire (at field Bext ≈ 0.3 T), while the rest of the nanowire’s volume remains saturated with the external field (i.e., along z-axis). As seen from the corresponding hysteresis curve, this leads to a decrease in magnetization with the applied field and results in the less squared curve. At the remanence (Bext = 0 T), the vortex of opposite chirality is formed at the opposite end of the NW. Eventually, the magnetization reversal of NW occurs by a process similar to the regular nanowire (vortex DW propagation) at the same switching field, Bext = −0.035 T.
As can be seen, the appearance of a hemispherical cap on the top of the individual NW does not strongly affect the hysteresis loop: there is a small reduction in the squareness (at about 15%) with no change in coercive field. Such behaviour aligns with previous studies of nanowires with different geometries (e.g., with spherical or conical ends, dumbbell- or diablo-like tips) which showed a visible reduction of remanence compared to nanowires with a cylindrical shape [17,27]. However, in that case, much pronounced changes in coercivity were observed, probably due to the more complex geometry of the nanowires, leading to a stronger change in shape anisotropy. On the other hand, the magnetic behavior of NW with OD reminds the behavior of nanowires with diameter modulations [28], for which the decrease in hysteresis squareness was also observed. Similarly to our case, where the vortex was initially formed on the hemisphere (see Figure 3 for NW with OD at Bext = 0.3 T), in this case, the magnetization reversal process also starts in the segments of the larger diameter compared to the rest of the nanowire.
As it is known, the total magnetic field of the structure consists of an applied external field and a demagnetizing field. The latter is strongly dependent on the shape and orientation of the magnetic object and may directly influence the magnetic behavior.
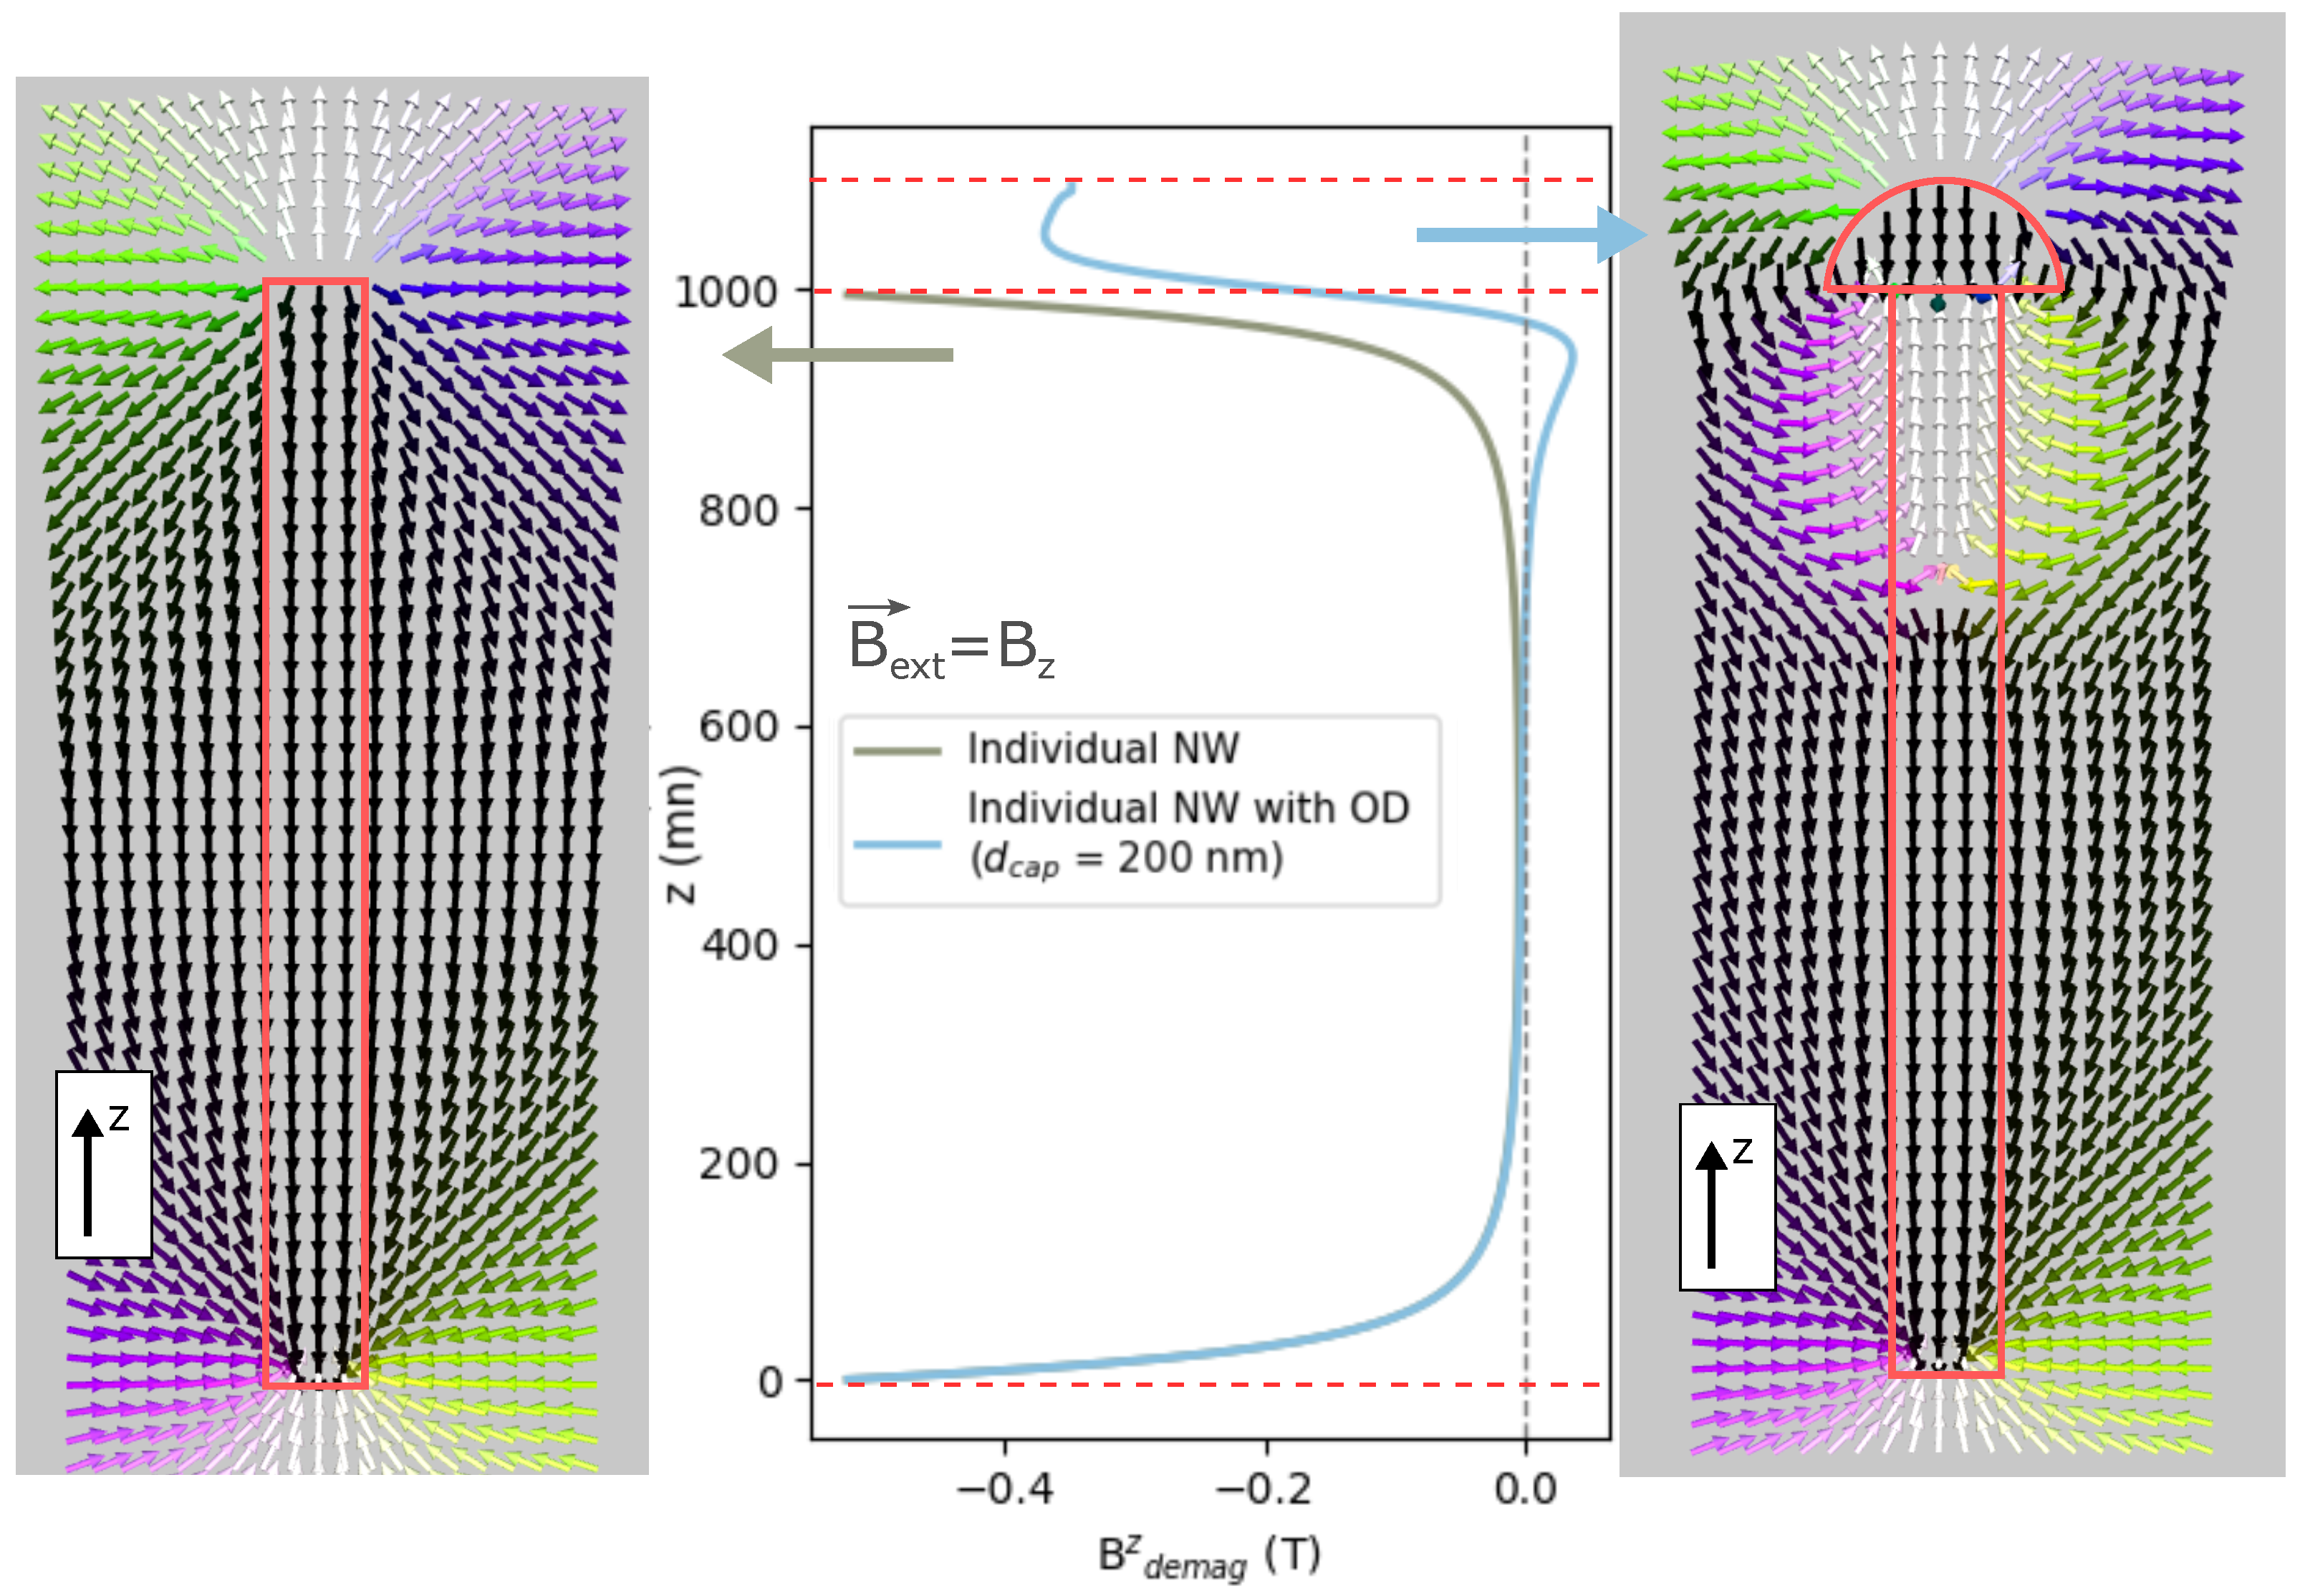
Figure 4 presents the demagnetizing field distribution and profile of its z-component along the nanowire for the case of an individual NW with and without OD at the saturating magnetic field. For an isolated nanowire without OD, the demagnetizing field is high at the tips of the nanowire, where magnetic charge densities are localized, and is close to zero in the central part of the nanowire, where they are compensated. From the visualization of the demagnetization field distribution, it is seen that the field looks like that of a magnetic dipole (lines leaving the “north” pole and entering the “south” pole of the NW). The symmetry of both ends and their far position is important for holding the saturated state and relatively hard reversal of the magnetization. Therefore, the corresponding hysteresis loop is of high squareness and low coercivity.
For the NW with OD, the demagnetizing field is also close to zero at the central part and rises at the NW ends. Importantly, as seen in Figure 4, the B d e m a g z has a high value over the entire region of the hemispherical cap (i.e., between z = 1000–1100 nm), which is explained by the high demagnetizing factor of such geometry [29]: for a hemisphere magnetized along its symmetry axis (the vertical axis passing through the flat circular face), the average demagnetizing factor equals to approx. 0.5. For a long cylinder (aspect ratio ≥ 10) magnetized along its axis, in contrast, the demagnetizing factor equals approx. 0.04. Similarly, the higher value of demagnetizing field on the distorted tips of NWs (diabolo and dumbbell shapes) in comparison to a regular NW was observed in previous studies [27]. As seen from the map of demagnetizing field distribution, the demagnetizing field possesses a complex profile at the joint between the cap and the cylindrical part of the nanowire. In contrast to a flat-end cylinder, instead of going directly to the opposite pole, many field lines bend back toward the cylindrical sidewall near the junction. This creates a highly non-uniform demagnetizing field – local closed-loop flux patterns appear near the junction instead of simple pole-to-pole connections. As a result, in this region, B d e m a g z points along the external field, and therefore, in Figure 4, the blue curve has a local region where the demagnetizing field is positive. For such a nanowire, with one end having the magnetization perpendicular to the long axis, the system tends to minimize the stray magnetic field arising from the surface magnetization. Therefore, a vortex state is formed at the NW’s top at a higher field (i.e., Bext ≈ 0.3 T) in comparison to the nanowire without OD, for which vortices appear simultaneously at both ends at Bext ≈ 0.1 T. In such a way, the presence of the semi-spherical texture on the nanowire is responsible for a visible change in the hysteresis loop, namely, a reduction of squareness and a much higher value of saturation field.

3.2. Array of Nanowires

In the next step of the study, we will examine the magnetic behavior of the arrays of nanowires. Here, it is important to note that according to the literature, the overdeposition process can occur in different stages [13,14]. Normally growth of nanowires in the membrane proceeds until the pores are filled up to its top surface. However, the extension of the electrodeposition process even for a few seconds results in the formation of caps on the membrane surface. If such a process continues, the caps will grow and even connect to each other as the coalescence on the membrane surface occurs. Therefore, in this section, we will consider three different magnetic structures, namely, an array of nanowires without OD (see Figure 2a), an array of nanowires with hemispherical caps formed on the top (see Figure 2b), and an array of nanowires with overdeposition caps, part of which are connected to each other (see Figure 2c).
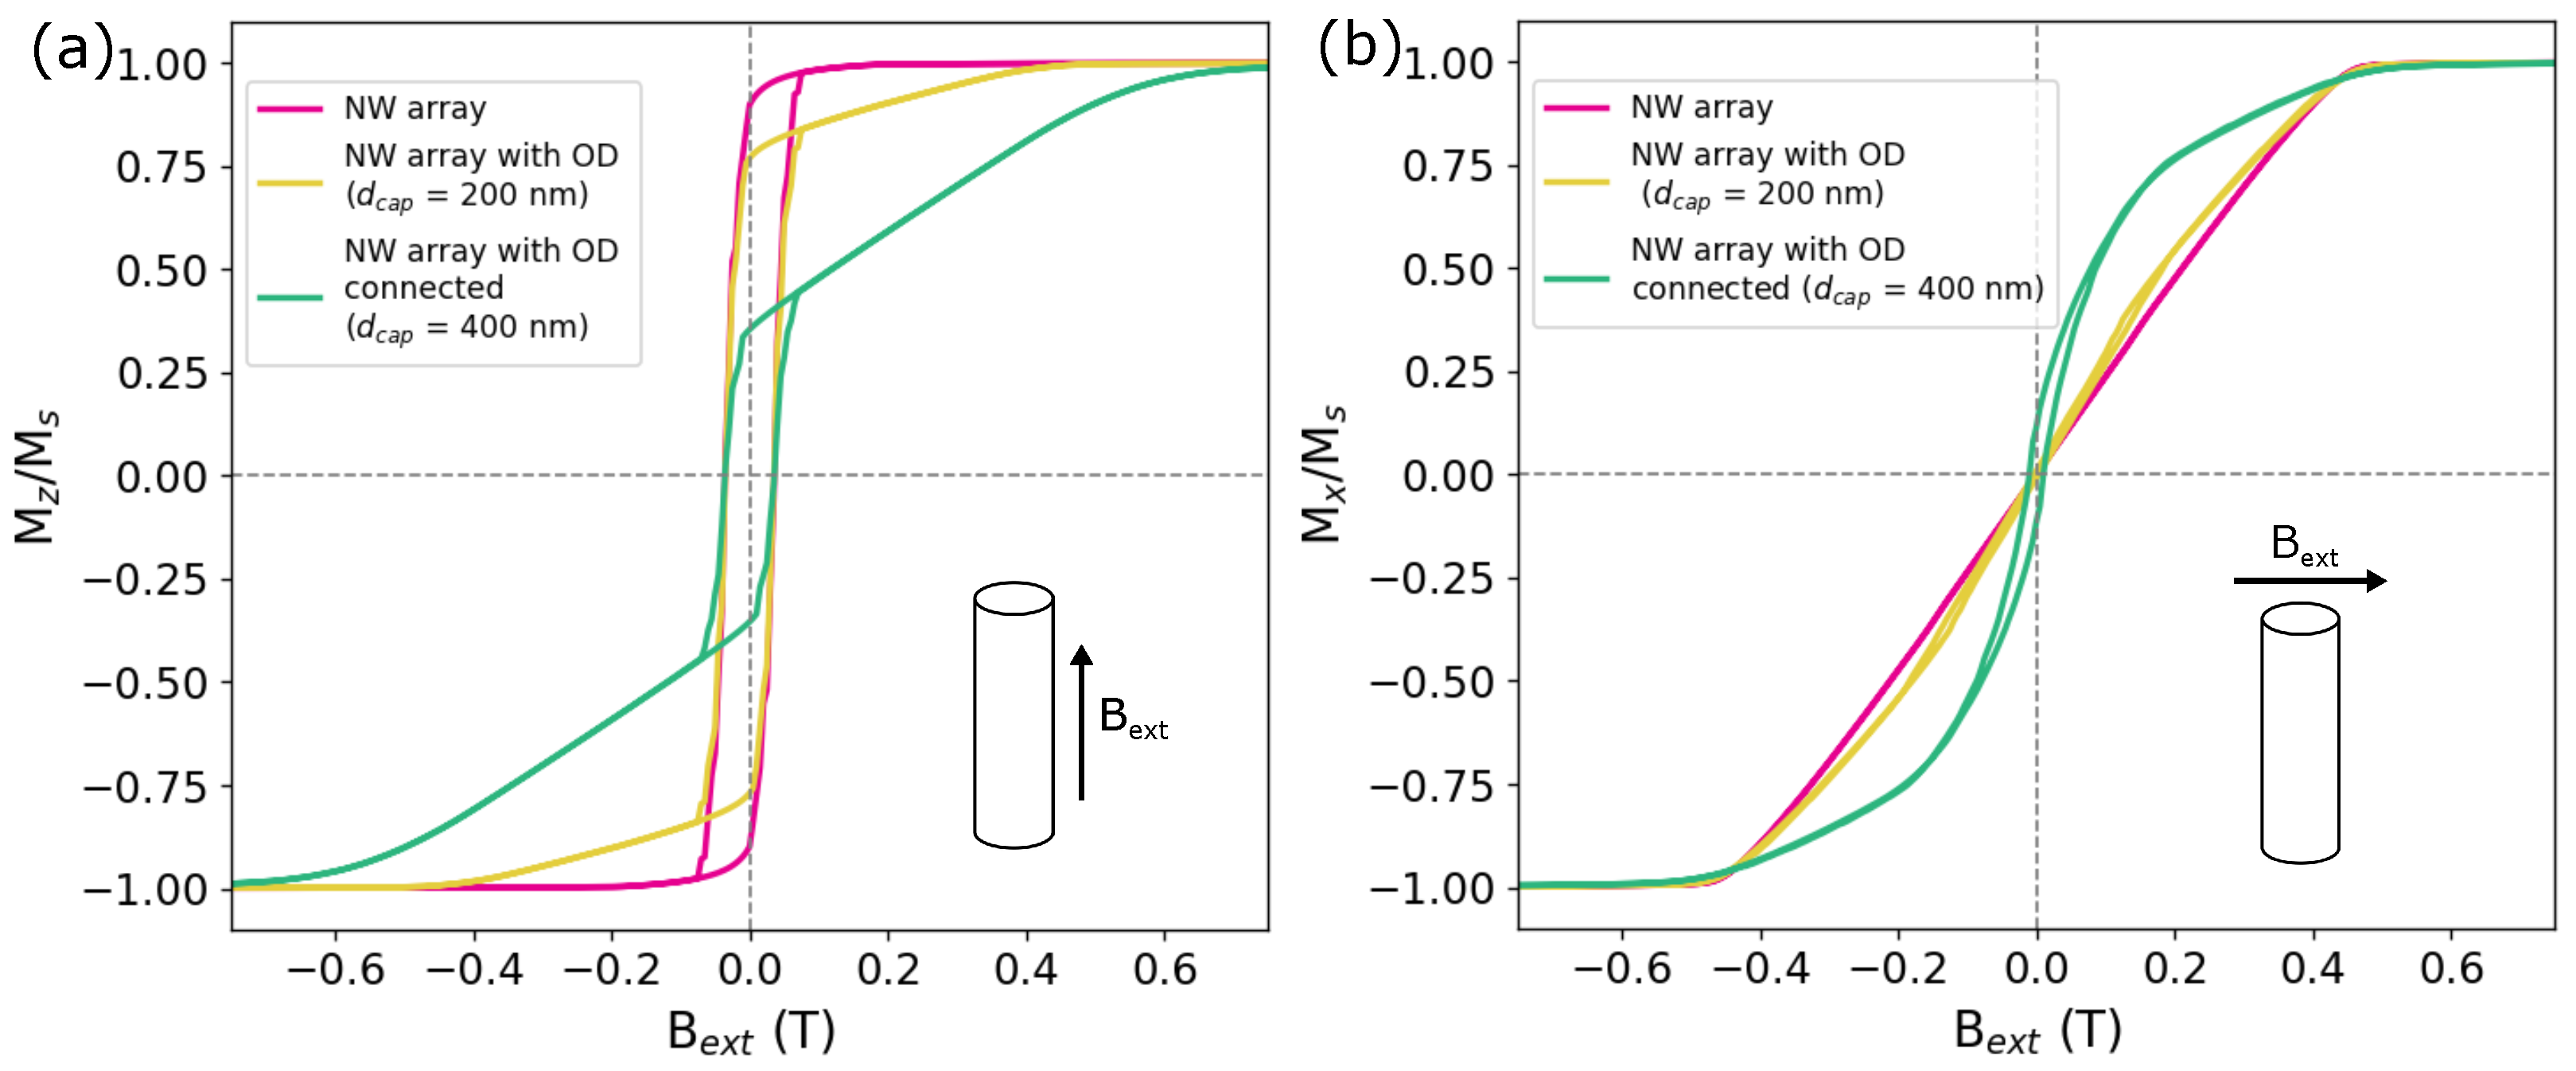
Figure 5a shows hysteresis loops of the above-mentioned arrays of nanowires with a magnetic field applied along the nanowires’ long axis (i.e., along the z-axis). As we can see, each of the three samples exhibits a hysteresis loop that is nearly rectangular, as expected for the nanowires with the arrangement corresponding to the PC membrane. This indicates that the dipolar interactions between the nanowires are significantly smaller than, for example, in the case of hexagonal packing [30], corresponding to the AAO matrix. Nevertheless, a significant difference is observed between the arrays with and without overdeposition. Namely, the strong reduction of squareness from 0.88 for NWs without OD to 0.77 for NWs with hemispherical caps and 0.36 for NWs with connected caps. Also, the saturation of magnetization is reached for a larger field with the increasing effect of overdeposition in the array. Looking at the magnetization curves for a field applied perpendicular to the NWs long axis (Figure 5b), we can see that there is not much difference between the array of NWs with and without OD caps. For both cases, a typical for NW (with aspect ratio ≥10) hard-axis hysteresis loop is observed [31]. However, when the OD caps are connected, the NWs array shows completely different behavior. The corresponding hysteresis loop shows visible coercivity and non-zero squareness, indicating that the easy axis of magnetization is no longer positioned strictly along the NW long axis, but changes toward the in-plane position for a certain amount.
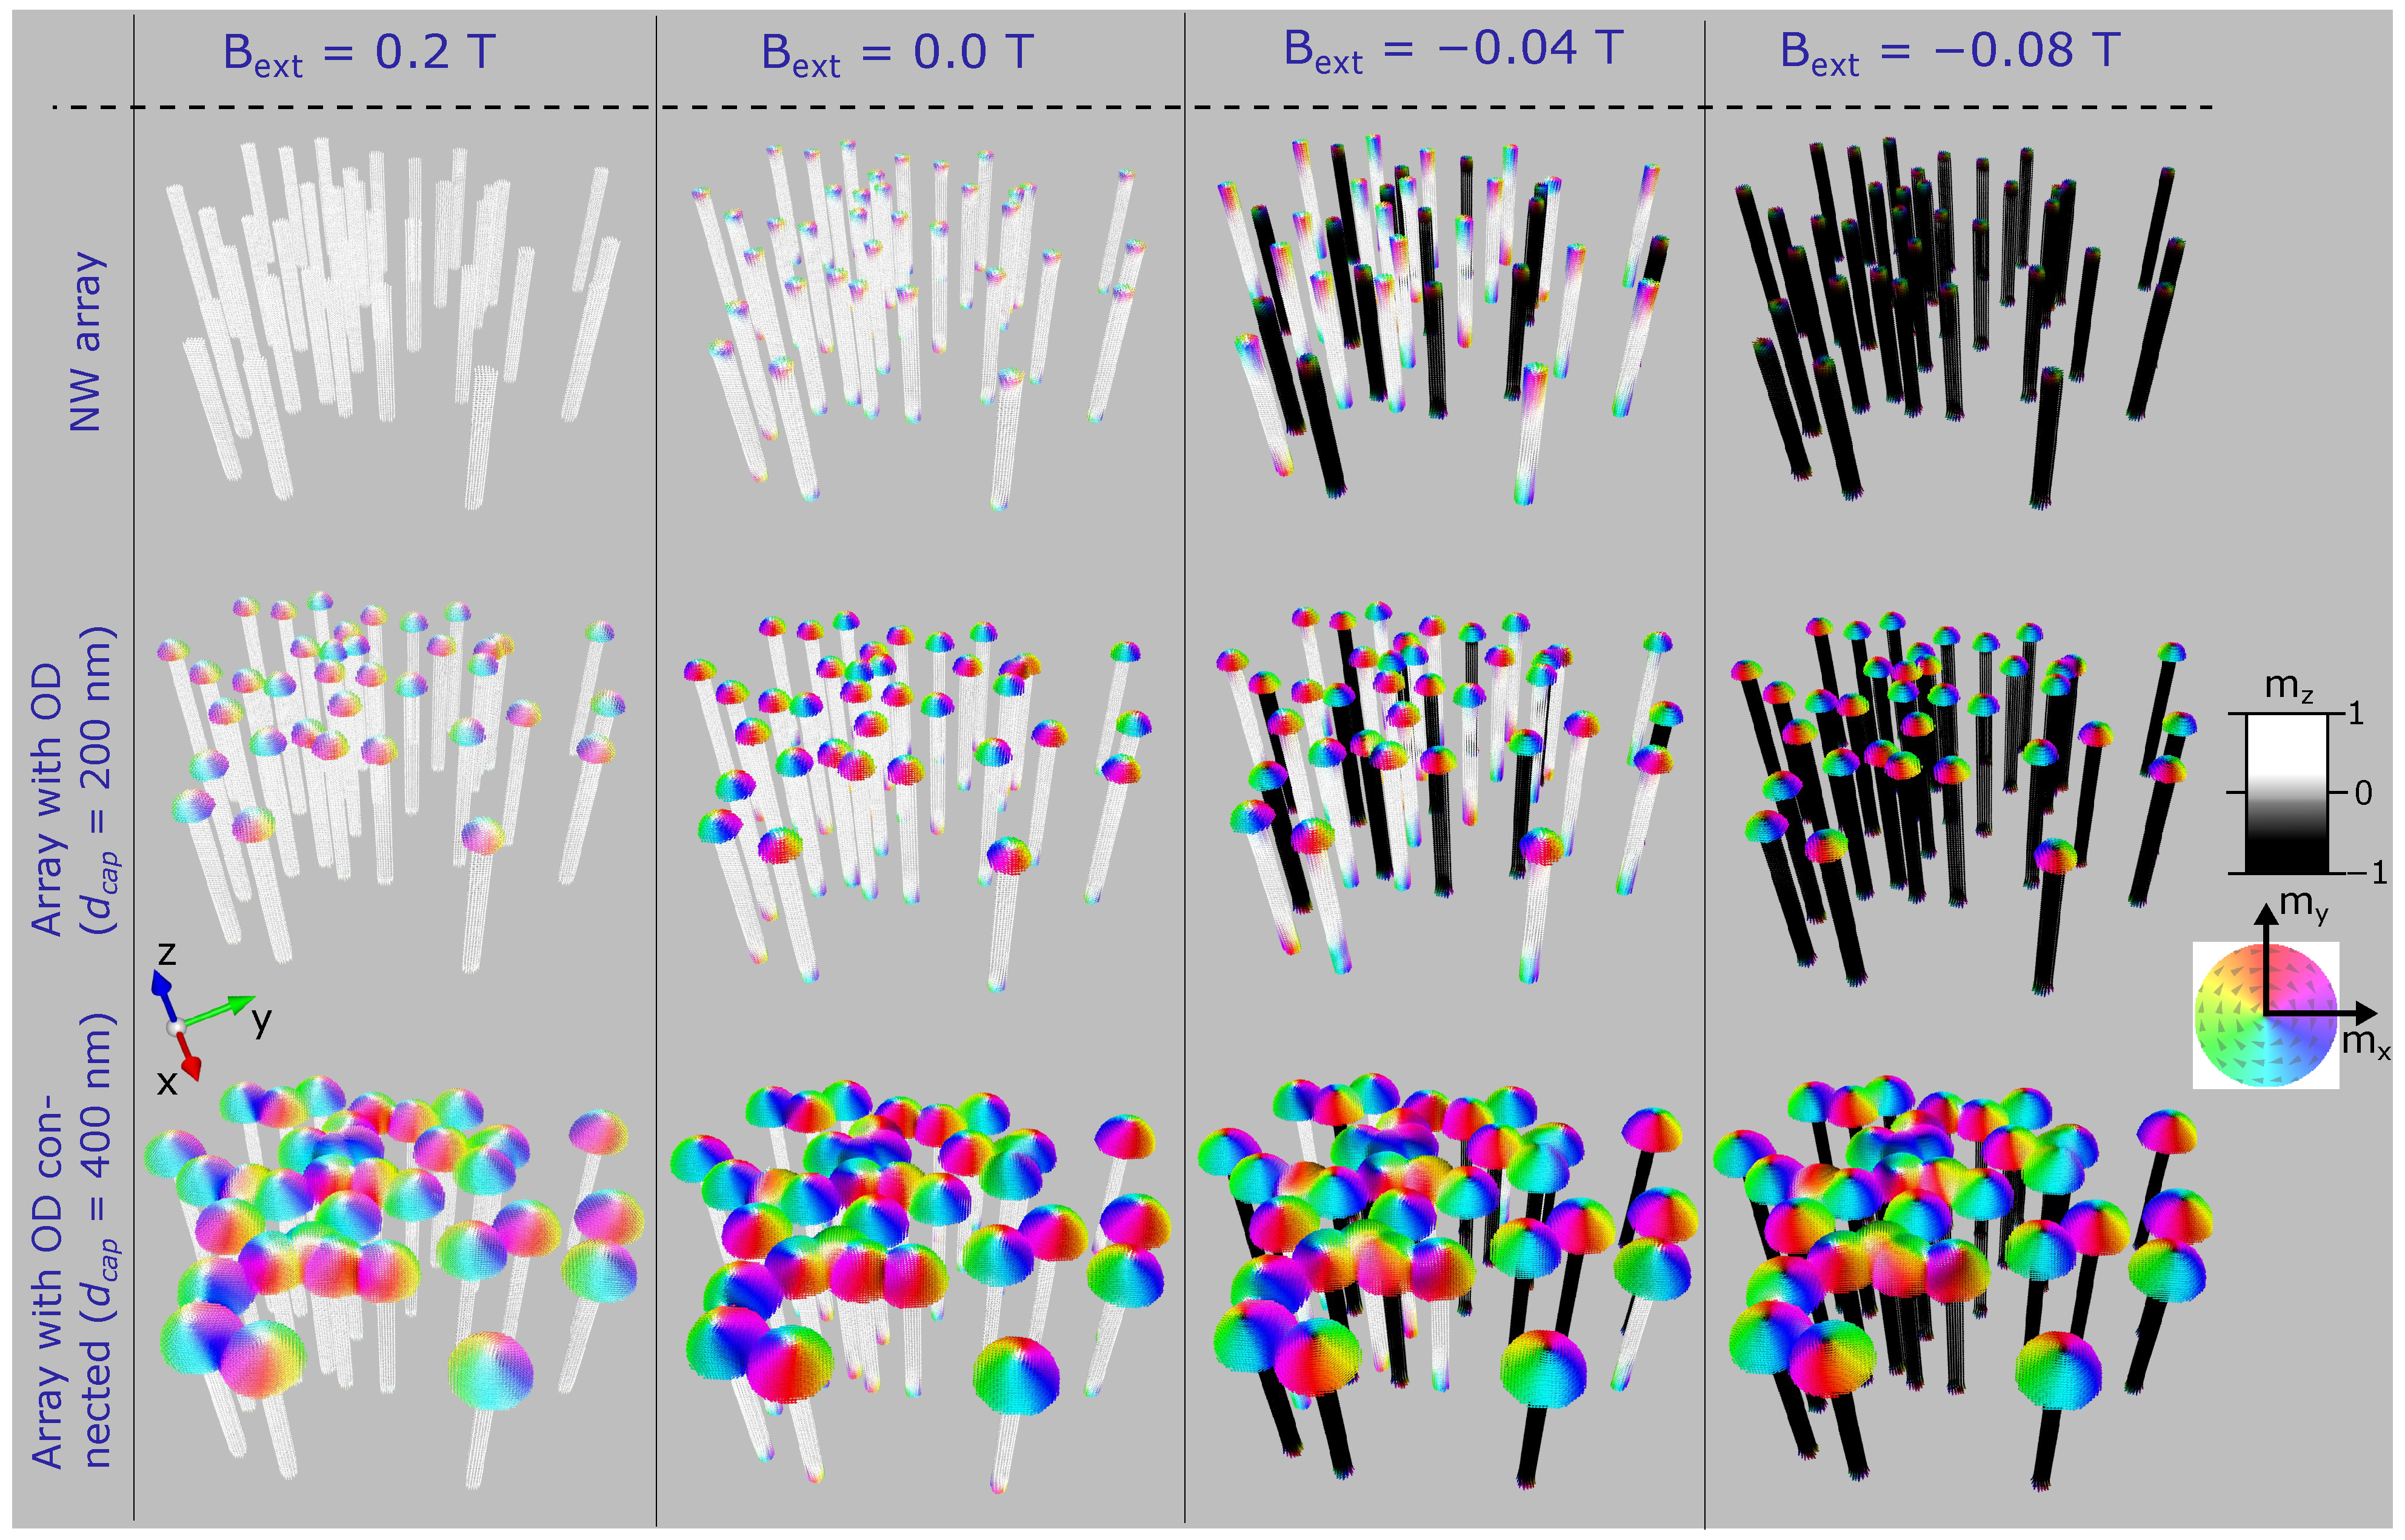
A better understanding of the magnetization switching of NW arrays can be obtained by examining the magnetization distribution during the reversal process (Figure 6). For the case of nanowires wihout overdeposition, the magnetization reversal proceeds through the following sequence: the formation of the vortices on the NW tips (see configuration for Bext = 0.0 T), switching of individual nanowires along the applied field as it becomes negative (see configuration for Bext = −0.04 T) and finally, switching of the entire array along the z -axis (see configuration for Bext = −0.08 T). In contrast, for arrays with overdeposition, the initial stages of magnetization reversal are characterized by vortex formation exclusively at the capped tips, similar to the behavior of an isolated nanowire. These modified tips serve as nucleation points for magnetization reversal, resulting in a non-uniform magnetization distribution along the nanowires. As a result, as one can see on the corresponding hysteresis loop (Figure 5), the magnetization decreases more rapidly with the applied field. At the remanent state (Bext = 0.0 T), the vortices are observed at both ends of the nanowires and subsequently propagate toward the center of the nanowire with further decreasing of the field. In contrast to an individual nanowire, for the array, the vortex domain walls do not reach the center of the NW, and its central part remains in the longitudinal orientation of magnetic moments. This is probably due to the influence of the dipolar field from the neighboring nanowires [30,32]. A similar magnetization reversal process is observed for an array with connected OD caps; however, there is even more initial vortex formation (at Bext ≈ 0.5 T) and, as a result, an abrupt decline of the magnetization curve with applied field, compared to the other two cases. Important to note that a closer look at the magnetization configuration of the array with connected OD caps for the Bext = 0.0 T, reminds the configuration of the double or triple vortex states with opposite vortex chiralities [33]. The dynamics of such multivortex states can be very complex, and the ability of their stabilization and control is of great interest for nanotechnology [34].
It is well established that the magnetic behavior of nanowires is primarily governed by their shape anisotropy [35,36] (in the case of permalloy, the magnetocrystalline anisotropy is negligible compared to shape effects). For arrays of nanowires, dipolar interactions between neighboring wires can also significantly influence the overall magnetic anisotropy [37]. While these interactions are relatively weak in randomly distributed nanowires, the formation of hemispherical caps during overdeposition, and especially their mutual connection, can substantially modify the dipolar coupling. Consequently, both shape-related factors and interwire interactions play key roles in determining the evolution of the magnetic properties of nanowires with increasing overdeposition. To analyze this effect in more detail, the distribution of the demagnetizing field inside and outside the nanowire arrays was examined.
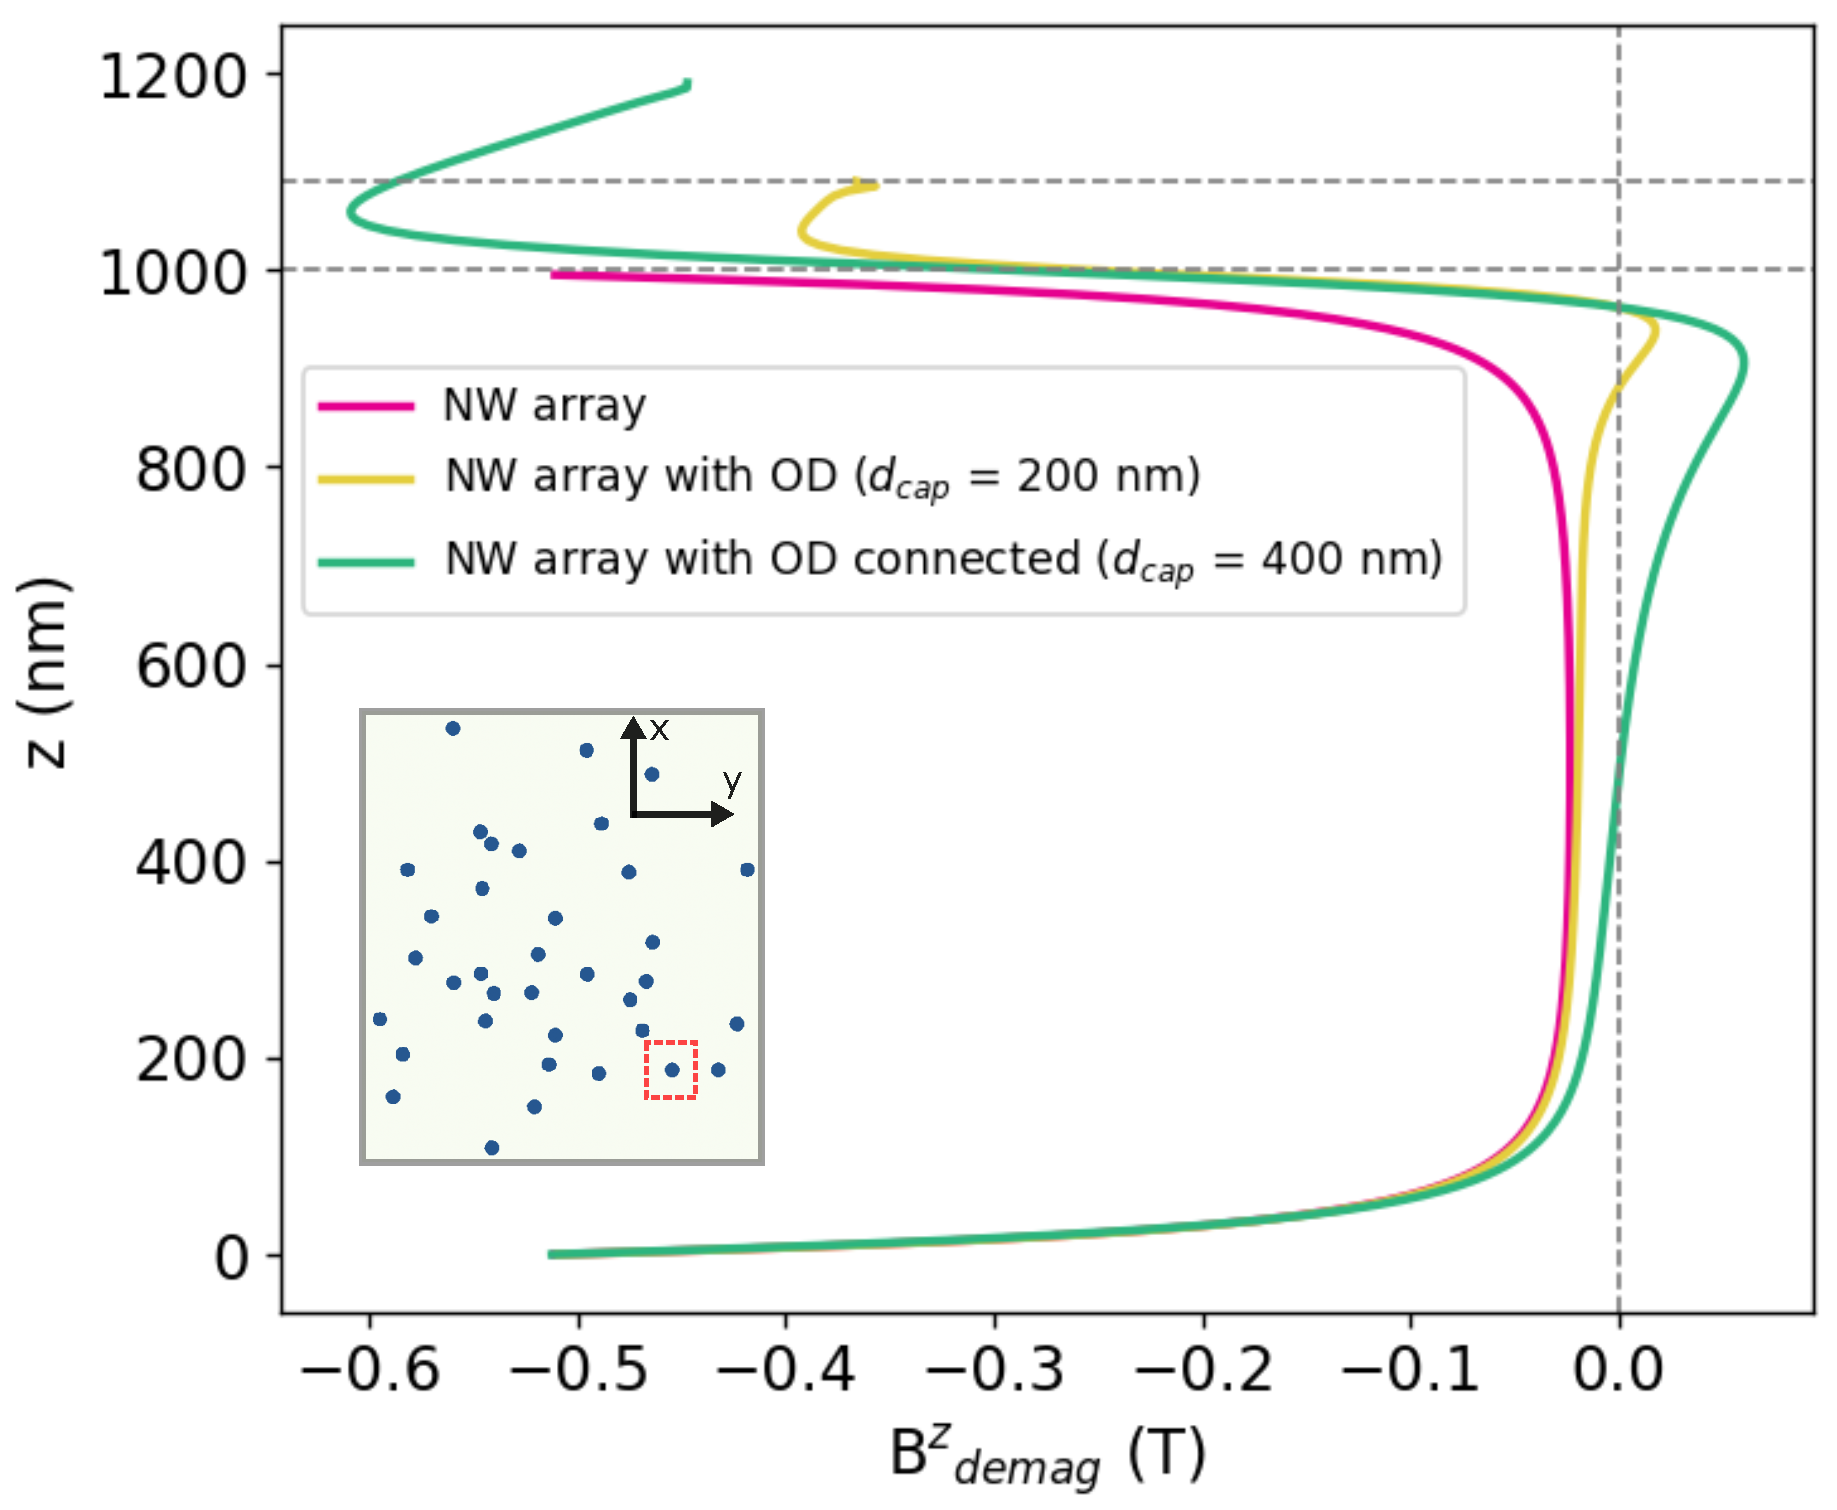
Figure 7 shows profiles of the z-component of the demagnetizing field along the z-axis of a selected nanowire of the array. For the case of NW without overdeposition, the demagnetizing field exhibits a symmetric profile, with maxima localized at the wire ends and a gradual decay toward the central region. This distribution reflects the shape anisotropy of an elongated cylinder, where strong stray fields develop mainly at the ends. In contrast, for nanowires with overdeposition, the demagnetizing field is strongly modified near the capped ends. The overdeposited regions act as sources of enhanced stray fields, which, as follows from Figure 7, lead to a more inhomogeneous axial profile. Specifically, the field intensity is significantly larger at the capped ends compared to the uncapped regions, thereby facilitating more initial vortex nucleation as was observed from magnetization maps (Figure 6) and a much faster decrease in magnetization with the applied field as seen from the hysteresis loop (Figure 5).
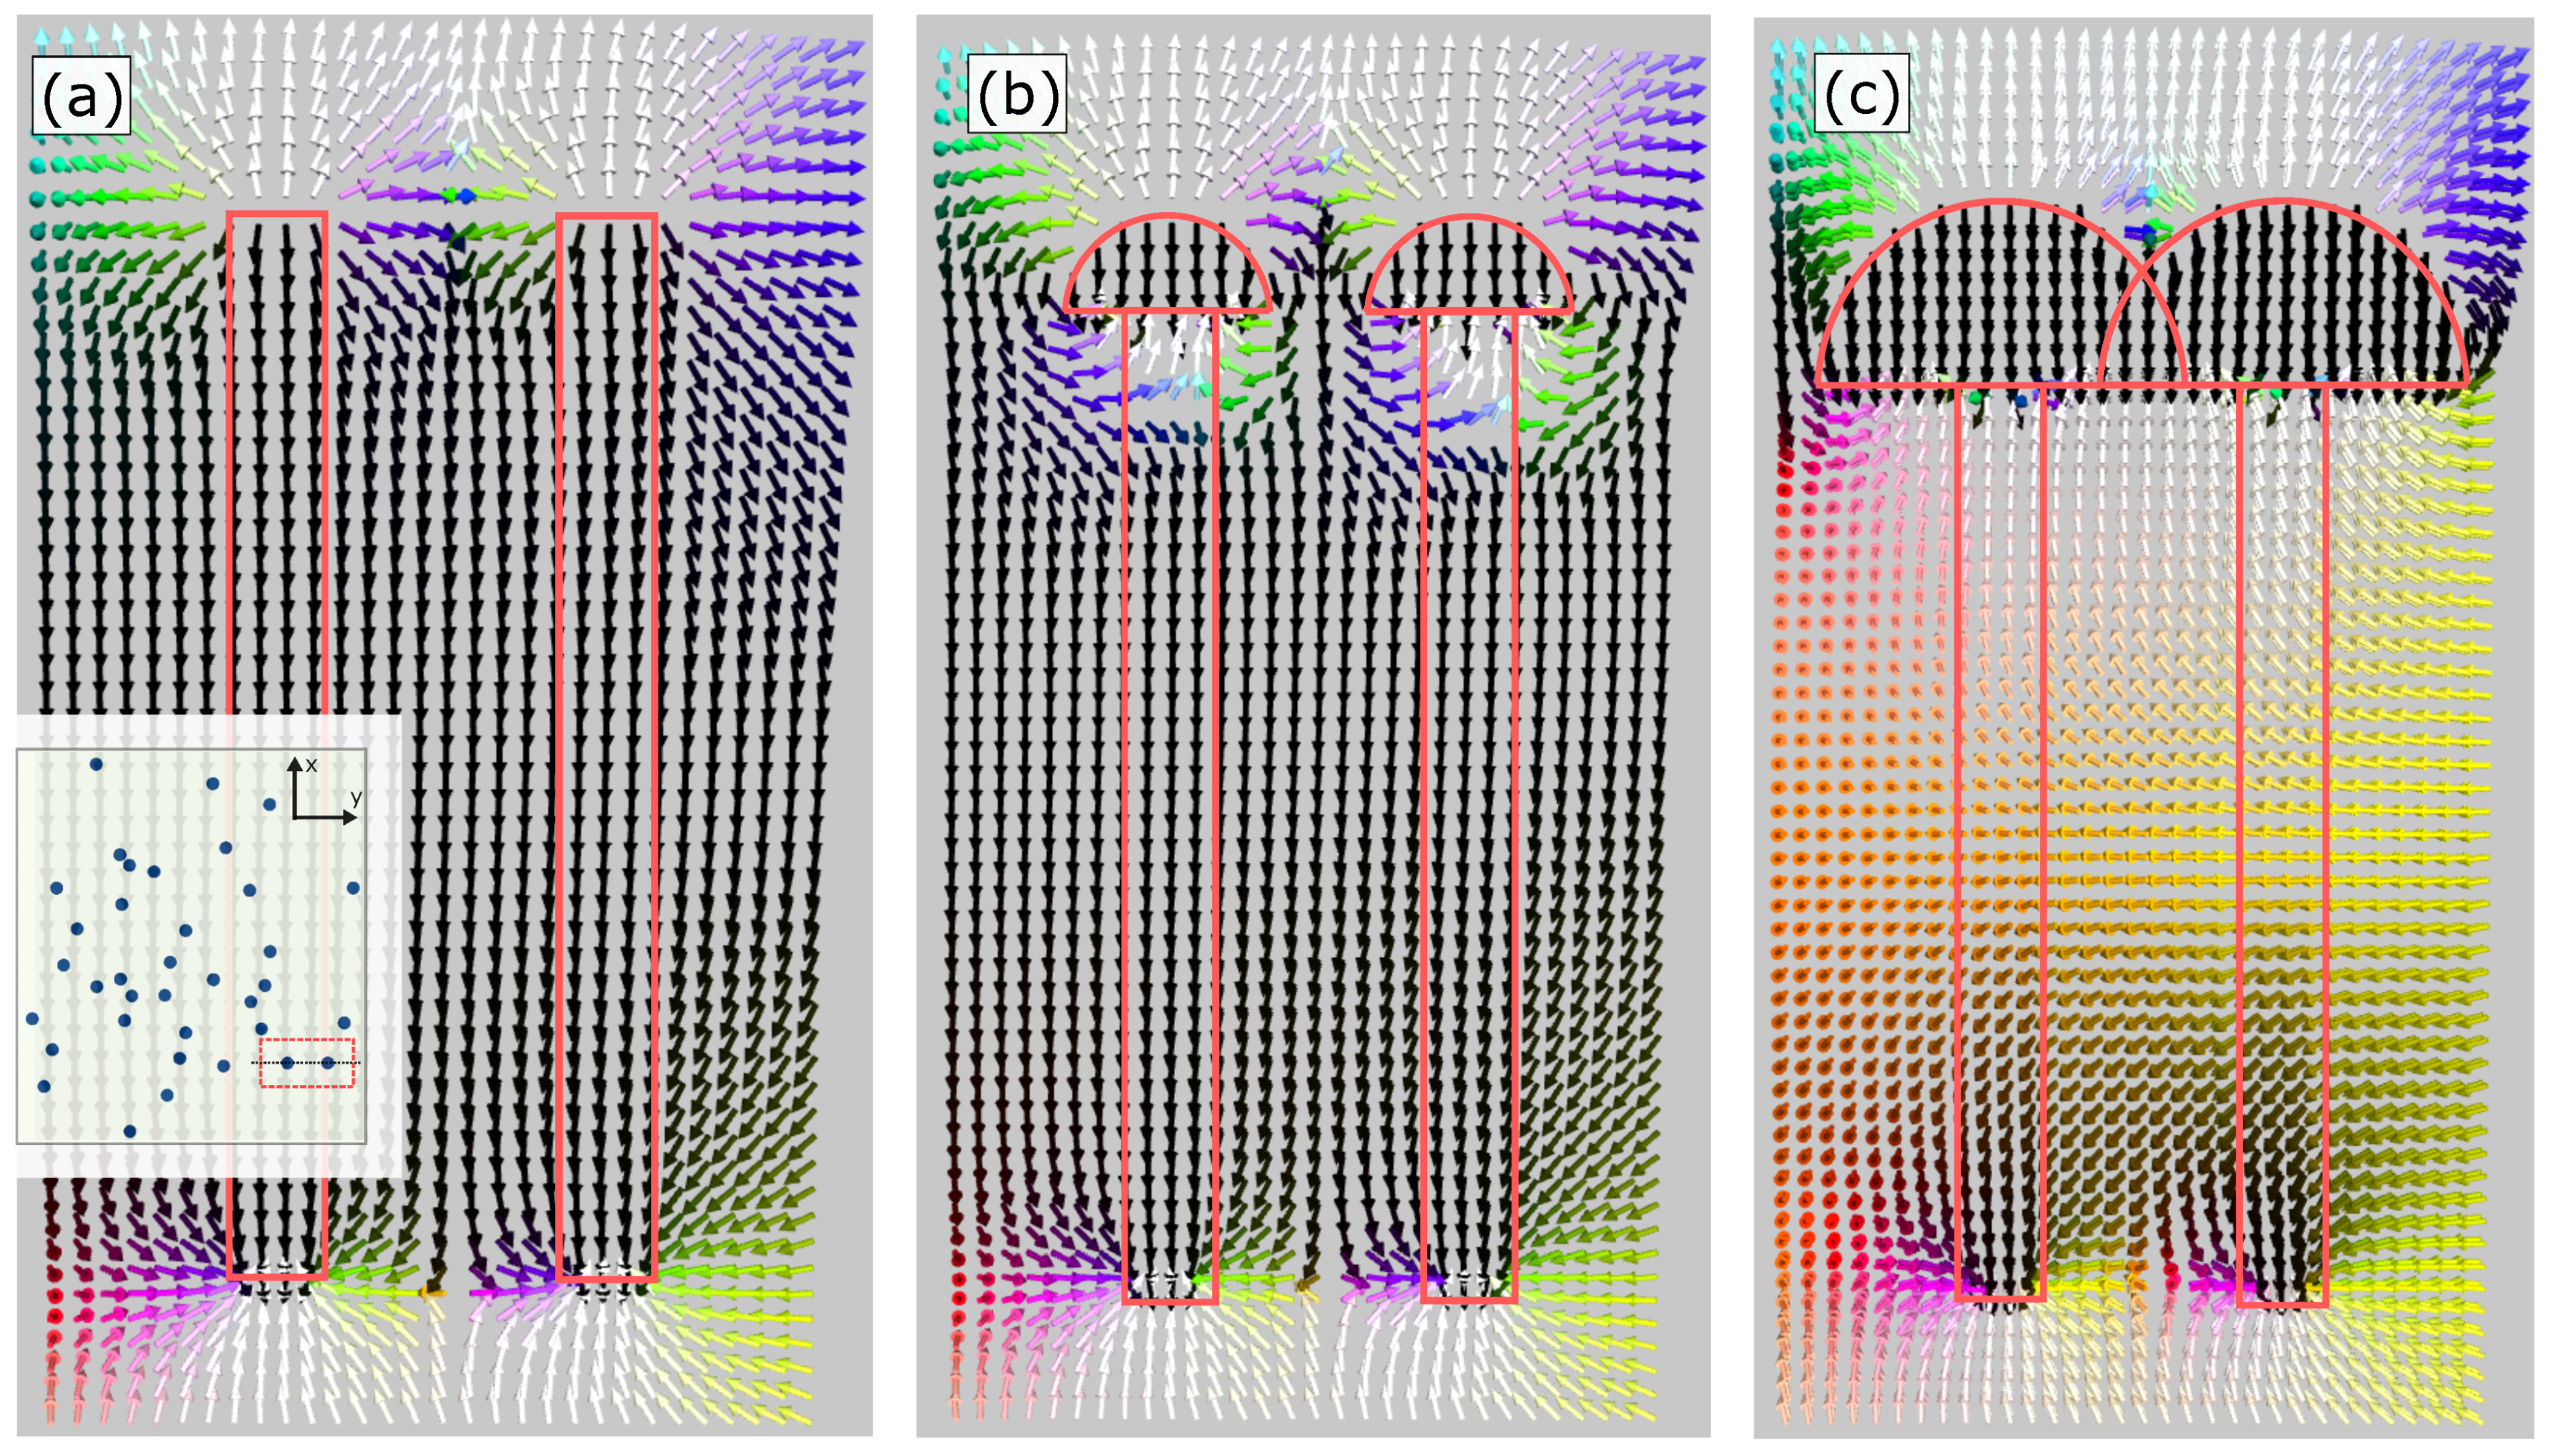
Let us take a look at the demagnetizing field distributions along the long axis (i.e., along the z-axis) of the two selected nanowires in the array (NWs are at magnetization saturation along the OZ direction). As can be seen from Figure 8, for the case of NWs without OD, the demagnetizing field distribution is changing mostly along the z-axis, similarly to an individual cylinder: field lines emerge radially outward from one nanowire tip, extend along the axial direction, and terminate at the opposite tip. In contrast, for nanowires with overdeposition, the topology of the field lines is modified near the capped ends: part of the field closes locally beneath the cap region. This localized closure of field lines leads to a partial confinement of the demagnetizing field within the overdeposited volume. A similar situation takes place for the NWs array, for which the caps connect to each other. However, as can be seen from Figure 8, much complicated distribution is observed, accompanied by a much pronounced appearance of x- and y-components of the demagnetizing field. Such redistribution of field lines related to the increased interaction between neighbouring nanowires: it enhances short-range dipolar interactions between them, especially at the ends where the overdeposited caps face each other (see corresponding profile for NWs with connected caps in Figure 7). In particular, the capped ends act as localized sources of stray fields that overlap more strongly with adjacent elements, thereby strengthening the inter-wire interactions and promoting distinct magnetic behavior, namely advancing a slight in-plane alignment of the magnetic easy axis (see Figure 5).

3.3. Summary of Simulations and Relation to the Experimental Data

Overall, by considering the effect of overdeposition in both individual nanowires and arrays, we can see that it has a pronounced influence on their magnetic behavior. A summary of the corresponding magnetic parameters change is presented in Figure 9. As we can see, the hysteresis loop calculations reveal a similar trend for all investigated systems when overdeposition is considered: a reduction in squareness accompanied by an increase in the saturation field (field at which material is fully magnetized), but with no significant effect on the coercive field. This behavior can be explained by the geometric modification of the nanowires caused by overdeposition, which directly alters the shape anisotropy. The analysis of the magnetization reversal process and demagnetizing field distribution provides further insight into these changes. As shown, the overdeposition caps at the end of the nanowires act as nucleation sites, promoting the formation of vortices. This arises from the enhanced demagnetizing field in these regions: the OD caps generate a complex demagnetizing field profile, leading to a locally confined increase in the field. As seen in Figure 9b, the z-component of the demagnetizing field increases in both isolated nanowires and arrays when OD is present. Importantly, in the case of arrays, the in-plane component of the demagnetizing field also becomes significant, particularly for strong overdeposition, where coupling between OD caps of neighboring wires occurs. Consequently, mutual demagnetizing fields modify the effective anisotropy by reducing the axial preference (along the wire axis) and promoting collective magnetic states. This effect also alters the interaction energy between neighboring nanowires. As seen in Figure 9b, the magnetostatic energy in nanowire arrays is relatively weak in the absence of OD, but increases substantially once OD is introduced.
An intriguing aspect revealed by the simulations of nanowire arrays with overdeposition effects concerns the role of the increased cap size on the magnetic behavior and its relation to the physical connection between neighboring nanowires. In the present study, we analyzed two representative cases: an array with OD caps of diameter d c a p = 200 nm, corresponding to separated NWs, and another with d c a p = 400 nm, where adjacent nanowires become physically connected through their caps. The results indicate that increasing the OD cap diameter leads to a marked reduction in the squareness of the Mz/Ms hysteresis loop (when the magnetic field is applied along the nanowire axis, z-direction). However, in addition, for the case of interconnected nanowires, a narrow hysteresis loop emerges for the field applied perpendicular to the nanowire axis (x-direction), as shown in Figure 5b. This behavior can be attributed to the formation of a continuous, ferromagnetic layer on top of the NW array once the OD caps merge. Such a layer introduces an additional in-plane magnetic anisotropy in the system, which results in the observed hysteresis in the Mx/Ms curve. Hence, the physical connection between OD caps appears to be the dominant factor responsible for the emergence of this in-plane magnetic component, which is consistent with previous experimental observations [38].
To further test this hypothesis, we carried out additional simulations focusing on individual nanowires, thereby excluding the inter-wire connection effects. Four configurations were considered: (1) a NW without OD, (2) a NW with d c a p = 200 nm, (3) a NW with d c a p = 300 nm, and (4) a NW with d c a p = 400 nm. The obtained results (see Figure S1 of Supplementary Materials) reveal that increasing the OD cap diameter progressively reduces the squareness of the Mz/Ms hysteresis loop for the field applied along the nanowire axis. However, no hysteresis is observed for Mx/Ms in any of these cases, confirming the absence of in-plane anisotropy in isolated nanowires even for large OD caps.
Concerning the array of nanowires, which imitates the arrangement corresponding to a polycarbonate membrane, the NWs are not located at the same distance from one another (see Figure 1a). Consequently, the influence of the OD cap physical connection varies across the array, leading to nonuniform magnetic interactions. This implies that the two effects (the intrinsic modification of individual NW magnetic behavior due to OD growth and the extrinsic coupling between physically connected caps) cannot be fully separated for the array of nanowires. To better capture this transition, we also simulated an intermediate case with d c a p = 300 nm (see Figure S2 of Supplementary Materials). In this case, approximately half of the nanowires become connected through their OD caps, forming partial bridge-like regions that resemble a ferromagnetic layer. As a result, a visible coercivity appears in the Mx/Ms hysteresis loop, thereby confirming that the physical connection between OD caps promotes the emergence of in-plane magnetic anisotropy within the system.
Important to note that numerous studies report the appearance of overdeposition in the process of synthesis of nanowires [13,14,15,16,24], however, the study of its influence on the magnetic properties is poorly presented. Our research therefore, provides a valuable analysis of the impact of OD on the magnetic behavior of nanowire arrays, including hysteretic response, magnetization reversal mechanisms, and demagnetizing field distributions. Nevertheless, the presented calculations can also be qualitatively compared with experimental observations. For example, studies of Co nanowires with diameters of 50 nm and Co/Cu multilayer nanowires with diameters of 200 nm, electrodeposited in polycarbonate membranes, have reported a strong influence of OD on the magnetic properties [11,38]. In particular, this effect is primarily reflected in the pronounced change in the easy axis of magnetization of nanowires and the emergence of an in-plane orientation of the magnetic easy axis. Our calculations are consistent with these observations. Specifically, for nanowire arrays with connected OD caps, the in-plane magnetization curve exhibits a clear hysteresis, and the x-component of the demagnetizing field becomes non-negligible. These results confirm that OD has a strong effect on the magnetic properties of nanowires, and is especially important when neighboring wires are connected through OD caps.
4. Conclusions

The micromagnetic simulations of the overdeposition effect on the magnetic properties were carried out for both individual and an array of permalloy nanowires. It was shown that the appearance of a hemispherical cap on the top of the nanowire provides initial nucleation of a vortex state, resulting in the rapid decrease in magnetization with the applied external field, observed on the easy-axis hysteresis loop. This provides a decrease in the squareness and a higher saturation field. Moreover, the OD cap in the nanowire strongly changes the demagnetizing field distribution and provides an increase in its amplitude in this geometrically modified region. For an array of nanowires, the decrease in squareness of the hysteresis loop was also observed, which becomes much strongly pronounced when the OD caps of neighboring NWs couple to each other. Moreover, the change in the easy-axis of magnetization toward the in-plane orientation (along the x-axis) was observed. As was shown, this provides a visible redistribution of the demagnetizing field in comparison to a regular array of NWs and increases the interaction between nanowires.
The presented results show an important role of overdeposition on the magnetic properties of NWs. Such an effect should therefore be precisely controlled during the electrochemical deposition of magnetic nanowires and accounted for in the magnetic measurements and possible applications. The obtained results, therefore, can be of great interest for experimental groups and for further theoretical investigations of similar magnetic nanostructures.

Supplementary Materials

The following supporting information can be downloaded at https://www.mdpi.com/article/10.3390/condmat10040057/s1.

Funding

The simulations were performed at the Poznan Supercomputing and Networking Center (Grant No. pl0478-01).

Data Availability Statement

All data generated or analyzed during this study are included in the manuscript.

Acknowledgments

Author is grateful to Małgorzata Kąc for providing the SEM images (Figure 1) and fruitful discussions concerning the analysis of results.

Conflicts of Interest

The author declares no conflicts of interest.

Abbreviations

NWnanowire
AAOanodic aluminum oxide
PCpolycarbonate
ODoverdeposition
SEMscanning electron microscopy
LLGLandau–Lifshitz–Gilbert
Pypermalloy (Ni80Fe20)
DWdomain wall

References

  1. Fert, A.; Piraux, L. Magnetic nanowires. J. Magn. Magn. Mater. 1999, 200, 338–358. [Google Scholar] [CrossRef]
  2. Piraux, L. Magnetic nanowires. Appl. Sci. 2020, 10, 1832. [Google Scholar] [CrossRef]
  3. Vazquez, M. Cylindrical nanowire arrays: From advanced fabrication to static and microwave magnetic properties. J. Magn. Magn. Mater. 2022, 543, 168634. [Google Scholar] [CrossRef]
  4. Kou, X.; Fan, X.; Dumas, R.K.; Lu, Q.; Zhang, Y.; Zhu, H.; Zhang, X.; Liu, K.; Xiao, J.Q. Memory effect in magnetic nanowire arrays. Adv. Mater. 2011, 23, 1393–1397. [Google Scholar] [CrossRef] [PubMed]
  5. Cisternas, E.; Vogel, E. Improving information storage by means of segmented magnetic nanowires. J. Magn. Magn. Mater. 2015, 388, 35–39. [Google Scholar] [CrossRef]
  6. Tian, Y.; Bakaul, S.R.; Wu, T. Oxide nanowires for spintronics: Materials and devices. Nanoscale 2012, 4, 1529–1540. [Google Scholar] [CrossRef]
  7. Cox, B.; Davis, D.; Crews, N. Creating magnetic field sensors from GMR nanowire networks. Sens. Actuators A Phys. 2013, 203, 335–340. [Google Scholar] [CrossRef]
  8. Pondman, K.M.; Bunt, N.D.; Maijenburg, A.W.; Van Wezel, R.J.; Kishore, U.; Abelmann, L.; Ten Elshof, J.E.; Ten Haken, B. Magnetic drug delivery with FePd nanowires. J. Magn. Magn. Mater. 2015, 380, 299–306. [Google Scholar] [CrossRef]
  9. Wade, T.; Wegrowe, J.E. Template synthesis of nanomaterials. Eur. Phys. J.-Appl. Phys. 2005, 29, 3–22. [Google Scholar] [CrossRef]
  10. Li, W.; Zhang, J.; Shen, T.; Jones, G.A.; Grundy, P.J. Magnetic nanowires fabricated by anodic aluminum oxide template—a brief review. Sci. China Phys. Mech. Astron. 2011, 54, 1181–1189. [Google Scholar] [CrossRef]
  11. Kac, M.; Zarzycki, A.; Kac, S.; Kopec, M.; Perzanowski, M.; Dutkiewicz, E.M.; Suchanek, K.; Maximenko, A.; Marszalek, M. Effect of the template-assisted electrodeposition parameters on the structure and magnetic properties of Co nanowire arrays. Mater. Sci. Eng. B 2016, 211, 75–84. [Google Scholar] [CrossRef]
  12. Sellmyer, D.; Zheng, M.; Skomski, R. Magnetism of Fe, Co and Ni nanowires in self-assembledarrays. J. Phys. Condens. Matter 2001, 13, R433. [Google Scholar] [CrossRef]
  13. Rousse, C.; Fricoteaux, P. Electrodeposition of thin films and nanowires Ni–Fe alloys, study of their magnetic susceptibility. J. Mater. Sci. 2011, 46, 6046–6053. [Google Scholar] [CrossRef]
  14. Schönenberger, C.; Van der Zande, B.; Fokkink, L.; Henny, M.; Schmid, C.; Krüger, M.; Bachtold, A.; Huber, R.; Birk, H.; Staufer, U. Template synthesis of nanowires in porous polycarbonate membranes: Electrochemistry and morphology. J. Phys. Chem. B 1997, 101, 5497–5505. [Google Scholar] [CrossRef]
  15. Ersching, K.; Isoppo, E.; Tumelero, M.; Viegas, A.; Pasa, A. Uniformity and homogeneity of FeXNi100- X nanowires electrodeposited in nanoporous alumina. J. Phys. Chem. Solids 2017, 104, 124–132. [Google Scholar] [CrossRef]
  16. Llavona, Á.; Pérez, L.; Sánchez, M.C.; de Manuel, V. Enhancement of anomalous codeposition in the synthesis of Fe–Ni alloys in nanopores. Electrochim. Acta 2013, 106, 392–397. [Google Scholar] [CrossRef]
  17. Ott, F.; Maurer, T.; Chaboussant, G.; Soumare, Y.; Piquemal, J.Y.; Viau, G. Effects of the shape of elongated magnetic particles on the coercive field. J. Appl. Phys. 2009, 105, 013915. [Google Scholar] [CrossRef]
  18. Arzuza, L.; López-Ruiz, R.; Salazar-Aravena, D.; Knobel, M.; Beron, F.; Pirota, K.R. Domain wall propagation tuning in magnetic nanowires through geometric modulation. J. Magn. Magn. Mater. 2017, 432, 309–317. [Google Scholar] [CrossRef]
  19. Pereira, A.; Sáez, G.; Saavedra, E.; Escrig, J. Tunable magnetic properties of interconnected permalloy nanowire networks. Nanomaterials 2023, 13, 1971. [Google Scholar] [CrossRef]
  20. Ivanov, Y.P.; Chubykalo-Fesenko, O. Micromagnetic simulations of cylindrical magnetic nanowires. In Magnetic Nano- and Microwires; Woodhead Publishing: London, UK, 2015; pp. 423–448. [Google Scholar]
  21. Proenca, M.P.; Rial, J.; Araujo, J.P.; Sousa, C.T. Magnetic reversal modes in cylindrical nanostructures: From disks to wires. Sci. Rep. 2021, 11, 10100. [Google Scholar] [CrossRef]
  22. Nykiel, A.; Zarzycki, A.; Maziarz, W.; Ghanbaja, J.; Walcarius, A.; Kac, M. The evolution of magnetic behavior in FeCoNi nanowires with different geometry. Mater. Sci. Eng. B 2025, 322, 118645. [Google Scholar] [CrossRef]
  23. Dubitskiy, I.; Elmekawy, A.; Iashina, E.; Sotnichuk, S.; Napolskii, K.; Menzel, D.; Mistonov, A. Effect of interactions and non-uniform magnetic states on the magnetization reversal of iron nanowire arrays. J. Supercond. Nov. Magn. 2021, 34, 539–549. [Google Scholar] [CrossRef]
  24. Brogan, L.J.; Stacy, A.M. Sparse nanowire arrays for facile transport measurements. Mater. Lett. 2010, 64, 1674–1676. [Google Scholar] [CrossRef]
  25. Vansteenkiste, A.; Leliaert, J.; Dvornik, M.; Helsen, M.; Garcia-Sanchez, F.; Van Waeyenberge, B. The design and verification of MuMax3. AIP Adv. 2014, 4, 107133. [Google Scholar] [CrossRef]
  26. Abo, G.S.; Hong, Y.K.; Park, J.; Lee, J.; Lee, W.; Choi, B.C. Definition of magnetic exchange length. IEEE Trans. Magn. 2013, 49, 4937–4939. [Google Scholar] [CrossRef]
  27. Zighem, F.; Mercone, S. Magnetization reversal behavior in complex shaped Co nanowires: A nanomagnet morphology optimization. J. Appl. Phys. 2014, 116, 193904. [Google Scholar] [CrossRef]
  28. Fernández-Roldán, J.A.; Ivanov, Y.P.; Chubykalo-Fesenko, O. Micromagnetic modeling of magnetic domain walls and domains in cylindrical nanowires. In Magnetic Nano-and Microwires; Elsevier: Amsterdam, The Netherlands, 2020; pp. 403–426. [Google Scholar]
  29. Durhuus, F.L.; Fogh, E.; Jauho, T.; Beleggia, M. Demagnetization factors and field of hemispherical objects. J. Magn. Magn. Mater. 2025, 626, 173047. [Google Scholar] [CrossRef]
  30. Zighem, F.; Maurer, T.; Ott, F.; Chaboussant, G. Dipolar interactions in arrays of ferromagnetic nanowires: A micromagnetic study. J. Appl. Phys. 2011, 109, 013910. [Google Scholar] [CrossRef]
  31. Kartopu, G.; Yalçın, O.; Es-Souni, M.; Başaran, A. Magnetization behavior of ordered and high density Co nanowire arrays with varying aspect ratio. J. Appl. Phys. 2008, 103, 093915. [Google Scholar] [CrossRef]
  32. David, C.; Kappel, W.; Pătroi, E.A.; Manta, E.; Midoi, V. Micromagnetic study of iron nanowire arrays. Rev. Roum. Des Sci. Tech.—Sér. Électrotech. Énergétique 2022, 67, 9–13. [Google Scholar]
  33. Guslienko, K.Y. Magnetic vortex state stability, reversal and dynamics in restricted geometries. J. Nanosci. Nanotechnol. 2008, 8, 2745–2760. [Google Scholar] [CrossRef]
  34. Vavassori, P.; Zaluzec, N.; Metlushko, V.; Novosad, V.; Ilic, B.; Grimsditch, M. Magnetization reversal via single and double vortex states in submicron Permalloy ellipses. Phys. Rev. B 2004, 69, 214404. [Google Scholar] [CrossRef]
  35. Zhan, Q.F.; Gao, J.H.; Liang, Y.Q.; Di, N.L.; Cheng, Z.H. Dipolar interactions in arrays of iron nanowires studied by Mössbauer spectroscopy. Phys. Rev. B—Condens. Matter Mater. Phys. 2005, 72, 024428. [Google Scholar] [CrossRef]
  36. Ochoa, A.; Mejía-López, J.; Velasquez, E.A.; Mazo-Zuluaga, J. Finite-length Fe nanowire arrays: The effects of magnetic anisotropy energy, dipolar interaction and system size on their magnetic properties. J. Phys. D Appl. Phys. 2017, 50, 095003. [Google Scholar] [CrossRef]
  37. Clime, L.; Ciureanu, P.; Yelon, A. Magnetostatic interactions in dense nanowire arrays. J. Magn. Magn. Mater. 2006, 297, 60–70. [Google Scholar] [CrossRef]
  38. Kac, M.; Kopec, M.; Cieniek, L.; Zarzycki, A.; Kac, S.; Maximenko, A.; Dutkiewicz, E.; Marszalek, M. Influence of Cu layer thickness on morphology and magnetic properties of Co/Cu nanowires. Acta Phys. Pol. A 2018, 133, 302–305. [Google Scholar] [CrossRef]
Figure 1. The scanning electron microscope image of a top view of polycarbonate membrane (a), and polycarbonate membrane with nanowires, containing overdeposited caps (b). The inset of (b) shows the lateral view of individual nanowires with overdeposition caps.
Condensedmatter 10 00057 g001
Figure 2. Schemes of investigated nanostructures used in the calculations: individual nanowire and its array with distribution as in PC membrane (a), individual nanowire with overdeposition cap and its array (b), and array of nanowires with partially connected overdeposition caps (c).
Condensedmatter 10 00057 g002
Figure 3. Simulated hysteresis loops (external field applied along the z-axis, i.e., (Bext = Bz z ^ ) for an individual nanowire with and without overdeposition cap, along with magnetization distribution images during the magnetization reversal process.
Condensedmatter 10 00057 g003
Figure 4. Profile of the demagnetizing field z-component along the nanowire length for an individual nanowire with and without an overdeposition cap and the demagnetizing field distribution inside and outside of such NWs. The profiles and maps shown as a cross-section through the length of the nanowire after applying a saturating field along the z-axis, i.e., (Bext = Bz z ^ ). The color changes with the direction of the demagnetizing field lines, shown by the arrows.
Condensedmatter 10 00057 g004
Figure 5. Hysteresis curves for the array of nanowires with and without overdeposition, calculated for the field applied along the NWs long axis (i.e., along the z-axis) (a) and perpendicular to it (i.e., along the x-axis) (b).
Condensedmatter 10 00057 g005
Figure 6. Magnetization maps of nanowire arrays with and without overdeposition during the selected stages of magnetization reversal process.
Condensedmatter 10 00057 g006
Figure 7. Profile of the z-component of the demagnetizing field for a selected nanowire of the studied arrays ( B d e m a g z shown along the nanowire length) after applying a saturating field along the z-axis, i.e., (Bext = Bz z ^ ). The inset shows the position of such NW within the array.
Condensedmatter 10 00057 g007
Figure 8. The demagnetizing field distribution inside and outside of two selected nanowires from the studied arrays: for the case of an array without OD (a), an array with OD caps ( d c a p = 200 nm) (b), and an array with connected OD caps ( d c a p = 400 nm) (c). The inset shows the position of such NWs within the array.
Condensedmatter 10 00057 g008
Figure 9. The summary of simulation results obtained from magnetization-field dependence (a) and demagnetizing field distribution (b) calculations. Here, μ 0 Hc is the coercive field value, Squareness is the ratio of remanent magnetization to saturation magnetization, μ 0 Hsat is the saturation field (magnetic field value at which material is fully magnetized, M = M s ), B d e m a g z is the value of z-component of the demagnetizing field, B d e m a g x is the value of x-component of the demagnetizing field and Eint is the value of interaction (magnetostatic) energy obtained after applying saturating field along the z- axis.
Condensedmatter 10 00057 g009
Disclaimer/Publisher’s Note: The statements, opinions and data contained in all publications are solely those of the individual author(s) and contributor(s) and not of MDPI and/or the editor(s). MDPI and/or the editor(s) disclaim responsibility for any injury to people or property resulting from any ideas, methods, instructions or products referred to in the content.