Article

High-Performance Natural Dye-Sensitized Solar Cells Employing a New Semiconductor: Gd2Ru2O7 Pyrochlore Oxide

1
LPMC, University of Picardie Jules Verne, 33 rue Saint Leu, 80039 Amiens, CEDEX 01, France
2
UFR SSMT, Lab-Tech, Université Félix-Houphouët-Boigny, 01 BPV 34 Abidjan 01, Côte d’Ivoire
3
LPMO, Research Institute for Materials Science and Engineering, University of Mons, Place du Parc, 20, B7000 Mons, Belgium
4
UCCS, Unité de Catalyse et Chimie du Solide, CNRS, Centrale Lille, Université d’ArtoisUniversité de Lille, UMR 8181, 62300 Lens, France
*
Authors to whom correspondence should be addressed.
Condens. Matter 2025, 10(3), 38; https://doi.org/10.3390/condmat10030038 (registering DOI)
Submission received: 5 May 2025 / Revised: 27 June 2025 / Accepted: 5 July 2025 / Published: 14 July 2025

Abstract

We investigated a novel natural dye-sensitized solar cell (DSSC) utilizing gadolinium ruthenate pyrochlore oxide Gd2Ru2O7 (GRO) as a photoanode and compared its performance to the TiO2-Gd2Ru2O7 (TGRO) combined-layer configuration. The films were fabricated using the spin-coating technique, resulting in spherical grains with an estimated mean diameter of 0.2 µm, as observed via scanning electron microscopy (SEM). This innovative photoactive gadolinium ruthenate pyrochlore oxide demonstrated strong absorption in the visible range and excellent dye adhesion after just one hour of exposure to natural dye. X-ray diffraction confirmed the presence of the pyrochlore phase, where Raman spectroscopy identified various vibration modes characteristic of the pyrochlore structure. Incorporating Gd2Ru2O7 as the photoanode significantly enhanced the overall efficiency of the DSSCs. The device configuration FTO/compact-layer/Gd2Ru2O7/Hibiscus-sabdariffa/electrolyte(I/I3)/Pt achieved a high efficiency of 9.65%, an open-circuit voltage (Voc) of approximately 3.82 V, and a current density of 4.35 mA/cm2 for an active surface area of 0.38 cm2. A mesoporous TiO2-based DSSC was fabricated under the same conditions for comparison. Using impedance spectroscopy and cyclic voltammetry measurements, we provided evidence of the mechanism of conductivity and the charge carrier’s contribution or defect contributions in the DSSC cells to explain the obtained Voc value. Through cyclic voltammetry measurements, we highlight the redox activities of hibiscus dye and electrolyte (I/I3), which confirmed electrochemical processes in addition to a photovoltaic response. The high and unusual obtained Voc value was also attributed to the presence in the photoanode of active dipoles, the layer thickness, dye concentration, and the nature of the electrolyte.

1. Introduction

Emerging third-generation solar cell technology has been growing rapidly due to its low cost, resulting from the abundance of materials and the simplicity of the manufacturing process. Highly photoactive materials are crucial for dye-sensitized solar cells (DSSCs), particularly those integrating lanthanide ions in photoanode structures for photovoltaic (PV) technology [1]. The wide absorption range and homogeneous distribution of lanthanide dopants enhance the properties of these new materials. These upconversion materials can be combined with quantum dots or plasmonic particles to improve upconversion efficiency [2]. High-performance DSSCs based on rare-earth-doped perovskite metals, such as BiFeO3 (BFO) doped with Nd, Gd, and Pr, have been successfully synthesized with natural sensitizers by Khan et al. [3]. The efficiency of these fabricated DSSCs is significantly higher compared to undoped BFO-based DSSCs, showing an increase from 0.84% to 2.15%. Factors contributing to the improvement in DSSC efficiency include the fabrication technique, photoanode structure, and materials used [4]. Nien et al. [5] developed new photoanodes based on Fe2O3 nanoparticles on TiO2 nanofibers using the spin-coating technique, achieving an efficiency of 5.13% with the metal N719 dye. Additionally, an alkaline hydrothermal method in NaOH solution produced different TiO2 structures, resulting in a hierarchical flower-like structure of TiO2 on Ti wires, which yielded 1.98% efficiency in DSSC devices [6]. Integrating BaSnO3 thin films as photoanodes, with N719 dye, yielded an efficiency of 3.9% [7]. Aguilar et al. reported that replacing TiO2 anatase with a mixture of rutile TiO2 and pyrochlore Tm2Ti2O7 increased efficiency from 2.32% to 3.16% in the presence of the metallic dyes N3 and Ru535 [8]. These studies highlight the significant role of inorganic perovskite and pyrochlore oxide structures in achieving stable and efficient DSSCs.
In contrast to these previous studies, which relied on metallic dyes, our study employs natural dyes. This choice is driven by ecological considerations and the desire to develop low-cost, environmentally friendly DSSCs accessible to a wider range of users. We also chose Gd2Ru2O7 as a photoanode material because of its light absorption over a broad visible spectrum and its promising optoelectronic properties, which should help to improve photovoltaic performance when coupled with natural dyes. Gadolinium ruthenate pyrochlore oxides (Gd2Ru2O7) have intriguing optoelectronic properties as electrode materials, being stable mixed electronic and ionic semiconductors [9,10,11]. These new pyrochlore oxide semiconductors are likely to enhance DSSC performance [12,13].
In this study, we developed dye-sensitized solar cells based on a new Gd2Ru2O7 (GRO) photoanode material and a TiO2-Gd2Ru2O7 (TGRO) combined material. These planar n-i-p devices, composed of FTO/(compact layer)/(GRO or TGRO)/(Hibiscus sabdariffa)/electrolyte (I/I3)/Pt, demonstrated exceptional results. The optical properties of different photoanodes showed strong absorption in the visible range, highlighting their potential as superior photoanodes. Scanning electron microscopy (SEM) analysis revealed cylindrical and spherical grain shapes across the entire surface of mesoporous TiO2 nanoparticles [14]. The particle sizes of TiO2 and GRO were approximately 150 nm and 200 nm, respectively, based on SEM and atomic force microscopy (AFM) measurements. Raman spectroscopy confirmed various vibrational modes, indicating an anatase phase structure for TiO2 and the gadolinium ruthenate pyrochlore oxide structure for GRO.

2. Experimental Conditions

2.1. Chemical Coumpounds and Apparatus

Acetic acid (purchased from Thermo scientific, Illkirch, France, 99.7%, ACS reagent), hydrochloric acid (HCl) (Alfa Aesar 36% w/w aq), methanol (Thermo scientific 99%, extra pure), Ethylene glycol (Alfa Aesar, 99%, A11591 LOT: 61800798), acetonitrile (from HPLC, Fisher Chemical™, Pittsburgh, PA, USA), potassium iodide (Merck, KI-ACS reagent, ≥99.0%) and diiodine (Merck, I2 anhydrous) crystal, titanium isopropoxide solution (Aldrich-Merk (99.99% purity), Darmstadt, Germany and anhydrous N,N-dimethylformamide (DMF: 99.8%, Sigma-Aldrich, St. Louis, MO 63103, USA) reagents were used for the sample preparation. Sonicator (UP50H, Hielscher Ultrasound Technology, D-14513 Teltow, Germany) apparatus was used for the solution homogenization, with glass substrate coated with fluorine-doped tin oxide (FTO) (TEC 13, Merck-Aldrich) used as the substrate. The coatings were applied using a spin coater (Model WS-650MZ-23NPPB, Laurell Technologies corporation, Lansdale, PA 19446-3840, USA). The symmetry phases of the semiconductor were confirmed using an X-ray diffraction (XRD, Bruker D4, Ettlingen, Germany) under CuKα wavelength radiation (λ = 1.5406 Å). Raman vibration modes were identified using a RENISHAW inVia Raman spectroscope (Renishaw UK Sales Ltd., Gloucestershire, UK) with a laser wavelength λ = 532 nm. The morphology of the grains was assessed using Scanning Electron Microscopy (SEM, FEI Quanta 200 FEG, FEI, Hillsboro, OR, USA) equipped with an energy dispersive X-ray (EDX, X-Max 80, Oxford Instruments Co., Abingdon, UK) system, allowing for the simultaneous determination of the chemical composition of the material. The ellipsometric response of the samples (Y and D) was measured using an EP3-SE imaging ellipsometer (Park System, Accurion, Germany). Atomic Force Microscopy (AFM, MultiMode 8-HR, Bruker, Karlsruhe, Germany) was used to complete the size observations. Optical measurements were performed using a JASCO V-670 spectrophotometer. The PV devices were illuminated by a solar simulator (Ossila solar simulator Model No: G2009A1). The current–voltage (I–V) characteristics were obtained using a KEITHLEY SourceMeter 2602 B (Tektronix/Keithley, Cleveland, OH, USA), controlled by a program written under MATLAB software version R2014b (win64), (MathWorks, Natick, MA 01760-2098, USA). Gd2Ru2O7 powder was obtained from gadolinium (III) oxide (Gd2O3, purity 99.99%, Sigma-Aldrich) and ruthenium (IV) oxide (RuO2, purity 99.99%, Sigma-Aldrich) by the solid-state reaction technique [11].

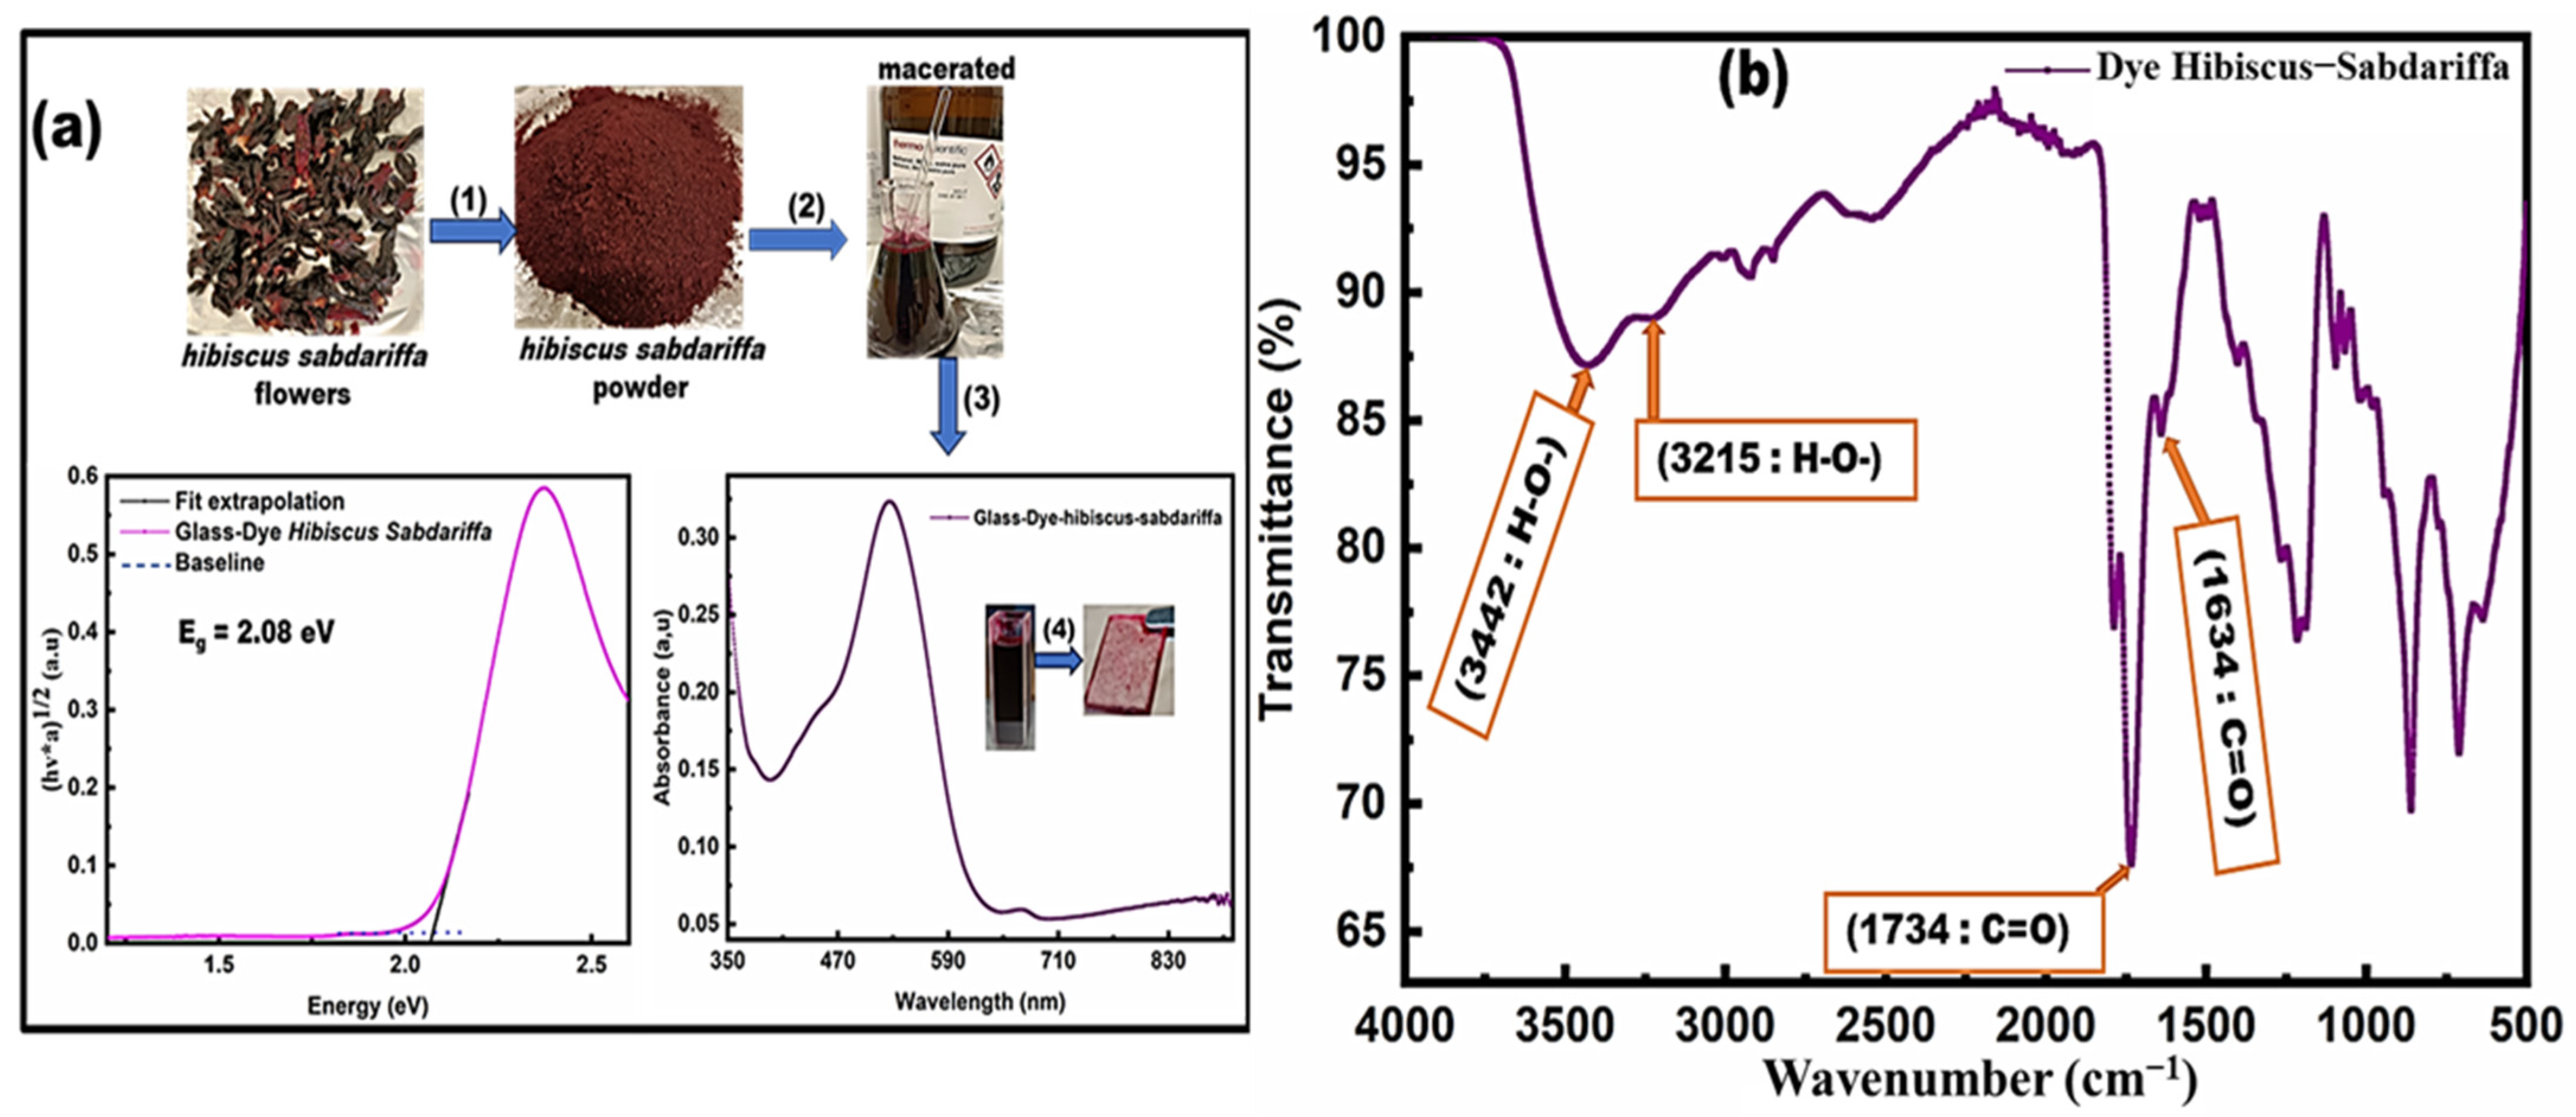
2.2. Sample Growth and Analysis

(a) Compact TiO2 based Layer
A solution containing 200 µL titanium isopropoxide and 10 mL ethanol was stirred magnetically at 1000 rpm for 2 h. Then, 5 µL of acetic acid was added dropwise to the solution, which was magnetically stirred for 6 h. This method of preparation was found from the literature [15,16], but substantial modifications were made to obtain the expected result. Finally, a clear precursor was obtained after this preparation process. The substrates were ultrasonically cleaned in distilled water, ethanol, and then in acetone for 15 min for each solvent. Before each deposition, the substrate was passed under nitrogen flow, in order to obtain good-quality deposited films. Dynamic deposition on glass-FTO substrates was carried out with a rotation speed of 1000 rpm and a deposition time of 10 s, followed by a further 2500 rpm, with a deposition time of 30 s. Final densification was achieved after annealing at 430 °C for 30 min in a muffle furnace at an increasing heating rate of 3 °C/min.
(b) Mesoporous TiO2 based layer
The powders were prepared using the sol–gel technique. Firstly, 50 µL of HCL was dissolved in 5 mL of 2-propanol; then, 700 µL of titanium isopropoxide was added dropwise while solution was magnetically stirring [15]. Next, a 2:1 ratio of 2-propanol and distilled water was added to the solution to reach 80 mL. Finally, the solution was magnetically stirred for 12 h. The solvents in the gelled solution were completely evaporated in an oven at 90 °C for 12 h. The powder obtained was ground in an agate mortar for several hours. Progressive heat treatment (500 °C for 2 h) yielded an anatase TiO2 powder, which was confirmed by X-ray diffraction (XRD). Figure 1 shows the XRD pattern of TiO2 powder, with 87% anatase phase and 13% rutile phase. The anatase phase structure exhibited the main peaks at 25.34, 37.79, 48.00, 53.86, 55.05, and 62.6°, corresponding to the (1 0 1), (0 0 4), (2 0 0), (1 0 5), (2 1 1) and (2 0 4) planes, respectively. In addition, the rutile phase structure peaks observable at 27.49, 36.01, 41.20 and 56.67° correspond to the (110), (101), (111) and (220) planes, respectively [17,18].
This powder was then dispersed in methanol using an 80% amplitude and sonicator cycle 1. Various layers were deposited by centrifugation with the following deposition parameters. Step 01/02: spinning fixed at 1000 rpm for 10 s with an acceleration speed of 600; and step 02/02: spinning fixed at 2500 rpm for 30 s at an acceleration speed of 1200, followed by subsequent annealing at 430 °C for 30 min.
(c) Synthesis of Gd2Ru2O7 and TiO2-Gd2Ru2O7 layers
Thin films were fabricated using a spin-coating technique. Gd2Ru2O7 (GRO) powder was dispersed in DMF (10 mM) for 30 min, supported by a Sonicator shaker. Deposition parameters were set as above. The films were heat treated for 30 min at 250 °C with a ramp rate of 5°/min to densify the surface. The TiO2-Gd2Ru2O7 (TGRO) film was prepared by first depositing 4 layers of TiO2, followed by heat treatment at 430 °C for 30 min. Subsequently, 4 layers of GRO were deposited on the substrate, which had previously been coated with a compact layer of TiO2 and a mesoporous layer of TiO2.
(d) Extraction of natural dye
Figure 2a shows the dye extraction process from hibiscus (H) sabdariffa flowers. Dried hibiscus sabdariffa flowers were carefully washed with distilled water and dried in the shade {(1)}. They were ground to fine powder and then macerated in methanol for 24 h {(1)–(2)}. The dye obtained underwent no purification before use. Absorbance measurement had been performed on the dye deposited directly on virgin glass. A glass slide was immersed in the dye solution for 2 h and then removed, rinsed in ethanol and dried before the UV-visible analysis. A large absorption range was observed in the visible region around (710 nm) {(3)–(4)}. The red dye obtained has essential characteristic for our study, namely the presence of anthocyanin rings known for their resistance to temperature [19,20,21]. Furthermore, it has a high absorbance in the visible range, enabling it to capture more photons in our device. Figure 2b shows the Fourier Transform Infrared (FTIR) spectrum of the spectral range in the wave band 4000–500 cm−1 of dyes extracted from hibiscus sabdariffa. The strong and broad bands observed between 2500 and 3700 cm−1 are due to the -O-H groups. The peaks at 1634 cm−1 and 1734 cm−1 are assigned to C=O. The peak at 3441 cm−1 corresponds to the -O-H stretching vibration. The peak at 1406 cm−1 corresponds to the C-C stretching vibration in the aromatic group [22]. Overall, these functional groups correspond to those contained in the anthocyanin basic framework [23,24]. Hydroxyl groups from the dye enhance absorption in the photoanode, improving energy and electron transfer [25,26]. In Tauc’s diagram, a linear fit has been applied to the fundamental peak (fit extrapolation). In addition, a second linear fit has been applied to the left side at the bottom of the curve, corresponding to fundamental absorption. The intersection of the two fit lines gives the estimated bandgap energy at 2.08 eV [27].
(e) Electrolyte
Ethylene glycol, acetonitrile, potassium iodide (KI), and diiodine (I2) crystal were used to prepare the electrolyte solution. In a mixed solvent (1 mL ethylene glycol and 4 mL acetonitrile), 249 mg potassium iodide and 50.8 mg diiodine were dissolved. The solution was then magnetically stirred (1000 rpm for 3 h) without exposure to light. The electrolyte concentration was determined according to the literature [28], but other concentrations were tested in this case.

3. Results and Discussion

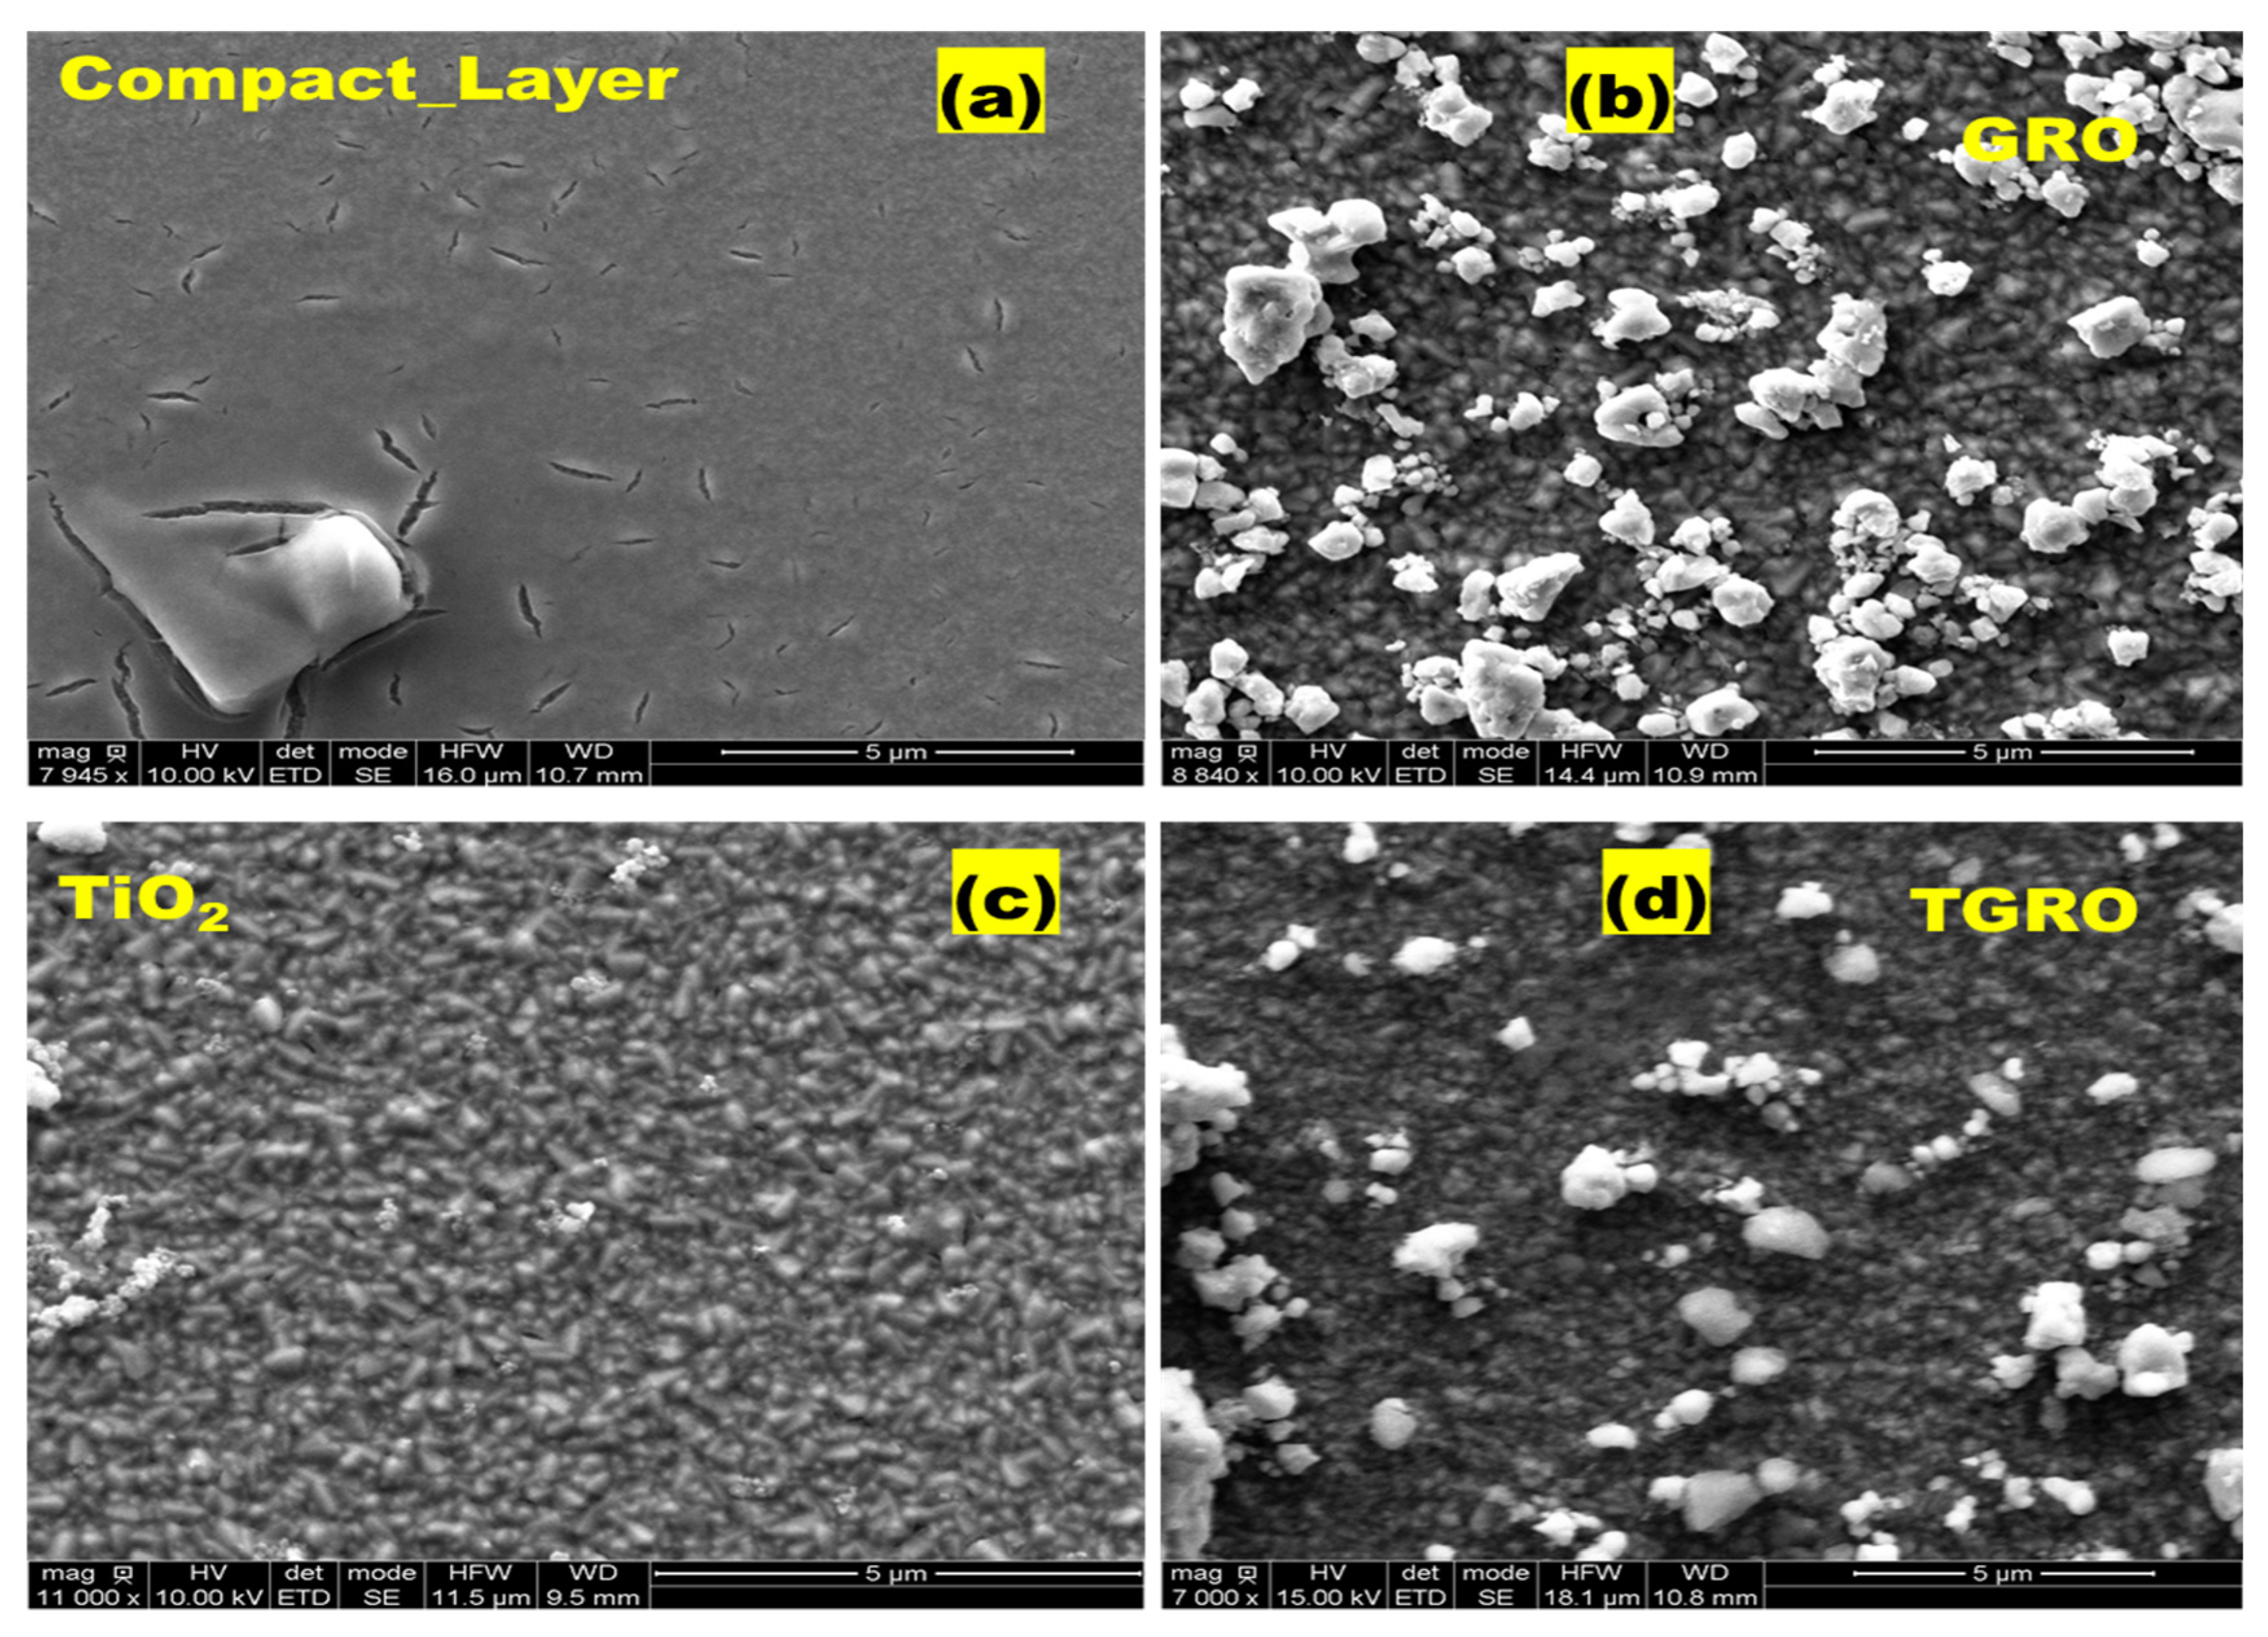
3.1. Structural Properties

SEM analysis was conducted to assess the grain size and surface morphology. In Figure 3, we present SEM images of the processed samples. Spherical GRO microparticles are visible, exhibiting non-uniform distribution across all TGRO and GRO (Figure 3b and Figure 3d, respectively) on the surface of TiO2 compact layer (Figure 3a). Additionally, cylindrical nanoparticles are observed for the mesoporous TiO2 morphology (Figure 3c). The SEM image of the mesoporous TiO2 reveals a combination of spherical grains with a diameter of 100 nm and cylindrical grains with an estimated height of 200 nm and width of 60 nm, facilitating maximum dye absorption.

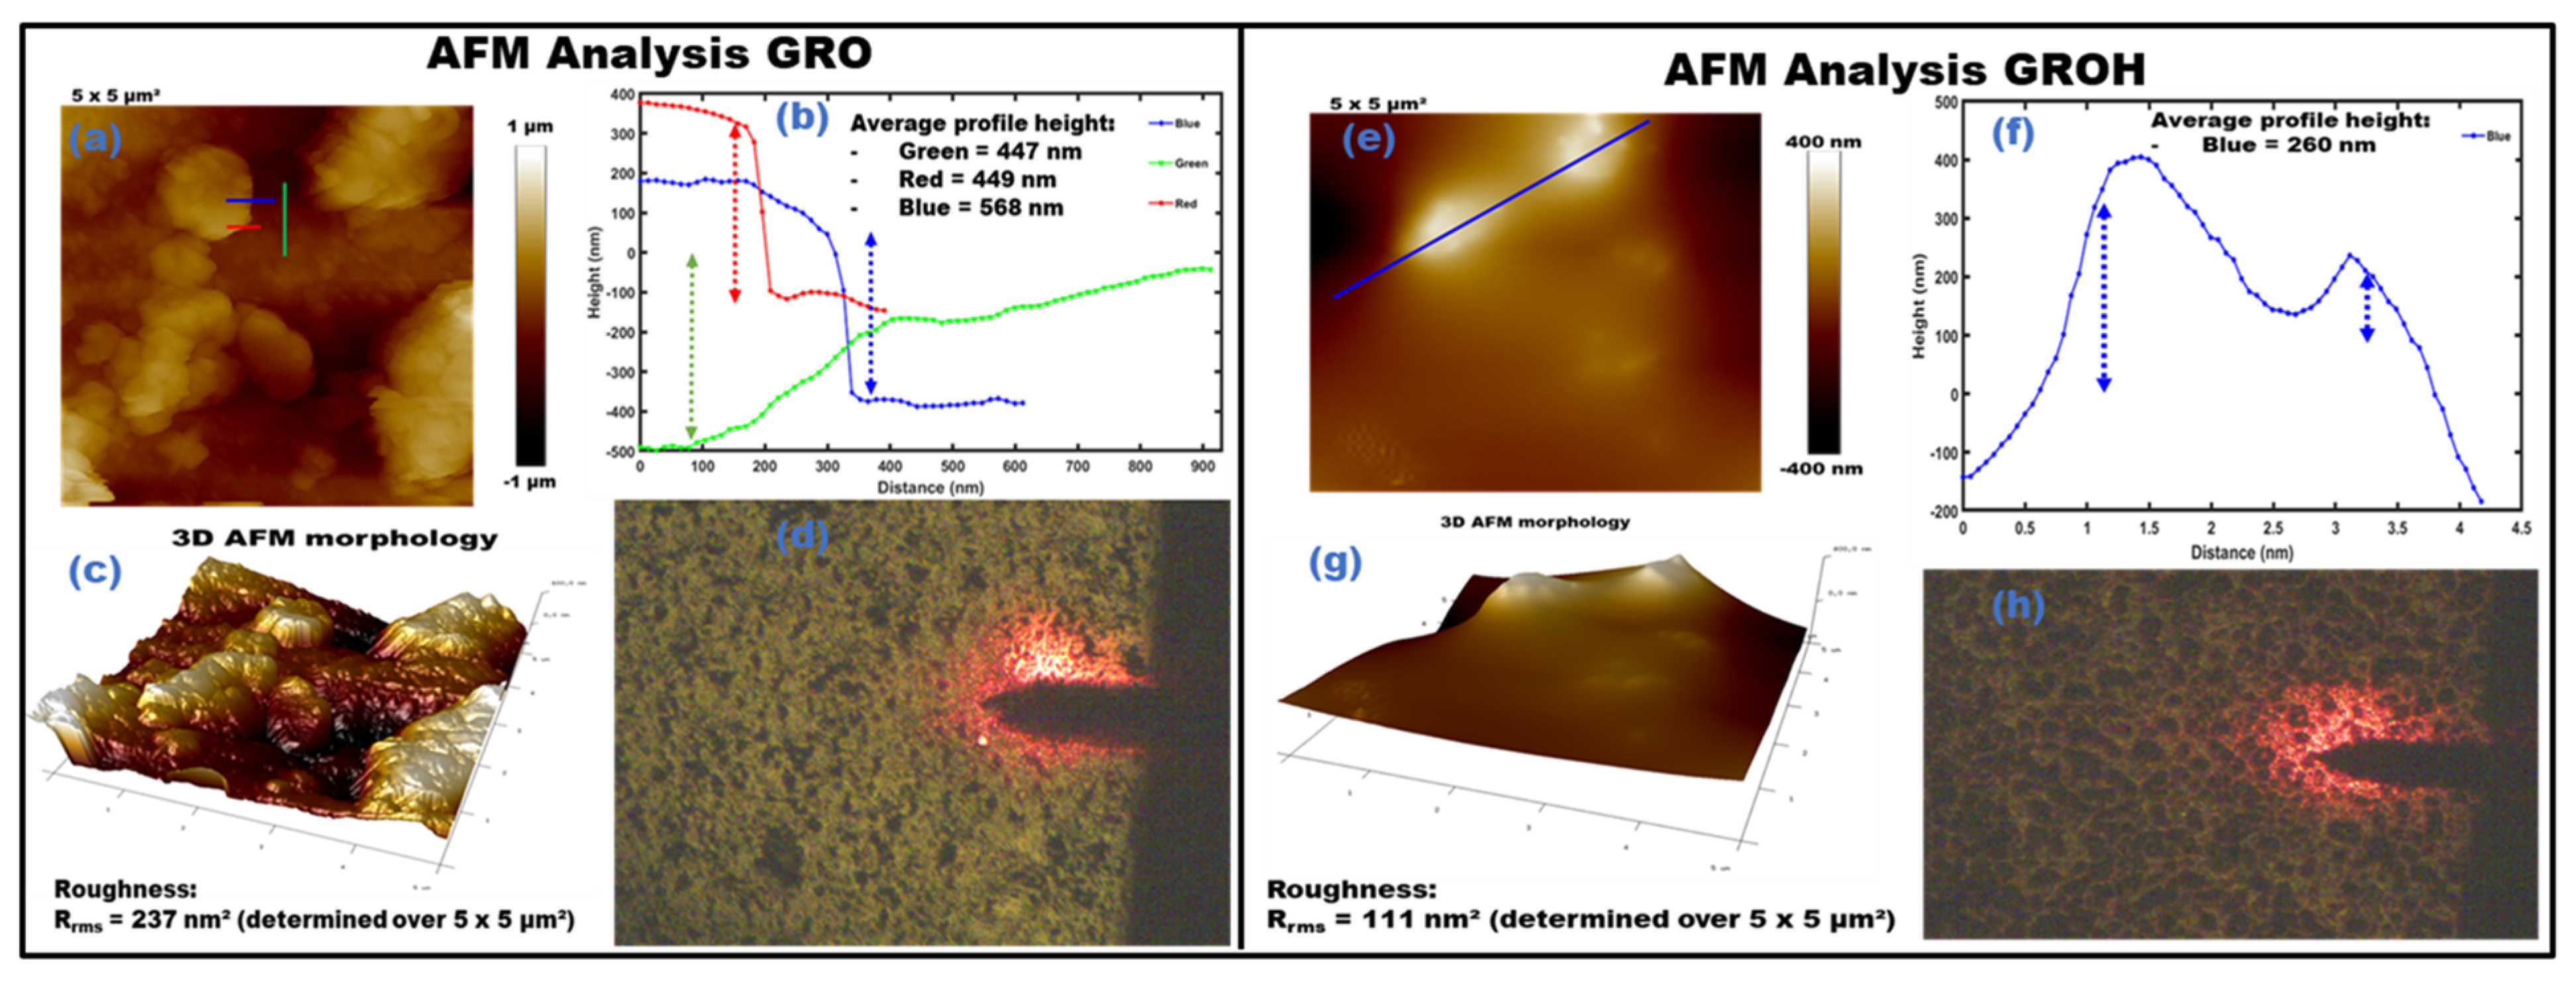
3.2. AFM Characterization

Surface morphology was studied locally by Tapping Mode Atomic Force Microscopy at room temperature. The surface morphology of the TiO2 compact layer is granular and very homogeneous, as shown in Figure 4. The roughness measured on 5 × 5 (µm)2 is 8.0 nm. These observations confirmed the SEM analysis on the TiO2 compact layer.
Figure 5a–e shows the surface topography of GRO (a–d) and GROH (e–h), respectively, separated by the black line. It should be noted that GROH is the GRO thin film after dye impregnation. A rough and porous surface is observed in GRO, as can be seen in the optical image in Figure 5d. However, this roughness is softened in the presence of dye, as shown in Figure 5h. The 5 × 5 (µm)2 area was scanned in both cases, confirming the thickness of the GRO layer obtained by profilometer measurements. The green profile curve in Figure 5b corresponds to the film surface at the compact layer level. The dark area represents the surface of the compact layer, as seen in Figure 5c,g. The green profile exhibits an estimated thickness of 447 nm (Figure 5b). The red profile determines the height of the aggregates relative to the surface (Figure 5b), demonstrating that the surface is covered with agglomerated nanostructures in some places. These grain agglomerations only show up in specific areas, not over the full swept area. Furthermore, when GRO was coated with dye (GROH), it was observed that the dye completely covers the grains, making it difficult to distinguish the aggregates, as shown in Figure 5e. The GROH optical morphology image (right side) shows a mesoporous wrapped surface (Figure 5h), which is likely to favor good diffusion of the redox electrolyte into the interstices. In the two cases, the value of the measured thicknesses is indicated directly in the figures. Electrolyte–dye interfaces can be observed in areas without aggregates. These observations confirm the formation of functionality of the new DSSC using natural dye (hibiscus sabdariffa). In both cases, we have presented the 3D profiles (Figure 5c,g) of the surfaces and the optical images, which highlight alveolus occupied by the hibiscus dye (Figure 5h). Figure 5b,f depict different the average profile heights, evaluating the grain sizes and thicknesses. The presence of these nanoparticles on the surface favors easy adhesion of the dye, which can improve absorption by increasing the efficiency of the solar cell devices.

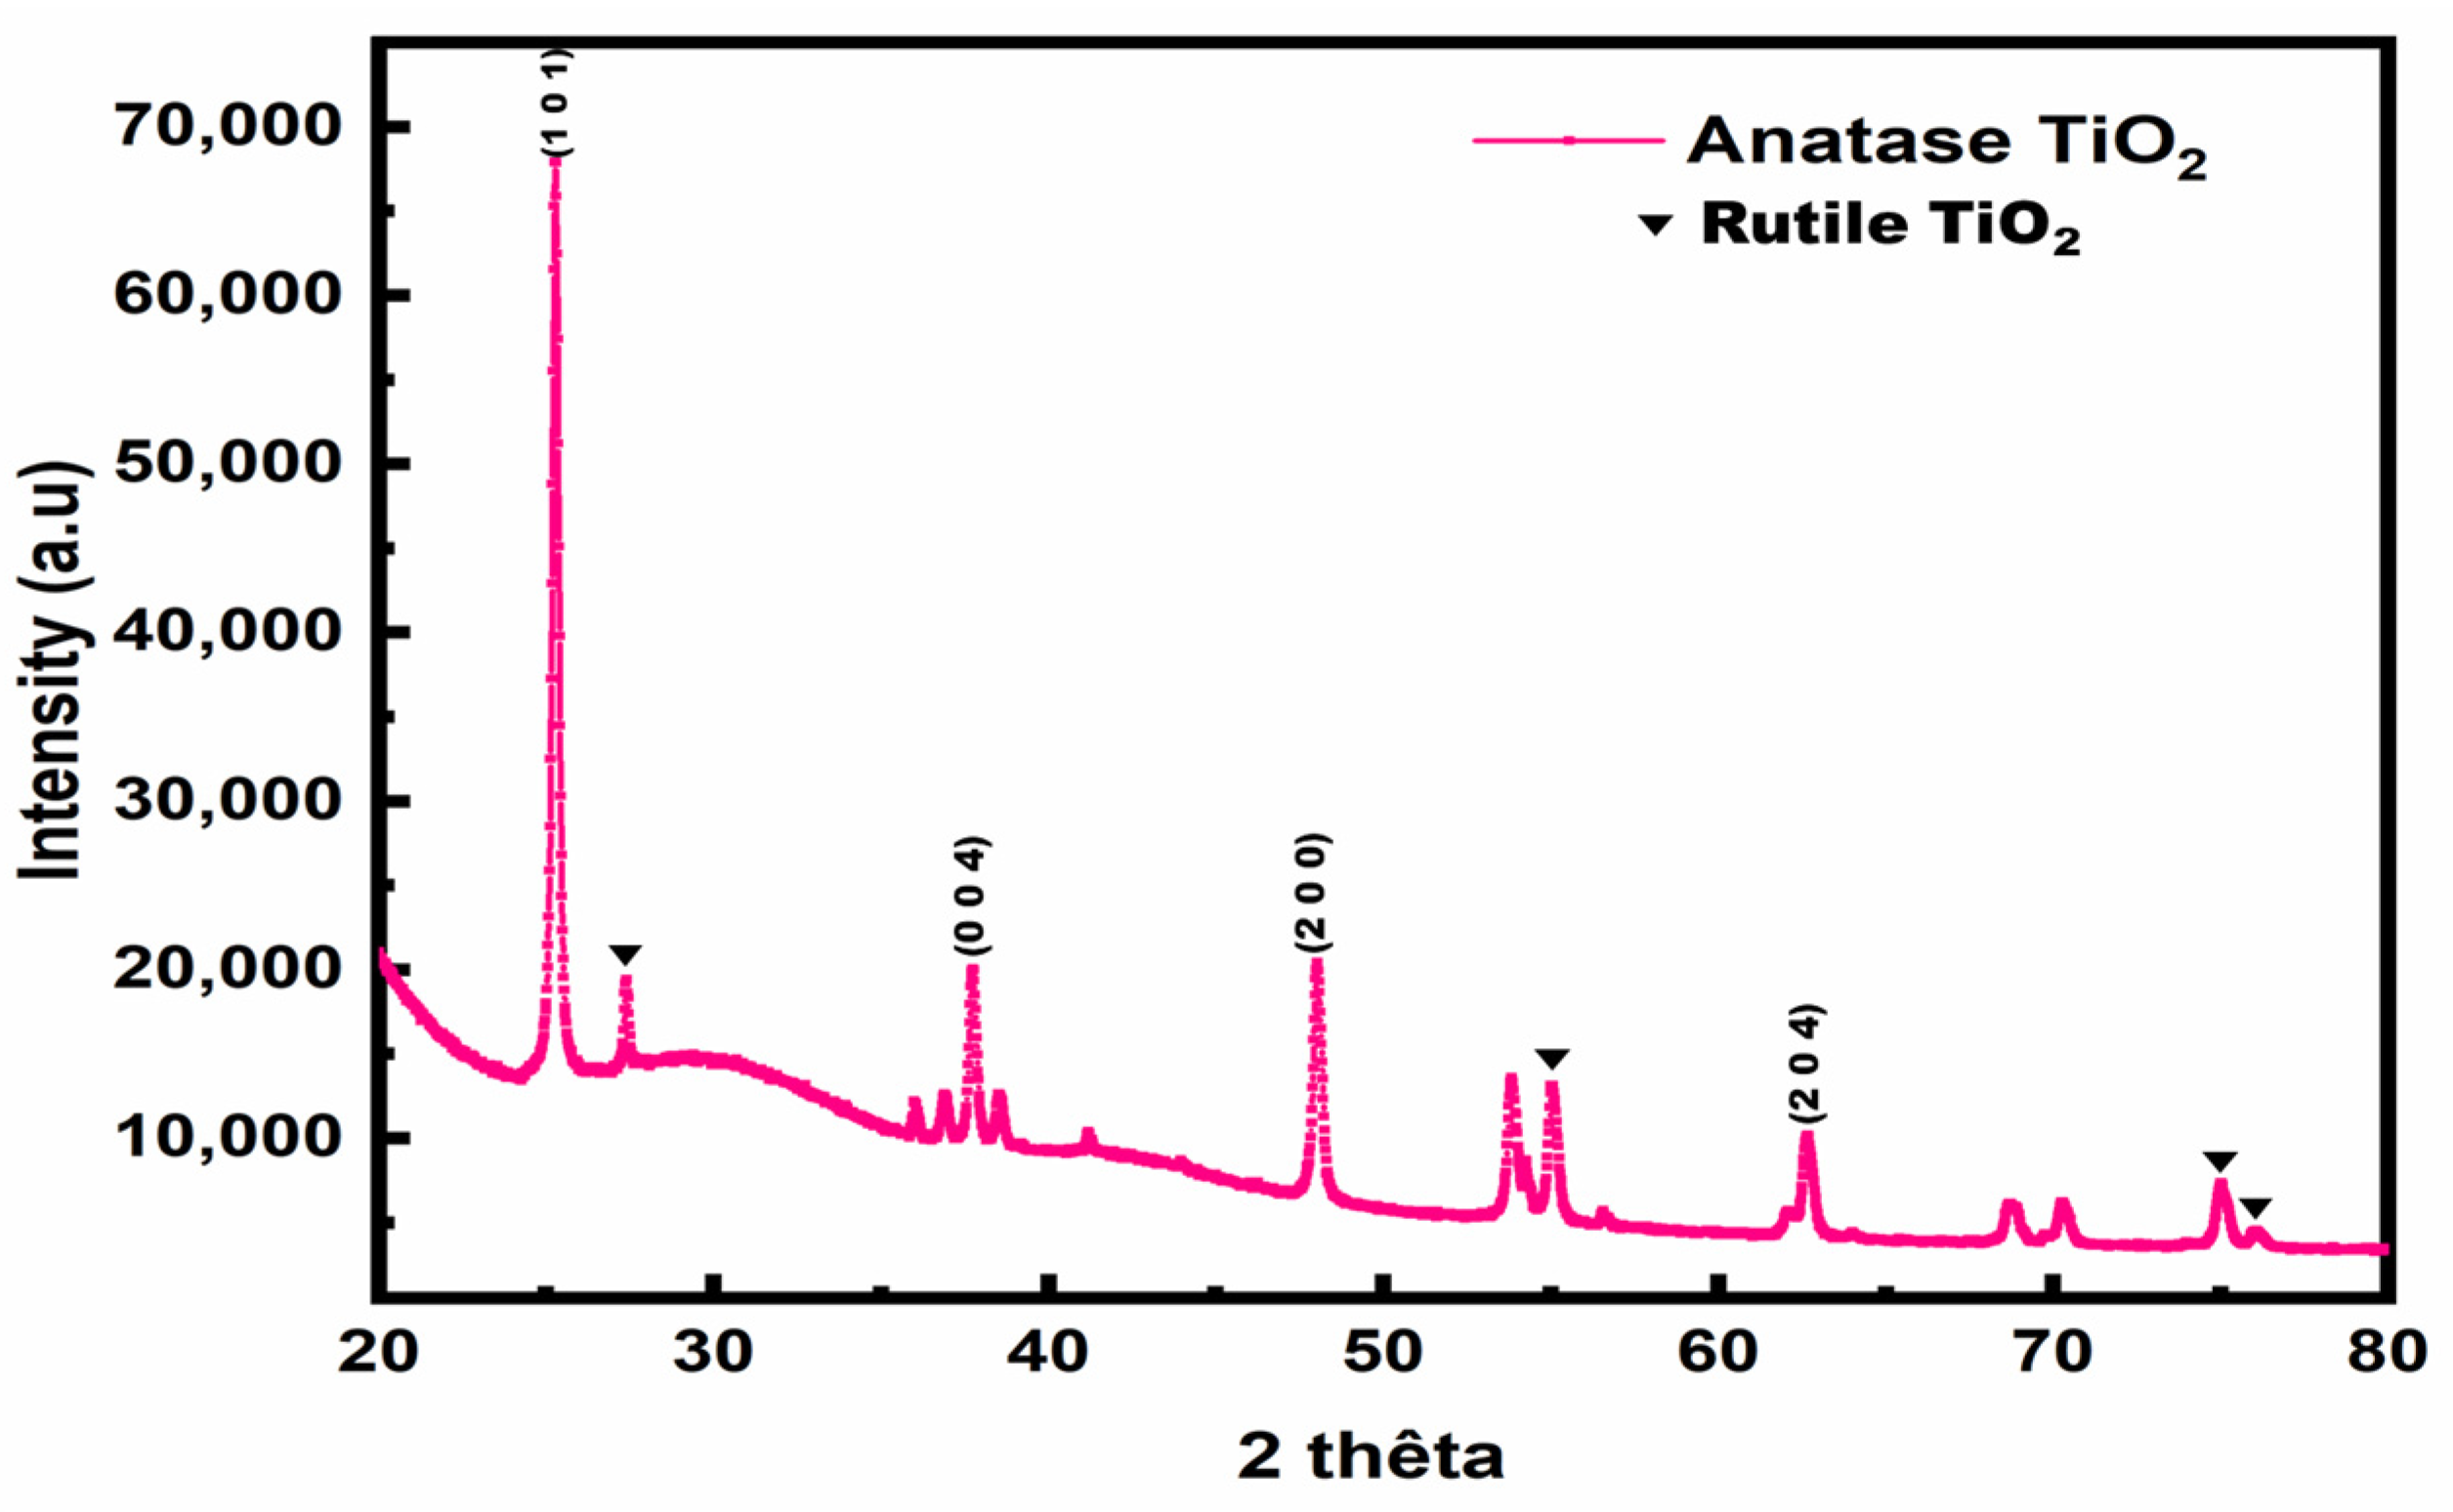
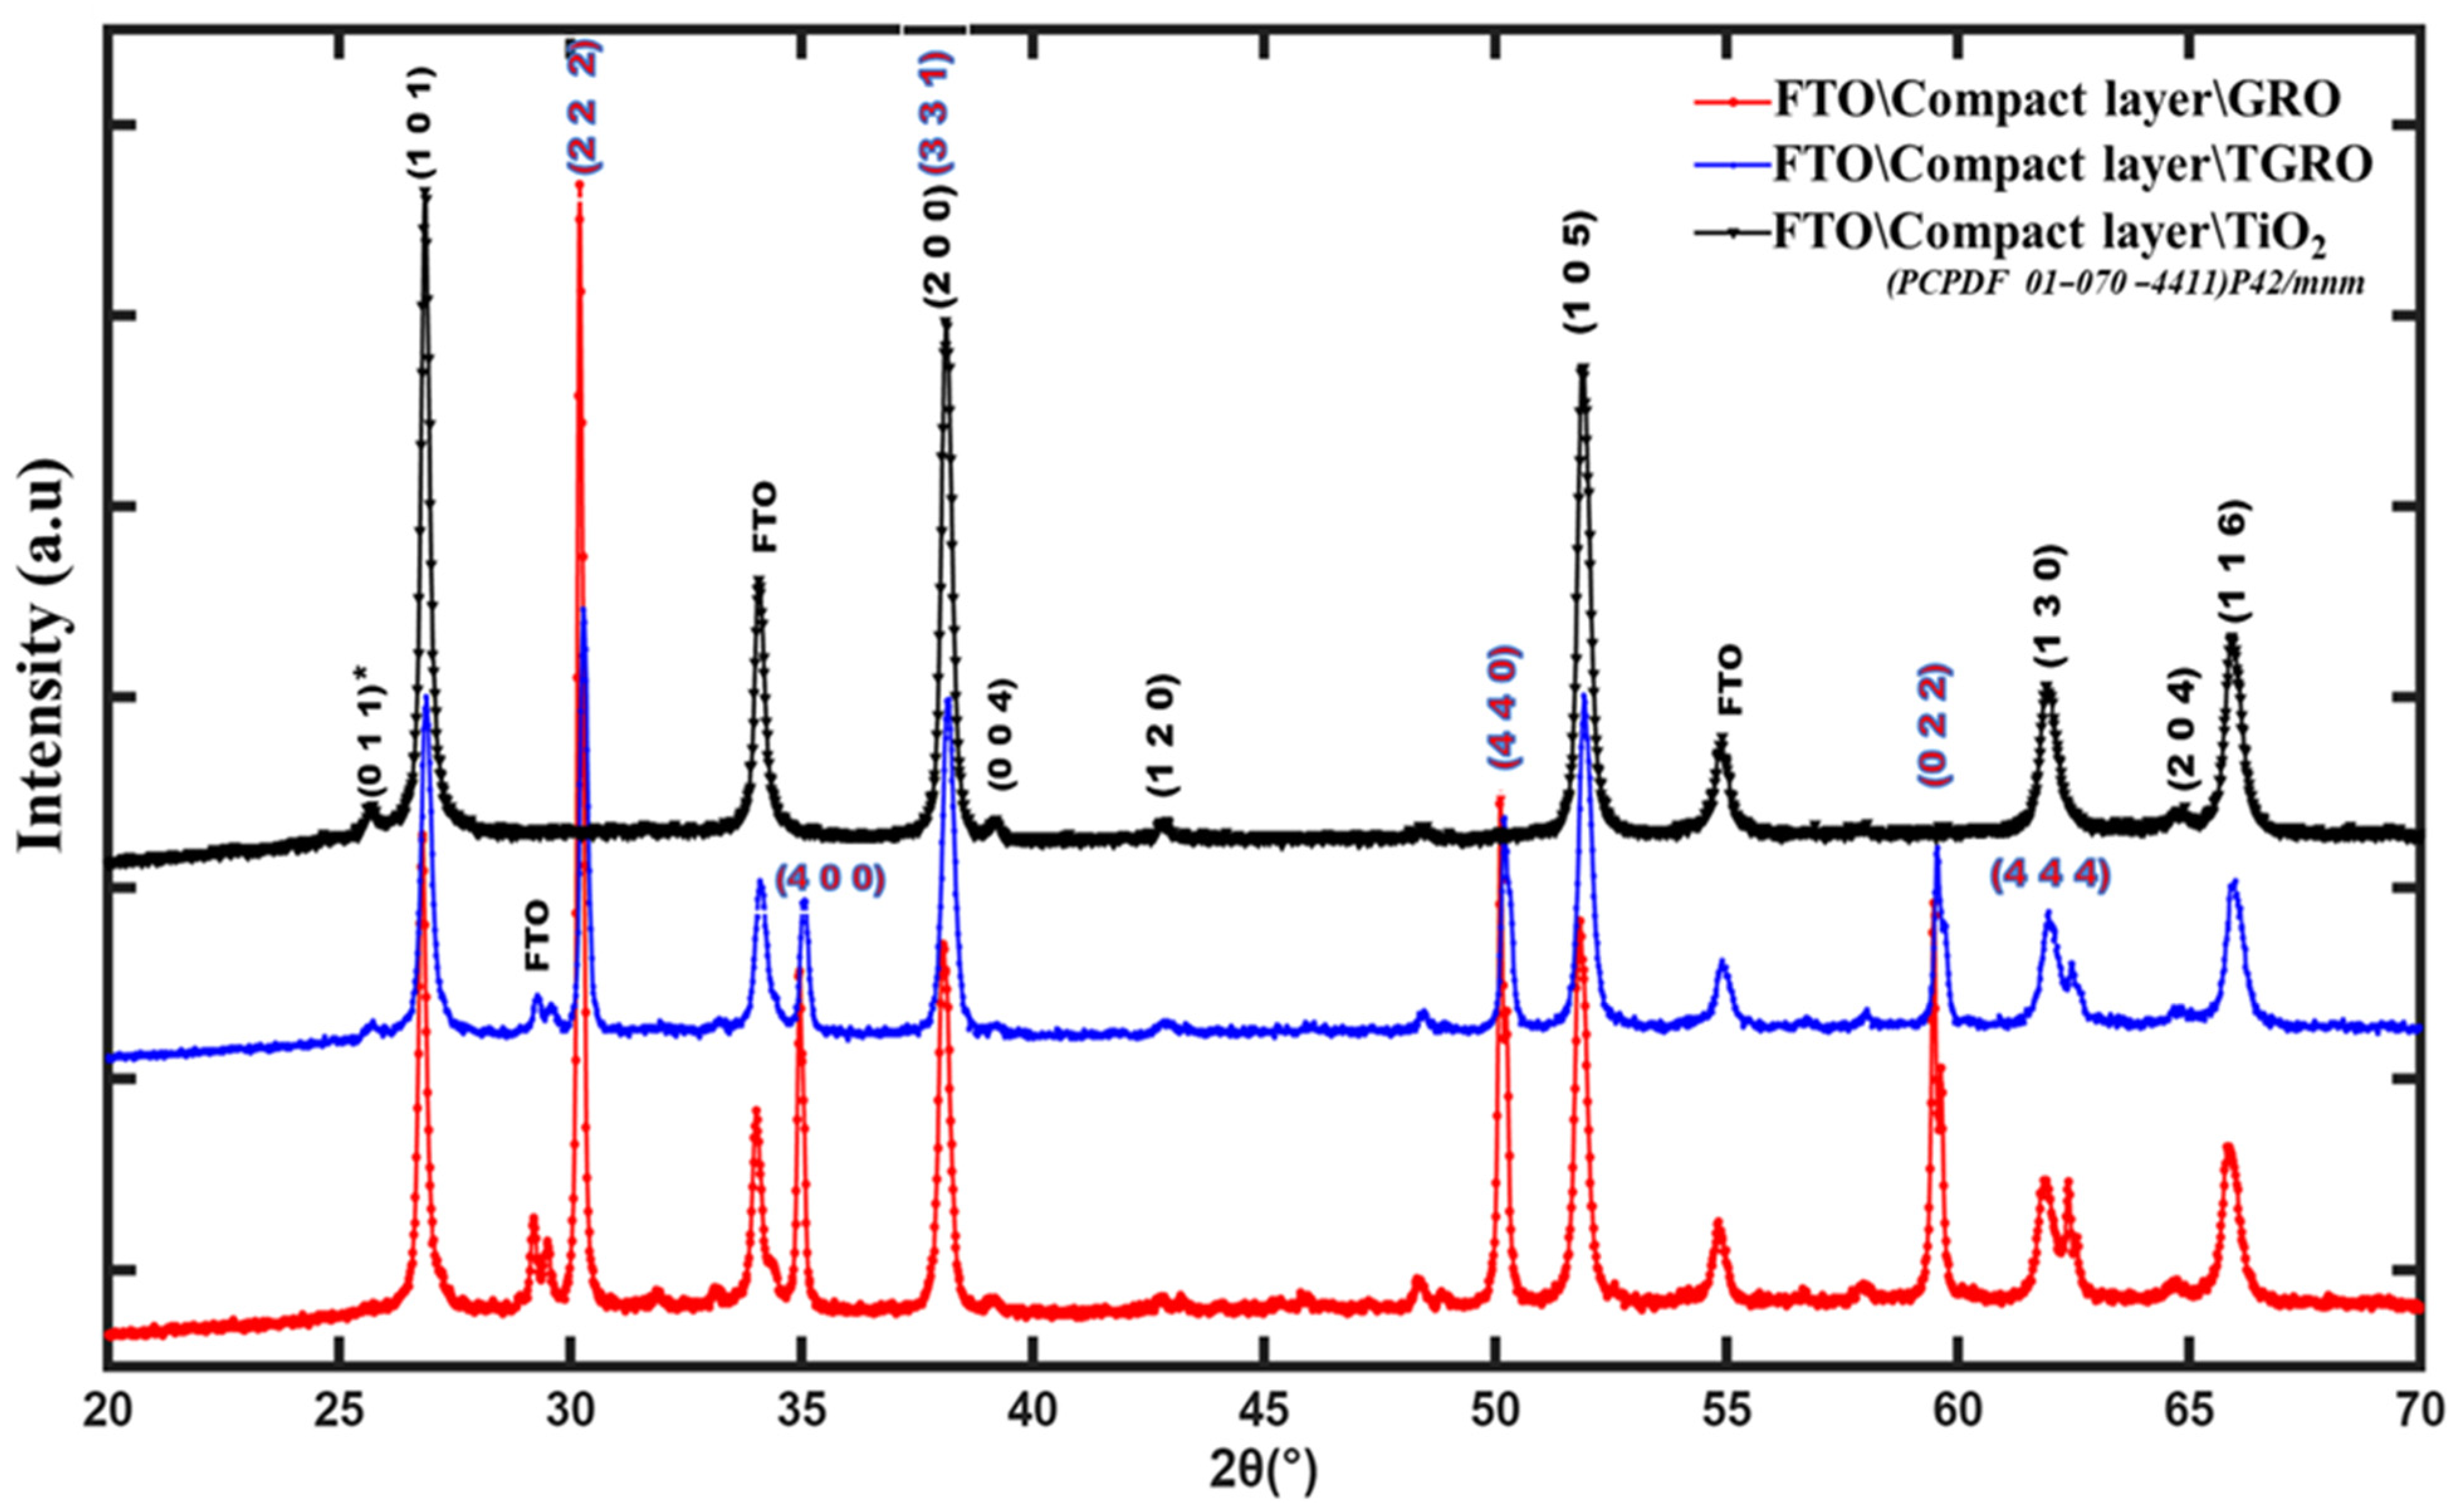
3.3. X-Ray Diffraction

Figure 6 depicts the X-ray diffraction (XRD) patterns of various films produced by spin-coating on glass/FTO substrate, obtained using a Cu-Kα source (λ = 1.54056 Å). GRO and TGRO layers were deposited on the initial TiO2 compact layer (CL). The patterns exhibit high crystallinity of the films. The peak observed at 25° in the TGRO diagram can be attributed to the reticular plans with (101) orientation in the TiO2 structure, indicating crystallization in the anatase phase [29]. Furthermore, the peak at around 27° corresponds to the (110) orientated plans of FTO [30]. The most intense diffraction peak observed in the TGRO and GRO structures around 30° represents the pyrochlore phase of Gd2Ru2O7 [31,32]. The other peaks with weak intensity are consistent with the pyrochlore GRO symmetry. The XRD patterns were analyzed using material project Fd-3m SG (mp-505216) and Inorganic Crystal Structure Database Cmcm SG (92067-ICSD) sources.
The crystalline quality of the three structures was evaluated by calculating the full width at half maximum (FWHM) of the diffracted lines. This was achieved using the diffraction line situated at 51.88°, one of the representative diffraction angles that could be observed in the three structures. We obtained Δ2θ1 = 0.30°, Δ2θ2 = 0.32°, and Δ2θ3 = 0.29° for the TiO2, TGRO, and GRO layers, respectively. These values show that the three compounds had almost the same crystalline quality.

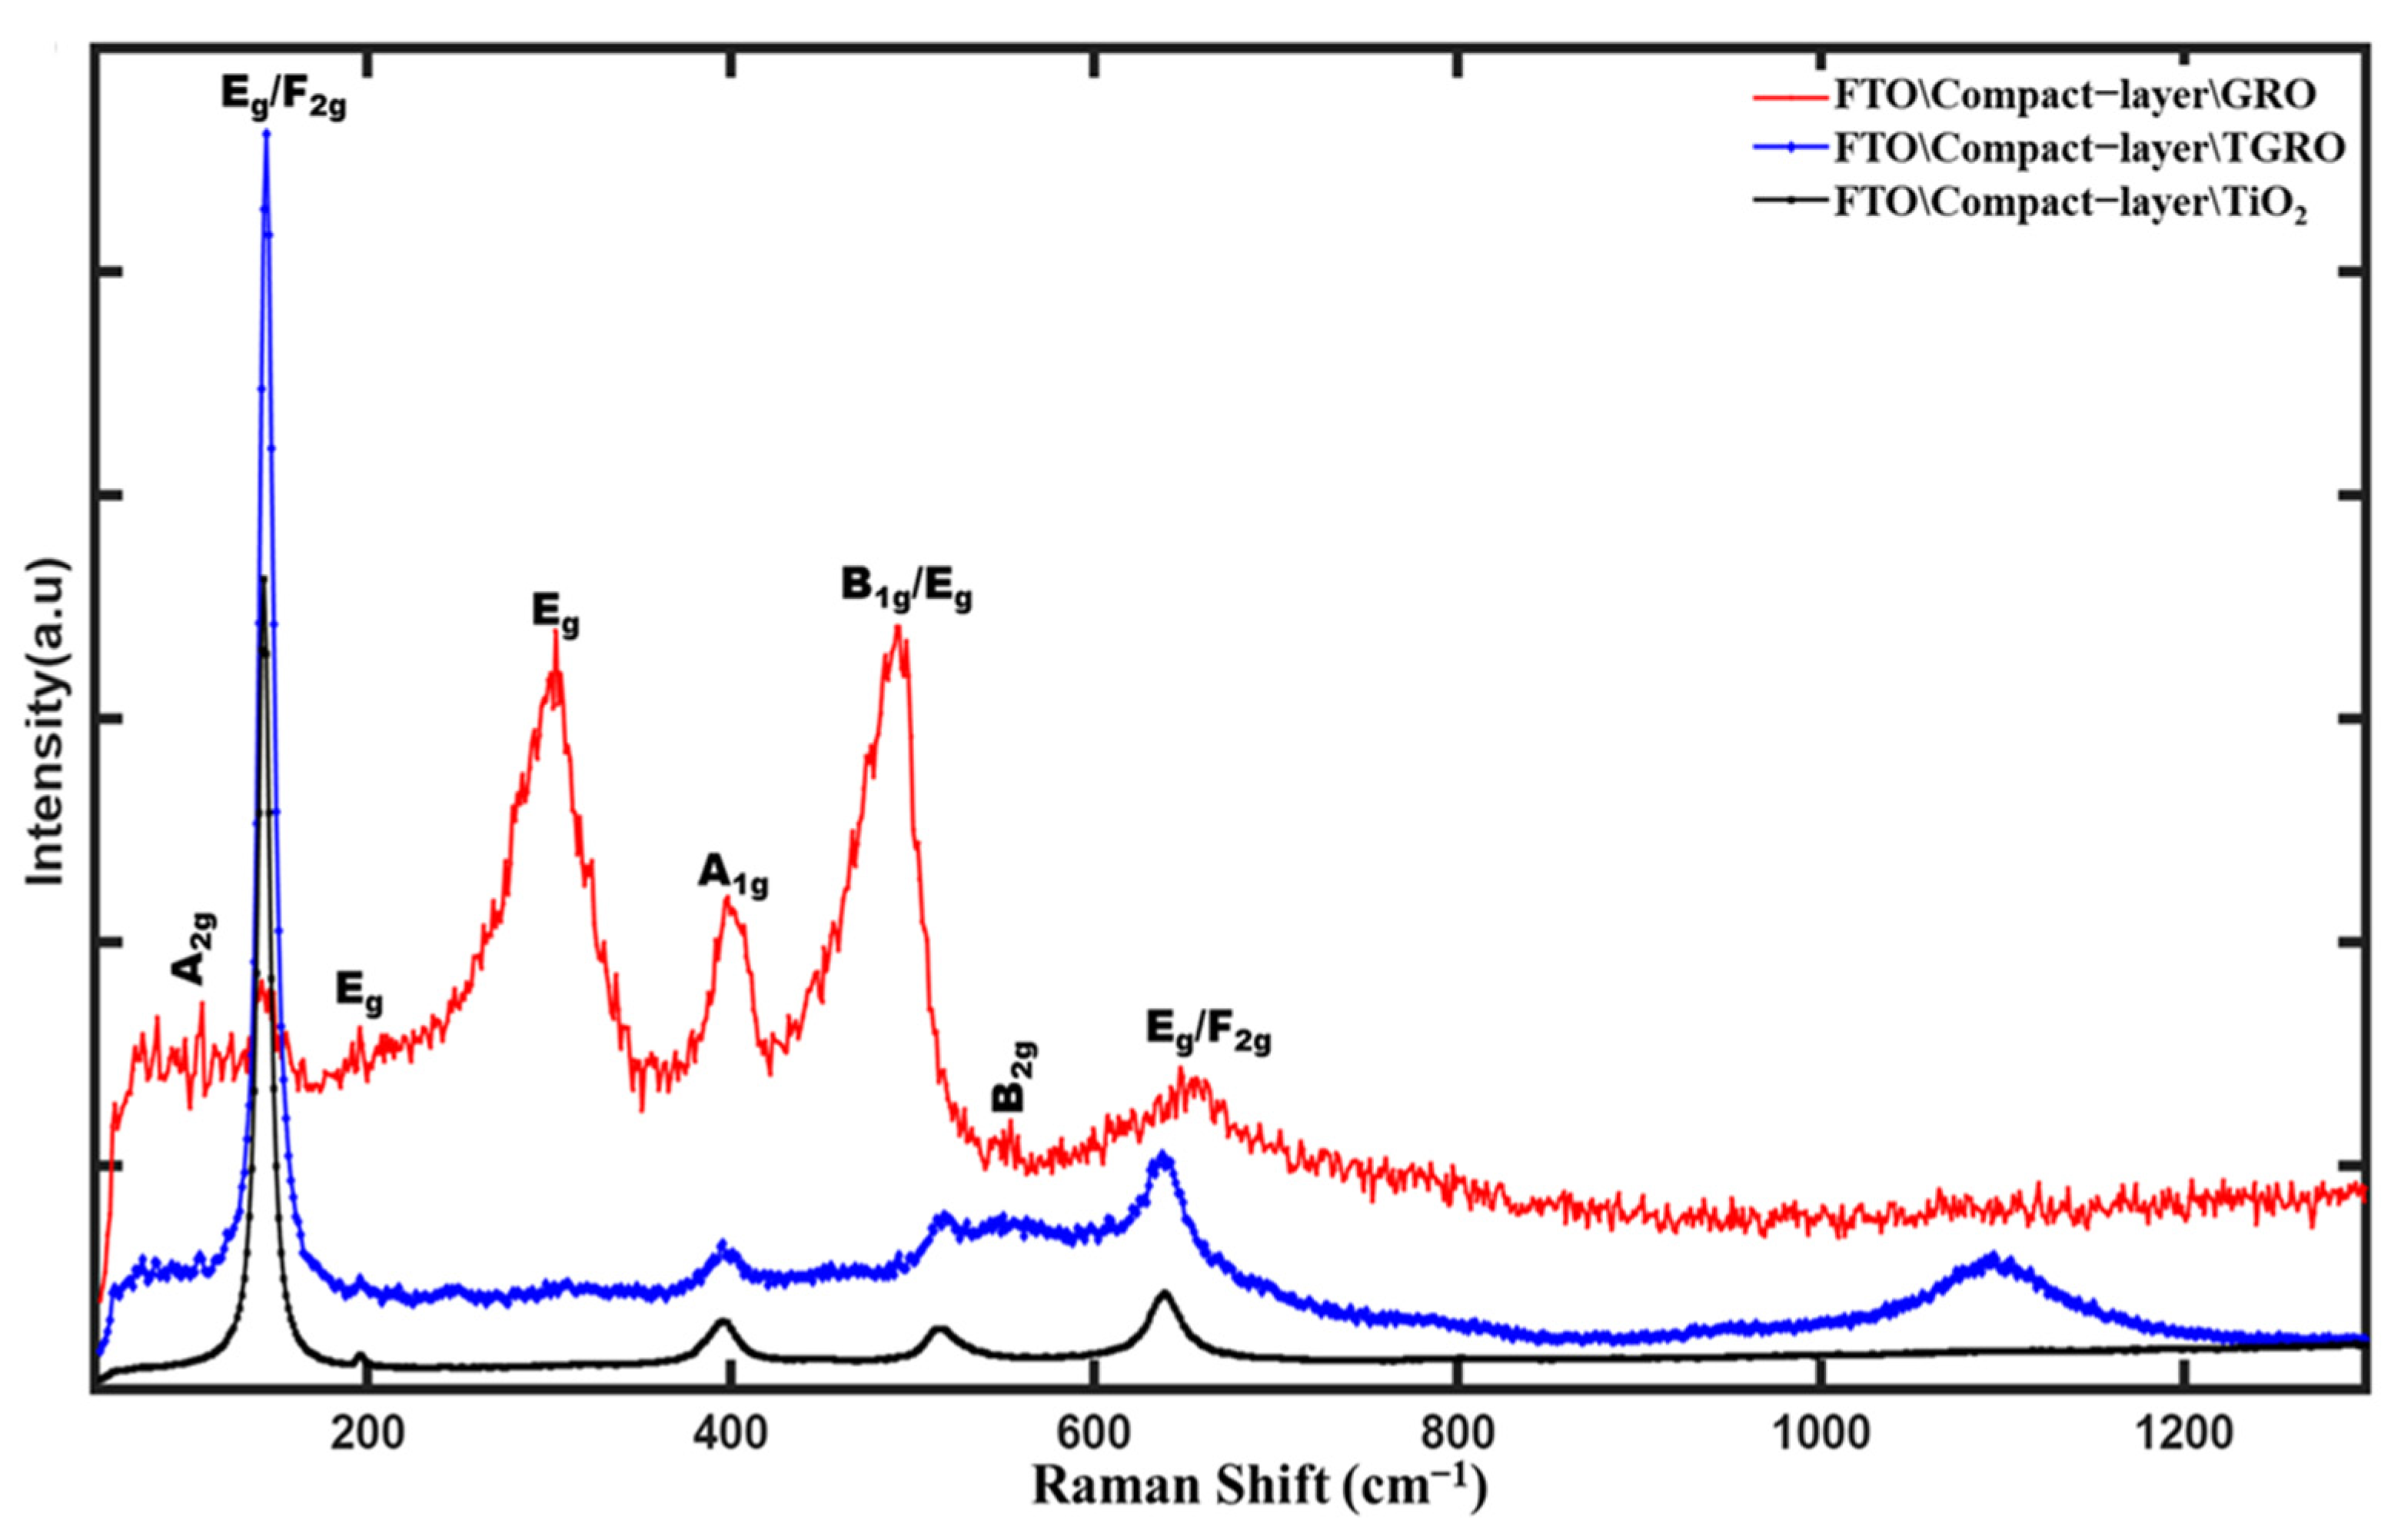
3.4. Raman Spectroscopy

Figure 7 displays three Raman spectra recorded on the glass-FTO/compact-layer/TiO2-Gd2Ru2O7 compound stacked films, the glass-FTO/compact-layer/Gd2Ru2O7 compound stacked films, and the TiO2 mesoporous layer deposited on the glass-FTO/compact layer. The peak observed at 142.03 cm−1 in the TGRO spectrum is attributed to the Eg mode, originating from the TiO2 layer [11,33], possibly combined with the F2g mode of the GRO structure. Peaks at 87 cm−1 and 130 cm−1 correspond to the A2g and F2g modes of the Gd2O3 structure [34], involving O-Gd-O vibrations. Peaks observed at 302 cm−1, 402 cm−1, 492 cm−1, and 645 cm−1 are attributed to the Eg, A1g, and B2g modes present in the RuO2 matrix [35,36]. The peak at 690 cm−1 in the Raman spectrum of Gd2Ru2O7 corresponds to the F2g mode, representing an O-Gd-O-Ru-O vibration, thus confirming the GRO structure in both spectra [11]. The stretch mode around 1093.23 cm−1 observed in the TGRO spectrum is an active vibration specific to the TiO2 semiconductor substrate [37], attributed to the A1g mode. These different modes confirm the XRD results.

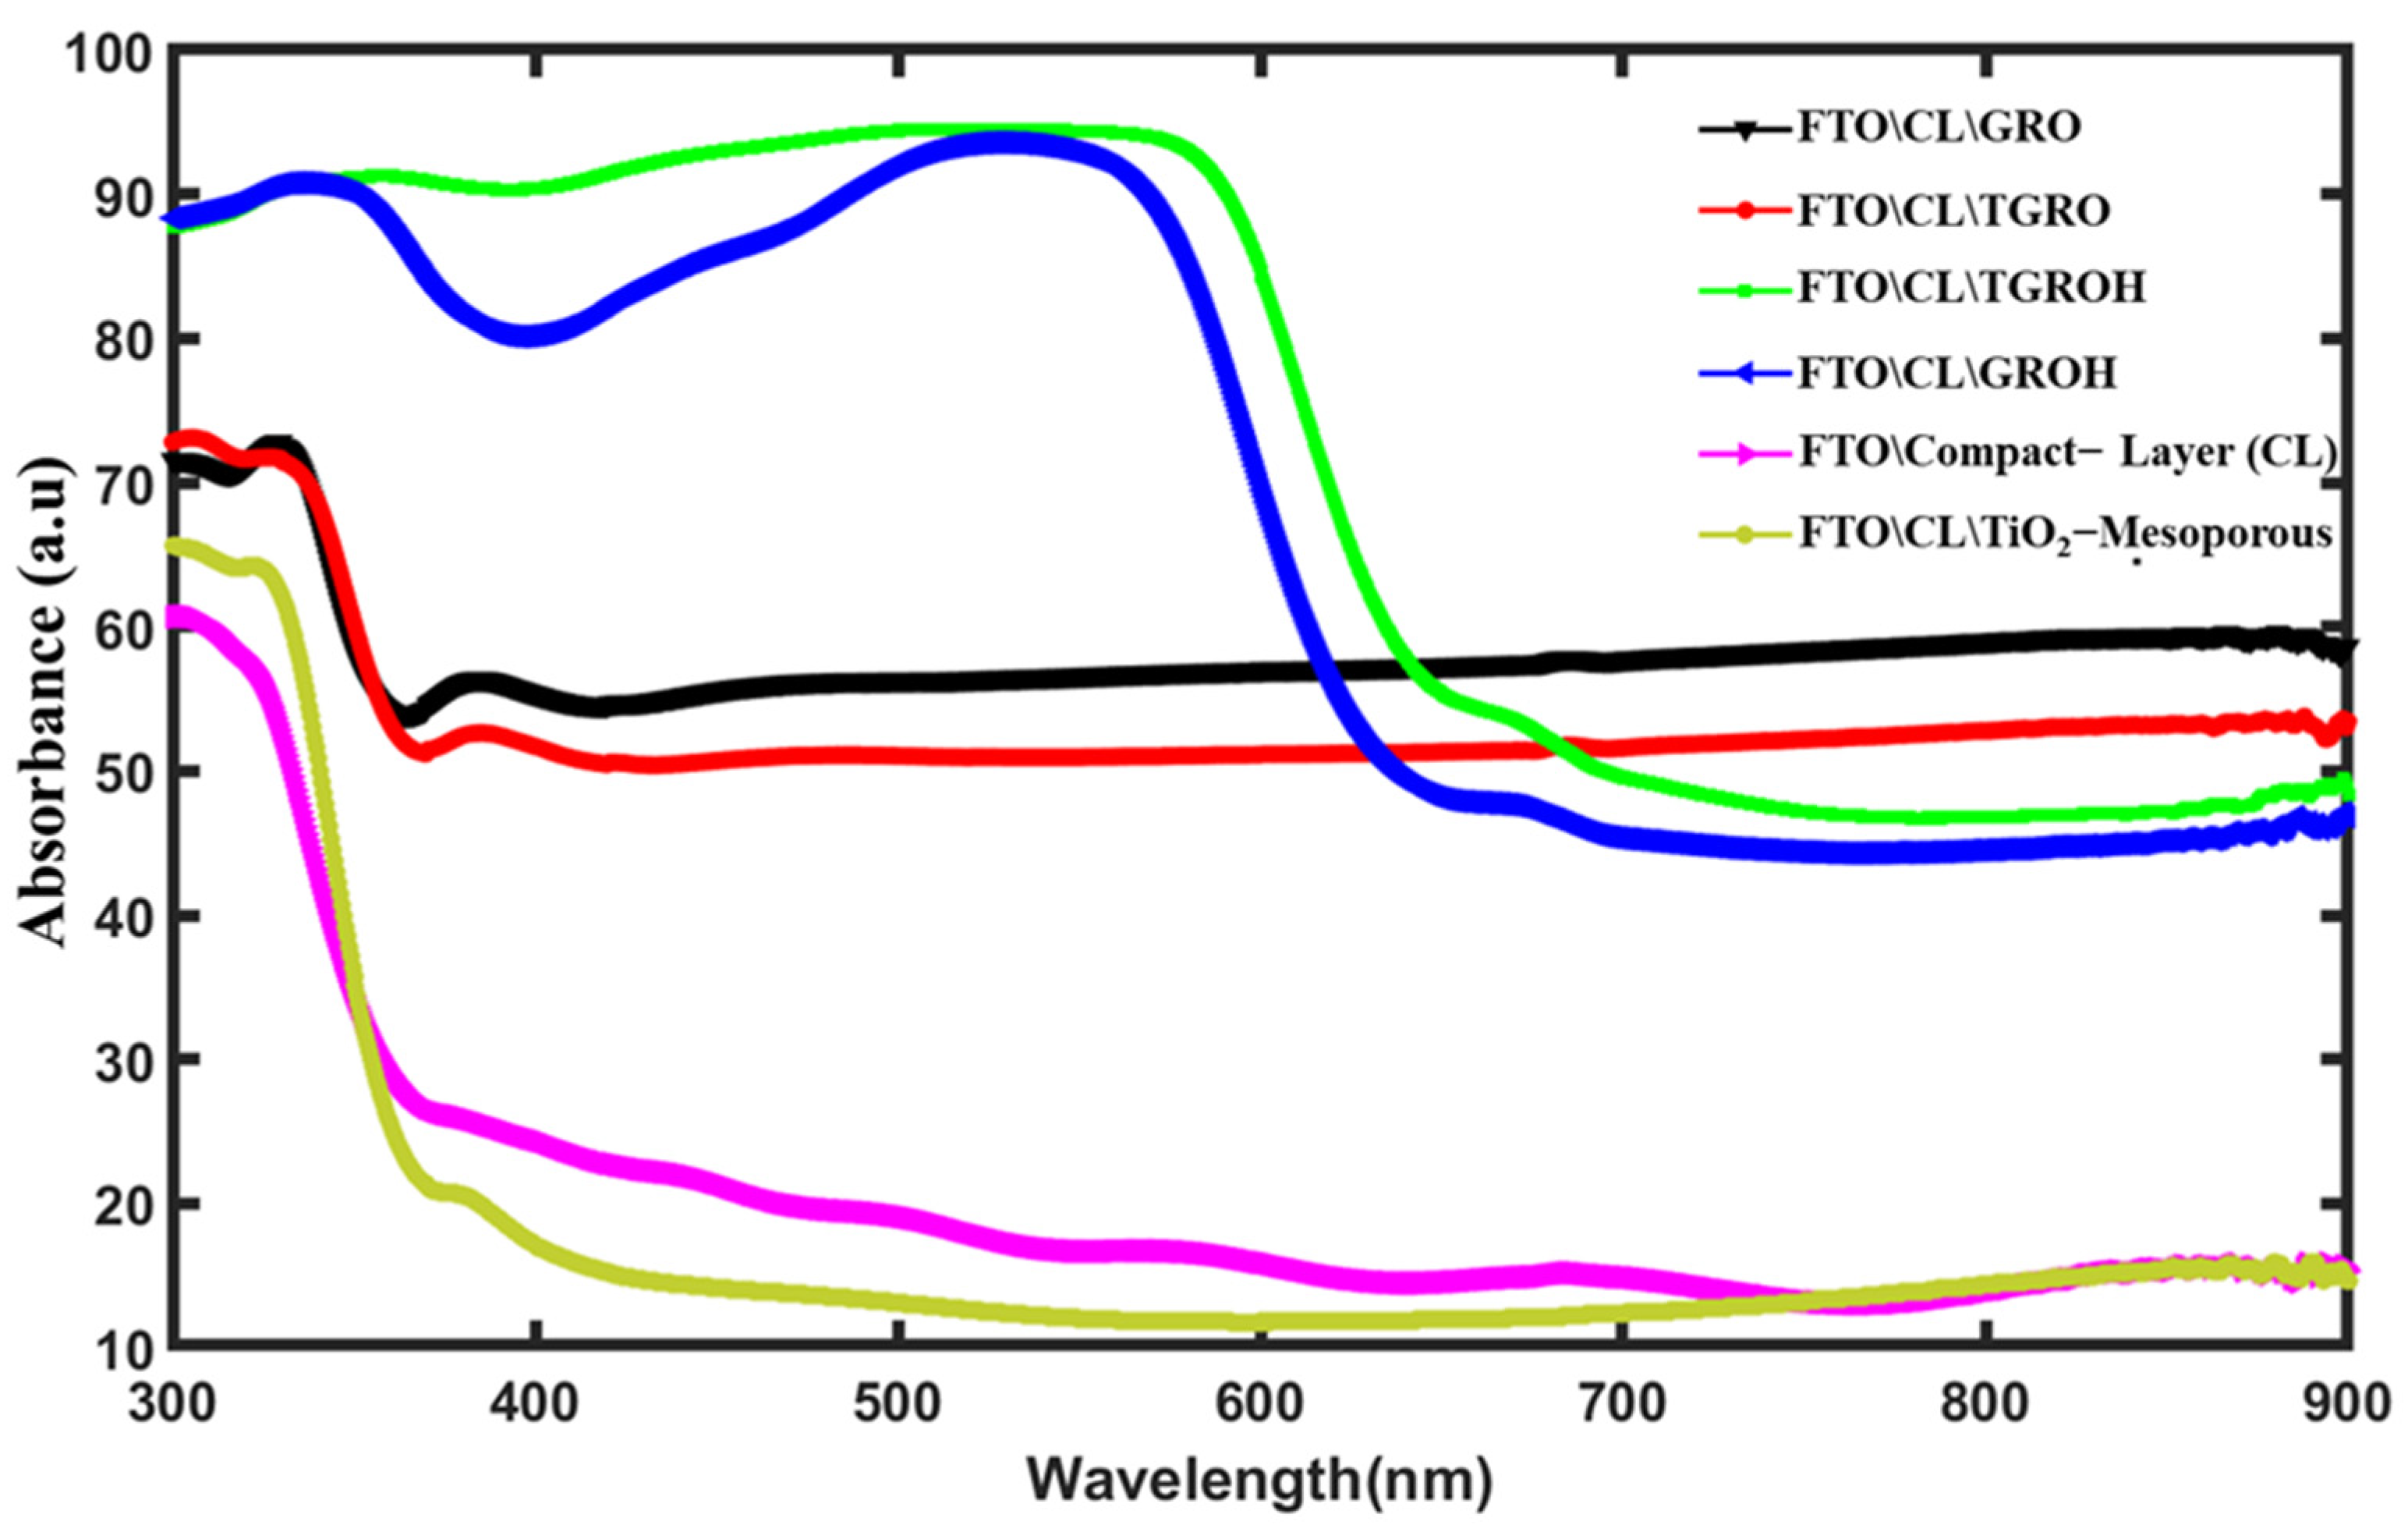
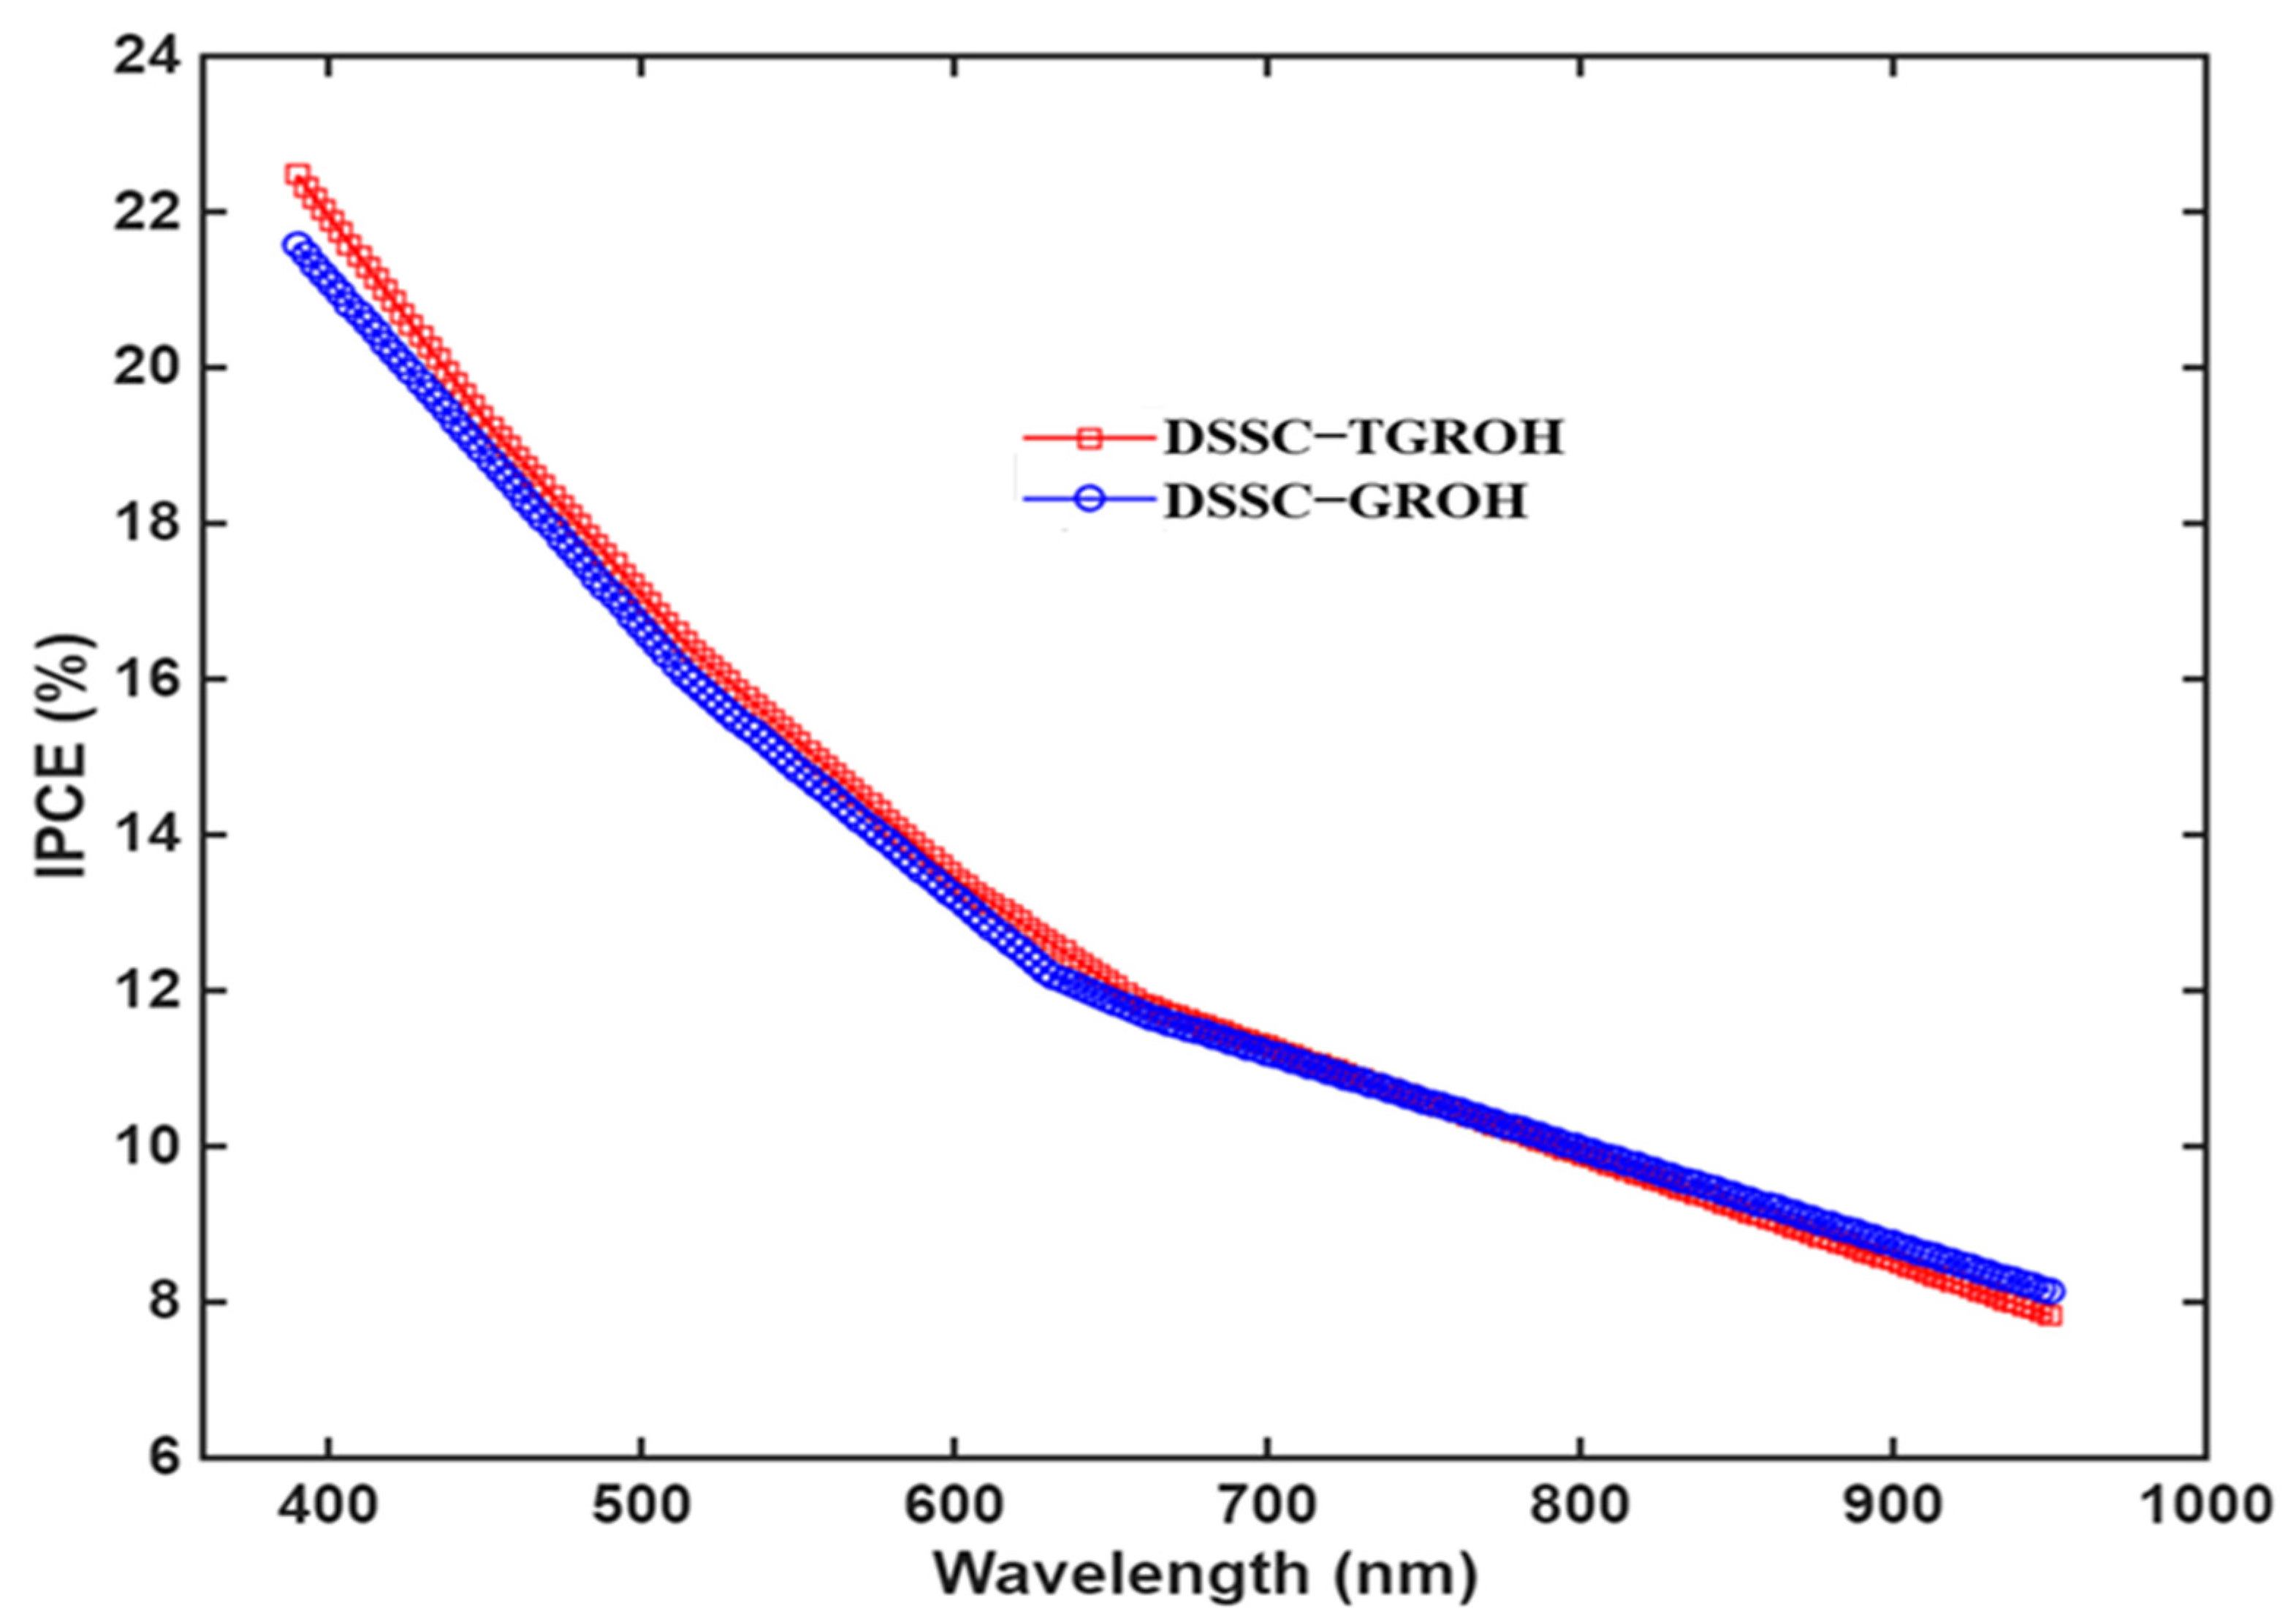
3.5. Optical Properties

The various films used to assemble the dye-sensitized solar cells (DSSC) were processed on FTO glass, which had previously been coated with a TiO2 based compact layer. The GRO photoanode is a semi-transparent material, which means that part of the light which passes through the material is both reflected and transmitted [38,39]. Absorbance is determined from the A + T + R = 1 relationship. From the absorbance value, we can quantify the percentage of absorption of these nanomaterials. Figure 8 shows the absorbance spectra of CL-GRO, CL-TGRO, CL-GROH, CL-TGROH, CL, and CL-TiO2-mesoporous grown on glass-FTO substrates. It should be noted that CL indicates “compact layer” and H is used for the soaked sample by the dye. The GRO films sensitized to hibiscus sabdarifa dye (GROH) and the TiO2-Gd2Ru2O7 sensitized to hibiscus sabdarifa dye (TGROH) exhibit high absorbance (about 90%) between 300 nm and 600 nm, which are stabilized around 50% from 600 nm up to 900 nm, confirming their ability to absorb visible light in a large specter. It can be observed that TiO2 nanoparticle-based films coated hibiscus dye (TGROH) show the highest absorbance, between 360 nm and 500 nm. However, the high absorbance observed in the TGRO and GRO spectra is attributed to grain sizes and oxygen defects in the GRO matrix. This could explain the faster dye adhesion in the pores of the surface of grains compared to TiO2-based films. The percentage of absorbance in the two dye-sensitized semiconductors is approximately 90%, between 360 nm and 600 nm. The plasmonic resonance present in the GRO matrix is further amplified in the presence of the dye, helping to improve the efficiency of the solar cell processed.

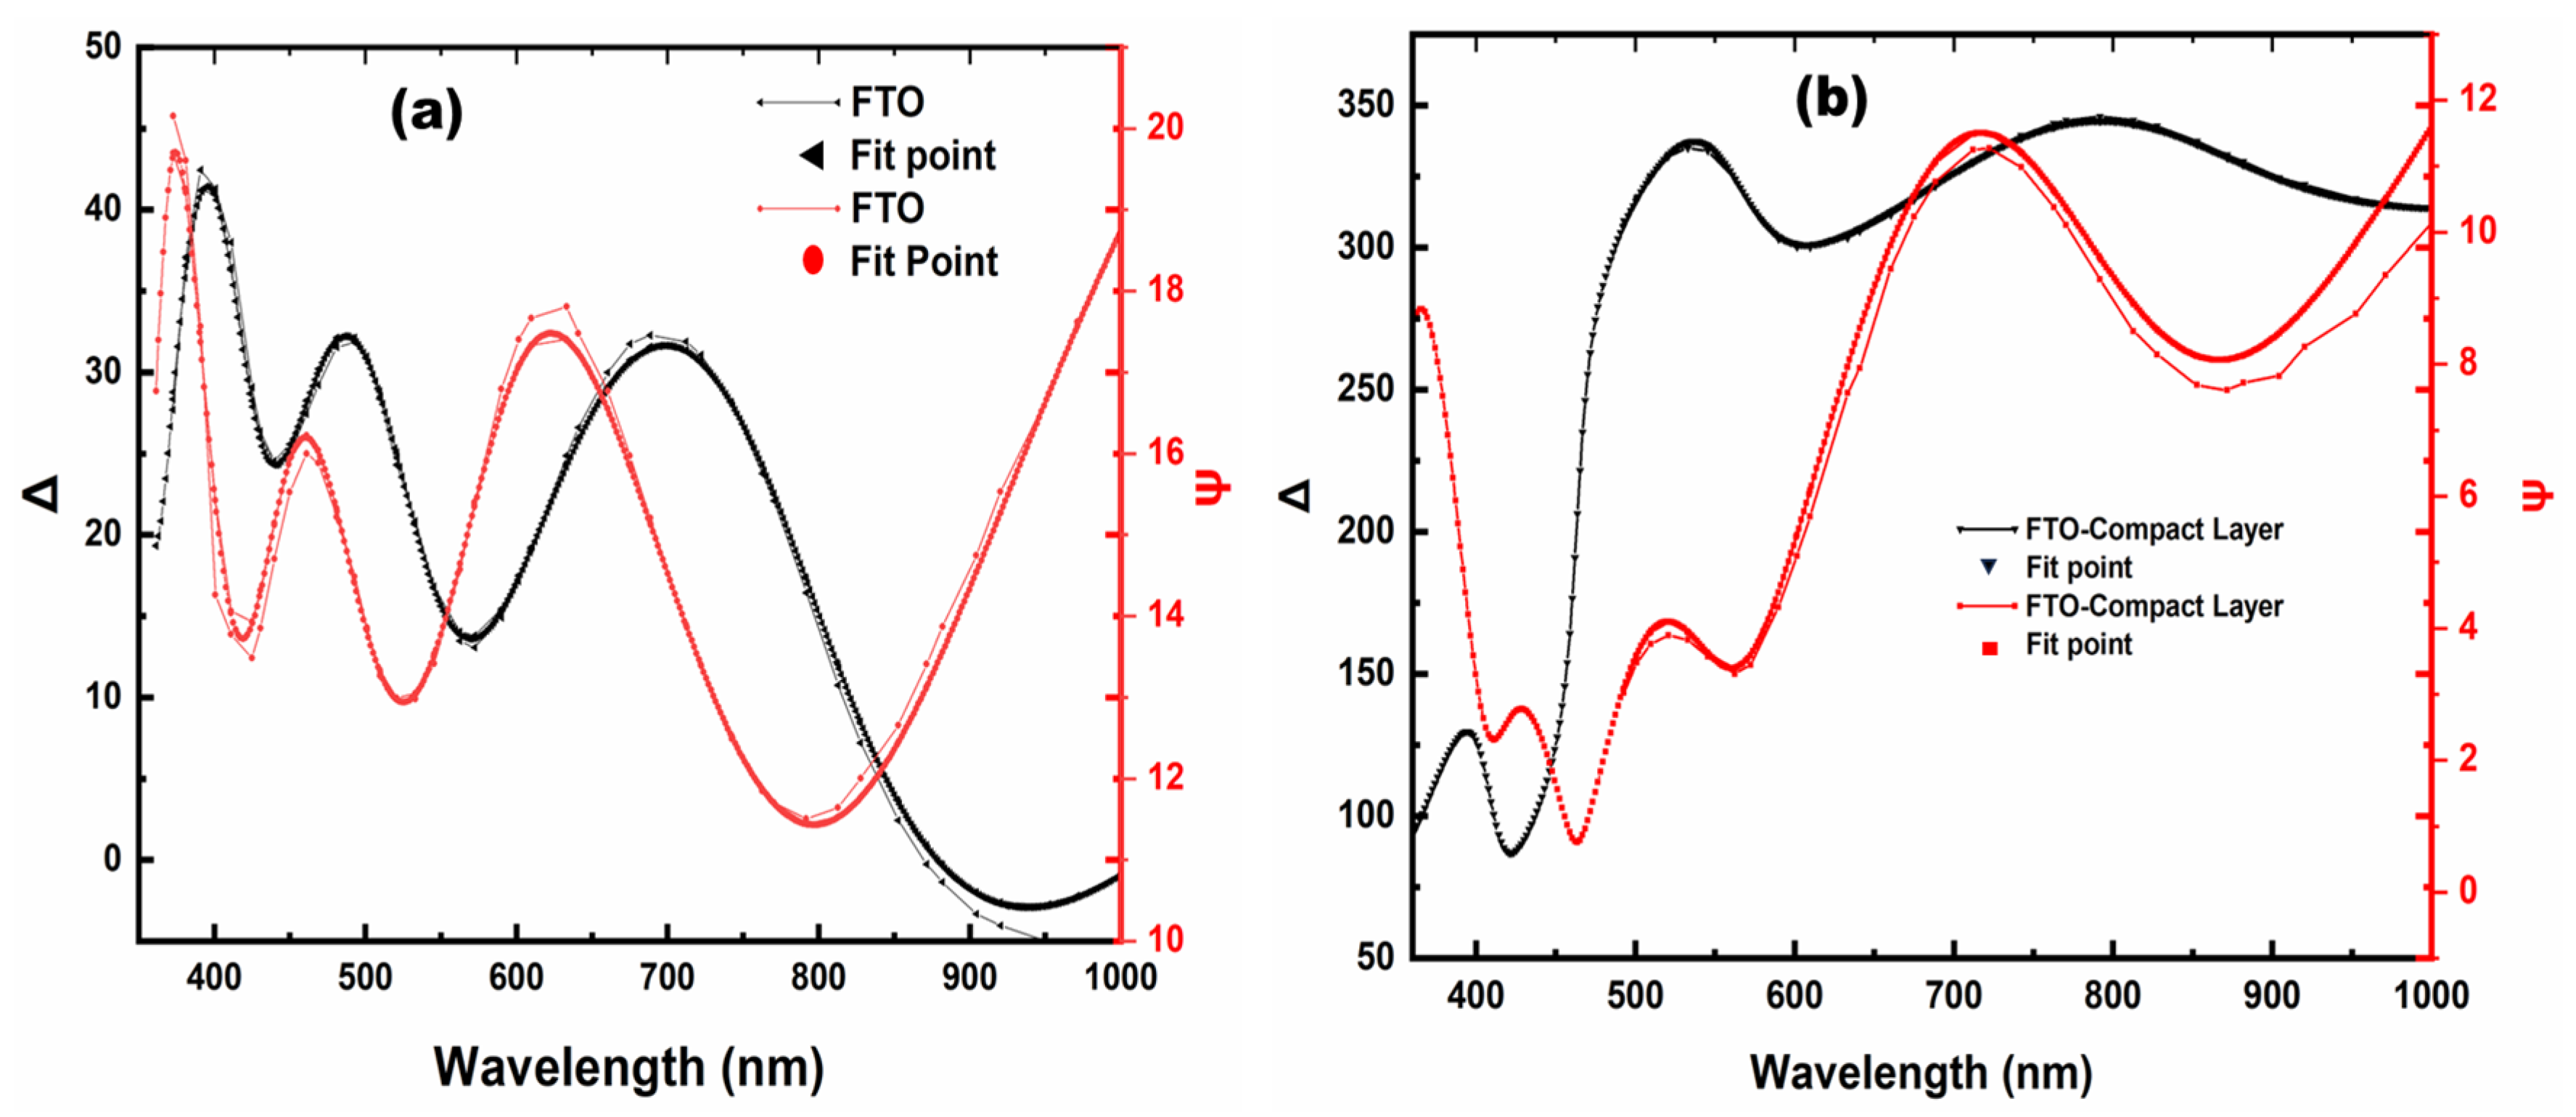
3.6. Ellipsometry Measurement

The ellipsometric measurements were performed in the range of 360 nm to 1000 nm. The ellipsometer was operated under a fixed angle of 70° to enable us to determine the thickness of the compact films and the optical complex structure corresponding to the FTO substrates. The experimental data were processed using the EP4 program (Accurion, Germany), assuming flat interfaces between the layers and taking the interfacial roughness into account via the effective medium approximation. The initial model is based on the work of Ball and coworkers [40].
The resulting physical model is a function of the ellipsometric factors ψ and Δ, based on the fundamental ellipsometer relationship [41,42]. The physical model used consisted of a glass substrate coated with FTO (Figure 9a) and a thin film of TiO2 (Figure 9b) deposited on glass-FTO substrate. The surface roughness and ambient medium (air) were also considered [43]. The physical approximation is based on Lorentzian dispersion laws [44,45].
Figure 10a,b show the ψ and Δ spectral response of the FTO and FTO-TiO2 substrate as a function of the wavelength, respectively. The proposed physical models are fitted to experimental data by considering Lorentzian oscillators. We observed a fit of curves in close agreement with the experimental data (RMSE = 0.98), allowing us to estimate the thicknesses accurately. Figure 10b shows the ψ and Δ spectra of the TiO2-based compact layer grown on a glass/FTO substrate. The fitting results also coincide with the experimental data (RMSE = 1.04), enabling us to estimate the thickness of the compact layers to be between 56 and 60 nm for the two samples.
Furthermore, the thicknesses of the GRO and TGRO layers were determined using a contact profilometer (Dektak XT Bruker nano surfaces division). The sample was moved vertically to obtain the z-axis displacement curve relative to the surface profile for each image pixel [46]. To determine the thickness, reference (R) and measurement (M) cursors were placed on the curve on two equal-height plates. By moving M to different positions on the z-axis of the focal points, the surface profiles were obtained. The thicknesses are estimated at 416 nm for GRO and 402 nm for TGRO. All these experimental techniques give the same orders of magnitude of the measured thicknesses of the studied samples.

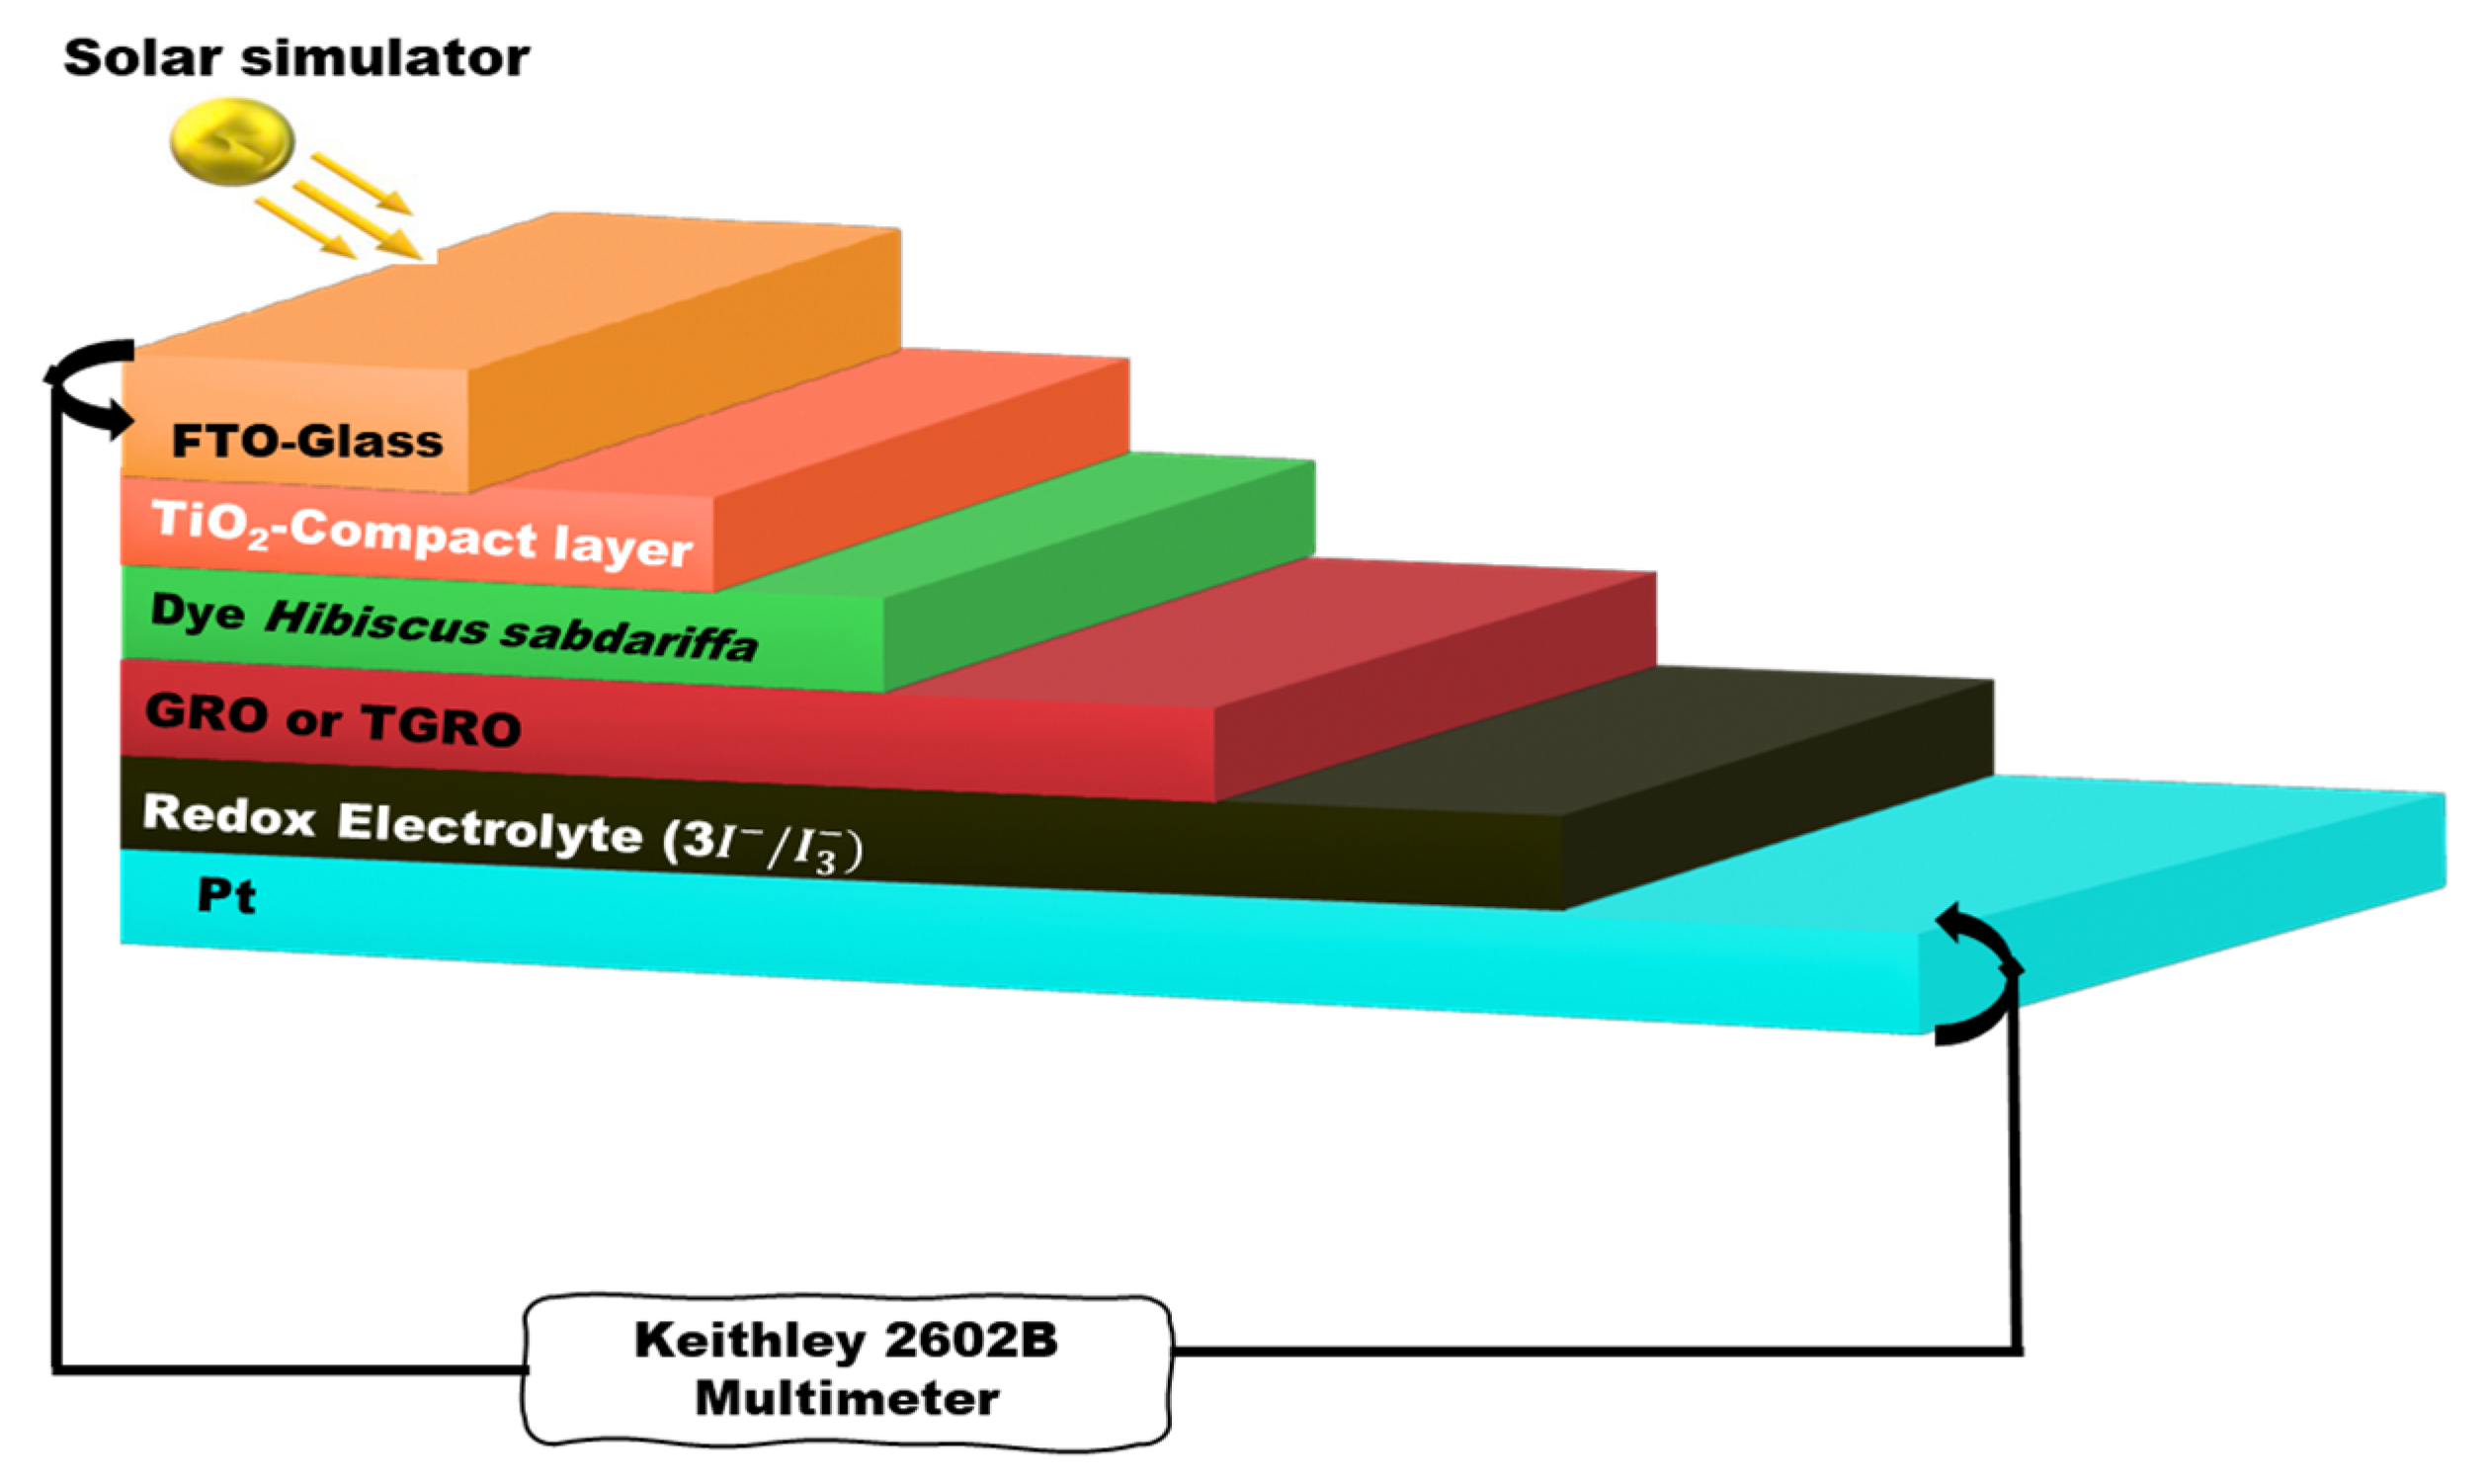
4. Assembled Natural Dye-Sensitized Solar Cells

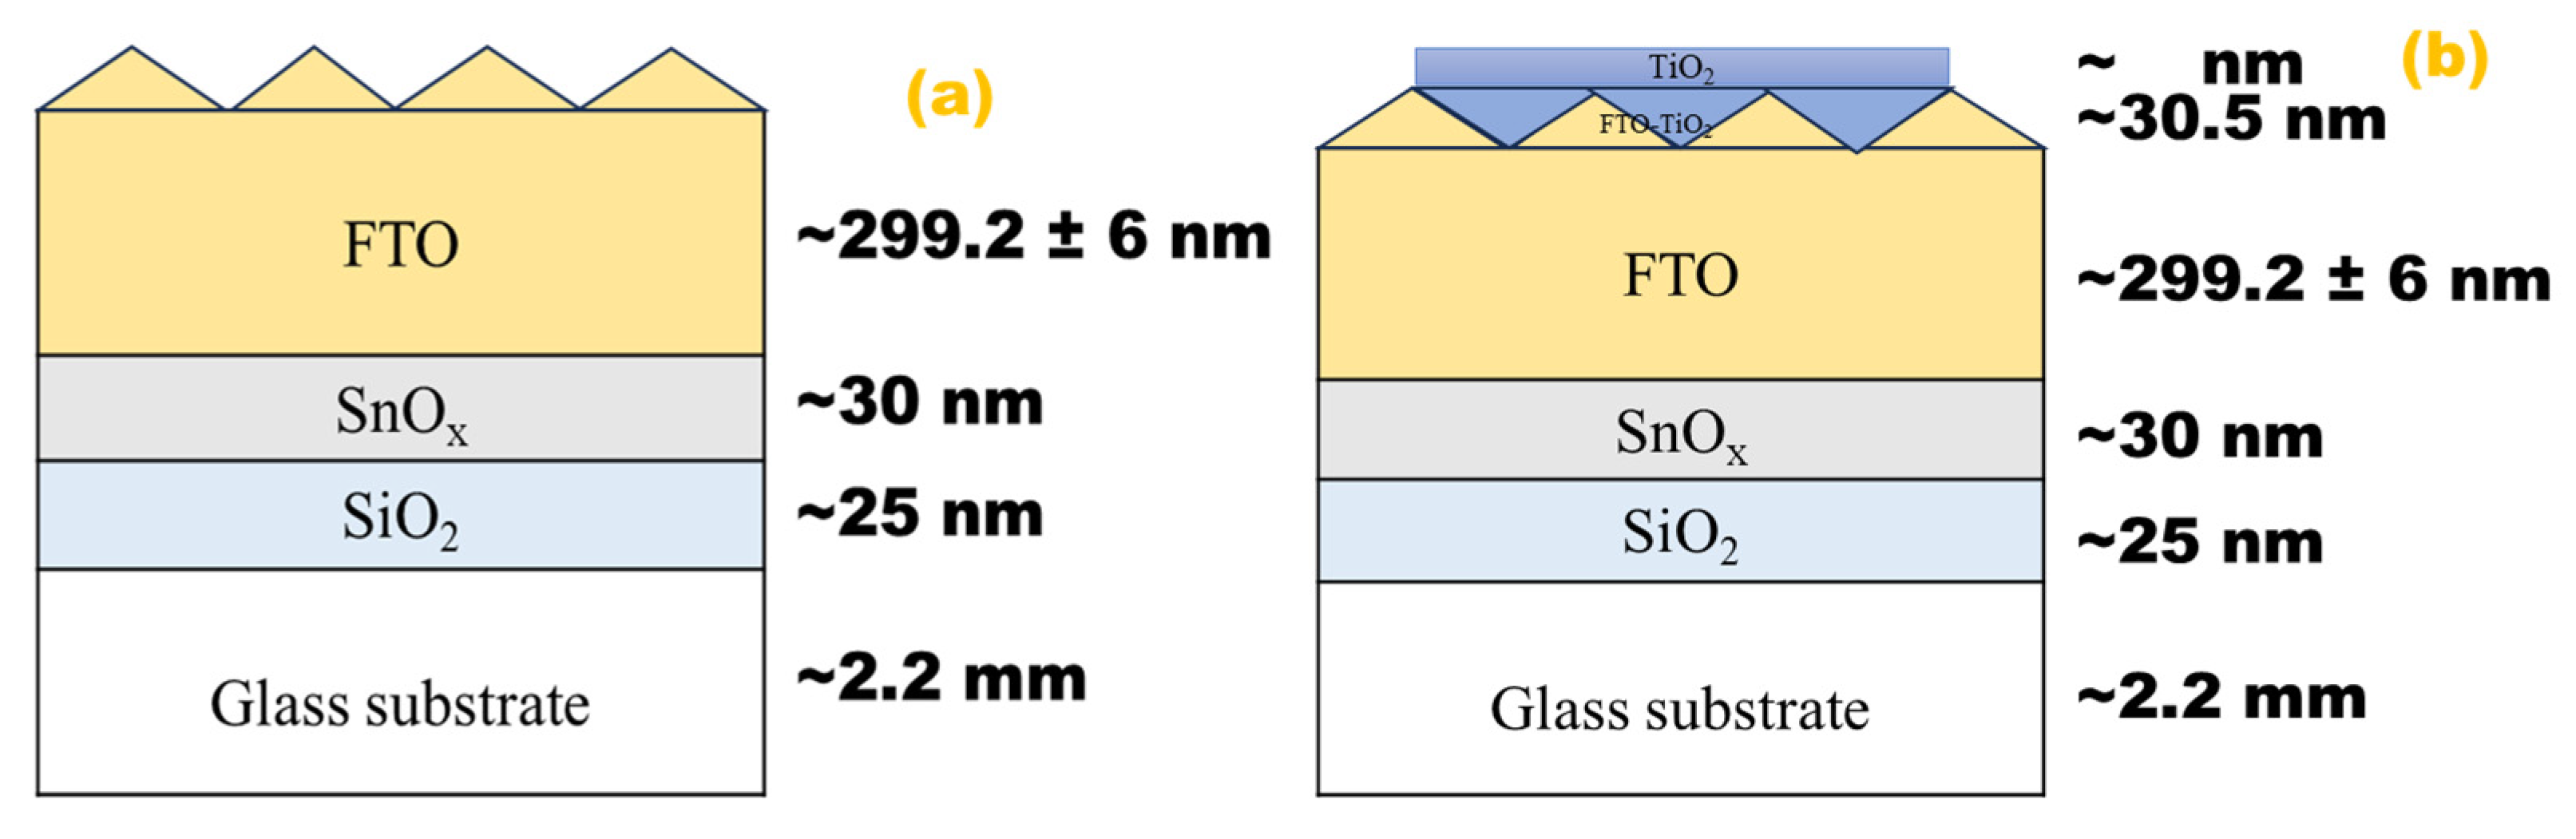
4.1. The Stacked Films in the DSSC-N Structure

Figure 11 shows the developed DSSC-N devices (with natural dye) in the two configurations:
FTO/compact-layer/Gd2Ru2O7/Hibiscus-sabdariffa/electrolyte(I/I3)/Pt or FTO/compact-layer/TiO2-Gd2Ru2O7/Hibiscus-sabdariffa/electrolyte(I/I3)/Pt of stacked layers.
The Gd2Ru2O7 (GRO) and TiO2-Gd2Ru2O7 (TGRO) photoanodes were all developed on glass-FTO substrate. The outer FTO glass containing the photoanode was exposed to a light source. Platinum-coated FTO glass (80 nm) served as the counter-electrode. A redox electrolyte (I/I3) was introduced between the two plates, sealed by a clamp to facilitate the electron–hole exchange. Electrical contacts were established on the upper and bottom plates for I-V measurements. The cell was illuminated by a solar simulator of Ossila. The light source of this simulator was calibrated to emit a total integrated power of 1000 W/m2 over the wavelength range of 350 nm to 1000 nm. J-V measurements were performed using the following protocol: from −0.05 to 4V with a step of 0.01, after a dwell time of 5 min under illumination. The dark current was measured after 30 min of absorption in a sealed crucible. Each point of measurement was taken twice.
In Figure 11, we clearly present the composition of the DSSC-N matrix under solar illumination. These solar cell measurements were performed via a Keithley Sourcemeter by connecting the photoanode and counter-electrode both without and under illumination.

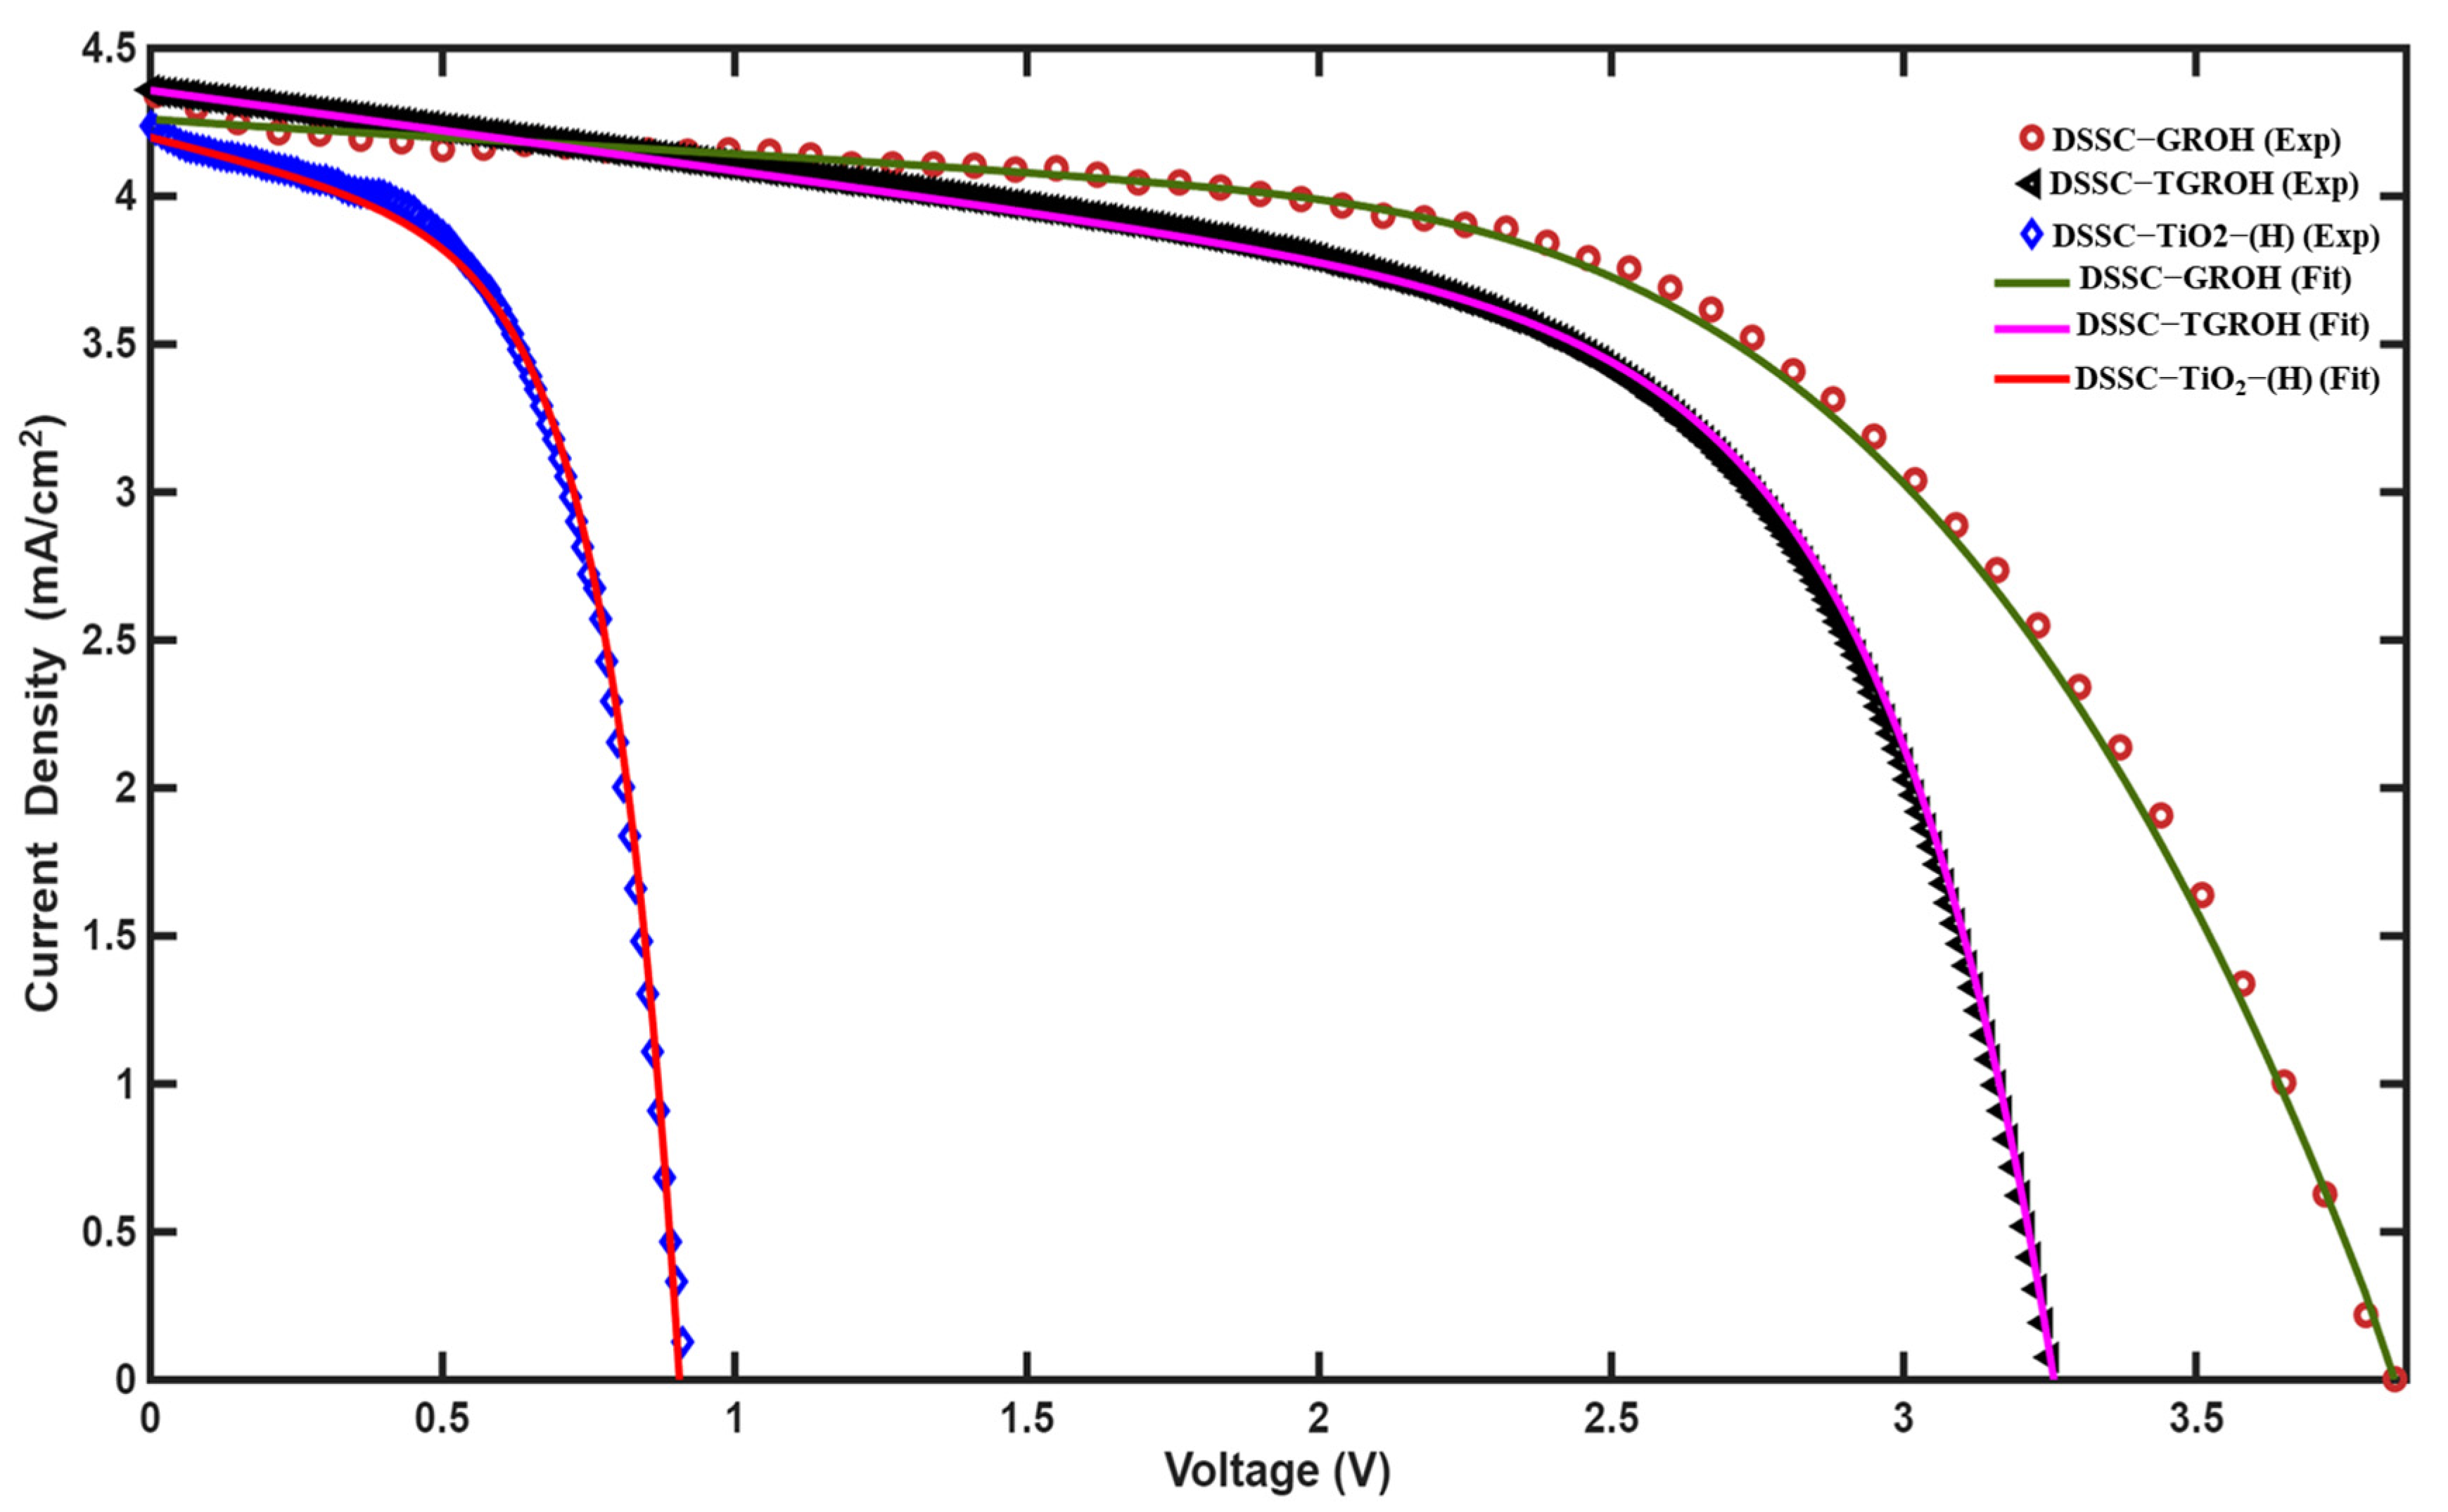
4.2. I-V Measurements

The device was fitted with a two-channel for I-V measurements. The power conversion efficiency (PCE) was evaluated from the J-V curve of the cell [47,48] using the expression:
Ƞ = J S C V O C F F Փ i n
where FF is the fill factor [3,49,50], evaluated by the formula:
F F = P m a x J S C V O C
Here, VOC is the open-circuit voltage, JSC is the short-circuit current, and Pmax is the maximum output power. Փ i n   is the maximum current received.

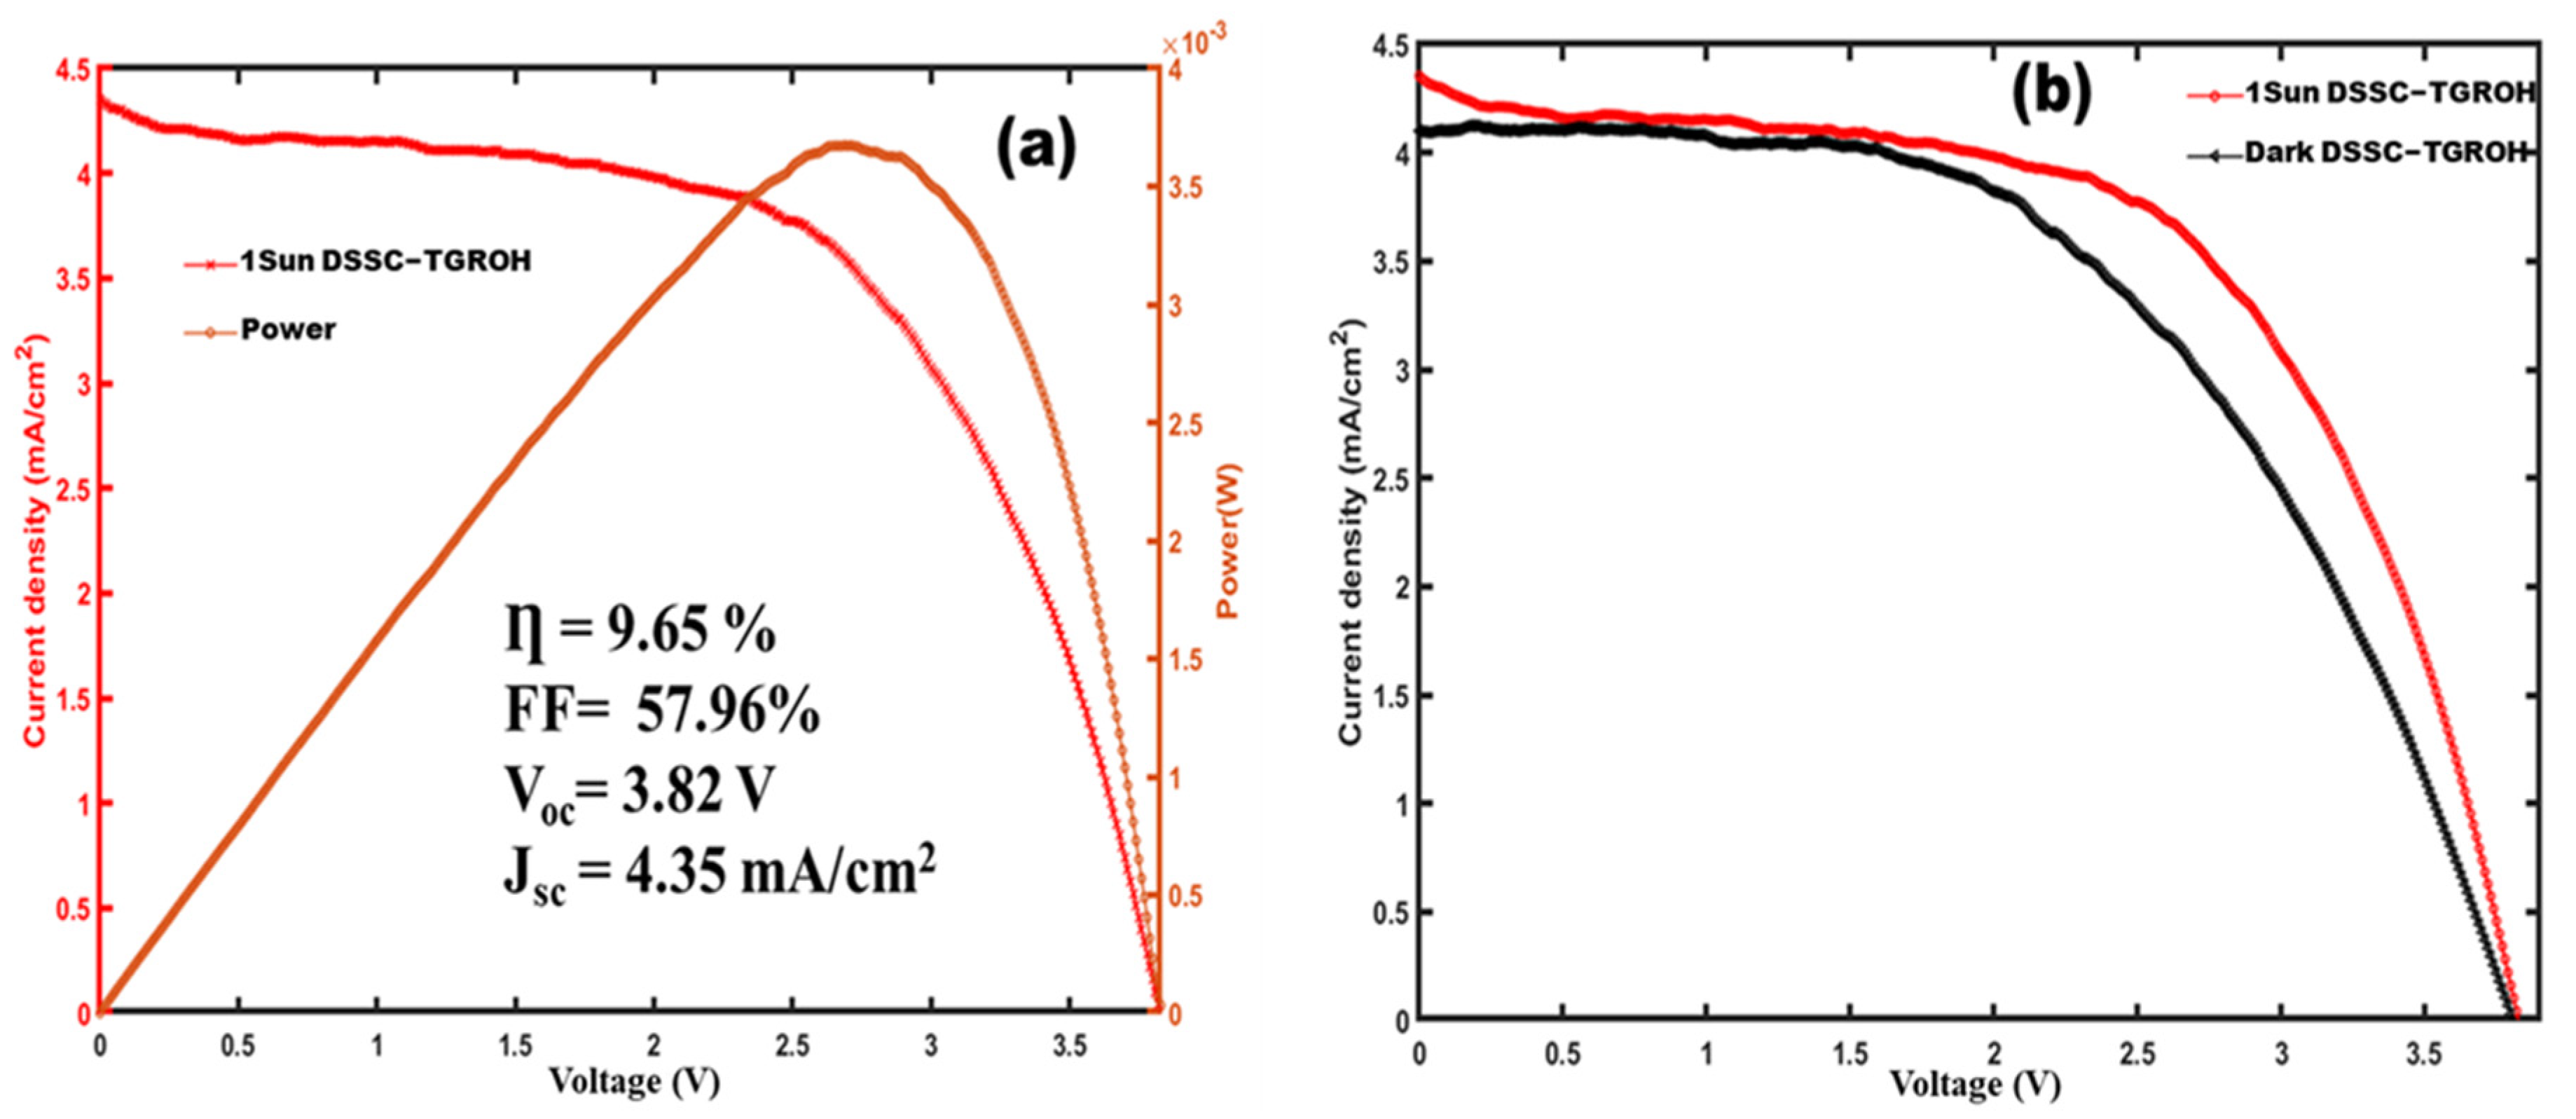
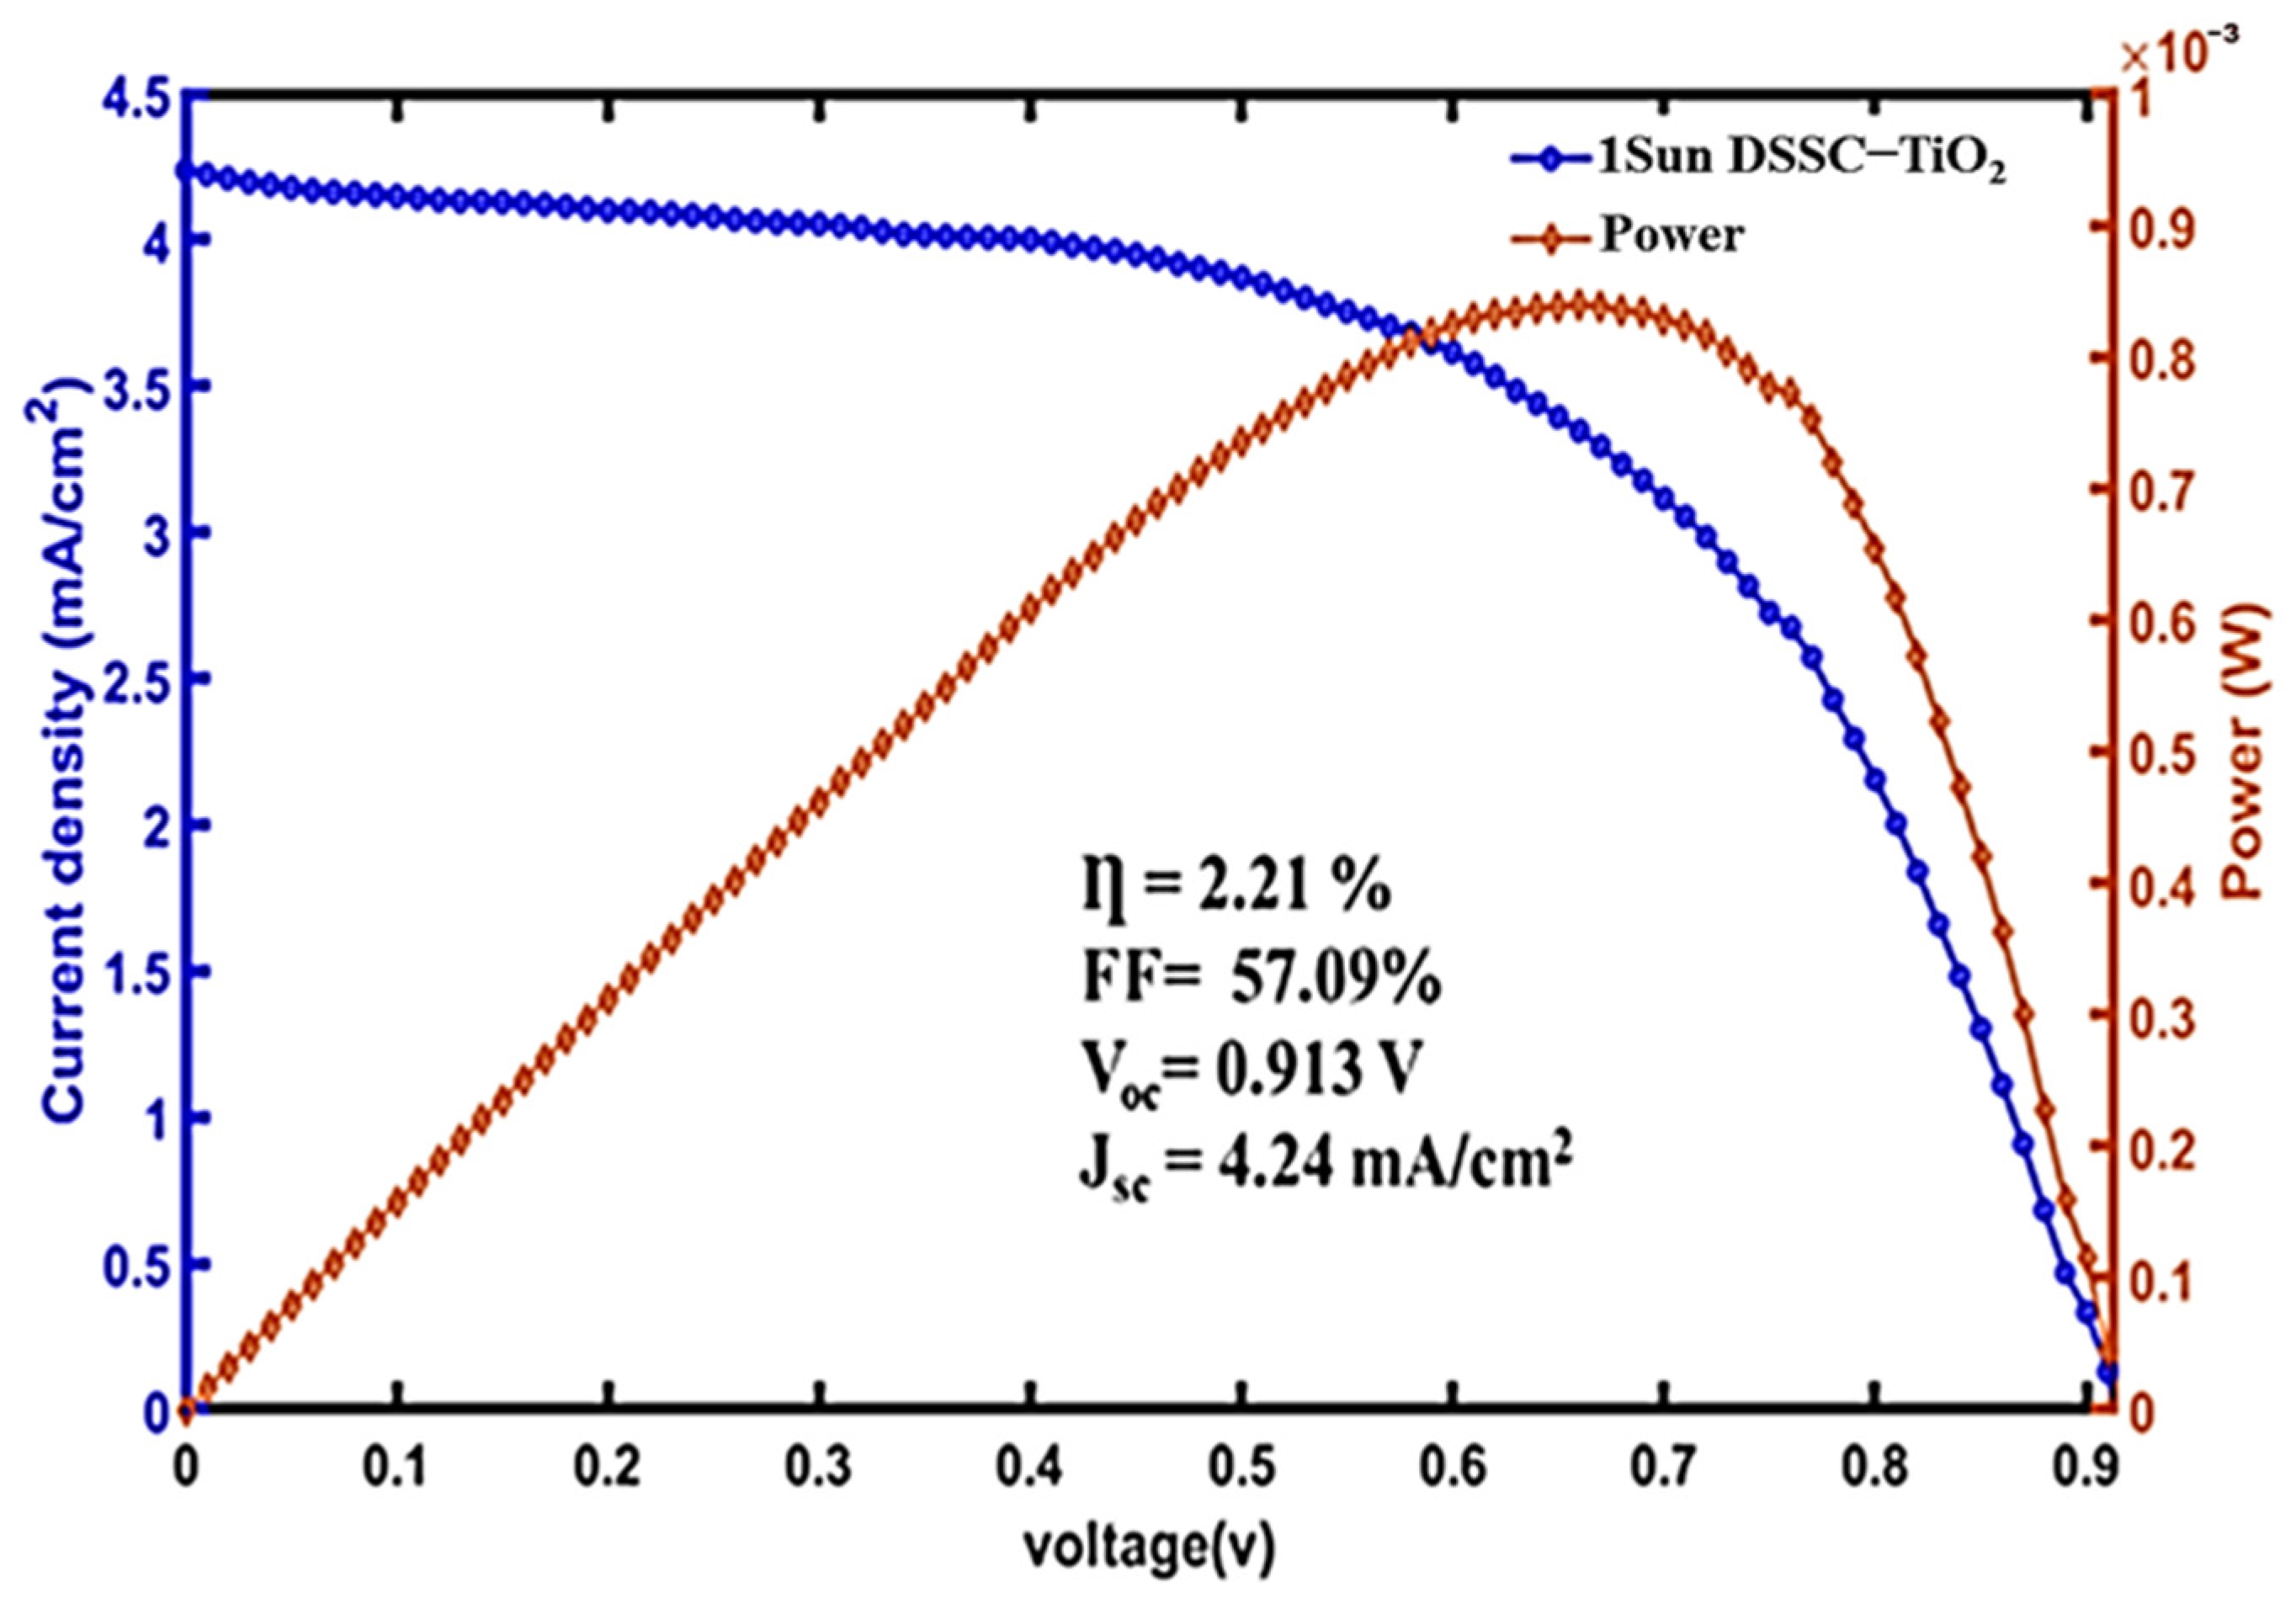
4.2.1. Results Obtained from DSSC-N Based on GRO

Figure 12a shows the J-V curve of the GRO-based DSSC-N. The J-V measurement of the planar-structure cell composed of FTO/compact-layer/Gd2Ru2O7/Hibiscus-sabdariffa/Electrolyte (I/I3)/Pt yielded an efficiency of 9.65%, which is among the best performances obtained in recent years [51,52,53], with a fill factor of 57.96%.
The open-circuit voltage VOC is around 3.82 V, which remains competitive among the developed DSSC-Ns [54]. Figure 12b shows the J-V curve of the cell in both dark and illuminated conditions. This high value of Voc can be attributed to residual polarization evidenced in the material constituting the photoanode, which participates in the resistive switching mechanism in the cell, as reported previously [11]. This can be also attributed to the thickness of the (TiO2 compact)/GRO photoanode and the nature of electrolyte. In the dark, the cell maintains a non-negligible difference of potential, which vanishes at short-circuit.

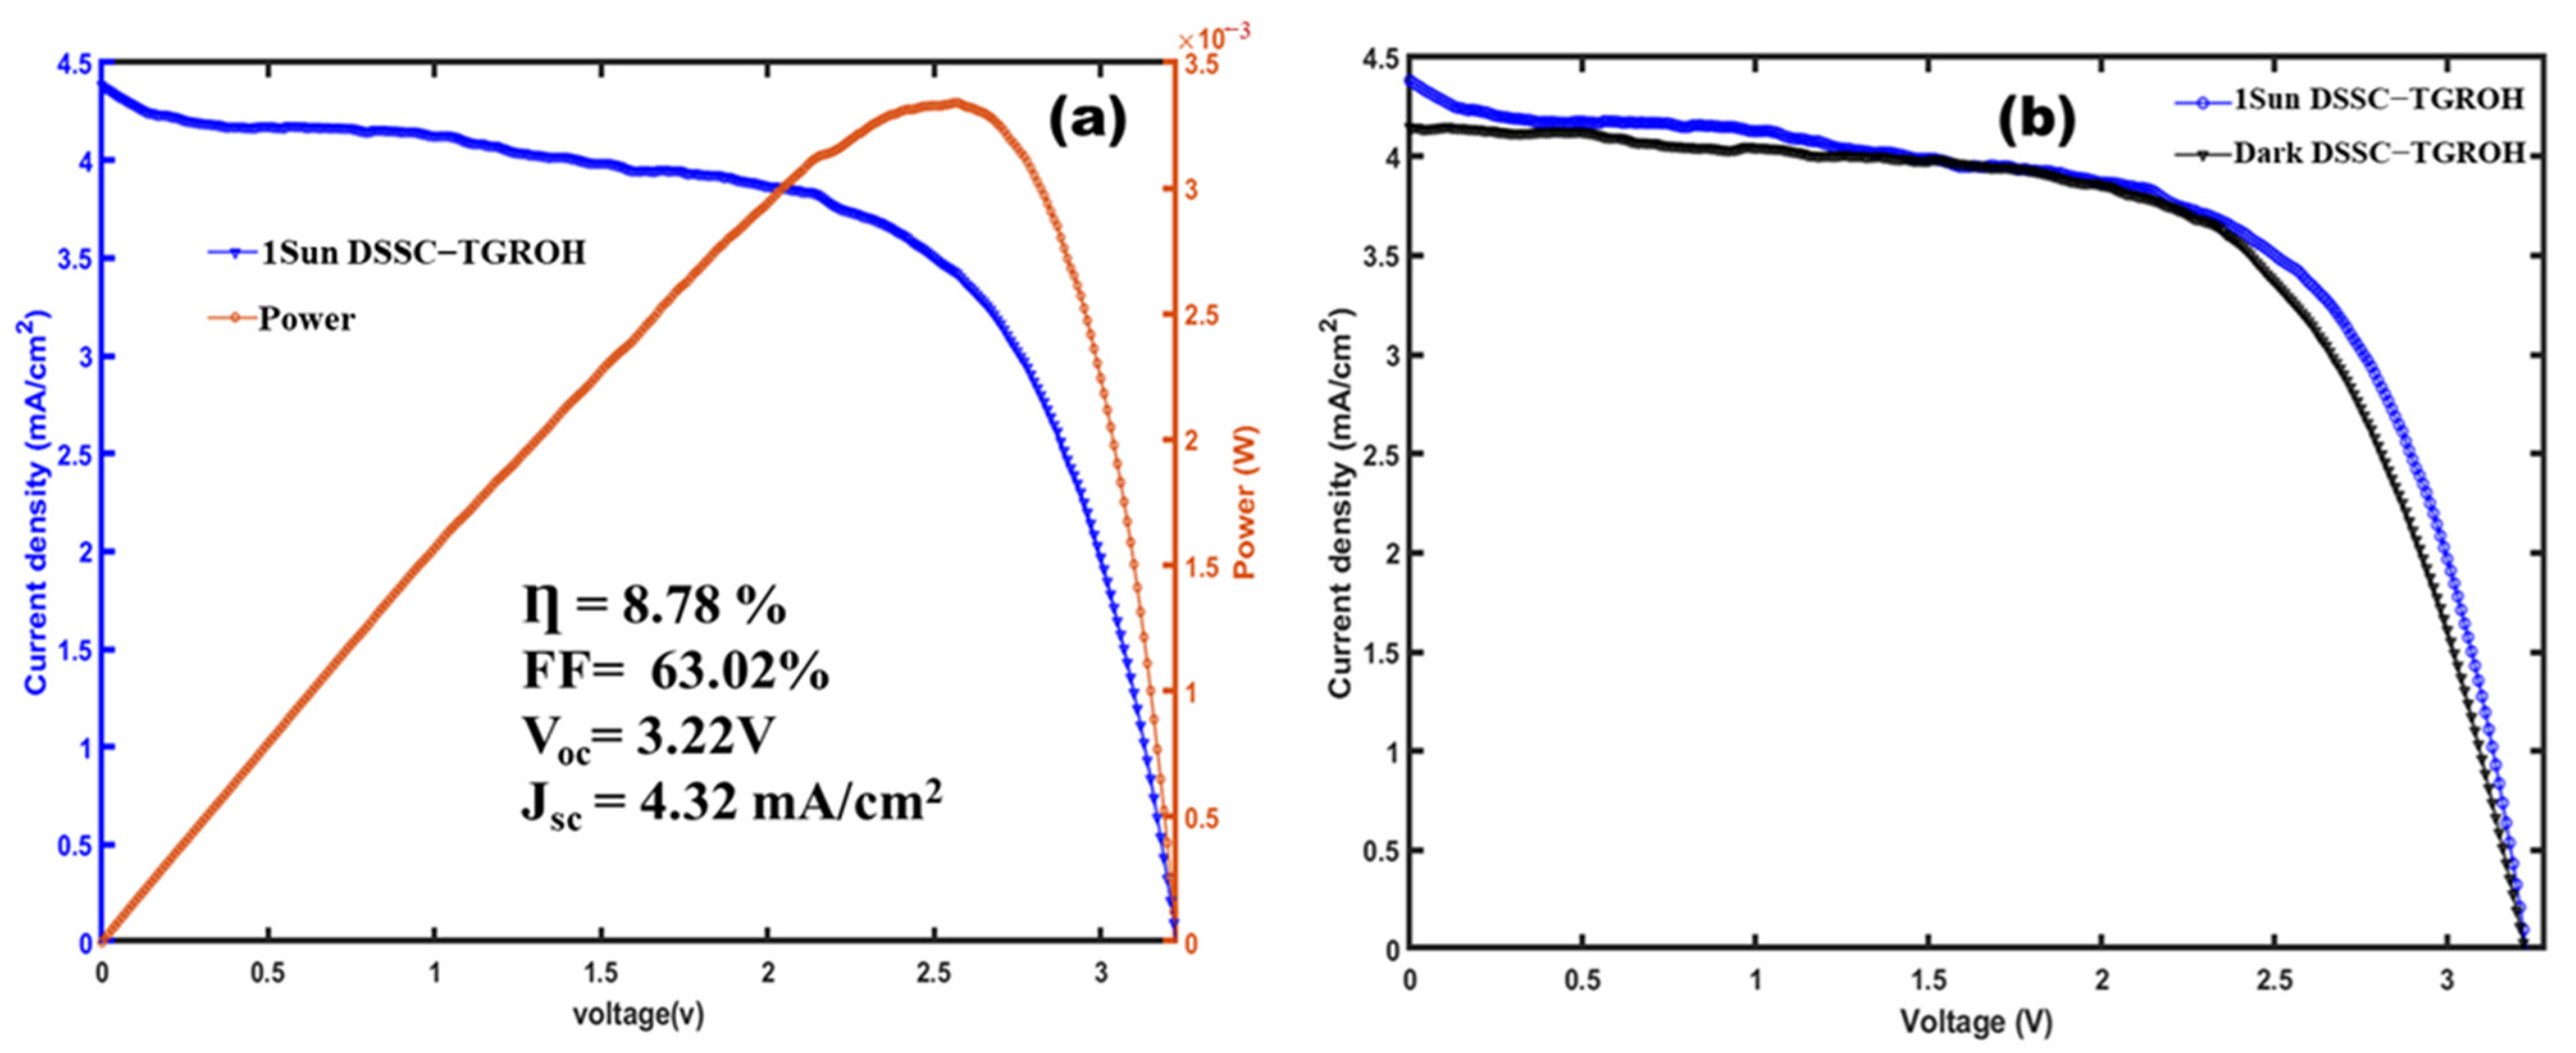
4.2.2. Results Obtained from DSSC-N Based on TGRO

Figure 13a shows the J-V curve of the DSSC-N based on the TiO2-Gd2Ru2O7 (TGRO) combined material as the photoanode. The evaluated photovoltaic device was structured as follows: FTO/compact-layer/TiO2-Gd2Ru2O7/Hibiscus-sabdariffa/Electrolyte (I/I3)/Pt. Figure 12a demonstrates, as in the case of GRO, a diode-like current density with a threshold voltage of 2.5 V and an efficiency η of 8.78%, which may be comparable to metal dye cells [55,56]. This highlights the effect of the new photoanode in the developed DSSC-N device. We obtained an improved fill factor estimated at 63.02%. Figure 13b presents measurements under both dark and solar illumination conditions. Under illumination, we obtained a VOC of 3.22 V with a current density of 4.32 mA/cm2 for an active area of 0.38 cm2. This behavior confirms photoactivity in the system and the high value obtained for Voc is attributed to the same consideration as in the previous section for GRO.

4.3. Discussion

The results obtained from the two studied devices—DSSC-N based on GRO and TGRO—are summarized in Table 1 in comparison with some reported results using oxides and the same dyes. It is worth remarking that the current density obtained in this study was not negligible, and permits to reach a high fill factor of FF, compared to the values reported in the literature. Moreover, the VOC is particular high in GRO- and TGRO-type devices and is attributed to the residual polarization in this photoanodes, as reported previously [11]. The presence of this polarization is in favor of high efficiency of these DSSC-Ns and offers a guarantee of energy production even in the absence of illumination during a short period, beneficial for practical applications.
To better understand the results obtained on the DSSC-N analyzed in this study, we produced a cell based only on TiO2 with the same electrolyte (I/I3) and the same hibiscus dye. This new solar cell is structured and assembled as follows:
FTO/compact-layer/TiO2 mesoporous/Hibiscus-sabdariffa/Electrolyte (I/I3)/Pt sequence that led to obtain a lower Voc value, confirming that the obtained values depend on the materials used as the photoanode and the type of electrolyte. Figure 14 shows the J-V curve performed on TiO2-based DSSC-N, that showed a Voc of 0.9 V, a current density (Jsc) of 4.24 mA/cm2, and a cell efficiency of 2.21%, which is higher than some reported values.
Incident Photon to Current conversion Efficiency (IPCE) measurements were performed using an OSSILA Solar Simulator, where wavelengths could be driven, and the obtained results are plotted in Figure 15. These values prove that the charge-transfer rate is not very satisfactory. However, we note that in the IR-Vis-UV range, the photoanodes are still active and improvements at the interfaces must be considered.

5. Electrical Measurements and Analysis

To better understand the mechanism of energy conversion in the DSSCs devices, we performed three complementary measurements:

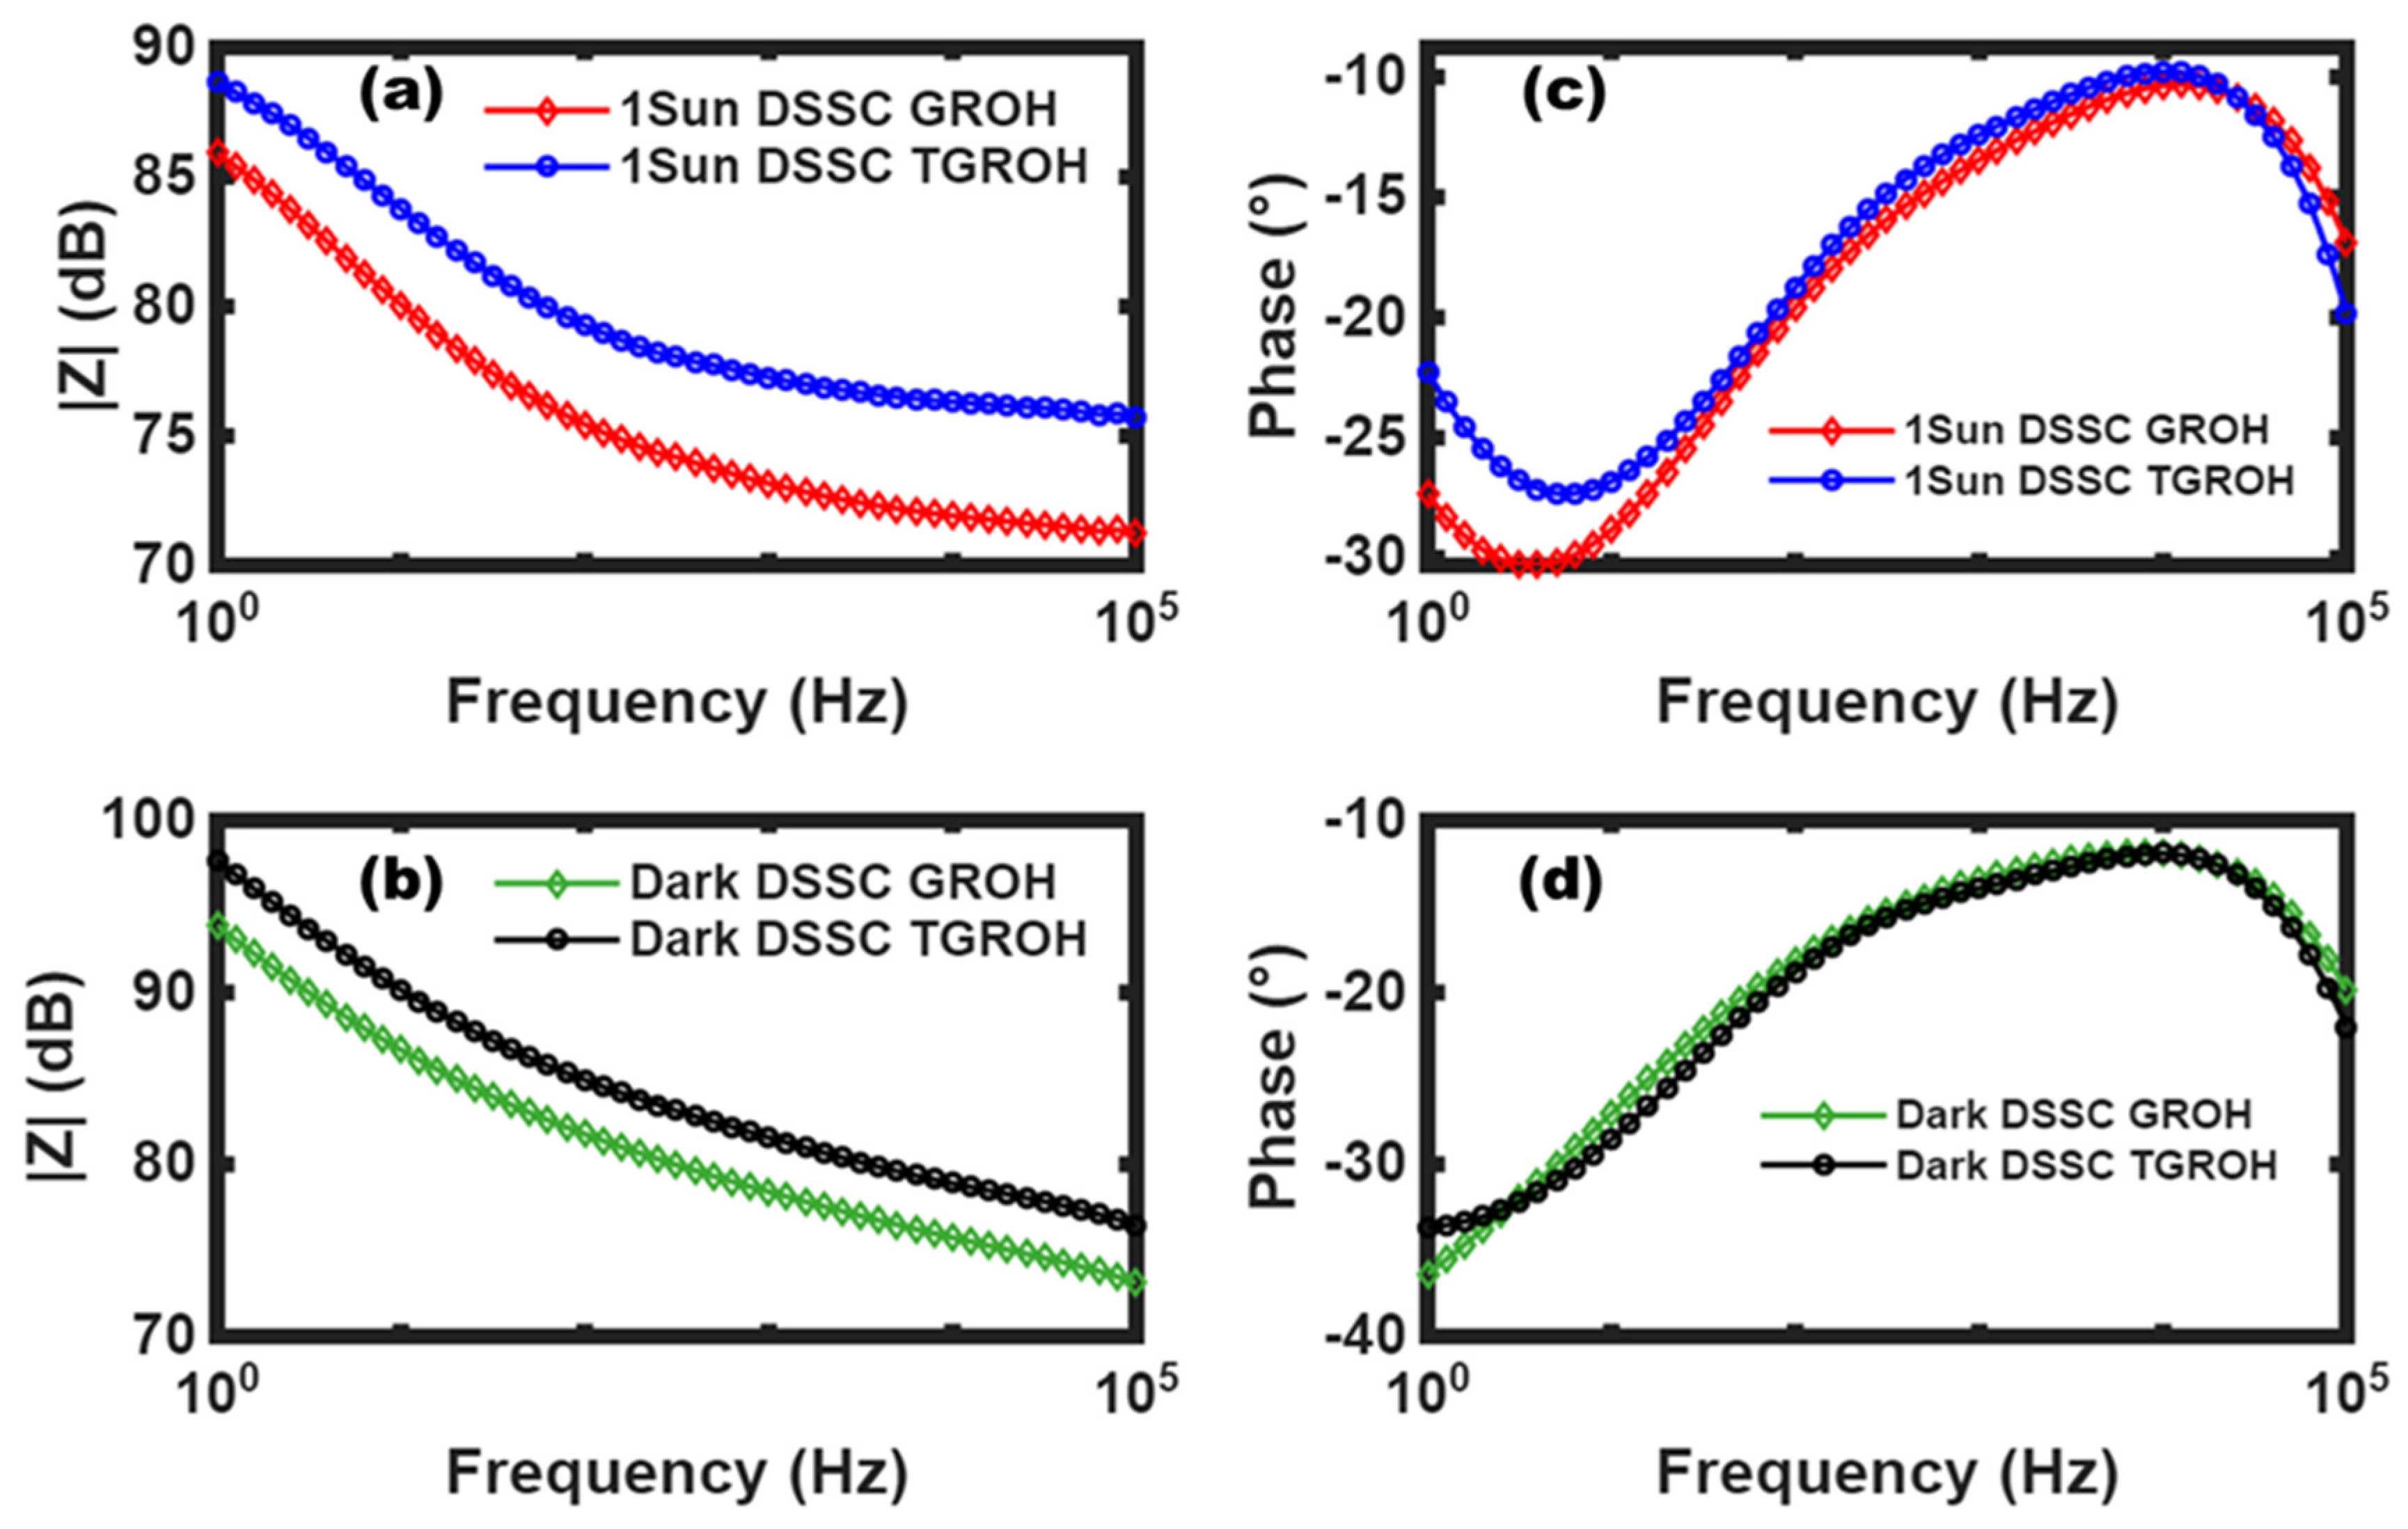
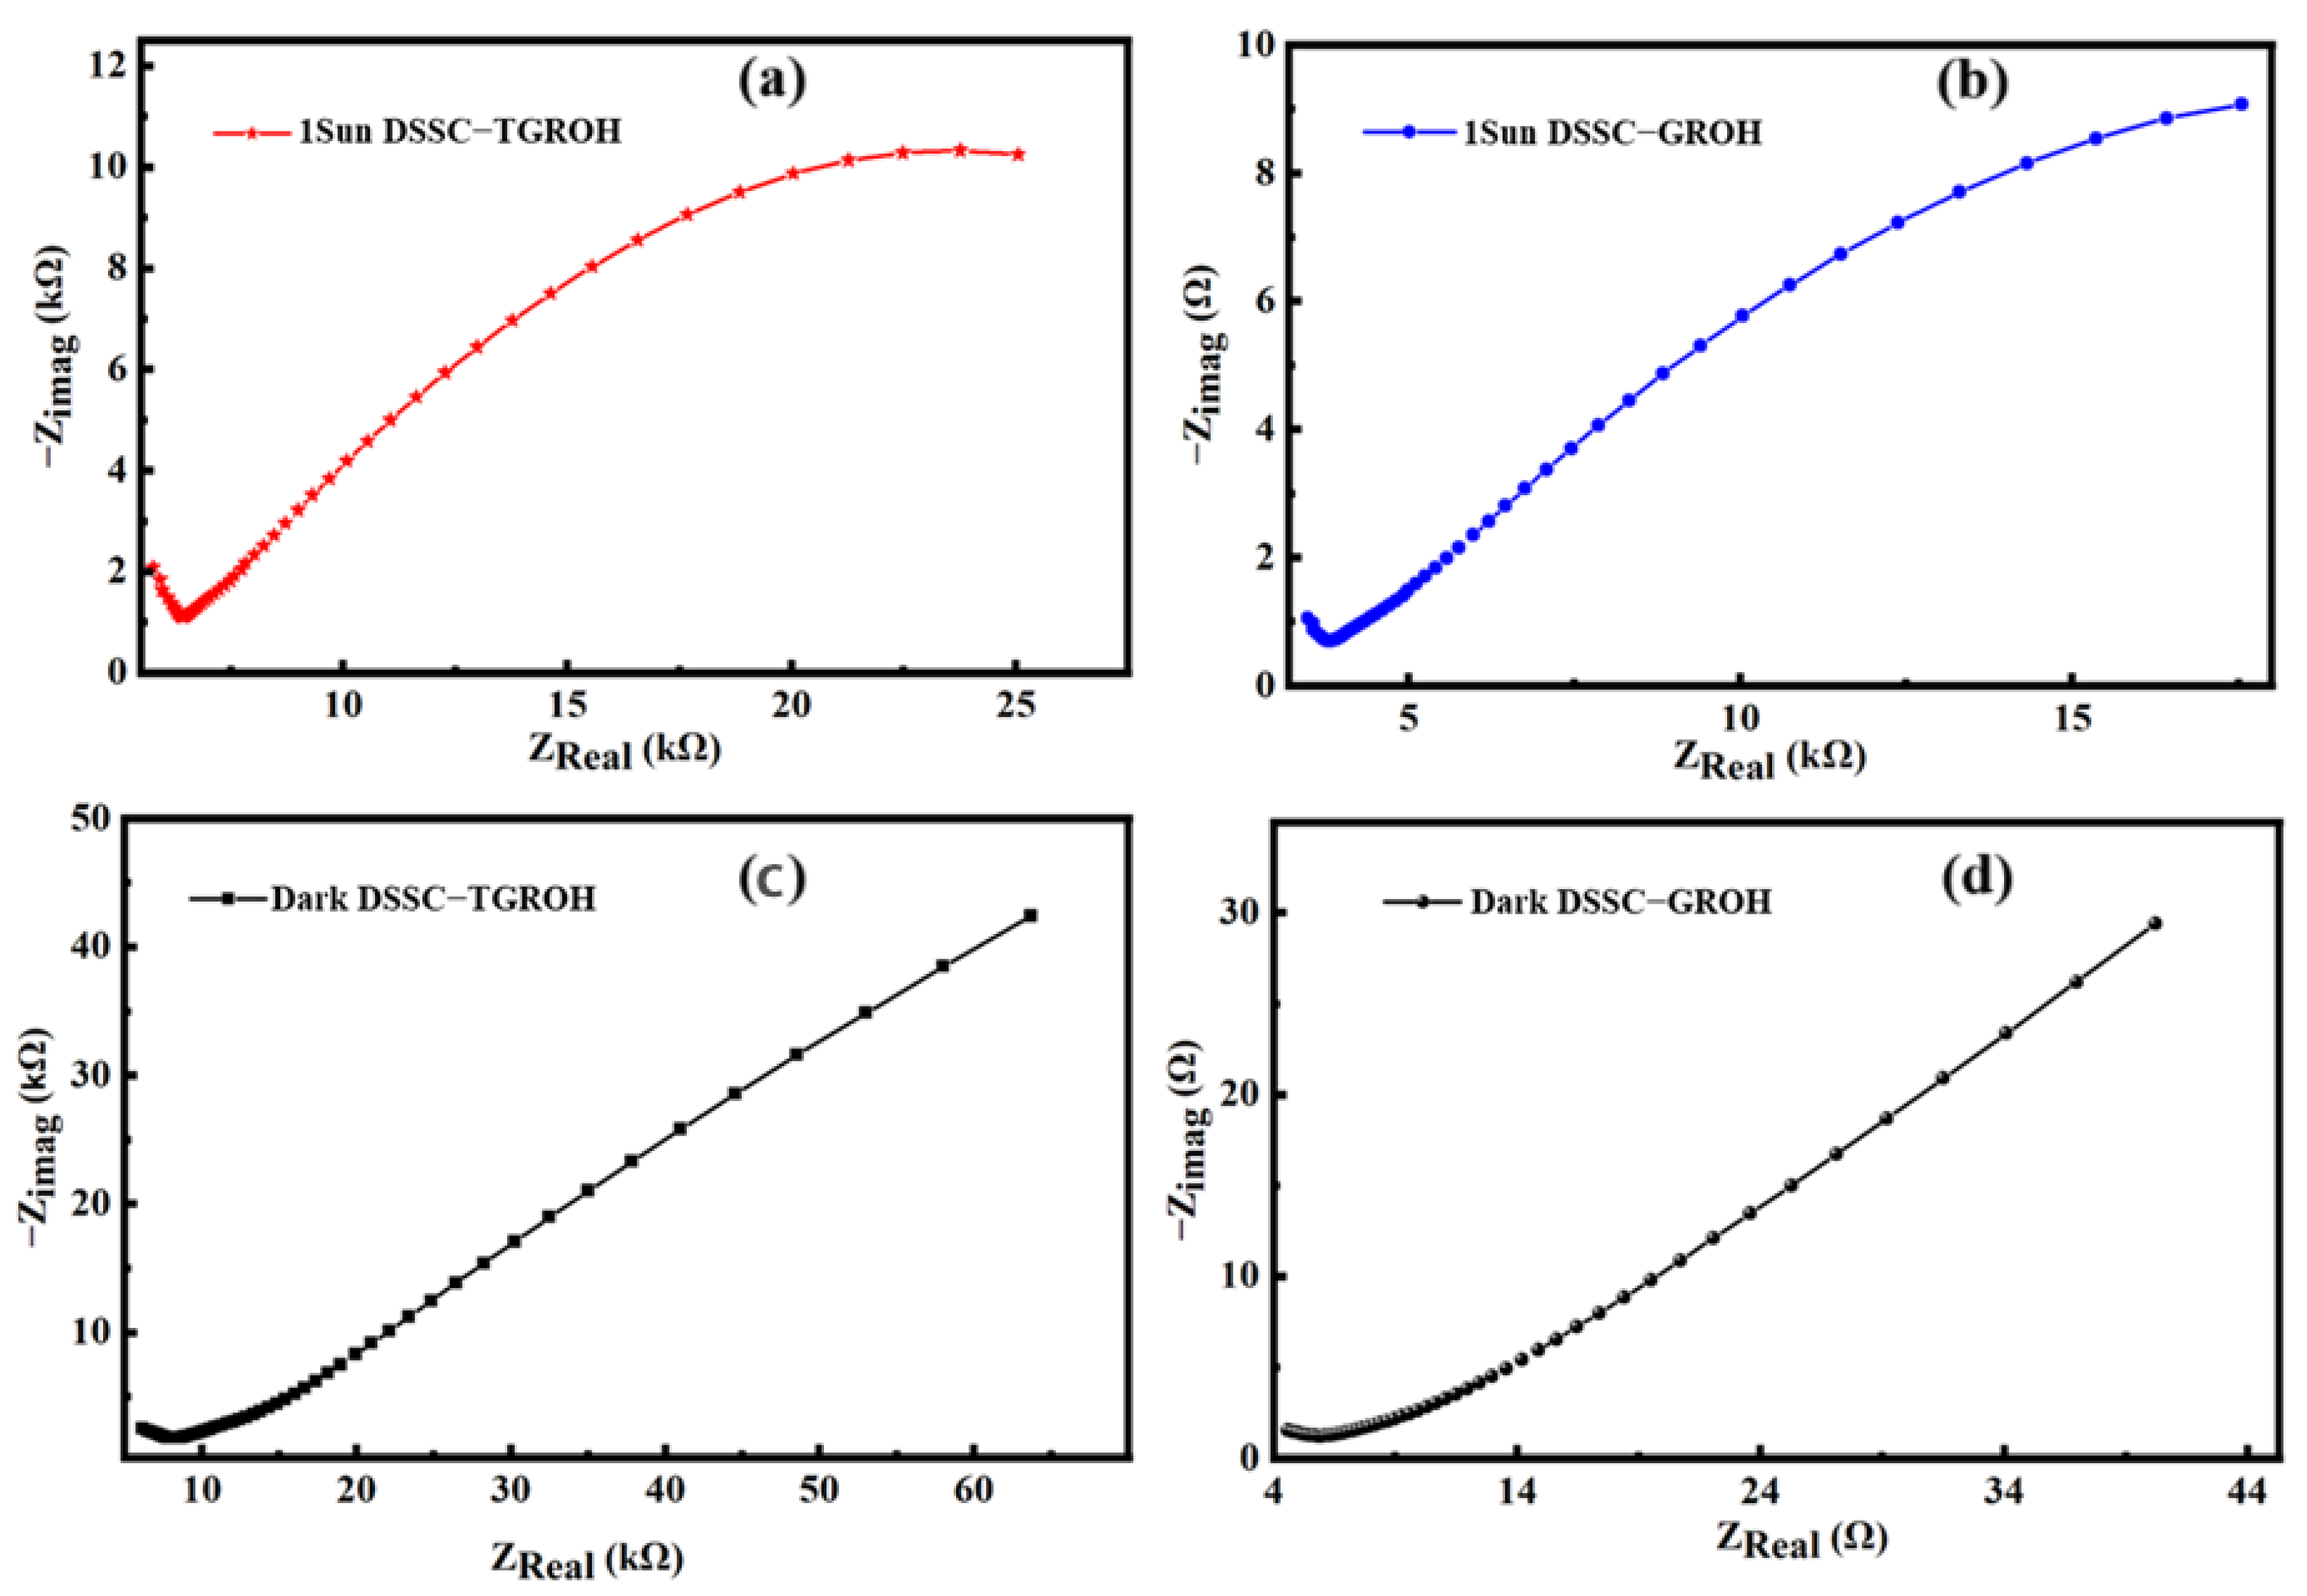
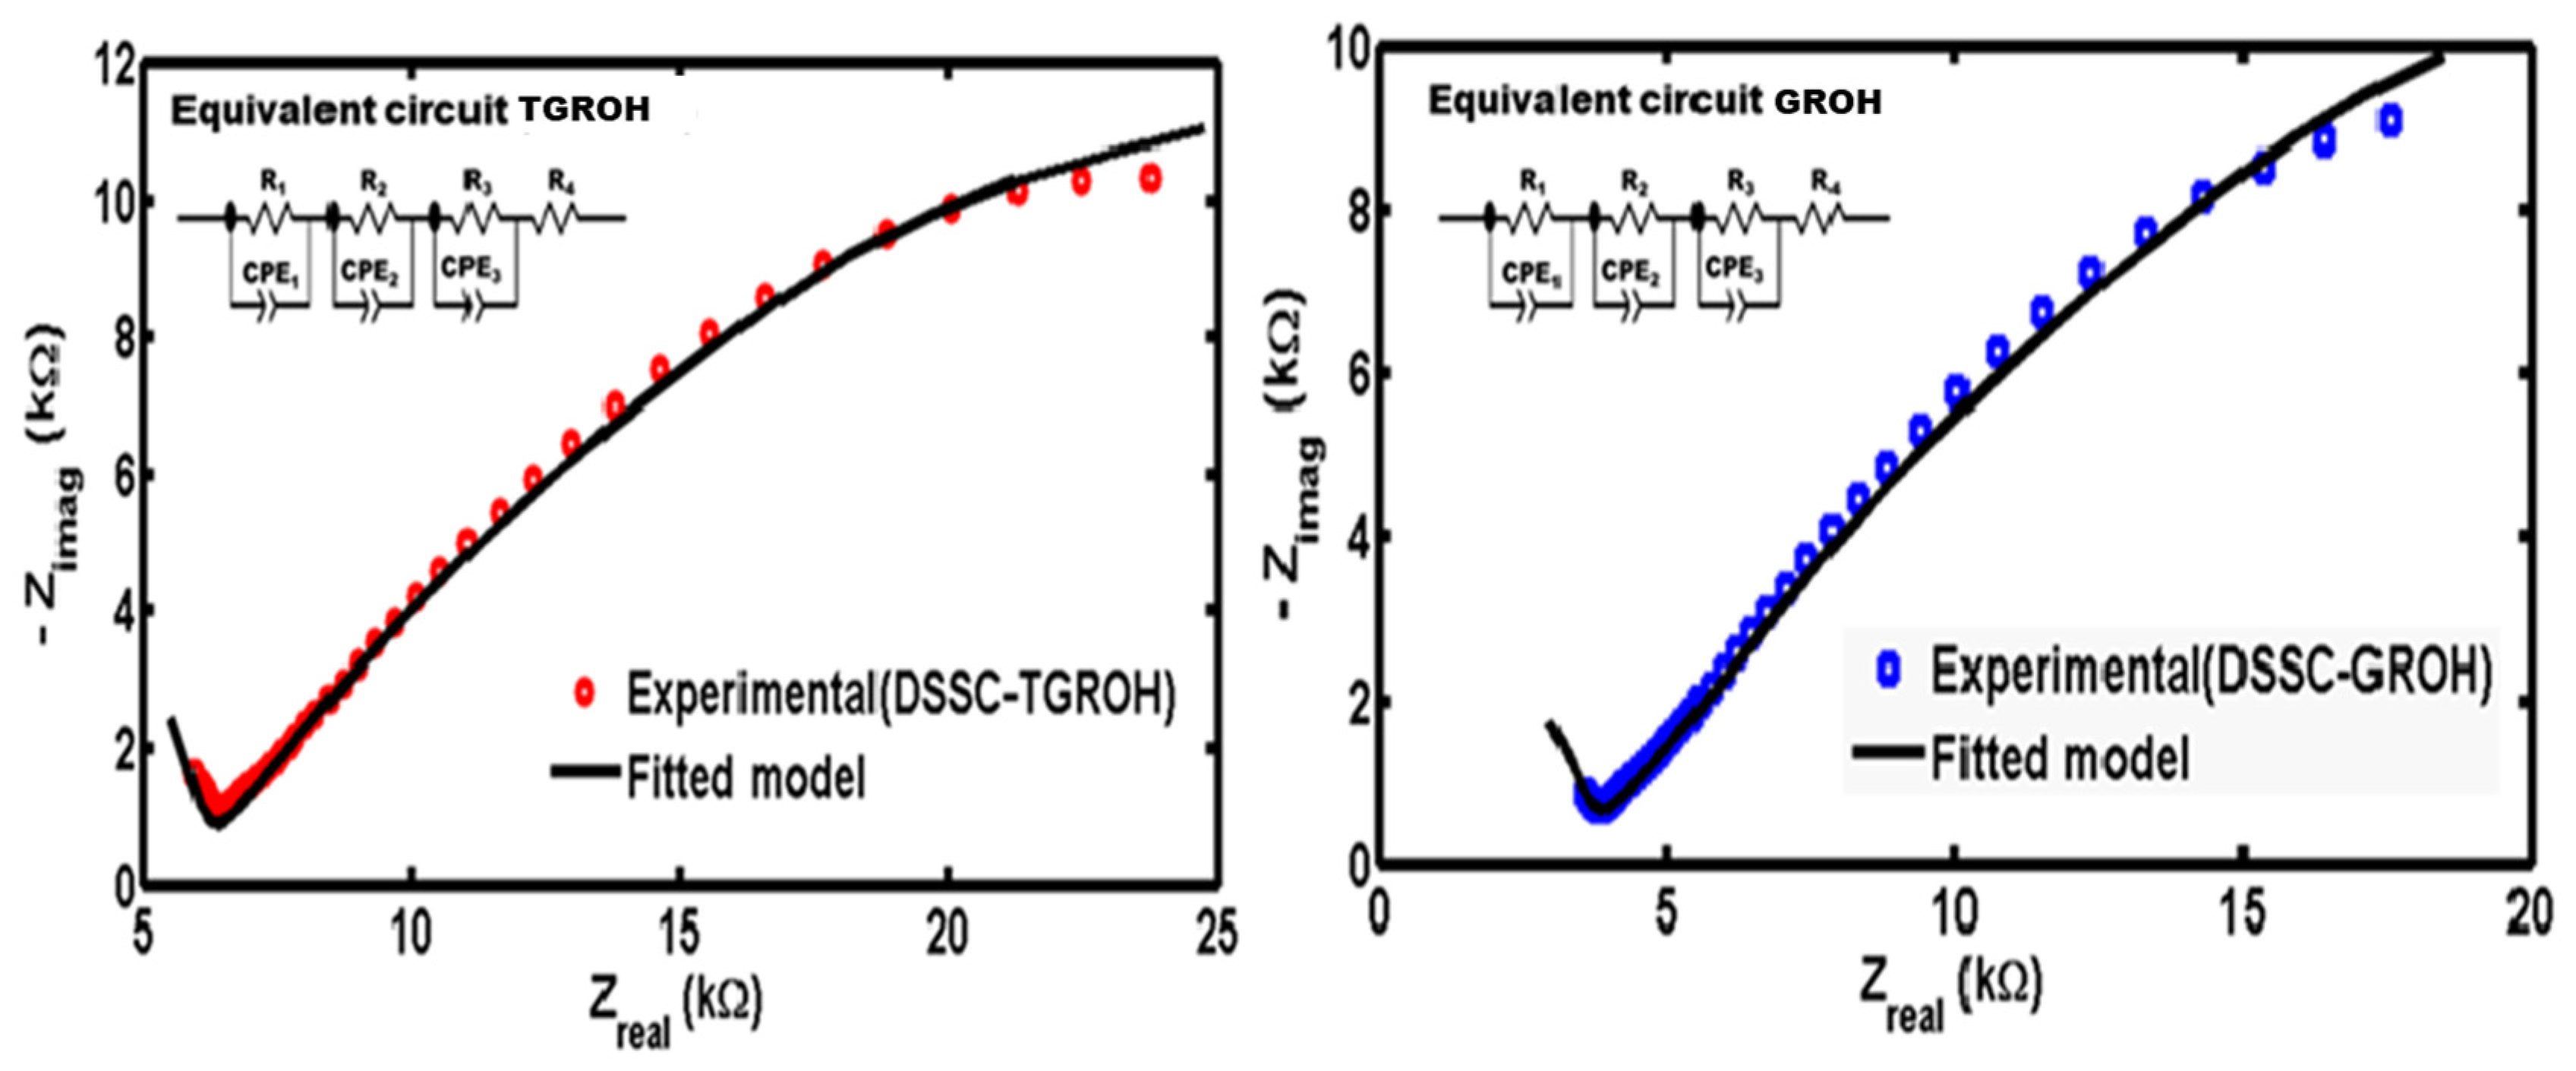
5.1. Impedance Spectroscopy

Dye-sensitized solar cells (DSSC-Ns) based on natural dyes were characterized using impedance spectroscopy to analyze the effect of frequency and the contribution of charge carriers. Indeed, the photovoltaic activity of the DSSC-N revealed the influence of the nature of the interfaces between its components, including the photoanode, electrolyte, and grain morphology, as well as the composition of the materials constituting the photoanode and the dye [18].
In Bode diagrams plotting, we highlight the impedance modulus and the angular phase shift behavior versus frequency, as shown in Figure 16. This representation consists of the calculation of 20 × log(|Z|) and arctan(Z″/Z′), plotted versus the logarithm of the frequency. Figure 16a,b shows clearly higher impedance values under dark conditions for each material (GROH or TGROH) comparatively to their impedances under illumination, indicating larger conductivity under light conditions. This confirms the photoactivity of the cells. However, the impedance of TGROH is higher than the impedance of GROH, which means that TGROH exhibits a greater recombination or less efficient electron transfer. Moreover, in Figure 16c,d we observed that GROH shows a slower response under light, especially at low frequencies, indicating better charge confinement and a longer lifetime. In contrast, TGROH is faster, but with a shallower minimum phase and more recombination [58].
To provide more information in the response analysis of our cells, we used the Nyquist representation. Figure 16a–d show the Nyquist plot impedance spectra for the two dye-sensitized solar cells that were developed in this study. Figure 17a,b show the responses of TGRO- and GRO-based DSSC under illumination, respectively, where Figure 17c,d exhibit the responses of the same devices under dark conditions. It can be observed that the DSSC exhibits higher resistance when the cell is not illuminated. On the other hand, impedance decreases under illumination, which means that conductivity increases thanks to the generation of the photocurrent. In other words, the excitation of the semiconductor leads to the creation of a greater number of mobile charge carriers, thus promoting electron–hole exchange and resulting in increased conductivity in the solar cells [59,60,61]. However, it is worth noting that the obtained impedances are significantly higher in devices containing dye extracted from hibiscus flowers. This suggests that the chemical configuration of this dye does not facilitate electronic exchange.
The DSSC device based on TGRO and GRO sensitized with the pigment extracted from African hibiscus was modeled using an equivalent electrical circuit (EEC), also known as the Randles circuit (Figure 18).
This model consists of a charge-transfer resistance R4, in series with three circuit element blocks connected in parallel. Each block includes a combination of (Ri, CPEi); where i = 1, 2, 3. In this model:
-
Ri represents pure resistance.
-
CPEi (ith Constant Phase Element) is an artificial impedance element known as Warburg impedance, with the expression:
Z C P E = 1 A ( j ω ) α
where α characterizes the deviation of the semicircle in the Nyquist plot.
-
For α = 0, the element behaves as a pure resistor.
-
For α = 1, it behaves as an ideal capacitor.
-
For intermediate values of α; when α is closer to 0, A is interpreted as an admittance, when closer to 1, it represents a capacitance.
For intermediate values of α, this element is neither a resistor nor a capacitor but an imperfect electrical component.
The three blocks in the model serve distinct functions, which can be interpreted as follow:
-
Block 1 (R1, CPE1): models the DSSC response at high frequencies, attributed to the redox activity of the electrolyte couple (I/I3) and charge transfer at the interface with the platinum (Pt) counter-electrode.
-
Block 2 (R2, CPE2): represents the intermediate frequency response, associated with the redox interaction of the dye and the charge transfer at the interface between the photoanode (GRO) and the dye.
-
Block 3 (R3, CPE3): model diffusion and conduction in the low-frequency region, attributed to ionic conduction of residual charge carriers or defects in the DSSC structure.
-
It should be noted that the series resistance R4 is often attributed to losses due to the measurement system wiring and electrodes.
This model, with three parallel charge-transfer paths, is particularly relevant for analyzing such devices [62,63,64,65]. The equivalent impedance ZDSSC [66] in the case of both DSSC is expressed as follows:
Z D S S C = R 1 1 + R 1 A 1 j ω α 1 + R 2 1 + R 2 A 2 j ω α 2 + R 3 1 + R 3 A 3 j ω α 3 + R 4
The equivalent circuit parameters are depicted in Table 2, confirming the relatively high values of the resistances. The model included an R4 negative/positive resistor value that corresponds in absolute value to the diameter of semicircle in the high-frequency region, which can be considered as the semicircle curves returning to contact with the abscissa axis in the negative part. Mathematically, the model is consistent and gives very low tuning parameters (0.015 and 0.016), due to the lack of value at higher frequencies.
Therefore, a negative resistance is meaningless physically. True resistances would correspond to half the absolute value of these negative quantities if the experiment device permitted the attainment of higher frequency values. This shows the complex mechanism process in these DSSC devices.

5.2. Electrical I-V Measurements and Analysis

The I–V responses of the DSSC cells fabricated in this study were fitted using the two-diode model, by also introducing an advanced electrical representation that accounts for various imperfections and mechanisms present within the device. The electrical model of a two-diode DSSC photovoltaic cell includes the following elements:
-
A photogenerated current source (Iph), which represents the current generated by light absorption, which is proportional to the incident light irradiance.
-
Two diodes connected in parallel: the first diode models the main junction and recombination within the photoactive layer, and the second diode accounts for more complex recombination phenomena, such as those occurring in the electrolyte or material interfaces.
-
The overall circuit also includes two resistances: RS (series resistance), representing ohmic losses in electrodes, contacts, and connections and RSh (shunt resistance), simulating leakage current losses due to internal imperfections or short circuits.
The output current of the circuit is expressed as follows:
I = I p h I 0 1 exp α 1 V + I R s n 1 k T 1 I 0 2 exp α 2 V + I R s n 2 k T 1 V + I R s R s h
with:
  • I01, I02: saturation currents of the diodes
  • n1, n2: ideality factors (ranging from 1 to 2 for n1 and from 2 to 3 for n2)
  • q: elementary charge (1.602 × 10⁻¹⁹ C)
  • k: Boltzmann constant (1.381 × 10⁻²³ SI units)
  • T: temperature in Kelvin (T = 298 K)
  • V: voltage across the cell terminals
  • α1, α2: coefficients introduced to account for differences in the redox activity of the cell’s redox couples, with values between 0 and 1
In the context of a Dye-Sensitized Solar Cell (DSSC), the proposed model accounts for slow electron recombination processes, which are strongly influenced by the nature of the dye layer and the electrolyte. It also incorporates electronic injection phenomena from the dye into the semiconductor—specifically, the photoanode materials such as GRO and TGRO. This approach allows for a more refined modeling of the internal physical processes that directly affect cell performance. In each of its terms, the equation used reflects the output current of the diode. Its solution relies on robust numerical methods, such as zero-finding using the Newton–Raphson method, or parameter fitting through optimization using the least squares method. These techniques enable the precise identification of model parameters based on experimental data using the Matlab software to solve the equation. It specifically uses the “lsqcurvefit” function, which is well-suited for nonlinear model fitting.
Figure 19 illustrates the results obtained by fitting the current–voltage (I–V) characteristic curve measured from the experimental TGROH photovoltaic cell. The extracted parameters from this optimization process are detailed in Table 3, showing a strong correlation between the proposed model and the experimental data. This consistency validates both the relevance of the model and the reliability of the numerical method used. The results presented in Table 3 indicate overall satisfactory performance of the TGROH photovoltaic cell, with an average efficiency of approximately 10.75%, in agreement with the available experimental data. This cell contains hibiscus dye, and the efficiency level demonstrates a good overall system operation. However, the open-circuit voltage (VOC) appears to be significantly higher than values generally reported in the literature. This discrepancy may be attributed to several defects in the system, such as the presence of voids, bubbles, dust, or irregularities at material interfaces, as well as to slow recombination phenomena between the dye, electrolyte, and semiconductor. These effects directly influence the quality of the charge separation and transport related to the cell assembly. Figure 19 shows the experiment and the fitted I-V curve for GROH-, TGROH-, and TiO2-based DSSC. Indeed, the proposed model satisfactorily corroborated the three J-V curves, with deduced coefficients summarized in Table 3.

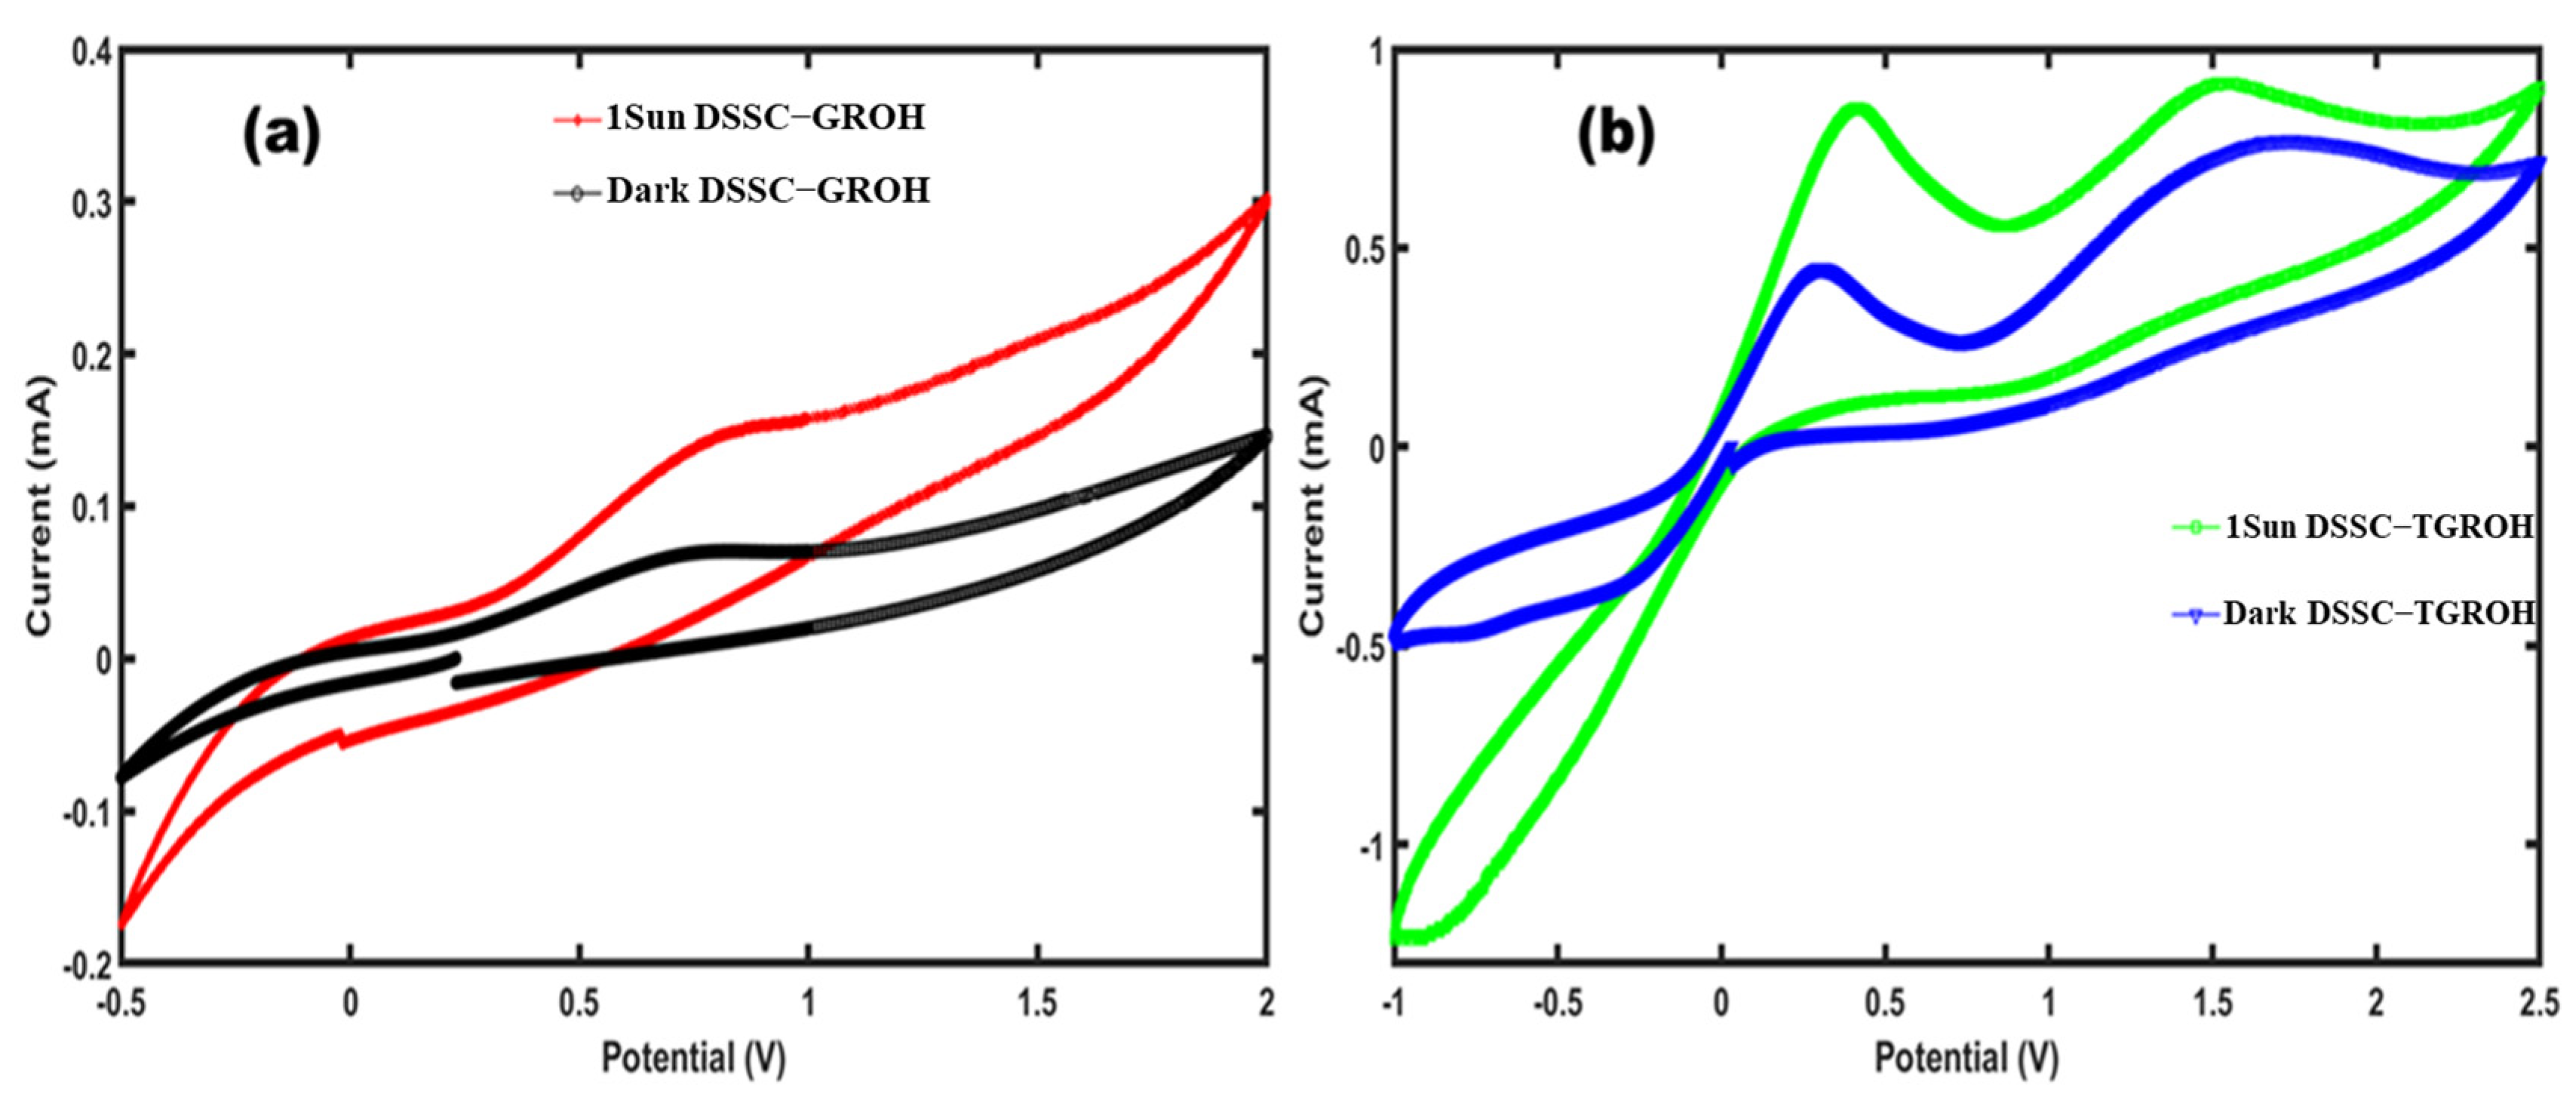
5.3. Cyclic Voltammetry

We characterized the DSSC cells by cyclic voltammetry measurements. Figure 18 shows the electrochemical curves obtained from the DSSC devices sensitized to hibiscus extracts.
Two peaks were observable in the both figures. They were observable at 0.45 V and 1.50 V in the TGROH device (Figure 20a), which were downshifted at −0.12 V and 0.75 V in the GROH device (Figure 20b), respectively. The first peaks, which appear at 0.45 V and −0.12 V in TGROH (Figure 20a) and GROH (Figure 20b), respectively, are affected to the reduction of the I3/I mediator, which corresponds to the reduction of triiodide (I3) into iodide (I). This reaction is essential for the proper functioning of the DSSC, as it allows for the regeneration of the dye after electron injection into the TGRO (TiO2−GRO) or GRO photoanodes. These first peaks indicate good electrochemical activity of the mediator. It should be noted that the intensity of the peaks does not decrease over time, ensuring the stability of the redox couple.
The second peaks, observable at 1.5 V (Figure 20a) and 0.4 V (Figure 20b), correspond to the oxidation of the dye, which in this case is extracted from hibiscus. This process signifies the return of the dye to its initial state after injecting an electron into the TGRO or GRO. The position of the peak remains stable in each DSSC device, indicating that the dye remains electrochemically active.
The asymmetry of the curves relative to zero is normal and can be explained by the relatively slow redox reactions in a DSSC, and the different types of redox as they involve coupled processes (electron transfer, diffusion of species in the electrolyte, and interactions with the photoanode). Indeed, the dye and the mediator do not have identical electrochemical kinetics. One may be faster than the other, creating differences between oxidation and reduction. There are also charge transport limitations, for example, if the electrode or electrolyte slows down the diffusion of redox species.

6. Conclusions

Our study highlights the pivotal role of the new photoanode material, gadolinium ruthenate pyrochlore oxide, in enhancing the performances of the natural dye-sensitized solar cells developed in this study. This material has demonstrated high absorption capacity and reduced dye adhesion time, placing it among the promising photoanodes for DSSC−N devices. The thickness of each deposited layer in the DSSC−N devices was determined using different techniques (SEM, AFM, and ellipsometry and profilometer) which led to almost the same values. This study enabled us to achieve a power conversion efficiency of 9.65% and an open-circuit voltage of 3.82 V for DSSC-Ns based on GRO and Hibiscus sabdariffa. Furthermore, the investigation of the device based on the TGRO photoanode resulted in an efficiency of 8.78%, with a new open-circuit voltage record of 3.22 V for an active area of 0.38 cm2. Using impedance spectroscopy measurement and current–voltage fitting, we evidenced the mechanism of conductivity and the charge carrier’s contribution or defect contributions in the DSSC cells.
Through cyclic voltammetry measurements, we evidenced the redox activities of hibiscus dye and electrolyte (I/I3), which exhibit electrochemical processes in addition to photovoltaic response. These findings underscore the promise of these new materials in the field of natural dye-sensitized solar cells and their potential for future applications in photovoltaic technologies.

Author Contributions

Conceptualization, A.F.K. and Y.G.; methodology, A.F.K. and Y.G.; software, A.F.K. and Y.G.; validation, A.S.Y. and J.K.D.; investigation, A.F.K. and Y.G.; resources, M.E.M.; data curation, Y.G., M.V. and A.F.; writing—original draft preparation, A.F.K.; writing—review and editing, J.K.D.; visualization, A.S.Y. and M.E.M.; supervision, Y.G., M.E.M. and A.S.Y.; project administration, Y.G.; funding acquisition, Y.G. All authors have read and agreed to the published version of the manuscript.

Funding

This work was founded by French Embassy in Cuba via Grant agreement No. PR-24-101, PHC CARLOS J. FINLAY 2025 N°53498YD and Ministry of Higher Education and Scientific Research of Côte d’Ivoire.

Data Availability Statement

Data is contained within the article. Further inquiries can be directed to the corresponding authors.

Acknowledgments

A.F.K. and Y.G. thank Bouchra Asbani for cyclic voltammetry and Sebastien Saitzek for electrochemical analysis.

Conflicts of Interest

The authors declare no conflict of interest.

References

  1. Ghazy, A.; Safdar, M.; Lastusaari, M.; Savin, H.; Karppinen, M. Advances in Upconversion Enhanced Solar Cell Performance. Sol. Energy Mater. Sol. Cells 2021, 230, 111234. [Google Scholar] [CrossRef]
  2. De Wild, J.; Meijerink, A.; Rath, J.K.; Van Sark, W.G.J.H.M.; Schropp, R.E.I. Upconverter Solar Cells: Materials and Applications. Energy Environ. Sci. 2011, 4, 4835. [Google Scholar] [CrossRef]
  3. Khan, M.; Iqbal, M.A.; Malik, M.; Hashmi, S.U.M.; Bakhsh, S.; Sohail, M.; Qamar, M.T.; Al-Bahrani, M.; Capangpangan, R.Y.; Alguno, A.C.; et al. Improving the Efficiency of Dye-Sensitized Solar Cells Based on Rare-Earth Metal Modified Bismuth Ferrites. Sci. Rep. 2023, 13, 3123. [Google Scholar] [CrossRef] [PubMed]
  4. Shougaijam, B.; Singh, S.S. Fabrication of Ag Nanoparticle Assisted TiO2 Nanowire Photoanode at Low Temperature for Flexible DSSC Applications. In Proceedings of the 2022 IEEE Silchar Subsection Conference (SILCON), Silchar, India, 4–6 November 2022; pp. 1–4. [Google Scholar]
  5. Nien, Y.-H.; Yong, Z.-R.; Chou, J.-C.; Lai, C.-H.; Kuo, P.-Y.; Ho, C.-S.; Lin, Y.-C.; Wu, Y.-T.; Syu, R.-H. The Photovoltaic Performance of the DSSC with the Photoanode Modified by γ-Fe2O3/TiO2 Nanofibers Under Low Illumination. IEEE J. Photovolt. 2022, 12, 618–624. [Google Scholar] [CrossRef]
  6. Lin, C.; Choudhury, B.D.; Ybarra, R.; Shawon, S.M.A.Z.; Majumder, H.; Soliz-Martinez, J.; Dimakis, N.; Lozano, K.; Uddin, M.J. Tailoring the Structure–Property Relationships of Innovative Flowerlike TiO2 Structures in a Fiber-Shaped Dye-Sensitized Solar Cell. ACS Appl. Energy Mater. 2024, 7, 2329–2337. [Google Scholar] [CrossRef]
  7. Najafabadi, H.A.; Ahmadi, M.; Ghanaatshoar, M. The Influence of Radio-Frequency Sputtered Blocking Layer on Boosting the Performance of BaSnO3-Based Dye-Sensitized Solar Cell. Thin Solid Films 2021, 717, 138346. [Google Scholar] [CrossRef]
  8. Aguilar, T.; Navas, J.; De Los Santos, D.M.; Sánchez-Coronilla, A.; Fernández-Lorenzo, C.; Alcántara, R.; Gallardo, J.J.; Blanco, G.; Martín-Calleja, J. TiO2 and Pyrochlore Tm2Ti2O7 Based Semiconductor as a Photoelectrode for Dye-Sensitized Solar Cells. J. Phys. Appl. Phys. 2015, 48, 145102. [Google Scholar] [CrossRef]
  9. Banerjee, A. Stability of the Pyrochlore Tm2Ru2O7(s) & Comparison of Its Stability with Other Heavy Rare Earth Ruthenium Pyrochlores. Solid State Ion. 2019, 332, 63–69. [Google Scholar] [CrossRef]
  10. Abbas, Z.; Naz, A.; Hussain, S.; Muhammad, S.; Algarni, H.; Ali, A.; Jung, J. First-Principles Calculations to Investigate Structural, Electronic, Optical and Magnetic Properties of Pyrochlore Oxides Eu2Tm2O7 (Tm = Hf, Sn, Zr) for Energy Applications. Inorganics 2023, 11, 193. [Google Scholar] [CrossRef]
  11. Kraidy, A.F.; Yapi, A.S.; El Marssi, M.; Penton Madrigal, A.; Gagou, Y. Structural Refinement and Optoelectrical Properties of Nd2Ru2O7 and Gd2Ru2O7 Pyrochlore Oxides for Photovoltaic Applications. Materials 2024, 17, 2571. [Google Scholar] [CrossRef]
  12. Munawar, K.; Mansoor, M.A.; Olmstead, M.M.; Yusof, F.B.; Misran, M.B.; Basirun, W.J.; Mazhar, M. Pyrochlore-Structured Y2Ti2O7–2TiO2 Composite Thin Films for Photovoltaic Applications. J. Aust. Ceram. Soc. 2019, 55, 921–932. [Google Scholar] [CrossRef]
  13. Saud, P.S.; Bist, A.; Kim, A.A.; Yousef, A.; Abutaleb, A.; Park, M.; Park, S.-J.; Pant, B. Dye-Sensitized Solar Cells: Fundamentals, Recent Progress, and Optoelectrical Properties Improvement Strategies. Opt. Mater. 2024, 150, 115242. [Google Scholar] [CrossRef]
  14. Zhang, Y.; Zhang, S.; Wang, K.; Ding, F.; Wu, J. Surfactant-Free Solvothermal Method for Synthesis of Mesoporous Nanocrystalline TiO2 Microspheres with Tailored Pore Size. J. Nanomater. 2013, 2013, 294020. [Google Scholar] [CrossRef]
  15. Greul, E.; Docampo, P.; Bein, T. Synthesis of Hybrid Tin Halide Perovskite Solar Cells with Less Hazardous Solvents: Methanol and 1,4-Dioxane. Z. Anorg. Allg. Chem. 2017, 643, 1704–1711. [Google Scholar] [CrossRef]
  16. Wang, C.-C.; Ying, J.Y. Sol−Gel Synthesis and Hydrothermal Processing of Anatase and Rutile Titania Nanocrystals. Chem. Mater. 1999, 11, 3113–3120. [Google Scholar] [CrossRef]
  17. Lavudya, P.; Pant, H.; Srikanth, V.V.S.S.; Ammanabrolu, R. Mesoporous and Phase Pure Anatase TiO2 Nanospheres for Enhanced Photocatalysis. Inorg. Chem. Commun. 2023, 152, 110699. [Google Scholar] [CrossRef]
  18. Nakamoto, T.; Higuchi, K.; Taguchi, K. Investigation of Rutile and Anatase Mesoporous SiO2@TiO2 Particles in the Scattering Layer of Dye-Sensitized Solar Cells. IEEJ Trans. Electr. Electron. Eng. 2024, 19, 285–287. [Google Scholar] [CrossRef]
  19. Diallo, A.; Zongo, S.; Mthunzi, P.; Rehman, S.; Alqaradawi, S.Y.; Soboyejo, W.; Maaza, M. Z-Scan and Optical Limiting Properties of Hibiscus Sabdariffa Dye. Appl. Phys. B 2014, 117, 861–867. [Google Scholar] [CrossRef]
  20. Narayan, M.R. Review: Dye Sensitized Solar Cells Based on Natural Photosensitizers. Renew. Sustain. Energy Rev. 2011, 16, 208–215. [Google Scholar] [CrossRef]
  21. Grajeda-Iglesias, C.; Figueroa-Espinoza, M.C.; Barouh, N.; Baréa, B.; Fernandes, A.; De Freitas, V.; Salas, E. Isolation and Characterization of Anthocyanins from Hibiscus sabdariffa Flowers. J. Nat. Prod. 2016, 79, 1709–1718. [Google Scholar] [CrossRef]
  22. Syafinar, R.; Gomesh, N.; Irwanto, M.; Fareq, M.; Irwan, Y.M. Optical characterization using nature based dye extracted from hibiscus’s flower. ARPN J. Eng. Appl. Sci. 2015, 10, 6336–6340. [Google Scholar]
  23. Giusti, M.M.; Wrolstad, R.E. Characterization and Measurement of Anthocyanins by UV-Visible Spectroscopy. Curr. Protoc. Food Anal. Chem. 2001, F1.2.1–F1.2.13. [Google Scholar] [CrossRef]
  24. Yuniati, Y.; Elim, P.E.; Alfanaar, R.; Kusuma, H.S.; Mahfud. Extraction of Anthocyanin Pigment from Hibiscus Sabdariffa l. by Ultrasonic-Assisted Extraction. IOP Conf. Ser. Mater. Sci. Eng. 2021, 1010, 012032. [Google Scholar] [CrossRef]
  25. Mahajan, U.; Prajapat, K.; Dhonde, M.; Sahu, K.; Shirage, P.M. Natural Dyes for Dye-Sensitized Solar Cells (DSSCs): An Overview of Extraction, Characterization and Performance. Nano-Struct. Nano-Objects 2024, 37, 101111. [Google Scholar] [CrossRef]
  26. Cui, T.; Su, Y.; Fu, X.; Zhu, Y.; Zhang, Y. The Key Role of Surface Hydroxyls on the Activity and Selectivity in Photocatalytic Degradation of Organic Pollutants and NO Removal. J. Alloys Compd. 2022, 921, 165931. [Google Scholar] [CrossRef]
  27. Makuła, P.; Pacia, M.; Macyk, W. How To Correctly Determine the Band Gap Energy of Modified Semiconductor Photocatalysts Based on UV–Vis Spectra. J. Phys. Chem. Lett. 2018, 9, 6814–6817. [Google Scholar] [CrossRef]
  28. Gu, P.; Yang, D.; Zhu, X.; Sun, H.; Wangyang, P.; Li, J.; Tian, H. Influence of Electrolyte Proportion on the Performance of Dye-Sensitized Solar Cells. AIP Adv. 2017, 7, 105219. [Google Scholar] [CrossRef]
  29. Sadek, O.; Touhtouh, S.; Rkhis, M.; Anoua, R.; El Jouad, M.; Belhora, F.; Hajjaji, A. Synthesis by Sol-Gel Method and Characterization of Nano-TiO2 Powders. Mater. Today Proc. 2022, 66, 456–458. [Google Scholar] [CrossRef]
  30. Icli, K.C.; Yavuz, H.I.; Ozenbas, M. Production of Core–Shell Type Conducting FTO/TiO2 Photoanode for Dye Sensitized Solar Cells. J. Solid State Chem. 2014, 210, 22–29. [Google Scholar] [CrossRef]
  31. Castro, A.A.; Rosas-Huerta, J.L.; Escamilla, R. Effect of Mo Substitution on the Structure and Electrical Properties of Gd2Ru2O7 Pyrochlore. Phys. B Condens. Matter 2021, 619, 413227. [Google Scholar] [CrossRef]
  32. Ohsaka, T.; Izumi, F.; Fujiki, Y. Raman Spectrum of Anatase, TiO2. J. Raman Spectrosc. 1978, 7, 321–324. [Google Scholar] [CrossRef]
  33. Ali, S.M. An Approach for CdS-QD-Based Layered Heterostructure Electrodes for Supercapacitor Applications. J. Electron. Mater. 2024, 53, 207–216. [Google Scholar] [CrossRef]
  34. Le Luyer, C.; García-Murillo, A.; Bernstein, E.; Mugnier, J. Waveguide Raman Spectroscopy of Sol–Gel Gd2O3 Thin Films. J. Raman Spectrosc. 2003, 34, 234–239. [Google Scholar] [CrossRef]
  35. Korotcov, A.V.; Huang, Y.; Tiong, K.; Tsai, D. Raman Scattering Characterization of Well-aligned RuO2 and IrO2 Nanocrystals. J. Raman Spectrosc. 2007, 38, 737–749. [Google Scholar] [CrossRef]
  36. Meng, L. Raman Spectroscopy Analysis of Magnetron Sputtered RuO2 Thin Films. Thin Solid Films 2003, 442, 93–97. [Google Scholar] [CrossRef]
  37. Yang, L.; Yin, D.; Shen, Y.; Yang, M.; Li, X.; Han, X.; Jiang, X.; Zhao, B. Mesoporous Semiconducting TiO2 with Rich Active Sites as a Remarkable Substrate for Surface-Enhanced Raman Scattering. Phys. Chem. Chem. Phys. 2017, 19, 18731–18738. [Google Scholar] [CrossRef]
  38. Park, M.J.; Kim, S.K.; Pode, R.; Kwon, J.H. Low Absorption Semi-Transparent Cathode for Micro-Cavity Top-Emitting Organic Light Emitting Diodes. Org. Electron. 2018, 52, 153–158. [Google Scholar] [CrossRef]
  39. Szkoda, M.; Lisowska-Oleksiak, A.; Grochowska, K.; Skowroński, Ł.; Karczewski, J.; Siuzdak, K. Semi-Transparent Ordered TiO2 Nanostructures Prepared by Anodization of Titanium Thin Films Deposited onto the FTO Substrate. Appl. Surf. Sci. 2016, 381, 36–41. [Google Scholar] [CrossRef]
  40. Ball, J.M.; Stranks, S.D.; Hörantner, M.T.; Hüttner, S.; Zhang, W.; Crossland, E.J.W.; Ramirez, I.; Riede, M.; Johnston, M.B.; Friend, R.H.; et al. Optical Properties and Limiting Photocurrent of Thin-Film Perovskite Solar Cells. Energy Environ. Sci. 2015, 8, 602–609. [Google Scholar] [CrossRef]
  41. Vedam, K. Spectroscopic Ellipsometry: A Historical Overview. Thin Solid Films 1998, 313–314, 1–9. [Google Scholar] [CrossRef]
  42. Drude, P. Ueber die Gesetze der Reflexion und Brechung des Lichtes an der Grenze Absorbirender Krystalle. Ann. Phys. 1887, 268, 584–625. [Google Scholar] [CrossRef]
  43. Eiamchai, P.; Chindaudom, P.; Pokaipisit, A.; Limsuwan, P. A Spectroscopic Ellipsometry Study of TiO2 Thin Films Prepared by Ion-Assisted Electron-Beam Evaporation. Curr. Appl. Phys. 2009, 9, 707–712. [Google Scholar] [CrossRef]
  44. Franta, D.; Ohlídal, I.; Petrýdes, D. Optical Characterization of TiO2 Thin Films by the Combined Method of Spectroscopic Ellipsometry and Spectroscopic Photometry. Vacuum 2005, 80, 159–162. [Google Scholar] [CrossRef]
  45. Jiang, H.-Q.; Wei, Q.; Cao, Q.-X.; Yao, X. Spectroscopic Ellipsometry Characterization of TiO2 Thin Films Prepared by the Sol–Gel Method. Ceram. Int. 2008, 34, 1039–1042. [Google Scholar] [CrossRef]
  46. Liao, H.-S.; Cheng, S.-H.; Hwu, E.-T. Method for Film Thickness Mapping with an Astigmatic Optical Profilometer. Sensors 2022, 22, 2865. [Google Scholar] [CrossRef] [PubMed]
  47. El-Ahmar, M.H.; El-Sayed, A.-H.M.; Hemeida, A.M. Mathematical Modeling of Photovoltaic Module and Evalute the Effect of Varoius Paramenters on Its Performance. In Proceedings of the 2016 Eighteenth International Middle East Power Systems Conference (MEPCON), Cairo, Egypt, 27–29 December 2016; pp. 741–746. [Google Scholar]
  48. Belghachi, A. Theoretical Calculation of the Efficiency Limit for Solar Cells. In Solar Cells—New Approaches and Reviews; Kosyachenko, L.A., Ed.; InTech: London, UK, 2015; ISBN 978-953-51-2184-8. [Google Scholar]
  49. Alhamed, M.; Issa, A.S.; Doubal, A.W. Studying of natural dyes properties as photo-sensitizer for dye sensitized solar cells (DSSC). J. Electron Devices 2012, 16, 1370–1383. [Google Scholar]
  50. Hendi, A.A.; Alanazi, M.M.; Alharbi, W.; Ali, T.; Awad, M.A.; Ortashi, K.M.; Aldosari, H.; Alfaifi, F.S.; Qindeel, R.; Naz, G.; et al. Dye-Sensitized Solar Cells Constructed Using Titanium Oxide Nanoparticles and Green Dyes as Photosensitizers. J. King Saud Univ.-Sci. 2023, 35, 102555. [Google Scholar] [CrossRef]
  51. Nasyori, A.; Noor, F.A.; Abidin, K. Improved the DSSCs Performance by Sensitizing Eight Natural Dyes and Varying the Annealing Process on the TiO2. Mol. Cryst. Liq. Cryst. 2024, 768, 32–46. [Google Scholar] [CrossRef]
  52. Santos, F.; Ivanou, D.; Mendes, A. Solid-State Monolithic Dye-Sensitized Solar Cell Exceeding 10% Efficiency Using a Copper-Complex Hole Transport Material and a Carbon Counter-Electrode. Sol. RRL 2024, 8, 2300574. [Google Scholar] [CrossRef]
  53. Masud; Kim, H.K. Redox Shuttle-Based Electrolytes for Dye-Sensitized Solar Cells: Comprehensive Guidance, Recent Progress, and Future Perspective. ACS Omega 2023, 8, 6139–6163. [Google Scholar] [CrossRef]
  54. Azeez, J.; Kolawole, T. Fabrication of Dye Sensitized Solar Cell Using Baccate (Berry) and Citrullus Lanatus (Water Melon) as Dye. Int. J. Res. Innov. Appl. Sci. 2024, 9, 105–116. [Google Scholar] [CrossRef]
  55. Alenazi, N.A.; Abualnaja, M.M.; El-Metwaly, N.M. Development of Organic Co-Sensitizers Based on Piperonal for over 10% Efficient Ruthenium Complex Dye-Sensitized Solar Cells. J. Mol. Liq. 2024, 398, 124337. [Google Scholar] [CrossRef]
  56. Hsu, C.-Y.; Al-Salman, H.N.K.; Mahmoud, Z.H.; Ahmed, R.M.; Dawood, A.F. Improvement of the Photoelectric Dye Sensitized Solar Cell Performance Using Fe/S–TiO2 Nanoparticles as Photoanode Electrode. Sci. Rep. 2024, 14, 4931. [Google Scholar] [CrossRef] [PubMed]
  57. Kumar, T.S.; Shalini, S.; Roy, T.A.; Prasanna, S.; Balasundaraprabhu, R.; Sundaram, S. Solvent Selection for Anthrocyanin Dye Extraction from Kigelia Africana and Hibiscus Sabdariffa for Dye Sensitized Solar Cells. J. Photochem. Photobiol. 2024, 20, 100233. [Google Scholar] [CrossRef]
  58. Shan, C.-H.; Zhang, H.; Chen, W.-L.; Su, Z.-M.; Wang, E.-B. Pure Inorganic D–A Type Polyoxometalate/Reduced Graphene Oxide Nanocomposite for the Photoanode of Dye-Sensitized Solar Cells. J. Mater. Chem. A 2016, 4, 3297–3303. [Google Scholar] [CrossRef]
  59. Omar, A.; Ali, M.S.; Abd Rahim, N. Electron Transport Properties Analysis of Titanium Dioxide Dye-Sensitized Solar Cells (TiO2-DSSCs) Based Natural Dyes Using Electrochemical Impedance Spectroscopy Concept: A Review. Sol. Energy 2020, 207, 1088–1121. [Google Scholar] [CrossRef]
  60. Frank, A.J.; Kopidakis, N.; Lagemaat, J.V.D. Electrons in Nanostructured TiO2 Solar Cells: Transport, Recombination and Photovoltaic Properties. Coord. Chem. Rev. 2004, 248, 1165–1179. [Google Scholar] [CrossRef]
  61. Laschuk, N.O.; Easton, E.B.; Zenkina, O.V. Reducing the Resistance for the Use of Electrochemical Impedance Spectroscopy Analysis in Materials Chemistry. RSC Adv. 2021, 11, 27925–27936. [Google Scholar] [CrossRef]
  62. Ming, W.; Sun, P.; Zhang, Z.; Qiu, W.; Du, J.; Li, X.; Zhang, Y.; Zhang, G.; Liu, K.; Wang, Y.; et al. A Systematic Review of Machine Learning Methods Applied to Fuel Cells in Performance Evaluation, Durability Prediction, and Application Monitoring. Int. J. Hydrogen Energy 2023, 48, 5197–5228. [Google Scholar] [CrossRef]
  63. Haeverbeke, M.V.; Stock, M.; De Baets, B. Equivalent Electrical Circuits and Their Use Across Electrochemical Impedance Spectroscopy Application Domains. IEEE Access 2022, 10, 51363–51379. [Google Scholar] [CrossRef]
  64. Gaberšček, M. Impedance Spectroscopy of Battery Cells: Theory versus Experiment. Curr. Opin. Electrochem. 2022, 32, 100917. [Google Scholar] [CrossRef]
  65. Iurilli, P.; Brivio, C.; Wood, V. On the Use of Electrochemical Impedance Spectroscopy to Characterize and Model the Aging Phenomena of Lithium-Ion Batteries: A Critical Review. J. Power Sources 2021, 505, 229860. [Google Scholar] [CrossRef]
  66. Ali, S.; Chang, S.; Imran, M.; Shi, Q.; Chen, Y.; Zhong, H. Impedance Spectroscopy: A Versatile Technique to Understand Solution-Processed Optoelectronic Devices. Phys. Status Solidi RRL—Rapid Res. Lett. 2019, 13, 1800580. [Google Scholar] [CrossRef]
Figure 1. Powder XRD pattern showing anatase phase of TiO2 and some peaks of its rutile phase indicated by triangular symbols.
Condensedmatter 10 00038 g001
Figure 2. (a) Dye extraction process and (b) FTIR transmittance spectrum of hibiscus sabdariffa flowers.
Condensedmatter 10 00038 g002
Figure 3. SEM image of developed layers: (a) compact layer, (c) TiO2 nanoparticle, (b) Gd2Ru2O7 and (d) TiO2-Gd2Ru2O7.
Condensedmatter 10 00038 g003
Figure 4. AFM image showing the surface topography and surface roughness of the TiO2 compact layer.
Condensedmatter 10 00038 g004
Figure 5. AFM measurements showing topography results obtained on GRO (ad) and GROH (eh) without and after impregnation with the hibiscus dye: respectively. (a) shows images of surface aggregates and grains for GRO and (e) GROH. The red profile indicates the size of the surface aggregates and the blue profile demonstrates the size of the grains, as depicted in the (b,f) for GRO and GROH respectively. This profile enabled us to estimate the width of the grains at around 18 nm, with several aggregates estimated at 27 nm and a thickness of 447 nm. (d,h) show surface topography before and after dye impregnation of GRO, respectively. The presence of these nanoparticles on the surface favors easy adhesion of the dye, which can improve absorption by increasing the efficiency of the solar cell devices.
Condensedmatter 10 00038 g005
Figure 6. XRD patterns of Gd2Ru2O7, TiO2-Gd2Ru2O7. and TiO2 thin films grown on FTO glass substrate. Black indexes indicate Bragg reflection lines of TiO2-type structure symmetry, as in PCPDF N° 01-070-4411. The * indicates TiO2-type structure index observable in PCPDF N° 01-075-1537.
Condensedmatter 10 00038 g006
Figure 7. Raman Spectrum of Gd2Ru2O7, TiO2-Gd2Ru2O7 and TiO2 anatase phase.
Condensedmatter 10 00038 g007
Figure 8. Absorbance spectrum of films produced on FTO glass.
Condensedmatter 10 00038 g008
Figure 9. Physical model schematic for (a) glass/FTO and (b) glass/FTO-TiO2.
Condensedmatter 10 00038 g009
Figure 10. Experimental and fitted data of Ψ (red) and Δ (black) for (a) glass-FTO substrate and (b) compact TiO2 layer.
Condensedmatter 10 00038 g010
Figure 11. Scheme of dye-sensitized solar cells (DSSC-N) with natural dye device.
Condensedmatter 10 00038 g011
Figure 12. J-V curve of DSSC-N based at Gd2Ru2O7 microparticle. (a) Current density and Power variation versus applied voltage. (b) Dark and lighted current density as function of applied voltage.
Condensedmatter 10 00038 g012
Figure 13. J-V curve of DSSC-N based on TiO2-Gd2Ru2O7 (TGRO) photoanode. (a) Current density and Power variation versus applied voltage. (b) Dark and lighted current density as function of applied voltage.
Condensedmatter 10 00038 g013
Figure 14. J-V curve of DSSC-N based only on TiO2 photoanode.
Condensedmatter 10 00038 g014
Figure 15. IPCE measurement obtained from GROH- and TGROH-based DSSC-N devices using independent wavelengths of Ossila Solar Simulator.
Condensedmatter 10 00038 g015
Figure 16. Bode representation by |Z| for GROH and TGROH (a) under illumination and (b) in dark and by angular phase shift of GROH- and TGROH-based DSSC-N (c) under illumination and (d) in dark.
Condensedmatter 10 00038 g016
Figure 17. Impedance spectra obtained from DSSC cells based on TiO2–Gd2Ru2O7 (TGRO) and Gd2Ru2O7 (GRO) sensitized with hibiscus dyes, under illumination (1 Sun) (a,b) and dark (c,d) conditions, respectively.
Condensedmatter 10 00038 g017
Figure 18. Experimental and fitted curves of the illuminated DSSC based on TGRO (red circle marker) and GRO (blue square marker). Fitted curves are in black lines.
Condensedmatter 10 00038 g018
Figure 19. Experimental I-V response of TGROH-based DSSC and its adjustment using the double diodes model.
Condensedmatter 10 00038 g019
Figure 20. Cyclic voltammetry curves from (a) TGRO- and (b) GRO-based DSSC.
Condensedmatter 10 00038 g020
Table 1. Comparison of DSSC characteristics using new photoanodes.
Photoanode/DyeJsc (mA/cm2)Voc (V)FF (%)Ƞ (%)Ref:
TiO2/Hibiscus Sabdariffa4.100.4146.040.77[57]
TiO2/Hibiscus Sabdariffa4.240.9157.092.21This work
GRO/Hibiscus Sabdariffa4.353.8257.939.65This work
TGRO/Hibiscus Sabdariffa4.323.2263.028.78This work
Table 2. Impedance fitting parameters obtained from TGRO-H and GRO-H.
ParametersR1
(kΩ)
A1
(pF)
α1R2
(kΩ)
A2
(µF)
α2R3
(kΩ)
A3
(µF)/
(µΩ−1)
α3R4
(kΩ)
TGROH25550.85390.72423.30.59± 18.70
GROH5.832200.963.45.80.8830014.50.42± 2.51
Table 3. I-V curve fitting parameter of TGROH-, GROH-, and TiO2-based DSSC.
Fitted ParametersPV Characteristics
TGROHGROHTiO2 TGROHGROHTiO2
Iph (mA)1.6671.6821.596Isc (mA)1.6671.6921.603
I01(nA)0.00012352708Voc (V)3.2603.9800.910
n11.981.711.23Vmax (V)2.5502.9300.670
I02 (nA)13.531.09736Imax (mA)1.2751.1701.253
n22.982.591.75Pmax (mW)3.2513.4280.839
γ10.270.090.26FF (%)59.8250.9257.56
γ20.270.090.26η (%)8.559.032.21
Rs (Ω)0.000.042.39
Rsh (Ω)897579415472
Disclaimer/Publisher’s Note: The statements, opinions and data contained in all publications are solely those of the individual author(s) and contributor(s) and not of MDPI and/or the editor(s). MDPI and/or the editor(s) disclaim responsibility for any injury to people or property resulting from any ideas, methods, instructions or products referred to in the content.

