Article

A Fish Target Identification and Counting Method Based on DIDSON Sonar and YOLOv5 Model

1
College of Oceanography and Ecological Science, Shanghai Ocean University, Shanghai 201306, China
2
Office of Asset and Laboratory Management, Shanghai Ocean University, Shanghai 201306, China
3
College of Marine Living Resource Sciences and Management, Shanghai Ocean University, Shanghai 201306, China
*
Author to whom correspondence should be addressed.
These authrs contributed equally to this work.
Fishes 2024, 9(9), 346; https://doi.org/10.3390/fishes9090346
Submission received: 11 August 2024 / Revised: 26 August 2024 / Accepted: 30 August 2024 / Published: 31 August 2024
(This article belongs to the Special Issue Underwater Acoustic Technologies for Sustainable Fisheries)

Abstract

In order to more accurately and quickly identify and count underwater fish targets, and to address the issues of excessive reliance on manual processes and low processing efficiency in the identification and counting of fish targets using sonar data, a method based on DIDSON and YOLOv5 for fish target identification and counting is proposed. This study is based on YOLOv5, which trains a recognition model by identifying fish targets in each frame of DIDSON images and uses the DeepSort algorithm to track and count fish targets. Field data collection was conducted at Chenhang Reservoir in Shanghai, and this method was used to process and verify the results. The accuracy of random sampling was 83.56%, and the average accuracy of survey line detection was 84.28%. Compared with the traditional method of using Echoview to process sonar data, the YOLOv5 based method replaces the step that requires manual participation, significantly reducing the time required for data processing while maintaining the same accuracy, providing faster and more effective technical support for monitoring and managing fish populations.
Key Contribution: This study combines YOLOv5 with DIDSON to develop a fast and accurate method for underwater fish target identification and counting. Compared to traditional methods, this approach significantly reduces data processing time while maintaining high accuracy, and it avoids the drawbacks of human fatigue and subjective bias.

1. Introduction

The identification and counting of fish targets are essential processes in the assessment and monitoring of fishery resources, playing a crucial role in sustainable management and conservation efforts. Accurate fish population estimates are vital for maintaining ecological balance, supporting commercial fisheries, and ensuring the long-term viability of aquatic ecosystems. Traditional studies of fish resources frequently employ acoustic techniques to circumvent the challenges posed by the underwater transmission of optical signals, notably in murky waters. However, these sonars, while providing an extensive detection range through echo integration or counting methods, are limited by insufficient recognition accuracy, which prevents them from fully meeting the demands of precise fish identification and counting [1].
The dual-frequency identification sonar (DIDSON), also known as the ‘acoustic camera’, delivers distinct acoustic images in obscured and dim underwater conditions [2] and has been widely used in fisheries management, underwater inspections, and environmental monitoring [3]. Research has demonstrated that DIDSON can effectively replace optical systems in murky waters, providing clear and nearly photographic images for various imaging tasks [4,5]. It has been employed for counting and measuring farmed fish during transfer [6], estimating fish abundance [7], and measuring swimming patterns and body length of cultured Chinese sturgeons [8].
Echoview, extensively utilized in hydroacoustic research, fisheries science, and marine environmental monitoring among other domains [9], proves effective for the processing and analysis of DIDSON data. Nevertheless, its semi-interactive, semi-automatic mode of data processing demands considerable time and incurs substantial labor costs when applied to the identification and counting of fish targets.
To address these limitations, researchers have explored alternative methods that aim to reduce manual intervention and increase processing efficiency. For instance, the use of custom MATLAB scripts has allowed for more tailored analysis, but these often require advanced programming skills and are not easily scalable. Recent developments in deep learning, particularly the application of Convolutional Neural Networks (CNNs) like Faster R-CNN, have shown potential in automating the detection process, though these approaches typically demand significant computational resources and may not be ideal for real-time applications. Hybrid methods that integrate traditional image processing with machine learning have also been proposed to enhance detection accuracy, but they tend to increase the complexity of processing, making them challenging to implement on a large scale.
Target recognition algorithms are fundamental in computer vision, encompassing both traditional machine learning and deep learning methods. With advancements in deep learning, deep learning-based target detection has increasingly become the preferred approach. YOLOv5, known for its rapid processing, high accuracy, and adaptability, has been widely employed across various applications, including acoustic image recognition. For example, YOLOv5 has been used to analyze audio data for animal species monitoring [10], identify single-fish echo trajectories on echo maps [11], recognize and localize targets in side-scan sonar images [12], and improve fish detection in noisy sonar environments to aid fish farming and resource assessment [13]. This demonstrates that YOLOv5 is highly effective and accurate in the field of acoustic image recognition.
This study combines YOLOv5 with DIDSON data to provide a new method for fish identification and counting, addressing the limitations of traditional methods like Echoview. By automating the detection process and eliminating the need for manual participation, YOLOv5 significantly reduces the time required for processing DIDSON data, avoiding the drawbacks of human fatigue and subjective bias, and consistently maintaining high accuracy. This method not only improves efficiency but also provides faster and more effective technical support for monitoring and managing fish populations, contributing to the sustainable development of fisheries.

2. Methodology

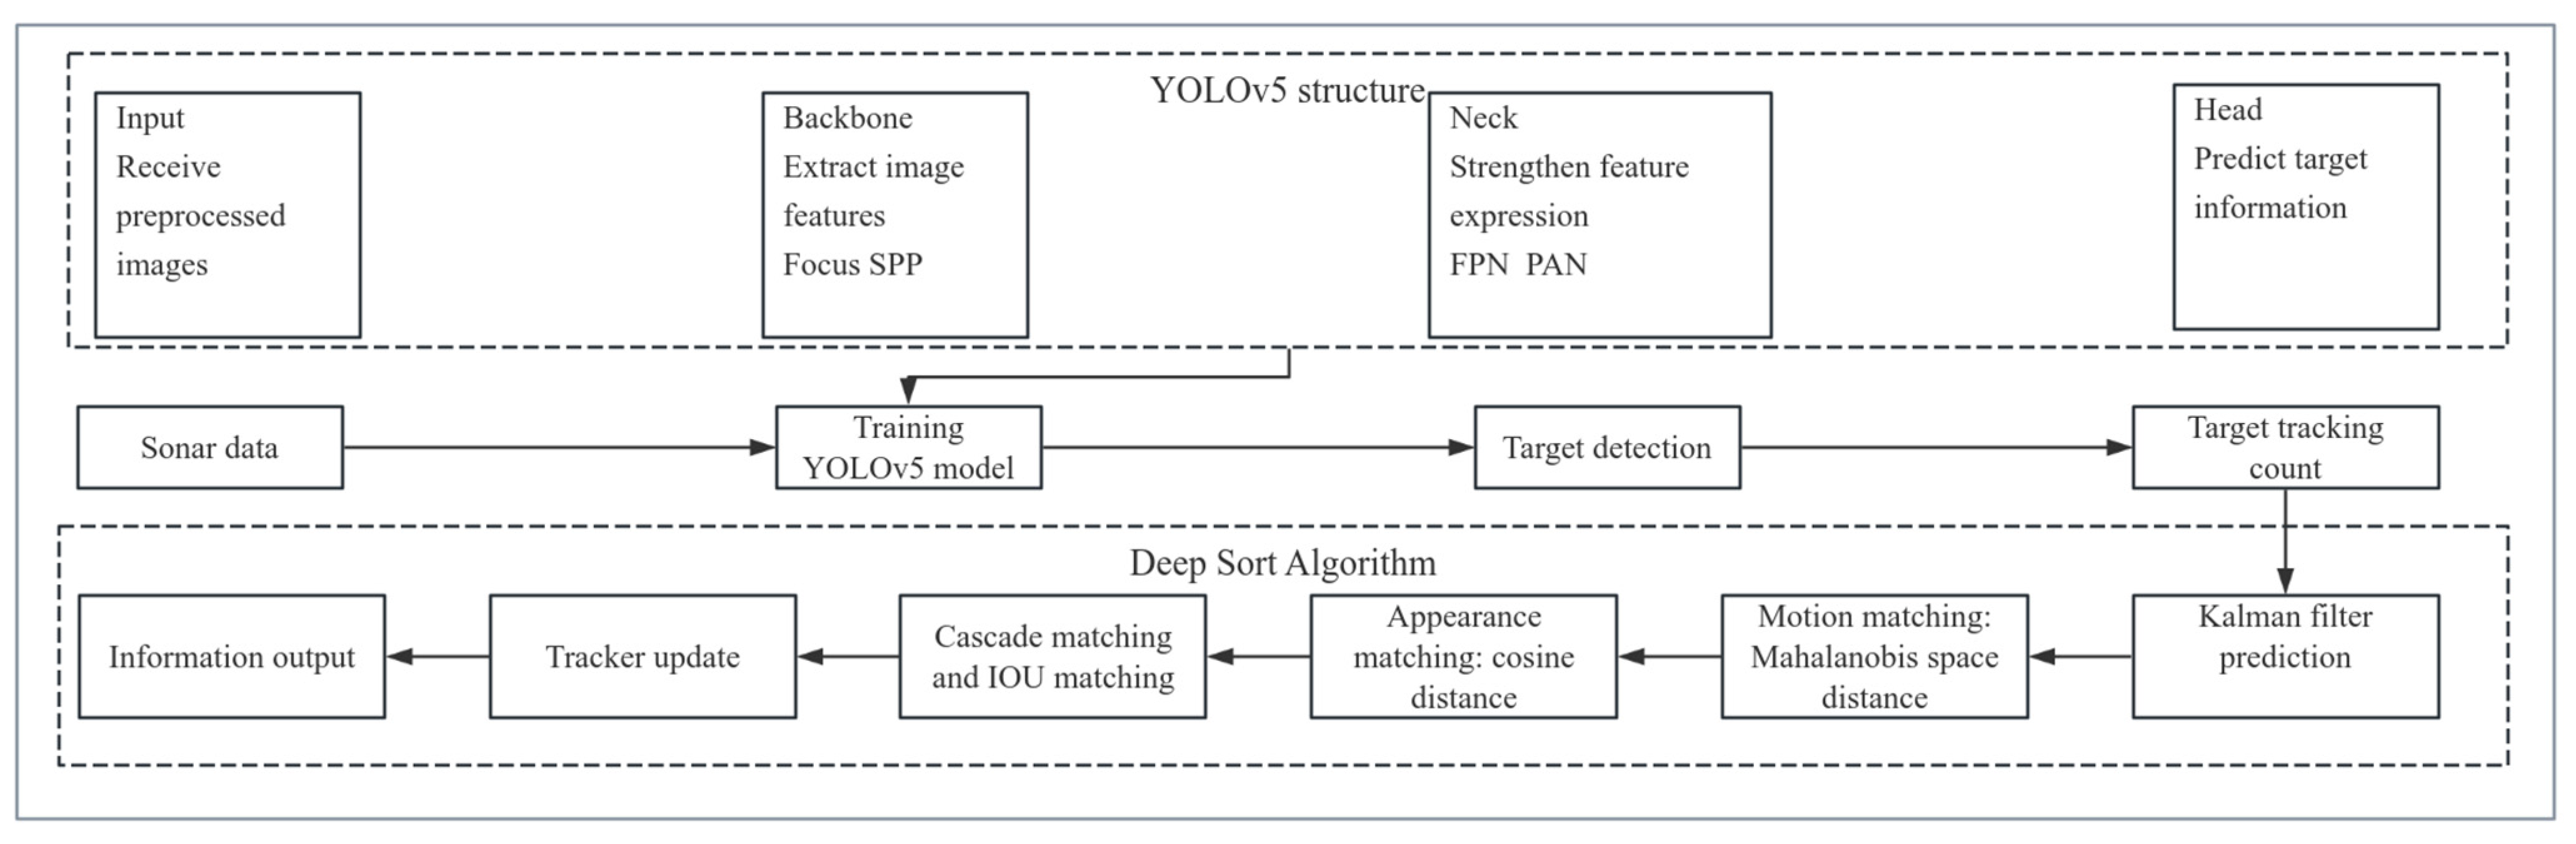
2.1. YOLOv5 Target Detection Model

YOLOv5, the fifth-generation model in the YOLO (You Only Look Once) series, was developed by Ultralytics for real-time object recognition tasks.
The architecture of YOLOv5 is segmented into four integral components: input, backbone, neck, and head [14]. These components work in concert to facilitate swift and precise target detection. The input layer is tasked with receiving and preprocessing image data to fulfill the requirements of the layers that follow. The backbone is primarily composed of multiple convolutional layers, normalization layers, and activation functions, dedicated to extracting features from images. The neck amplifies the capacity for feature representation using the feature pyramid network (FPN) and the path aggregation network (PAN). The head utilizes the extracted feature maps to determine the target’s position, category, and confidence.
Additionally, YOLOv5 incorporates various efficient modules, such as spatial pyramid pooling (SPP) and the Focus module, which enhance the model’s capability to detect objects across different scales and to extract intricate features. During training, a composite loss function is employed to refine various prediction tasks. At the inference stage, non-maximum suppression (NMS) is utilized to identify and retain the most accurate bounding box.
Pre-trained models of YOLOv5, available in various scales, can be chosen based on the specific needs of the task at hand. Furthermore, the model can be tailored and fine-tuned using custom datasets, broadening its applications in fields such as object recognition and motion target tracking.

2.2. DeepSort Multi-Object Tracking Algorithm

DeepSort is a multi-object tracking algorithm that leverages deep learning techniques. It utilizes an object detection model to process video frames sequentially, acquiring target positions and categories. Additionally, a deep learning model extracts high-dimensional feature vectors representing the appearance and motion characteristics of the targets. By employing the Kalman filter and the Hungarian algorithm, DeepSort matches and associates the detection results from the current frame with targets tracked in previous frames. This process determines the motion trajectory of the target, maintains its identity continuity, and computes the similarity between feature vectors to address challenges posed by target occlusion and resemblance in appearance. DeepSort constructs a trajectory model of the target using historical data and aligns this data based on the target’s motion state and appearance, enhancing tracking precision. By integrating the appearance features, motion state, and historical data of the target, DeepSort facilitates efficient and accurate multi-target tracking in complex environments.
Following object detection on video frames by the YOLOv5 model, the DeepSort algorithm assigns each detected object a bounding box, category label, and confidence level. An additional feature extraction network extracts appearance features, aiding in distinguishing different objects during the tracking phase.
d ( i ,   j ) = ( Z i H x ^ j ) S j 1 ( Z i H x ^ j ) T
The algorithm applies a Kalman filter to forecast each tracked object’s position, producing a predicted state. It then uses the Mahalanobis distance d ( i , j ) to evaluate the discrepancy between the Kalman predicted state and the newly detected object, incorporating covariance considerations to optimize the matching process.
In the DeepSort algorithm, the Mahalanobis distance quantifies the discrepancy between the ith detection and the jth prediction. This Mahalanobis distance measures the difference between the newly detected observation Z i , and the predicted state H x ^ j , factoring in the covariance matrix S j of the measurement prediction.
The Mahalanobis distance effectively explains the correlation between variables and provides a more accurate measure of the similarity between predicted states and the newly detected object. This ability makes it particularly suitable for improving the accuracy of object matching in the DeepSort algorithm.
c ( i , j ) = 1 f i · f j f i f j
Furthermore, the cosine distance is utilized to assess the similarity between the appearance features of detected and tracked objects, facilitating the differentiation of individual targets.
This is denoted as c ( i , j ) , where f i and f j are the appearance feature vectors of the detected and tracked objects, respectively. The value range of the formula is between [0,2], where a smaller value indicates that the two vectors are more similar and conversely, a larger value indicates they are less similar.
The cosine distance effectively measures the directional difference between two feature vectors, while ignoring their magnitude. This property is particularly useful when tracking applications that have different object sizes but still have similar appearance characteristics. The smaller the cosine distance, the higher the similarity, which helps to accurately match targets with similar appearances.
DeepSort incorporates a cascade matching strategy, which prioritizes the matching of long-standing trajectories to enhance tracking consistency and precision. IoU matching serves as a supplementary method to further support tracking stability. When the tracked object’s position and features are updated based on the matching results, its continuity is maintained effectively. However, if a tracked object fails to match any detection across consecutive frames, it is deemed to have disappeared, and the tracking process for that object is consequently terminated.The specific flowchart of the entire algorithm is shown in Figure 1.

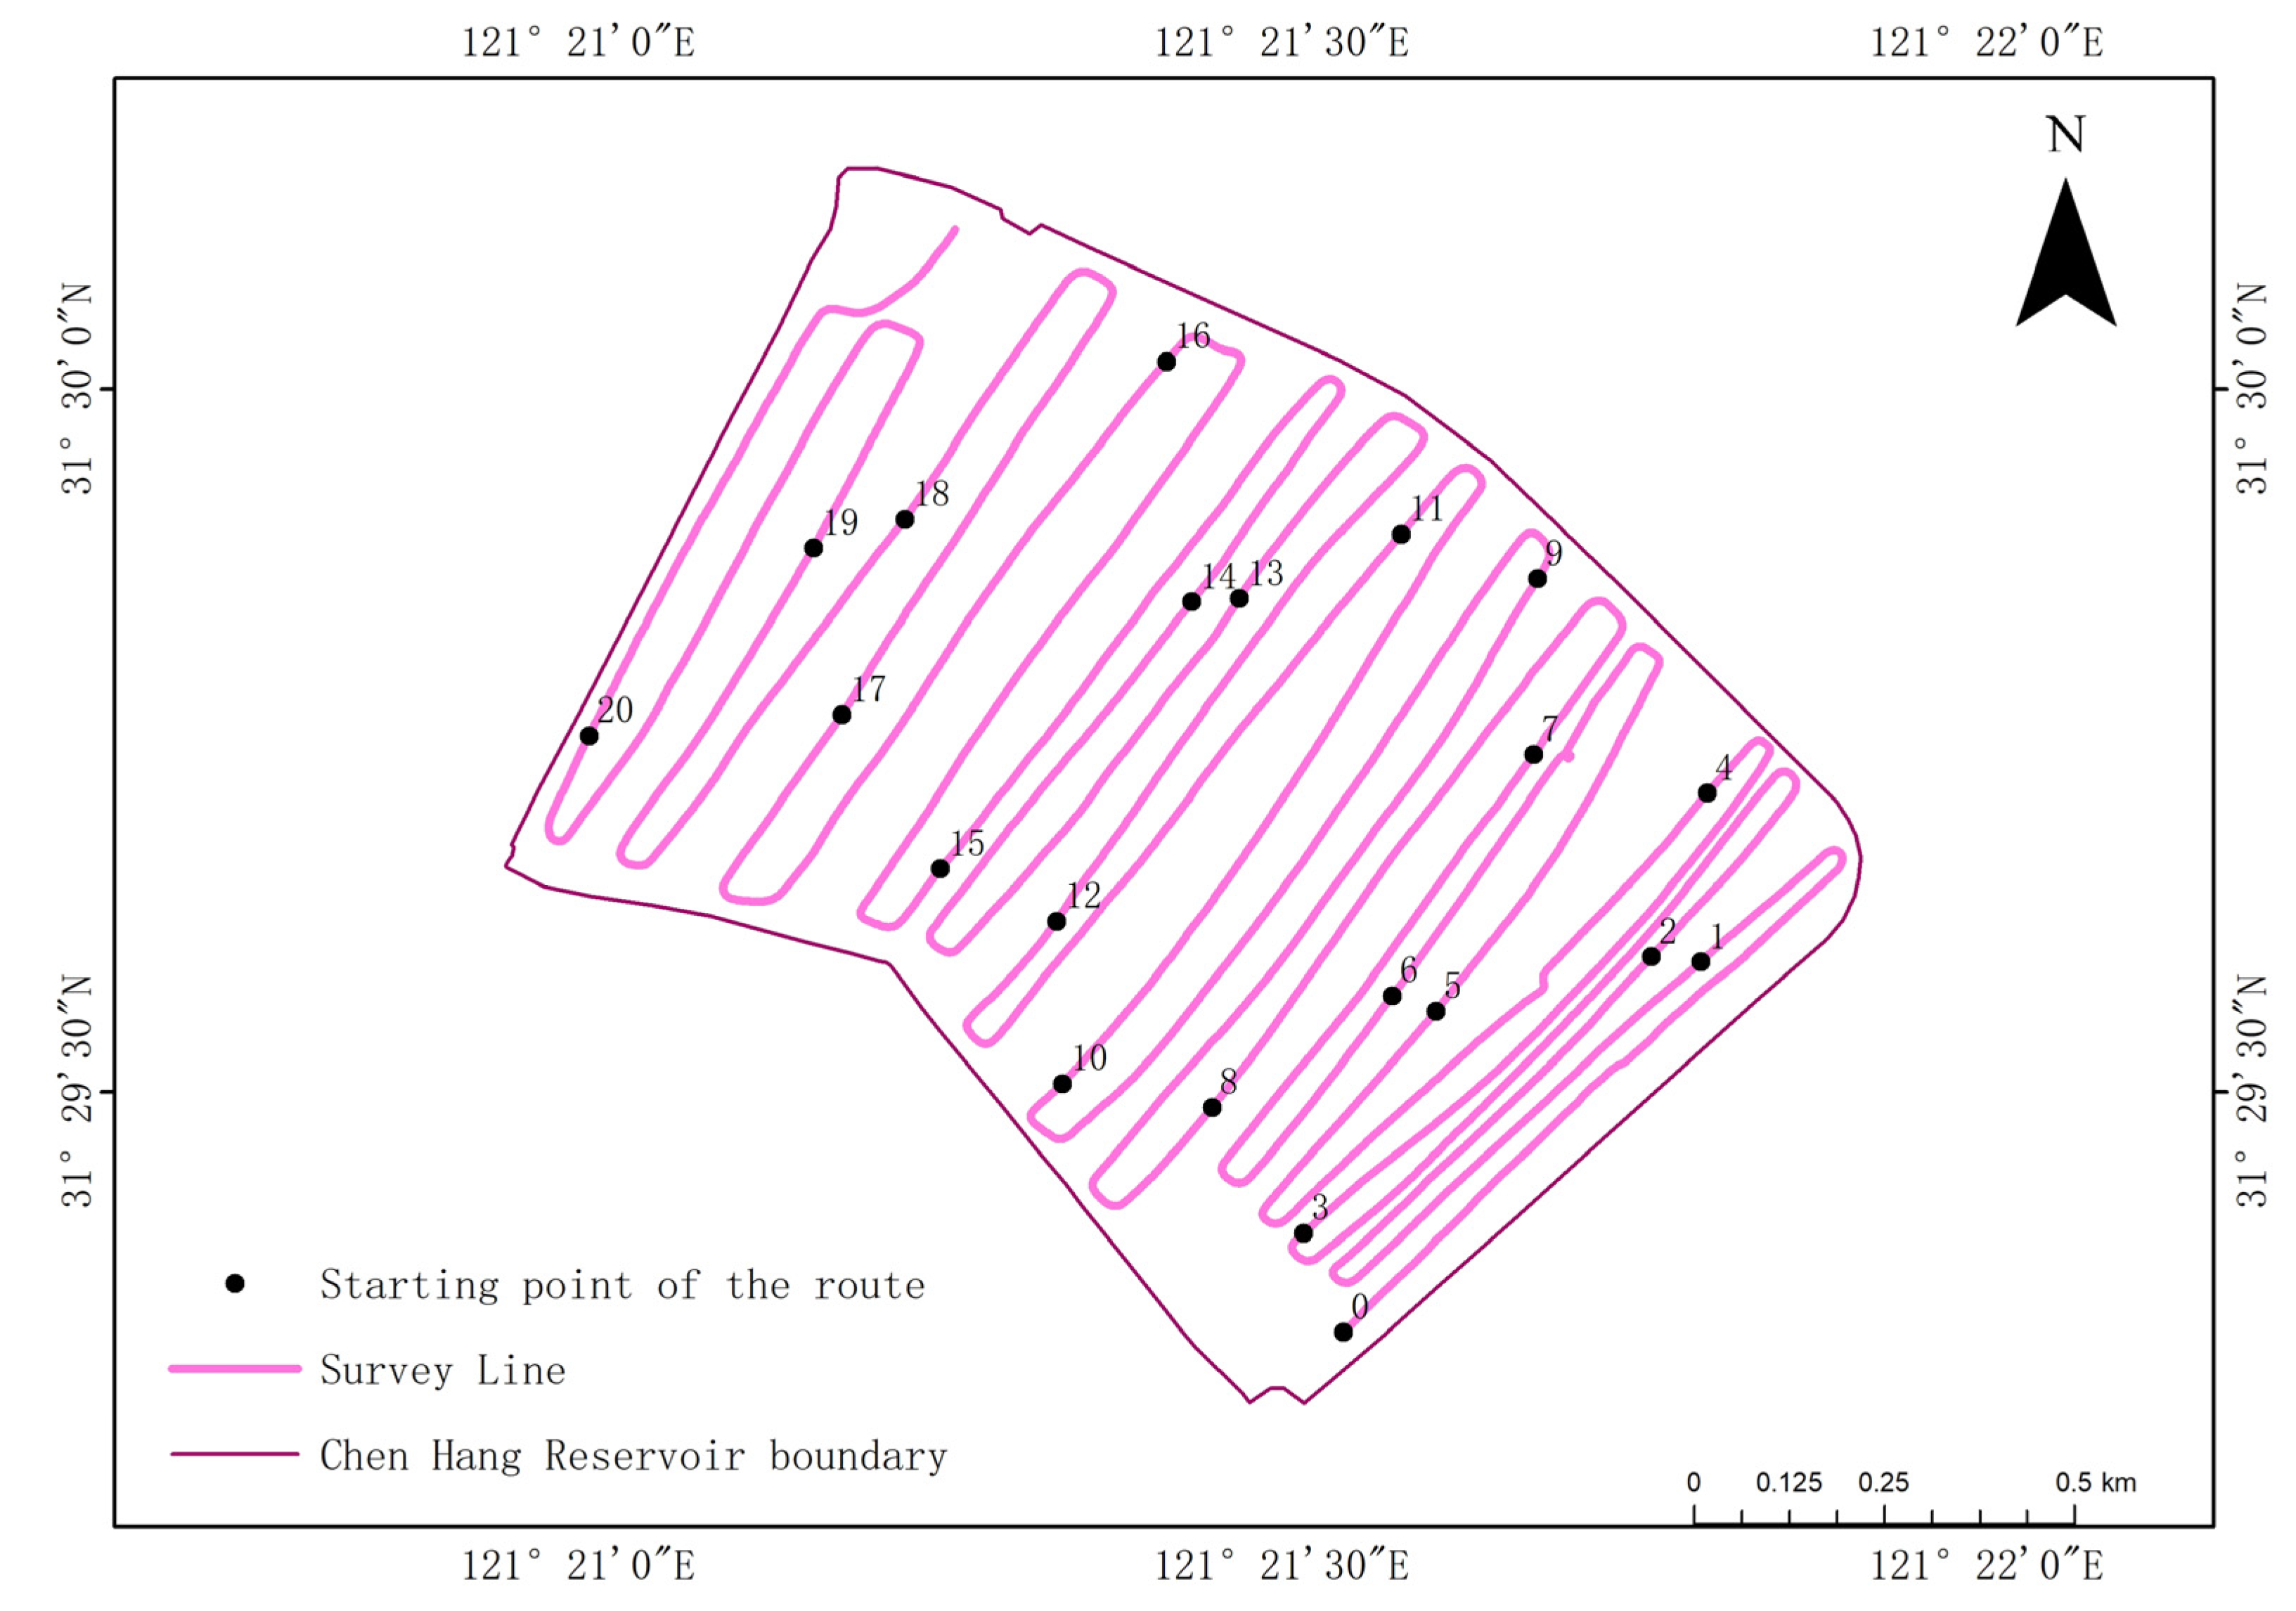
2.3. Field Data Acquisition

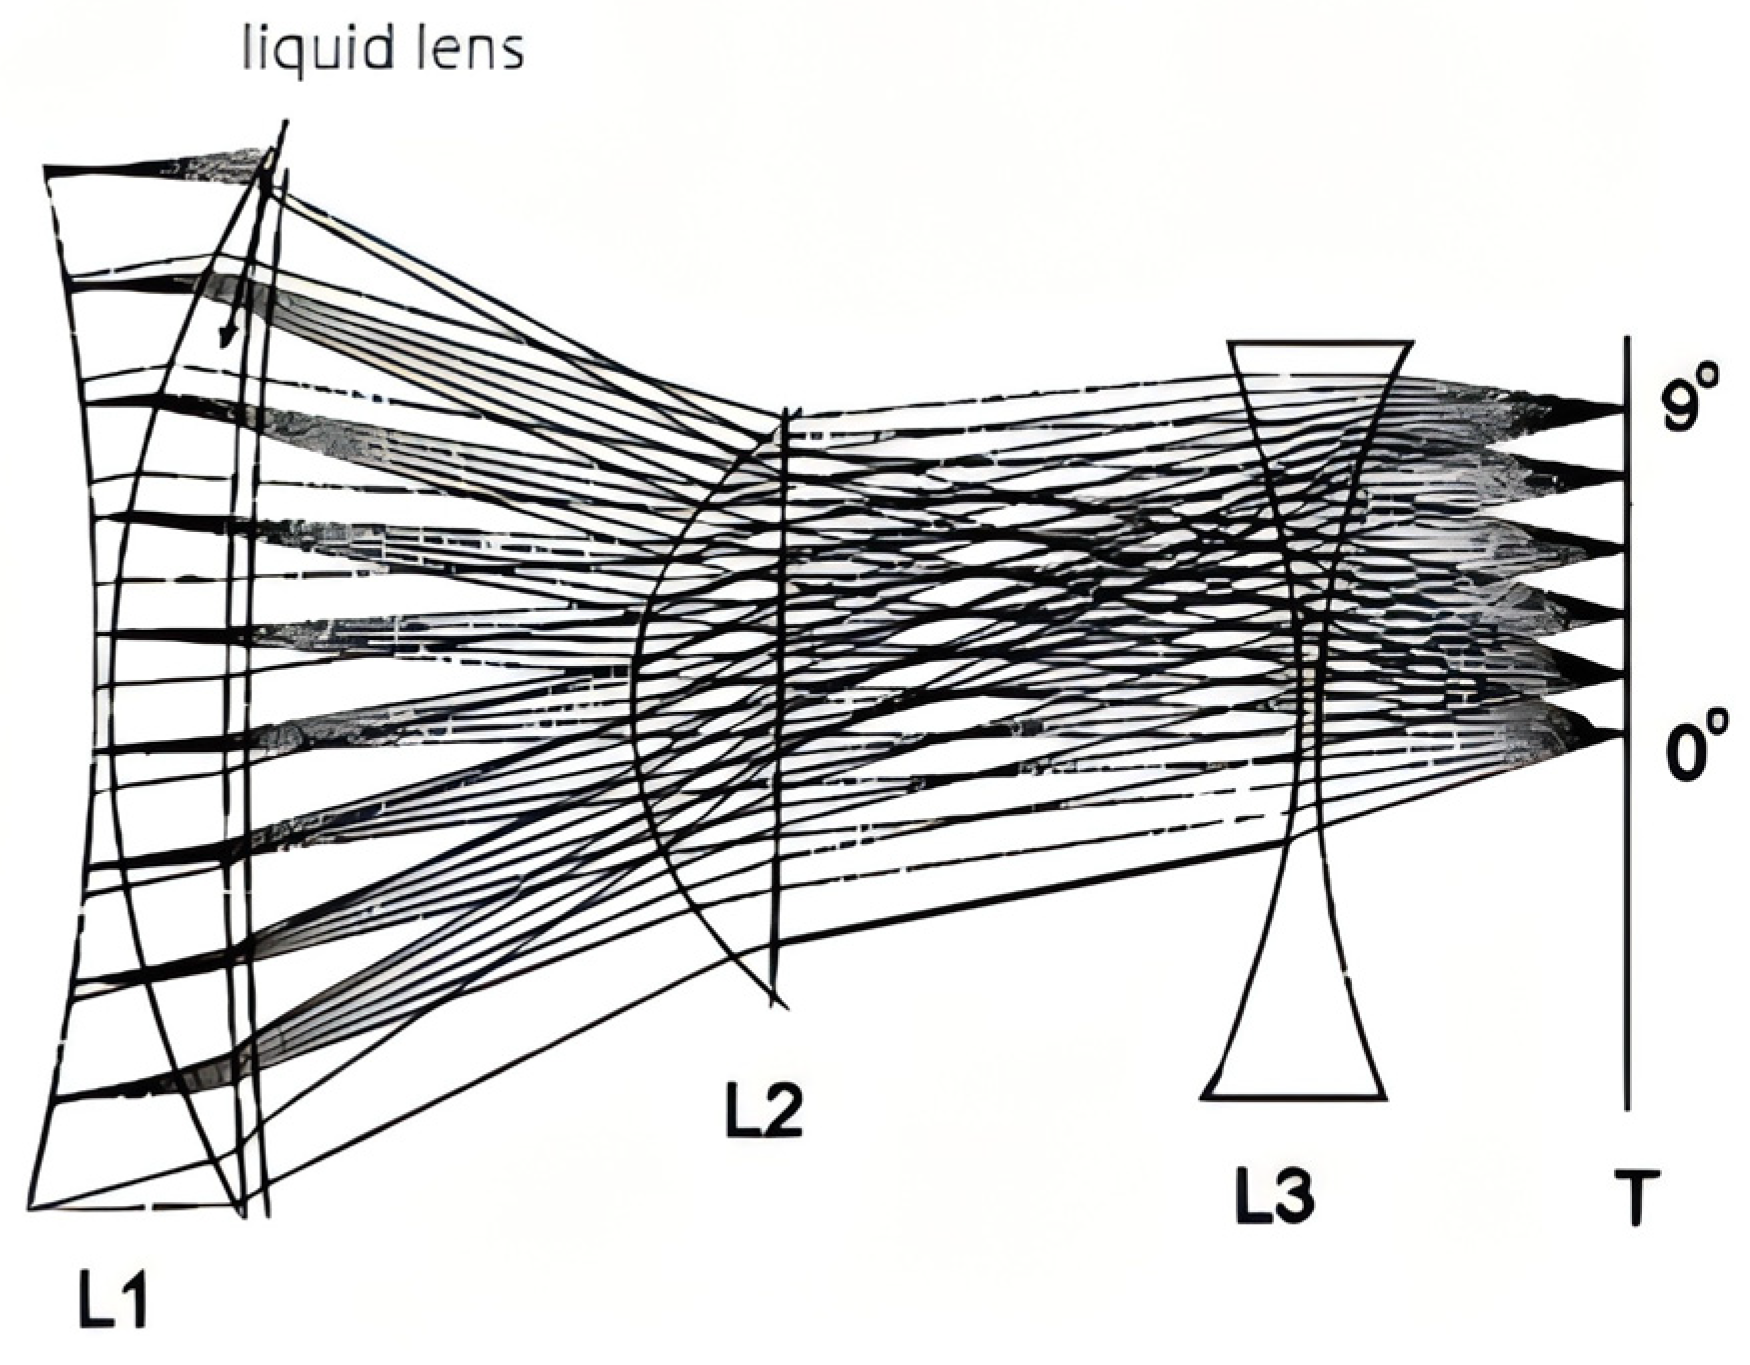
2.3.1. DIDSON Dual-Frequency Identification Sonar

DIDSON, a high-resolution identification sonar created by the University of Washington and produced by Sound Metrics in the United States, utilizes the sound wave focusing principle of sound lenses to form a narrow beam. This technology enables the production of images nearly equivalent to optical quality in low-visibility underwater conditions, as illustrated in Figure 2. The acoustic lens, which requires minimal power for beam compression, facilitates the transmission and reception of the beam. Such a configuration enhances operational efficiency and decreases the size of the equipment [15]. The sonar operates with a horizontal angle of 29° and a vertical angle of 14° [16]. It is capable of delivering high-resolution images at 0.3° with a frequency of 1.8 MHz, providing distinctly clear images up to a distance of 11.63 m. At a reduced frequency of 1.1 MHz, the sonar achieves a resolution of 0.6° and a maximum detection range of 40 m, where it can automatically focus on targets and maintain image clarity within a 1–40 m range. The specific parameters of DIDSON are shown in Table 1.

2.3.2. Data Acquisition

In October 2023, a motorized boat equipped with DIDSON was utilized for a survey of fish resources in Chenhang Reservoir, Shanghai, China. The sonar was mounted on the starboard side at a draft of 0.5 m and angled downward at 60°. The direction of data collection aligned with the forward motion of the boat. Custom brackets were implemented to minimize vibrations of the device during movement, thereby ensuring the capture of high-quality images. The survey’s path is depicted in Figure 3. Considering the conditions of the Chenhang Reservoir, the high-frequency mode was used throughout. The window start was set at 0.83 m, with a window length of 11.63 m. The sampling rate was 8 frames per second, the receiving gain was set to 25, and the threshold was around 15, adjusted according to the actual condition.

2.4. YOLOv5 Model Training

Among the 88,763 frames of images collected by DIDSON, 8876 were randomly chosen, and 1000 containing fish targets were identified. Out of these, 100 images were designated for the validation set, and 900 were used for the training set.
The image annotation tool Labellmg was employed in this study. Initially, the selected images were uploaded to Labellmg, where the fish targets were manually annotated, as depicted in Figure 4. This process generated an XML file for each annotated image, detailing the position coordinates and category labels of the fish bounding boxes. These XML files were formatted according to the PASCAL VOC standards for further model training.
All raw images and XML files were stored in the designated directory for the YOLOv5 training model. Modifications were made to the target category, which was set to 1 and labeled “fish”. Adjustments to the training parameters included setting the epochs to 300, the batch size to 8, the number of workers to 4, and the image size to 640 × 640.
Upon completion of the training, all training data were saved in the results file, and a line graph was generated to display the precision (P), recall (R), loss, average precision (AP), as shown in Figure 5.
P = T P T P + F P
R = T P T P + F N
A P = 0 1 P ( R ) d R
In this graph, TP denotes the number of correctly identified fish targets, FP indicates the falsely identified fish targets, and FN represents the fish targets that were not detected.
According to the data in Figure 5, it was observed that, as the number of iterations increases, the accuracy in the top left stabilizes at around 0.85, reaching a peak of 0.8796 at 217 iterations. The recall in the top right stabilizes at around 0.95, reaching its maximum value of 0.9803 at 77, 107, and 110 epochs. The loss value in the bottom left gradually decreases as the model converges. The AP (average precision) in the bottom right stabilizes at around 0.95, with a peak value of 0.9766 achieved at 110 epochs. These evaluation results suggest that, after 300 iterations, the model achieved relative stability and performed effectively in recognizing fish targets in image data.

3. Experiments and Analyses

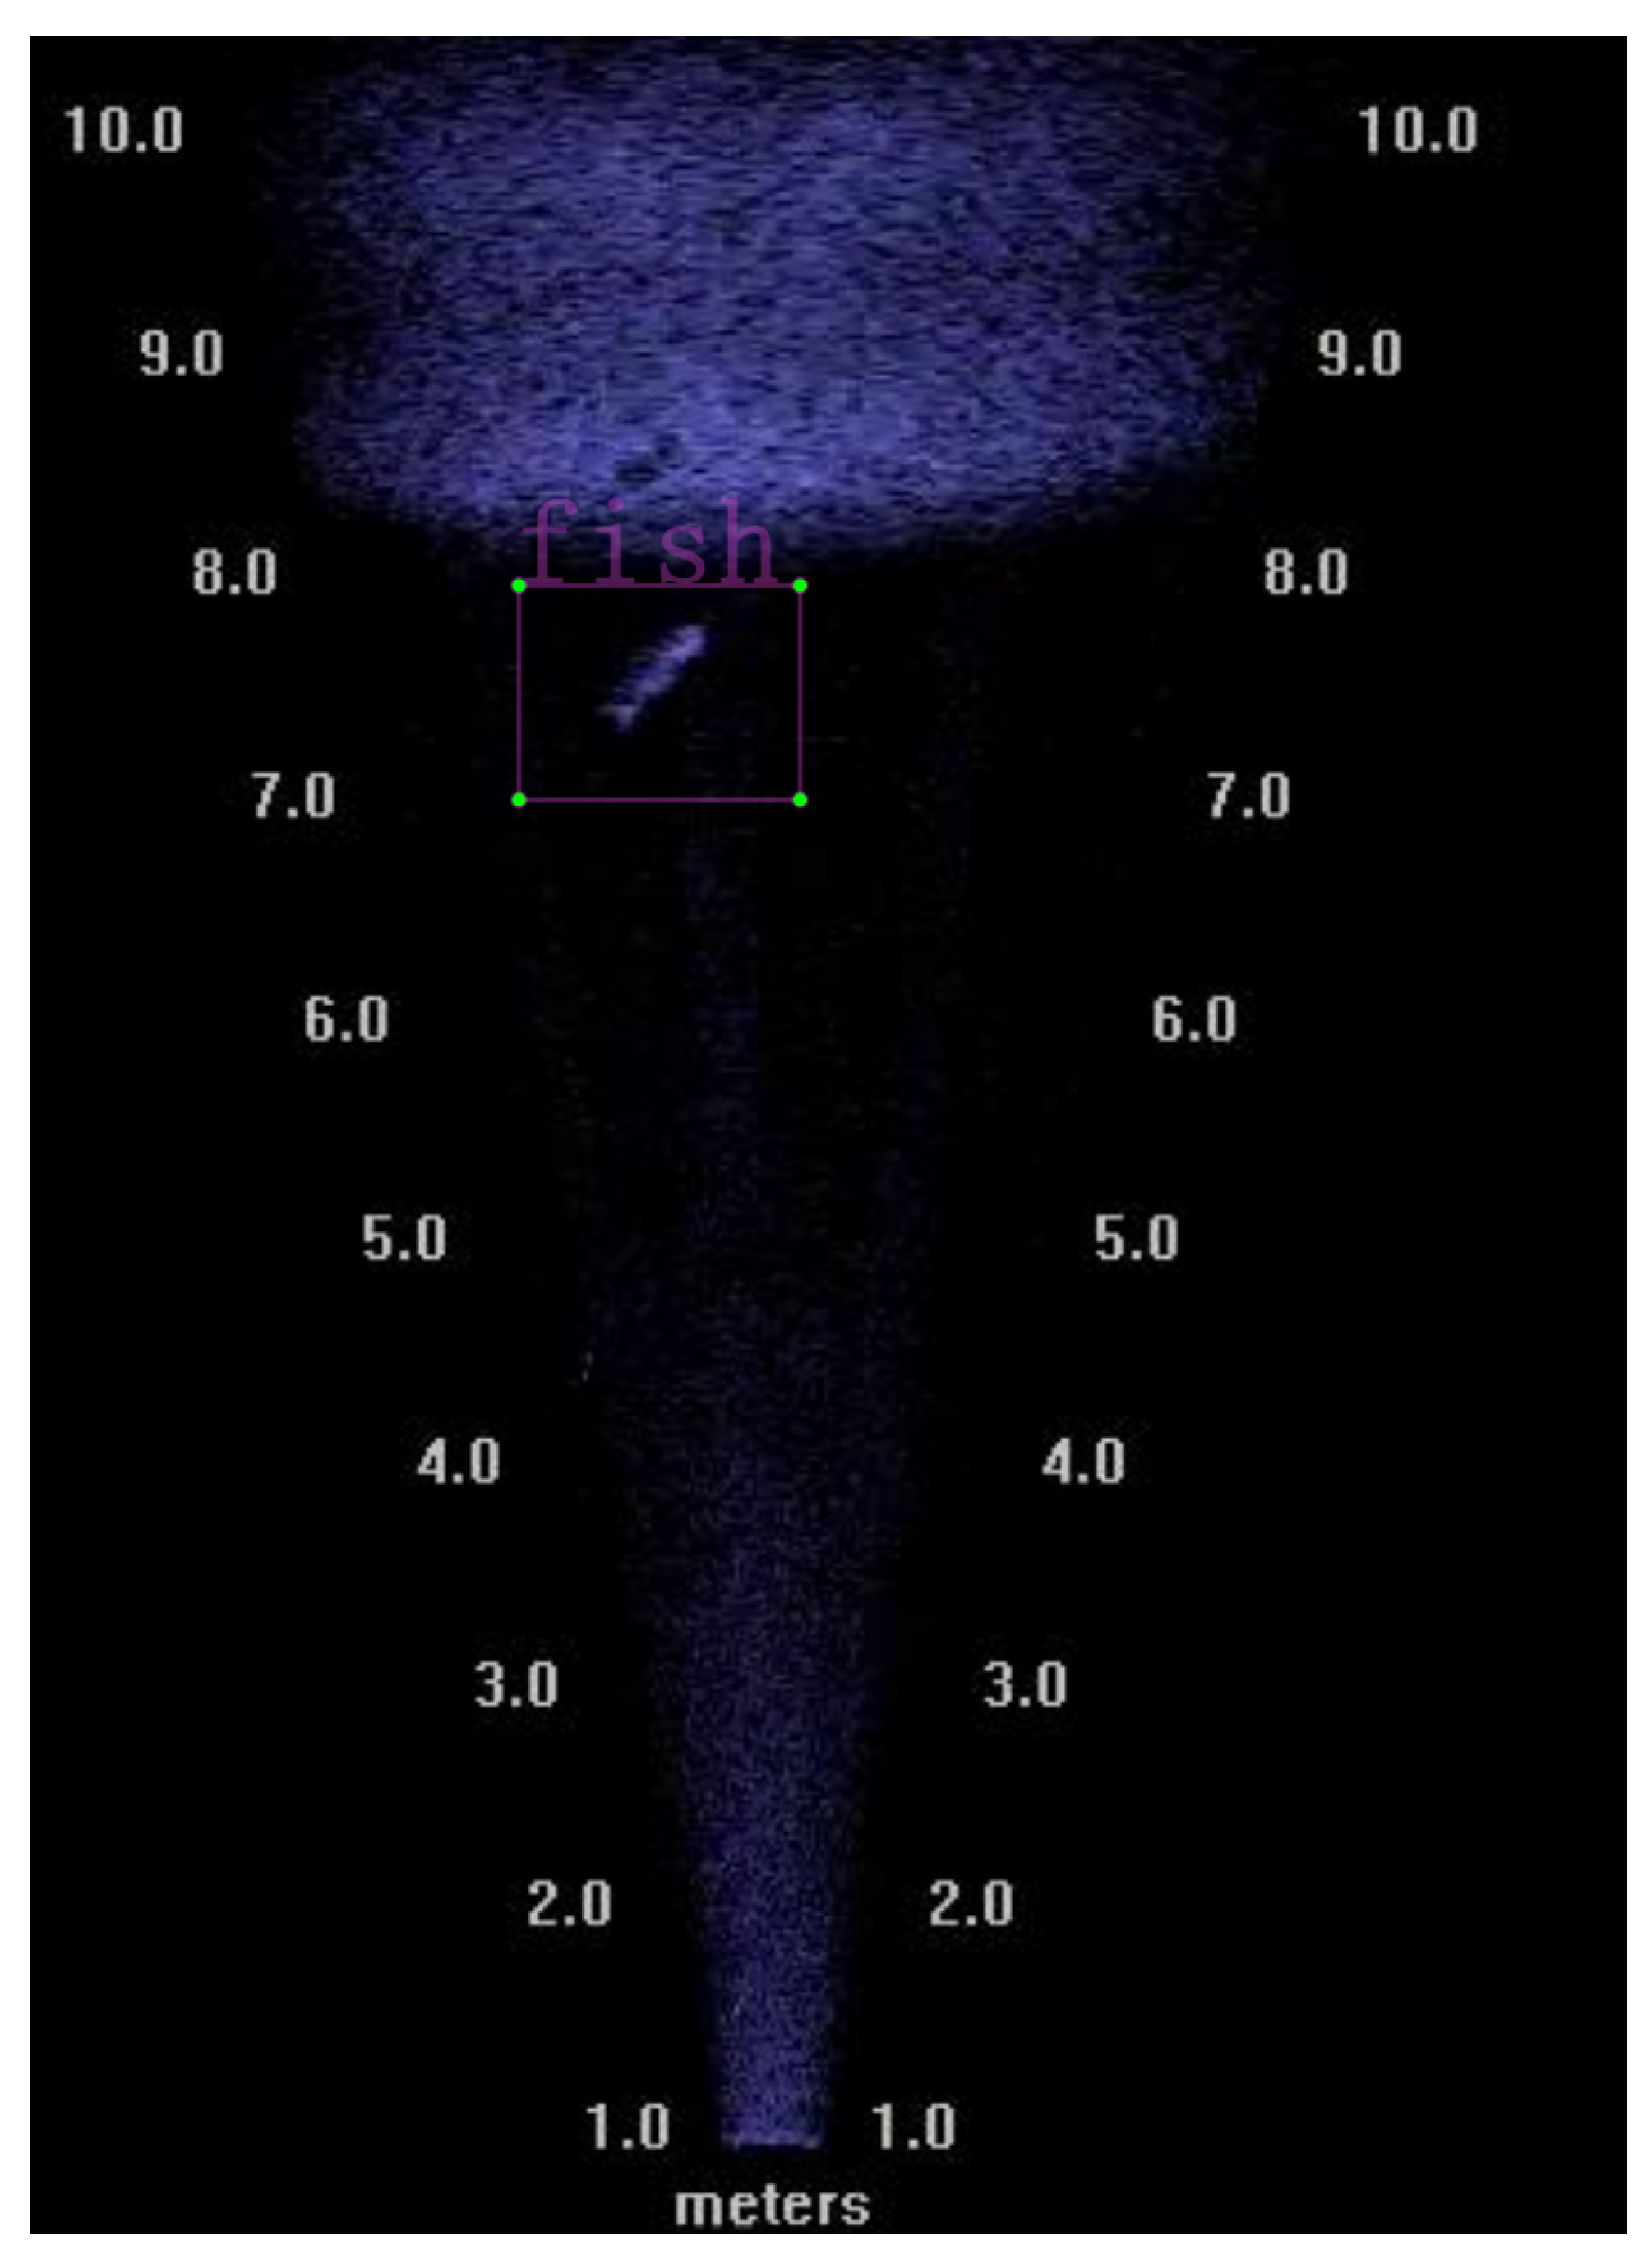
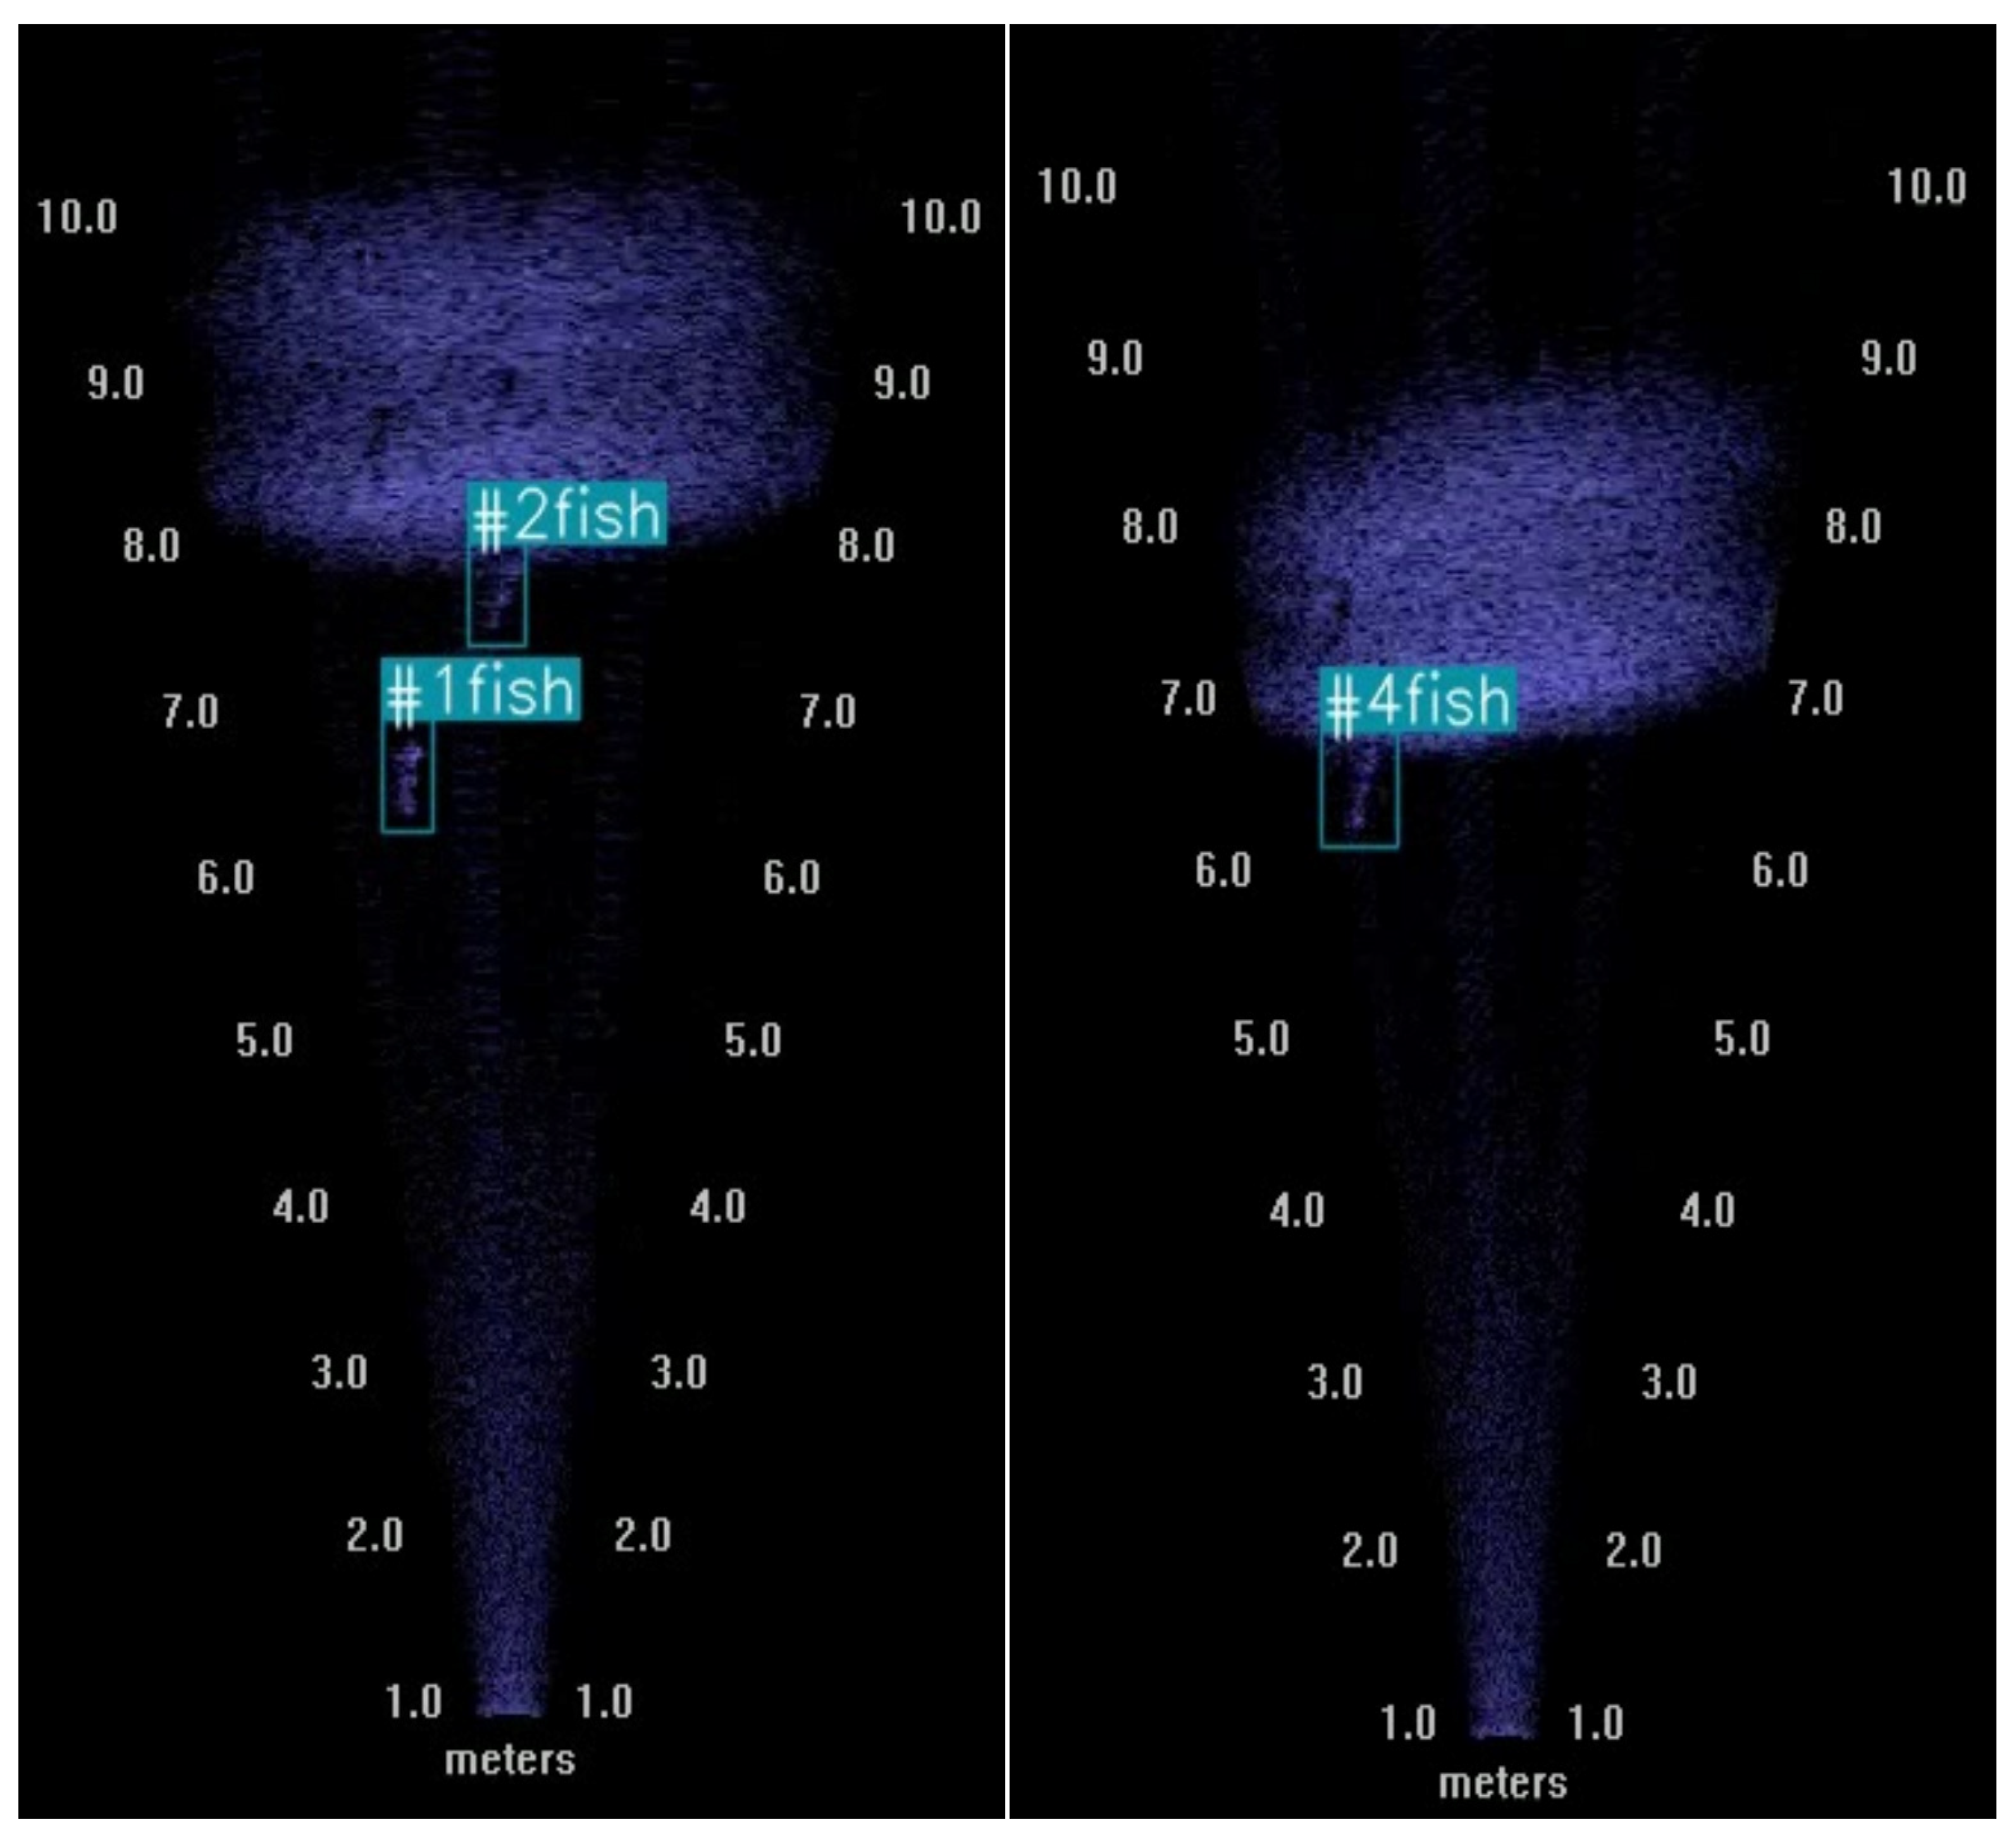
3.1. Target Identification and Counting

Upon completion of the YOLOv5 model training, configure the DeepSort parameters (such as the maximum tracking count of 70 frames, a minimum detection count of 3 frames, a minimum confidence threshold of 0.3, a maximum cosine distance of 0.2, a maximum IOU distance of 0.7, and a maximum overlap ratio for non-maximum suppression (NMS) of 1.0,etc.) Then, the model was integrated with the sonar video files requiring analysis, and the YOLOv5 model will pass the detection results to DeepSort for tracking. By assigning a unique ID to each detected fish target and tracking its movement, accurate and rapid fish target recognition and counting are achieved, as depicted in Figure 6. This survey consisted of 21 lines, with the processed results summarized in Table 2.The ‘Survey Line’ row represents the survey line number, which can be seen in Figure 3, while the ‘YOLOv5’ row indicates the number of fish detected on that specific survey line, with a total of 1760 fish identified.
Table 3 presents the output data of the identified fish targets, “ID” represents the identification number for each fish. “Frame Count” indicates the total number of frames in which the fish target was detected. “First Frame” represents the frame number where the tracked object first appeared, and “Last Frame” indicates the frame number where the tracked object last appeared. “Avg_Depth” represents the actual average depth of the fish after data conversion. “Lat” and “Lon” represent the latitude and longitude where the tracked object appeared. This information is instrumental for subsequent analyses concerning the distribution of fish density.

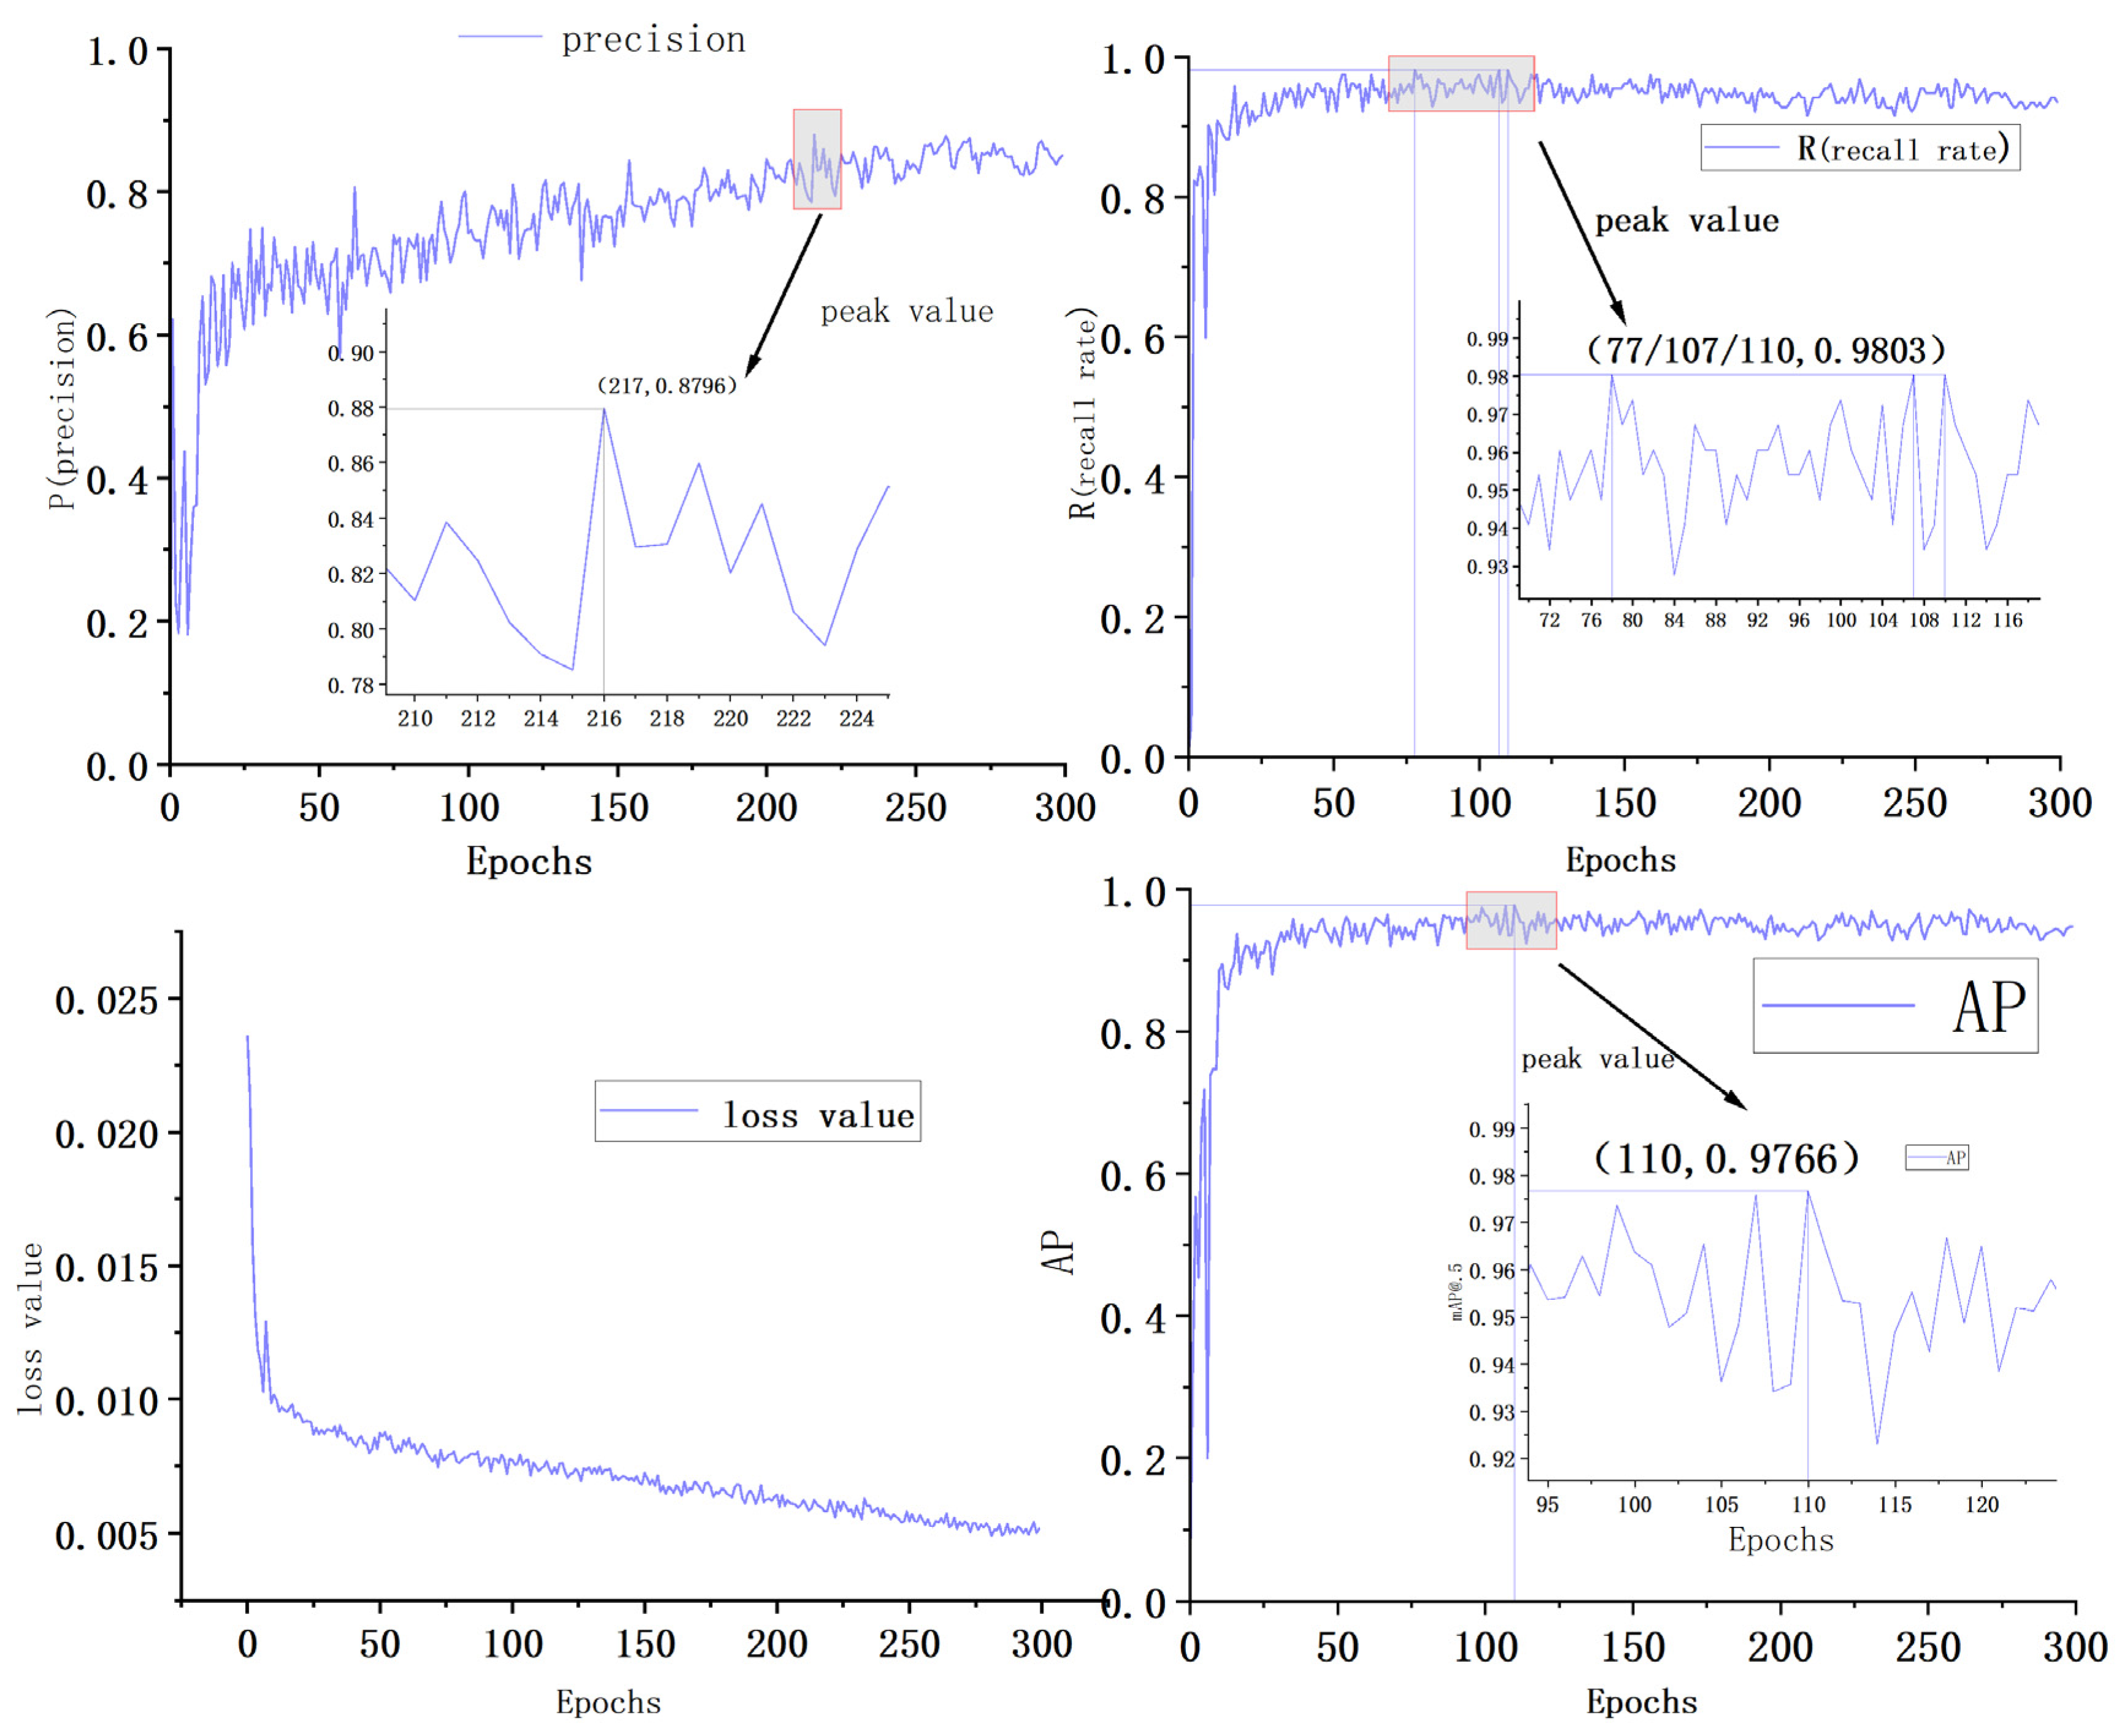
3.2. Accuracy Evaluation

3.2.1. Random Sampling

From the datasets of the initial five survey lines, a tenth of the images were randomly selected. An accuracy analysis was conducted on 500 images containing fish targets, with the results compared against manual recognition outcomes, as shown in Table 4. The identification accuracy reached 83.56%, with the primary causes of recognition errors listed as follows:
  • Excessive clustering of fish led to errors in identification.
  • Errors were likely when fish targets neared the water bottom due to linear propagation, causing them to resemble the bottom.
  • Complex underwater terrain contributed to recognition errors.

3.2.2. Line Inspection

Data from three survey lines were selected to conduct statistics on fish targets and evaluate accuracy, which were then compared with manual recognition results, as presented in Table 5. The average accuracy rate was 84.28%, marginally higher than the sampling rate. This increase was attributed to the movement of both the fish and the boat, causing the same fish targets to appear in multiple frames and to be recognized and counted repeatedly.
Using the DIDSON data from these three survey lines, a comparison was made with different versions of the YOLO method and the traditional Echoview method for processing DIDSON data. The results are shown in Table 6. It can be seen that the accuracy of several methods on the three survey lines is not significantly different but in terms of processing speed, the Echoview method requires a lot of time and manual involvement throughout the entire process. When collecting data from deeper waters, DIDSON sonar data will experience more noise and interference, and the time and effort required for manual work will double. Therefore, the method combining YOLOv5 and DIDSON has strong practicality, saving a lot of the time and energy required for manual processing.

4. Discussion

4.1. Sonar Images

As a high-resolution recognition sonar, DIDSON excels in identifying and counting fish targets underwater compared to traditional scientific fish detectors. However, several factors still impede its accuracy enhancement. For example, sonar echoes reflected by bubbles, plankton, tree branches, and debris in water bodies can introduce noise into DIDSON sonar images [17]. Environmental noise during the collection process, such as ship engine sounds and noise generated by waves, can also affect the sonar images, complicating the detection of fish targets [18]. Balk et al. [19] noted that high boat speeds could result in jagged contours of collected fish targets, a problem that could be alleviated by reducing the boat’s speed. Furthermore, the behavior of fish targets, such as clustering or nearing the bottom, could cause targets to overlap [20] or merge, leading to inaccuracies in their counts. Therefore, the following measures should be taken to obtain high-quality sonar images:
  • Maintaining an appropriate vessel speed, ideally around 5–6 km/h
  • Choose a vessel with minimal noise.
  • Ensure the equipment is securely installed to avoid vibrations.
  • Whenever possible, select clean water areas to reduce reflections from debris in the water.

4.2. Identification and Counting

YOLOv5 combined with DeepSort offers substantial benefits in the practical applications of fish target identification and counting. YOLOv5, known for its high precision and rapid response, is well-suited for real-time object identification and counting [21]. Optimal identification performance necessitates extensive training and validation with a significant amount of data, which should be diverse and cover various scenarios, including different fish types, postures, and densities, as well as a range of underwater conditions and lighting situations [22]. Moreover, precise adjustment of algorithm parameters is crucial; the selection of weight parameters in YOLOv5 model training greatly influences model performance. Adjustments must be made to different loss terms in the loss function, such as classification loss, localization loss, and confidence loss, to meet specific application requirements. An adequate number of training epochs is essential, as too few can result in under-learning, while too many might lead to overfitting and reduce the model’s ability to generalize to new data [23]. DeepSort plays a key role in continuously tracking and counting targets in video frames [24]. It utilizes Kalman filters to predict target positions and employs deep learning features alongside the Hungarian algorithm to resolve target association challenges [23]. DeepSort leverages pre-trained convolutional neural networks to extract appearance features of targets, encoding these into fixed-length vectors to assess target similarity. This process effectively manages challenges posed by temporarily occluded or densely clustered fish targets, enhancing the robustness and reliability of tracking and counting. However, DeepSort demands significant computational resources, such as GPU and memory, particularly when handling high-resolution videos and numerous targets. The performance of DeepSort is heavily dependent on the quality of the feature extraction network; inadequacies in this network can lead to incorrect target associations. In scenarios involving highly clustered or swiftly moving targets, DeepSort might encounter tracking inaccuracies or losses, a limitation that can be partially addressed through deep learning features but not entirely eliminated. By strategically allocating computing resources, optimizing feature extraction networks, and thoroughly preparing training data, the combined capabilities of YOLOv5 and DeepSort can be effectively utilized to enhance fish target recognition and tracking performance.

4.3. Manual Identification

During the accuracy evaluation and verification phases, manual counting was employed for validation. The results varied among individuals due to differences in their levels of cognition and experience in recognizing fish targets [25], precluding the possibility of achieving absolute accuracy. Furthermore, prolonged periods of manual counting were susceptible to errors stemming from human fatigue. Although YOLOv5 demonstrated a slightly lower accuracy compared to manual counting, it provided the advantage of stable, automatic counting, which is not affected by fatigue or subjective biases. This feature is particularly beneficial for the consistent identification and counting of fish targets.

5. Conclusions

The importance of automated identification and counting of fish targets cannot be overstated in the context of fish resource assessment and management. This study introduced a method that integrates high-definition DIDSON sonar with YOLOv5, achieving a recognition accuracy exceeding 80%. This method offers substantial improvements over traditional Echoview method in terms of recognition accuracy, processing speed, and reduced labor costs.
The accuracy of the proposed method is influenced by several factors, including the quality of sonar images, background noise, and variations in fish size, density, and proximity to the water bottom. Further refinement is necessary to enhance identification and counting accuracy while minimizing disturbances such as acoustic noise during data acquisition. Additionally, the parameter settings and data training for YOLOv5 and DeepSort require optimization to support the model’s generalization capabilities and robustness across various application scenarios. Future research will focus on enhancing the accuracy and reliability of fish target identification and counting by improving sonar technology, refining model structures, and enriching the diversity of training data.
In summary, the method proposed in this study offers high recognition accuracy and significantly improves the speed of sonar data processing, while avoiding the drawbacks of human fatigue and subjective bias. It consistently maintains a high level of accuracy, enhances efficiency, and provides faster and more effective technical support for the monitoring and management of fish populations, thereby contributing to the sustainable development of fisheries.

Author Contributions

W.S., Conceptualization, formal analysis, investigation, supervision and writing—review and editing; M.L., investigation, methodology, writing—original draft preparation and, writing—review and editing and data curation. Q.L., validation, writing—original draft preparation and resources. Z.Y., data curation, resources and writing—review and editing. J.Z., investigation, supervision, project administration, resources and formal analysis. All authors have read and agreed to the published version of the manuscript.

Funding

This research received no external funding.

Institutional Review Board Statement

Not applicable.

Informed Consent Statement

Not applicable.

Data Availability Statement

All data used in this study can be obtained from the corresponding author.

Acknowledgments

The authors sincerely appreciate all the reviewers for their invaluable feedback and suggestions.

Conflicts of Interest

The authors declare no conflicts of interest.

References

  1. Cronkite, G.M.W.; Enzenhofer, H.J. Observations of Controlled Moving Targets with Split-Beam Sonar and Implications for Detection of Migrating Adult Salmon in Rivers. Aquat. Living Resour. 2002, 15, 1–11. [Google Scholar] [CrossRef]
  2. Perivolioti, T.-M.; Tušer, M.; Terzopoulos, D.; Sgardelis, S.P.; Antoniou, I. Optimising the Workflow for Fish Detection in DIDSON (Dual-Frequency IDentification SONar) Data with the Use of Optical Flow and a Genetic Algorithm. Water 2021, 13, 1304. [Google Scholar] [CrossRef]
  3. Moursund, R.A.; Carlson, T.J.; Peters, R.D. A Fisheries Application of a Dual-Frequency Identification Sonar Acoustic Camera. ICES J. Mar. Sci. 2003, 60, 678–683. [Google Scholar] [CrossRef]
  4. Belcher, E.; Hanot, W.; Burch, J. Dual-Frequency Identification Sonar (DIDSON). In Proceedings of the 2002 Interntional Symposium on Underwater Technology (Cat. No.02EX556), Tokyo, Japan, 19 April 2002; pp. 187–192. [Google Scholar]
  5. Maxwell, S.L.; Gove, N.E. The Feasibility of Estimating Migrating Salmon Passage Rates in Turbid Rivers Using a Dual Frequency Identification Sonar (DIDSON); Anchorage, Alaska Department of Fish and Game, Division of Commercial Fisheries: Anchorage, Alaska, 2004. [Google Scholar]
  6. Han, J.; Honda, N.; Asada, A.; Shibata, K. Automated Acoustic Method for Counting and Sizing Farmed Fish during Transfer Using DIDSON. Fish. Sci. 2009, 75, 1359–1367. [Google Scholar] [CrossRef]
  7. Jing, D.; Han, J.; Wang, X.; Wang, G.; Tong, J.; Shen, W.; Zhang, J. A Method to Estimate the Abundance of Fish Based on Dual-Frequency Identification Sonar (DIDSON) Imaging. Fish. Sci. 2017, 83, 685–697. [Google Scholar] [CrossRef]
  8. Zhang, H.; Wei, Q.; Kang, M. Measurement of Swimming Pattern and Body Length of Cultured Chinese Sturgeon by Use of Imaging Sonar. Aquaculture 2014, 434, 184–187. [Google Scholar] [CrossRef]
  9. Ladroit, Y.; Escobar-Flores, P.C.; Schimel, A.C.G.; O’Driscoll, R.L. ESP3: An Open-Source Software for the Quantitative Processing of Hydro-Acoustic Data. SoftwareX 2020, 12, 100581. [Google Scholar] [CrossRef]
  10. Husain, B.H.; Osawa, T. Advancing Fauna Conservation through Machine Learning-Based Spectrogram Recognition: A Study on Object Detection Using YOLOv5. J. Sumberd. Alam Dan Lingkung. 2023, 10, 58–68. [Google Scholar] [CrossRef]
  11. Tong, J.; Wang, W.; Xue, M.; Zhu, Z.; Han, J.; Tian, S. Automatic Single Fish Detection with a Commercial Echosounder Using YOLO v5 and Its Application for Echosounder Calibration. Front. Mar. Sci. 2023, 10, 1162064. [Google Scholar] [CrossRef]
  12. Yu, Y.; Zhao, J.; Gong, Q.; Huang, C.; Zheng, G.; Ma, J. Real-Time Underwater Maritime Object Detection in Side-Scan Sonar Images Based on Transformer-YOLOv5. Remote Sens. 2021, 13, 3555. [Google Scholar] [CrossRef]
  13. Xing, B.; Sun, M.; Ding, M.; Han, C. Fish Sonar Image Recognition Algorithm Based on Improved YOLOv5. Math. Biosci. Eng. 2024, 21, 1321–1341. [Google Scholar] [CrossRef] [PubMed]
  14. Li, Z.; Song, J.; Qiao, K.; Li, C.; Zhang, Y.; Li, Z. Research on Efficient Feature Extraction: Improving YOLOv5 Backbone for Facial Expression Detection in Live Streaming Scenes. Front. Comput. Neurosci. 2022, 16, 980063. [Google Scholar] [CrossRef] [PubMed]
  15. Belcher, E.O.; Lynn, D.C.; Dinh, H.Q.; Laughlin, T.J. Beamforming and Imaging with Acoustic Lenses in Small, High-Frequency Sonars. In Proceedings of the Oceans ’99. MTS/IEEE. Riding the Crest into the 21st Century. Conference and Exhibition. Conference Proceedings (IEEE Cat. No.99CH37008), Seattle, WA, USA, 13–16 September 1999; Volume 3, pp. 1495–1499. [Google Scholar]
  16. Holmes, J.A.; Cronkite, G.M.W.; Enzenhofer, H.J.; Mulligan, T.J. Accuracy and Precision of Fish-Count Data from a “Dual-Frequency Identification Sonar” (DIDSON) Imaging System. ICES J. Mar. Sci. 2006, 63, 543–555. [Google Scholar] [CrossRef]
  17. Kovesi, P. Phase Preserving Denoising of Images. Signal 1999, 4, 212–217. [Google Scholar]
  18. Luo, Y.; Lu, H.; Zhou, X.; Yuan, Y.; Qi, H.; Li, B.; Liu, Z. Lightweight Model for Fish Recognition Based on YOLOV5-MobilenetV3 and Sonar Images. Guangdong Nongye Kexue 2023, 50, 37–46. [Google Scholar]
  19. Balk, H.; Lindem, T. Improved Fish Detection in Data from Split-Beam Sonar. Aquat. Living Resour. 2000, 13, 297–303. [Google Scholar] [CrossRef]
  20. Helminen, J.; Linnansaari, T. Object and Behavior Differentiation for Improved Automated Counts of Migrating River Fish Using Imaging Sonar Data. Fish. Res. 2021, 237, 105883. [Google Scholar] [CrossRef]
  21. Redmon, J.; Farhadi, A. YOLOv3: An Incremental Improvement. arXiv 2018, arXiv:1804.02767. [Google Scholar]
  22. Lin, T.-Y.; Maire, M.; Belongie, S.; Hays, J.; Perona, P.; Ramanan, D.; Dollár, P.; Zitnick, C.L. Microsoft COCO: Common Objects in Context. In Proceedings of the Computer Vision—ECCV 2014; Fleet, D., Pajdla, T., Schiele, B., Tuytelaars, T., Eds.; Springer International Publishing: Cham, Switzerland, 2014; pp. 740–755. [Google Scholar]
  23. Shafiq, M.; Gu, Z. Deep Residual Learning for Image Recognition: A Survey. Appl. Sci. 2022, 12, 8972. [Google Scholar] [CrossRef]
  24. Wojke, N.; Bewley, A.; Paulus, D. Simple Online and Realtime Tracking with a Deep Association Metric. In Proceedings of the 2017 IEEE International Conference on Image Processing (ICIP), Beijing, China, 17–20 September 2017; pp. 3645–3649. [Google Scholar]
  25. Keefer, M.L.; Caudill, C.C.; Johnson, E.L.; Clabough, T.S.; Boggs, C.T.; Johnson, P.N.; Nagy, W.T. Inter-Observer Bias in Fish Classification and Enumeration Using Dual-Frequency Identification Sonar (DIDSON): A Pacific Lamprey Case Study. Northwest Sci. 2017, 91, 41–53. [Google Scholar] [CrossRef]
Figure 1. Algorithm flowchart. The figure illustrates the integrated workflow of YOLOv5 and DeepSORT for object tracking. Initially, YOLOv5 extracts image features from the input sonar data, completing object detection through its Backbone, Neck, and Head modules. Following detection, the DeepSORT algorithm takes over, using Kalman filtering for prediction, Mahalanobis distance for motion matching, and cosine distance for appearance matching. Finally, the algorithm updates the target trajectories through cascade matching and IoU matching, outputting the tracking results. This workflow effectively combines detection and tracking, ensuring accurate multi-object tracking even in complex environments.
Fishes 09 00346 g001
Figure 2. DIDSON imaging schematic. L1 is a lens triplet composed of a biconcave plastic lens, a liquid medium, and a thinner plastic lens. L2 is a plano-convex plastic lens, and its focal length can be adjusted by altering the distance between it and L1. L3 is positioned in front of the transducer array T. When sound waves are incident on L1 at a 0° angle, the focal point of the waves aligns with the center of the transducer array. When sound waves are incident at a 9° angle, the lens alters the propagation path of the waves, focusing them at the 9° position of the transducer array.
Fishes 09 00346 g002
Figure 3. Chenhang Reservoir sonar survey route. During the field sonar data collection process, starting from the bottom right corner of the image and ending at the top left corner, we switch the survey line file approximately every eight minutes to ensure consistent data file sizes, with a measurement distance of approximately 1 km, making subsequent processing more convenient.
Fishes 09 00346 g003
Figure 4. Labellmg annotation schematic. In this figure, the area from 1 to 4 m shows speckle noise caused by factors such as ship noise, bubbles, and impurities in the water. The boxed section highlights a horizontally oriented fish. Due to the relatively high speed of the vessel, the sonar image of the fish appears as connected blocks, creating a jagged or sawtooth pattern. The large reflective area from 8 to 10 m is caused by reflections from the lakebed.
Fishes 09 00346 g004
Figure 5. Model evaluation parameters.
Fishes 09 00346 g005
Figure 6. Fish target identification.
Fishes 09 00346 g006
Table 1. DIDSON sonar related parameters.
Specification/ModeLow FrequencyHigh Frequency
Operating Frequency1.0 MHz1.8 MHz
Beam WidthHorizontal 0.4°, Vertical 12°Horizontal 0.3°, Vertical 12°
Number of Beams4896
Source Level202 dB re 1 μPa at 1 m206 dB re 1 μPa at 1 m
Start Range0.75 m to 40 m0.38 m to 11.63 m
Maximum Frame Rate4–21 frames/s
Field of View29°
Remote Focusing1 m to maximum range
Power ConsumptionWatts typical
Weight in Air7.0 kg (15.4 lbs)
Weight in Water−0.61 kg (1.33 lbs)
Dimensions30.7 cm × 20.6 cm × 17.1 cm
Table 2. Automatic identification count.
Survey Line012345678910
YOLOv5 (fish)18821614312214510070497110063
Survey Line11121314151617181920Total
YOLOv5 (fish)7066124436481344422171760
Note: The values represent the number of fish automatically identified by YOLOv5 on each survey line.
Table 3. Information related to fish target identification.
IDFrame CountFirst
Frame
Last FrameAvg_Depth (m)LatLon
1114145.8731.49176567121.355733
2137196.7031.49177917121.3557462
31421346.3631.4918065121.3557723
471211276.4331.49198483121.355938
541551585.4031.49204017121.355989
Table 4. Evaluation of the accuracy of extracted images.
Manual IdentificationTotal IdentificationsCorrect IdentificationsUnidentifiedMisidentificationsAccuracy (%)Unidentification Rate (%)Misidentification Rate (%)
Count (fish)675588564872483.56%12.89%3.56%
Note: The values represent the number of fish.
Table 5. Evaluation of line accuracy.
Survey LineManual identification CountYOLOv5 Total Identifications
Count
Correct Identifications CountUnidentified CountMisidentifications
Count
Accuracy (%)Unidentification Rate (%)Misidentification Rate (%)
107163618285.92%11.27%2.82%
1183706913183.13%15.66%1.20%
127566639384%12%4%
Average 10384.28%13.10%2.62%
Note: The values represent the number of fish automatically identified by YOLOv5 on each survey line.
Table 6. Comparison of Accuracy Across Different Methods.
MethodYOLOv5 YOLOv6YOLOv8EchoviewManual Identification
Survey Line 106361596071
Survey Line 117063646983
Survey Line 126667757075
Processing Time (single survey line)3 min3 min3 minApproximately 30 minApproximately 120 min
Deviation (total)30383130
Note: These values represent the number of fish identified by different methods.
Disclaimer/Publisher’s Note: The statements, opinions and data contained in all publications are solely those of the individual author(s) and contributor(s) and not of MDPI and/or the editor(s). MDPI and/or the editor(s) disclaim responsibility for any injury to people or property resulting from any ideas, methods, instructions or products referred to in the content.

