1. Introduction
From 1980 to 2019, China’s aquatic product production skyrocketed, increasing from 4.6 million tons in 1980 to 64.8 million tons in 2019, with 78% coming from aquaculture and 22% from capture fisheries [
1]. As the world-leading fishing and fish-farming country [
2], China’s fisheries have faced numerous challenges [
3], including overfishing and the depletion of fish stock [
4,
5], water pollution [
6], conflicts over resources in common seas shared with adjacent coastal countries [
7], and coastal and offshore habitat deterioration [
8,
9]. In response, China has gradually implemented a series of laws, regulations, measures, programs, and agreements over the past four decades to address these issues and promote sustainable fishery management (
Table 1).
The key legislative and regulatory milestones include the “Marine Environmental Protection Law” (1982) and “Fishery Law” (1986, as amended in 2000 and 2004), which provided the legal framework for fishery management. Some key input control policies, such as the “Dual Control” (1987) and the “Fishermen Transfer and Fishing Fleet Scrapping” programs (2003), have been implemented with the aim of reducing the number of fishermen and marine fishery vessels. Output control measures such as the “Summer Fishing Moratorium” (1995) provided respite for depleted fish stock, while the “Zero Growth” (1999), “Total Allowable Catch” (2016), and “Trial of Marine Capture Quota” (2017) initiatives aimed to limit marine catches. To enhance transparency and safety, the “DWF Supervisory Regulation” (2003) and “Mandatory Installation of Vessel Monitoring Systems (VMS)” (2011) measures govern distant-water fleets. International cooperation is addressed through “Bilateral Agreements” (1997–2000) for resolving disputes in common fishing grounds.
Despite fishery management efforts in China [
10], the recent literature has not fully explored the long-term impacts of these measures on fishery production and fishing efforts. In addition, regarding China’s fisheries, marine fisheries [
9,
11] have received more attention than inland fisheries [
12], and capture fisheries [
13,
14] more than aquaculture [
15,
16]. Most previous research has focused on qualitative [
17,
18] analyses of management policies, with few studies providing quantitative insights [
19]. To address these gaps, this study analyzes China’s fishery inputs (effort) and outputs (production) in response to various management measures over the past 40 years, employing both qualitative and quantitative insights, and offers a comprehensive view of the effectiveness of these policies in promoting sustainable fisheries.
2. Materials and Methods
2.1. Data Source
This systematic review analyzed the development of China’s capture fisheries and aquaculture from 1980 to 2019, utilizing comprehensive long-term data from multiple sources. The primary data source was China’s Fisheries Yearbook, which provides annual statistics on key fishery inputs (for example, the number of fishing boats, aquaculture area, and number of fishermen) and outputs (for example, the catch volume, economic value, and fishermen’s income). This yearbook is recognized as an authoritative source for national fishery statistics.
To ensure a robust and thorough examination, additional data on governmental fishery management measures were collected from the Ministry of Agriculture and Rural Affairs of China. An extensive literature review was conducted, drawing from a variety of sources, including laws and regulations, government reports, China’s Statistical Bulletin, the Gazette of the Ministry of Agriculture, the Bulletin of the State Council, academic publications, media news, and organizational websites.
2.2. Analysis Approach
The analysis was conducted in several steps to ensure a detailed and systematic review of China’s fishery management practices and their outcomes over the past four decades.
Data Collection and Verification: Data from China’s Fisheries Yearbook and additional sources were meticulously collected and cross-referenced to ensure accuracy and consistency [
1,
10]. This included verifying the statistical data against multiple reports and publications.
Categorization of Policies and Measures: Fishery management measures were categorized based on their primary objectives, such as conservation, sustainability, economic support, and regulatory control [
20,
21]. This categorization helped in understanding the specific focus and intended outcomes of each policy.
Quantitative Analysis: Statistical tools were used to analyze trends in fishery inputs and outputs over the 40-year period. This involved calculating the annual growth rates, identifying peaks and troughs in production, and assessing the impact of specific policies on these trends [
22,
23]. A time-series analysis was employed to track changes over time and to correlate those changes with the implementation of specific management measures.
Qualitative Analysis: A detailed review of policy documents, laws, and regulations was conducted to understand the context and rationale behind each management measure [
24,
25]. Case studies of significant policies, such as the Marine Environmental Protection Law (1982) and the Fisheries Law of the People’s Republic of China (1986), were included to provide in-depth insights into their development and impact.
Impact Assessment: The effectiveness of each policy was assessed by comparing pre- and post-implementation data, which involved looking at changes in key indicators such as the fish stock levels, economic value, and fishing effort [
26,
27,
28]. Policies were classified as effective, partially effective, or ineffective based on their impact on sustainable fishery management.
This multifaceted approach integrated quantitative data and qualitative insights, providing a comprehensive understanding of the fishery sector’s evolution and management.
This systematic review and analysis provided a comprehensive understanding of the evolution and impact of China’s fishery management policies over four decades.
3. Results and Discussion
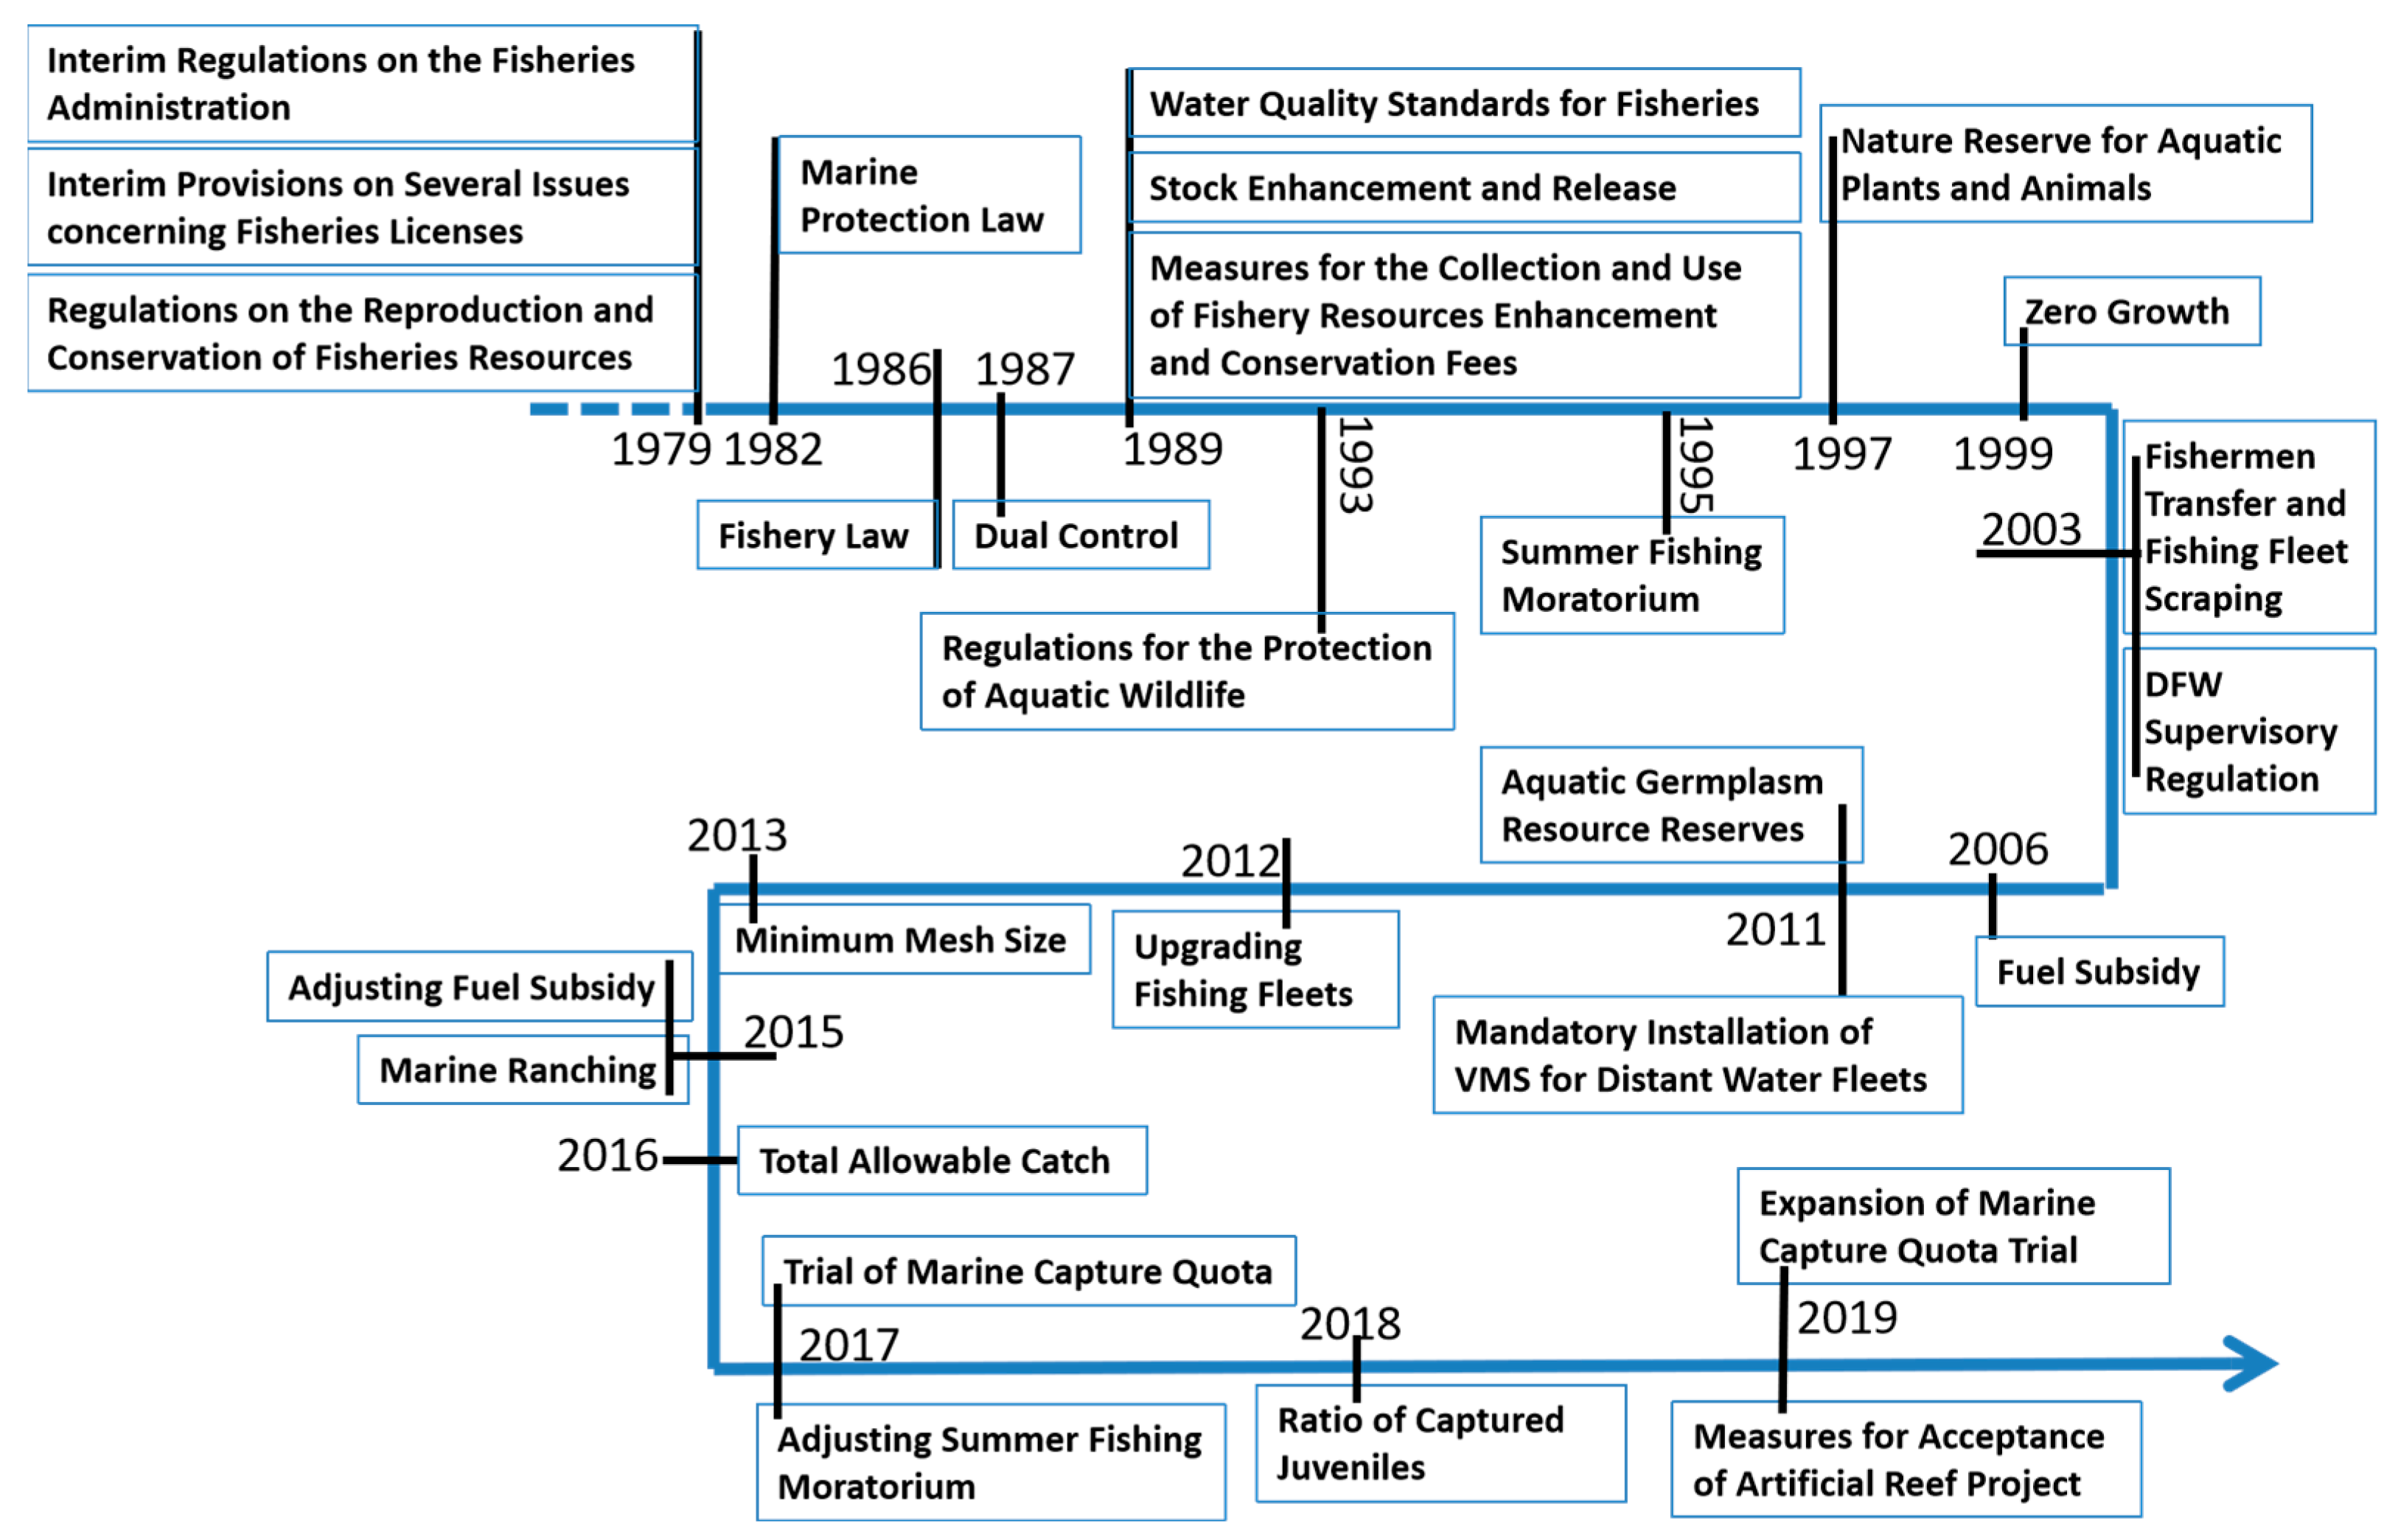
3.1. Laws, Regulations, and Policy Measures
China’s fishery management has evolved significantly since the 1950s (
Figure 1). Before 1980, preliminary legal frameworks such as the “Order Regarding Motorized Trawl Fisheries Closed Fishing Areas of the Bohai Sea, the Yellow Sea, and the East China Sea”, “Regulations on the Reproduction and Conservation of Fisheries Resources”, and “Interim Provisions on Several Issues Concerning Fisheries Licenses” laid the foundation for fishery management. The “Marine Environmental Protection Law” (1982) aimed to improve the marine environment and conserve marine resources, while the “Fisheries Law of the People’s Republic of China” (1986) established overarching rules governing the use of fish resources, marking the beginning of comprehensive fishery management.
In response to fish stock depletion and environmental pollution, China issued several laws and regulations with specific objectives:
Dual Control (1987): Controlled the number and power of marine fisheries’ fleets.
Water Quality Standards for Fisheries (1989): Ensured the quality of aquatic products.
Stock Enhancement and Release Program (1989): Replenished fish stocks by releasing juveniles into public waters.
Measures for Fishery Resources Enhancement Fees (1989): Regulated the collection and use of enhancement and conservation fees.
Regulations for the Protection of Aquatic Wildlife (1993): Managed precious and endangered aquatic species.
Summer Fishing Moratorium (1995): Implemented seasonal fishing bans to allow fish stock recovery.
Nature Reserves for Aquatic Plants and Animals (1997): Established to enhance aquatic biodiversity.
Zero Growth (1999): Ensures no increase in marine capture production compared to the previous year.
Aquatic Germplasm Resource Reserves (2011): Focused on breeding endangered species, with 535 reserves established by 2018.
Upgrading Fishing Fleets (2012): Improved fleet safety and efficiency.
Minimum Mesh Size (2013): Set standards for marine fishing gear to reduce bycatch.
Marine Ranching (2015): Promoted sustainable use and conservation, with over 200 ranches contributing significantly to the economy.
Total Allowable Catch (2016): Limited marine catch to under 10 million tons annually.
Adjusting Summer Fishing Moratorium (2017): Increased protection for fish stocks.
Trial of Marine Capture Quota (2017): Implemented quotas in coastal provinces based on maximum sustainable yield (MSY) principles.
Ratio of Captured Juveniles (2018): Protected high-value species by setting juvenile capture limits.
From 1997 to 2000, bilateral agreements with Japan, South Korea, and Vietnam led to reduced fishing grounds, decreased fleet sizes, and the relocation of fishermen. The “Fishermen Transfer and Fishing Fleet Scrapping” program (2003) provided funds for decommissioning fleets and retraining fishermen.
Other significant measures included the following:
Distant-Water Fishery (DWF) Supervisory Regulation (2003): Promoted sustainable use of pelagic fisheries.
Fuel Subsidy (2006): Aimed to reduce fishermen’s production costs, although it conflicted with other programs until it was adjusted in 2015.
Mandatory Installation of Vessel Monitoring Systems (VMS) (2011): Enhanced the transparency of distant-water fleets.
Acceptance of Artificial Reef Project (2019): Regulated artificial fish reef construction.
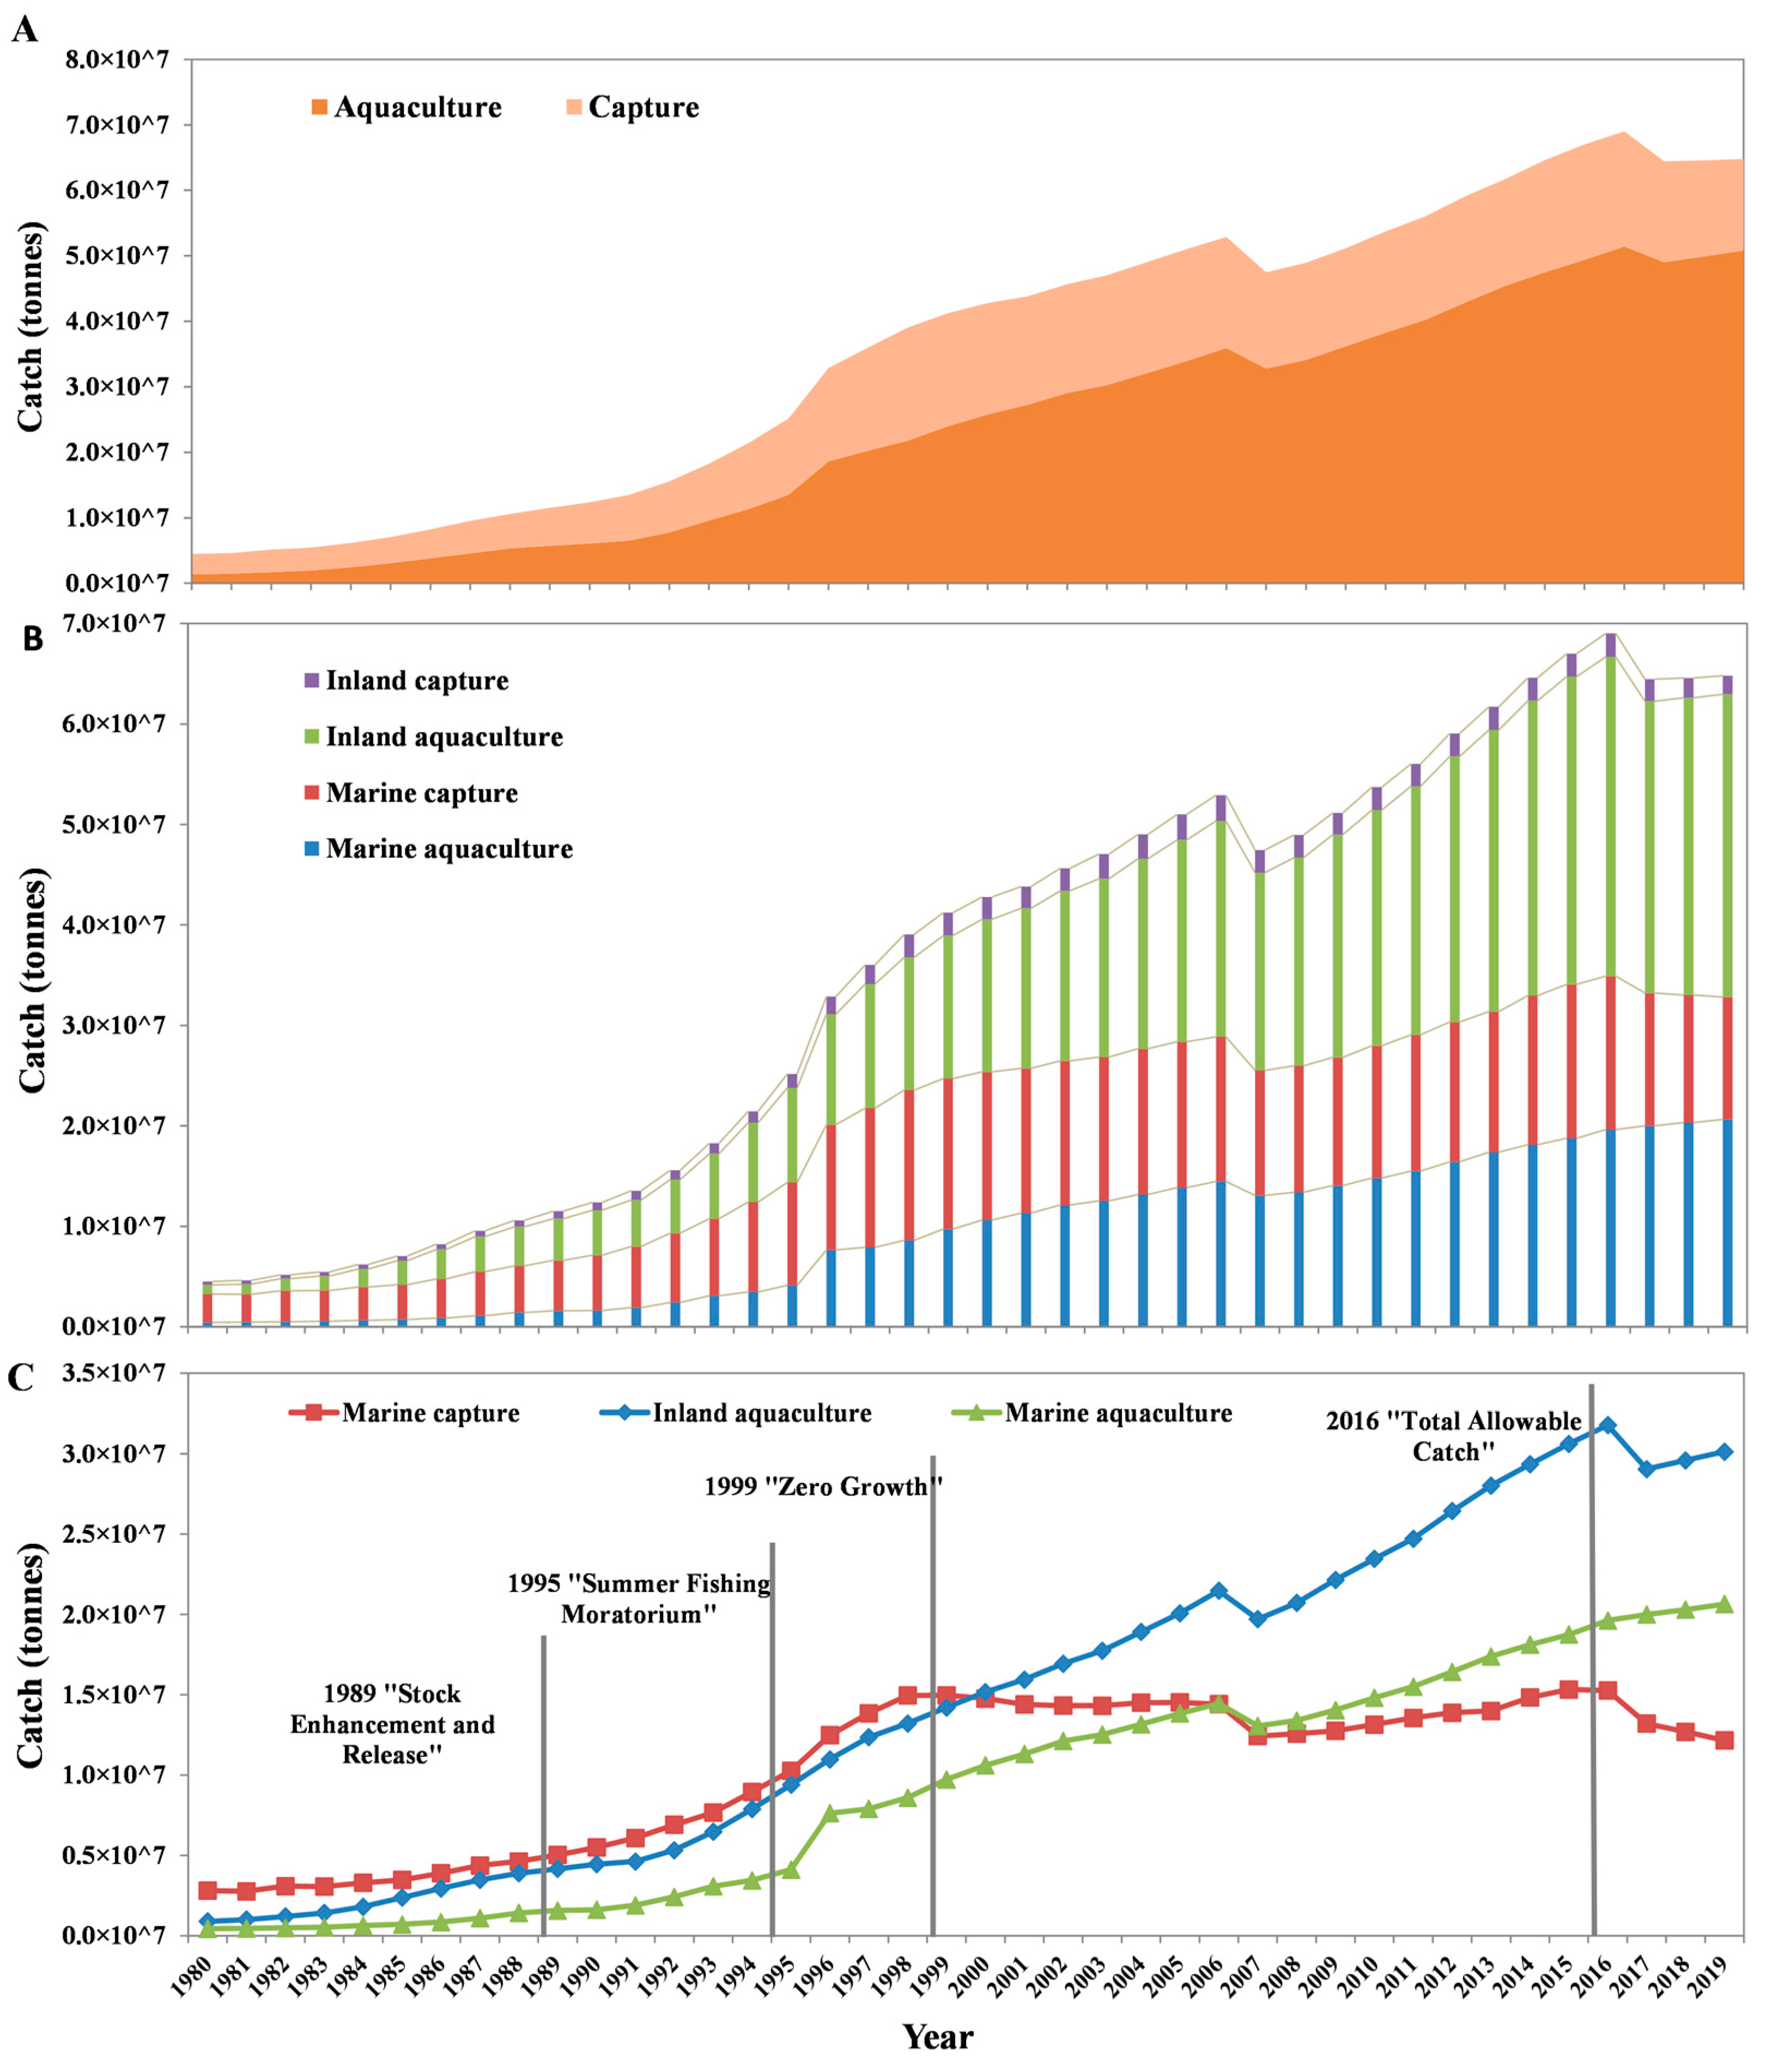
3.2. Landings
3.2.1. National Landings
Figure 2A shows a significant increase in the total national landings over the past 40 years. From 1980 to 2019, China’s annual aquatic food production surged from 4.5 million tons to 64.8 million tons, with an impressive growth rate of 7% per year. In 2016, national landings peaked at 69 million tons, over 15 times the volume in 1980. Most of the increase was due to aquaculture, which accounted for 50 million tons of the 64.5 million tons, while capture fisheries contributed just under 15 million tons. Since 1993, aquaculture has consistently dominated the landings in terms of quantity.
The production of marine aquaculture, marine capture, inland aquaculture, and inland capture together comprise China’s total seafood volume.
Figure 2B illustrates the upward trend in landing quantities across all the sectors from 1980 to 2019. On average, inland aquaculture contributed 41% of the national landings, followed by marine capture (29%) and marine aquaculture (26%), highlighting China’s reliance on aquaculture [
29], which accounted for 67% of the total production.
A close look at these three most productive sectors by year (
Figure 2C) reveals that marine capture dominated national yields between 1980 and 1984. However, inland aquaculture steadily increased, overtaking marine capture in 2001 and maintaining dominance through 2019. Additionally, marine aquaculture (inshore) has surpassed marine capture (offshore) in quantity since 2007, a shift illustrating China’s transition from capture to aquaculture and from offshore to inshore.
Several regulations, including the 1989 “Stock Enhancement and Release”, 1995 “Summer Fishing Moratorium”, 1999 “Zero Growth”, and 2016 “Total Allowable Catch”, significantly impacted marine capture. The 1989 and 1995 regulations positively affected fish resource rebuilding, with marine capture landings increasing by 0.4 million tons in 1989 and 1.3 million tons in 1995 compared to the previous years (
Figure 2C). Conversely, the 1999 and 2016 policies successfully reduced the marine catch intensity, with marine capture landings decreasing by 0.19 million tons in 2000 and 0.21 million tons in 2017 compared to earlier years (
Figure 2C).
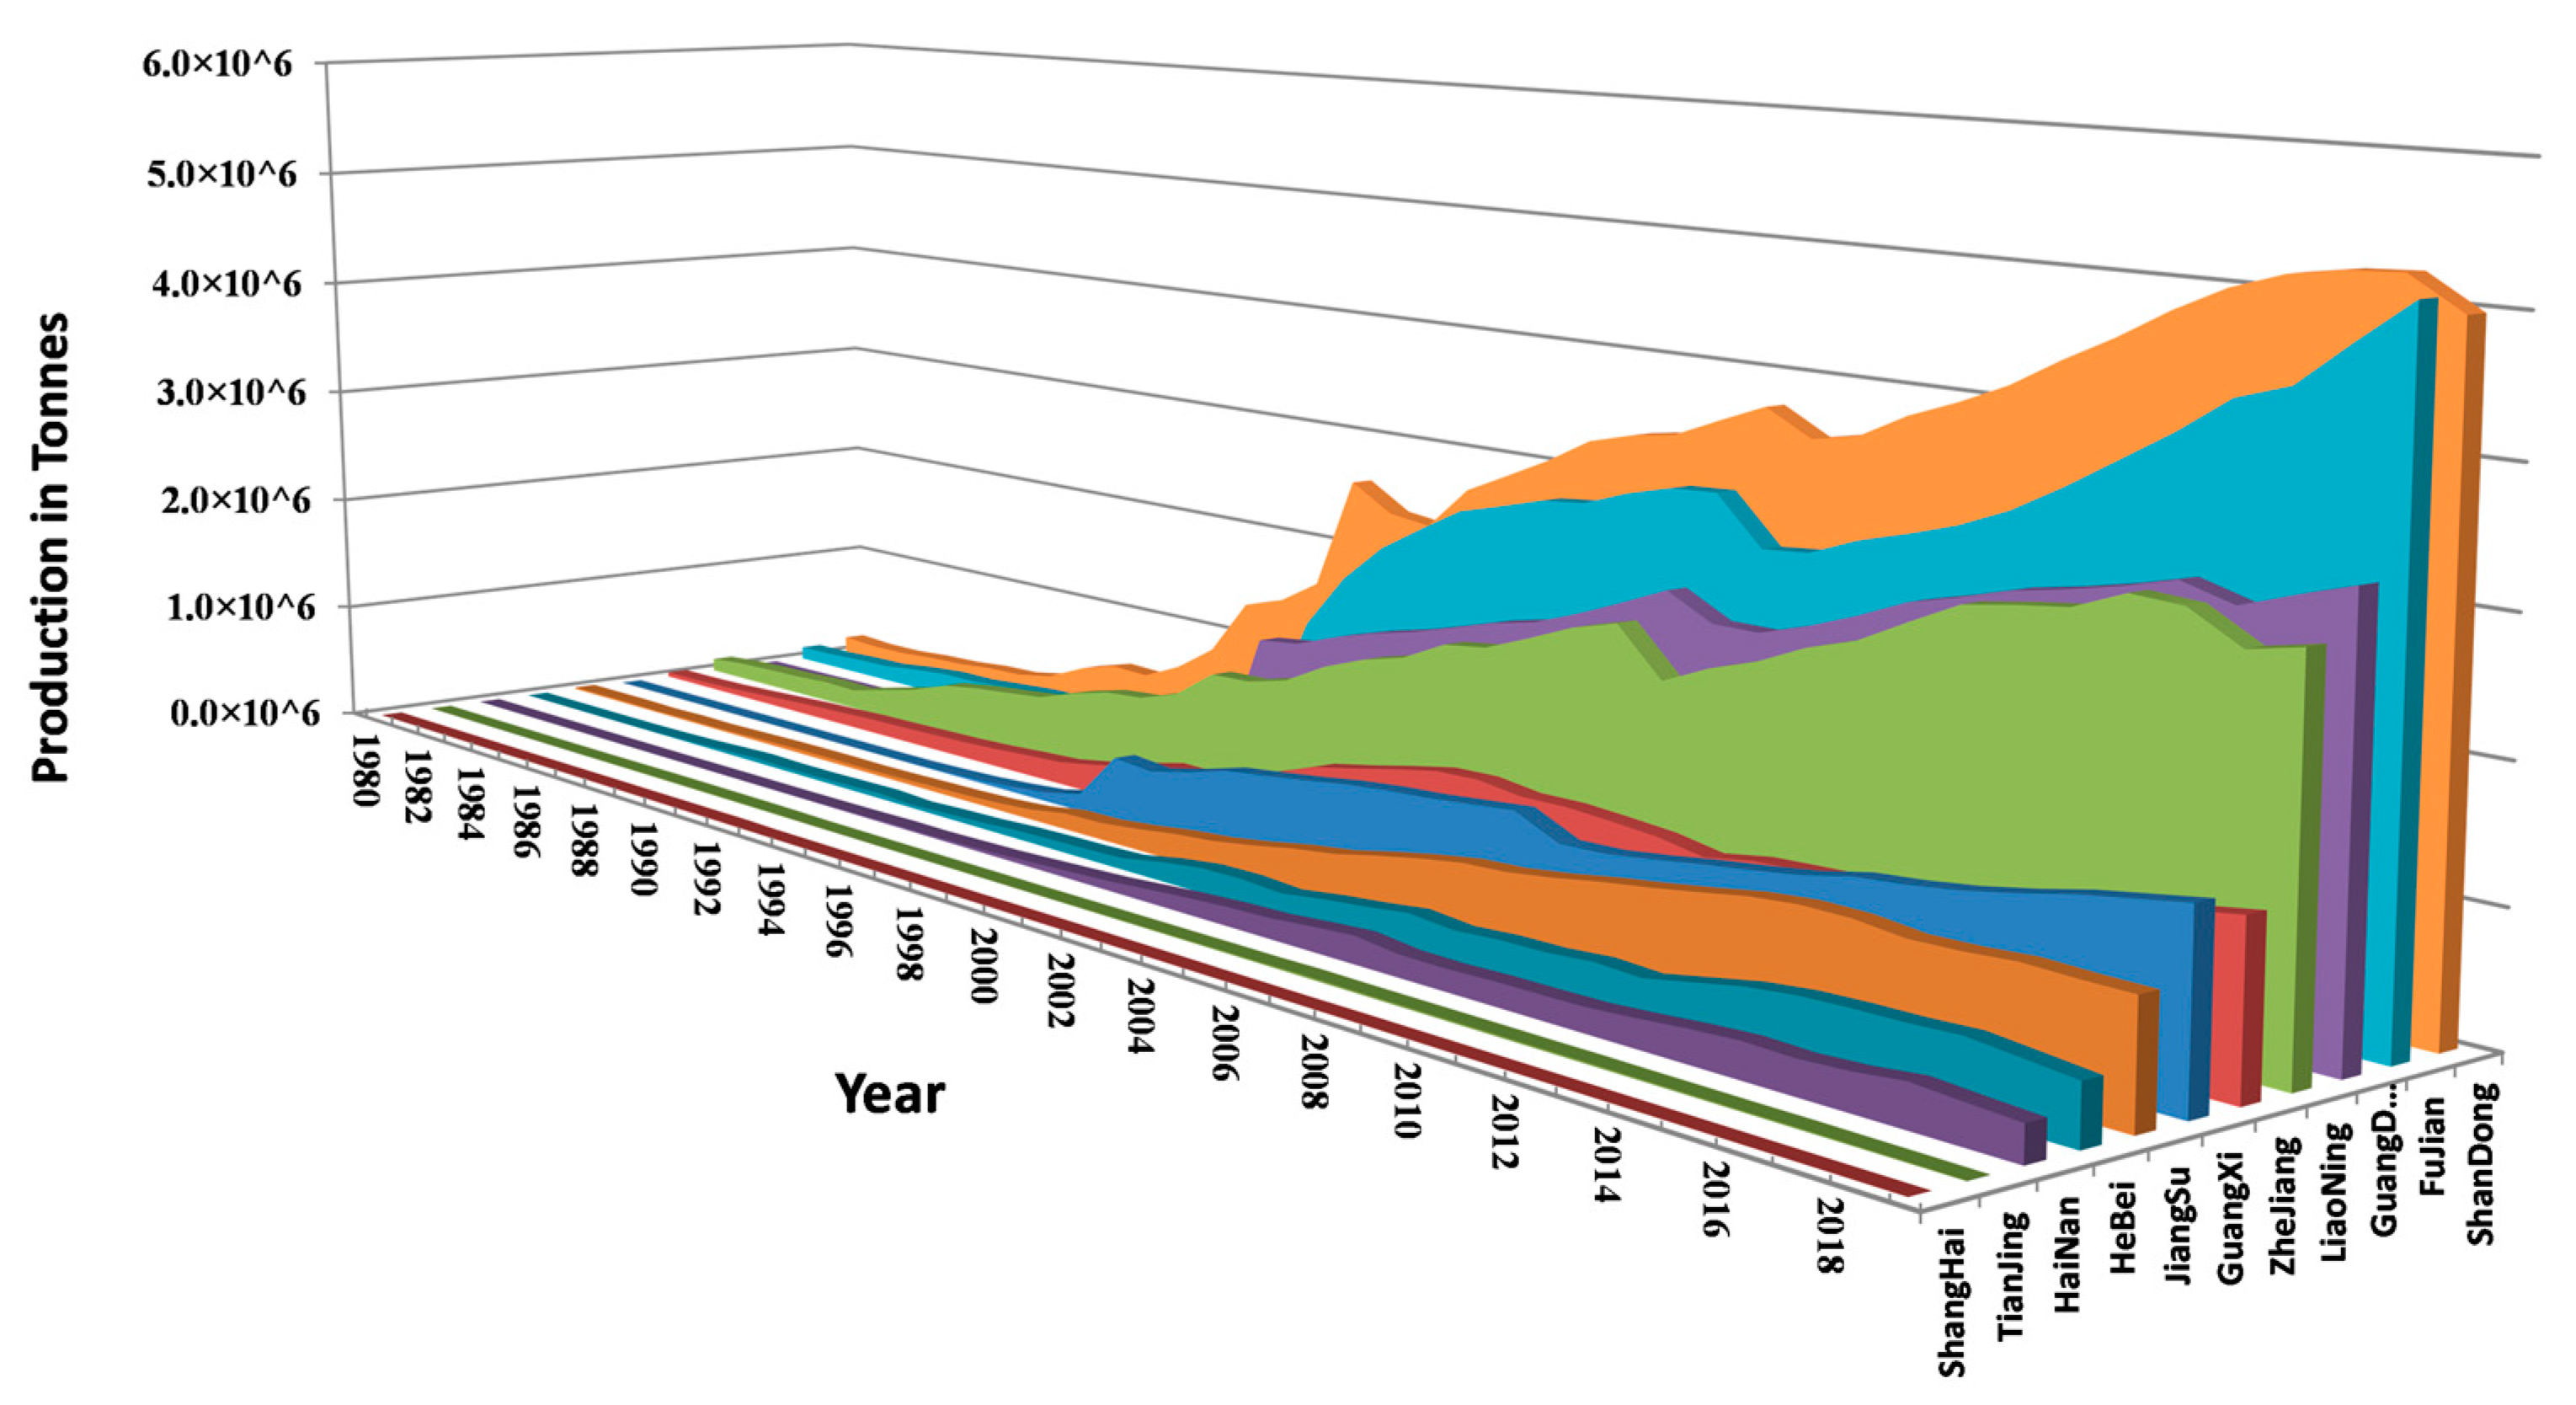
3.2.2. Regional Yields
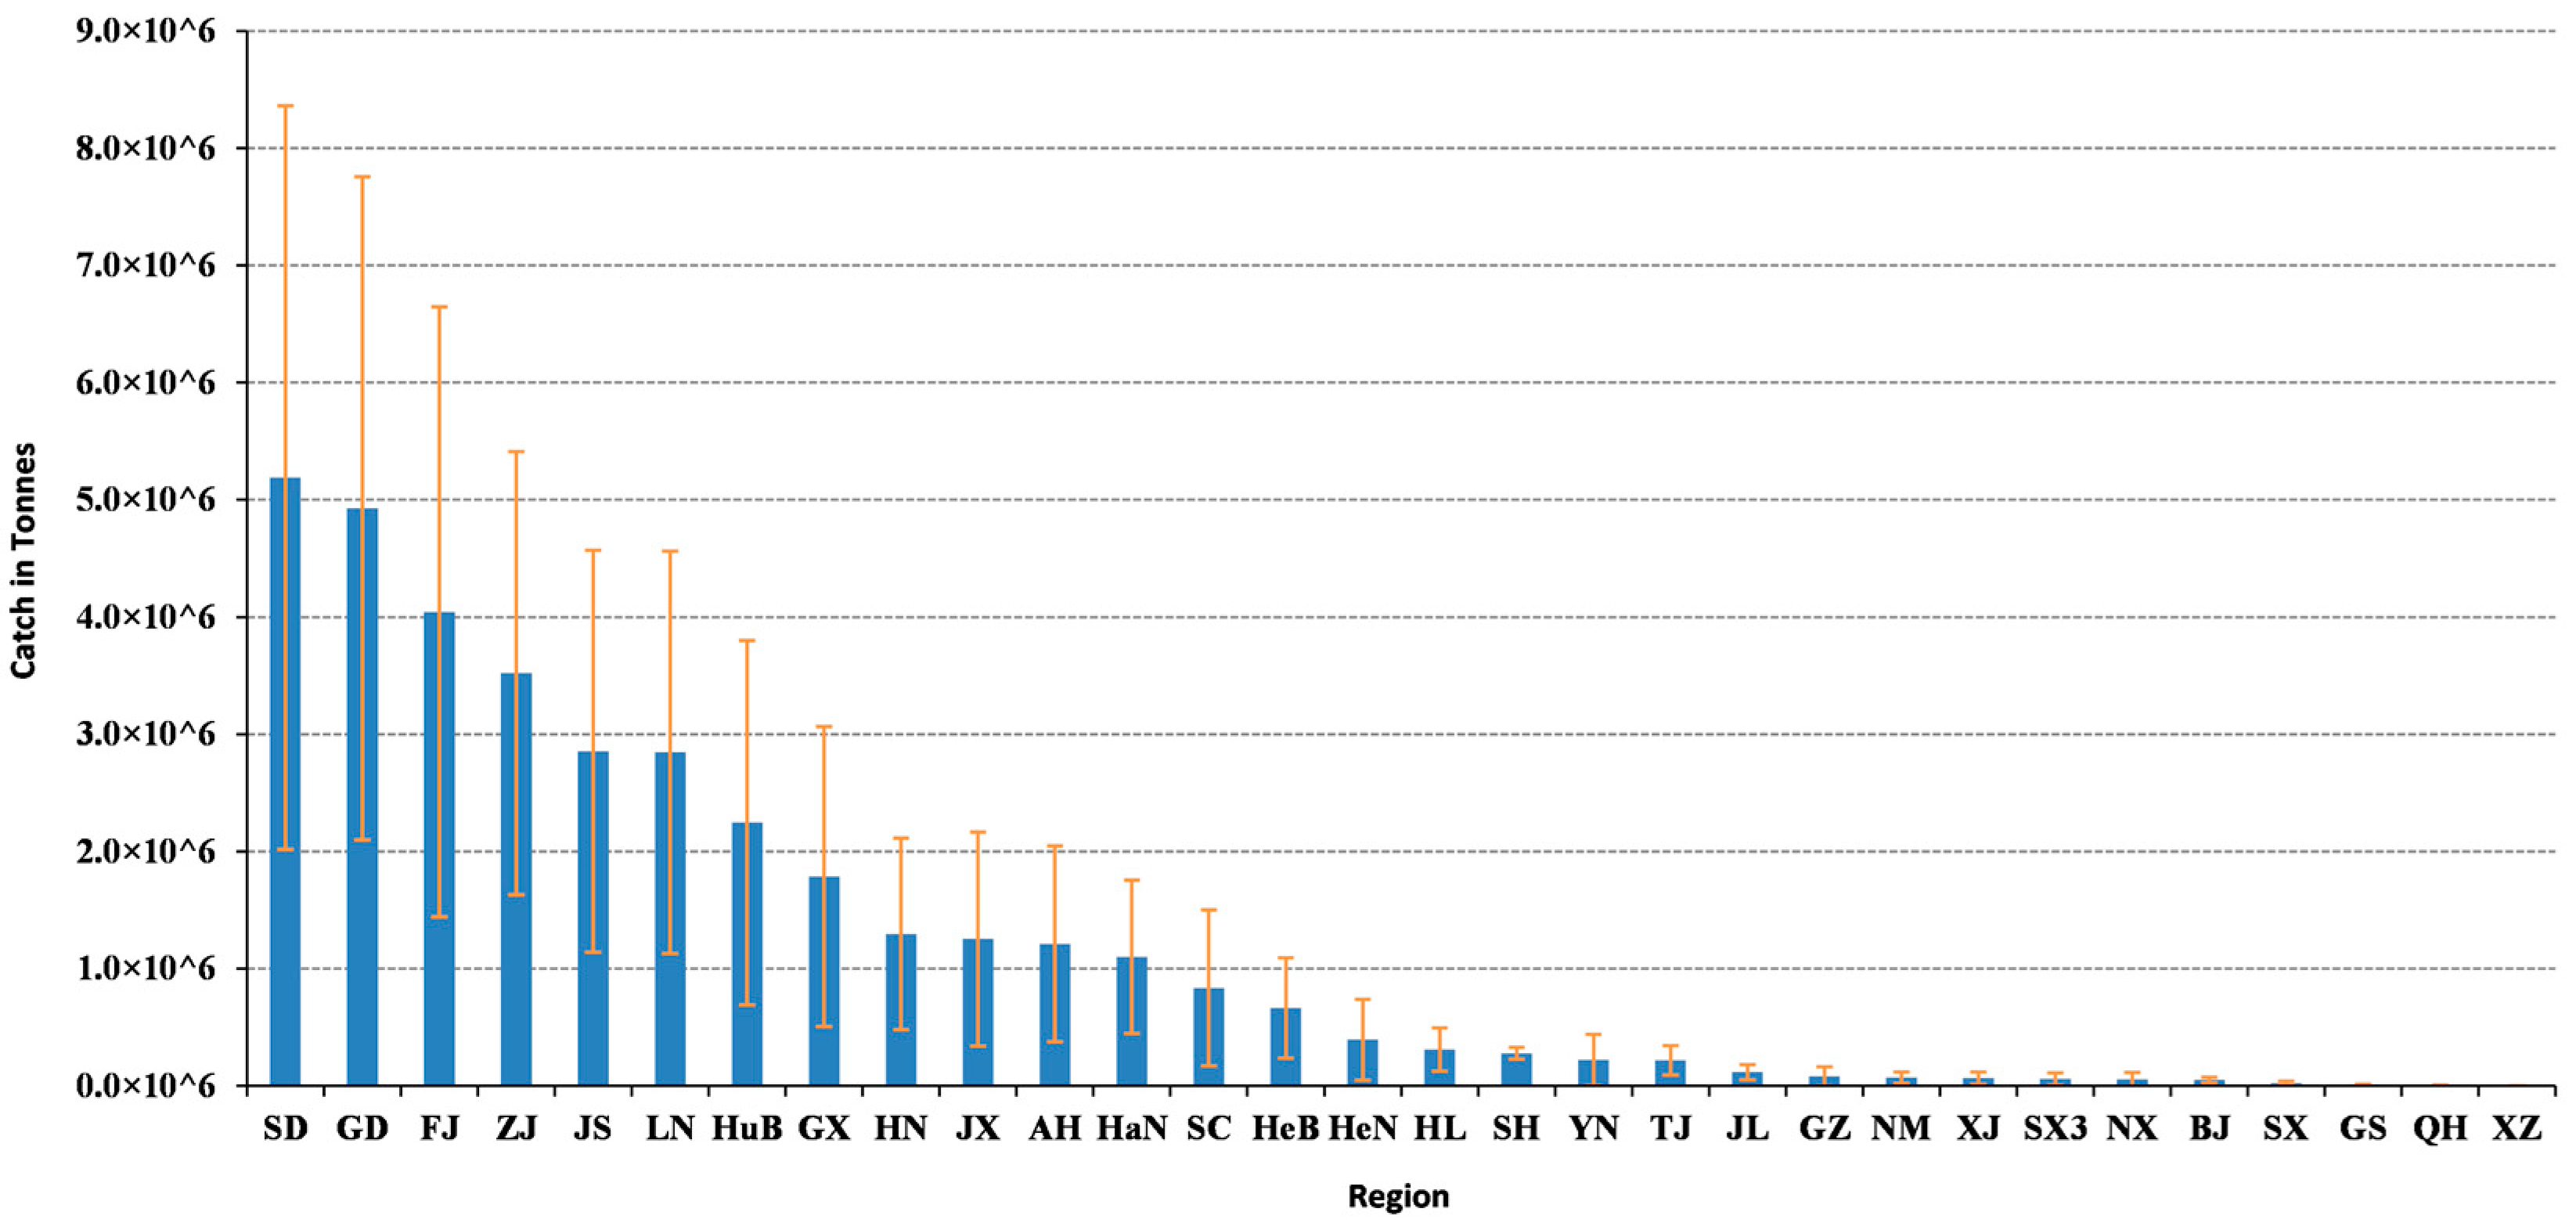
Regional analysis of China’s fisheries indicates that coastal provinces play an important role in providing fish-related products. At present, China has 11 coastal regions, including nine provinces and two municipalities. Over the 40-year period, the top six provinces—ShanDong, GuangDong, FuJian, ZheJiang, JiangSu, and LiaoNing—accounted for 65.8% of the total national fishery production by volume (
Figure A1).
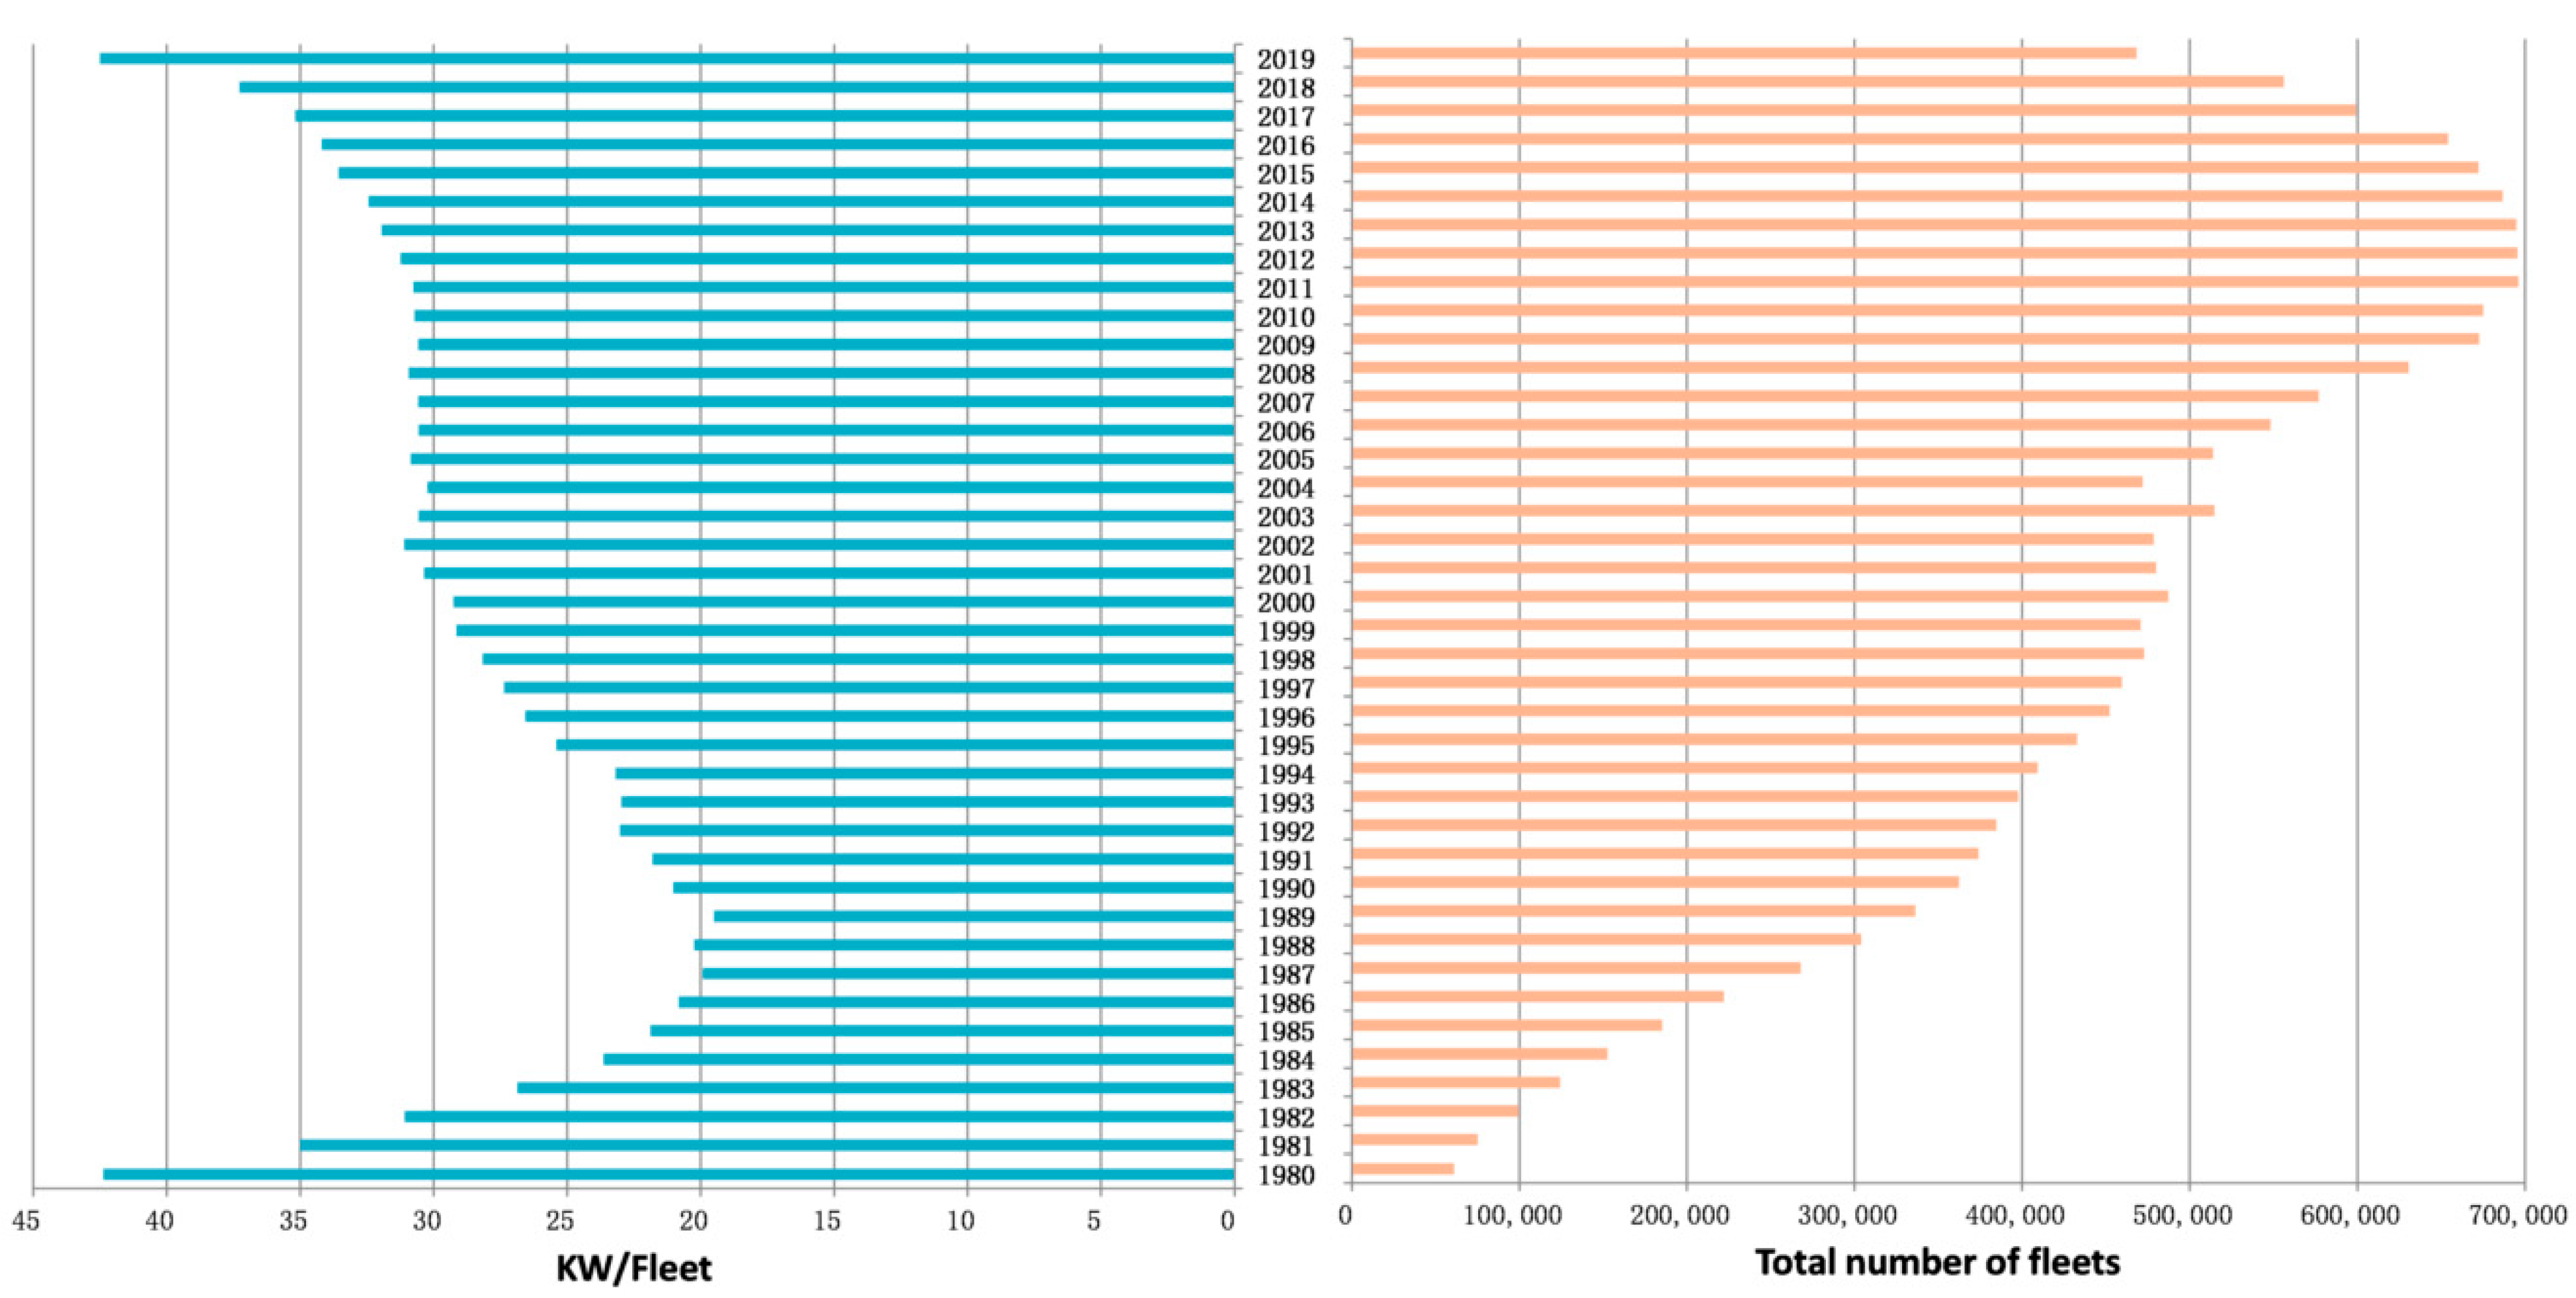
3.3. Fishery-Related Efforts: Fleets and Labors
3.3.1. Fleets in Use
Figure 3 shows the number of fishery fleets (marine and inland) from 1980 to 2019. The total fleet count peaked at 696,186 in 2011, then declined to 468,312 by 2019. Conversely, the average engine horsepower per vessel increased from 42.37 KW in 1980 to 42.50 KW in 2019, indicating a trend toward larger, more powerful fleets since the 1990s. Marine fishery fleets comprised up to 80% of the total in 1980, but this proportion gradually declined to 48% by 2019.
Two key regulations aimed at controlling the fleet size were “Dual Control” (1987) and “Fishermen Transfer and Fishing Fleet Scrapping” (2003). The 1987 policy had limited success, as there were 21,204 more marine fishery fleets newly built in 1988 than in 1987, while the 2003 program was more effective, reducing the total number of fleets by 42,865 between 2003 and 2004 and significantly decreasing the proportion of marine fishery fleets. The subsequent 2006 “Fuel Subsidy” temporarily increased the fleet numbers until adjustments in 2015 led to a subsequent decline.
3.3.2. Working Population and Earnings
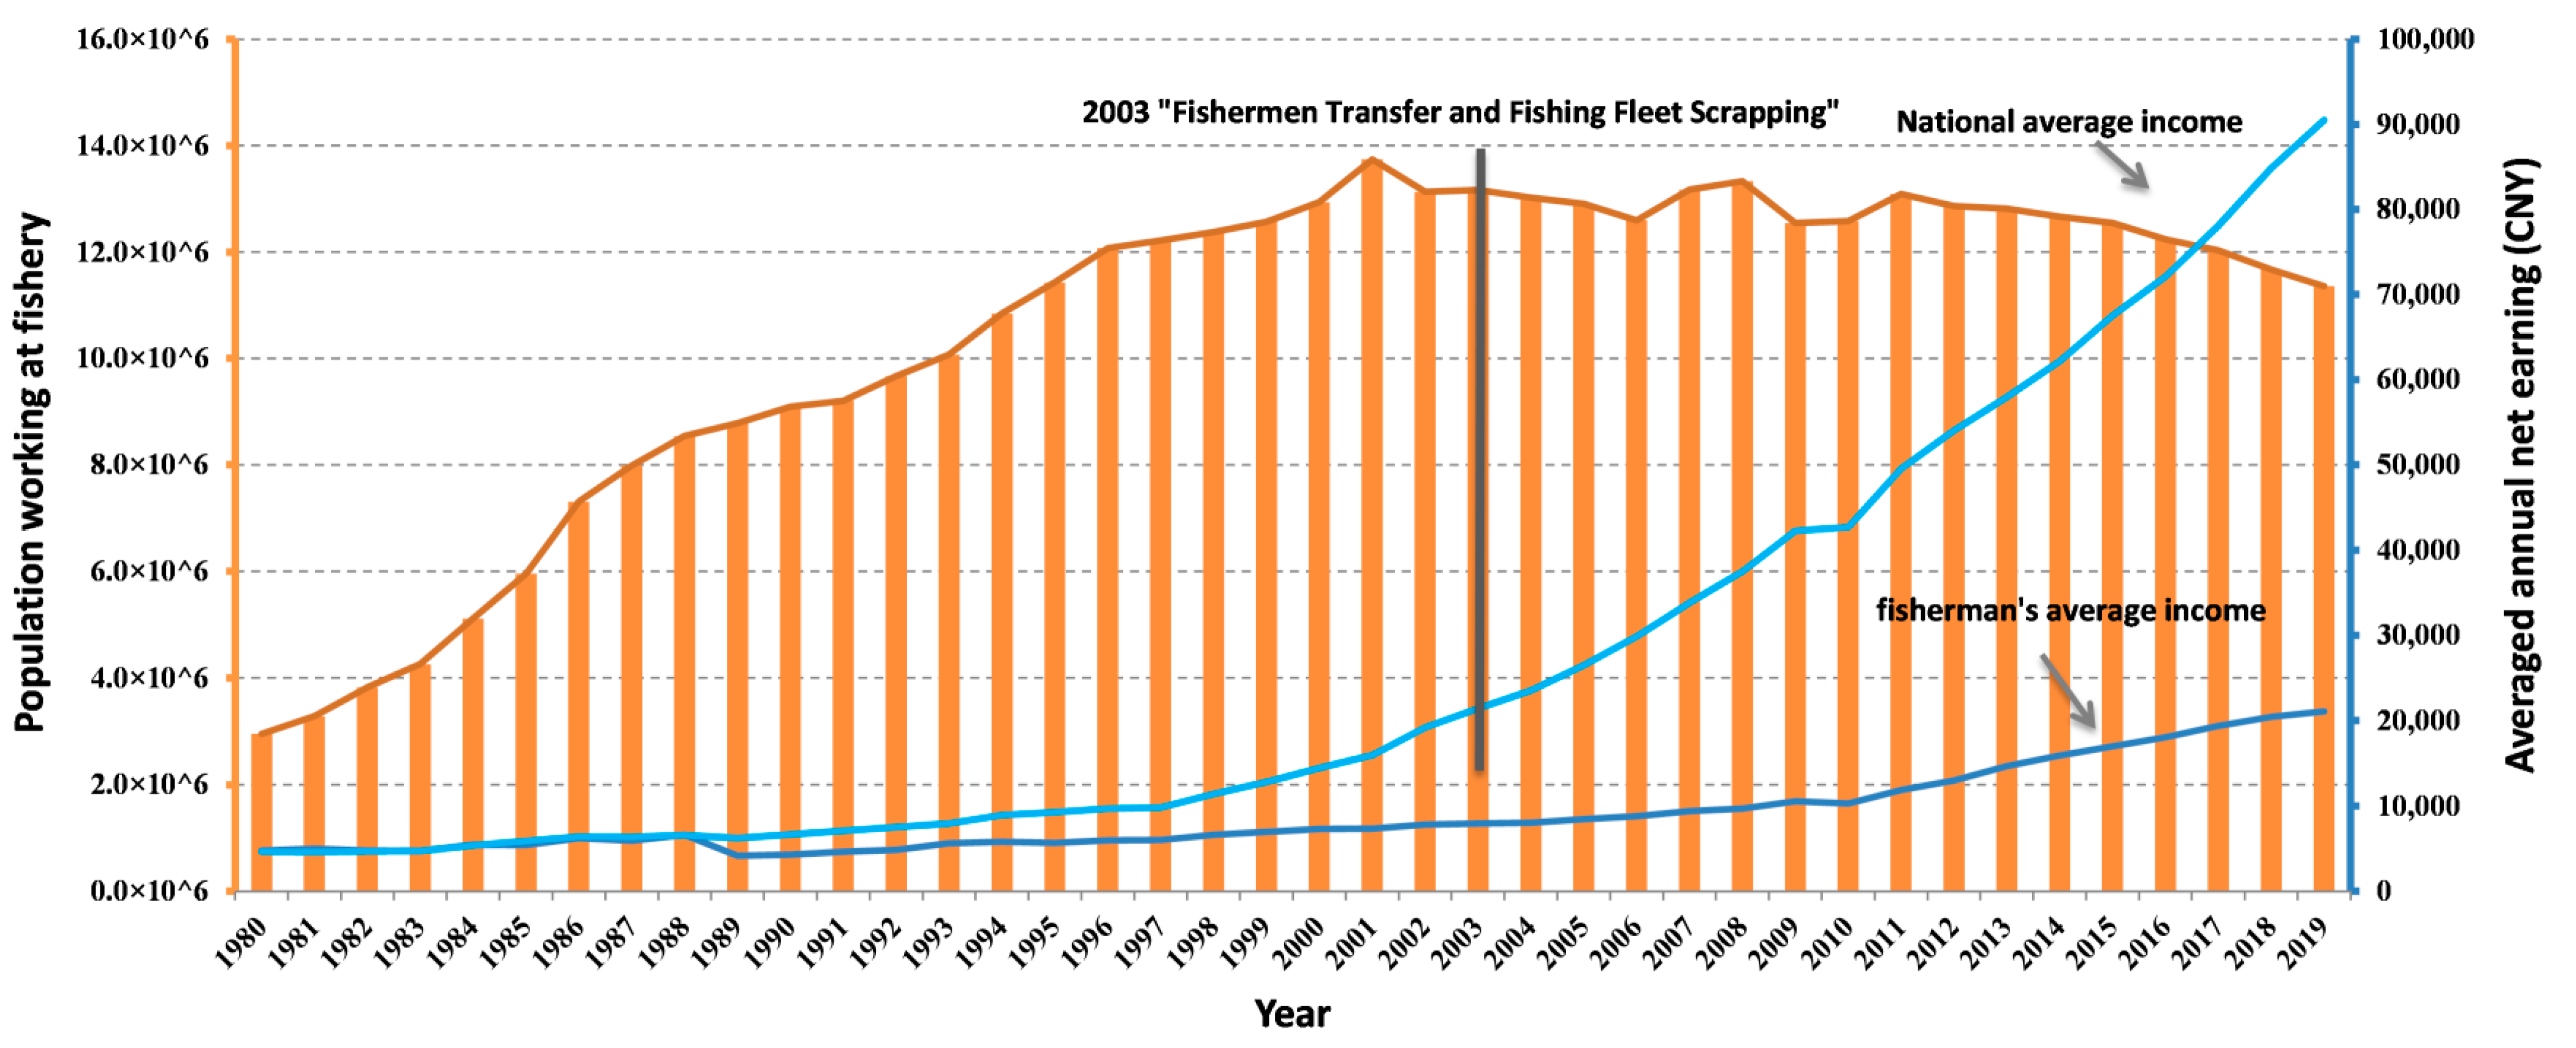
Figure 4 presents the total capture fishery workforce and average annual earnings per worker. The capture fishery workforce ranged from 2.9 million in 1980 to 13.7 million in 2001, averaging 10.5 million over 40 years. In 2019, 11.4 million people were employed in the capture fisheries, with just over 1.5 million full-time fishermen. The percentage of full-time fishermen decreased from over 30% in 1980 to about 14% in 1995, remaining constant between 13% and 15% through to 2019.
The “Fishermen Transfer and Fishing Fleet Scrapping” program (2003) effectively reduced the number of fishermen, with 144,480 workers transitioning to other jobs in 2004, including 45,778 full-time fishermen (
Figure A2). The economic income for fishery workers increased steadily over the past 40 years. Adjusted to 2019 CNY, the net earnings ranged from CNY 4167 in 1989 to CNY 21,108 in 2019. However, fishermen’s earnings fell behind the national average after 1988, making the profession less attractive.
3.4. Capture Fishery
3.4.1. Marine Capture
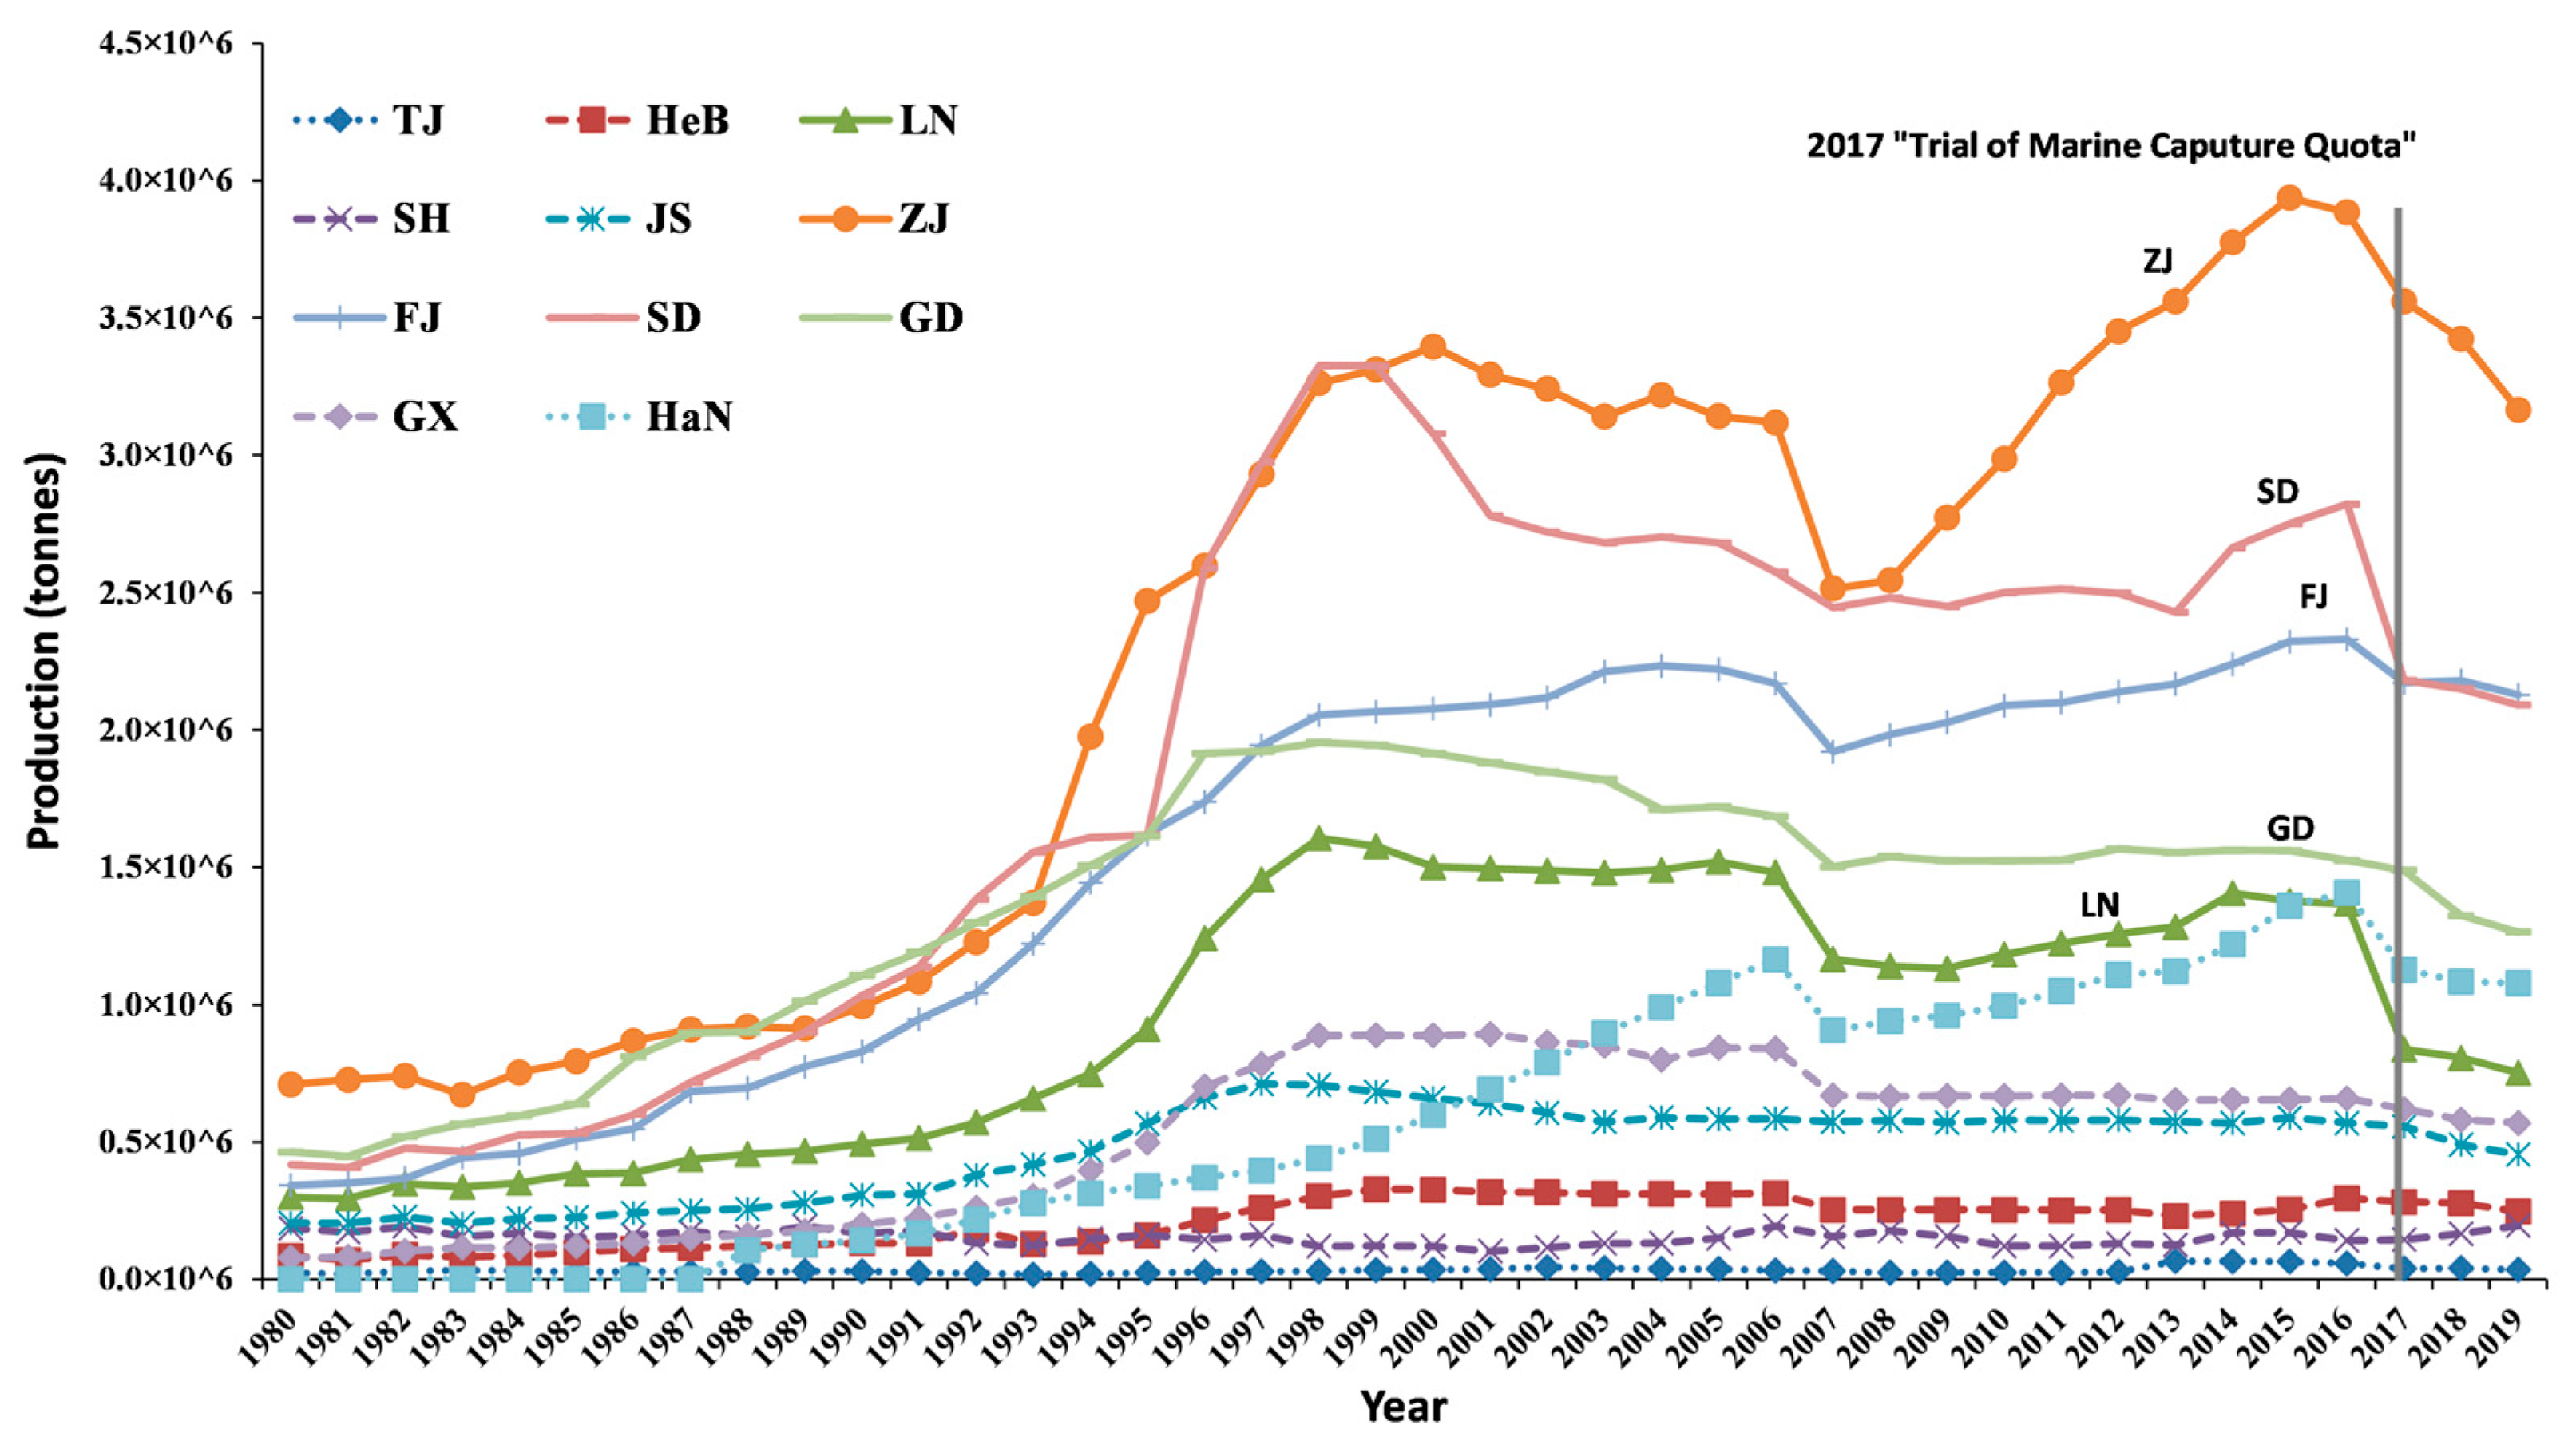
Marine capture production, including distant-water fishery, increased 4.3 times from 1980 to 2019, reaching 12.1 million tons. China’s marine capture fully relied on 11 coastal regions, among which the aggregation of five provinces, including ZheJiang, ShanDong, FuJian, GuangDong, and LiaoNing, contributed 79% of the national marine capture over 40 years (
Figure 5). Consequently, the “Marine Capture Quota” system, piloted in these provinces in 2017 to control the overfishing issue, significantly reduced production. For example, these provinces produced 11.9 million tons in 2016, dropping to 10.2 million tons in 2017. The number of coastal provinces implementing the “Marine Capture Quota” system expanded to nine in 2019.
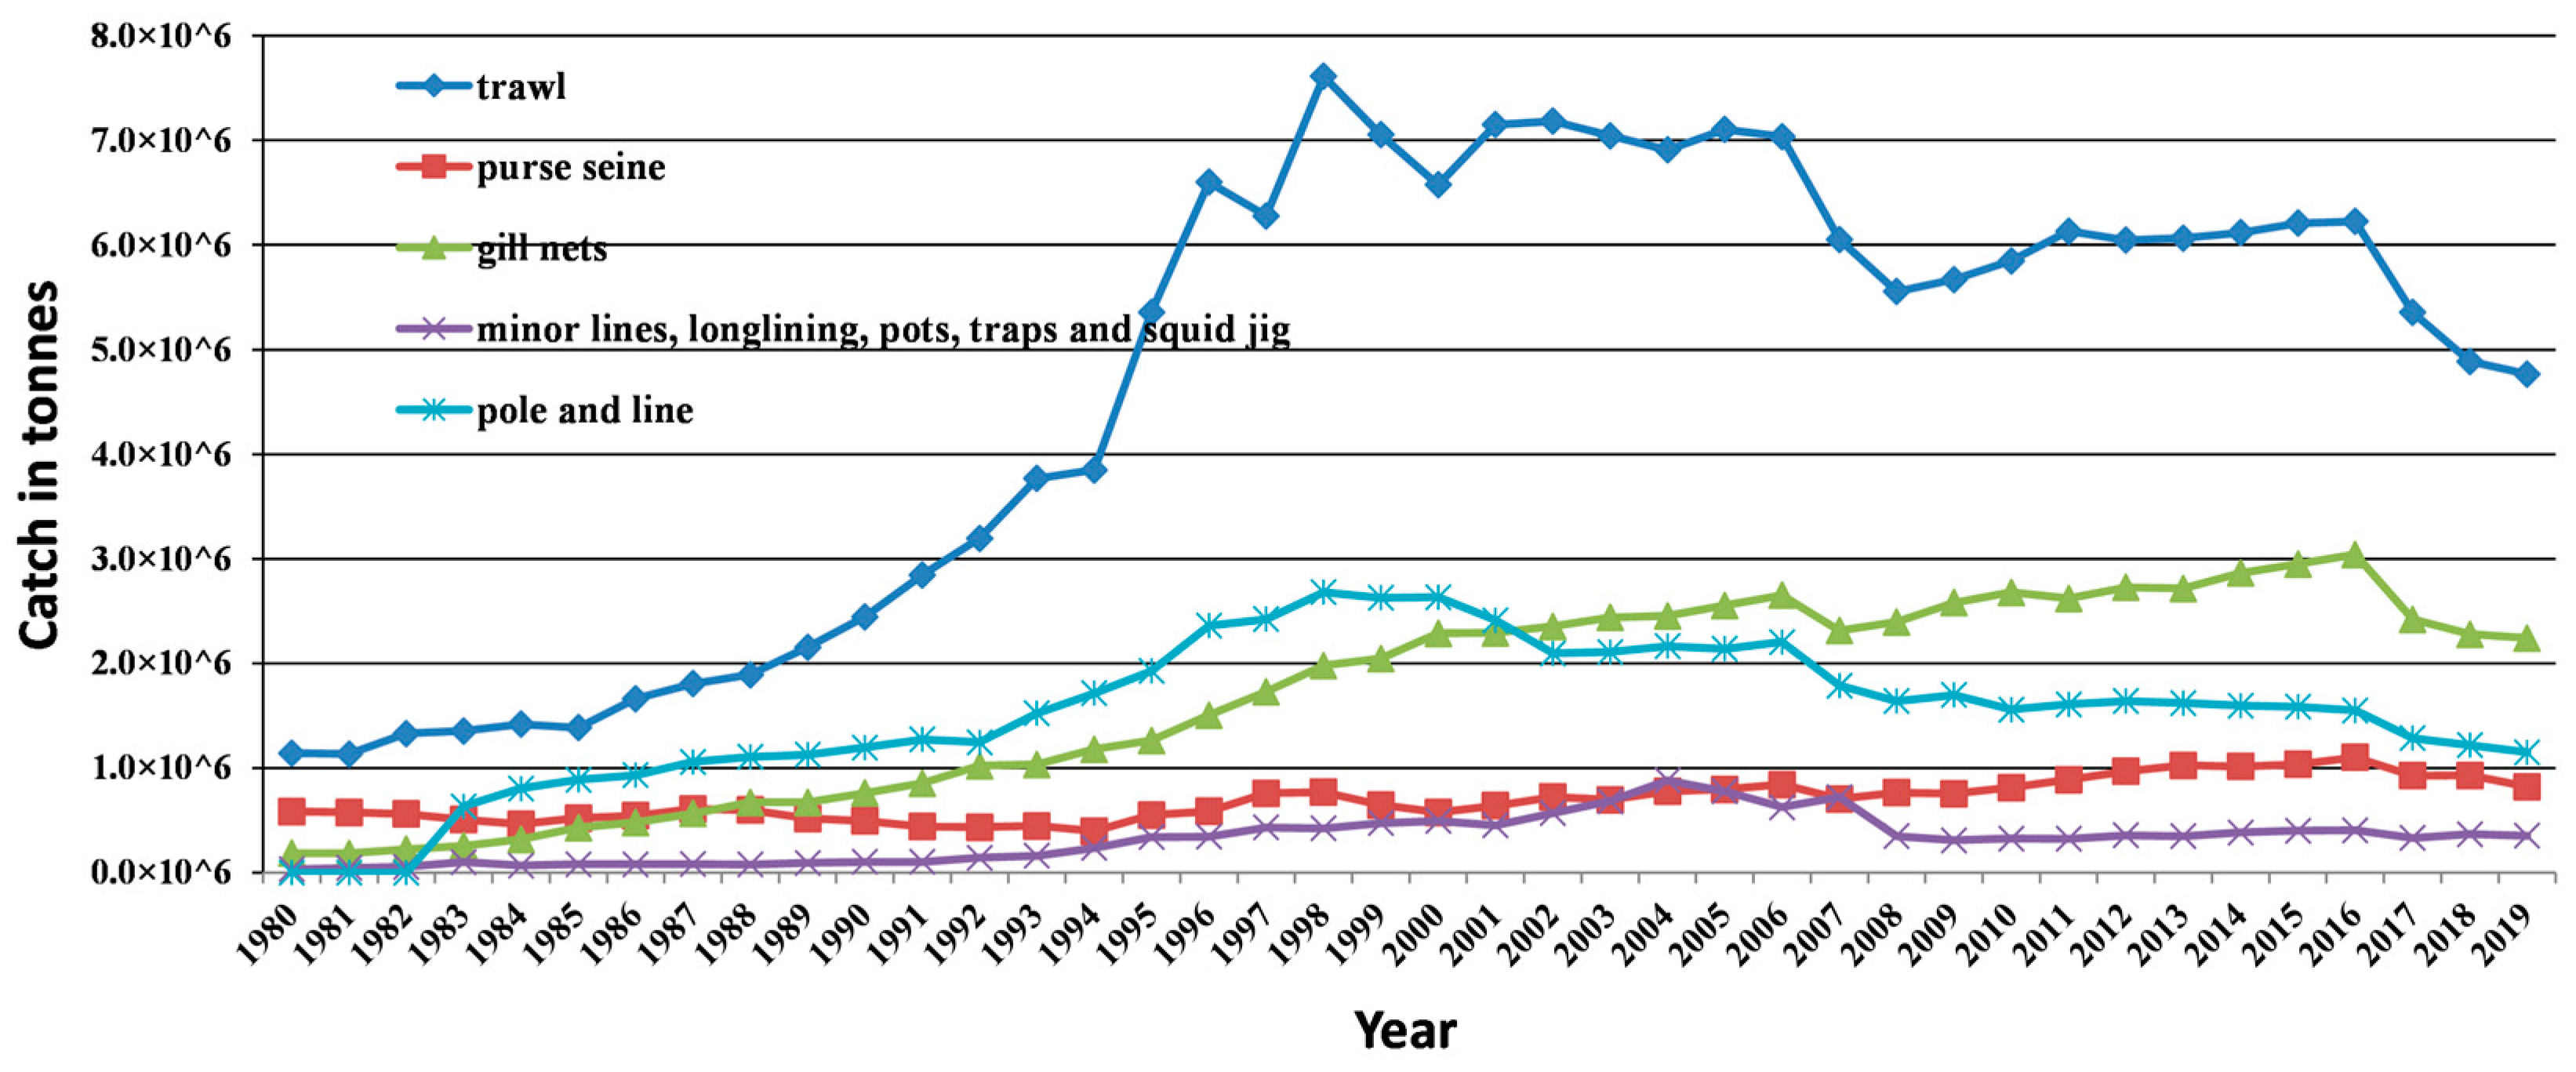
The primary fishing methods included trawl, purse seine, gillnets, minor lines, longlining, pots, traps, squid jigging, and pole and line [
10]. Among these fishing methods (
Figure A3), trawl (45%) contributed to the highest level of production for China’s marine fishing, followed by gillnets (16%) and pole and line (15%).
3.4.2. Inland Capture
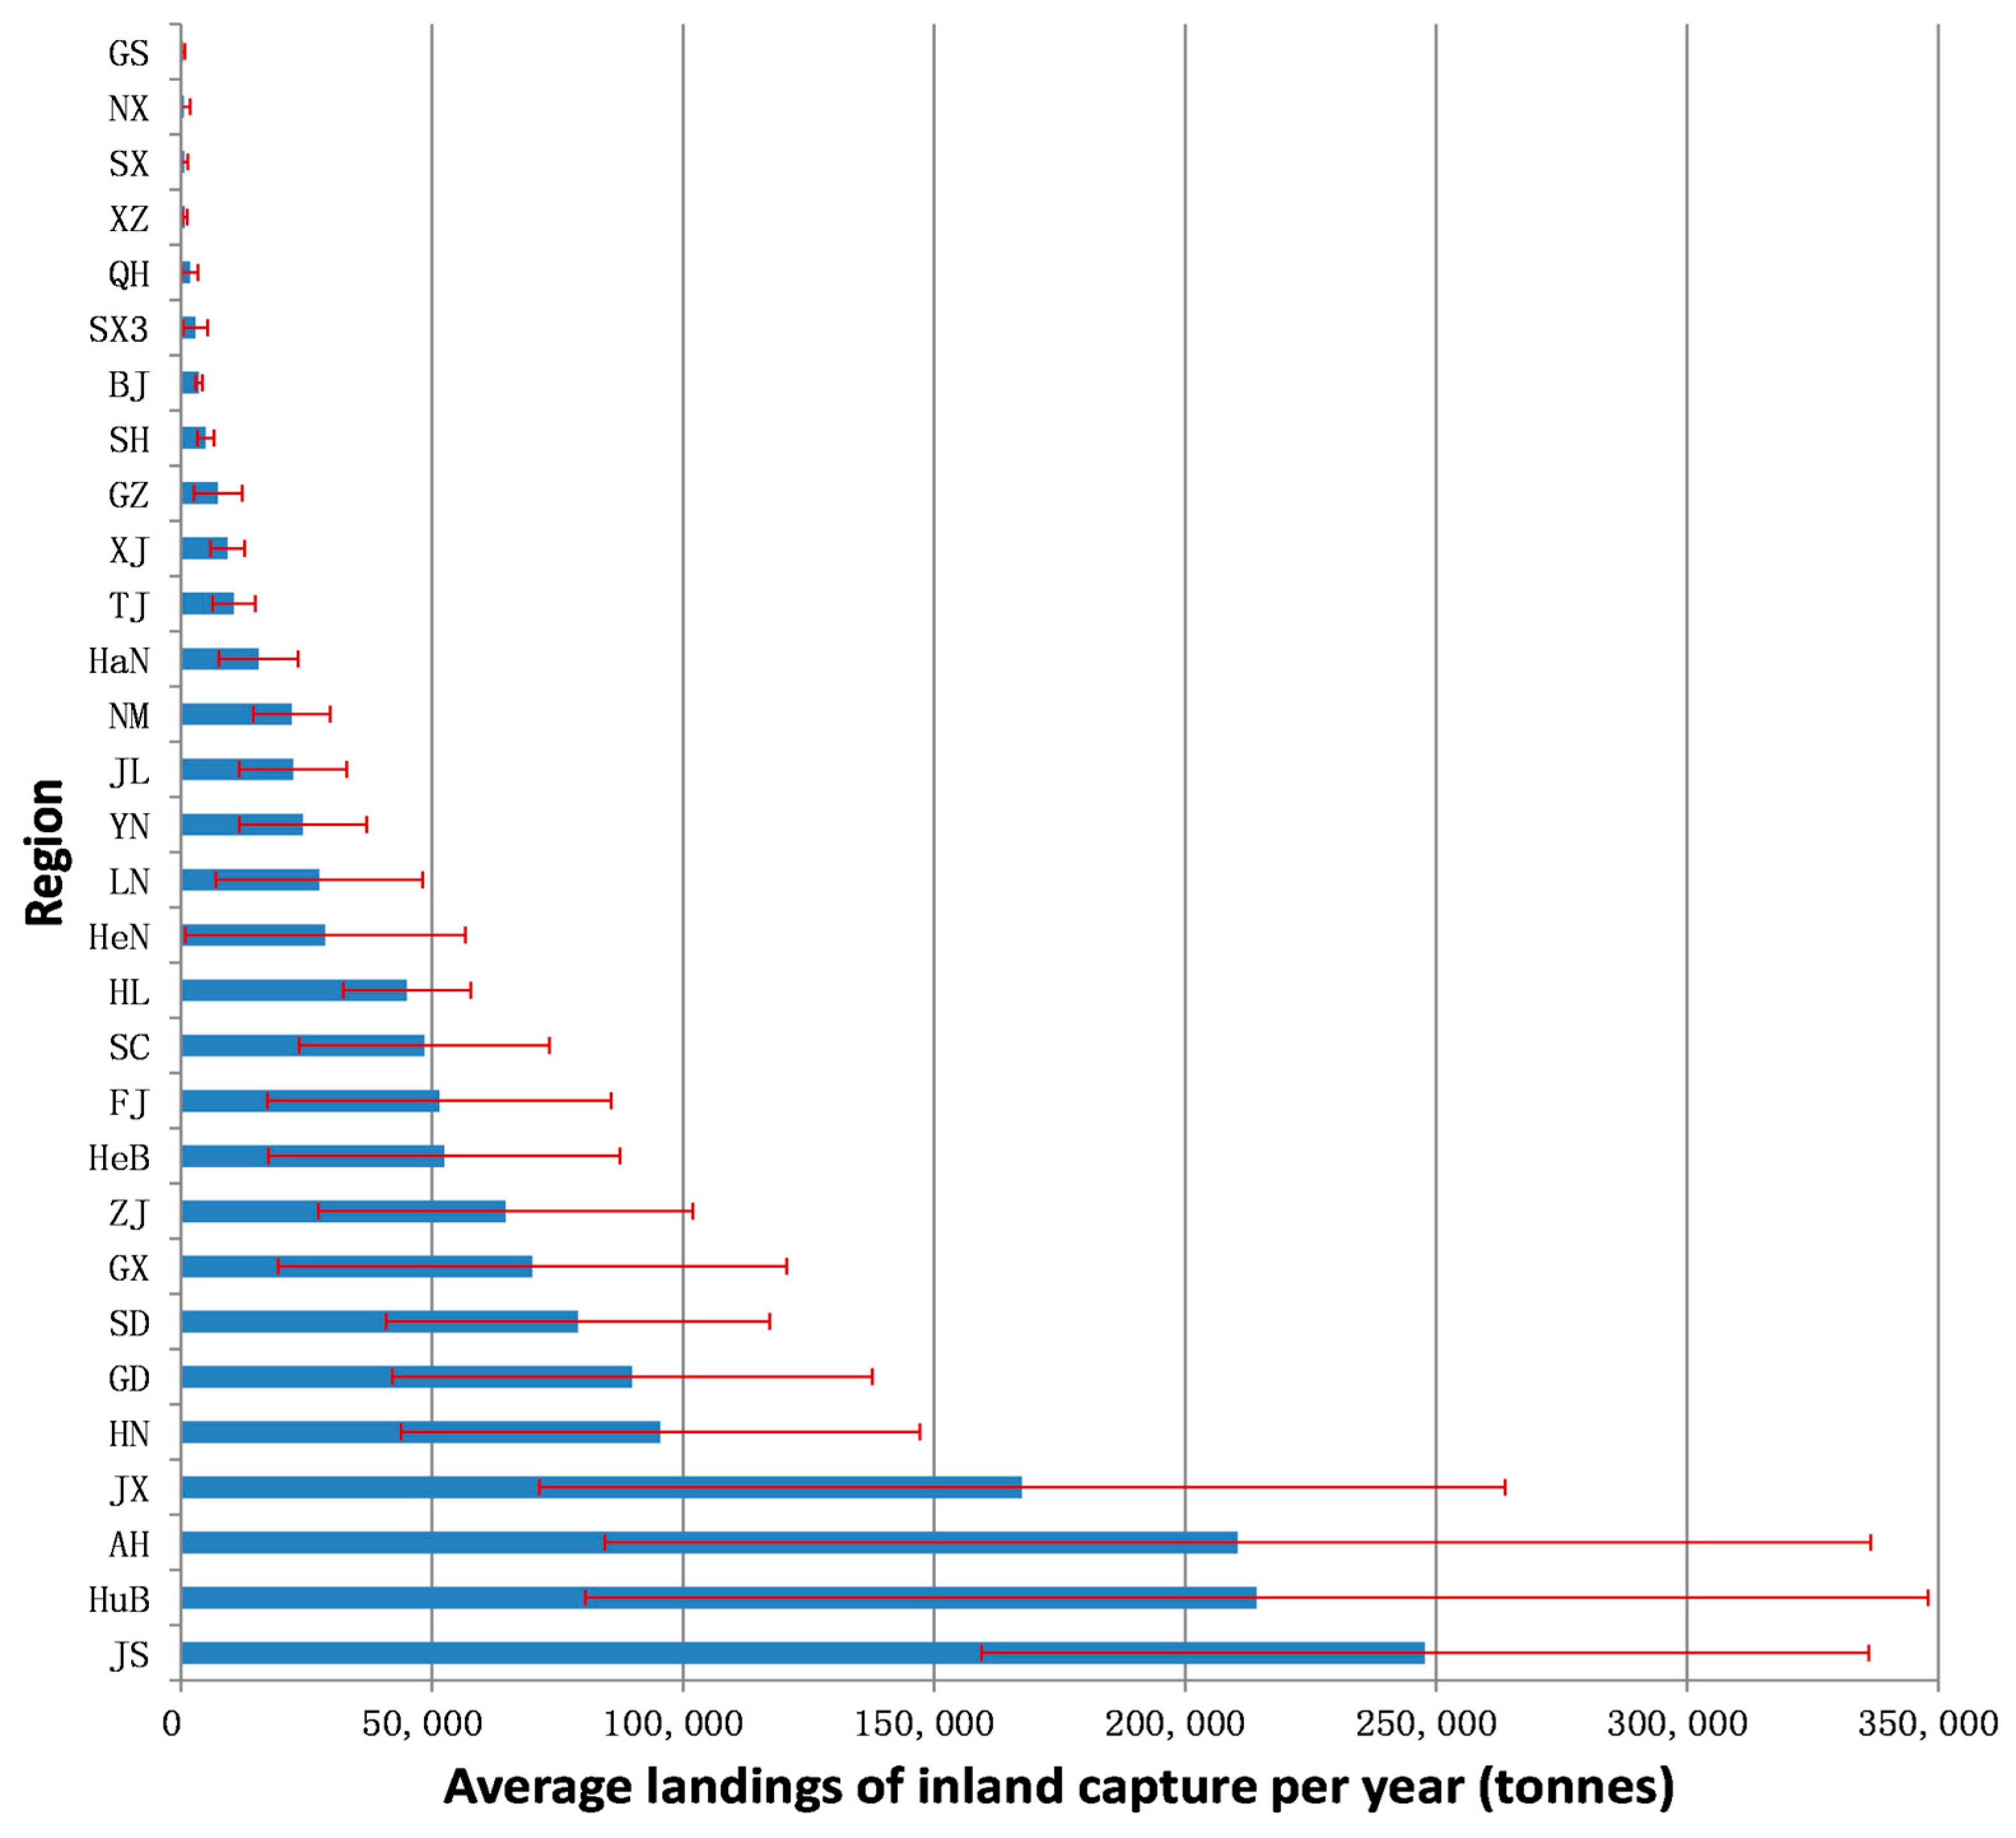
Inland fishing is the least productive sector, averaging 4.5% of national landings over 40 years. In 2019, the inland capture production amounted to 1,841,221 tons, 5.4 times higher than in 1980.
Figure 6 shows an overview of the landings for inland capture fisheries by 30 regions (Chongqing municipality was included in the SiChuan province). The top five productive provinces—JiangSu, HuBei, AnHui, JiangXi, and HuNan—contributed 57% of the national inland capture. In particular, all of the top five except HuNan province produced an average of over 150,000 tons per year for the four decades, with the most productive provinces located along the ChangJiang (Yangtze) River.
3.4.3. Distant-Water Fishing
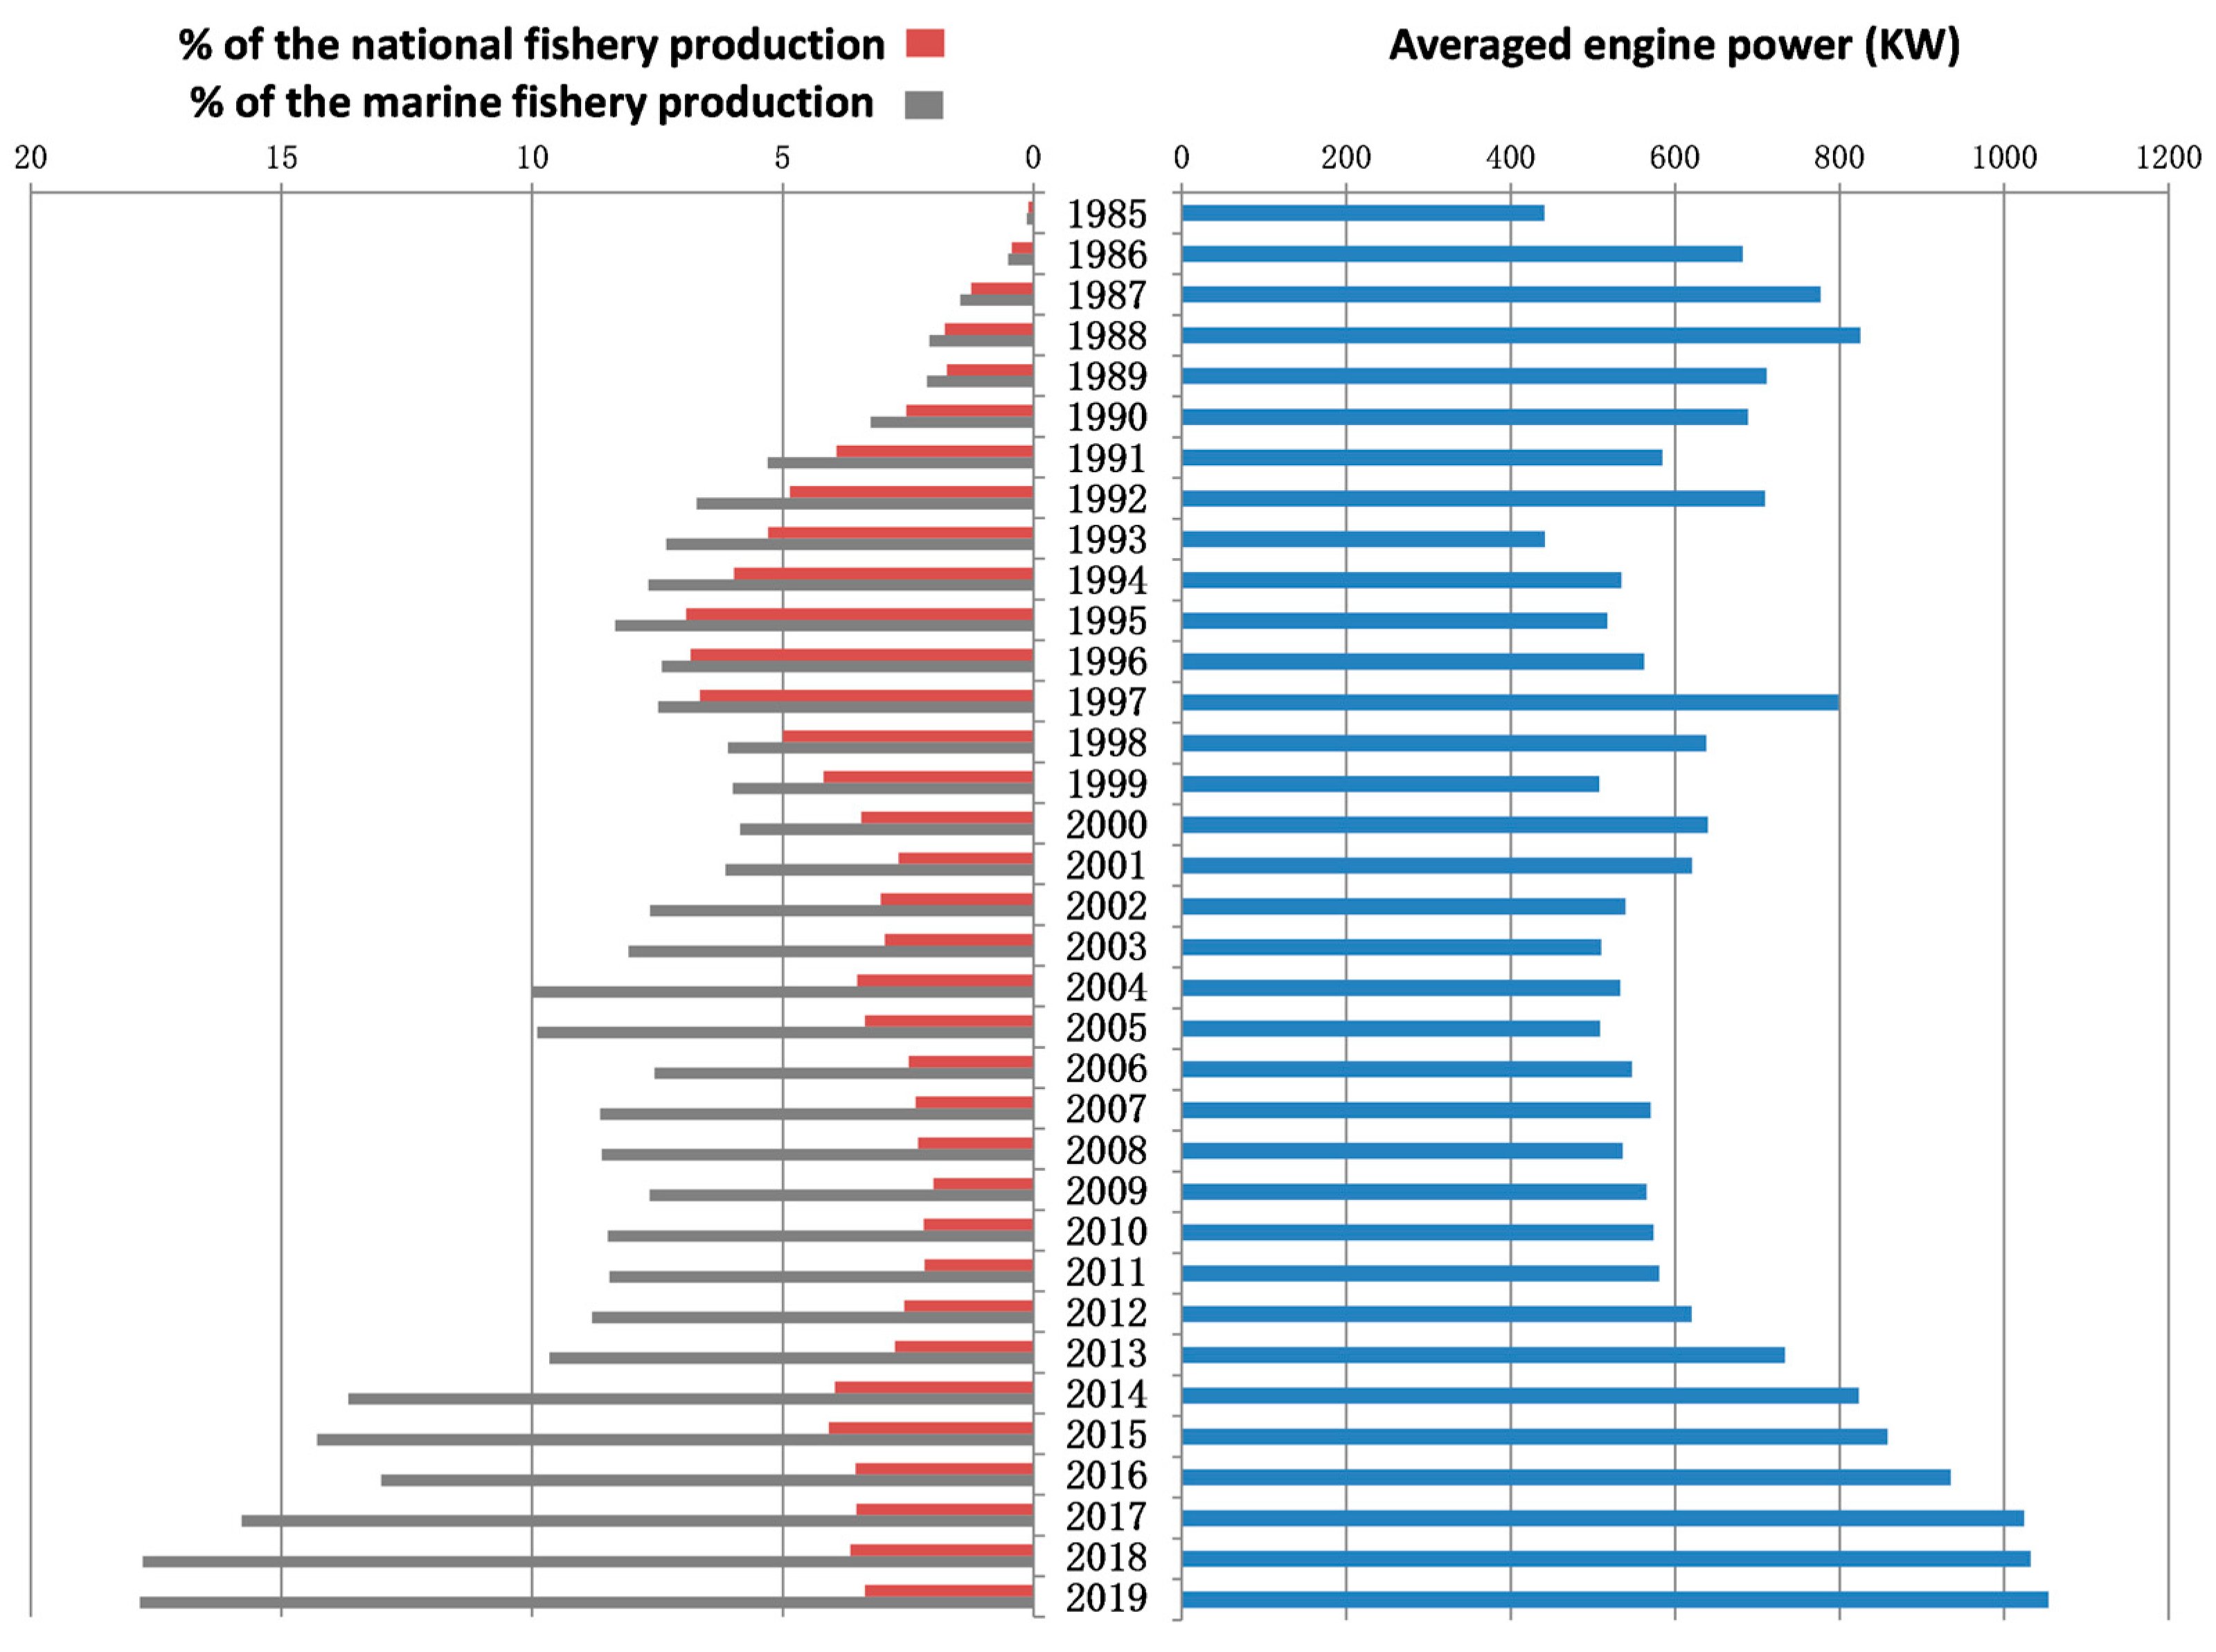
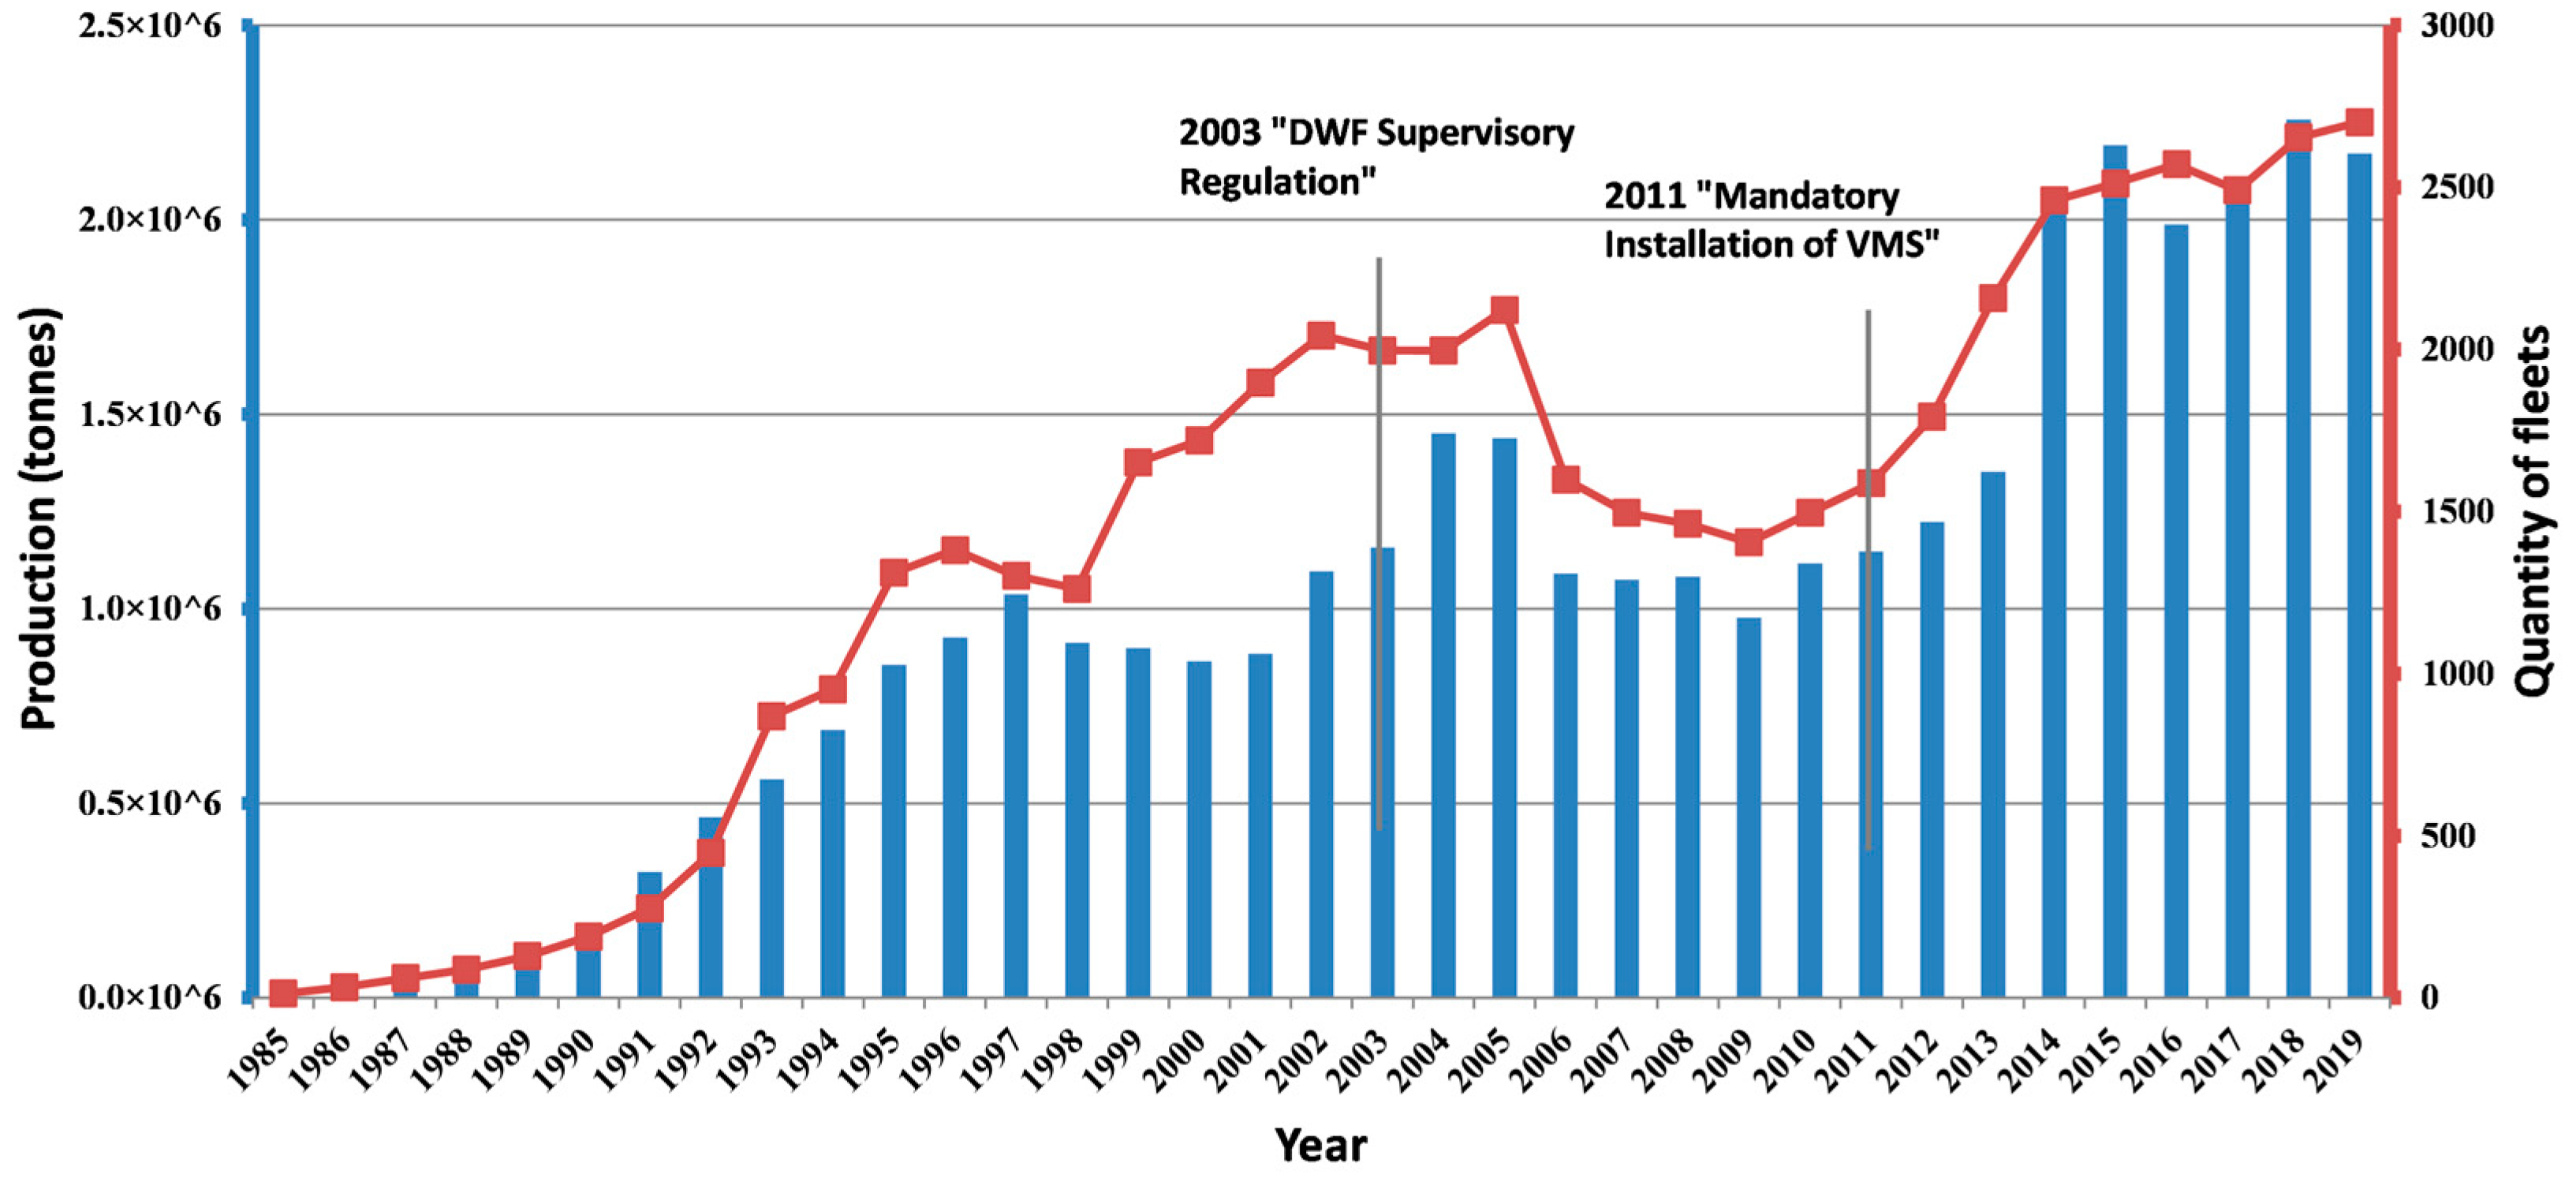
China’s distant-water fishing fleet expanded from 13 vessels with an average engine power of 441.3 KW in 1985 to 2701 vessels with an average engine power of 1054 KW in 2019 (
Figure A4). Production increased from 4680 tons to 2.17 million tons, making distant-water fishing a significant sector of marine capture (
Figure A5). The number of distant-water fishery vessels counted in this study only includes vessels flagged to China. Policies such as the 2003 “Distant-Water Fishery Supervisory Regulation” and 2011 “Mandatory Installation of Vessel Monitoring Systems” improved both transparency and sustainability.
According to the “Development of China’s Distant-Water Fisheries” issued by the Ministry of Agriculture and Rural Affairs, by the end of 2019, China had 178 approved distant-water fishing enterprises and 2701 distant-water fishing vessels (including 1589 fishing vessels) operating in the high seas of the Pacific, Indian, and Atlantic Oceans, and in the seas around Antarctica, as well as in the waters under the jurisdiction of cooperating countries. China is now a member of the International Commission for the Conservation of Atlantic Tunas (ICCAT), the Indian Ocean Tuna Commission (IOTC), the Western and Western Pacific Fisheries Commission (WCPFC), the Inter-American Tropical Tuna Commission (IATTC), the North Pacific Fisheries Commission (NPFC), the South Pacific Regional Fisheries Management Organization (SPRFMO), the Southern India Ocean Fisheries Agreement (SIOFA), the Commission for the Conservation of Antarctic Marine Living Resources (CCAMLR), and other regional fishery management organizations (RFMOs). In addition, China attaches great importance to honoring the international DWF agreements, actively fulfilling the obligations of member states under multilateral fisheries treaties and RFMOs, and carrying out the due diligence obligations of flag states for high seas fisheries that are not yet managed by RFMOs.
3.5. Aquaculture
3.5.1. Marine Aquaculture
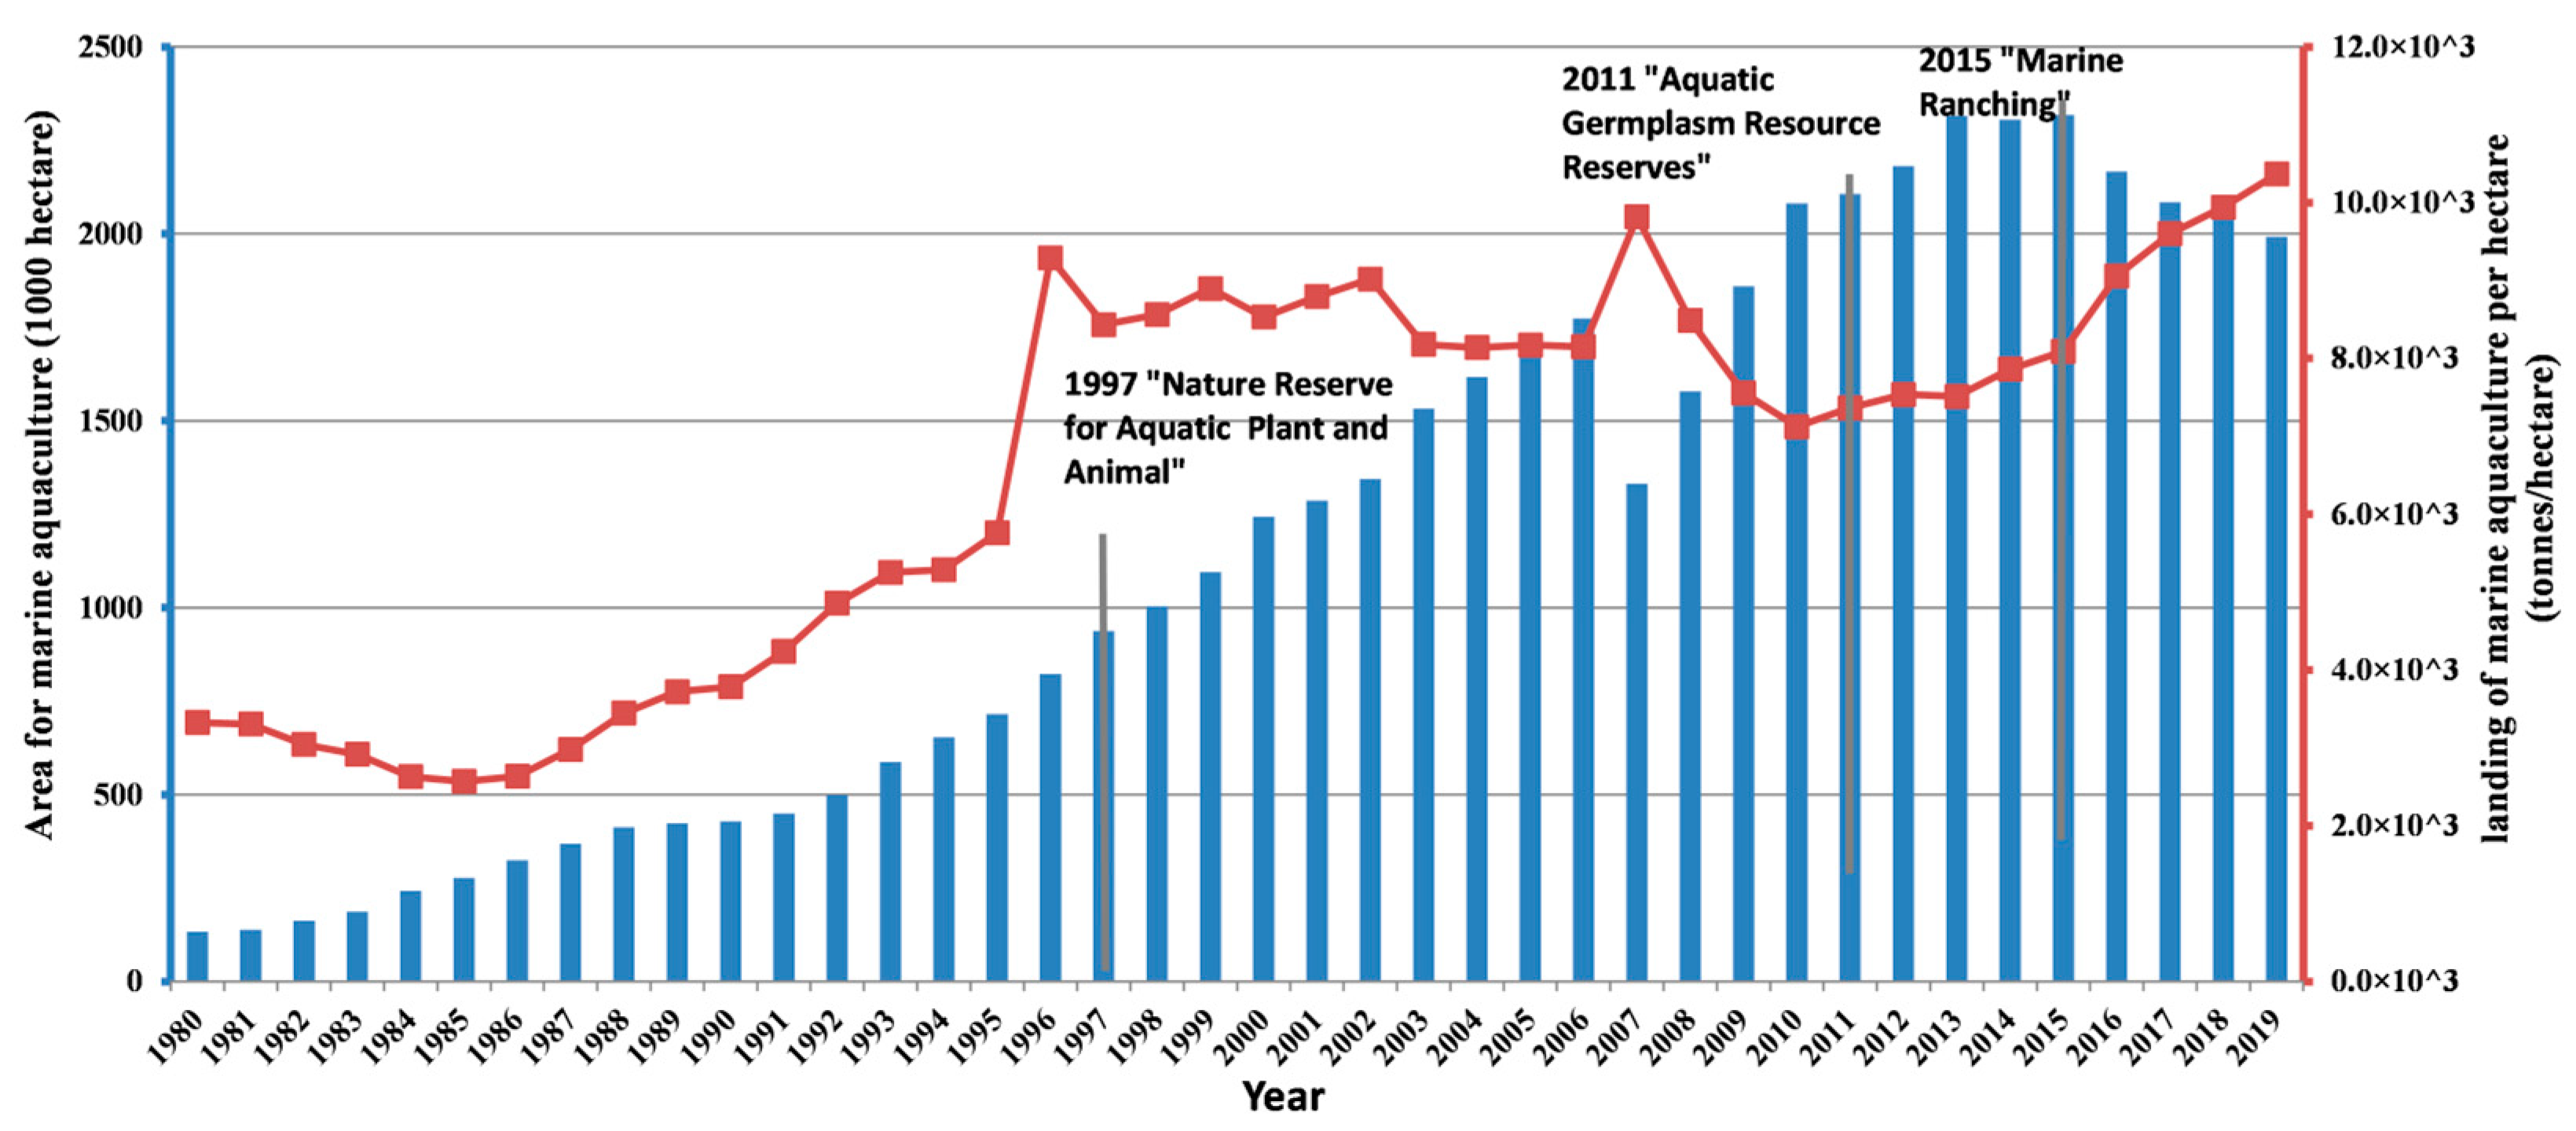
Marine aquaculture production in 2019 was nearly 46.5 times higher than in 1980, driven by the expansion of aquaculture areas and increased unit yields (
Figure 7). The aquaculture area expanded to 1,992,177 hectares by 2019, 14.9 times larger than in 1980, while the landings per hectare increased to 10,367 tons, 3.1 times higher than in 1980. Measures such as the 1997 “Nature Reserve for Aquatic Plants and Animals” and 2011 “Aquatic Germplasm Resource Reserves” policies did not reverse the trend of expanding aquaculture areas, but the 2015 “Marine Ranching” initiative reduced the marine aquaculture areas, promoting sustainable production and mitigating pollution.
Figure A6 presents the marine aquaculture yield by region. Marine aquaculture production is dominated by four provinces—ShanDong, FuJian, GuangDong, and LiaoNing—accounting for 79% of the national total in 2019.
3.5.2. Inland Aquaculture
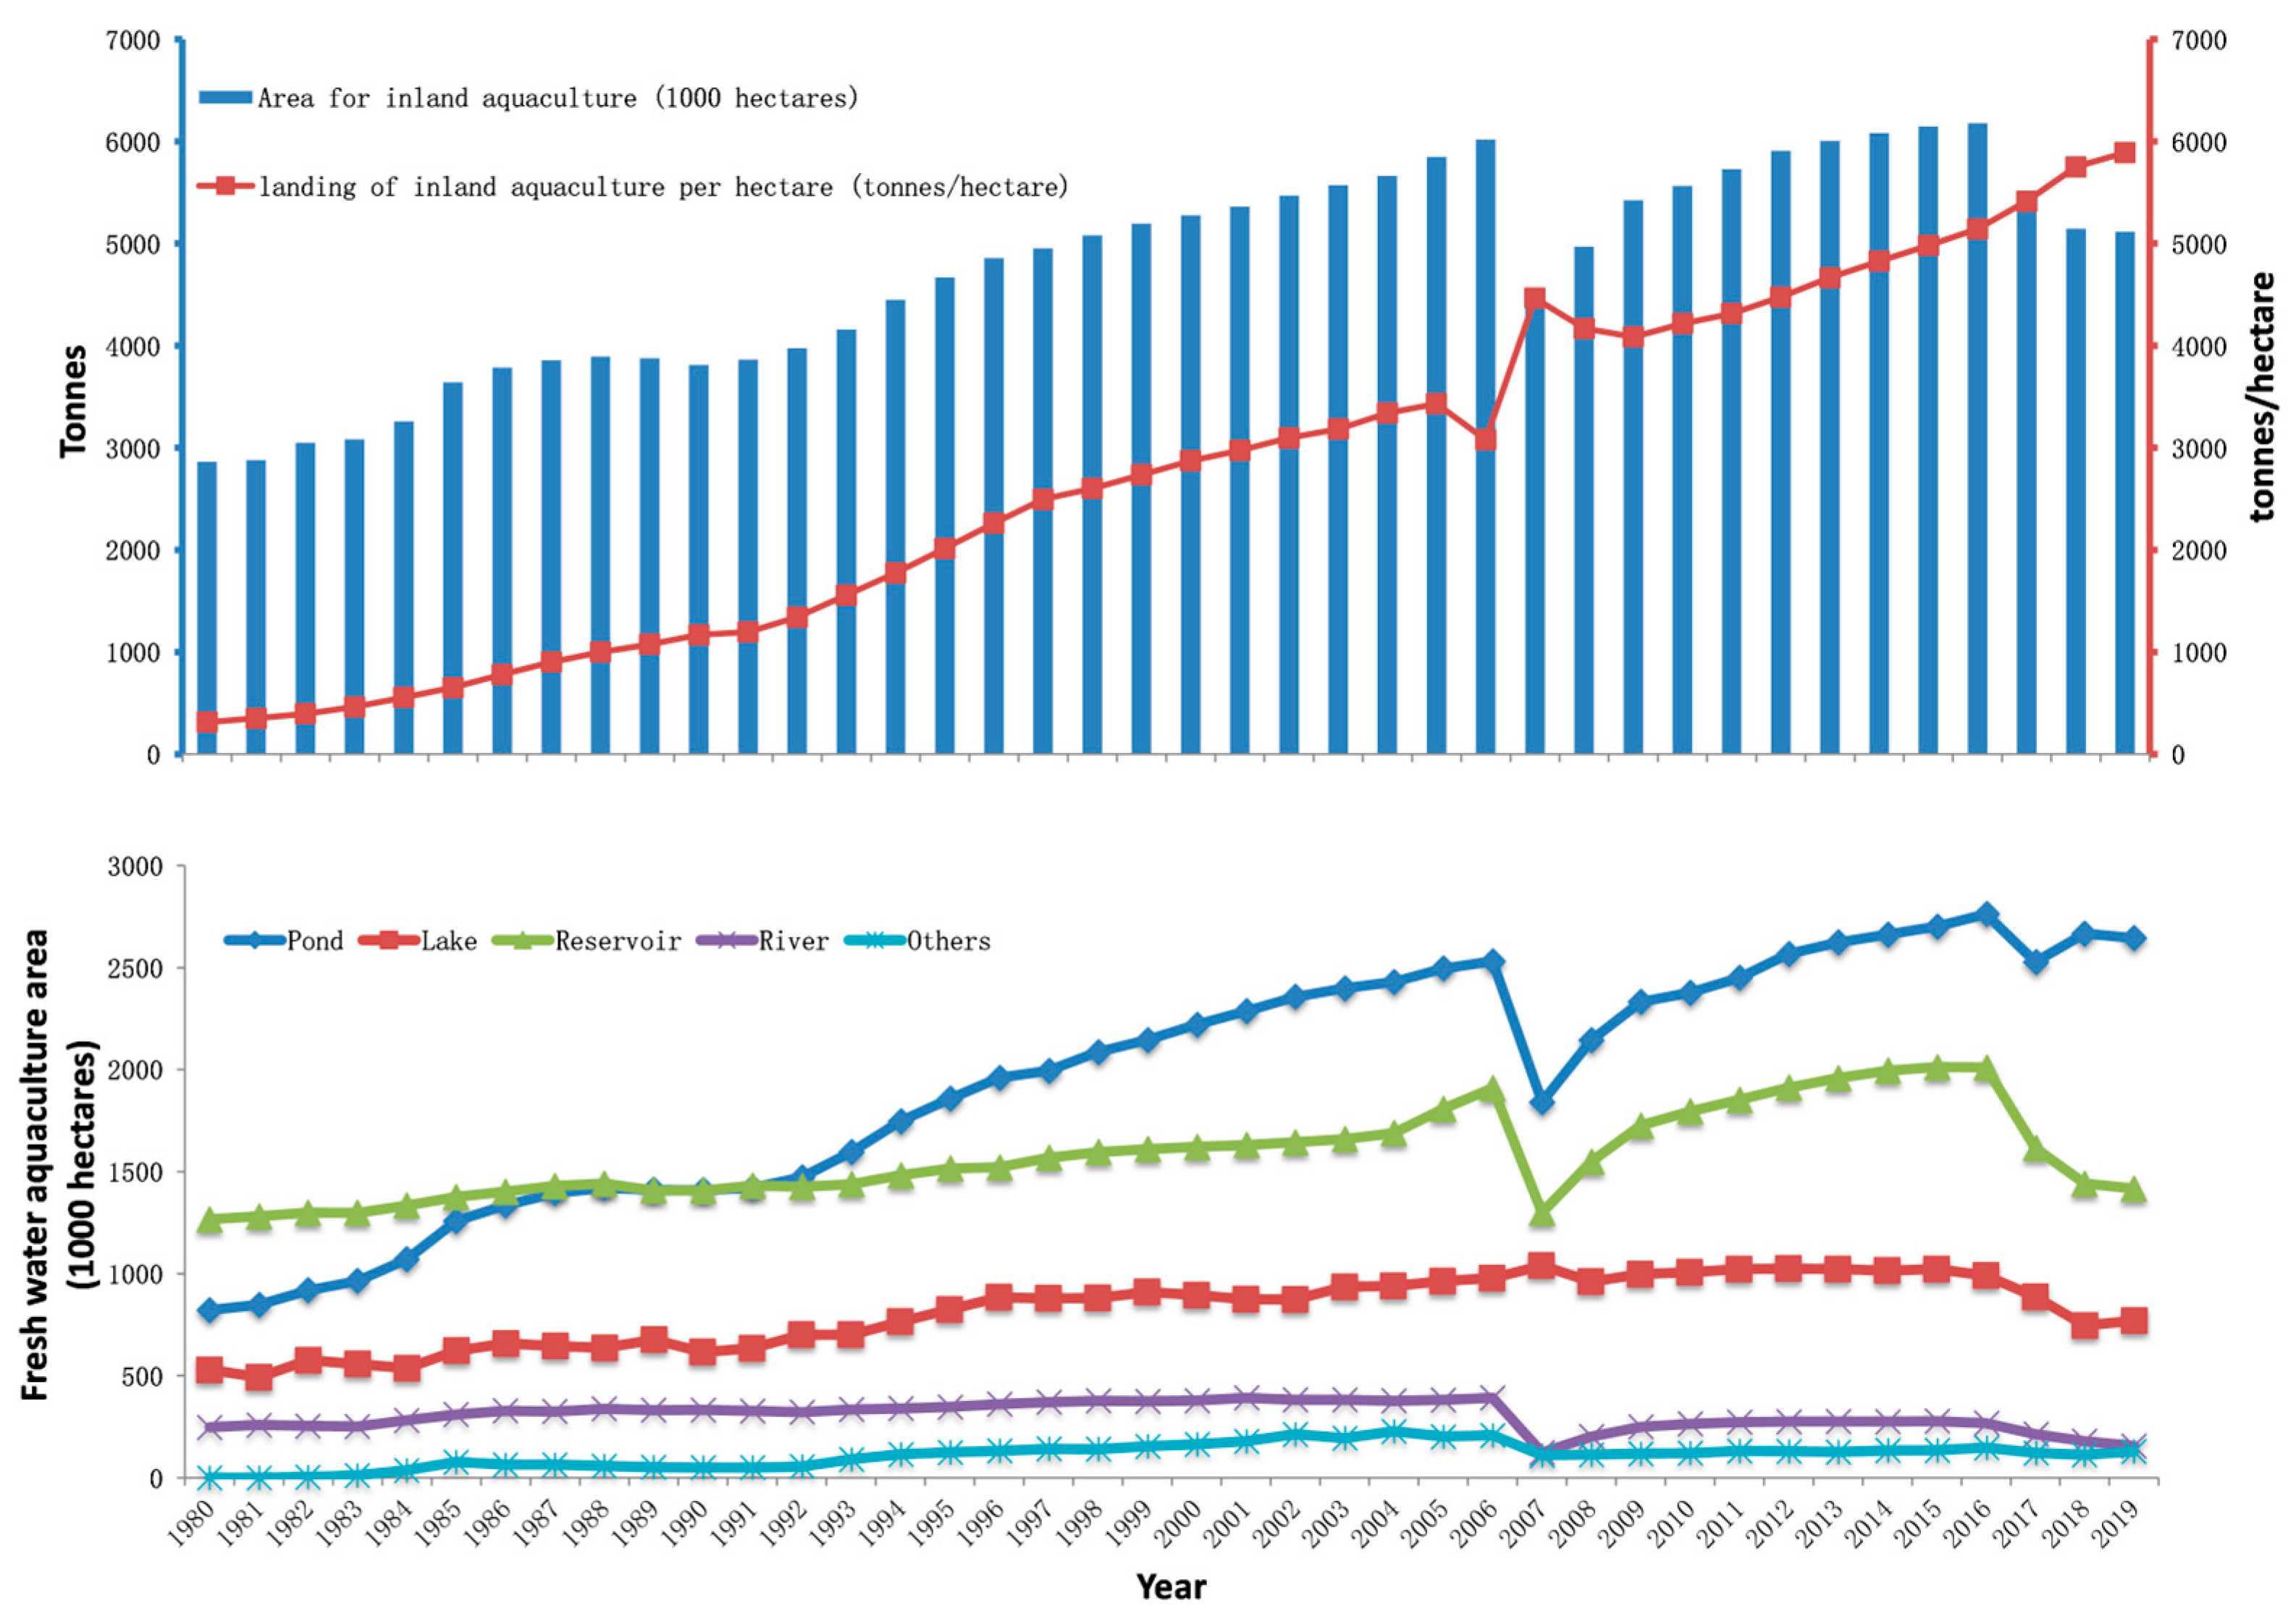
Inland aquaculture production in 2019 was 33.4 times higher than in 1980, driven by the expansion of aquaculture areas and increased unit yields. The area available for inland aquaculture expanded to 5,116,320 hectares, 1.8 times larger than in 1980, while the landings per hectare increased to 5890 tons, 18.7 times higher than in 1980 (
Figure 8, top). Inland aquaculture is characterized by rapid yield enhancements and moderate area expansions, differing from marine aquaculture.
The inland aquaculture area is much larger than that of marine aquaculture, but the unit yields are lower. For example, in 2019, the inland aquaculture area is 2.6 times as large as that of marine aquaculture, while its unit yield is only 0.6 times as high as that of marine aquaculture. By 2019, ponds accounted for 52% of the inland aquaculture area, surpassing reservoirs and lakes (
Figure 8, bottom).
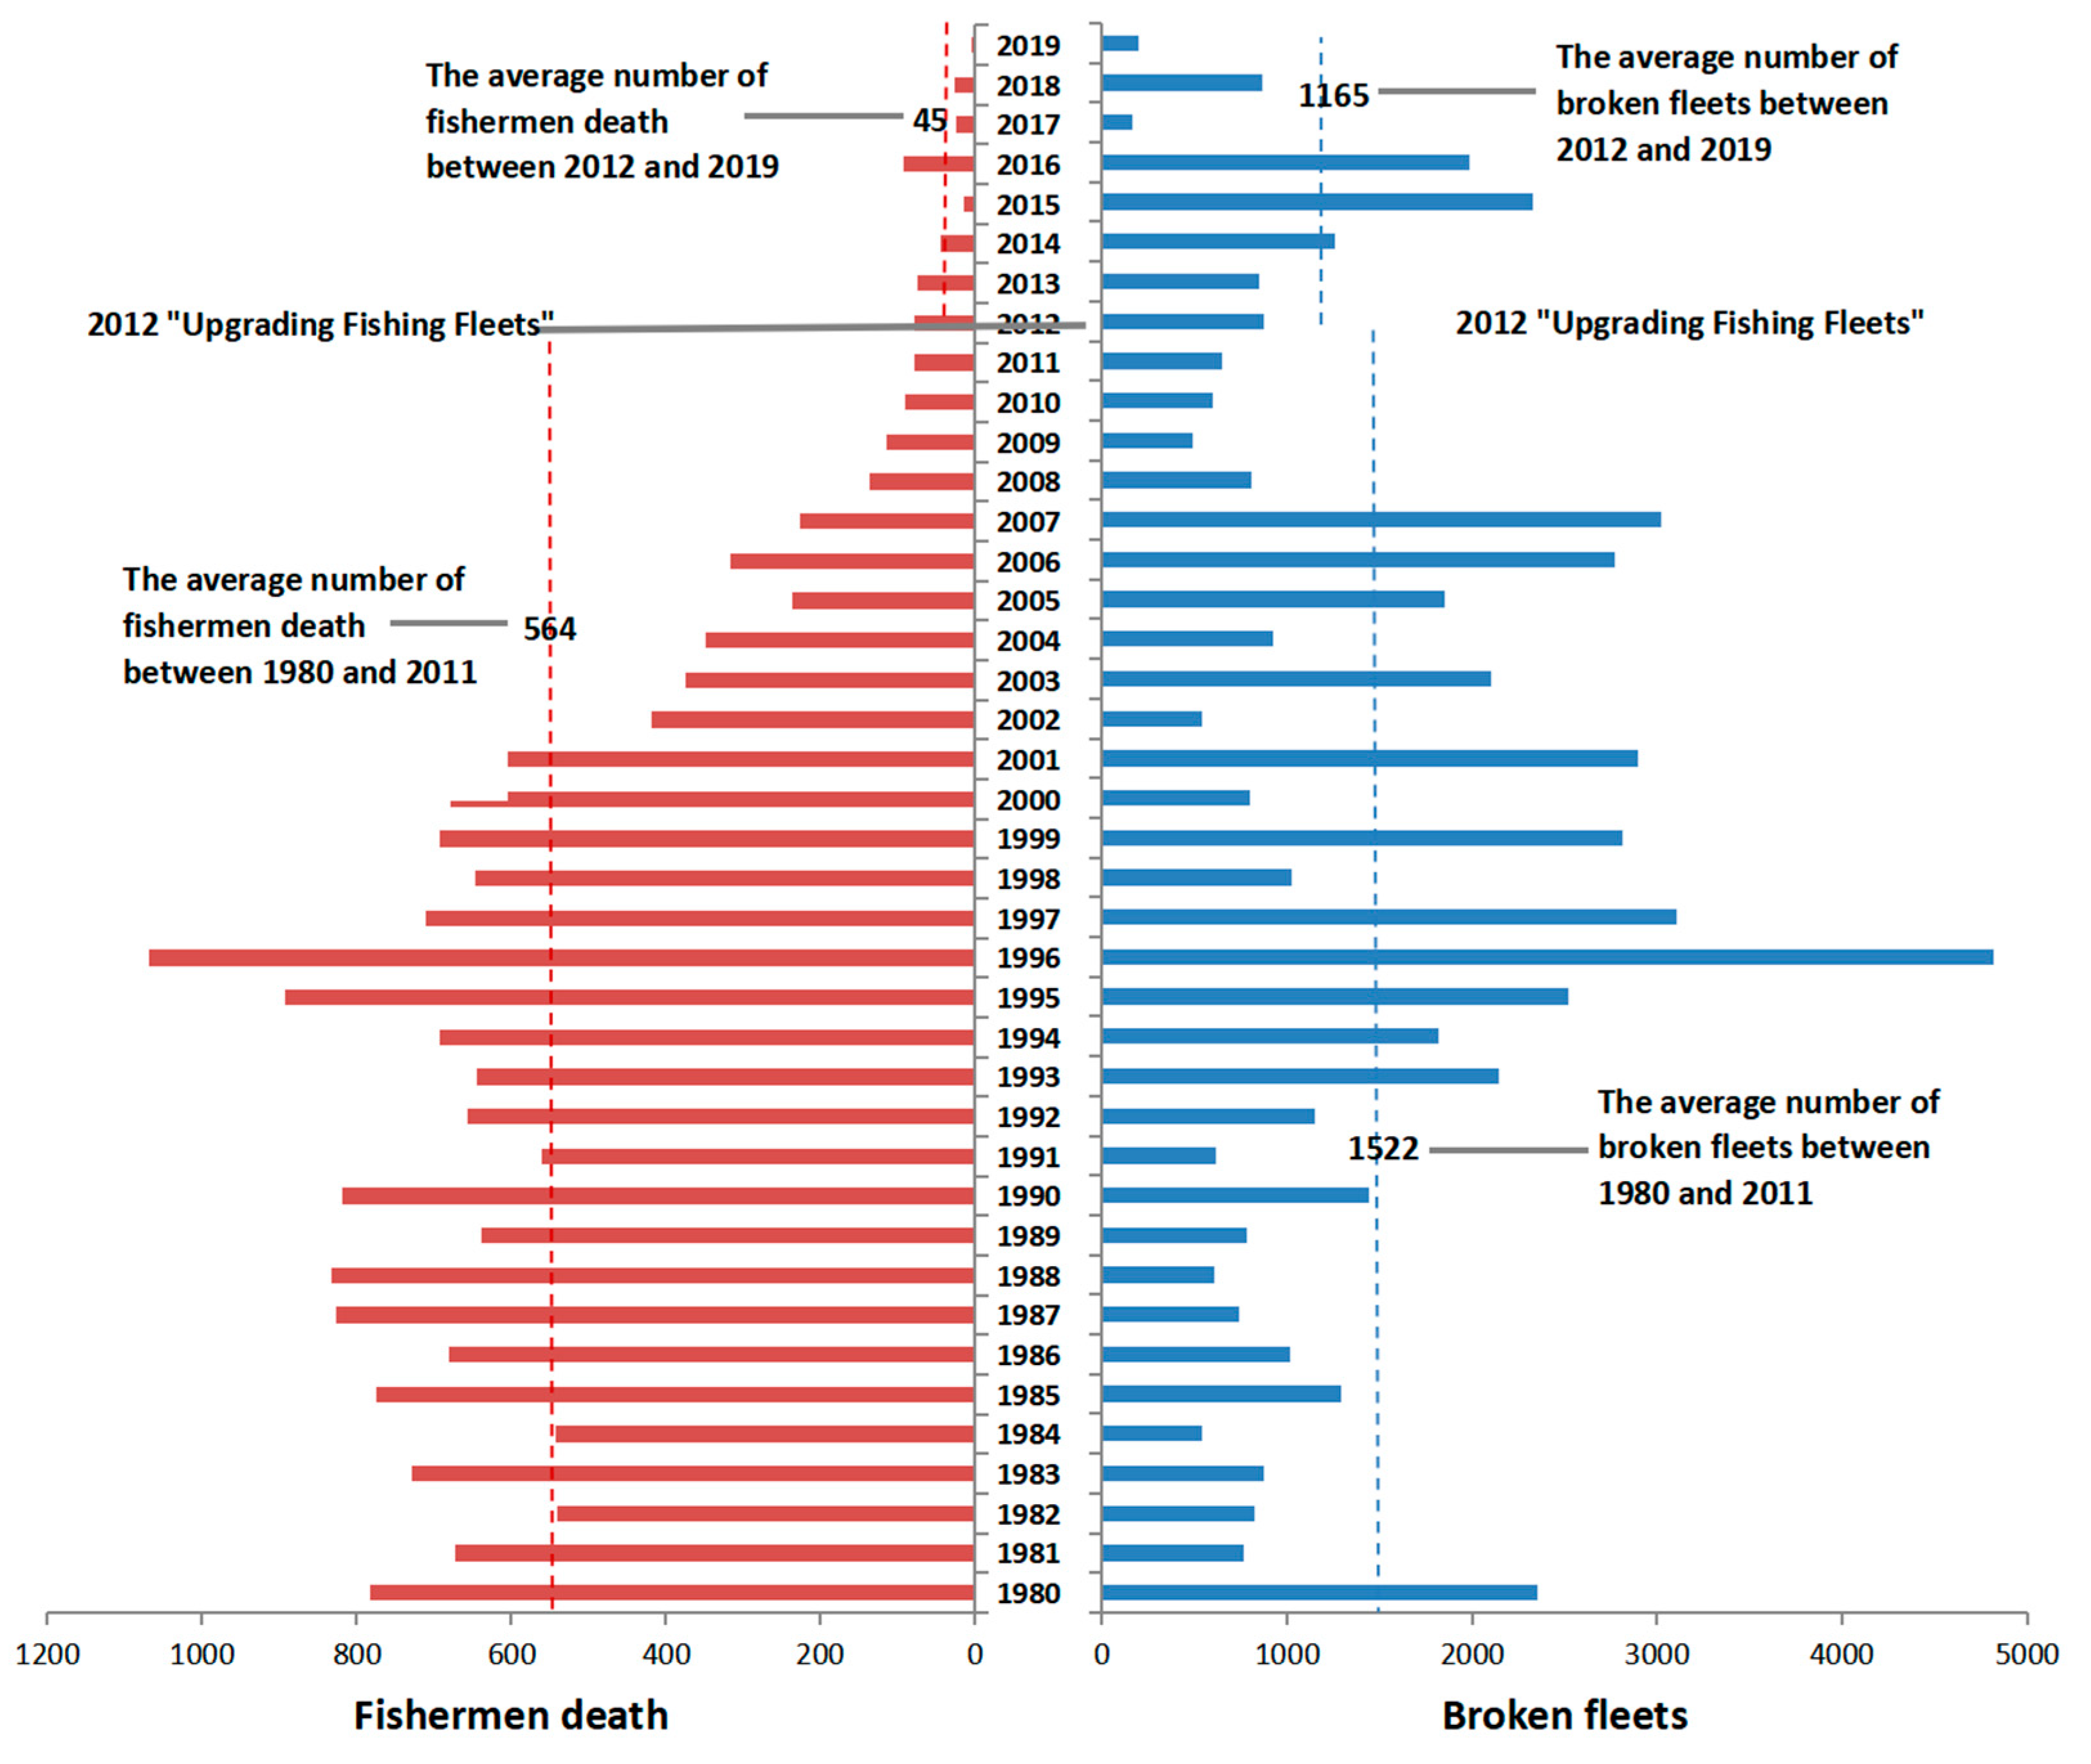
3.6. Fishery Disasters Caused by Typhoons
Although a variety of disasters have resulted in fishery losses in China, the continuous observations of fishery losses recorded were related to only typhoons. An analysis of fishermen’s mortality and the quantity of fleets sunk by typhoons was also performed for China’s fishery industry (see
Figure 9). Typhoons have caused significant fishery losses in China, with 18,410 fishermen’s deaths and 58,019 sunk fleets since 1980, with 1996 seeing the highest number of deaths and sunk fleets (
Figure 9). It was thus concluded there was a clear decreasing trend for mortality as time went on; however, the number of sunk fishing fleets did not show a trend comparable with that of the casualties. Since 2012, the “Upgrading Fishing Fleets” policy has improved safety, reducing the average annual casualty rate from 564 to 45 and the number of sunk fleets from 1522 to 1165.
3.7. Evaluation of Fishery Regulations
From 1989 to 2019, various fishery regulations were implemented, focusing on inputs (fishing area, fishermen, fleets) and outputs (production, fishing gear, fishing time), and partial regulations were evaluated based on short-term changes in inputs or outputs pre- and post-implementation (
Table 2).
The implementation of the “Dual Control” policy has not reversed the increasing trend in the number of marine fishery fleets and total engine power. It was also agreed in previous research that “Dual Control” has not fully achieved the expected effect on fishery management [
30]. The “Fishermen Transfer and Fishing Fleet Scrapping” and “Distant-Water Fishery Supervisory Regulation” measures were proven to be helpful in controlling the fishery fleets and the number of employees in the fishery industry. Specifically, the fund from the “Fishermen Transfer and Fishing Fleet Scrapping” policy was used to encourage the decommissioning of fishing fleets and relocation of fishermen, which significantly adjusted the marine fishery structure and lessened the pressure on fish stocks [
10]. In addition, measures such as “Zero Growth”, “Total Allowable Catch”, and “Trial of Marine Capture Quota” effectively limited the marine capture yields.
The effects of most fishery management measures are multifaceted, and different perspectives have led to a variety of conclusions. Regarding the “Nature Reserve for Aquatic Plants and the Animals” and “Aquatic Germplasm Resource Reserves” policies, there are differing opinions. China has established 25 state-level nature reserves for aquatic plants and animals and 525 aquatic germplasm resource reserves. According to previous research, there are more than 120 species and 400 species being protected via the “Nature Reserve for Aquatic Plants and the Animals” and “Aquatic Germplasm Resource Reserves” policies, respectively [
31]. Despite establishing numerous reserves, only a small number of these reserves (i.e., 7 of 25 nature reserves, and 110 of 525 aquatic germplasm resource reserves) are from marine areas. From the point of view of the limited marine area covered by the reserves, these two regulations are ineffective in controlling marine aquaculture expansion. There were also divergent opinions on the “Stock Enhancement and Release” and “Summer Fishing Moratorium” measures in previous studies. From their initial set-ups, both measures were constantly subject to annual adjustments regarding several factors, including the dates, sea areas, and the number of juveniles released. Some studies have confirmed that these two policies promoted the recovery of fishery resources [
32,
33]; however, their long-term effectiveness has been debated due to post-moratorium fishing efforts [
10,
34]. Therefore, the evaluation of China’s many fishery policies is complex and cannot be viewed as one-sided, and all of these factors comprise a series of signs signaling a change in China’s policy focus from resource exploitation to ecological conservation.
4. Conclusions
This study reviewed China’s fishery development from 1980 to 2019, focusing on its management, inputs, and outputs. Fishery-related policies tracing back to the 1980s were analyzed alongside fishery production and fishing efforts over a 40-year period. This analysis highlighted structural shifts within the fishery industry and the impact of management strategies on fishery production and related efforts.
Despite ongoing issues such as depleting fish stocks, China has continuously designed, implemented, and adjusted fishery policies. Key regulations such as “Fishermen Transfer and Fishing Fleet Scrapping”, “Zero Growth”, Total Allowable Catch”, “Trial of Marine Capture Quota”, and “Marine Ranching” have proven critically effective. However, policies such as “Dual Control” have been less effective, and its supervision needs to be strengthened. Regulations such as “Aquatic Germplasm Resource Reserves” and “Nature Reserve for Aquatic Animals and Plants” have been more successful in conserving inland waters compared to marine areas. Moving forward, these regulations should increase their focus on marine waters to further enhance conservation efforts. The unreasonable “Stock Enhancement and Release” policy will lead to the destruction of natural water ecosystems and the gradual decline of fishery resources, and sufficient assessments of species and areas should be performed before release.
Overall, China’s fishery management history reflects a significant policy shift from resource exploitation to ecosystem restoration, striving for a balance between fishery production and ecological sustainability.
Author Contributions
X.L. (Xin Liu): Conceptualization, methodology, formal analysis, investigation, writing—original draft preparation, writing—review and editing; R.G.: Data curation, writing—editing, writing—review and editing; T.N.D.: Writing—review and editing; X.L. (Xin Lv): Methodology, data curation; X.D.: Supervision, funding acquisition. All authors have read and agreed to the published version of the manuscript.
Funding
This research was funded by Big Earth Data in Support of the Sustainable Development Goals 2024, Chinese Academy of Sciences (No. AIRZB76-2024-000689).
Institutional Review Board Statement
This research does not involve animal experimentation and only utilizes fisheries’ statistical data, eliminating the need for Ethics Committee approval.
Informed Consent Statement
Not applicable.
Data Availability Statement
The original data contributions presented in the study are included in the article; further inquiries can be directed to the corresponding authors.
Acknowledgments
We sincerely appreciate the valuable comments provided by the editors and reviewers, which greatly contributed to the improvement of this work.
Conflicts of Interest
The authors declare no conflicts of interest.
Appendix A
Figure A1.
Contribution of all the regions to China’s fishery sector. Note: Chongqing city was separated from Sichuan province and established as a municipality directly under the central government in 1997. For simplicity, fishery products from Chongqing are included with Sichuan province in this study. Abbreviations: AH = AnHui; BJ = BeiJing; CQ = ChongQing; FJ = FuJian; GD = GuangDong; GS = GanSu; GX = GuangXi; GZ = GuiZhou; HeB = HeBei; HaN = HaiNan; HeN = HeNan; HuB = HuBei; HL = HeiLongjiang; HN = HuNan; JL = JiLin; JS = JiangSu; JX = JiangXi; LN = LiaoNing; NM = NeiMeng; NX = NingXia; QH = QingHai; SC = SiChuan; SD = ShanDong; SH = ShangHai; SX = ShanXi; SX3 = Shan3Xi; TJ = TianJing; XJ = XinJiang; XZ = XiZang; YN = YunNan; ZJ = ZheJiang.
Figure A2.
Percentage of the working population employed part-time or full-time in the fishery sector (annually). The percentage of fishermen in the total population per year is indicated with a dotted line.
Figure A2.
Percentage of the working population employed part-time or full-time in the fishery sector (annually). The percentage of fishermen in the total population per year is indicated with a dotted line.
Figure A3.
Production by five major operating methods in marine capture.
Figure A3.
Production by five major operating methods in marine capture.
Figure A4.
Annually averaged engine power of distant-water fleets and production proportions of distant-water fishing in various landings: national total and marine capture.
Figure A4.
Annually averaged engine power of distant-water fleets and production proportions of distant-water fishing in various landings: national total and marine capture.
Figure A5.
Number of distant-water fleets and production level of distant-water fishing in tons (1980–2019).
Figure A5.
Number of distant-water fleets and production level of distant-water fishing in tons (1980–2019).
Figure A6.
Production of marine aquaculture in all 11 coastal regions of China from 1980 to 2019. At present, the top two most productive regions are Shandong and Fujian provinces, each achieving a production level of 5 million tons of fish per year.
Figure A6.
Production of marine aquaculture in all 11 coastal regions of China from 1980 to 2019. At present, the top two most productive regions are Shandong and Fujian provinces, each achieving a production level of 5 million tons of fish per year.
References
- The Ministry of Agriculture and Rural Affairs of the People’s Republic of China. China Fishery Statistics Yearbook; China Agriculture Press: Beijing, China, 1980–2020. [Google Scholar]
- World Food and Agriculture Statistical Yearbook. 2020. Available online: https://openknowledge.fao.org/items/453d9430-f28c-4872-bb7a-0cf28e1232e5 (accessed on 13 June 2023).
- Tang, Q.S. Fisheries science knowledge system and characteristics China approach for fisheries. Dev. J. Agric. 2018, 8, 19–23. (In Chinese) [Google Scholar]
- Bao, H.; Wang, G.; Yao, Y.; Peng, Z.; Dou, H.; Jiang, G. Warming-driven shifts in ecological control of fish communities in a large northern Chinese lake over 66 years. Sci. Total Environ. 2021, 770, 144722. [Google Scholar] [CrossRef]
- Zhai, L.; Liang, C.; Pauly, D. Assessments of 16 Exploited Fish Stocks in Chinese Waters Using the CMSY and BSM Methods. Front. Mar. Sci. 2020, 7, 483993. [Google Scholar] [CrossRef]
- Wang, Y.; Wei, H.; Wang, Y.; Peng, C.; Dai, J. Chinese industrial water pollution and the prevention trends: An assessment based on environmental complaint reporting system (ECRS). Alexandria Eng. J. 2021, 60, 5803–5812. [Google Scholar] [CrossRef]
- Spijkers, J.; Merrie, A.; Wabnitz, C.C.C.; Osborne, M.; Mobjörk, M.; Bodin, Ö.; Selig, E.R.; Le Billon, P.; Hendrix, C.S.; Singh, G.G.; et al. Exploring the future of fishery conflict through narrative scenarios. One Earth 2021, 4, 386–396. [Google Scholar] [CrossRef]
- Liu, J.Y. Status of marine biodiversity of the China seas. PLoS ONE 2013, 8, e50719. [Google Scholar] [CrossRef]
- Cui, B.; He, Q.; Gu, B.; Bai, J.; Liu, X. China’s Coastal Wetlands: Understanding Environmental Changes and Human Impacts for Management and Conservation. Wetlands 2016, 36, 1–9. [Google Scholar] [CrossRef]
- Huang, S.; He, Y. Management of China’s capture fisheries: Review and prospect. Aquacult. Fish. 2019, 4, 173–182. [Google Scholar] [CrossRef]
- Crona, B.I.; Wassénius, E.; Troell, M.; Barclay, K.M.; Mallory, T.; Fabinyi, M.; Zhang, W.; Lam, V.W.Y.; Cao, L.; Henriksson, P.J.G.; et al. China at a Crossroads: An Analysis of China’s Changing Seafood Production and Consumption. One Earth 2020, 3, 32–44. [Google Scholar] [CrossRef]
- Kang, B.; Huang, X.; Li, J.; Liu, M.; Guo, L.; Han, C.C. Inland Fisheries in China: Past, Present, and Future. Rev. Fish. Sci. Aquacult. 2017, 25, 270–285. [Google Scholar] [CrossRef]
- Wang, Q.; Wang, S. Carbon emission and economic output of China’s marine fishery—A decoupling efforts analysis. Mar. Policy 2022, 135, 104831. [Google Scholar] [CrossRef]
- Su, M.; Wang, L.; Xiang, J.; Ma, Y. Adjustment trend of China’s marine fishery policy since 2011. Mar. Policy 2021, 124, 104322. [Google Scholar] [CrossRef]
- Ji, J.; Guo, X.; Zhang, Y. The study of symbiotic relationships between the economic and the ecological system of China’s mariculture industry—An empirical analysis of 10 coastal regions with Lokta–Volterra model. Reg. Stud. Mar. Sci. 2021, 48, 102051. [Google Scholar] [CrossRef]
- Yu, J.; Yin, W.; Liu, D. Evolution of mariculture policies in China: Experience and challenge. Mar. Policy 2020, 119, 104062. [Google Scholar] [CrossRef]
- Yu, J.K.; Wang, H.X. Evolution of distant water fisheries policies in China: Overview, characteristics and proposals. Ocean Coast. Manag. 2021, 207, 105592. [Google Scholar] [CrossRef]
- Zhang, X.; Vincent, A.C.J. China’s policies on bottom trawl fisheries over seven decades (1949–2018). Mar. Policy 2020, 122, 104256. [Google Scholar] [CrossRef]
- Mallory, T.G. Fisheries subsidies in China: Quantitative and qualitative assessment of policy coherence and effectiveness. Mar. Policy 2016, 68, 74–82. [Google Scholar] [CrossRef]
- Huang, S.L.; Tang, Y. Fisheries Regulations and Fisheries Administration; China Agriculture Press: Beijing, China, 2010. (In Chinese) [Google Scholar]
- Liu, X.; Geng, R.Y.; Lv, X.; Hu, X.K.; Do, T.N.; Liu, M. From dynamics to sustainability: Modeling the shrimp (Penaeus chinensis) fishery in Shandong, China. Ecol. Modell. 2024, 489, 110600. [Google Scholar] [CrossRef]
- Yang, H.J.; Peng, D.; Liu, H.; Mu, Y.; Kim, D.H. Is China’s Fishing Capacity Management Sufficient? Quantitative Assessment of China’s Efforts toward Fishing Capacity Management and Proposals for Improvement. J. Mar. Sci. Eng. 2022, 10, 1998. [Google Scholar] [CrossRef]
- Yu, J.K.; Wang, Y. Evolution of deep-sea fisheries policies in China: Review, performance and prospects. Fish. Manag. Ecol. 2023, 30, 109–120. [Google Scholar] [CrossRef]
- Shen, H.; Huang, S. China’s policies and practice on combatting IUU in distant water fisheries. Aquacult. Fish. 2020, 6, 27–34. [Google Scholar] [CrossRef]
- Ding, Q.; Shan, X.J.; Jin, X.S.; Gorfine, H. A multidimensional analysis of marine capture fisheries in China’s coastal provinces. Fish Sci. 2021, 87, 297–309. [Google Scholar] [CrossRef]
- Yu, J.; Zhang, L. Evolution of marine ranching policies in China: Review, performance and prospects. Sci. Total Environ. 2020, 737, 139782. [Google Scholar] [CrossRef] [PubMed]
- Ding, Q.; Shan, X.; Jin, X.; Gorfine, H.; Guan, L.; Yang, T. Evolution of China’s Total Allowable Catch (TAC) system: Review and way forward. Mar. Policy 2023, 147, 105390. [Google Scholar] [CrossRef]
- Huang, L.M.; Wang, J.Q.; Shih, Y.J.; Li, J.; Chu, T.J. Revealing the Effectiveness of Fisheries Policy: A Biological Observation of Species Johnius belengerii in Xiamen Bay. J. Mar. Sci. Eng. 2022, 10, 732. [Google Scholar] [CrossRef]
- Cao, L.; Chen, Y.; Dong, S.; Hanson, A.; Huang, B.; Leadbitter, D.; Little, D.C.; Pikitch, E.K.; Qiu, Y.; Sadovy de Mitcheson, Y.; et al. Opportunity for marine fisheries reform in China. Proc. Natl. Acad. Sci. USA 2017, 114, 435–442. [Google Scholar] [CrossRef]
- Sun, J.T.; Lv, K. Evaluation and adjustment of the “double control” system for Chinese marine fishing vessels. Fujian Tribune 2016, 11, 49–55. (In Chinese) [Google Scholar]
- Yang, H.L.; Wei, Q.W. Suppressive and active protective actions in aquatic wildlife conservation. J. Lake Sci. 2021, 33, 1–10. (In Chinese) [Google Scholar]
- Chen, D.Q.; Li, S.J.; Wang, K. Enhancement and conservation of inland fisheries resources in China. Environ. Biol. Fish. 2012, 93, 531–545. [Google Scholar] [CrossRef]
- Liu, A.X. The preliminary study on changes of fishery resources in Daya Bay before and after the closed fishing period. Ocean Fish. 2017, 2, 60–61. (In Chinese) [Google Scholar]
- Yu, J.; Hu, Q.; Yuan, H.; Chen, P. Effect assessment of summer fishing mortatorium in Daya Bay based on remote sensing data. South China Fish. Sci. 2018, 14, 1–9. (In Chinese) [Google Scholar]
Figure 1.
An overview of management in China’s fishery sector over the period 1980–2019.
Figure 1.
An overview of management in China’s fishery sector over the period 1980–2019.
Figure 2.
Yields of China’s fisheries in quantity from 1980 to 2019. (A). National yield by volume in capture fisheries and aquaculture. (B). National production by volume in marine capture, marine aquaculture, inland capture, and inland aquaculture. (C). Landing trends in the top three productive sectors, with a focus on marine capture controlled by the four regulations: 1989 “Stock Enhancement and Release”, 1995 “Summer Fishing Moratorium”, 1999 “Zero Growth”, and 2016 “Total Allowable Catch”.
Figure 3.
Forty-year time-series: the average engine horsepower per fishery fleet and the number of fishery fleets.
Figure 3.
Forty-year time-series: the average engine horsepower per fishery fleet and the number of fishery fleets.
Figure 4.
Total capture fishery workforce per year, with the 2003 policy highlighted. Average annual income per capture fishery worker compared with the national average income. Earnings for all the years were adjusted to 2019 CNY.
Figure 4.
Total capture fishery workforce per year, with the 2003 policy highlighted. Average annual income per capture fishery worker compared with the national average income. Earnings for all the years were adjusted to 2019 CNY.
Figure 5.
Marine capture production of 11 coastal regions: TJ (TianJing), HeB (HeBei), LN (LiaoNing), SH (ShangHai), JS (JiangSu), ZJ (ZheJiang), FJ (FuJian), SD (ShanDong), GD (GuangDong), GX (GuangXi), and HaN (HaiNan). In 2017, ZJ, SD, FJ, GD, and LN (five coastal provinces marked in solid lines) were selected as pilot provinces to initially implement the “Marine Capture Quota” system.
Figure 6.
Average annual landings of inland capture by region over 40 years. The top five productive provinces, located along the ChangJiang River, are marked in blue. The bottom and top of the red line represent the minimum and maximum annual landings for each region, respectively. For simplicity, inland capture production from Chongqing is included with Sichuan province in this study. Abbreviations: AH = AnHui; BJ = BeiJing; CQ = ChongQing; FJ = FuJian; GD = GuangDong; GS = GanSu; GX = GuangXi; GZ = GuiZhou; HeB = HeBei; HaN = HaiNan; HeN = HeNan; HuB = HuBei; HL = HeiLongjiang; HN = HuNan; JL = JiLin; JS = JiangSu; JX = JiangXi; LN = LiaoNing; NM = NeiMeng; NX = NingXia; QH = QingHai; SC = SiChuan; SD = ShanDong; SH = ShangHai; SX = ShanXi; SX3 = Shan3Xi; TJ = TianJing; XJ = XinJiang; XZ = XiZang; YN = YunNan; ZJ = ZheJiang.
Figure 7.
Expansion of marine aquaculture areas and improvement of their unit yield for China from 1980 to 2019, with related policies issued in 1997, 2011, and 2015.
Figure 7.
Expansion of marine aquaculture areas and improvement of their unit yield for China from 1980 to 2019, with related policies issued in 1997, 2011, and 2015.
Figure 8.
Top: total area of inland aquaculture (thousand hectares) and unit yield (tons per hectare), 1980–2019. Bottom: inland aquaculture area by various types of territorial waters.
Figure 8.
Top: total area of inland aquaculture (thousand hectares) and unit yield (tons per hectare), 1980–2019. Bottom: inland aquaculture area by various types of territorial waters.
Figure 9.
Fishery damage caused by typhoons. Left: the number of fishermen killed. Right: the number of sunken fishing fleets.
Figure 9.
Fishery damage caused by typhoons. Left: the number of fishermen killed. Right: the number of sunken fishing fleets.
Table 1.
Fishery management measures with a brief description.
Table 1.
Fishery management measures with a brief description.
| Management Measure (Year) | Description |
|---|
| Marine Environmental Protection Law (1982) | Establishes regulations on marine fishery production. |
Fishery Law
(1986, as amended in 2000 and 2004) | China’s first comprehensive law on the protection, multiplication, development, and rational utilization of fishery resources. |
| Dual Control (1987) | Controls the number and total power of marine fishery vessels nationwide. |
| Fishermen Transfer and Fishing Fleet Scrapping (2003) | Establishes a special fund for scrapping fishing vessels and training fishermen to transition to other industries. |
| Summer Fishing Moratorium (1995) | Prohibits marine fishing with specified gear or in specified areas at designated times annually. |
| Zero Growth (1999) | Ensures no increase in marine capture production compared to the previous year. |
| Total Allowable Catch (2016) | Controls the total domestic marine capture production. |
| Trial of Marine Capture Quota (2017) | Catch quota trials for selected species in specific sea areas. |
| DWF Supervisory Regulation (2003) | Supervises the scope, basic system, enterprise qualification, vessels, and crews of distant-water fishing. |
| Mandatory Installation of Vessel Monitoring Systems (VMS) (2011) | Requires VMS installation on all distant-water fishing vessels in China. |
| Bilateral Agreements (1997–2000) | International cooperation on fisheries with adjacent coastal countries. |
Table 2.
A summary of the effectiveness of selected management measures.
Table 2.
A summary of the effectiveness of selected management measures.
| Management (Year) | One-Year Change | Effective? | Aim |
|---|
| Dual Control (1987) | Marine fishery fleets: +21,204 fleets
Total engine power: +744,881 kW | No | Reduce the number of fishermen and marine fishery fleets |
| Fishermen Transfer and Fishing Fleet Scrapping (2003) | Marine fishery fleets: −42,865 fleets
Fishermen: −144,480 people | Yes |
| Zero Growth (1999) | Marine capture fishery production nationwide: −0.2 million tons | Yes | Limit marine capture fishery production |
| Total Allowable Catch (2016) | Marine capture fishery production nationwide: −0.2 million tons | Yes |
| Trial of Marine Capture Quota (2017) | Marine capture fishery production of the five selected coastal provinces: −1.7 million tons | Yes |
| Mandatory Installation of Vessel Monitoring Systems (VMS) (2011) | Distant-water fleets: −46 fleets
Total engine power: −83,472 kW | Yes | Reduce the number of distant-water fleets |
| Disclaimer/Publisher’s Note: The statements, opinions and data contained in all publications are solely those of the individual author(s) and contributor(s) and not of MDPI and/or the editor(s). MDPI and/or the editor(s) disclaim responsibility for any injury to people or property resulting from any ideas, methods, instructions or products referred to in the content. |
© 2024 by the authors. Licensee MDPI, Basel, Switzerland. This article is an open access article distributed under the terms and conditions of the Creative Commons Attribution (CC BY) license (https://creativecommons.org/licenses/by/4.0/).


