Article

Heterogeneous Weight Development of Lumpfish (Cyclopterus lumpus) Used as Cleaner Fish in Atlantic Salmon (Salmo salar) Farming

1
SAMBA, Norwegian Computing Center, Gaustadalleen 23A, 0373 Oslo, Norway
2
Akvaplan-niva AS, Storlavika 7, 7770 Flatanger, Norway
3
Bjørøya AS, Storlavika 7, 7770 Flatanger, Norway
4
Norwegian Veterinary Institute, Elizabeth Stephansens vei 1, 1433 Ås, Norway
5
Aqualife R&D, Havnegata 9, 7010 Trondheim, Norway
*
Author to whom correspondence should be addressed.
Fishes 2024, 9(9), 336; https://doi.org/10.3390/fishes9090336
Submission received: 28 July 2024 / Revised: 20 August 2024 / Accepted: 22 August 2024 / Published: 26 August 2024

Abstract

Lumpfish (Cyclopterus lumpus) are used as cleaner fish in Atlantic salmon (Salmo salar) aquaculture as one of multiple control measures against salmon lice (Lepeophtheirus salmonis). Numerous studies have documented weight as an important factor for characterising the cleaning efficacy of individual lumpfish. Hence, the efficacy of lumpfish in fish farms depends on the size at stocking and the weight development over time. Here, we aimed to quantify how weight developed over time for lumpfish deployed in salmon farming sea cages in Norway through modelling the daily growth rate. We found that the coefficient of variation for lumpfish weight increased over time, implying that the standard deviation increased more than the expected weight. The data thus showed heterogeneous growth for lumpfish in salmon farming cages, where some individuals exhibited no apparent growth, and others significant proliferation. We found that the daily growth rate was best described as bell-shaped functions of weight and temperature, consistent with a sigmoid-shaped growth curve and an optimal temperature around 10 °C. These results allow for more realistic modelling of the efficacy of lumpfish in controlling salmon lice in fish farms, as one can combine estimates of weight-dependent cleaning efficacy with weight development over time.
Key Contribution: We provide a model for the weight development of lumpfish deployed as cleaner fish in commercial Atlantic salmon farming. We found heterogeneous growth of lumpfish, with some lumpfish steadily increasing in weight, and others not growing at all.

1. Introduction

The use of lumpfish (Cyclopterus lumpus) as cleaner fish is a common control measure against salmon lice (Lepeophtheirus salmonis) on farmed Atlantic salmon (Salmo salar) [1,2,3,4]. This is especially true for fish farms with comparatively low sea temperatures, where lumpfish are considered to be the most appropriate cleaner fish species [1,2,5]. Lumpfish constituted 28 million out of the 46 million cleaner fish deployed in Norwegian fish farms in 2021, and practically all of these were of farmed origin [6].
The lumpfish is a teleost belonging to the family of Cyclopteridae and the order Scorpaeniformes. The species is dispersed particularly in the North Atlantic and has five genetically distinct groups located within this area [7]. Juvenile fish are often observed in shallow benthic regions attached to substrates using their sucker disc, a morphological feature enabling the species to handle turbulent waters and feed passively on motile food items drifting by [8]. At this stage of ontogeny, their feeding habits show a variety in preferences, including crustaceans, hydrozoans, molluscs, and algae [9]. After 1–2 years, the species commonly migrates to open waters to feed, observed in surface trawls feeding on jellyfish and small fish, before returning to spawn [10]. Lumpfish are considered semi-pelagic and have morphological adaptations to both pelagic and benthic lifestyles [11]. The species exhibits cleaning behaviour (approaching and consuming ectoparasites from the skin of a usually larger client fish) when introduced to open salmon net pens [12]. Moreover, the cohabitation between the species does not seem to negatively impact the stress levels or health scoring of either species [13]; while lumpfish cleaning behaviour has been rarely observed in nature, these features have made it a popular choice for the salmon industry as a biological control measure, aiming to prevent or delay use of chemical or mechanical delousing, which can have a negative impact on the environment and salmon welfare [14,15].
Nonetheless, the introduction of a new species to salmon duo-culture has been challenging in relation to increasing lumpfish mortality rates and disease outbreaks, especially during the latter phase in net pens [16]. Concern has also been raised regarding the spread of infectious pathogens between lumpfish and salmon (e.g., [17,18]); while many measures have been put in place to improve breeding, feed, environmental conditions and handling, there are still challenges with maintaining good welfare during the production cycle.
Recently, there has been a particular focus on increasing lumpfish welfare and survival during production [16,19,20,21,22,23,24,25,26], and there is pressure on the industry to improve lumpfish welfare [19]. Lumpfish weight and growth are important welfare surveillance indicators, and are necessary for assessing body condition (well-being/fatness) [27,28,29]. Specifically, body condition has recently been suggested as an operational welfare indicator for lumpfish [16,20]. Hence, it is interesting to assess how lumpfish weight varies with time since deployment. Moreover, it is common to use supplementary stocks of lumpfish over time during production. It is therefore also interesting to assess whether lumpfish weight can be used to distinguish between different stocks based on time since their deployment in sea cages.
Lumpfish weight has been found to be an important factor for salmon lice grazing. Lumpfish above 200–300 g have been found to have a lower cleaning efficacy than comparatively smaller lumpfish [30,31,32]. One study [33] found an estimated optimal weight of 40 g, by analysing a large sample of stomach contents from approximately 20,000 lumpfish deployed in Norwegian salmon fish farms. Lumpfish below and above 40 g contained fewer salmon lice. Note that it is not known whether lumpfish of comparatively large weight prefer not to consume salmon lice, or lumpfish which prefer to graze on salmon lice gain less weight. Nonetheless, the prevalence of salmon feed in lumpfish stomach contents has been found to increase with lumpfish weight [31].
Since lumpfish weight is an important factor for grazing efficacy, the success of different lumpfish stocking strategies will depend both on the stocking weight and on the weight development over time since deployment. Hence, a model for lumpfish growth over time can be used as an important component in models of salmon lice infestations on farmed salmon, for example as additional components in the models published in [34,35]. The models could then be used as simulation tools in order to assess and compare the efficacy of different lumpfish stocking strategies.
How lumpfish size may evolve post-deployment as cleaner fish in salmon farming cages is thus of relevance to fish farmers for both welfare and sea lice control purposes; this is addressed in the present study. The main aim of the present study is hence to establish a model for lumpfish weight over time since deployment in commercial sea cages. Secondarily, we assess whether lumpfish weight can be used to distinguish between different stocks deployed at different time points. Thirdly, we compare the lumpfish growth for the commercially deployed lumpfish, to a controlled tank experiment. The results show a large heterogeneity in lumpfish growth in commercial sea cages, where the standard deviation increased faster than the expected weight.

2. Materials and Methods

2.1. Commercial Farm Data

2.1.1. Lumpfish Weight from Commercial Farms

In this study, we used individual data of lumpfish weight for 625 lumpfish sampled at different time points from two salmon farms in Mid-Norway: Nausttaren (latitude: 64.3896, longitude: 10.5125 (WGS84)) and Kråkholmen (latitude: 64.6025, longitude: 10.8541). Each of the 625 lumpfish was only sampled at one of the time points, and hence the individual lumpfish were not followed over time. We obtained data from two different sea cages from Nausttaren, and four different sea cages from Kråkholmen. All cages had a circumference of 160 m and were stocked with 150,000–200,000 Atlantic salmon (Salmo salar) smolts weighing 100–150 g. The two cages at Nausttaren were stocked with salmon in August 2019, and the four cages in Kråkholmen were stocked in the period August–October 2020. At the first stocking of lumpfish at Nausttaren on 2 September 2019, the salmon in the cages weighed approximately 150 g. The corresponding salmon weight at Kråkholmen on 2 November 2020 was approximately 250–550 g. There were nine different sampling time points from Nausttaren, ranging from 10 October 2019 to 11 August 2020. For Kråkholmen, we obtained data for nine different time points, ranging from 9 September 2020 to 21 June 2021. The number of lumpfish on each sample date ranged from 6 to 63 due to practical limitations and various weather conditions. The minimum observed weight was 24 g, while the maximum observed weight was 1031 g. The total number of lumpfish sampled from each stock at each sample date is provided in the Supplementary Materials, Table S1, with corresponding minimum and maximum weight, and coefficient of variation for each date. Lumpfish weight was measured in grams. Note that the stocking weight was unknown.
Each lumpfish stock consisted of a cohort of closely related individuals cohabitating from hatching and during rearing until departure from the lumpfish producer Namdal Rensefisk AS. For each stock, all individuals were tagged with VIE (visible implant elastomer) (Northwest Marine Technology Inc., Washington, DC, USA). Insulin syringes ( 0.33 mm × 12.7 mm U-100, Becton Dickinson and Company, Franklin Lake, WI, USA) were used to implant the coloured VIE directly underneath the epithelial tissue on the flat area between the pelvic fins and behind the sucker disc of the lumpfish. Lumpfish were lightly sedated with 30 mg/L tricaine (Pharmaq, Overhalla, Norway). The tagging method was considered gentle and did not seem to impact fish welfare, since there were no observed mortalities and all individual lumpfish returned to feeding on the same day as tagging had occurred. The experiment was approved by the Norwegian Food Safety Authority (FDU 25536).
By tagging each stock with a unique colour, it was possible to monitor and follow each group of lumpfish deployed at sea. Hence, we knew the number of days the lumpfish individuals had been in the salmon farming cages for each sampling time point. At Nausttaren, the blue-tagged lumpfish were deployed on 2 September 2019. The purple-tagged lumpfish were deployed on 14 November 2019 and the orange-tagged lumpfish were deployed on 21 April 2020. At Kråkholmen, the red- and green-tagged lumpfish were deployed on 2 November 2020, and the purple-tagged lumpfish were deployed on 15 January 2021. As we were only interested in time since deployment, we merged the red- and green-tagged lumpfish, which were deployed on the same date, and coloured these as red in the plots. A timeline of the sampling time points and the deployment dates for the different stocks is provided in Figure 1.

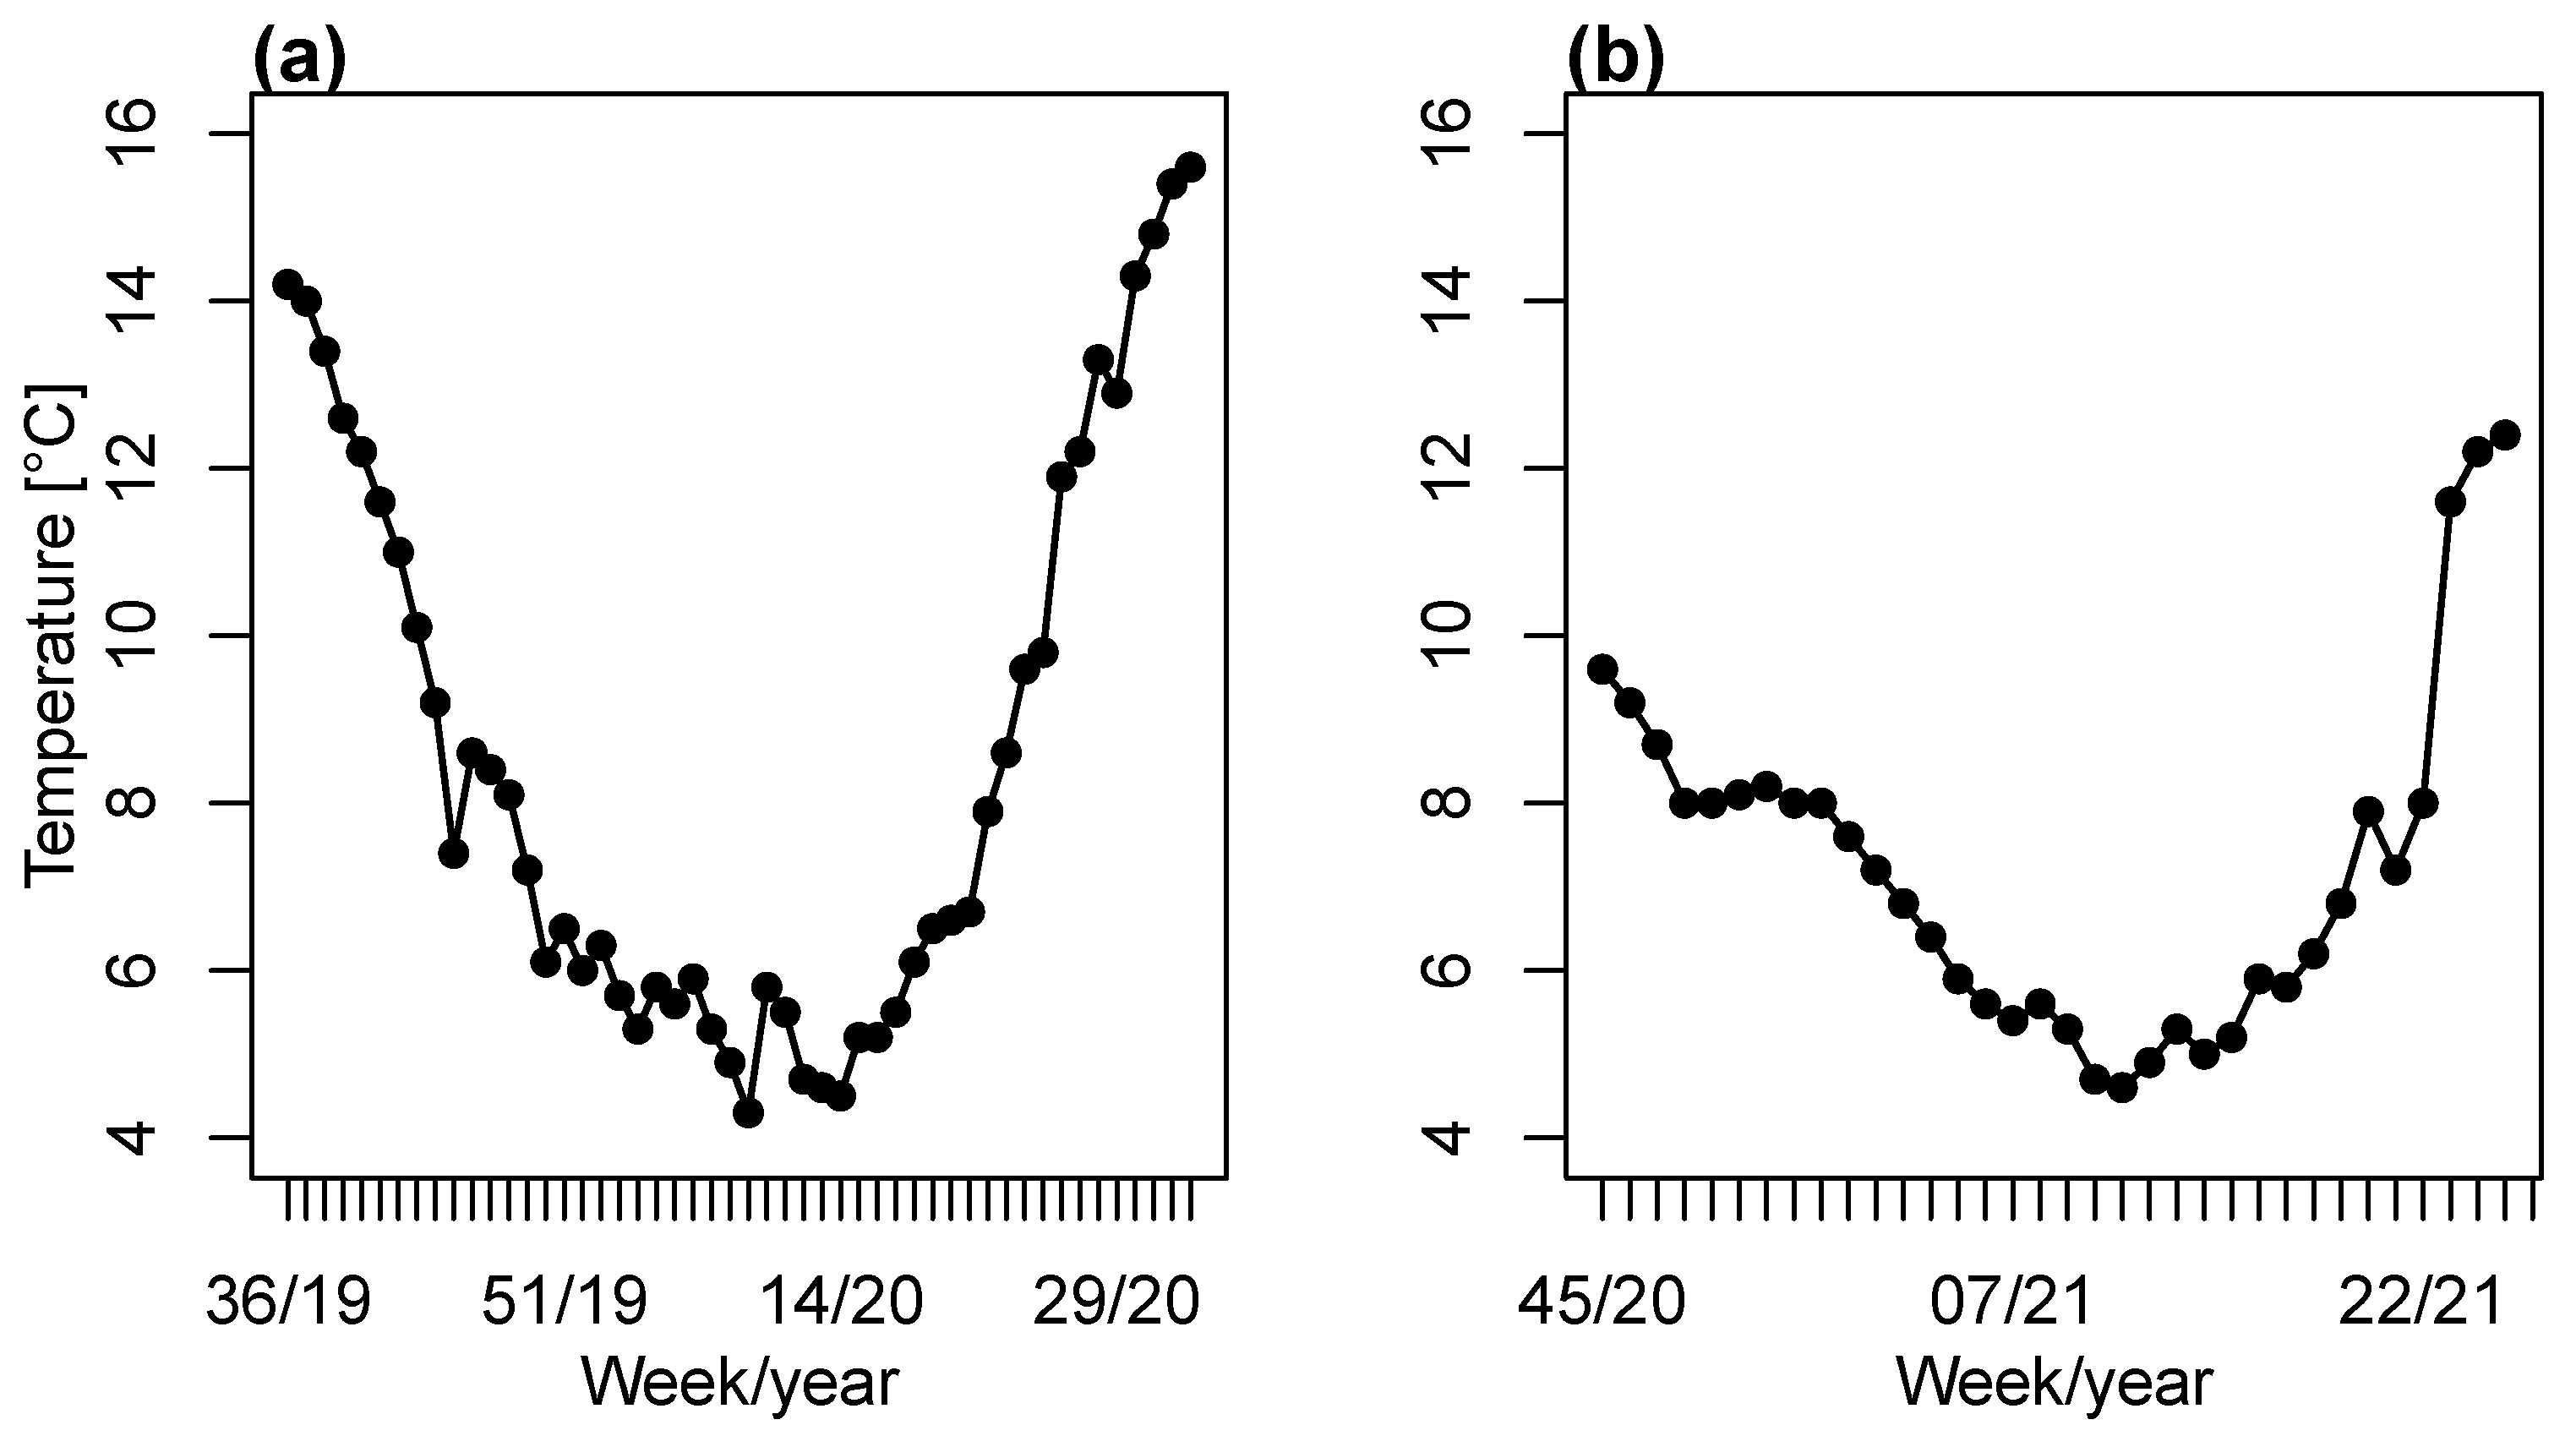
2.1.2. Sea Water Temperature from Commercial Farms

The sea temperatures for the area were downloaded from BarentsWatch [36]. BarentsWatch contains weekly sea temperature measurements at 3 m depth from the different commercial fish farm sites. As we were interested in daily sea temperatures, we set the daily sea temperatures to the reported temperature of the corresponding week. The temperatures for the relevant periods are provided in Figure 2.

2.2. Lumpfish Weight Development in a Controlled Tank Experiment

We used weight data from [13] to compare weight development in lumpfish from a controlled tank experiment with weight development in commercial salmon cages. The tank experiment data were from individually tagged lumpfish (floy tags [13]) reared at low density (20 individuals in each homogeneous 1 × 1 × 1 m3 grey tank). The dataset included lumpfish weight for 136 individuals measured every second week for 43 days. The individuals were thus followed over time, and there were four sampling time points for each lumpfish individual, where the first corresponds to the start of the experiment. The start weight for these lumpfish is thus known. These lumpfish were fed daily with pellets (2% of biomass) at a mean temperature of 7.5 °C. The observed lumpfish weight over time for the controlled tank experiment is provided in Figure 3. We note that the lines are almost parallel. For more information on these weight data, see Material and Methods section in [13].

2.3. Methods

All analyses were performed using R Statistical Software v4.3.3 [37].

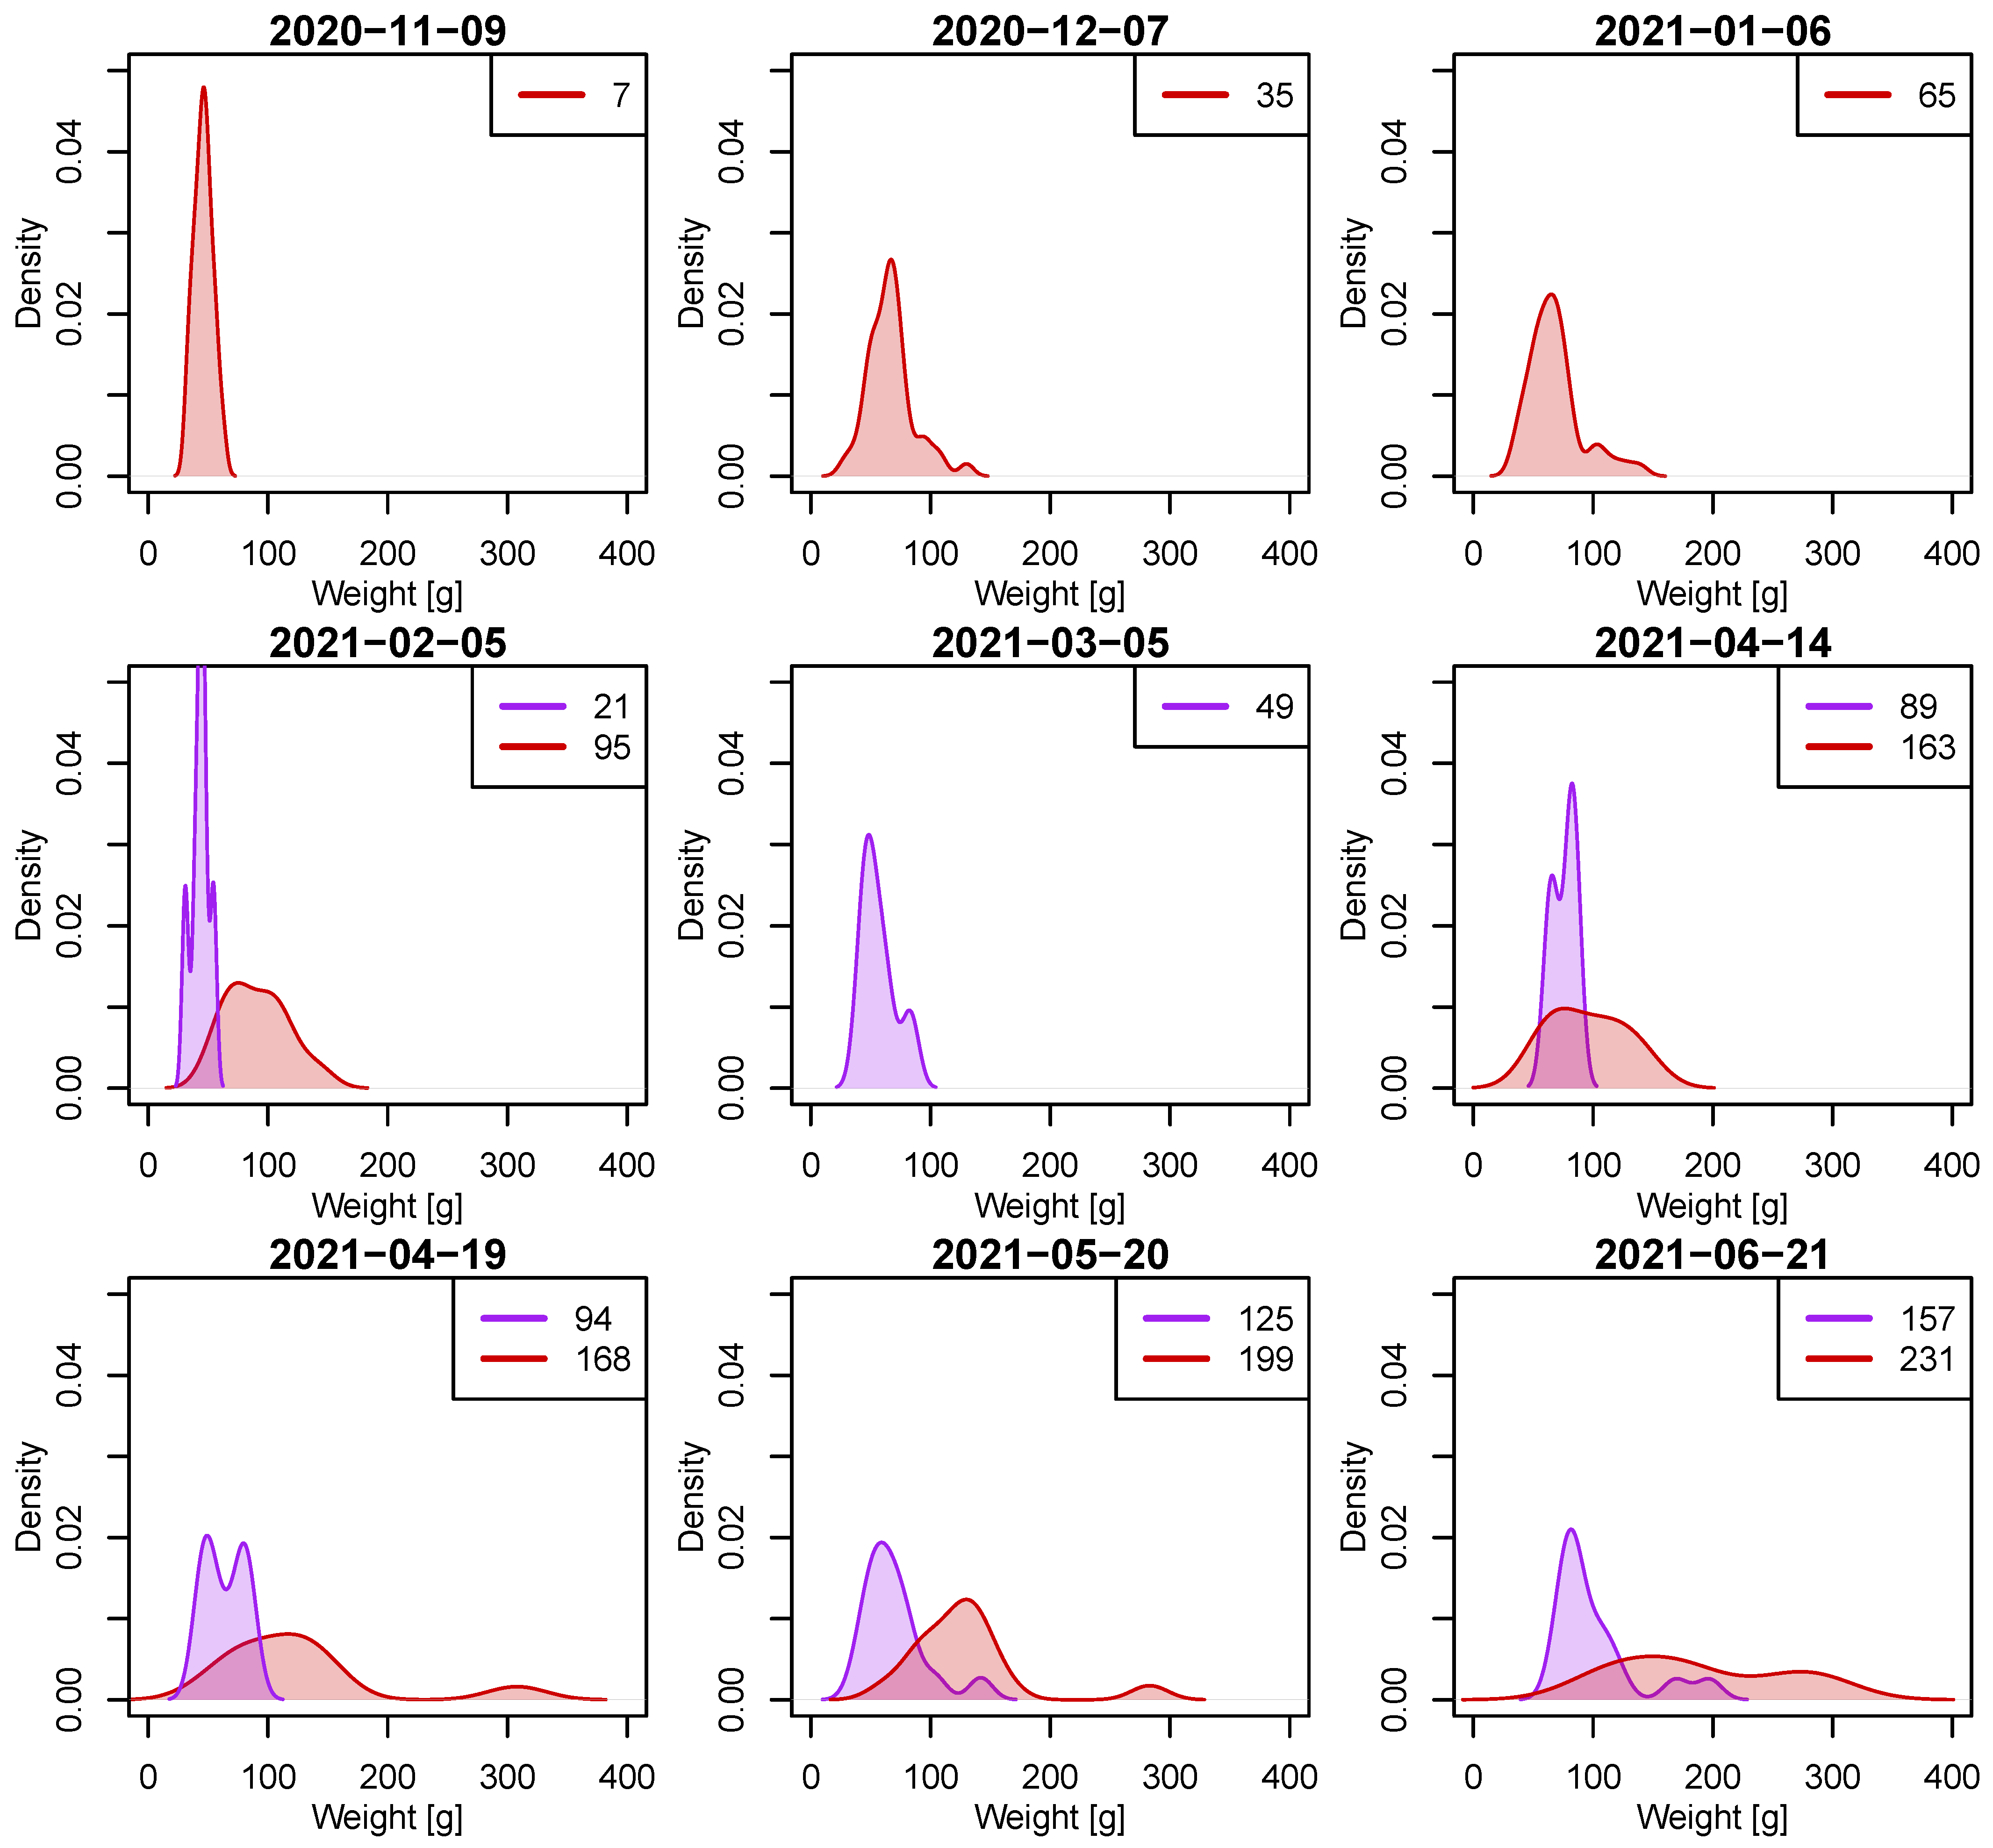
2.3.1. Probability Density of Weight over Time

In order to assess whether different stocks could be distinguished based on lumpfish weight, we plotted the probability density of weight for the different sampling time points and stocks. The estimated non-parametric probability density functions of weight were computed using the default Gaussian kernel density estimator from the density function in R [38]. A density estimation is a way to smooth the raw data, similar to a smoothed histogram. Note that this analysis only served as a visual illustration of how the weight distributions differed between the different stocks, and not a formal analysis. The formal weight analysis is explained in the section below.

2.3.2. Regression Model for Lumpfish Weight

We fitted a regression model to data from both salmon farms. We assumed a gamma distribution for lumpfish weight, where we modelled the expected daily growth factor for each stock with a logarithmic link function. We also estimated the starting weights for each of the five stocks. Note that we model the population means of each stock, while the individual weights will be spread around these population means. As explanatory variables, we tried models with linear, quadratic, and interaction terms between temperature and weight. All models investigated included linear effects in temperature and weight, as these are known to be important for lumpfish growth (see for example [39]). We used AIC (Akaike’s information criterion) [40] (Chapter 2) as our model selection criterion. Hence, let x s , t be the (vector) of explanatory variables for stock s on t days since stocking, and let μ t , s be the expected weight for stock s on t days since stocking. We then fitted the following model:
log ( γ t , s ) = β 0 + β x t , s ,
μ t + 1 , s = γ t , s μ t , s ,
where
Y i , t , s Gamma μ t , s , ν t , s ,
is the lumpfish weight for individual i from stock s on day t since stocking, and γ t , s is the growth factor for stock s on day t since stocking. The corresponding daily growth rate (in %) is then given by 100 ( γ t , s 1 ) . The parameter ν i , t , s is related to the variance, by Var ( Y i , t , s ) = μ t , s 2 / ν t , s . The coefficient of variation (standard deviation divided by expectation) is 1 / ν t , s . In a standard gamma distribution, ν is constant. However, we also allowed it to vary with μ t , s , as ν t , s = 1 / ( α 0 μ t , s α 1 ) and chose the best model by AIC. The starting weights μ 0 , s were also estimated for each stock. We let s = 1 correspond to the blue-tagged lumpfish at Nausttaren, s = 2 correspond to the purple-tagged lumpfish at Nausttaren, s = 3 correspond to the orange-tagged lumpfish at Nausttaren, s = 4 correspond to the red- and green-tagged lumpfish at Kråkholmen, and s = 5 correspond to the purple-tagged lumpfish at Kråkholmen. We estimated μ 0 , s , ν , α 0 , α 1 , β 0 and β as the maximum likelihood estimates. Note that, for the models where the daily growth rate was modelled as a function of weight, the expected weight at time point t, μ t , s was included as an explanatory variable for γ t , s in x s , t , which was used to estimate μ t + 1 , s . Note also that with this model, the daily growth rate was not restricted to being positive, as weight decrease is possible.

2.3.3. Comparison with Individual Time–Series from the Controlled Tank Experiment

The fitted model for the growth factors for the lumpfish observations in commercial salmon farms was compared to the growth for the individual time–series data from the controlled tank experiment. The growth is compared by the expected growth for lumpfish with starting weight corresponding to the average start weight for the lumpfish individuals in the controlled tank experiment (40.1 g), at temperature 7.5 °C, like in the controlled tank experiment. The expected weights were then compared to the observed average weights in the controlled tank experiment. We also compared the estimated coefficients of variation from the fitted model in commercial salmon farms to the empirical coefficients of variation in the controlled tank experiment.

3. Results

The estimated non-parametric probability density plots in general showed overlap between different stocks for lumpfish with comparatively low weight appearing at all time points (Figure 4 and Figure 5). The lumpfish with the highest weights had typically been in the sea cages for the longest time. Note that some of these estimated density curves were based on few observations and are thus uncertain. The number of observations for each density curve can be found in the Supplementary Materials Table S1.

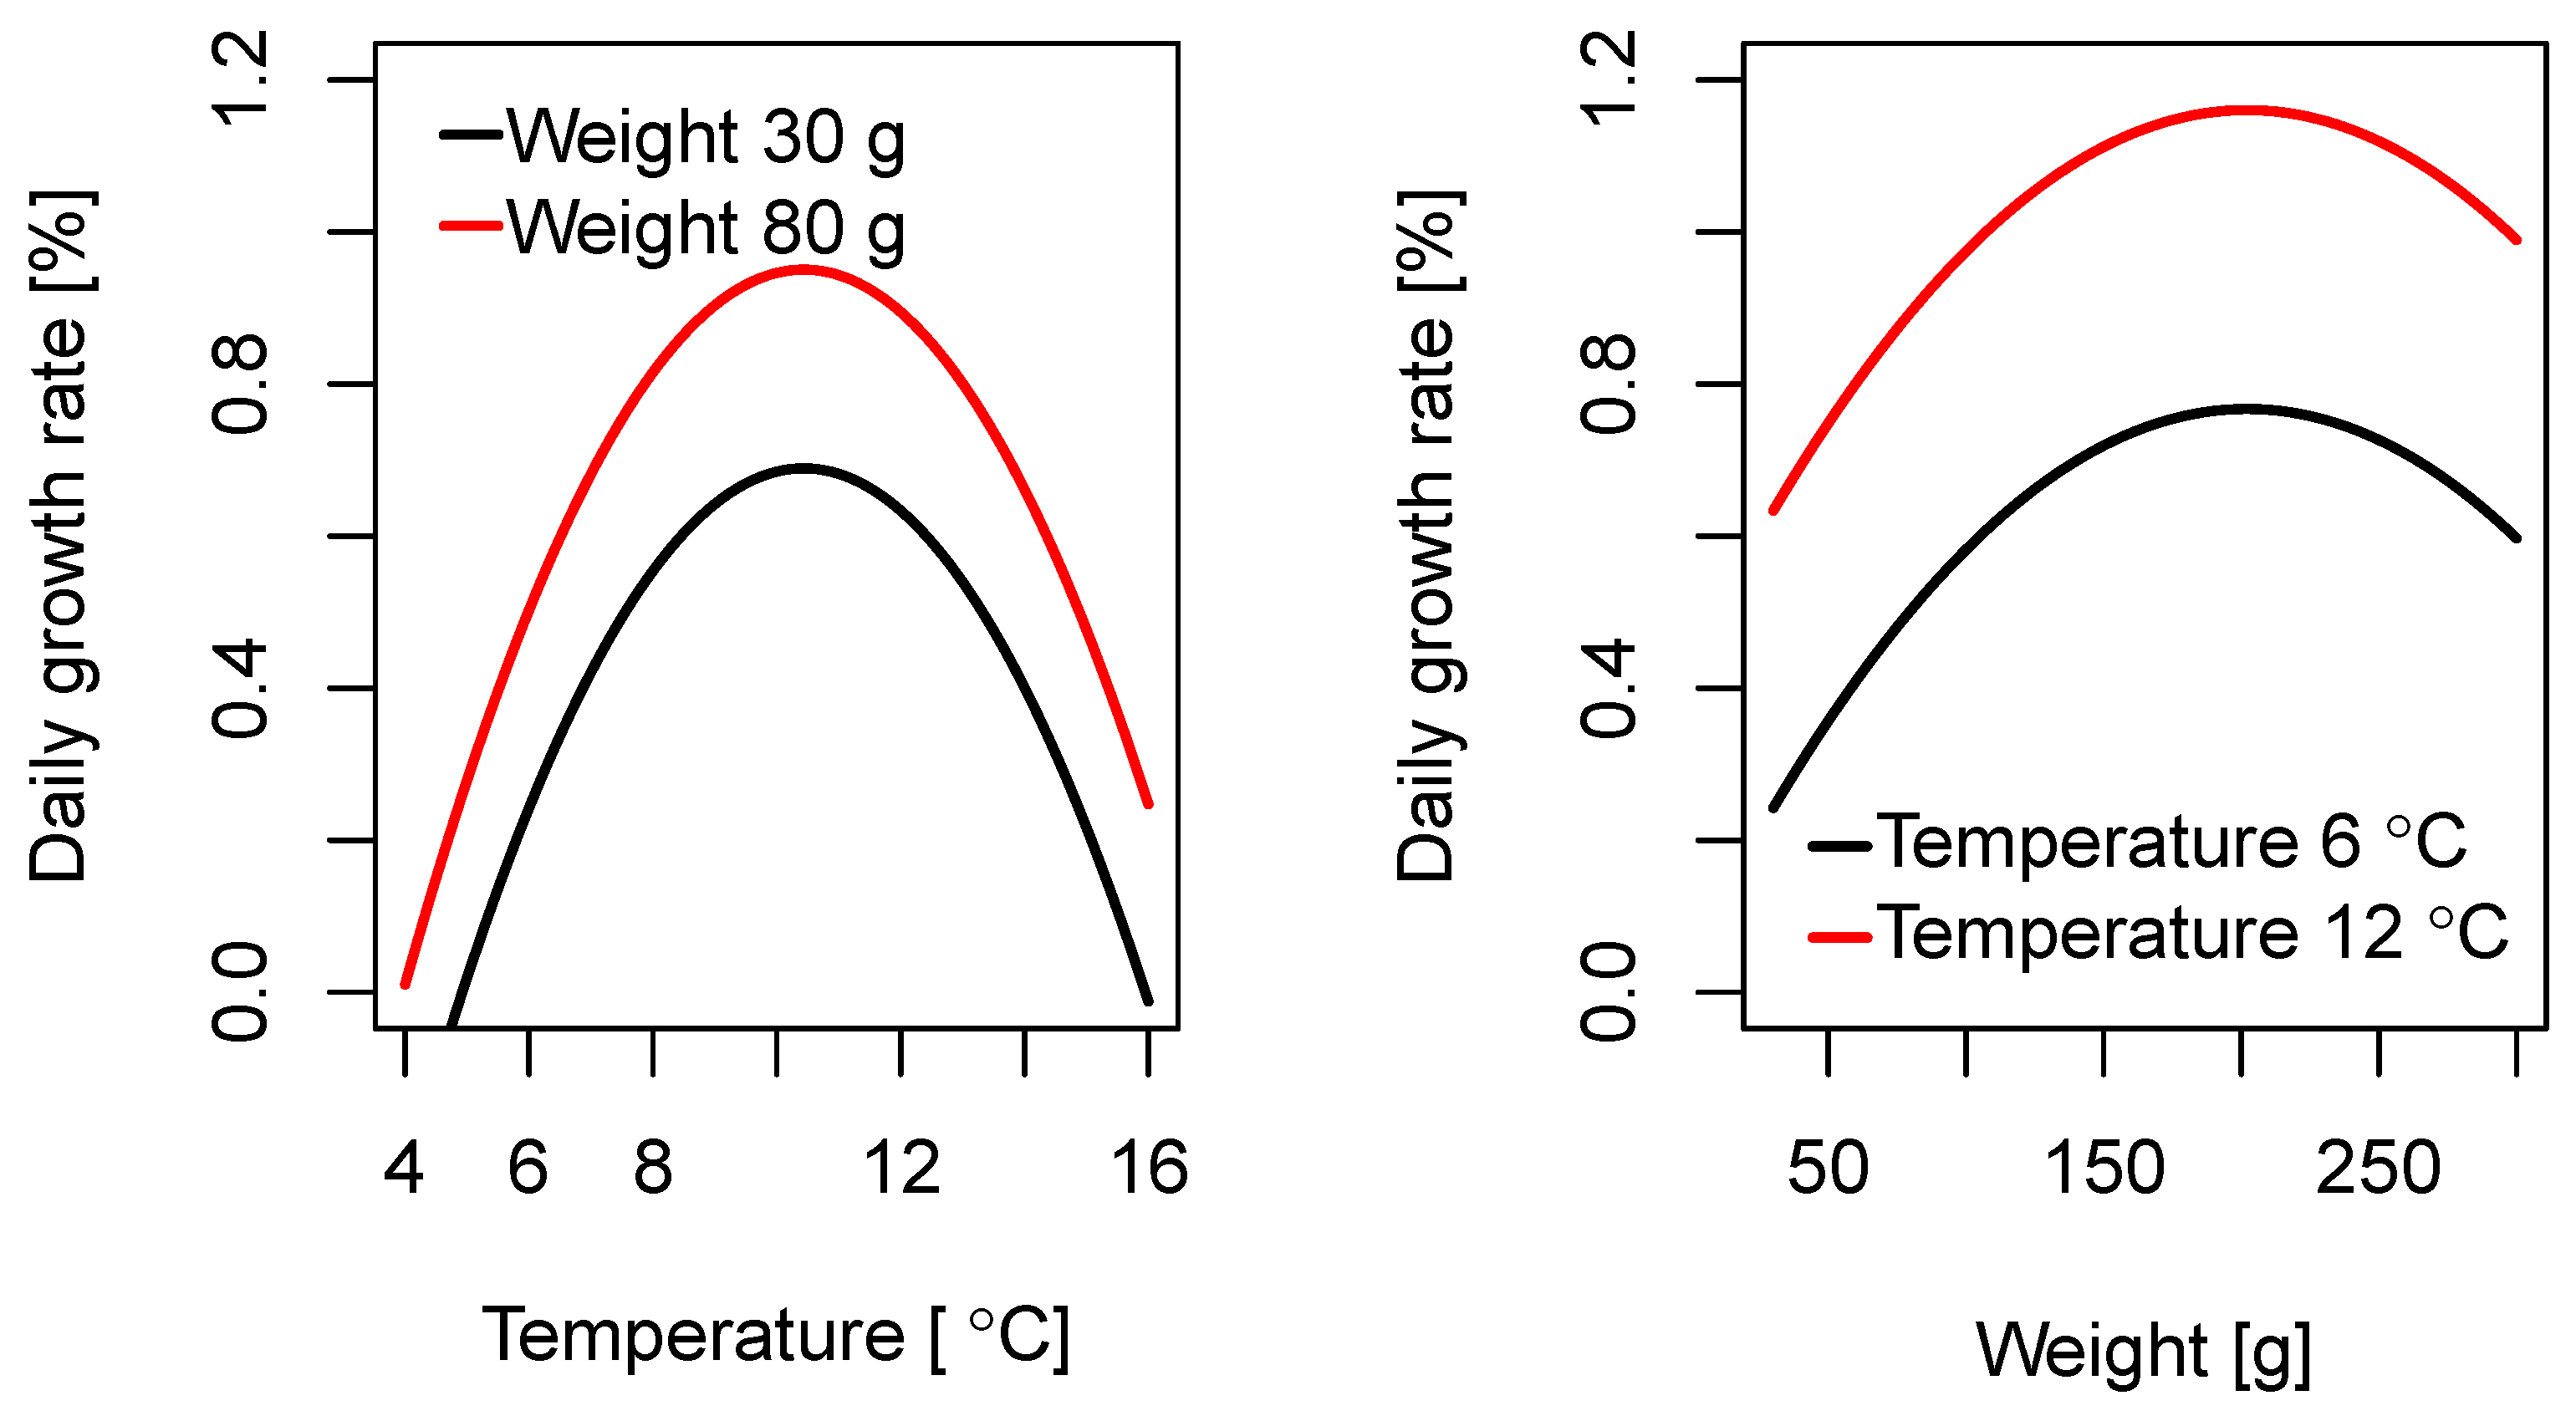
3.1. Regression Models for Daily Growth

The AIC values for a selection of fitted models are provided in Table 1. The best model in terms of AIC was the model with a quadratic effect in temperature and weight, without any interaction term, and with a non-constant coefficient of variation. The quadratic term in weight improved the AIC by 9.0, while the quadratic term in temperature improved the AIC by 2.2. Models with a constant coefficient of variation resulted in a substantially worse fit to the data.
The fit to the observations and the estimated daily growth rates for the best fitting model are provided in Figure 6. The growth rates were different between the different stocks, due to different temperatures and stocking weights. We note that, for the blue-tagged lumpfish at Nausttaren, the estimated daily growth rate was negative in the latest period. The corresponding estimated coefficients are provided in Table 2. In Figure 7, we show the effect of temperature and weight on the estimated daily growth rate. We estimated an optimal temperature for growth at 10.2 °C. We also found an optimal growth rate for expected weight at 202 g.

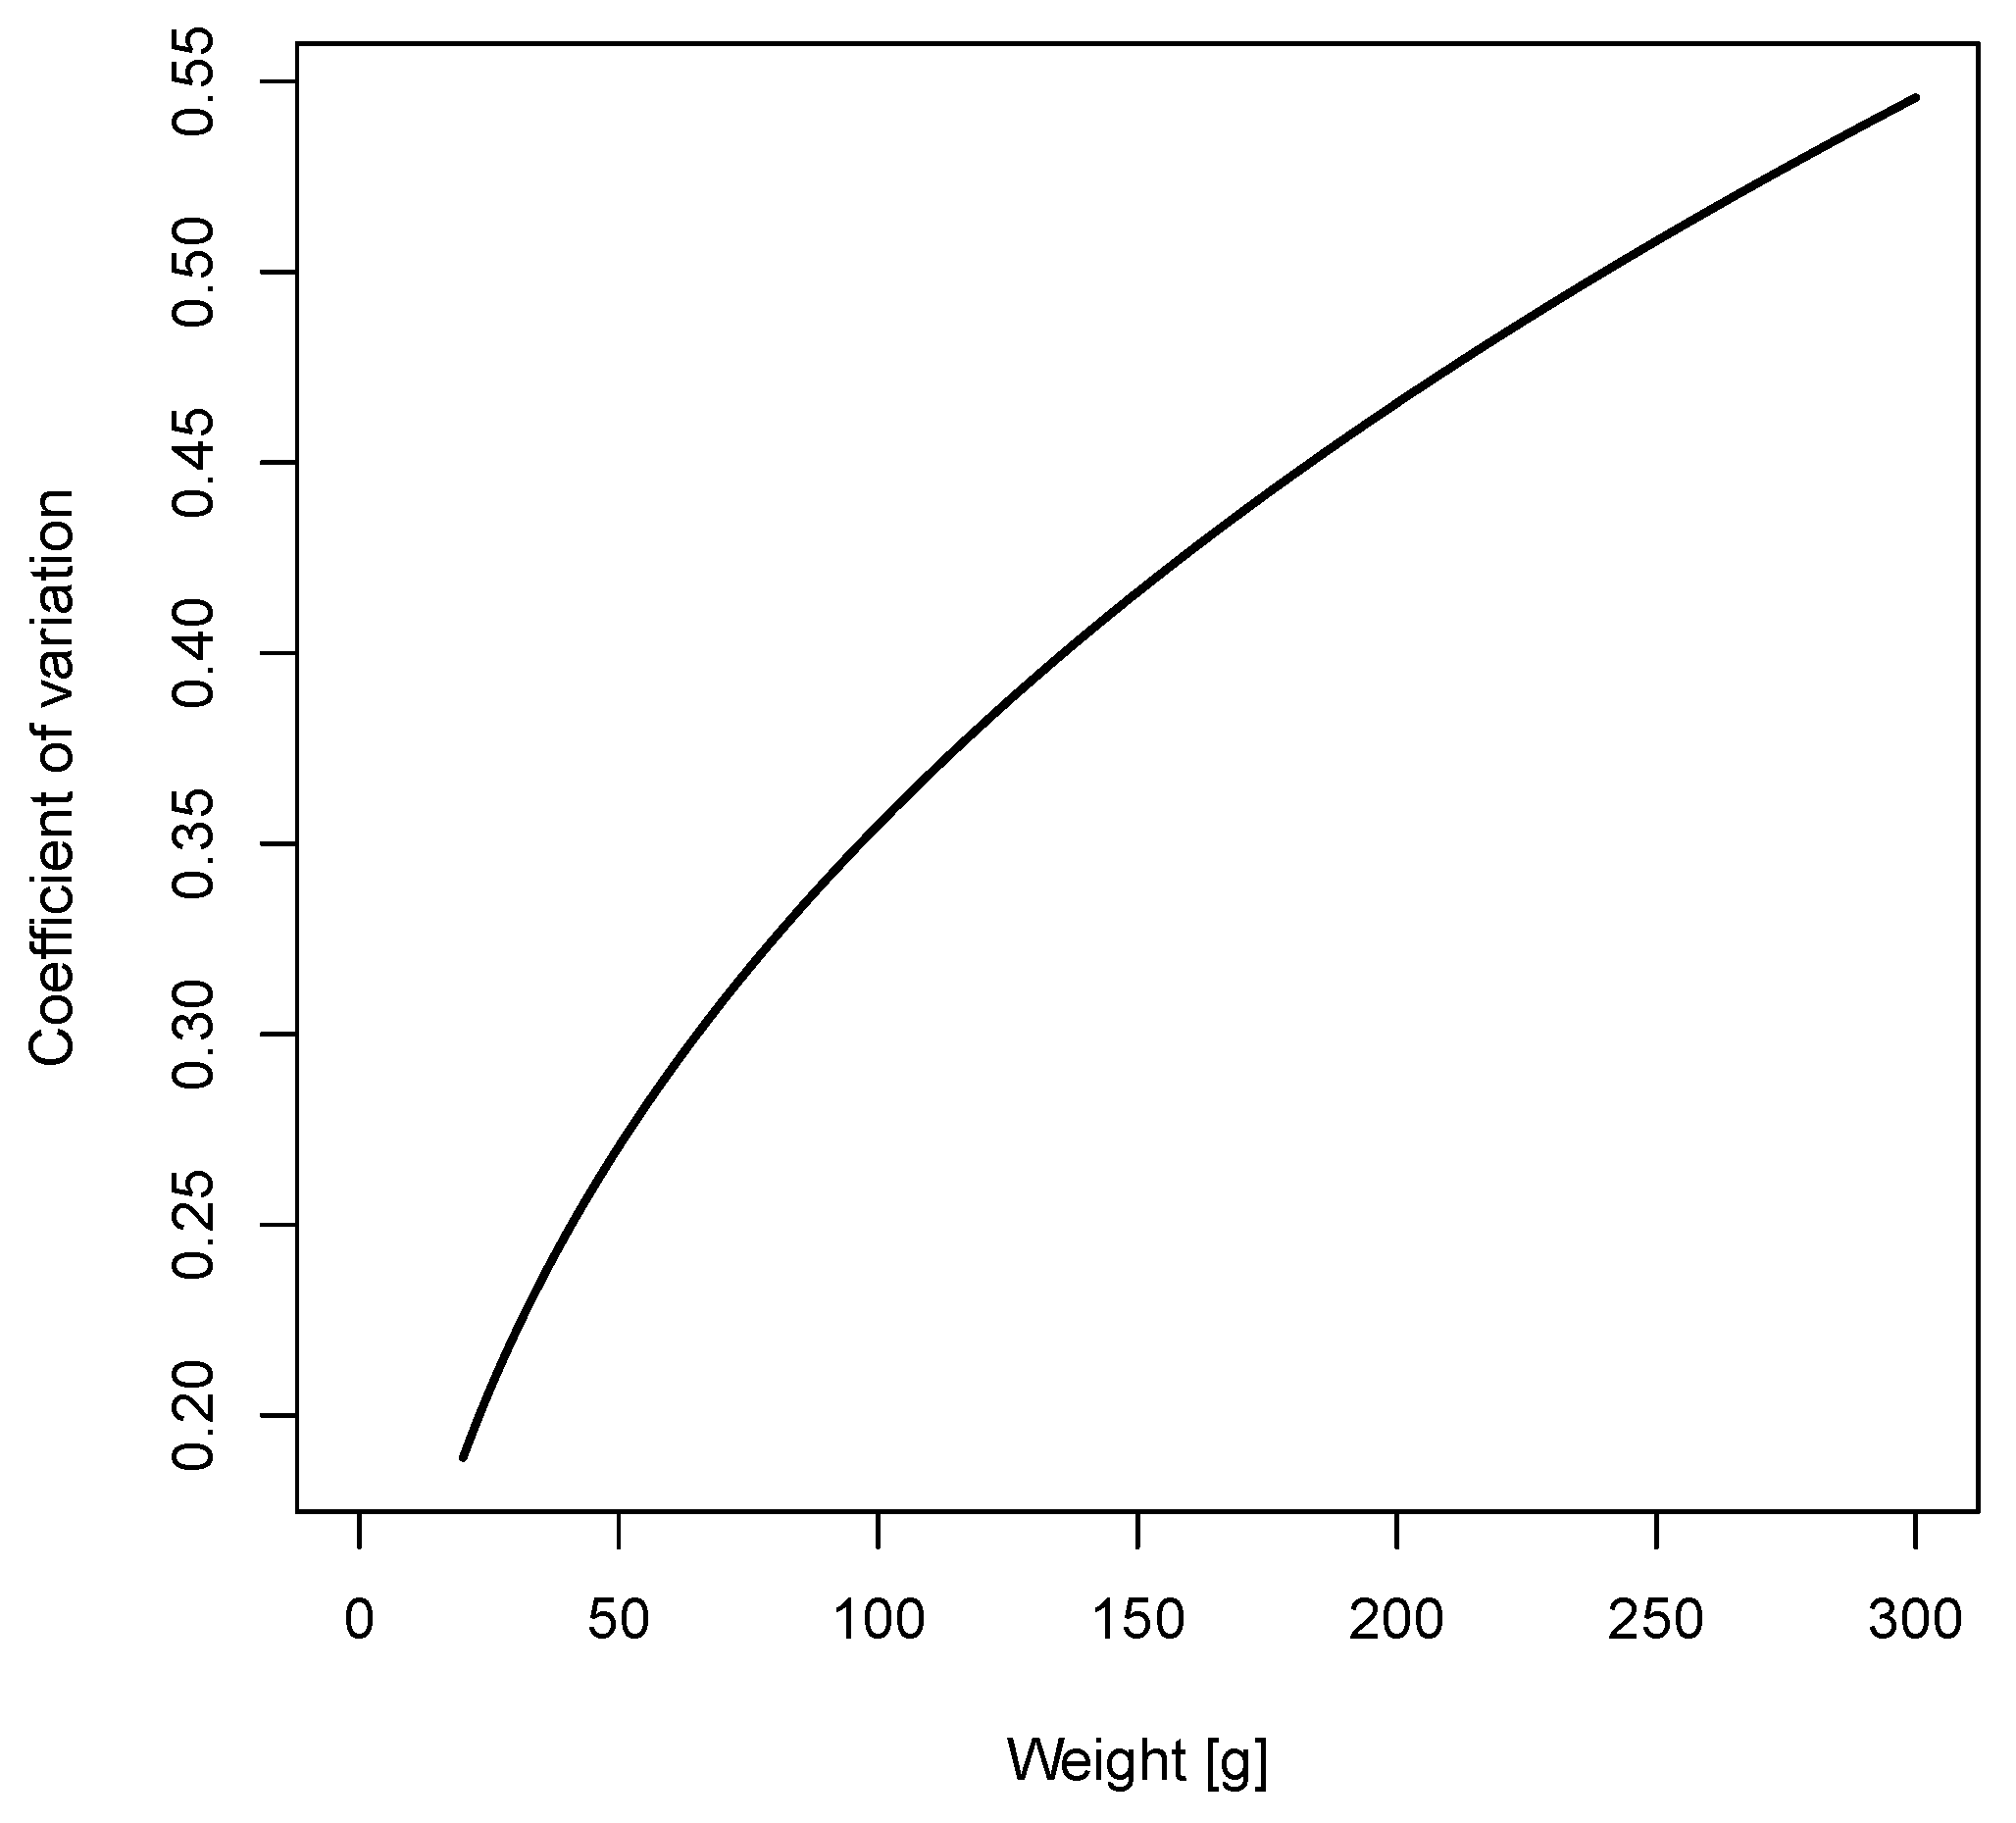
Coefficient of Variation

Note that, since the parameter α 1 in the fitted growth model was significant (c.f. Table 2), there was a clear tendency for the coefficient of variation to increase with expected weight in the commercial lumpfish data. The estimated coefficient of variation, C V ^ , increased with the expected weight, as follows:
C V ^ = 1 / ν ^ = α 0 ^ μ ^ α 1 ^ = 0.0585 μ ^ 0.392 .
This corresponds to a CV of 0.25 for an expected weight of 40 g, a CV of 0.27 for an expected weight of 50 g, a CV of 0.29 for an expected weight of 60 g, and a CV of 0.31 for an expected weight of 70 g. A plot of the estimated coefficient of variation as a function of expected weight is provided in Figure 8.

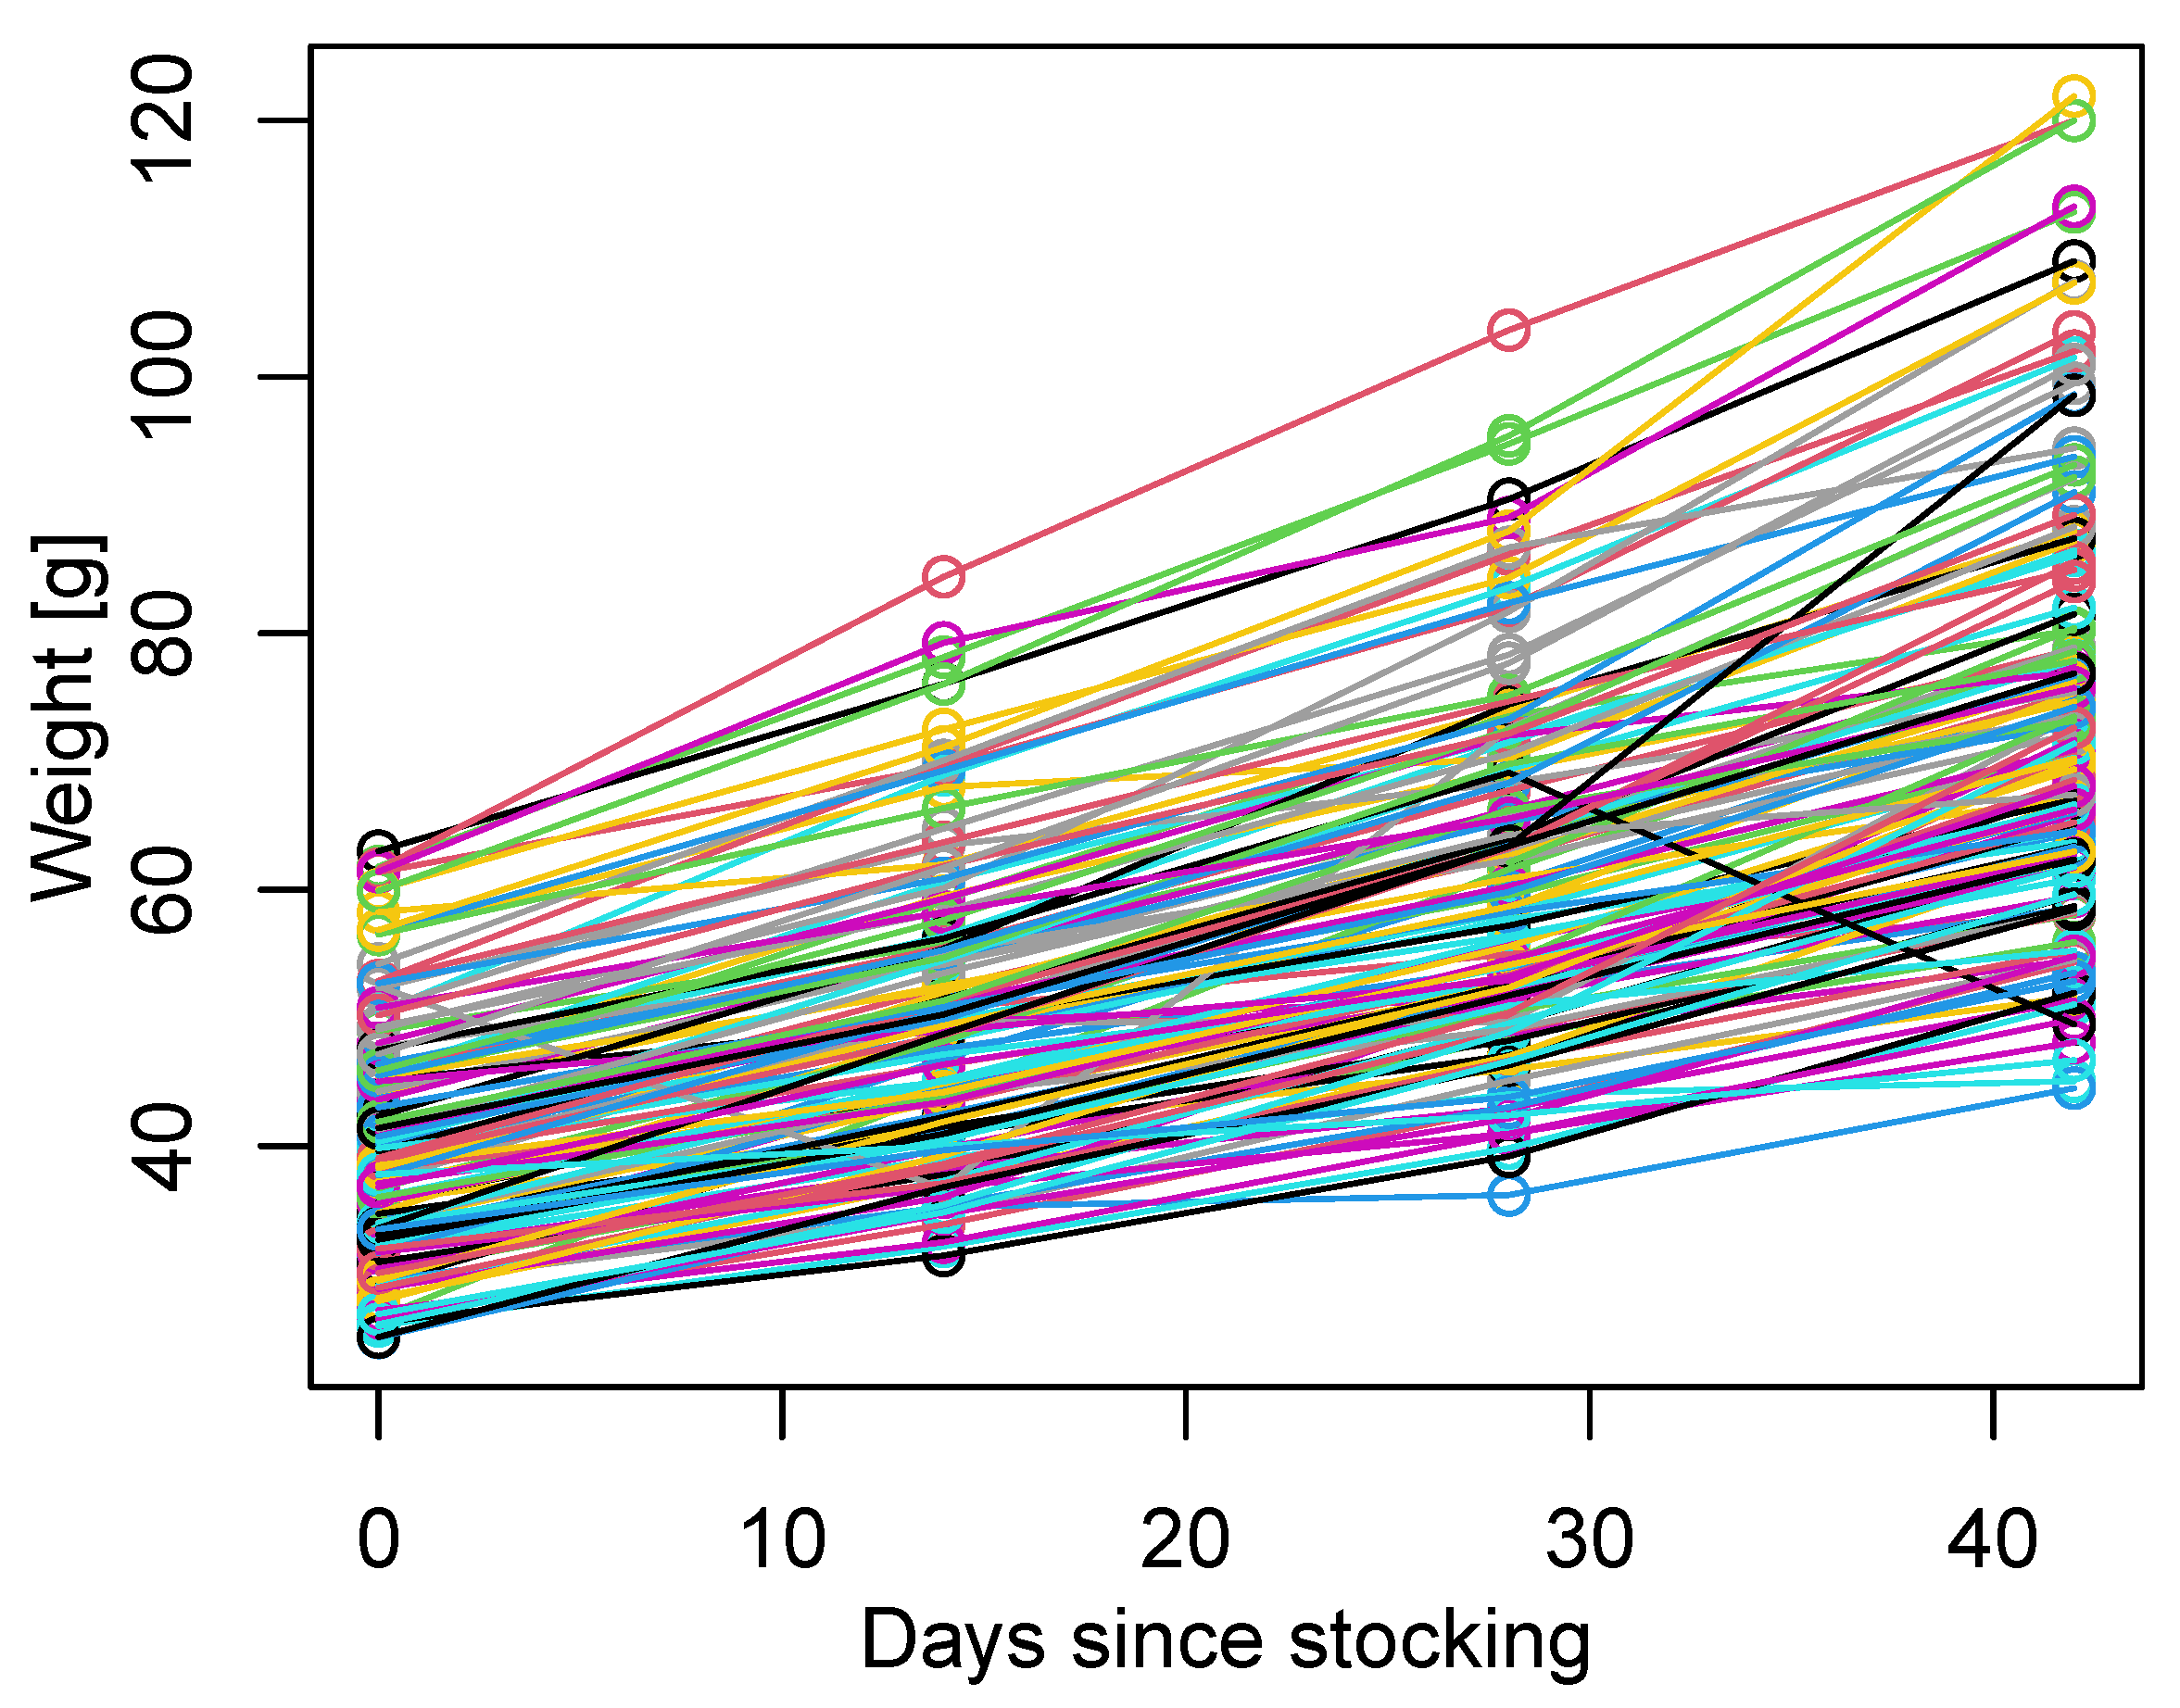
3.2. Individual Time–Series of Weight in the Controlled Tank Experiment

Computing the coefficient of variation for the four sampling time points in the controlled tank experiment resulted in ( 0.23 , 0.22 , 0.22 , 0.23 ) , i.e., a constant coefficient of variation. The mean weight (in g) for the four sampling time points was ( 40.1 , 49.8 , 60.4 , 73.2 ) . Hence, comparing to the coefficient of variation from the fitted model for lumpfish deployed in commercial salmon farm cages, we found a higher coefficient of variation for the lumpfish in salmon farms over time, but similar values for low expected weights.
We compared the fitted growth model to the observed growth in the controlled tank experiment, by assuming a starting weight corresponding to the starting weight of the tank experiment (40.1 g) and a temperature of 7.5 °C, like in the tank experiment. The corresponding expected weights from our fitted model was ( 40.1 , 43.4 , 47.0 , 51.2 ) , that is, much slower growth than that of the individual controlled tank experiment.

4. Discussion

The coefficient of variation for lumpfish weight in salmon farming cages was found to increase with the expected lumpfish weight, as 0.0585 μ 0.392 , for the best model among those investigated. This means that the standard deviation was found to increase faster than the expected weight. Hence, there was a clear heterogeneity in lumpfish growth during production; while some lumpfish did not grow, others tended to grow a lot. Though it is unknown why some lumpfish grow a lot, one probable explanation could be that they start feeding on salmon pellets, as salmon feed has been found to be more prevalent in lumpfish stomach contents of heavier lumpfish [31,41]. As the variance of lumpfish weight increases over time, it is clear that lumpfish weight cannot be used to distinguish between different stocks based on time post deployment in sea cages. If there were a strong correlation between lumpfish weight and number of days since stocking, then lumpfish weight could be used to inform about lumpfish mortality in salmon farm cages. However, this was not the case, as lumpfish weight could not be used to separate between different stocks.
In the controlled tank experiment over 43 days, the coefficient of variation was found to be constant, i.e., the standard deviation was found to be proportional to the expected weight. Note however that the time period for the tank experiment was comparatively short. Interestingly, the coefficient of variation for weight in the controlled tank experiment was lower than that for the lumpfish in the salmon farming cages. A possible reason for this difference is that the standardised conditions in the controlled tank experiment allowed for less heterogeneity in feeding than for lumpfish in salmon farming cages.
In the controlled tank experiment, the estimated growth rate was found to be higher than that for lumpfish in commercial sea cages. A study [39] investigated the effect of fish size and temperature on lumpfish growth rates in tank experiments at 4, 7, 10, 13, and 16 °C. Overall, they found higher growth rates than in the present study, though note that the lumpfish studied in their study were considerably smaller.
In our best fitting model, we found an optimal temperature for growth of 10.2 °C. This is in accordance with the literature, as optimal temperature for growth is known to be a typical characteristic for fish growth [42]. Optimal temperatures for growth were also found in [39], though in their study these optimal temperatures were found to be size-dependent. In the present study, our best fitting model did not include an interaction term between temperature and weight. In [39], the optimal temperature for growth varied from 8.9 °C for lumpfish in the size group 120–200 g to ca. 16 °C for lumpfish of sizes 11–40 g; hence, this is in accordance with the optimal temperature we found in our model of 10.2 °C.
Note that, importantly, the model reported in the present paper should not be used outside the range of measured temperatures (i.e., 4–16 °C). There are studies showing that lumpfish mortality increases when the temperature becomes too low or too high [39,43,44], and for temperatures outside the tolerance range for lumpfish, the growth may be very different. Moreover, a recent study estimated a critical thermal maximum of 20.6 °C for lumpfish acclimated to 6 °C [45]. However, lumpfish would likely not be deployed as cleaner fish in periods with temperatures outside their tolerance range.
Our results suggested highest specific growth rate at a weight of around 200 g, consistent with a sigmoid-shaped growth curve with an inflection point around this size. In comparison, ref. [39] found that specific growth rates of lumpfish under controlled experimental settings decreased with size for all sizes investigated (around 40 to 200 g). A possible reason for this difference is that fish in the commercial cages investigated in our study were able to feed on more profitable diet items as they grew, e.g., salmon feed pellets. As also noted above, salmon feed has been found to be more prevalent in lumpfish stomach contents of heavier lumpfish [31,41].
Several studies report effective cleaning of salmon lice by lumpfish [4,12,30,43,46,47], though there are also examples of studies which find small cleaning effects [3]. Other studies analyse stomach contents of lumpfish, in order to assess different factors associated with salmon lice grazing [33,48]. These studies show large individual variation in salmon lice grazing, with only a small proportion of the lumpfish consuming salmon lice (e.g., 3% of the 25,000 lumpfish studied in [33] were found with lice in their stomach contents). Hence, there is a need for a better understanding of how lumpfish affect salmon lice abundance in salmon farming cages under various conditions.
To further explore the effects of different lumpfish stocking strategies to control salmon lice, scenario simulations are attractive, as large-scale experiments are costly and time-consuming to perform. Such scenario simulations should include the important factors associated with salmon lice grazing by lumpfish. One of the most important factors is lumpfish weight [30,31,32,33,48]. By combining estimates of cleaning effects of lumpfish with estimates of how lumpfish weight develops over time in sea cages, different stocking strategies can be evaluated and compared. Similarly, one should simultaneously account for other important factors for salmon lice grazing, like salmon lice abundance in the sea cages [33].
For simulation purposes (and potentially other applications), a simple, parametric model for lumpfish growth over time is necessary. We provide a model which depends only on temperature and weight. There are, however, likely also other important variables for lumpfish growth in commercial sea cages, like ocean current levels, number of sunlight hours, disease, stress, etc. However, in this paper, we have aimed for a simple model which is appropriate to use in salmon lice infestation models and hence do not take such variables into account.

4.1. Limitations

Unfortunately, we do not have observations of lumpfish weight for the same individuals over time in sea cages during salmon production, which would be the ideal type of data for estimating growth rates of lumpfish after deployment. This is because the data were collected for other main purposes. Collecting such data is resource-demanding; hence, we consider the present dataset as a valuable alternative for studying growth of lumpfish used as cleaner fish in salmon farming cages.
Ideally, one should study lumpfish from a wide range of salmon farms and over time, as the transferability of our results to other settings depends on whether the conditions in these two specific salmon farms in these specific years are representative for a general (Norwegian) salmon farm. Weight increase will depend on multiple factors which we have not accounted for in our model, like feeding strategy and type, and (potentially size-dependent) lumpfish mortality. In these two productions, the registered mortality during production was 4382 out of a total of 19,684 tagged lumpfish at Nausttaren (22%), and 4215 out of a total of 30,708 lumpfish at Kråkholmen (14%). Note that the mortality is likely higher than the registered mortality, as it is unlikely that all the dead fish were accounted for.
Moreover, applying the model outside the range of temperatures (4–16 °C) and population weights (44 to ca. 300 g) observed should be performed with caution, as we have no way of validating the model outside this range. Note that the model was for the population means, while the individual weights will be spread around this population mean. One option is to extrapolate the estimated effects with flat functions, i.e., letting the estimates be equal to the edges. For example, this would mean assuming that the daily growth rate for a population weight of 30 g would equal that for a population weight of 44 g.

4.2. Future Work

Future work should combine the results of lumpfish growth and estimates of weight-dependent cleaning efficacy for lumpfish to simulate the development of salmon lice over time for different lumpfish stocking strategies. Such models would also need to consider how salmon lice abundance affects cleaning efficacy. Such scenario simulations are interesting and important for the fish farmers, as there is limited insight into how different lumpfish stocking strategies contribute to salmon lice control. As pointed out in [3,49], the commercial salmon farming industry needs a stronger evidence base to guide targeted cleaning fish strategies.

5. Conclusions

The best-fitting model for weight development of lumpfish was found to be a quadratic function of temperature and weight, suggesting a maximum specific growth rate at a temperature around 10 °C and a weight around 200 g. We found heterogeneous growth for lumpfish in salmon farming cages, where the coefficient of variation for lumpfish weight increased over time; while some lumpfish steadily gained weight, others appeared not to grow. The model fitted in the present study will be an important ingredient in models of salmon lice development in farms with cleaner fish present, as lumpfish weight has been shown to be an important factor for sea lice grazing. Hence, the model can be used to obtain more realistic modelling of the effect of lumpfish in controlling salmon lice infestations in fish farms, which could again be used to compare different lumpfish stocking strategies through simulations.

Supplementary Materials

The following Supplementary Materials can be downloaded at: https://www.mdpi.com/article/10.3390/fishes9090336/s1, Data S1: lumpfish weight data; Table S1: detailed weight information for each sampling date.

Author Contributions

Conceptualization, S.E., M.A., F.R.S., E.B., L.C.S. and P.A.J.; methodology, S.E., M.A., L.C.S. and P.A.J.; formal analysis, S.E. and M.A.; investigation, S.E., M.A., L.C.S. and P.A.J.; data curation, F.R.S. and E.B.; writing—original draft preparation, S.E., M.A., F.R.S. and P.A.J.; writing—review and editing, S.E., M.A., F.R.S., E.B., L.C.S. and P.A.J.; visualization, S.E. and M.A. All authors have read and agreed to the published version of the manuscript.

Funding

This research was funded by the Norwegian Seafood Research Fund [Rensefiskbetingelser project 901766] and Bjørøya AS [project CycLus, NTF36-37].

Institutional Review Board Statement

The animal study protocol was approved by the Norwegian Food Safety Authority (FDU 25536).

Informed Consent Statement

Not applicable.

Data Availability Statement

The individual weight data of tagged lumpfish from commercial farms used in the main analysis of this paper are provided in the Supplementary Materials. The data contain the following information: cage, sampling date, weight measured in g, fish farm, lumpfish stocking date, number of days since lumpfish stocking, and number of day-degrees since lumpfish stocking.

Conflicts of Interest

The authors declare no conflicts of interest. The work was funded by Bjørøya AS, where one of the authors, Eskil Bendiksen, is affiliated. He participated in the design of the study; in the collection of data, and in the writing of the manuscript. He did not participate in the modelling of the data or in the decision to publish the results. The remaining authors declare that the research was conducted in the absence of any commercial or financial relationships that could be construed as a potential conflict of interest.

References

  1. Powell, A.; Treasurer, J.W.; Pooley, C.L.; Keay, A.J.; Lloyd, R.; Imsland, A.K.; Garcia de Leaniz, C. Use of lumpfish for sea-lice control in salmon farming: Challenges and opportunities. Rev. Aquac. 2018, 10, 683–702. [Google Scholar] [CrossRef]
  2. Brooker, A.J.; Papadopoulou, A.; Gutierrez, C.; Rey, S.; Davie, A.; Migaud, H. Sustainable production and use of cleaner fish for the biological control of sea lice: Recent advances and current challenges. Vet. Rec. 2018, 183, 383. [Google Scholar] [CrossRef] [PubMed]
  3. Barrett, L.T.; Overton, K.; Stien, L.H.; Oppedal, F.; Dempster, T. Effect of cleaner fish on sea lice in Norwegian salmon aquaculture: A national scale data analysis. Int. J. Parasitol. 2020, 50, 787–796. [Google Scholar] [CrossRef]
  4. Imsland, A.K.; Reynolds, P.; Eliassen, G.; Hangstad, T.A.; Foss, A.; Vikingstad, E.; Elvegård, T.A. The use of lumpfish (Cyclopterus lumpus L.) to control sea lice (Lepeophtheirus salmonis Krøyer) infestations in intensively farmed Atlantic salmon (Salmo salar L.). Aquaculture 2014, 424, 18–23. [Google Scholar] [CrossRef]
  5. Imsland, A.K.; Reynolds, P.; Eliassen, G.; Hangstad, T.A.; Jónsdóttir, O.D.; Elvegård, T.A.; Lemmens, S.C.; Rydland, R.; Nytrø, A.V. Investigation of behavioural interactions between lumpfish (Cyclopterus lumpus) and goldsinny wrasse (Ctenolabrus rupestris) under controlled conditions. Aquac. Int. 2016, 24, 1509–1521. [Google Scholar] [CrossRef]
  6. Fiskeridirektoratet. Utsett av Rensefisk 1998–2021-Publ. 13 October 2022. Available online: https://www.fiskeridir.no/Akvakultur/Tall-og-analyse/Akvakulturstatistikk-tidsserier/Rensefisk/ (accessed on 14 February 2023).
  7. Whittaker, B.A.; Consuegra, S.; de Leaniz, C.G. Genetic and phenotypic differentiation of lumpfish (Cyclopterus lumpus) across the North Atlantic: Implications for conservation and aquaculture. PeerJ 2018, 6, e5974. [Google Scholar] [CrossRef]
  8. Davenport, J.; Thorsteinsson, V. Sucker action in the lumpsucker cyclopterus Lumpus L. Sarsia 1990, 75, 33–42. [Google Scholar] [CrossRef]
  9. Ingólfsson, A.; Kristjánsson, B.K. Diet of juvenile lumpsucker Cyclopterus lumpus (Cyclopteridae) in floating seaweed: Effects of ontogeny and prey availability. Copeia 2002, 2002, 472–476. [Google Scholar] [CrossRef]
  10. Eriksen, E.; Durif, C.M.; Prozorkevich, D. Lumpfish (Cyclopterus lumpus) in the Barents Sea: Development of biomass and abundance indices, and spatial distribution. ICES J. Mar. Sci. 2014, 71, 2398–2402. [Google Scholar] [CrossRef]
  11. Davenport, J. Synopsis of Biological Data on the Lumpsucker, Cyclopterus lumpus (Linnaeus, 1758); Number 147; Food & Agriculture Org.: Rome, Italy, 1985. [Google Scholar]
  12. Imsland, A.K.; Reynolds, P.; Eliassen, G.; Hangstad, T.A.; Nytrø, A.V.; Foss, A.; Vikingstad, E.; Elvegård, T.A. Notes on the behaviour of lumpfish in sea pens with and without Atlantic salmon present. J. Ethol. 2014, 32, 117–122. [Google Scholar] [CrossRef]
  13. Staven, F.R.; Gesto, M.; Iversen, M.H.; Andersen, P.; Patel, D.M.; Nordeide, J.T.; Kristensen, T. Cohabitation with Atlantic Salmon (Salmo salar) Affects Brain Neuromodulators but Not Welfare Indicators in Lumpfish (Cyclopterus lumpus). Front. Physiol. 2022, 13, 781519. [Google Scholar] [CrossRef] [PubMed]
  14. Walde, C.S.; Stormoen, M.; Pettersen, J.M.; Persson, D.; Røsæg, M.V.; Jensen, B.B. How delousing affects the short-term growth of Atlantic salmon (Salmo salar). Aquaculture 2022, 561, 738720. [Google Scholar] [CrossRef]
  15. Parsons, A.E.; Escobar-Lux, R.H.; Sævik, P.N.; Samuelsen, O.B.; Agnalt, A.L. The impact of anti-sea lice pesticides, azamethiphos and deltamethrin, on European lobster (Homarus gammarus) larvae in the Norwegian marine environment. Environ. Pollut. 2020, 264, 114725. [Google Scholar] [CrossRef]
  16. Boissonnot, L.; Karlsen, C.; Reynolds, P.; Austad, M.; Stensby-Skjærvik, S.; Remen, M.; Imsland, A.K. Welfare and survival of lumpfish (Cyclopterus lumpus) in Norwegian commercial Atlantic salmon (Salmo salar) production. Aquaculture 2023, 572, 739496. [Google Scholar] [CrossRef]
  17. Haugland, G.T.; Olsen, A.B.; Rønneseth, A.; Andersen, L. Lumpfish (Cyclopterus lumpus L.) develop amoebic gill disease (AGD) after experimental challenge with Paramoeba perurans and can transfer amoebae to Atlantic salmon (Salmo salar L.). Aquaculture 2017, 478, 48–55. [Google Scholar] [CrossRef]
  18. Sandlund, N.; Rønneseth, A.; Ellul, R.M.; Nylund, S.; Sandlund, L. Pasteurella spp. Infections in Atlantic salmon and lumpsucker. J. Fish Dis. 2021, 44, 1201–1214. [Google Scholar] [CrossRef]
  19. Garcia de Leaniz, C.; Gutierrez Rabadan, C.; Barrento, S.I.; Stringwell, R.; Howes, P.N.; Whittaker, B.A.; Minett, J.F.; Smith, R.G.; Pooley, C.L.; Overland, B.J.; et al. Addressing the welfare needs of farmed lumpfish: Knowledge gaps, challenges and solutions. Rev. Aquac. 2022, 14, 139–155. [Google Scholar] [CrossRef]
  20. Gutierrez-Rabadan, C.; Spreadbury, C.; Consuegra, S.; de Leaniz, C.G. Development, validation and testing of an Operational Welfare Score Index for farmed lumpfish Cyclopterus lumpus L. Aquaculture 2021, 531, 735777. [Google Scholar] [CrossRef]
  21. Eliasen, K.; Patursson, E.J.; McAdam, B.J.; Pino, E.; Morro, B.; Betancor, M.; Baily, J.; Rey, S. Liver colour scoring index, carotenoids and lipid content assessment as a proxy for lumpfish (Cyclopterus lumpus L.) health and welfare condition. Sci. Rep. 2020, 10, 8927. [Google Scholar] [CrossRef]
  22. Imsland, A.K.; Reynolds, P.; Jonassen, T.M.; Hangstad, T.A.; Elvegård, T.A.; Urskog, T.C.; Mikalsen, B. Effects of three commercial diets on growth, cataract development and histopathology of lumpfish (Cyclopterus lumpus L.). Aquac. Res. 2018, 49, 3131–3141. [Google Scholar] [CrossRef]
  23. Imsland, A.K.; Reynolds, P.; Jonassen, T.M.; Hangstad, T.A.; Elvegård, T.A.; Urskog, T.C.; Hanssen, A.; Mikalsen, B. Effects of different feeding frequencies on growth, cataract development and histopathology of lumpfish (Cyclopterus lumpus L.). Aquaculture 2019, 501, 161–168. [Google Scholar] [CrossRef]
  24. Imsland, A.K.; Reynolds, P.; Hangstad, T.A.; Jónsdóttir, Ó.D.; Noble, T.; Wilson, M.; Mackie, J.A.; Elvegård, T.A.; Urskog, T.C.; Mikalsen, B. Feeding behaviour and growth of lumpfish (Cyclopterus lumpus L.) fed with feed blocks. Aquac. Res. 2018, 49, 2006–2012. [Google Scholar] [CrossRef]
  25. Imsland, A.K.; Reynolds, P.; Lorentzen, M.; Eilertsen, R.A.; Micallef, G.; Tvenning, R. Improving survival and health of lumpfish (Cyclopterus lumpus L.) by the use of feed blocks and operational welfare indicators (OWIs) in commercial Atlantic salmon cages. Aquaculture 2020, 527, 735476. [Google Scholar] [CrossRef]
  26. Klakegg, Ø.; Myhren, S.; Juell, R.A.; Aase, M.; Salonius, K.; Sørum, H. Improved health and better survival of farmed lumpfish (Cyclopterus lumpus) after a probiotic bath with two probiotic strains of Aliivibrio. Aquaculture 2020, 518, 734810. [Google Scholar] [CrossRef]
  27. Blackwell, B.G.; Brown, M.L.; Willis, D.W. Relative weight (Wr) status and current use in fisheries assessment and management. Rev. Fish. Sci. 2000, 8, 1–44. [Google Scholar] [CrossRef]
  28. Bolger, T.; Connolly, P. The selection of suitable indices for the measurement and analysis of fish condition. J. Fish Biol. 1989, 34, 171–182. [Google Scholar] [CrossRef]
  29. Le Cren, E.D. The length-weight relationship and seasonal cycle in gonad weight and condition in the perch (Perca fluviatilis). J. Anim. Ecol. 1951, 20, 201–219. [Google Scholar] [CrossRef]
  30. Imsland, A.K.; Reynolds, P.; Nytrø, A.V.; Eliassen, G.; Hangstad, T.A.; Jónsdóttir, Ó.D.; Emaus, P.A.; Elvegård, T.A.; Lemmens, S.C.; Rydland, R.; et al. Effects of lumpfish size on foraging behaviour and co-existence with sea lice infected Atlantic salmon in sea cages. Aquaculture 2016, 465, 19–27. [Google Scholar] [CrossRef]
  31. Eliasen, K.; Danielsen, E.; Johannesen, Á.; Joensen, L.L.; Patursson, E.J. The cleaning efficacy of lumpfish (Cyclopterus lumpus L.) Faroese salmon (Salmo salar L.) farming pens in relation to lumpfish size and seasonality. Aquaculture 2018, 488, 61–65. [Google Scholar] [CrossRef]
  32. Imsland, A.K.D.; Reynolds, P.; Hangstad, T.A.; Kapari, L.; Maduna, S.N.; Hagen, S.B.; Jónsdóttir, Ó.D.B.; Spetland, F.; Lindberg, K.S. Quantification of grazing efficacy, growth and health score of different lumpfish (Cyclopterus lumpus L.) families: Possible size and gender effects. Aquaculture 2021, 530, 735925. [Google Scholar] [CrossRef]
  33. Engebretsen, S.; Aldrin, M.; Qviller, L.; Stige, L.C.; Rafoss, T.; Danielsen, O.R.; Lindhom, A.; Jansen, P.A. Salmon lice (Lepeophtheirus salmonis) in the stomach contents of lumpfish (Cyclopterus lumpus) sampled from Norwegian fish farms: Relationship between lice grazing and operational conditions. Aquaculture 2023, 563, 738967. [Google Scholar] [CrossRef]
  34. Aldrin, M.; Huseby, R.B.; Stien, A.; Grøntvedt, R.N.; Viljugrein, H.; Jansen, P.A. A stage-structured Bayesian hierarchical model for salmon lice populations at individual salmon farms–Estimated from multiple farm data sets. Ecol. Model. 2017, 359, 333–348. [Google Scholar] [CrossRef]
  35. Aldrin, M.; Jansen, P.; Stryhn, H. A partly stage-structured model for the abundance of salmon lice in salmonid farms. Epidemics 2019, 26, 9–22. [Google Scholar] [CrossRef]
  36. BarentsWatch. Norwegian Fish Health. 2023. Available online: https://www.barentswatch.no/en (accessed on 15 September 2022).
  37. R Core Team. R: A Language and Environment for Statistical Computing; R Foundation for Statistical Computing: Vienna, Austria, 2024. [Google Scholar]
  38. W, S.B. Density Estimation; Chapman and Hall: Boca Raton, FL, USA, 1986. [Google Scholar]
  39. Nytrø, A.V.; Vikingstad, E.; Foss, A.; Hangstad, T.A.; Reynolds, P.; Eliassen, G.; Elvegård, T.A.; Falk-Petersen, I.B.; Imsland, A.K. The effect of temperature and fish size on growth of juvenile lumpfish (Cyclopterus lumpus L.). Aquaculture 2014, 434, 296–302. [Google Scholar] [CrossRef]
  40. Claeskens, G.; Hjort, N.L. Model Selection and Model Averaging; Cambridge University Press: Cambridge, UK, 2008. [Google Scholar]
  41. Roy, J.L.; Boulding, E.G. Comparison of DNA metabarcoding and morphological diet analysis of lumpfish (Cyclopterus lumpus) as methods of estimating sea lice cleaning efficacy inside commercial Atlantic salmon (Salmo salar) sea cages. Aquaculture 2024, 586, 740817. [Google Scholar] [CrossRef]
  42. Jobling, M. Temperature and growth: Modulation of growth rate via temperature. In Global Warming: Implication for Freshwater and Marine Fish; Cambridge University Press: Cambridge, UK, 1997; pp. 225–253. [Google Scholar] [CrossRef]
  43. Imsland, A.K.D.; Hanssen, A.; Nytrø, A.V.; Reynolds, P.; Jonassen, T.M.; Hangstad, T.A.; Elvegård, T.A.; Urskog, T.C.; Mikalsen, B. It works! Lumpfish can significantly lower sea lice infestation in large-scale salmon farming. Biol. Open 2018, 7, bio036301. [Google Scholar] [CrossRef] [PubMed]
  44. Hvas, M.; Folkedal, O.; Imsland, A.; Oppedal, F. Metabolic rates, swimming capabilities, thermal niche and stress response of the lumpfish, Cyclopterus lumpus. Biol. Open 2018, 7, bio036079. [Google Scholar] [CrossRef] [PubMed]
  45. Eisenberg, R.M.; Sandrelli, R.M.; Gamperl, A.K. Comparing methods for determining the metabolic capacity of lumpfish (Cyclopterus lumpus Linnaeus 1758). J. Fish Biol. 2024, 104, 787–796. [Google Scholar] [CrossRef]
  46. Imsland, A.K.; Reynolds, P.; Eliassen, G.; Hangstad, T.A.; Nytrø, A.V.; Foss, A.; Vikingstad, E.; Elvegård, T.A. Assessment of growth and sea lice infection levels in Atlantic salmon stocked in small-scale cages with lumpfish. Aquaculture 2014, 433, 137–142. [Google Scholar] [CrossRef]
  47. Imsland, A.K.D.; Reynolds, P. In lumpfish We Trust? The Efficacy of Lumpfish Cyclopterus lumpus to Control Lepeophtheirus salmonis Infestations on Farmed Atlantic Salmon: A Review. Fishes 2022, 7, 220. [Google Scholar] [CrossRef]
  48. Boissonnot, L.; Engebretsen, S.; Aldrin, M. Kondisjonsfaktor hos rognkjeks. Nor. Fiskeoppdrett 2022, 4, 62–65. [Google Scholar]
  49. Overton, K.; Barrett, L.T.; Oppedal, F.; Kristiansen, T.S.; Dempster, T. Sea lice removal by cleaner fish in salmon aquaculture: A review of the evidence base. Aquac. Environ. Interact. 2020, 12, 31–44. [Google Scholar] [CrossRef]
Figure 1. Timeline of deployment dates and sampling time points for the different stocks and the two localities. The sampling time points are plotted as vertical, dashed lines. The deployment dates are plotted as coloured, horizontal lines, where the colour indicates the tag colour for the respective stocks. The horizontal lines end at the last sampling time point. Nausttaren is to the left of the figure, and Kråkholmen to the right.
Fishes 09 00336 g001
Figure 2. Temperature development. Weekly locality temperatures for the relevant time period for (a) Nausttaren and (b) Kråkholmen.
Fishes 09 00336 g002
Figure 3. Individual weight series. The individual time–series of lumpfish weight measurements in a controlled tank experiment over 43 days. The points correspond to the observations, while the lines correspond to linear interpolations between the observation points.
Fishes 09 00336 g003
Figure 4. Weight density at Nausttaren. Estimated density curves for the different sampling times for each tag colour for the lumpfish. The blue lumpfish were deployed 2 September 2019. The purple-tagged lumpfish were deployed 14 November 2019 and the orange-tagged lumpfish were deployed 21 April 2020. The legend shows the number of days since deployment at sea.
Fishes 09 00336 g004
Figure 5. Weight density at Kråkholmen. Estimated density curves for the different sampling times for each tag colour for the lumpfish. The red- and green-tagged lumpfish (here, both are coloured red) were deployed 2 November 2020, and the purple-tagged lumpfish were deployed on 15 January 2021. The legend shows the number of days since deployment at sea.
Fishes 09 00336 g005
Figure 6. Weight and growth rate versus time. The left panels show the observed weight versus days since stocking for all the five different stocks, together with the estimated expected weight development provided in black and 95% confidence bands for individual observations provided in orange. Note that we do not include the uncertainty in the estimated coefficients in the orange confidence bands. The right panels show the corresponding estimated daily growth rates and the temperature curves.
Fishes 09 00336 g006
Figure 7. Estimated daily growth rate versus temperature and weight. The left panel shows the estimated effect of temperature for weights 30 g and 80 g from the fitted model for lumpfish growth in commercial sea cages. The right panel shows the estimated effect of weight for temperatures 6 °C and 12 °C.
Fishes 09 00336 g007
Figure 8. Coefficient of variation. The estimated coefficient of variation for the best fitting model with a non-constant coefficient of variation as a function expected weight.
Fishes 09 00336 g008
Table 1. Differences in AIC. AIC values for the estimated models, relative to the best model. Δ AIC denotes the difference between the AIC of the respective model and the best model. The table is sorted by AIC, such that the best model is the first row of the table. “x” marks that the variable is present in the model, while “-” marks non-presence.
TT2WW2WTCV Δ AIC
xxxx-Non-constant0
xxxxxNon-constant0.4
x-xx-Non-constant2.2
x-xxxNon-constant2.5
xxx--Non-constant9.0
x-x--Non-constant11.2
xxxx-Constant84.2
Table 2. Parameter estimates. Fitted regression model for the best model in terms of AIC. Here β 0 is the intercept, β 1 is the effect of temperature, β 2 is the effect of weight, β 3 is the effect of temperature squared (Temperature2), and β 4 is the effect weight squared (Weight2). The μ 0 , s are the estimated starting weights for the five different stocks. The parameters α 0 and α 1 are related to the coefficient of variation. The p-values are for the test of whether these are significantly different from 0 and are omitted for the parameters where this test is meaningless.
CovariateParameterEstimateStandard Errorp-Value
Start weight stock 1 μ 0 , 1 77.29.35-
Start weight stock 2 μ 0 , 2 60.82.24-
Start weight stock 3 μ 0 , 3 85.63.62-
Start weight stock 4 μ 0 , 4 44.81.84-
Start weight stock 5 μ 0 , 5 48.53.92-
Intercept β 0 −0.01970.00325-
Temperature β 1 0.004720.000629<0.001
Weight β 2 7.13 · 10 5 2.77 · 10 5 0.00997
Temperature2 β 3 0.000226 4.26 · 10 5 <0.001
Weight2 β 4 1.76 · 10 7 6.41 · 10 8 0.00592
Variance parameter α 0 0.003420.00155-
Variance parameter α 1 0.7830.0925<0.001
Disclaimer/Publisher’s Note: The statements, opinions and data contained in all publications are solely those of the individual author(s) and contributor(s) and not of MDPI and/or the editor(s). MDPI and/or the editor(s) disclaim responsibility for any injury to people or property resulting from any ideas, methods, instructions or products referred to in the content.

