Article

The Effects of Water Flow Speed on Swimming Capacity and Energy Metabolism in Adult Amur Grayling (Thymallus grubii)

1
College of Life Science and Technology, Harbin Normal University, Harbin 150025, China
2
National Fishery Resources and Environment Fuyuan Observation Experimental Station, Heilongjiang River Basin Fishery Resources and Environment Scientific Observation Experimental Station, Heilongjiang River Fishery Research Institute, Chinese Academy of Fishery Sciences, Harbin 150070, China
3
College of Fisheries and Life Science, Dalian Ocean University, Dalian 116023, China
4
College of Fisheries and Life Science, Shanghai Ocean University, Shanghai 201306, China
*
Authors to whom correspondence should be addressed.
Fishes 2024, 9(7), 272; https://doi.org/10.3390/fishes9070272
Submission received: 10 June 2024 / Revised: 4 July 2024 / Accepted: 8 July 2024 / Published: 10 July 2024
(This article belongs to the Section Biology and Ecology)

Abstract

:
The present study aimed to explore whether water flow velocity could affect the swimming ability and overall energy metabolism of wild Amur grayling (Thymallus grubii). Swimming performance was assessed by measuring critical swimming speed (Ucrit), burst speed (Uburst), and oxygen consumption rate (MO2) based on the stepped velocity test method. Our results showed that the absolute values of Ucrit and Uburst tended to increase with body length. In contrast, the relative values of Ucrit and Uburst tended to decrease and increase, respectively. MO2 in Amur grayling was elevated with increasing velocity, suggesting relatively high swimming efficiency. We also measured the biochemical indices related to energy metabolism. Lactate dehydrogenase, hexokinase, and pyruvate kinase activities significantly increased (p < 0.05). Hepatic glycogen, glucose, and muscle glycogen contents decreased with the increasing trend of velocity (p < 0.05), the lactic acid contents of the blood and muscles increased significantly with the increase in velocities (p < 0.05), and changes in creatine phosphate content showed no significant difference (p > 0.05). The results not only denote the relationship between body size and swimming speed but also show the effects of water flow velocity on energy metabolism in Amur grayling. The results provide basic data for the construction of fish passage.
Key Contribution: Our study provides the first assessment insights for the swimming performance and physiological metabolism status of wild adult Amur grayling, which contribute to the design scheme for fish migration passage and shed light on conservation strategies to maintain wild populations of Amur grayling.

1. Introduction

Swimming performance is one of the crucial factors related to survival in aquatic organisms [1,2]. There is growing evidence that most freshwater fish species undertake migration [3]. Migrating fish species with different swimming capacities and energy metabolism efficiency show obvious differences in their ability to pass obstacles in habitats including culverts, fish ladders, and waterways. Therefore, it is important to gather data on the swimming performance of fish to facilitate the management of migration pathways [4].
The most common assessment standard for swimming capacity is critical swimming speed (Ucrit) [5]. Although arguably less informative than other speed definitions in terms of swimming physiology and swimming speeds in the wild, Ucrit gives a good estimate of swimming capacity in general as it includes aerobic and anaerobic swimming [6]. In many fish, burst swimming speed (Uburst) is useful to avoid predator attack, acquire food, and escape from trawls [7]. It is generally accepted that burst swimming is performed anaerobically and it can only be maintained for a short period of 15–20 s [8]. Ucrit is used to determine the waterway entrance velocity set maximum flow in the fishway and reflects the highest speed attainable [9,10].
The most important factor related to the adaptation to environmental conditions is the energy metabolism process [11]. Fish metabolism is affected by many ecological factors [12]. Stimulation caused by changing hydraulic factors lead to behavioral response alteration in fish, which can cause significant metabolic changes [13]. The energy expenditure during locomotion is further influenced by the swimming velocity of fish. Changes in the activities of the principal carbohydrate metabolism enzymes, glucose, lactate, and glycogen, are widely reported as indicators of modulations in energy metabolism [14].
Amur grayling (Thymallus grubii) is an economically important cold freshwater fish with high nutritional and commercial value [15]. Thymallus belongs to the order Salmoniformes, the family Salmonidae, and the subfamily Thymallinae [16]. Wild populations utilize streams and rivers year-round during all life stages and migrate to access other lotic habitats that can be used for spawning, feeding, and over-wintering [17]. The population of T. grubii has declined sharply over the past few decades because of overfishing, environmental pollution, and other human disturbances [18]. The development of water conservation projects (reservoirs and dam construction) has changed the spawning, feeding, and overwintering environment of fish, which affects reproduction and survival conditions [19,20]. As a result, the Amur grayling has been listed as an endangered species in the “China Red Data Book of Endangered Animals” [21]. Presently, the morphology, growth, resource status, and population genetic structure of the Amur grayling have been adequately provided [22,23], while few studies have evaluated the swimming performance and energy metabolism level of adult T. grubii under different body lengths and water flow speeds. The objective of this study was to perform an assessment of the swimming capability and oxygen consumption rate (MO2) of Thymallus grubii using a swimming respirometer. A secondary objective was to investigate the differences in energy metabolism changes by testing the key enzymes and biochemical substances between flow speeds. Our study contributes to the design strategy of fish passages and sheds light on conservation biology development to maintain wild populations of T. grubii.

2. Materials and Methods

2.1. Experimental Fish

The experiments complied with animal care laws and guidelines (Directive 2010(63)EU); all procedures were approved by the Laboratory Animal Ethics Committee of Heilongjiang River Fisheries Research Institute (No. 20210910-001).
All experimental fish were obtained from Fuyuan City (China). They were transported into aerated bags and then sent to the Heilongjiang River Fisheries Research Institute (Harbin, China). To eliminate transport stress, all fish were acclimatized in a temperature-controlled tank (80.5 cm × 48 cm × 39 cm) for 48 h before the formal experiment [24]. The water was aerated tap water and changed daily. In our study, water quality was analyzed using a water quality meter (4-Star, Thermo, Waltham, MA, USA). The breeding temperature was 8–9 °C, the pH value ranged from 6.5 to 7.5, and the dissolved oxygen (DO) level was maintained at 8.0–9.0 mg/L. The light/dark period was 12L:12D.

2.2. Experimental Facility

The fish were measured in a recirculating swimming flume (Figure 1) with a rectangular swim chamber from Loligo System (Loligo system SY28060, Viborg, Denmark), in which the volume and the rectangular swim chamber were 30 L and 10 L (40 cm × 10 cm × 10 cm), respectively. Temperature control in the water tank was realized by an aquarium heater (JRB-300, 300W, Sensen, China). Water velocity within the flumes was controlled by a propeller motor. A calibration curve (Figure S1) between the motor setting and average cross-sectional velocity was drawn to set the water velocity in this experiment. The dissolved oxygen and temperature in the respirometer were monitored using a multi-parameter probe (HQ30d, HACH, Loveland, Co, USA). Finally, the data were visualized using the WitroxView 2 program (Loligo system, Viborg, Denmark).

2.3. Measure for Swimming Speed and Oxygen Consumption

To characterize swimming ability, stepped velocity tests were performed to measure the critical swimming speed (Ucrit), burst swimming speed (Uburst), and oxygen consumption rates (MO2, mgO2 h−1 kg−1) of the Amur grayling. The swimming speed of adult T. grubii (n = 40) was investigated across a range of body sizes (total length, 14–20.55 cm), and MO2 was measured individually in 15 fish (body weight: 45.22–133.21 g; body length: 15.56–22.71 cm). Fish body length (BL) was measured and then transferred to the respirometer and adapted to the experimental conditions at 0.5 BL/s for 30 min. The water velocity, initially at 1 BL/s, was increased by 1 BL/s at 20 min intervals [5]. A fish was regarded as exhausted when it did not resume swimming and rested against the wire grid for 15 s. The fish were removed from the respirometer and weighed immediately. The size range (weight and length) of each tested group is given in Table 1. Subsequently, 15 fish were run for 20 min at 0, 1.0, 2.0, and 3.0 BL/s [25,26], each with the same temperature (9 °C), and three fish were randomly selected from each velocity after 20 min. The fish were immediately anesthetized using 0.02% Methane Sulfonate-222 (MS-222; Sigma, St. Louis, ME, USA). Whole blood samples were quickly collected with heparinized syringes from the caudal vein of the Thymallus grubii. Subsequently, 200 μL fresh plasma was obtained directly after centrifugation at 5400× g for 10 min at 4 °C to use for further assay steps. Subsequently, 150 mg of liver and tail muscle tissues were excised and then immediately ground on ice for 9 min, and the fresh supernatant was collected for the following biochemical indices assessment.
The Ucrit and Uburst were calculated using the flow velocities and step intervals recorded during the test and the equation below.
Ucrit = Up + (t/∆t) × ∆U
Uburst = Up + (t/∆t) × ∆U
where Up (BL/s) is the maximal velocity recorded before the fish become fatigued, ∆U (BL/s) is the velocity increment, t (min) is the time elapsed at fatigue velocity, and ∆t (min) is the prescribed interval time (∆t is 20 min for Ucrit and ∆t is 20 s for Uburst). The maximum cross-sectional area of the tested fish was less than 10% of the cross-sectional area of the swim chamber, thus eliminating the need to adjust for the blocking effect [27].
The relative (critical and burst) swimming speed Ucrit′ and Uburst′ were equal to the critical and burst swimming speed divided by the mean critical and burst swimming speed divided by body length. The formulas were as follows:
Ucrit′ = Ucrit/BL
Uburst′ = Uburst/BL
MO2 was calculated using the following equation:
MO2 = V(d(DO)/dt)/M
where V is the volume of the respirometer (L), M is the mass of the selected Thymallus grubii, and d(DO)/dt is the slope of the linear regression of Do decrease with time. DO was measured every 1 s, and the slope was calculated for each 10 min interval of the test.
When there was no fish presented to the respirometer, MO2 in the system was less than 1% of the MO2 in the T. grubii, and therefore, it had a negligible impact.

2.4. Glucose Metabolism Enzyme Activity and Energy Metabolism Substance Content Determination

Lactate dehydrogenase (LDH, JL-T1070), hexokinase (HK, JL-T0940), pyruvate kinase (PK, JL-T0767), and succinate dehydrogenase (SDH, JL-T0920) activity and glycogen (JL-T0741)/lactic acid (JL-T1068) content were detected using kits purchased from Jianglai Co. Ltd. (Shanghai, China) and creatine phosphate (BL889B) content was measured using a specific kit purchased from Labgic Technology Co. Ltd. (Beijing, China). All test samples and specific reagents were stored under 4 °C conditions and measured within 1 h to avoid the degradation of biochemical substances. The liver and muscle samples were homogenized immediately and diluted with cold extraction solution at a ratio of 1:9 (w:v). After centrifugation at 13,000× g for 10 min at 4 °C, the supernatant was collected. Blood glucose was determined using auto-chemistry analyzers (AU5800, Beckman Coulter, Brea, CA, USA). The activity levels of LDH, HK, PK, and SDH and the content of glycogen, creatine phosphate, and lactic acid were measured based on the manufacturer’s instructions. Optical density (OD) values were determined using a absorbance microplate reader (SpectraMax Plus 384, Molecular Devices, San Jose, CA, USA) at 450 nm (LDH), 340 nm (HK), 340 nm (PK), 600 nm (SDH), 510 nm (glycogen), 520 nm (creatine phosphate), and 450 nm (lactic acid).

2.5. Statistical Analysis

Curve fitting with a nonlinear regression model was used to describe the relationships between U (Ucrit, Uburst, Ucrit’, and Uburst’) and body length. The relative critical and burst swimming speeds were analyzed by using the nonparametric test of independent samples (Kruskal–Wallis rank-sum test), and data are shown as individual data points. Normality and homogeneity of variance for physiological index data were first determined using the Kolmogorov–Smirnov test and Levene’s test, respectively. One-way analysis of variance (ANOVA) was used to analyze the statistical significance between different velocity conditions. The least significant difference method was utilized to execute the post hoc multiple comparisons. The level of significance for the differences was selected as p < 0.05. The statistical procedure was accomplished using IBM SPSS Statistics software (22.0), plots were visualized using GraphPad Software (Version 8.4.3, USA), and data are presented as the mean ± standard deviation (SD).

3. Results

3.1. Critical and Burst Swimming Speed

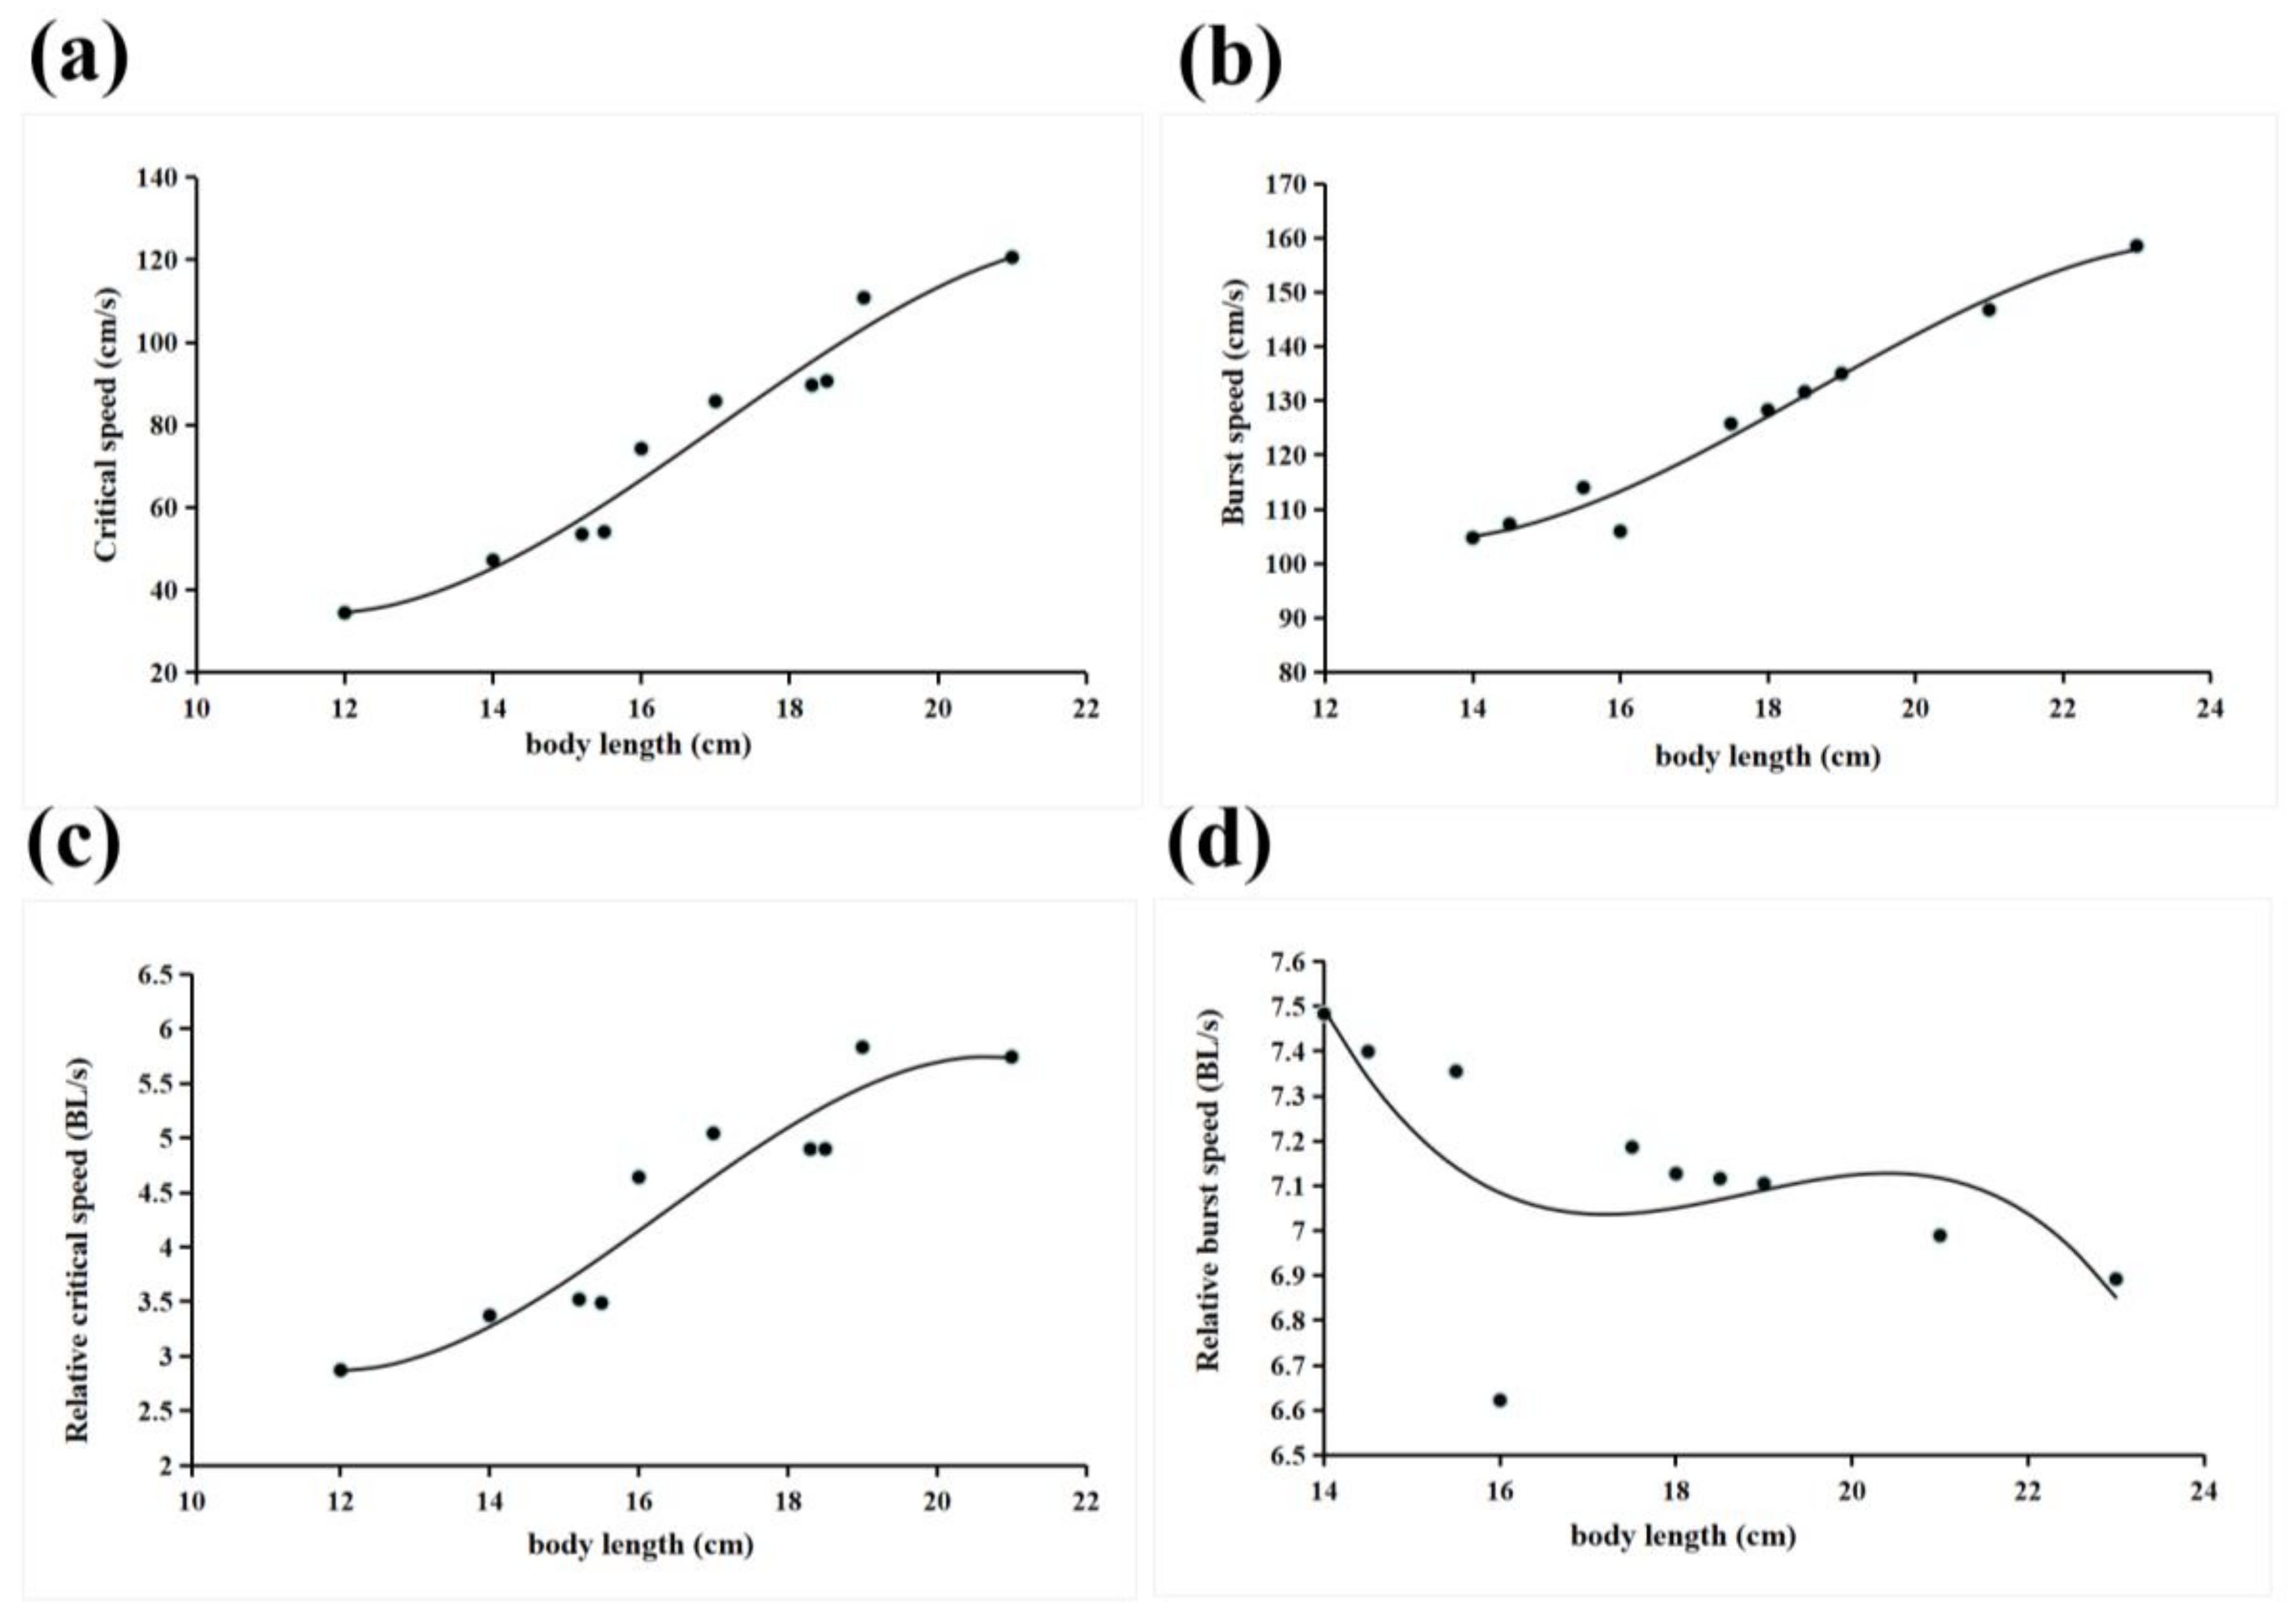
When plotted with a dimension of body length, the results showed that the Ucrit and Uburst of the Amur grayling (body length: 16.65 ± 2.65 cm and 17.7 ± 2.85 cm) ranged from 34.48 to 120.58 cm/s and 104.76 to 158.52 cm/s, respectively. Absolute values for Ucrit and Uburst tended to increase with body length. The relationship between relative Ucrit, Uburst, and fish length is indicated in Figure 2a,b. The relatively critical swimming speed Ucrit’ and Uburst’ could be described as 2.873–5.831 BL/s and 6.892–7.483 BL/s, respectively. Ucrit’ tended to increase with body length, while Uburst tended to decrease (Figure 2c,d). As shown in Table 1, the fitted equation between absolute critical swimming speed and body length was y = −0.1448x3 + 7.4003x2 − 113.4x + 579.91 R2 = 0.9586. The equation between the relative critical swimming speed and body length was y = −0.0085x3 + 0.4168x2 − 6.308x + 33.259 R2 = 0.8937. The fitted equation for the relationship between absolute burst speed and body length was y = −0.0865x3 + 4.8225x2 − 82.031x + 545.38; the fitted equation for the relationship between relative burst speed and body length was y = −0.0056x3 + 0.3132x2 − 5.8463x + 43.188 (Table 1).

3.2. Effect of Swimming Velocity on the Oxygen Consumption Rate of the Amur Grayling

The oxygen consumption rate of the Amur grayling increased with increasing swimming velocity in different body length groups (Figure 3). In group 1 (body length/cm: 16.42 ± 0.86), the MO2 of 0 BL/s was significantly different from that of the velocities group (p < 0.05), but there was no difference among the velocity groups (p > 0.05) (Figure 3a). In group 2 (body length/cm: 20.50 ± 0.71), the MO2 of 0 BL/s was significantly different from that of 2 BL/s and 3 BL/s (p < 0.05), but there was no difference among 2 BL/s and 3 BL/s (p > 0.05) (Figure 3b). In group 3 (body length/cm: 23.70 ± 0.84), the MO2 of 3 BL/s was significantly different from that of 0 BL/s and the other velocity groups (p < 0.05), but there was no difference among 0–2 BL/s (p > 0.05) (Figure 3c). The MO2 scale generally decreased with the increasing body length of groups 1–2 (Figure 3d). The equations of the relationship between MO2 and velocity were y = 0.04623 + 0.02452x0.39484 R2 = 0.94803 for group 1, y = 0.03514 + 0.01284x0.80175 R2 = 0.91076 for group 2, and y = 0.03214 + 0.00487x1.83557 R2 = 0.99464 for group 3 (Table 1).

3.3. Effect of Velocity on the Physiological and Biochemical Characteristics of the Amur Grayling

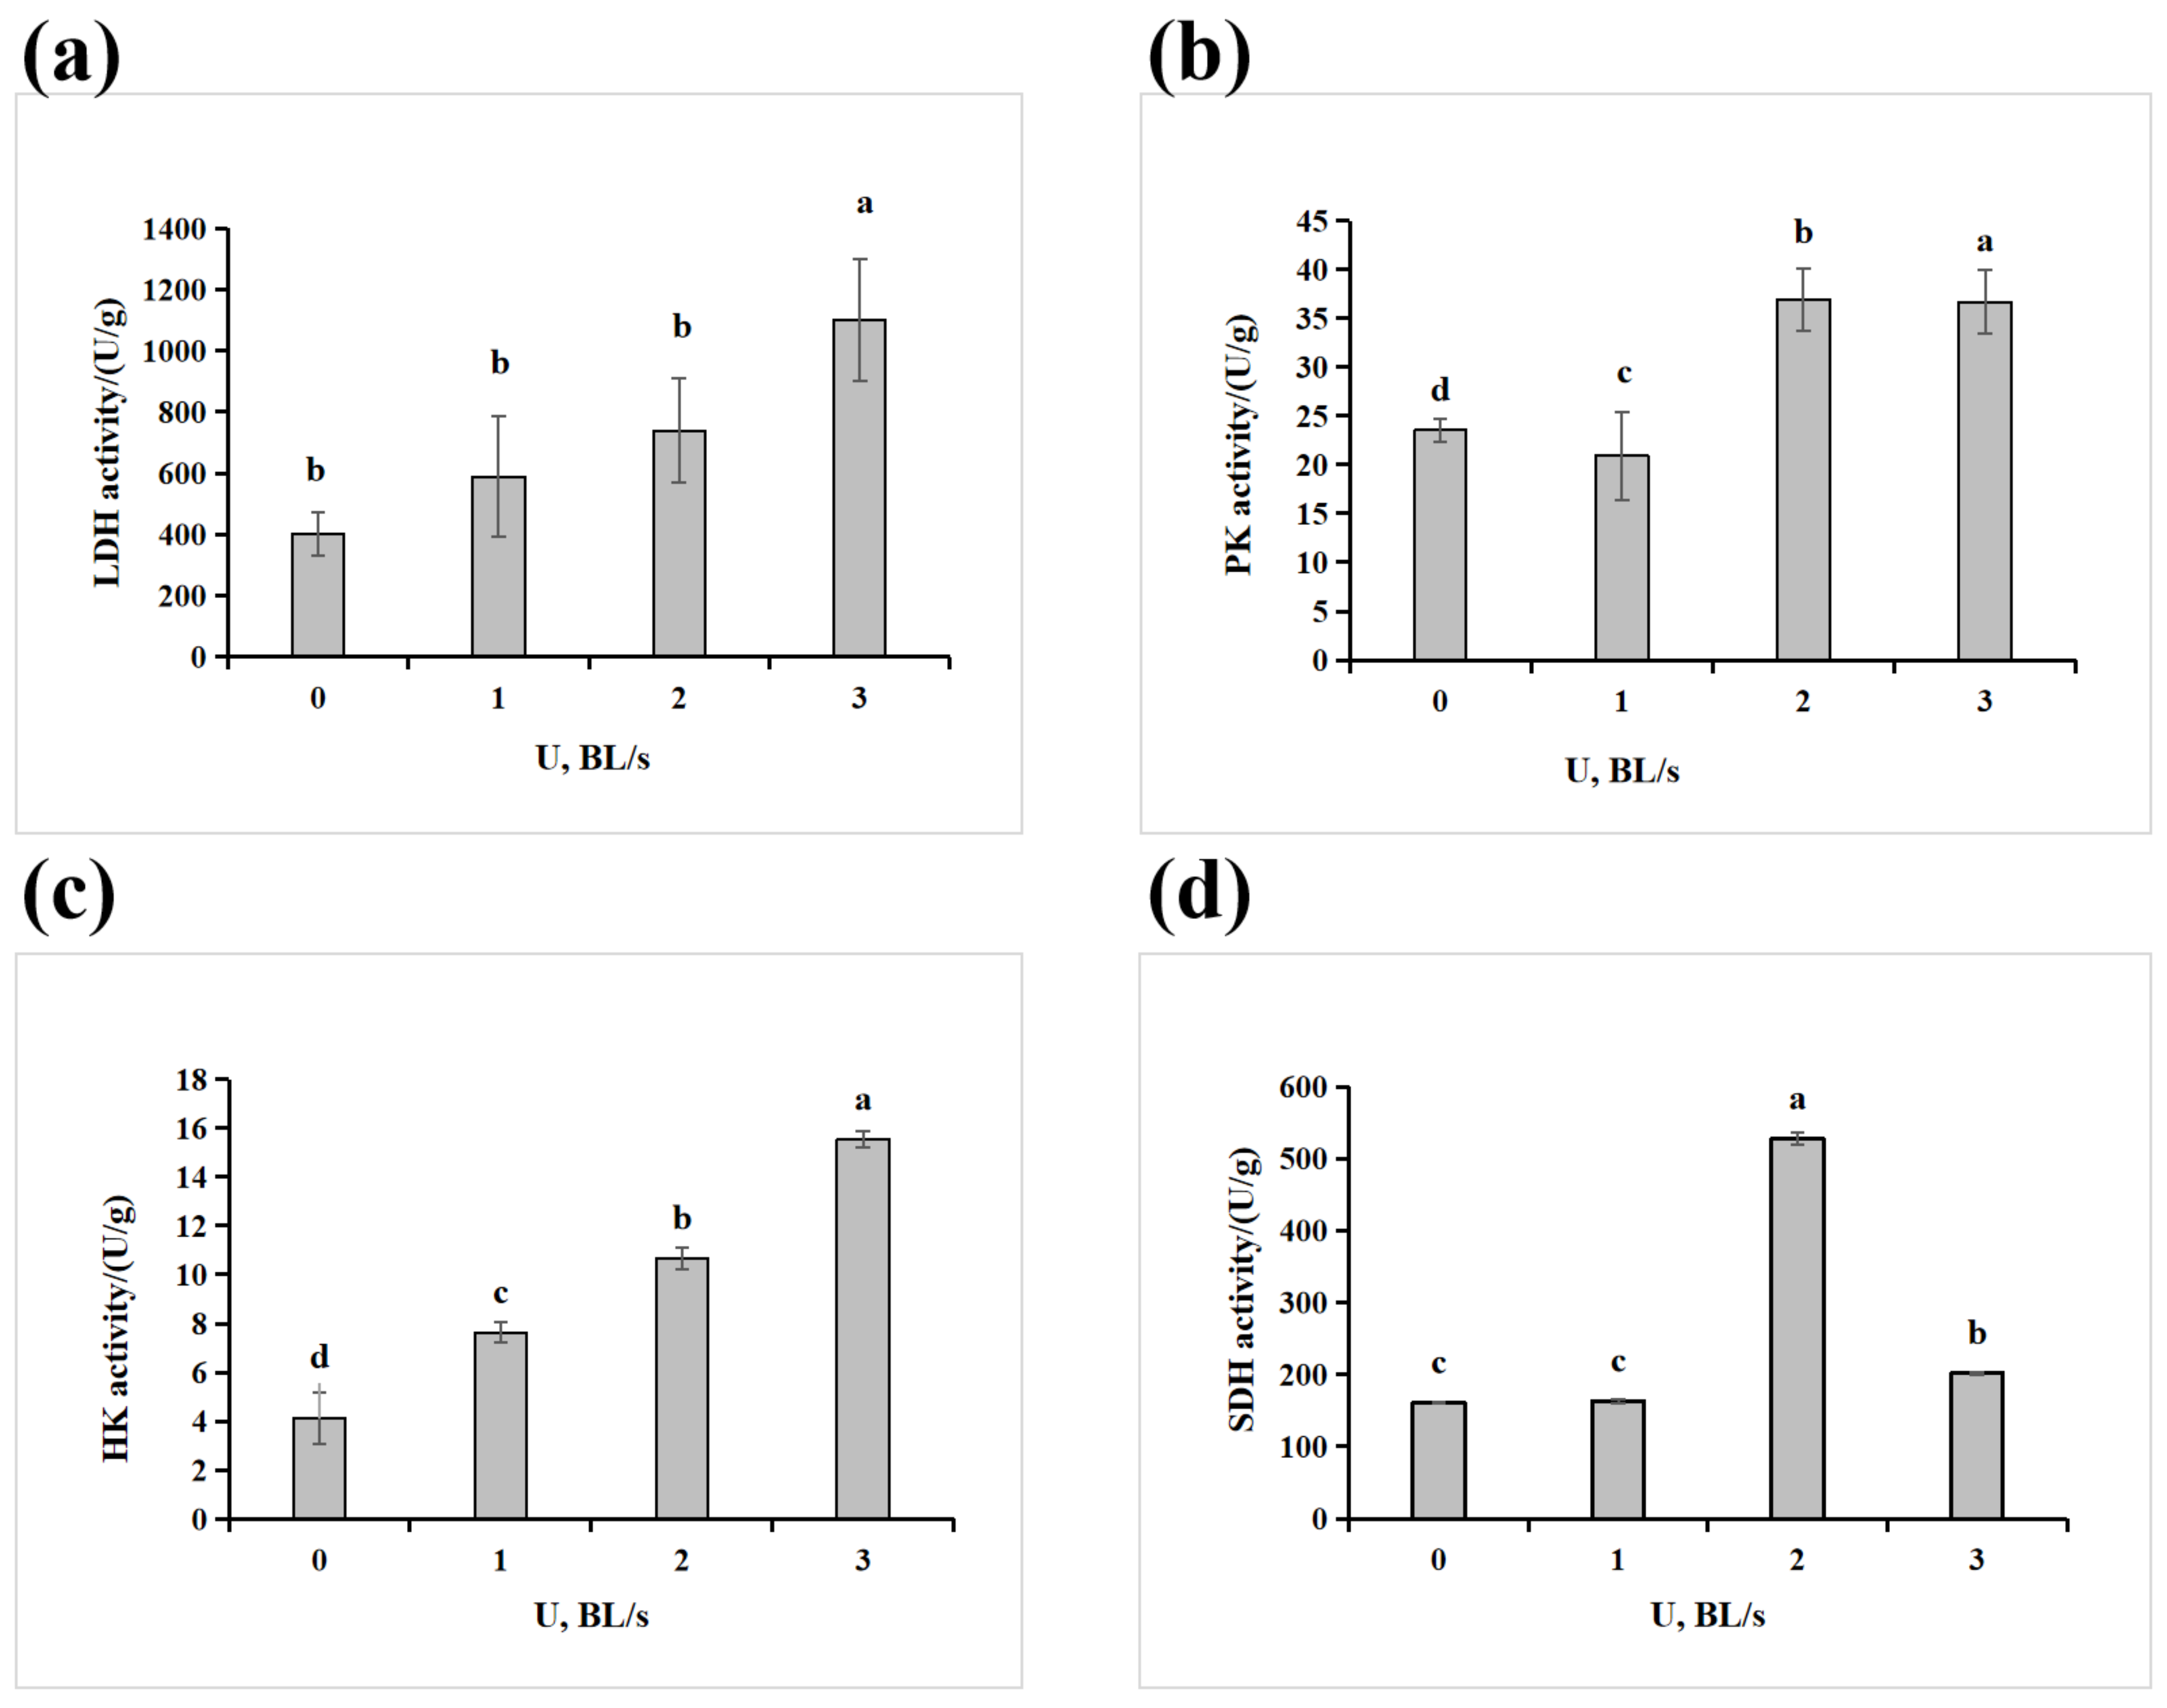
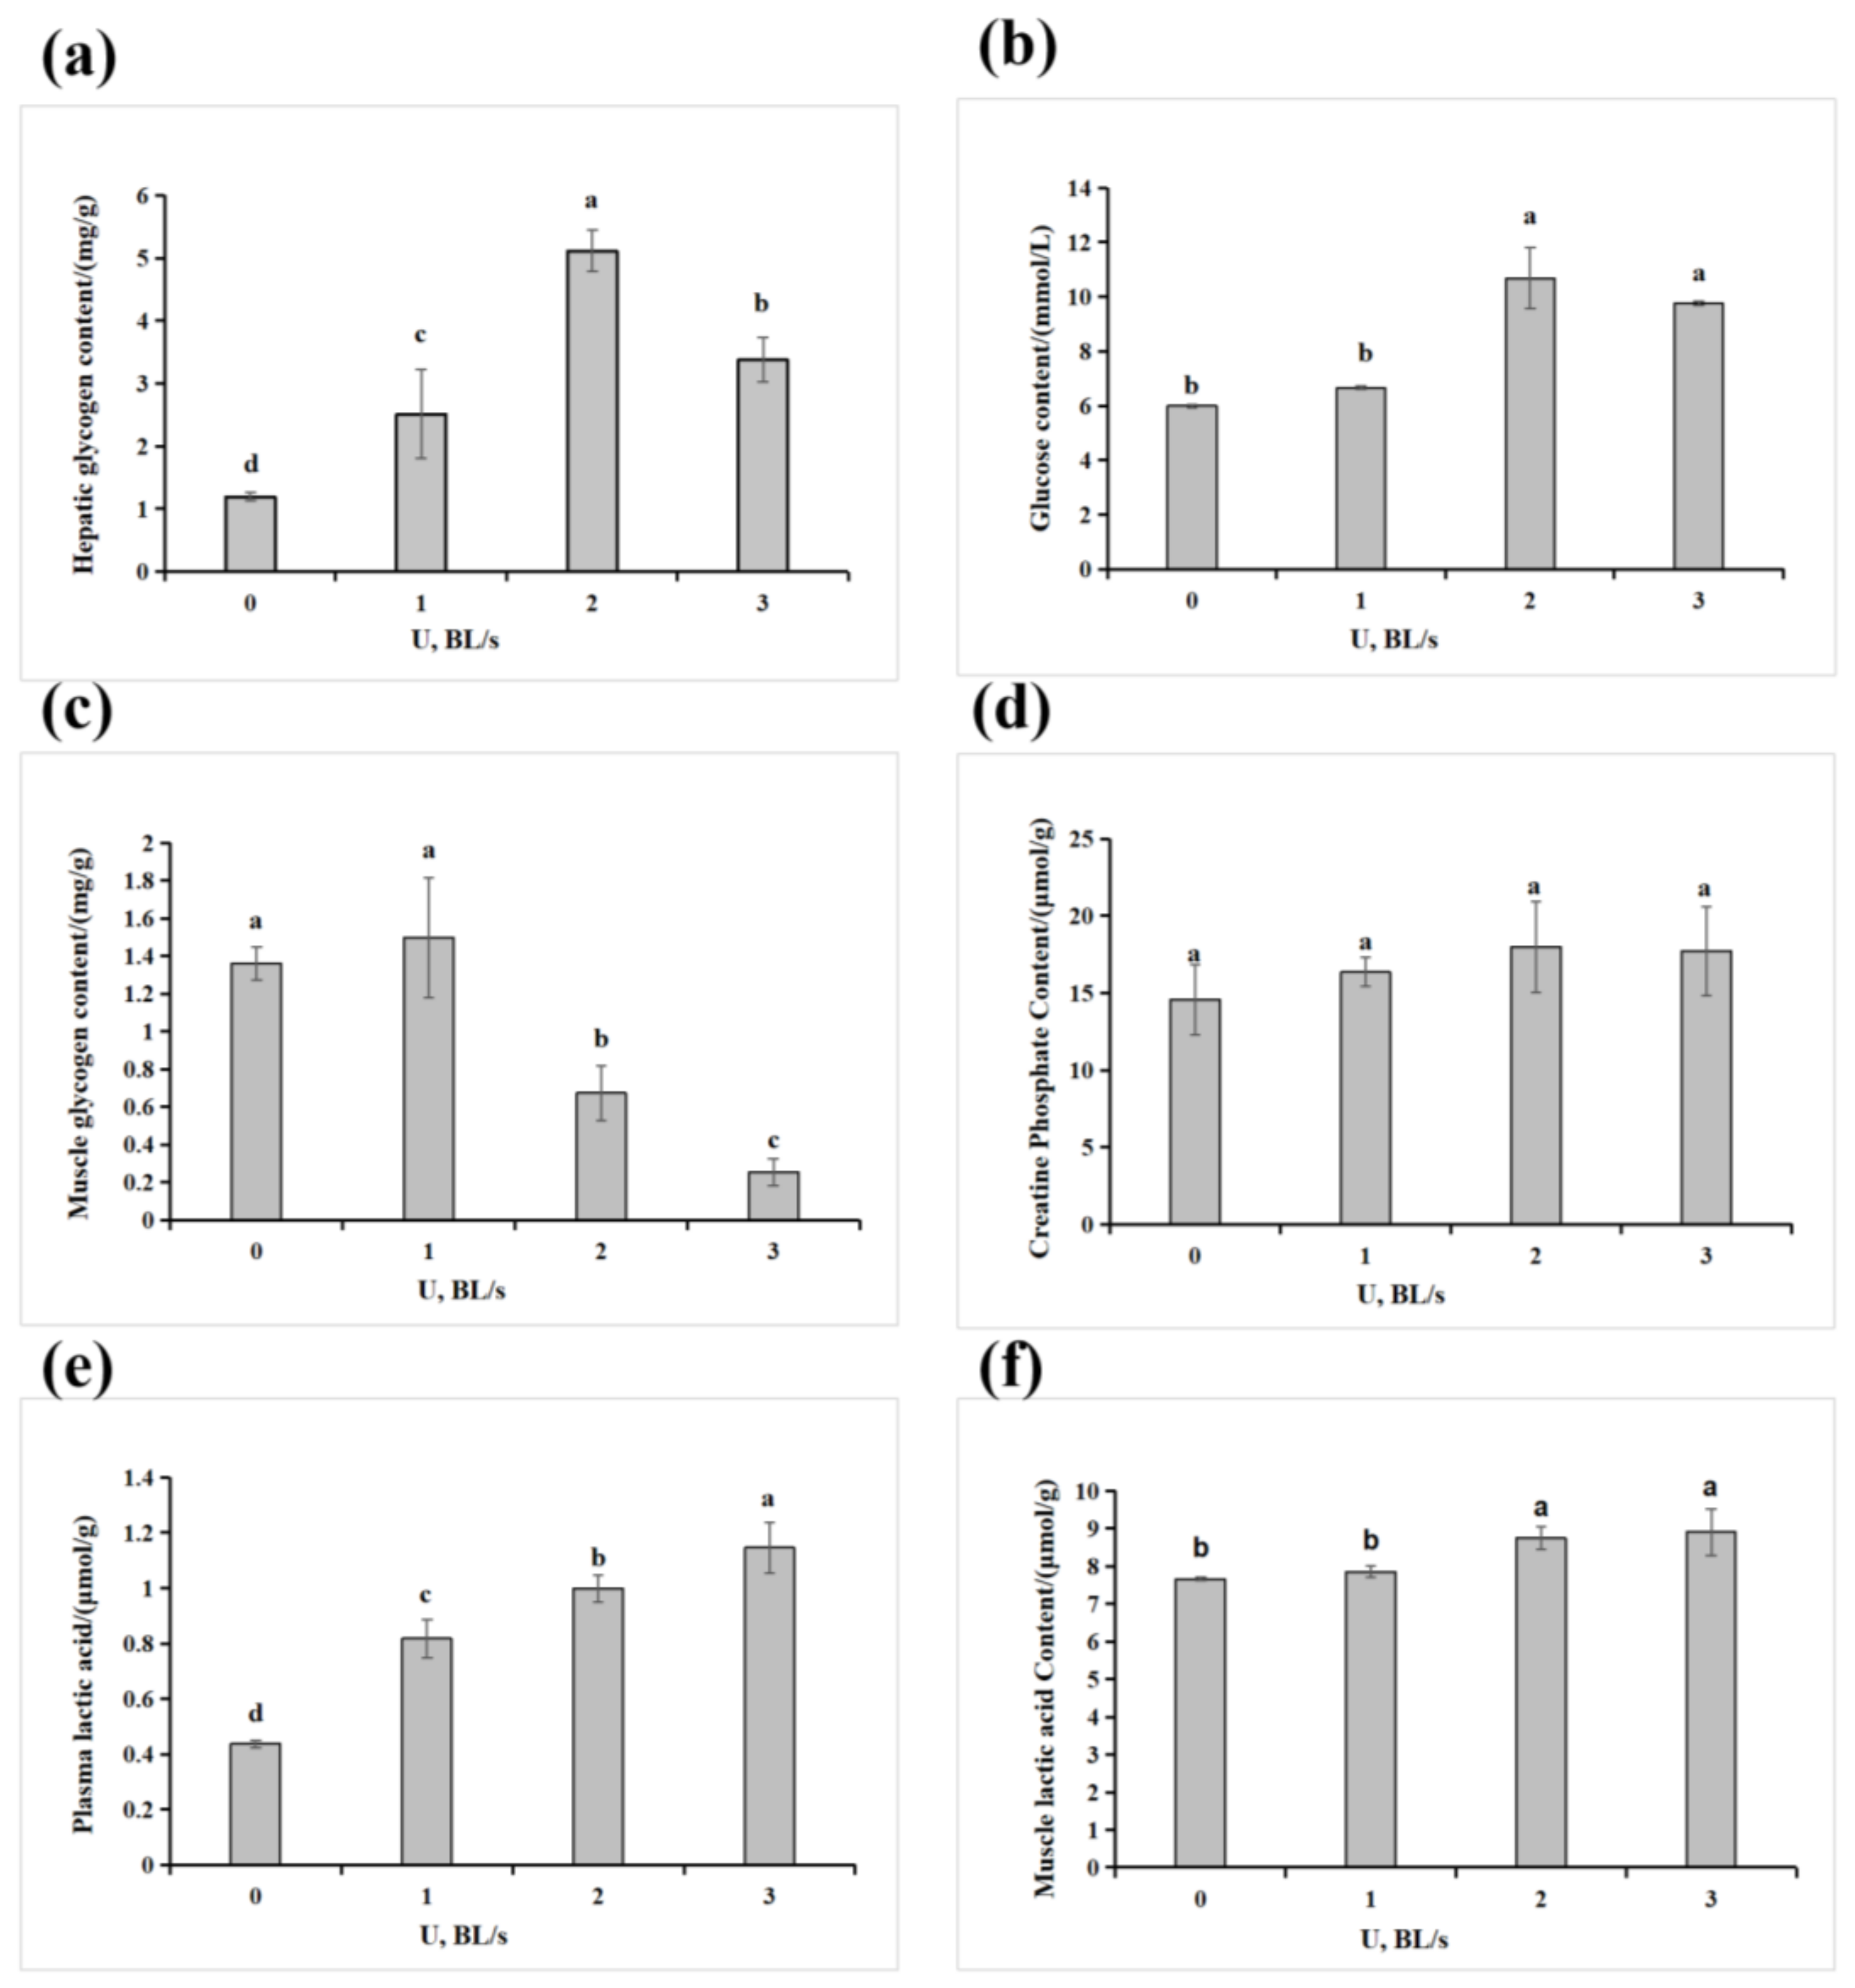
The glycolysis process begins with the phosphorylation process of glucose into glucose-6 phosphate (G6P) by HK. This step is the first transfer of a phosphate group and is an irreversible step. In the final step, PK turns phosphoenolpyruvic acid into pyruvate and phosphorylates ADP into ATP through a substrate-level phosphorylation effect. SDH is one of the links between oxidative phosphorylation and electron transport, and its activity reflects the activity of aerobic metabolism, which is one of the main pathways used by organisms to produce energy [28]. In various species, LDH constitutes one major anaerobic glycolysis checkpoint by catalyzing the reduction of pyruvate into lactate [29]. The effect of velocityin the liver on glucose enzyme activities is presented in Figure 4. LDH and HK activities increased significantly with increasing velocity (p < 0.05). PK activity was significantly lower than the control group in 1 BL/s and increased significantly in 2–3 BL/s (p < 0.05). SDH activity was first stimulated and then significantly decreased with the increase in velocity (p < 0.05). The hepatic glycogen and blood glucose contents were initially stimulated and subsequently decreased with the increase in velocity (p < 0.05) (Figure 5). Muscle glycogen content decreased significantly in the treatment group (p < 0.05). Creatine phosphate of muscle content increased and was then inhibited with increasing velocity, but the difference was not significant (p > 0.05). The lactic acid content of the blood and muscle increased significantly with the increase in velocity (p < 0.05).

4. Discussion

In recent decades, wild salmonid fish in rivers have declined dramatically in both population size and species diversity [30]. Man-made obstacles on the pathway of fish migration can be one of the major reasons that block the movement behavior of fish in rivers, which causes the population extinction of fish species [31]. The design strategy of passage systems should be referred to as swimming performance [32,33]. Due to swimming performance and energetics varying among species and by size within species [4,34], a comprehensive set of studies is needed for fish of different stages in different habitats and rivers.
Body length is usually recognized as one of the most important factors that affects fish swimming capacity [35]. Some studies have reported that there is a correlation between fish swimming speed and body length [36,37]. Drag force scales in proportion to the surface area of a fish increase in proportion to the square of body length, while the muscle powering locomotion scales increase with volume and increase in proportion to the cube of body length. The specific relationship between muscle weight and drag force changes with fish shape and size. As fish size increased, the relative values of surface area and muscle weight scale were such that absolute swimming speed increased while relative swimming speed decreased [24]. In this study, it can also be seen from Figure 1 that the swimming speed (critical and burst swimming speed) of the Amur grayling increased with the increase in body length, and the relative burst swimming speed decreased with body length. Similar results have been found in four carp, grass carp (Ctenopharyngodon idellus), barbel chub (Squaliobarbus curriculus), and yellowcheek carp (Elopicthys bambusa) [24,38]. However, the relative critical swimming speed increased with increasing body length, which was the opposite trend compared to the existing study. This suggests that body size has significant effects on animal behavior. BL significantly affects the swimming ability of fish. Entrance velocities, which should be below Uburst, are used to assist fish to enter into the fishway [9]. In this study, the Uburst for Amur grayling ranged from 104.76 to 158.52 cm/s; therefore, the better entrance velocity should not exceed 104.76 cm/s. Within fish passage, the appropriate velocity should be lower than Ucrit for T. grubii migration, except for turbulence in the fishway [39]. Thus, the passage velocity should be lower than 34.48 cm/s (2.873 BL/s) for improving fish passage designs. MO2 is important for designing fish migration pathways [39]. In the present study, the MO2 increased with increasing swimming velocity in different body length types and was consistent with other studies [40,41]. The relationship between MO2 and swimming velocity is generally described by a power function, and the exponent value of swimming velocity relates to swimming efficiency and is inversely related to swimming efficiency [42]. Exponent values reported in Atlantic cod (Gadus morhua) and haddock (Melanogrammus aeglefinus) were 2.01 and 2.11, respectively, with a body length of 20.9 ± 0.6 and 18.7 ± 0.2 cm [43]. In this study, the exponent values range from 0.4 to 1.8, indicating that the relatively higher swimming efficiency and lower cost would be a benefit to the long-distance migration process of the Amur grayling. This is also related to their habit of living in an environment of fast-flowing waters. The swimming capacity and respiratory characteristics of fish can be modulated, affected, and constrained by many biological and environmental variables, including water temperament, flow velocity, and dissolved oxygen [44,45]. The present study indicates that a constraint in oxygen uptake at high temperatures may restrict the growth of larger fish with environmental warming [46]. Nevertheless, some studies detected a significant decrease in swimming performance with lower water temperatures [47]. Other studies have noted the negative effects of several pollutants such as metals and nutrients on fish swimming performance [48]. Turbid waters become warmer as suspended particles absorb heat from sunlight, causing oxygen levels to fall (warm water holds less oxygen than cool water). Photosynthesis decreases with less light, resulting in even lower oxygen levels [49]. Hypoxia limits aerobic swimming performance in fish by limiting their aerobic metabolic scope [50]. The Amur grayling has strict requirements to survive, so we need to enhance their protection by improving water quality and protecting their habitat.
Studies on fish swimming performance have typically used a sealed swimming tunnel or chamber in which fish are induced to swim against a controlled current until fatigued. The use of fatigue as a physiological endpoint has been questioned, casting doubt on the method, because fatigue may be a behavioral response rather than a physiological threshold [51]. Therefore, the fish swimming ability of the Amur grayling needs to be further explored from the perspective of fish physiology. The energy metabolism of biological organisms is closely related to their physiological function [52]. In the present study, blood glucose and muscular and liver glycogen decreased in the fish kept at 3 BL/s, indicating the depletion of energy. One possible explanation for the increased blood glucose concentration in fish during swimming is that adrenaline activates the cyclic-AMP (cAMP)-dependent protein kinase (PKA) signaling pathway, thereby increasing blood glucose concentration and providing energy to various organs. In addition, the lactate levels of the muscles were not elevated significantly in the fast velocity treatment, which may have been expected if there was anaerobic swimming activity [53]. The lactic acid level of the blood was significantly higher than that in the static experimental group at 3 BL/s. At this time, the muscle glycogen was oxidated and decomposed into lactic acid in the blood, which resulted in higher blood lactic acid levels. PK and HK are non-equilibrium or regulatory steps in glycolysis, which have among the lowest activities in the pathway, with them being regulatory steps in the control of metabolism [54]. Our results showed that PK and HK had an increasing trend at different speeds and were related to increasing demand for ATP. SDH is the only enzyme in aerobic metabolism embedded in the inner mitochondrial membrane [55]. This experiment showed that SDH significantly decreased in the water velocity of 3 BL/s, which indicates that anaerobic respiration played a role at this stage. We observed that LDH activity during the experiment increased significantly. LDH is a key enzyme in glucose anaerobic metabolism [56]. It has been demonstrated that the activation of the anaerobic metabolism process can be characterized by increased LDH activity [57]. Therefore, the results of this study indicate that compared with the rest state, energy was obtained in the velocity group from glucose anaerobic metabolism. The above results demonstrate that the respiration mode of Thymallus grubii (body length: 21.06 ± 1.65 cm) was anaerobic and aerobic at a velocity of 1–2 BL/S, focusing on anaerobic respiration at a velocity of 3 BL/s. For this body length (21.06 ± 1.65 cm), the passage velocity should be lower than 120.58 cm/s (5.742 BL/s). However, the velocity should also not exceed 3 BL/s when combined with physiological parameters. Therefore, fish swimming performance and physiological threshold should be considered together in fish passage design and the relationships between them also need related verification tests in the future.

5. Conclusions

The critical and burst swimming speed of the fish increased with increasing length, and the relative critical and burst swimming speed increased and decreased with body length, respectively. In parallel, the fish increased their energy consumption to keep swimming and energy supplementation by regulating the anaerobic metabolism process at high flow velocity. Based on the present study, it may be considered that water velocity over 3 BL/s is unfavorable for the migration process of T. grubii. Above all, our data further pave the path for the construction mode of fish migration routes and restoration strategies for ecological habitats.

Supplementary Materials

The following supporting information can be downloaded at: https://www.mdpi.com/article/10.3390/fishes9070272/s1. Figure S1: Relationship between flow velocity in the experimental tank measured by a tachometer and frequency adjusted by the controller.

Author Contributions

Conceptualization, C.Z. and G.Z.; methodology, C.Z. and Y.L.; software, C.Z. and Q.E.; validation, C.Z., W.P., G.Z., and Y.L.; resources, B.M.; data curation, C.Z. and Q.E.; original draft preparation, C.Z.; review and editing, Y.Z. and Y.L.; visualization, Y.L., C.Z., and Q.E.; supervision, Y.Z. and B.M.; project administration, Y.Z. and B.M.; funding acquisition, B.M. All authors have read and agreed to the published version of the manuscript.

Funding

This study was supported by the Agricultural Finance Special Project of the Ministry of Agriculture and Rural Affairs, “Regularized monitoring of Fisheries Resources and Environment in Key Waters in Northeast China”, Central Public-interest Scientific Institution Basal Research Fund, CAFS (NO. 2023TD07), and the Earmarked Fund for China Agriculture Research System (Project No. CARS-46).

Institutional Review Board Statement

This study was conducted in accordance with animal care laws and guidelines (Directive 2010(63)EU); all procedures were approved by the Laboratory Animal Ethics Committee of Heilongjiang River Fisheries Research Institute (No. 20210910-001).

Informed Consent Statement

Not applicable.

Data Availability Statement

The data that support the findings of this study are available from the corresponding author upon reasonable request.

Conflicts of Interest

None of the authors have any financial or personal relationships that could inappropriately influence or bias the content of this paper.

References

  1. Cano-Barbacil, C.; Radinger, J.; Argudo, M.; Rubio-Gracia, F.; Vila-Gispert, A.; García-Berthou, E. Key factors explaining critical swimming speed in freshwater fish: A review and statistical analysis for Iberian species. Sci. Rep. 2020, 10, 18947. [Google Scholar] [CrossRef] [PubMed]
  2. Downie, A.T.; Illing, B.; Faria, A.M.; Rummer, J.L. Swimming performance of marine fish larvae: Review of a universal trait under ecological and environmental pressure. Rev. Fish Biol. Fish. 2020, 30, 93–108. [Google Scholar] [CrossRef]
  3. Knaepkens, G.; Bruyndoncx, L.; Eens, M. Assessment of residency and movement of the endangered bullhead (Cottus gobio) in two Flemish rivers. Ecol. Freshw. Fish. 2004, 13, 317–322. [Google Scholar] [CrossRef]
  4. Tudorache, C.; Viaene, P.; Blust, R.; Vereecken, H.; De Boeck, G. A comparison of swimming capacity and energy use in seven European freshwater fish species. Ecol. Freshw. Fish. 2008, 17, 284–291. [Google Scholar] [CrossRef]
  5. Brett, J.R. The respiratory metabolism and swimming performance of young sockeye salmon. J. Fish Res. Board Can. 1964, 21, 1183–1226. [Google Scholar] [CrossRef]
  6. Hammer, C. Fatigue and exercise tests with fish. Comp. Biochem. Physiol. A 1995, 112, 1–20. [Google Scholar] [CrossRef]
  7. Yanase, K.; Eayrs, S.; Arimoto, T. Influence of water temperature and fish length on the maximum swimming speed of sand flathead, Platycephalus bassensis: Implications for trawl selectivity. Fish. Res. 2007, 84, 180–188. [Google Scholar] [CrossRef]
  8. Blaxter, J.H.S. Swimming speeds of fish. In Proceedings of the FAO Conference on Fish Behavior in Relation to Fishing Techniques and Tactics, Bergen, Norway, 19–27 October 1967. [Google Scholar]
  9. Pavlov, D.S. Structures Assisting the Migrations of Non-Salmonid Fish: USSR; FAO Fisheries Technical Paper; FAO: Rome, Italy, 1989; Volume 308, pp. 1–97. [Google Scholar]
  10. Beamish, F.W.H. Swimming capacity. In Fish Physiology, VII; Hoar, W.S., Randall, D.J., Eds.; Academic Press: New York, NY, USA, 1978; pp. 101–187. [Google Scholar]
  11. Vodianitskyi, O.M.; Potrokhov, O.S.; Zinkovskyi, O.G.; Khudiiash, Y.M.; Prychepa, M.V. Effects of increasing water temperature and decreasing water oxygen concentration on enzyme activity in developing carp embryos (Cyprinus carpio). Fish. Aquat. Life 2021, 29, 35–44. [Google Scholar] [CrossRef]
  12. Sims, D.W. The effect of body size on the standard metabolic rate of the lesser spotted dogfish. J. Fish Biol. 1996, 48, 542–544. [Google Scholar] [CrossRef]
  13. Caputo, F.; Oliveira, M.F.M.d.; Denadai, B.S.; Greco, C.C. Fatores intrínsecos do custo energético da locomoção durante a natação. Rev. Bras. Med. Esporte. 2006, 12, 399–404. [Google Scholar] [CrossRef]
  14. Guo, T.T.; Yang, Y.; Meng, F.X.; Wang, S.D.; Xia, S.L.; Qian, Y.X.; Li, M.; Wang, R.X. Effects of low salinity on gill and liver glycogen metabolism of great blue-spotted mudskippers (Boleophthalmus pectinirostris). Comp. Biochem. Physiol. C Toxicol. Pharmacol. 2020, 230, 108709. [Google Scholar] [CrossRef] [PubMed]
  15. Dyldin, Y.; Hanel, L.; Romanov, V.; Plesnik, J. A review of the genus thymallus (pisces: Salmoniformes, salmonidae, thymallinae) with taxonomic notes. Bull. Lampetra 2017, 8, 103–126. [Google Scholar]
  16. Nelson, J.S. Fishes of the World; John Wiley & Sons, Inc.: Hoboken, NJ, USA, 2006; 601p. [Google Scholar]
  17. Junge, C.; Vøllestad, L.; Barson, N.; Haugen, T.O.; Otero, J.; Sætre, G.-P.; Leder, E.H.; Primmer, C.R. Strong gene flow and lack of stable population structure in the face of rapid adaptation to local temperature in a spring-spawning salmonid, the European grayling (Thymallus thymallus). Heredity 2011, 106, 460–471. [Google Scholar] [CrossRef] [PubMed]
  18. Sun, H.C.; Zhang, L.N.; Lv, X.N.; Kuang, Y.Y.; Tong, G.X.; Xue, S.Q.; Han, Y.; Yin, J.S. Development of 21 Microsatellite Loci and Diversity Analysis of Amur Grayling in Amur River. Thalassas 2020, 36, 165–170. [Google Scholar] [CrossRef]
  19. Liu, L.W.; Luo, Y.L.; Liang, X.F.; Ma, B.; Song, D. Occurrence of Amur grayling (Thymallus grubii grubii Dybowski, 1869) in the Amur River. J. Appl. Ichthyol. 2013, 29, 666–667. [Google Scholar] [CrossRef]
  20. Wu, H.P.; Chen, J.; Xu, J.J.; Zeng, G.M.; Sang, L.H.; Liu, Q.; Yin, Z.J.; Dai, J.; Yin, D.C.; Lang, J.; et al. Effects of dam construction on biodiversity: A review. J. Clean. Prod. 2019, 221, 480–489. [Google Scholar] [CrossRef]
  21. Wang, S.; Zheng, G.M.; Wang, Q.S. China Red Data Book of Endangered Animals; Science Press: Beijing, China, 1998; pp. 204–206. [Google Scholar]
  22. Ma, B.; Lui, T.T.; Zhang, Y.; Chen, J.P. Phylogeography and Population Genetic Structure of Amur grayling Thymallus grubii in the Amur Basin. Anim. Biosci. 2012, 25, 935–944. [Google Scholar] [CrossRef] [PubMed]
  23. Weiss, S.J.; Gonçalves, D.V.; Secci-Petretto, G.; Englmaier, G.K.; Gomes-Dos-Santos, A.; Denys, G.P.J.; Persat, H.; Antonov, A.; Hahn, C.; Taylor, E.B.; et al. Global systematic diversity, range distributions, conservation and taxonomic assessments of graylings (Teleostei: Salmonidae; Thymallus spp.). Org. Divers. Evol. 2021, 21, 25–42. [Google Scholar] [CrossRef]
  24. Cai, L.; Chen, J.H.; Johnson, D.; Tu, Z.Y.; Huang, Y.P. Effect of body length on swimming capability and vertical slot fishway design. Glob. Ecol. Conserv. 2020, 22, e00990. [Google Scholar] [CrossRef]
  25. Huang, Y.P.; Malik, A.H.; Tu, Z.Y.; Johnson, D.; Li, W.M.; Yuan, X. Effect of repeated exercise fatigue on the swimming performance of juvenile rock carp (Procypris rabaudi, Tchang). J. Appl. Ichthyol. 2020, 36, 811–816. [Google Scholar] [CrossRef]
  26. Li, X.M.; Pang, X.; Zheng, H.; Li, X.J.; Fu, S.J.; Zhang, Y.G. Effects of prolonged exercise training and exhaustive chasing training on the swimming performance of an endangered bream Megalobrama pellegrini. Aquat. Biol. 2017, 26, 125–135. [Google Scholar] [CrossRef]
  27. Peake, S.J.; Beamish, F.W.; McKinley, R.S.; Scruton, D.A.; Katopodis, C. Relating swimming performance of lake sturgeon, Acipenser fulvescens, to fishway desing. Can. J. Fish Aquat. Sci. 1997, 54, 1361–1366. [Google Scholar] [CrossRef]
  28. Akila, P.; Asaikumar, L.; Vennila, L. Chlorogenic acid ameliorates isoproterenolinduced myocardial injury in rats by stabilizing mitochondrial and lysosomal enzymes. Biomed. Pharmacother. 2017, 85, 582–591. [Google Scholar] [CrossRef] [PubMed]
  29. Granchi, C.; Bertini, S.; Macchia, M.; Minutolo, F. Inhibitors of lactate dehydrogenase isoforms and their therapeutic potentials. Curr. Med. Chem. 2010, 17, 672–697. [Google Scholar] [CrossRef] [PubMed]
  30. Rodríguez, T.T.; Agudo, J.P.; Mosquera, L.P.; Gonz’alez, E.P. Evaluating vertical-slot fishway designs in terms of fish swimming capabilities. Ecol. Eng. 2006, 27, 37–48. [Google Scholar] [CrossRef]
  31. Warren, M.L.; Burr, B.M.; Walsh, S.J.; Bart, H.L.; Cashner, R.C.; Etnier, D.A.; Freeman, B.J.; Kuhajda, B.R.; Mayden, R.L.; Robison, H.W.; et al. Diversity, distribution, and conservation status of the native freshwater fishes of the southern United States. Fisheries 2000, 25, 7–31. [Google Scholar] [CrossRef]
  32. Noonan, M.J.; Grant, J.W.A.; Jackson, C.D. A quantitative assessment of fish passage efficiency. Fish Fish. 2012, 13, 450–464. [Google Scholar] [CrossRef]
  33. Braaten, P.J.; Elliott, C.M.; Rhoten, J.C.; Fuller, D.B.; McElroy, B.J. Migrations and swimming capabilities of endangered pallid sturgeon (Scaphirhynchus albus) to guide passage designs in the fragmented Yellowstone River. Restor. Ecol. 2015, 23, 186–195. [Google Scholar] [CrossRef]
  34. Katopodis, C.; Gervais, R. Fish Swimming Performance Database and Analyses; Canadian Science Advisory Secretariat, Fisheries and Oceans Canada: Ottawa, ON, Canada, 2016; 550p. [Google Scholar]
  35. Plaut, I. Critical swimming speed: Its ecological relevance. Comp. Biochem. Physiol. Part A Mol. Integr. Physiol. 2001, 131, 41–50. [Google Scholar] [CrossRef]
  36. Cooke, S.J.; Cech, J.J.; Glassman, D.M.; Simard, J.; Louttit, S.; Lennox, R.J.; Cruz-Font, L.; O’Connor, C.M. Water resource development and sturgeon (Acipenseridae): State of the science and research gaps related to fish passage, entrainment, impingement and behavioural guidance. Rev. Fish Biol. Fish. 2020, 30, 219–244. [Google Scholar] [CrossRef]
  37. Poletto, J.B.; Cocherell, D.E.; Ho, N.; Cech, J.J.J.; Klimley, A.P.; Fangue, N.A. The effect of size on juvenile green sturgeon (Acipenser medirostris) behavior near water-diversion fish screens. Environ. Biol. Fish. 2018, 101, 67–77. [Google Scholar] [CrossRef]
  38. Tan, J.; Li, H.; Guo, W.; Tan, H.; Ke, S.; Wang, J.; Shi, X. Swimming Performance of Four Carps on the Yangtze River for Fish Passage Design. Sustainability 2021, 13, 1575. [Google Scholar] [CrossRef]
  39. Katopodis, C.; Cai, L.; Johnson, D.M. Sturgeon survival: The role of swimming performance and fish passage research. Fish. Res. 2019, 212, 162–171. [Google Scholar] [CrossRef]
  40. Cai, L.; Taupier, R.; Johnson, D.; Tu, Z.Y.; Liu, G.Y.; Huang, Y.P. Swimming capability and swimming behavior of juvenile Acipenser schrenckii. J. Exp. Zool. Part A Ecol. Genet. Physiol. 2013, 319, 149–155. [Google Scholar] [CrossRef]
  41. Gallaugher, P.E.; Thorarensen, H.; Kiessling, A.; Farrell, A.P. Effects of high intensity exercise training on cardiovascular function, oxygen uptake, internal oxygen transport and osmotic balance in chinook salmon (Oncorhynchus tshawytscha) during critical speed swimming. J. Exp. Biol. 2001, 204 Pt 16, 2861–2872. [Google Scholar] [CrossRef] [PubMed]
  42. Wardle, C.S.; Soofiani, N.M.; O’Neill, F.G.; Glass, C.W.; Johnstone, A.D.F. Measurements of aerobic metabolism of a school of horse mackerel at different swimming speeds. J. Fish Biol. 1996, 49, 854–862. [Google Scholar] [CrossRef]
  43. Norin, T.; Canada, P.; Bailey, J.A.; Gamperl, A.K. Thermal biology and swimming performance of Atlantic cod (Gadus morhua) and haddock (Melanogrammus aeglefinus). PeerJ 2019, 7, e7784. [Google Scholar] [CrossRef] [PubMed]
  44. Peake, S.J. Swimming and respiration. Sturgeons Paddlefish N. Am. 2005, 27, 147–166. [Google Scholar]
  45. Liu, H.; Yin, X.A.; Qiu, X.T.; Qin, J.L.; Yang, W.; Zhang, J. Coupled influence of flow velocity and water temperature on grass carp swimming behavior and gonad development. Hydrol. Process. 2021, 35, e14052. [Google Scholar] [CrossRef]
  46. Christensen, E.A.F.; Svendsen, M.B.S.; Steffensen, J.F. The combined effect of body size and temperature on oxygen consumption rates and the size-dependency of preferred temperature in European perch Perca fluviatilis. J. Fish Biol. 2020, 97, 794–803. [Google Scholar] [CrossRef]
  47. Claireaux, G.; Couturier, C.; Groison, A. Effect of temperature on maximum swimming speed and cost of transport in juvenile European sea bass (Dicentrarchus labrax). J. Exp. Biol. 2006, 209, 3420–3428. [Google Scholar] [CrossRef]
  48. Brown, D.R.; Thompson, J.; Chernick, M.; Hinton, D.E.; Di Giulio, R.T. Later life swimming performance and persistent heart damage following subteratogenic PAH mixture exposure in the Atlantic killifish (Fundulus heteroclitus). Environ. Toxicol. Chem. 2017, 36, 3246–3253. [Google Scholar] [CrossRef] [PubMed]
  49. Patel, H.; Vashi, R.T. Chapter 4—Batch adsorption treatment of textile wastewater. In Characterization and Treatment of Textile Wastewater; Patel, H., Vashi, R.T., Eds.; Elsevier: Amsterdam, The Netherlands, 2015; pp. 111–125. [Google Scholar]
  50. Domenici, P.; Herbert, N.A.; Lefrançois, C.; Steffensen, J.F.; McKenzie, D.J. The effect of hypoxia on fish swimming performance and behaviour. In Swimming Physiology of Fish; Palstra, A.P., Planas, J.V., Eds.; Springer: Berlin/Heidelberg, Germany, 2013; pp. 129–159. [Google Scholar]
  51. Peake, S.J.; Farrell, A.P. Fatigue is a behavioural response in respirometer—Confined smallmouth bass. J. Fish Biol. 2006, 68, 1742–1755. [Google Scholar] [CrossRef]
  52. Shan, H.W.; Geng, Z.X.; Ma, S.; Wang, T. Comparative study of the key enzymes and biochemical substances involved in the energy metabolism of Pacific white shrimp, Litopenaeus vannamei, with different ammonia-N tolerances. Comparative biochemistry and physiology. Toxicol. Pharmacol. CBP 2019, 221, 73–81. [Google Scholar] [CrossRef] [PubMed]
  53. Solstorm, F.; Solstorm, D.; Oppedal, F.; Fernö, A.; Fraser, T.W.K.; Olsen, R.E. Fast water currents reduce production performance of post-smolt Atlantic salmon Salmo salar. Aquac. Environ. Interact. 2015, 7, 125–134. [Google Scholar] [CrossRef]
  54. Newsholme, E.A.; William, T. The role of phosphoenolpyruvate carboxy-kinase in amino acid metabolism in muscle. Biochem. J. 1978, 176, 623–626. [Google Scholar] [CrossRef] [PubMed]
  55. Hägerhäll, C. Succinate: Quinone oxidoreductases. Variations on a conserved theme. Biochim. Biophys. Acta 1997, 1320, 107–141. [Google Scholar] [CrossRef] [PubMed]
  56. Hoffmann, K.; Mustafa, T.; Jørgensen, J. Role of pyruvate kinase, phosphoenolpyruvate carboxykinase, malic enzyme and lactate dehydrogenase in anaerobic energy metabolism of Tubifex spec. J. Comp. Physiol. 1979, 130, 337–345. [Google Scholar] [CrossRef]
  57. Guillen, A.C.; Borges, M.E.; Herrerias, T.; Kandalski, P.K.; de Arruda Marins, E.; Viana, D.G.; de Souza, M.R.; Oliveira do Carmo Daloski, L.; Donatti, L. Effect of gradual temperature increase on the carbohydrate energy metabolism responses of the Antarctic fish Notothenia rossii. Mar. Environ. Res. 2019, 150, 104779. [Google Scholar] [CrossRef]
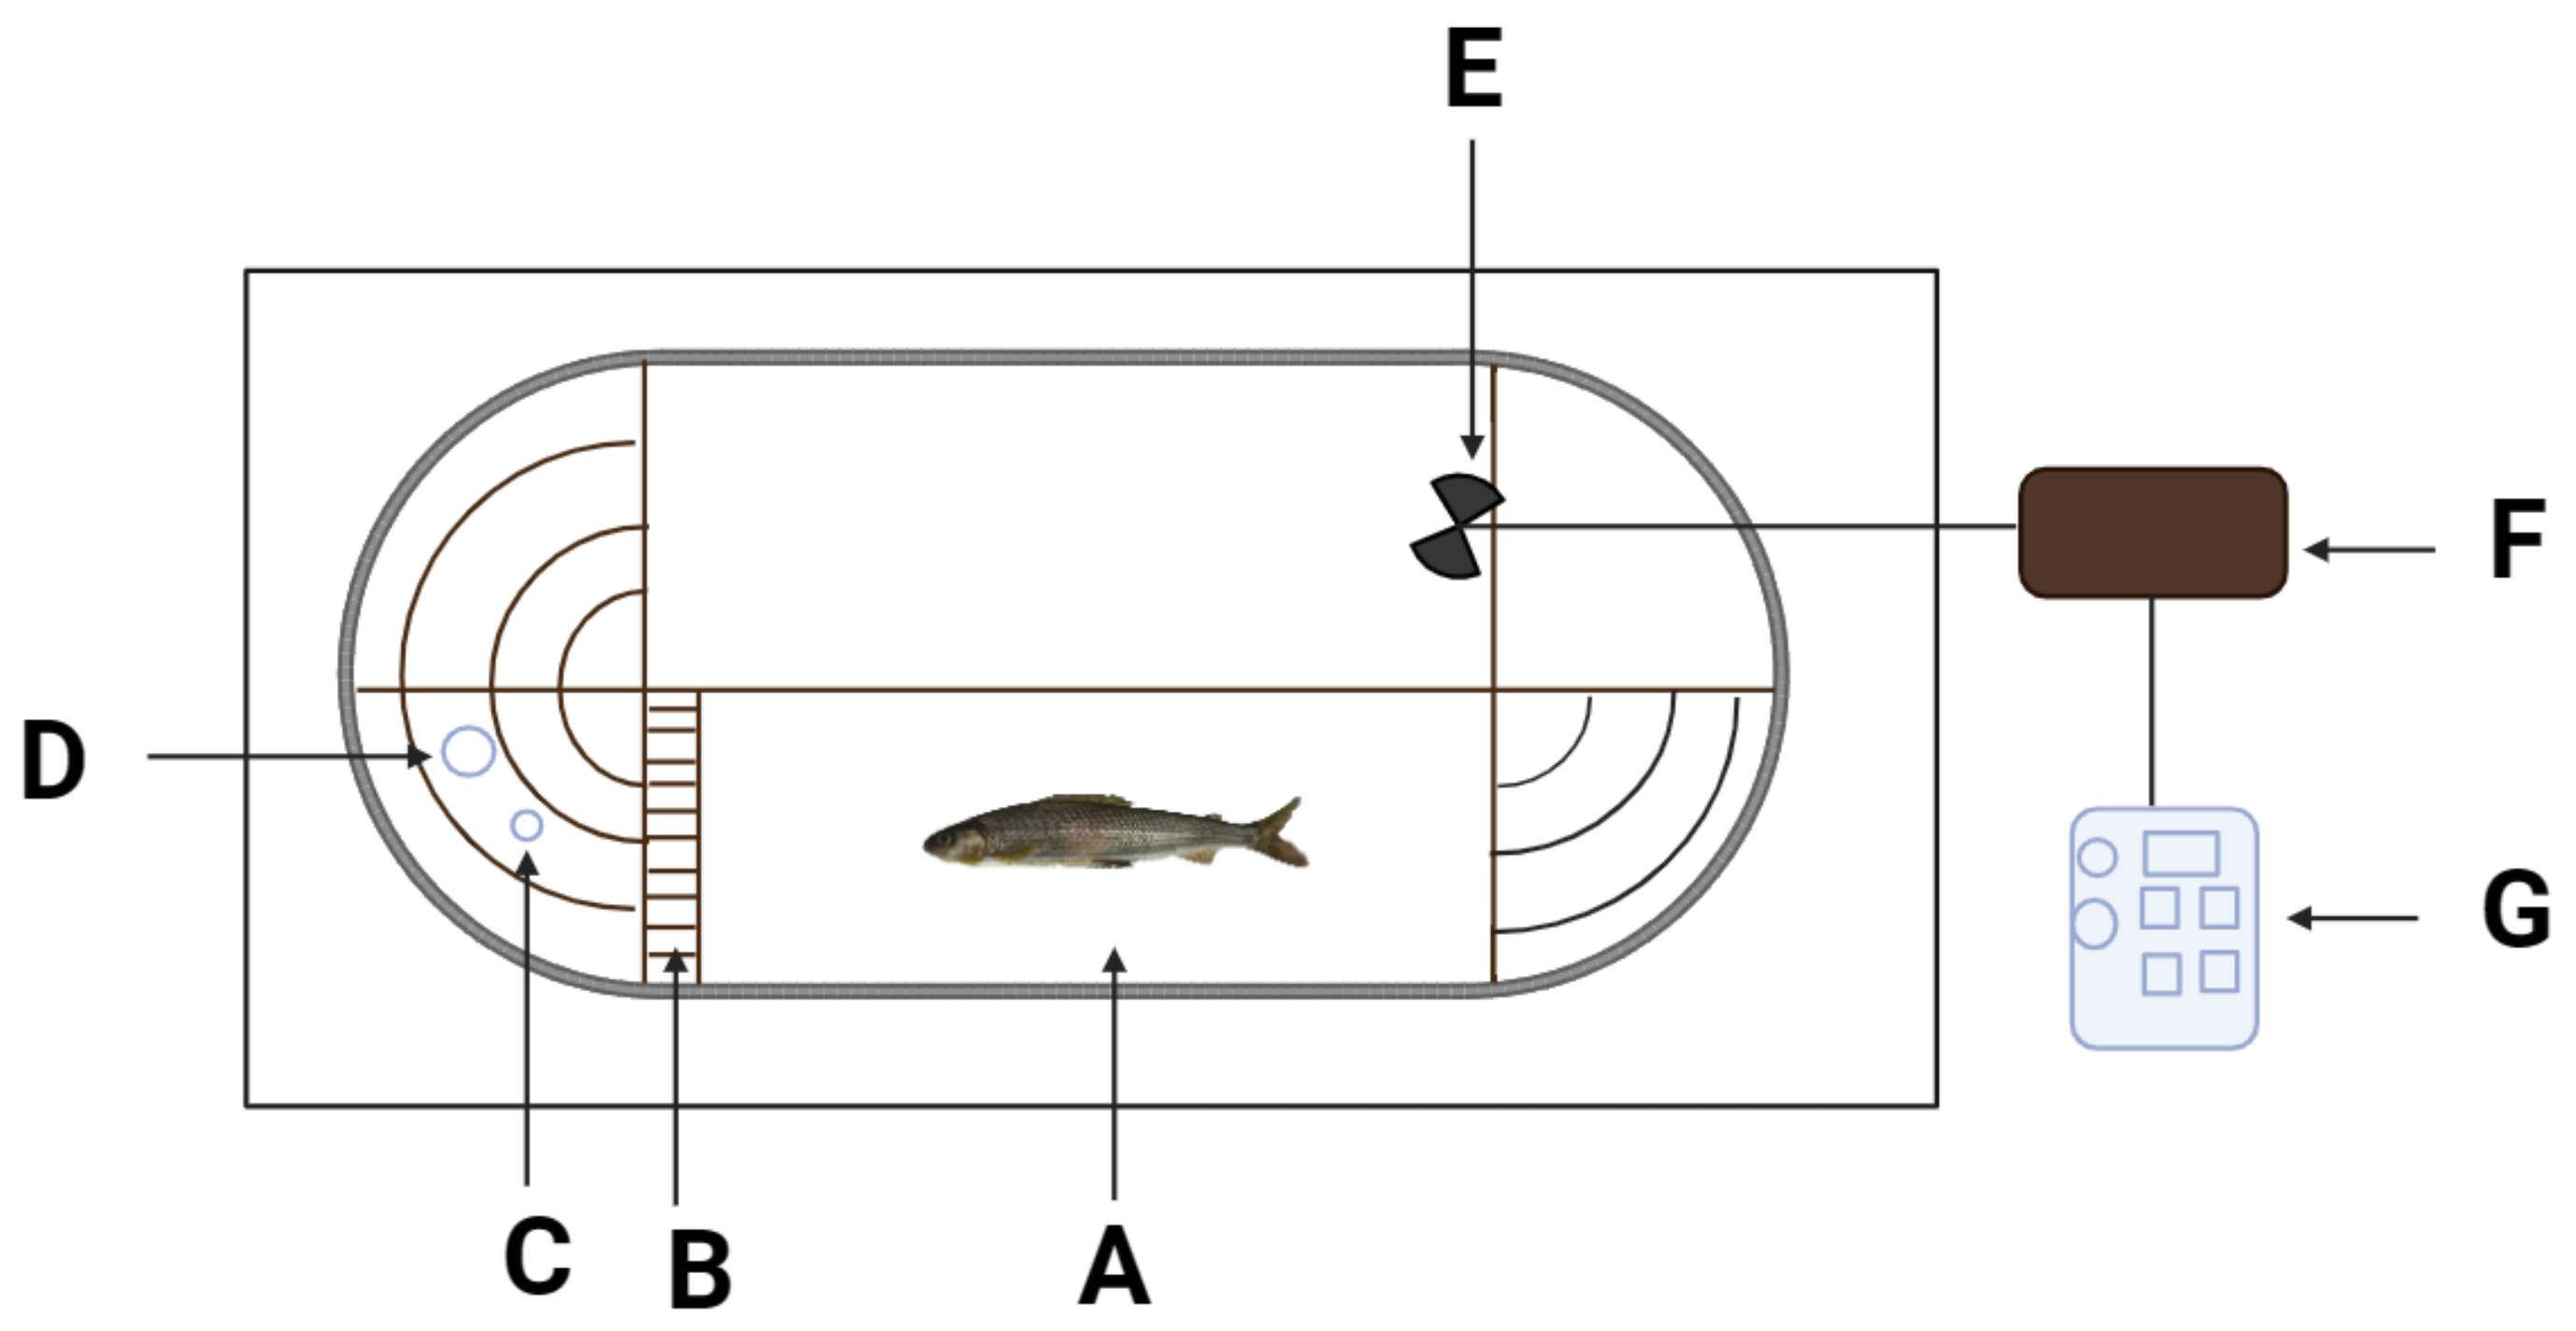
Figure 1. Schematic diagram of the flume-type swimming respirometer: (A) fish swimming area, (B) rectifier, (C) DO probe, (D) temperature sensor, (E) propeller, (F) propeller motor, and (G) frequency changer.
Fishes 09 00272 g001
Figure 2. Relationships between body length and swimming speed for T. grubii: (a) for the linear regression of critical speed (Ucrit) and fish body length, the equation is y = −0.1448x3 + 7.4003x2 − 113.4x + 579.91 (R2 = 0.9586); (b) for the linear regression of burst speed (Uburst) and fish body length, the equation is y = −0.0865x3 + 4.8225x2 − 82.031x + 545.38 (R2 = 0.9731); (c) for the linear regression of relative critical speed (Ucrit’) and fish body length, the equation is y = −0.0085x3 + 0.4168x2 − 6.308x + 33.259 (R2 = 0.8937); and (d) for the linear regression of relative burst speed (Uburst’) and fish body length, the equation is y = −0.0056x3 + 0.3132x2 − 5.8463x + 43.188 (R2 = 0.4689).
Fishes 09 00272 g002
Figure 3. Relationships between oxygen consumption rate and water flow velocity (U, BL/s) for different body lengths: (a) the oxygen consumption rate of group 1 (body length: 16.42 ± 0.86 cm) at different water flow velocities (mean ± SD, n = 6); (b) the oxygen consumption rate of group 2 (body length: 20.50 ± 0.71 cm) at different water flow velocities (mean ± SD, n = 4); (c) the oxygen consumption rate of group 3 (body length: 23.70 ± 0.84 cm) at different water flow velocities (mean ± SD, n = 5); (d) effect of water flow velocity on MO2. The dot types represent the different body length categories. The equations in (ac) are y = 0.04623 + 0.02452x0.39484 (R2 = 0.94803), y = 0.03514 + 0.01284x0.80175 (R2 = 0.91076), and y = 0.03214 + 0.00487x1.83557 (R2 = 0.99464), respectively. Different lowercase letters above the line graphs represent significant differences (p < 0.05) between the groups.
Fishes 09 00272 g003
Figure 4. Glycometabolism-related enzyme activities and physiological index content in the Amur grayling. LDH (a), PK (b), HK (c), and SDH (d) activities in the liver. Different lowercase letters indicated significant differences (p < 0.05) among the different water flow velocities (U, BL/s). Data are presented as the mean ± SD (n = 3).
Fishes 09 00272 g004
Figure 5. Biochemical substance content in the Amur grayling at different water flow velocities (U, BL/s): (af) variations in the content of hepatic glycogen (a), glucose (b), muscle glycogen (c), creatine phosphate (CP, (d)), plasma lactic acid (e), and muscle lactic acid (f) of the Amur grayling at different flow velocities. The letters indicate a significant difference (p < 0.05) between treatments. Data are presented as the mean ± SD (n = 3).
Fishes 09 00272 g005
Table 1. Parameters and linear regression analysis.
Swimming IndexSample SizeAge/yearsWet Wight/gBody Length/cmWater TemperatureRegression EquationpR2
Critical swimming speed103+/16.65 ± 2.658.88 ± 0.069y = −0.1448x3 + 7.4003x2 − 113.4x + 579.91p < 0.05R2 = 0.9586
Burst swimming speed10/17.7 ± 2.859.53 ± 0.085y = −0.0865x3 + 4.8225x2 − 82.031x + 545.38p < 0.05R2 = 0.9731
Relative critical Swimming speed10/16.65 ± 2.658.88 ± 0.069y = −0.0085x3 + 0.4168x2 − 6.308x + 33.259p < 0.05R2 = 0.8937
Relative burst swimming speed10/17.7 ± 2.859.53 ± 0.085y = −0.0056x3 + 0.3132x2 − 5.8463x + 43.188p < 0.05R2 = 0.4689
Oxygen consumption rate (group 1)63+50.43 ± 5.21 d16.42 ± 0.86 d9.57 ± 0.09 ay = 0.04623 + 0.02452x0.39484p < 0.05R2 = 0.94803
Oxygen consumption rate (group 2)44+122.73 ± 6.14 b20.50 ± 0.71 b8.99 ± 0.06 ay = 0.03514 + 0.01284x0.80175p < 0.05R2 = 0.91076
Oxygen consumption rate (group 3)55+165.81 ± 18.77 a23.70 ± 0.84 a9.28 ± 0.02 ay = 0.03214 + 0.00487x1.83557p < 0.05R2 = 0.99464
Biochemical indicator124+111.91 ± 21.3021.06 ± 1.659.55 ± 0.082///
Notes: Different lowercase letters represent significant differences (p < 0.05) between the groups. “+” represent age ranges, such as the age of 3 to 4 years is indicated by 3+.
Disclaimer/Publisher’s Note: The statements, opinions and data contained in all publications are solely those of the individual author(s) and contributor(s) and not of MDPI and/or the editor(s). MDPI and/or the editor(s) disclaim responsibility for any injury to people or property resulting from any ideas, methods, instructions or products referred to in the content.