Article

Ontogenetic, Spatial and Inter-Annual Variability in the Diet of European Hake Merluccius merluccius Linnaeus, 1758, in the North Aegean Sea

by
Athanasios Evangelopoulos
*,
Antonios Geropoulos
,
Nikolaos Kamidis
and
Emmanouil Koutrakis
Fisheries Research Institute, Hellenic Agricultural Organization—DIMITRA, Nea Peramos, 64007 Kavala, Greece
*
Author to whom correspondence should be addressed.
Fishes 2024, 9(7), 257; https://doi.org/10.3390/fishes9070257
Submission received: 19 May 2024 / Revised: 24 June 2024 / Accepted: 1 July 2024 / Published: 2 July 2024
(This article belongs to the Section Biology and Ecology)

Abstract

:
This study contributes to filling knowledge gaps regarding recent information on the diet of the European hake, Merluccius merluccius Linnaeus, 1758, in the Greek seas, particularly its ontogenetic shifts and its spatiotemporal variability. The trophic preferences of M. merluccius were investigated in the North Aegean Sea during the summers of 2019 to 2023 with visual stomach content analysis to assess its composition, diversity, and variability across body-size classes, years, and subareas. The identified prey are functionally diverse and in many cases also primary targets for local fisheries. The ontogenetic trophic niche of hake was characterized by two distinct shifts, delineated by 10 and 50 cm body-size thresholds. Cephalopods were a prevalent dietary component for large hake individuals. The intermediate body-size classes demonstrated greater trophic niche breadth concerning prey diversity and absolute prey-size ranges. A feeding strategy characterized by the specialization of individuals was also revealed. The effect of the temporal and spatial context on the hake diet was occasionally correlated with spatiotemporal variations in the sizes of their populations. In conclusion, ontogenetic and spatiotemporal variability in the hake diet were found to be significant and should be considered in the data collection design and analyses of the trophic interactions of the species.
Key Contribution: This study provides comprehensive recent information on the ontogenetic and spatiotemporal variability of the diet of European hake in the North Aegean Sea, thereby contributing to filling important knowledge gaps regarding a major biological resource and key component of the marine food web in the Mediterranean.

1. Introduction

Merluccius merluccius Linnaeus, 1758 (European hake, hereafter hake) is an important demersal and benthopelagic predator of the continental shelf and upper-slope ecosystems of the Mediterranean [1]. It is also one of the main fisheries-targeted species in its distribution range [2]. Hake has been reported to be the most overexploited stock across the Mediterranean Sea [3], where its landings have decreased from 52,394 tonnes in 1994 to 17,824 tonnes in 2021 [4]. Moreover, undersized individuals still constitute a large part of hake catches and are either discarded or landed [5], despite the endorsement of legislation regulating minimum conservation reference size and minimum trawl codend mesh sizes for hake [6,7]. However, hake stock status in the Mediterranean has been assessed to be slowly improving at a regional scale, demonstrating a stable average F/FMSY overexploitation ratio [4]. In Greece, hake is among the main fisheries-targeted demersal species [8,9]. Its abundance is higher at depths of 100–200 m, while it is fished down to 550 m [10], principally in the North and Western Aegean Sea, mainly with trawlers, as well as longliners and netters [10]. Hake production decreased in the Aegean Sea from 4867 tonnes in 1994 to 2744 tonnes in 2021 [11] and the status of hake stock in the Aegean Sea has been characterized as bad (ratio of observed biomass to the biomass that would provide maximum sustainable yield, B/BMSY = 0.52) and overexploited (ratio of observed fishing mortality to the fishing mortality that would produce maximum sustainable yield, F/FMSY = 1.57) [12].
Hake, an active predator of mobile and patch/school-forming prey [2,10,13], exhibits dynamic feeding habits. It engages, particularly young individuals, in diel vertical movements to pursue migrating prey, thus linking the pelagic and benthic domains [10]. Research has also indicated significant ontogenetic variation in hake’s diet, alongside seasonal, bathymetric, and geographic variability [10,14]. Numerous studies have explored the trophic preferences of hake in the Mediterranean, investigating both ontogenetic diet changes and spatial variability [15,16,17,18,19]. However, there remains a notable paucity of published time-series data on hake diet variability in the Mediterranean, with few exceptions [20]. Furthermore, recent research using DNA metabarcoding [21,22] or stable isotope analysis [23] has shed light on the intricate trophic relationships of Mediterranean hake, offering insights beyond what visual stomach contents analysis is capable of revealing. While the diet of hake has been extensively studied in the Greek seas [10,24,25,26,27], relevant literature has become scarce since the 2000s. Moreover, data on the temporal variability of its diet in the Greek seas are not available. Similarly, besides qualitative insights [28] and data on the diet of young hake individuals [29], detailed quantitative data on ontogenetic shifts in the diet of hake in the area are lacking in the peer-reviewed literature.
The ecosystem-based approach to fisheries management (EBFM) [30,31] has received support from the EU through initiatives such as the Common Fisheries Policy (CFP) [32], the Marine Strategy Framework Directive (MSFD) [33], and the Marine Spatial Planning Directive (MSPD) [34]. Accordingly, EU member states have been gathering data on trophic interactions of priority species within the multiannual EU program for the collection, management, and utilization of fisheries sector data (EU MAP). This EU MAP activity aims to inform assessments of the impacts of fisheries on biological marine resources, e.g., stock assessments and ecosystem models, with data on key components of the food web regarding their trophic interactions and natural mortalities. The collection of stomach samples was integrated into EU MAP as a pilot study from 2019 until 2021, and has become a regular component since 2022. Given its significance as both a primary target in Mediterranean fisheries and a key component in the marine food webs of the region, acting as both predator and competitor for species targeted by fisheries [2], hake has been selected as the first target species for stomach sampling in the Mediterranean under EU MAP.
This study quantifies and evaluates the ontogenetic, spatial, and inter-annual variability of the trophic preferences of hake in the North Aegean Sea, using a spatiotemporal resolution that has not been offered by previous studies in the area. The aim of the study is to provide comprehensive and up-to-date information that could enhance our understanding of the trophic interactions of hake in the marine food webs in the area. The assessment was based on the visual analysis of the contents of hake stomachs collected in the North Aegean Sea during the summers of 2019 to 2023 within the framework of EU MAP.

2. Materials and Methods

2.1. Study Area

The study area comprised the North Aegean Sea (Figure 1), which is spatially divided into five subareas according to the Greek multiannual program: Northeastern Aegean Sea (CHIO-MIT), Evia (EVIA), Thermaikos Gulf and adjacent seas (THERM), Thracian Sea (THR-LIM), and Thessaly and Sporades Islands (VOL-SPOR). Commercial fisheries in the North Aegean Sea are characterized by high catches of small pelagic fish predominantly captured by purse seiners. Bottom trawls are employed to target hake, mullets, shrimps, and cephalopods, while multi-gear small-scale coastal fisheries target a variety of pelagic and demersal species [35]. In 2022, the total quantity of small- and medium-scale fisheries landings in the North and Northeastern Aegean Sea reached 35,636 tonnes, constituting 55% of the overall Greek fisheries landings. The highest landings took place in the Thracian Sea (16,299 tonnes) and the area of Thermaikos Gulf and adjacent seas (14,121 tonnes), while landings in the Northeastern Aegean Sea amounted to 3630 tonnes [36]. Hake landings by trawlers in the North Aegean Sea during 2019–2022 ranged from 1318 to 1370 tonnes, corresponding to 59–66% of the hake landings by trawlers in Greece. Total hake production in the North Aegean Sea in 2022 was 2135 tonnes, 51% of the total hake production in Greece [36].

2.2. Field Work

The hake samples were collected in the International Bottom Trawl Survey in the Mediterranean (MEDITS) samplings conducted by the Fisheries Research Institute in the North Aegean Sea during the summers of 2019 to 2023 (June–July) in the framework of EU MAP (Figure 1). Fishing was carried out with an experimental bottom trawl with a codend net mesh opening of 40 mm, and a standard cruising speed of 3 knots. The duration of the hauls was 30 min for stations shallower than 200 m, and 60 min at deeper stations. All hake samples were collected during daylight hours, from late in the morning to early in the afternoon.
Sampling and lab analysis of the stomachs were implemented using the protocols and guidelines originally recommended in deliverable D3.3 of the MARE/2014/19 “Strengthening regional cooperation in the area of fisheries data collection in the Mediterranean and Black Sea” project [37] and further elaborated in the report of the RCG-Med&BS-organized “Workshop on Sampling, Processing, and Analyzing the Stomach Contents (WKSTCON)” that was held at Palma de Mallorca, Spain, in 2018 [38], and in deliverable D4.1 of the MARE/2016/22 “Strengthening regional cooperation in the area of fisheries data collection in the Mediterranean and Black Sea (STREAM)” project [39].
Total length (mm) and total weight (g) of hake individuals were measured onboard. In each annual survey, hake individuals were sampled for every one of six 100 mm (TL) body-size classes: 0 (<100 mm), 1 (100–199 mm), 2 (200–299 mm), 3 (300–399 mm), 4 (400–499 mm), and 5 (>500 mm). Sample collection aimed to reach an annual total of at least 100 stomachs. The fish were dissected, and non-everted stomachs were removed and preserved in a freezer at −20 °C until their analysis in the lab.

2.3. Lab Work

In the lab, the stomachs were partitioned between those that contained prey items (“full stomachs”), and those that did not (“empty stomachs”). The stomachs that contained only mucus that was over 0.2% of body weight were considered full [40] and were included as such in the calculation of the vacuity and repletion indices. The stomachs were weighed and then dissected for the removal of prey items, which were identified to the lowest possible taxonomic level, counted, and weighed to the nearest 0.01 g. Taxonomic identification of the prey items was carried out macroscopically, or with the aid of a stereomicroscope for prey items of small body sizes. Furthermore, the identification of fish species was aided by microscopic examination of the otoliths.

2.4. Data Analysis

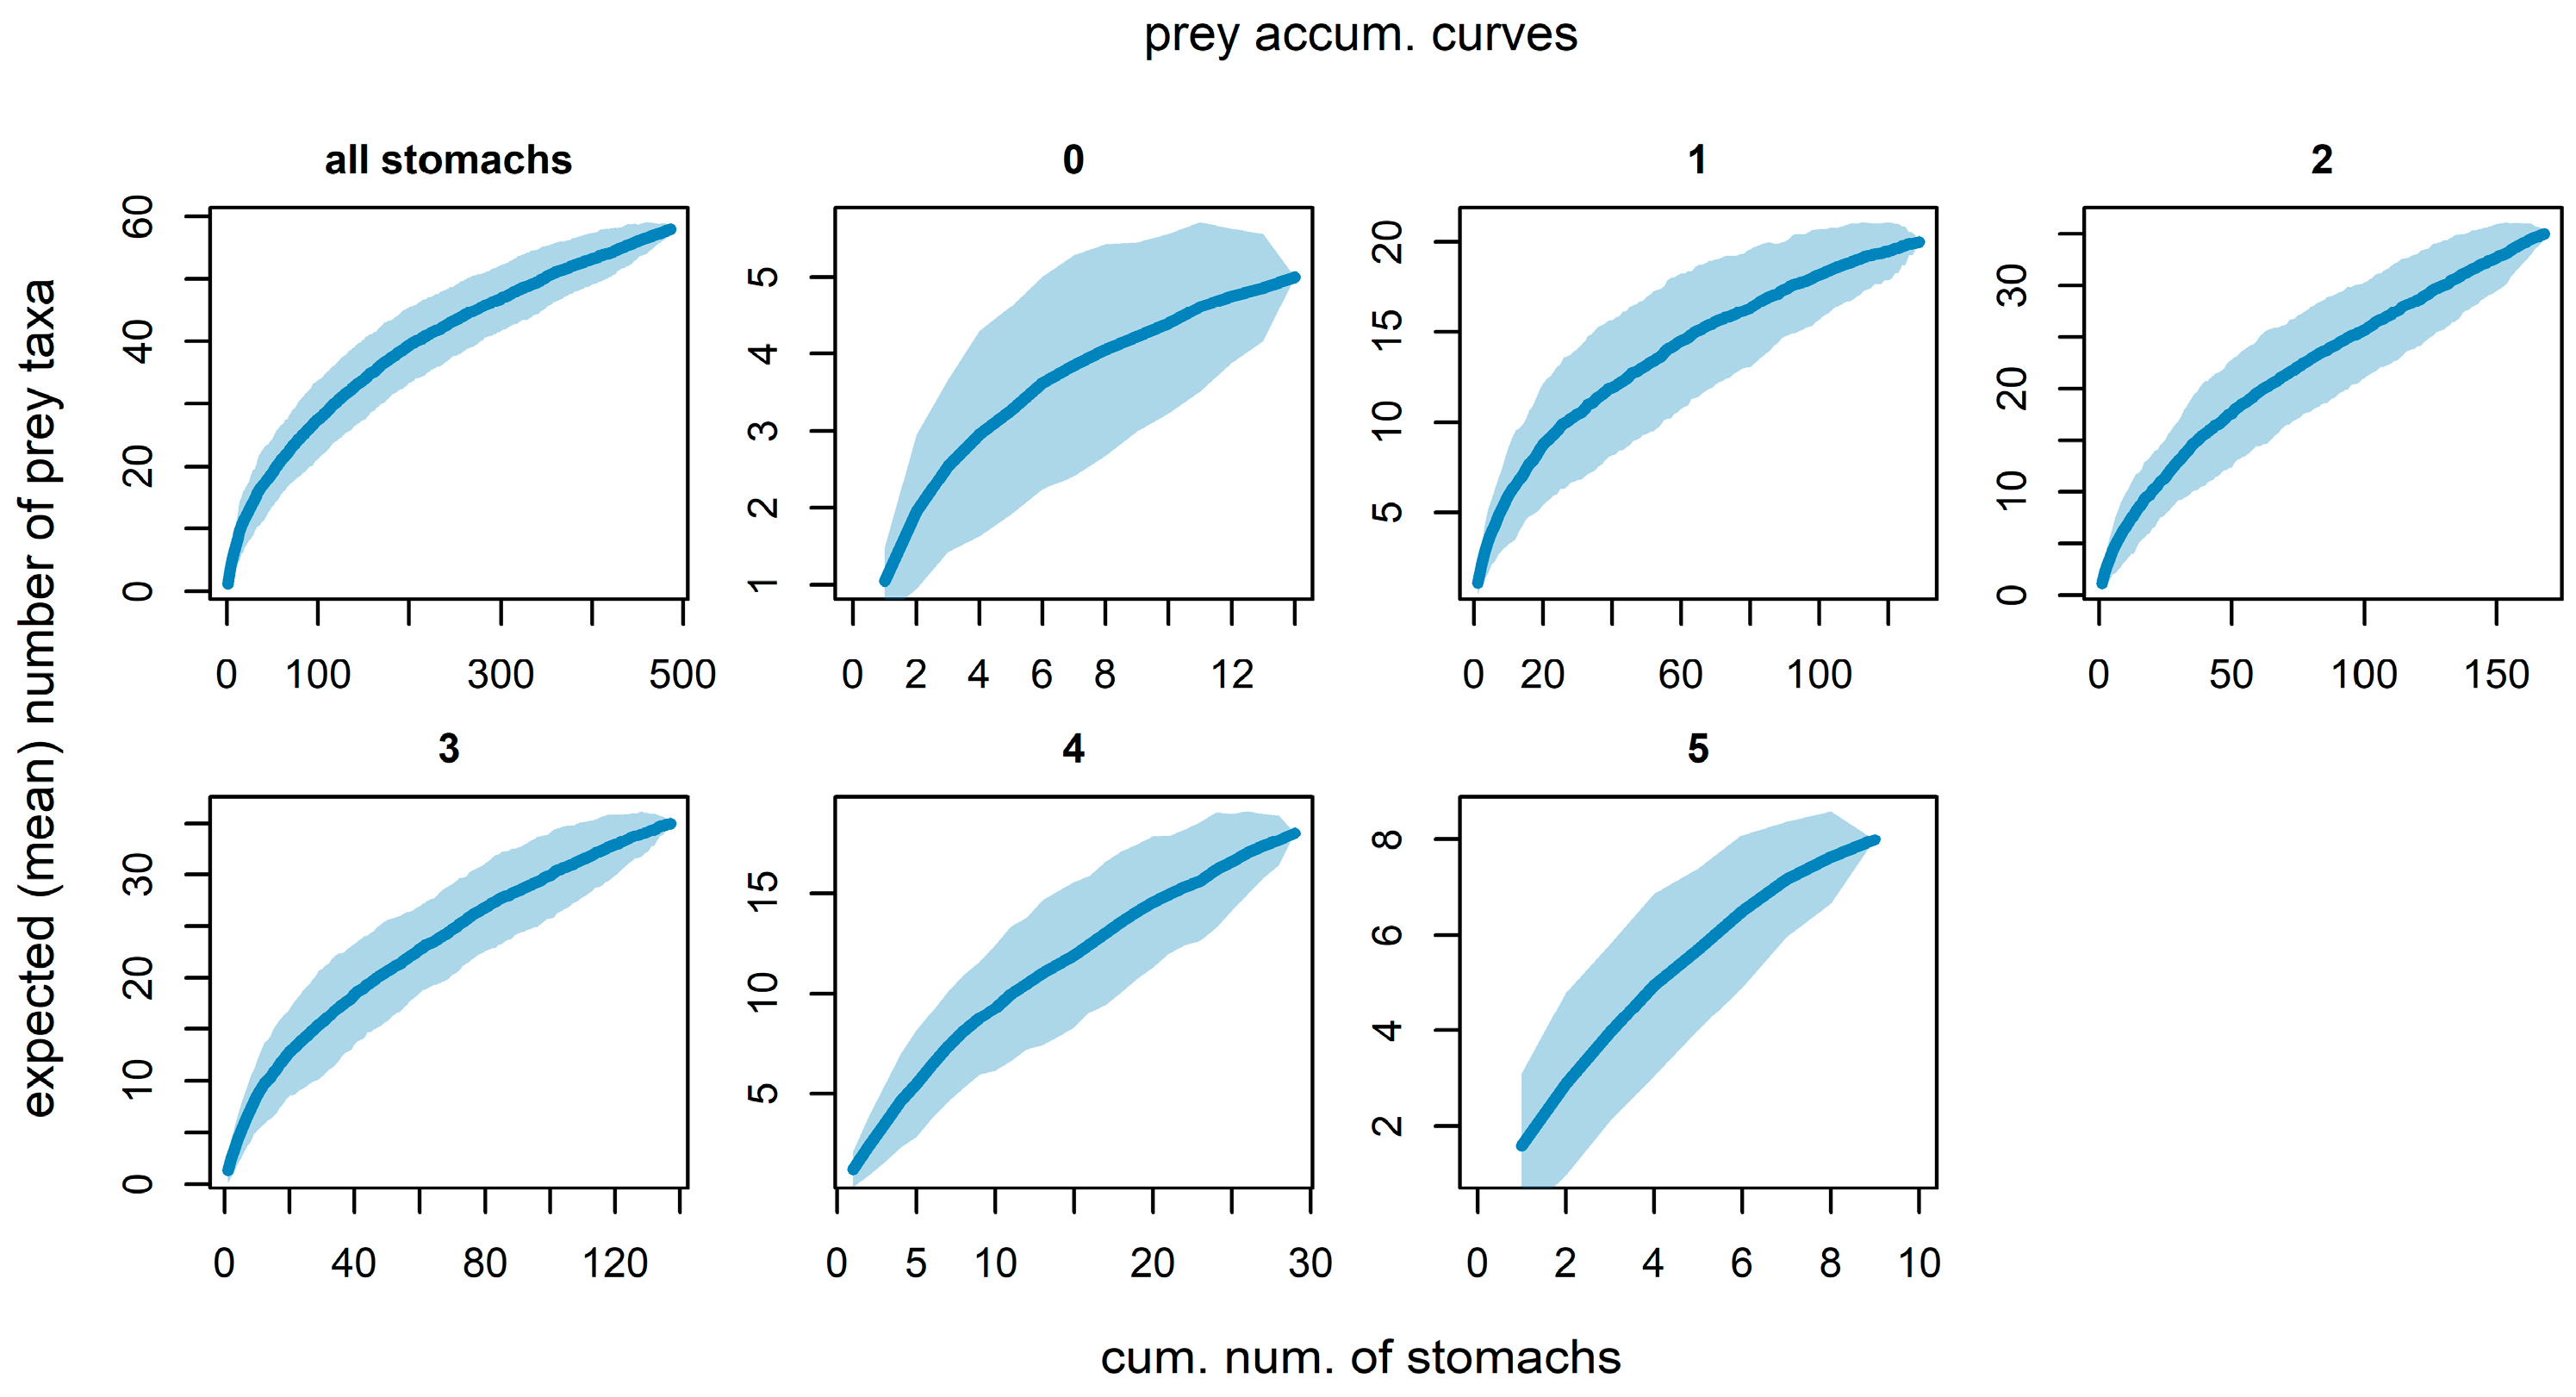
To evaluate whether the number of stomachs was sufficient for a valid characterization of hake diet, prey accumulation curves were computed [41,42].
Feeding intensity was assessed with the vacuity index [43] and the repletion index [44]. The vacuity index (VI) was calculated as the percentage of the analyzed stomachs that were empty, whereas the repletion index (RI) was calculated as the ratio of stomach contents weight to body weight, expressed as a per-thousand value. The χ2 test of independence was used to test for the null hypothesis that the proportions of full and empty stomachs were independent of body-size class, year, or subarea. Permutational multivariate analysis of variance (PERMANOVA) [45] was used to test for statistically significant differences in stomach repletion between body-size classes, years, and subareas. PERMANOVA was run on a Euclidean similarity matrix of the hake individuals computed on the RI index values. All factors were treated as fixed in the analysis design. The sum of squares type selected was Type III (partial), and the permutation method involved a permutation of residuals under a reduced model for the three-way layout or unrestricted permutation of raw data for the one-way layout. The number of permutations was set at 9999.
PERMANOVA was also used to test for statistically significant differences in the composition of the diet of hake, both by numbers and by weight, between years, subareas, and body-size classes. Three-way layout PERMANOVA was run on a Bray–Curtis similarity matrix of the hake stomachs computed on the prey numbers or weights values. All factors were treated as fixed in the analysis design. The sum of squares type selected was Type III (partial), and the permutation method involved a permutation of residuals under a reduced model. The number of permutations was set at 9999.
The proportions of prey taxa in the stomach contents were calculated with the frequency of occurrence, and the numerical and gravimetric methods [46]:
The frequency of occurrence of a prey taxon in the stomach contents was calculated as:
% F i = S i / S F   × 100
where Si is the number of stomachs that contained prey i, and SF is the number of full stomachs.
The percentage of the total number of prey individuals in the stomach contents belonging to a prey taxon was calculated as:
% N i = ( n i / i = 1 Q n i ) × 100
where ni is the total number of prey taxon i individuals and i = 1 Q n i is the total number of individuals of all prey taxa (Q) in all full stomachs.
The percentage of the total weight of prey in the stomach contents belonging to a prey taxon was calculated as:
% W i = ( w i / i = 1 Q w i ) × 100
where wi is the total wet weight of prey taxon i and i = 1 Q w i is the total wet weight of all prey taxa (Q) in all full stomachs.
The relative importance of each prey taxon in the diet of hake was estimated with the calculation of the % form of the Index of Relative Importance (IRI) [47]. This index combines the information provided by the %F, %N, and %W indices in a single value. A modified version of IRI [48] was used, which is calculated as:
I R I i = N i + W i × F i
The calculation of the % form of IRI was carried out as follows [49]:
% I R I i = ( I R I i / i = 1 Q I R I i ) ×   100
The trophic preferences of hake, including the variations between body-size classes, years, and subareas, was assessed primarily based on the %IRI index values. The data for the %F, %N, and %W indices are provided in Supplementary Table S1 and illustrated in Supplementary Figures S1–S3.
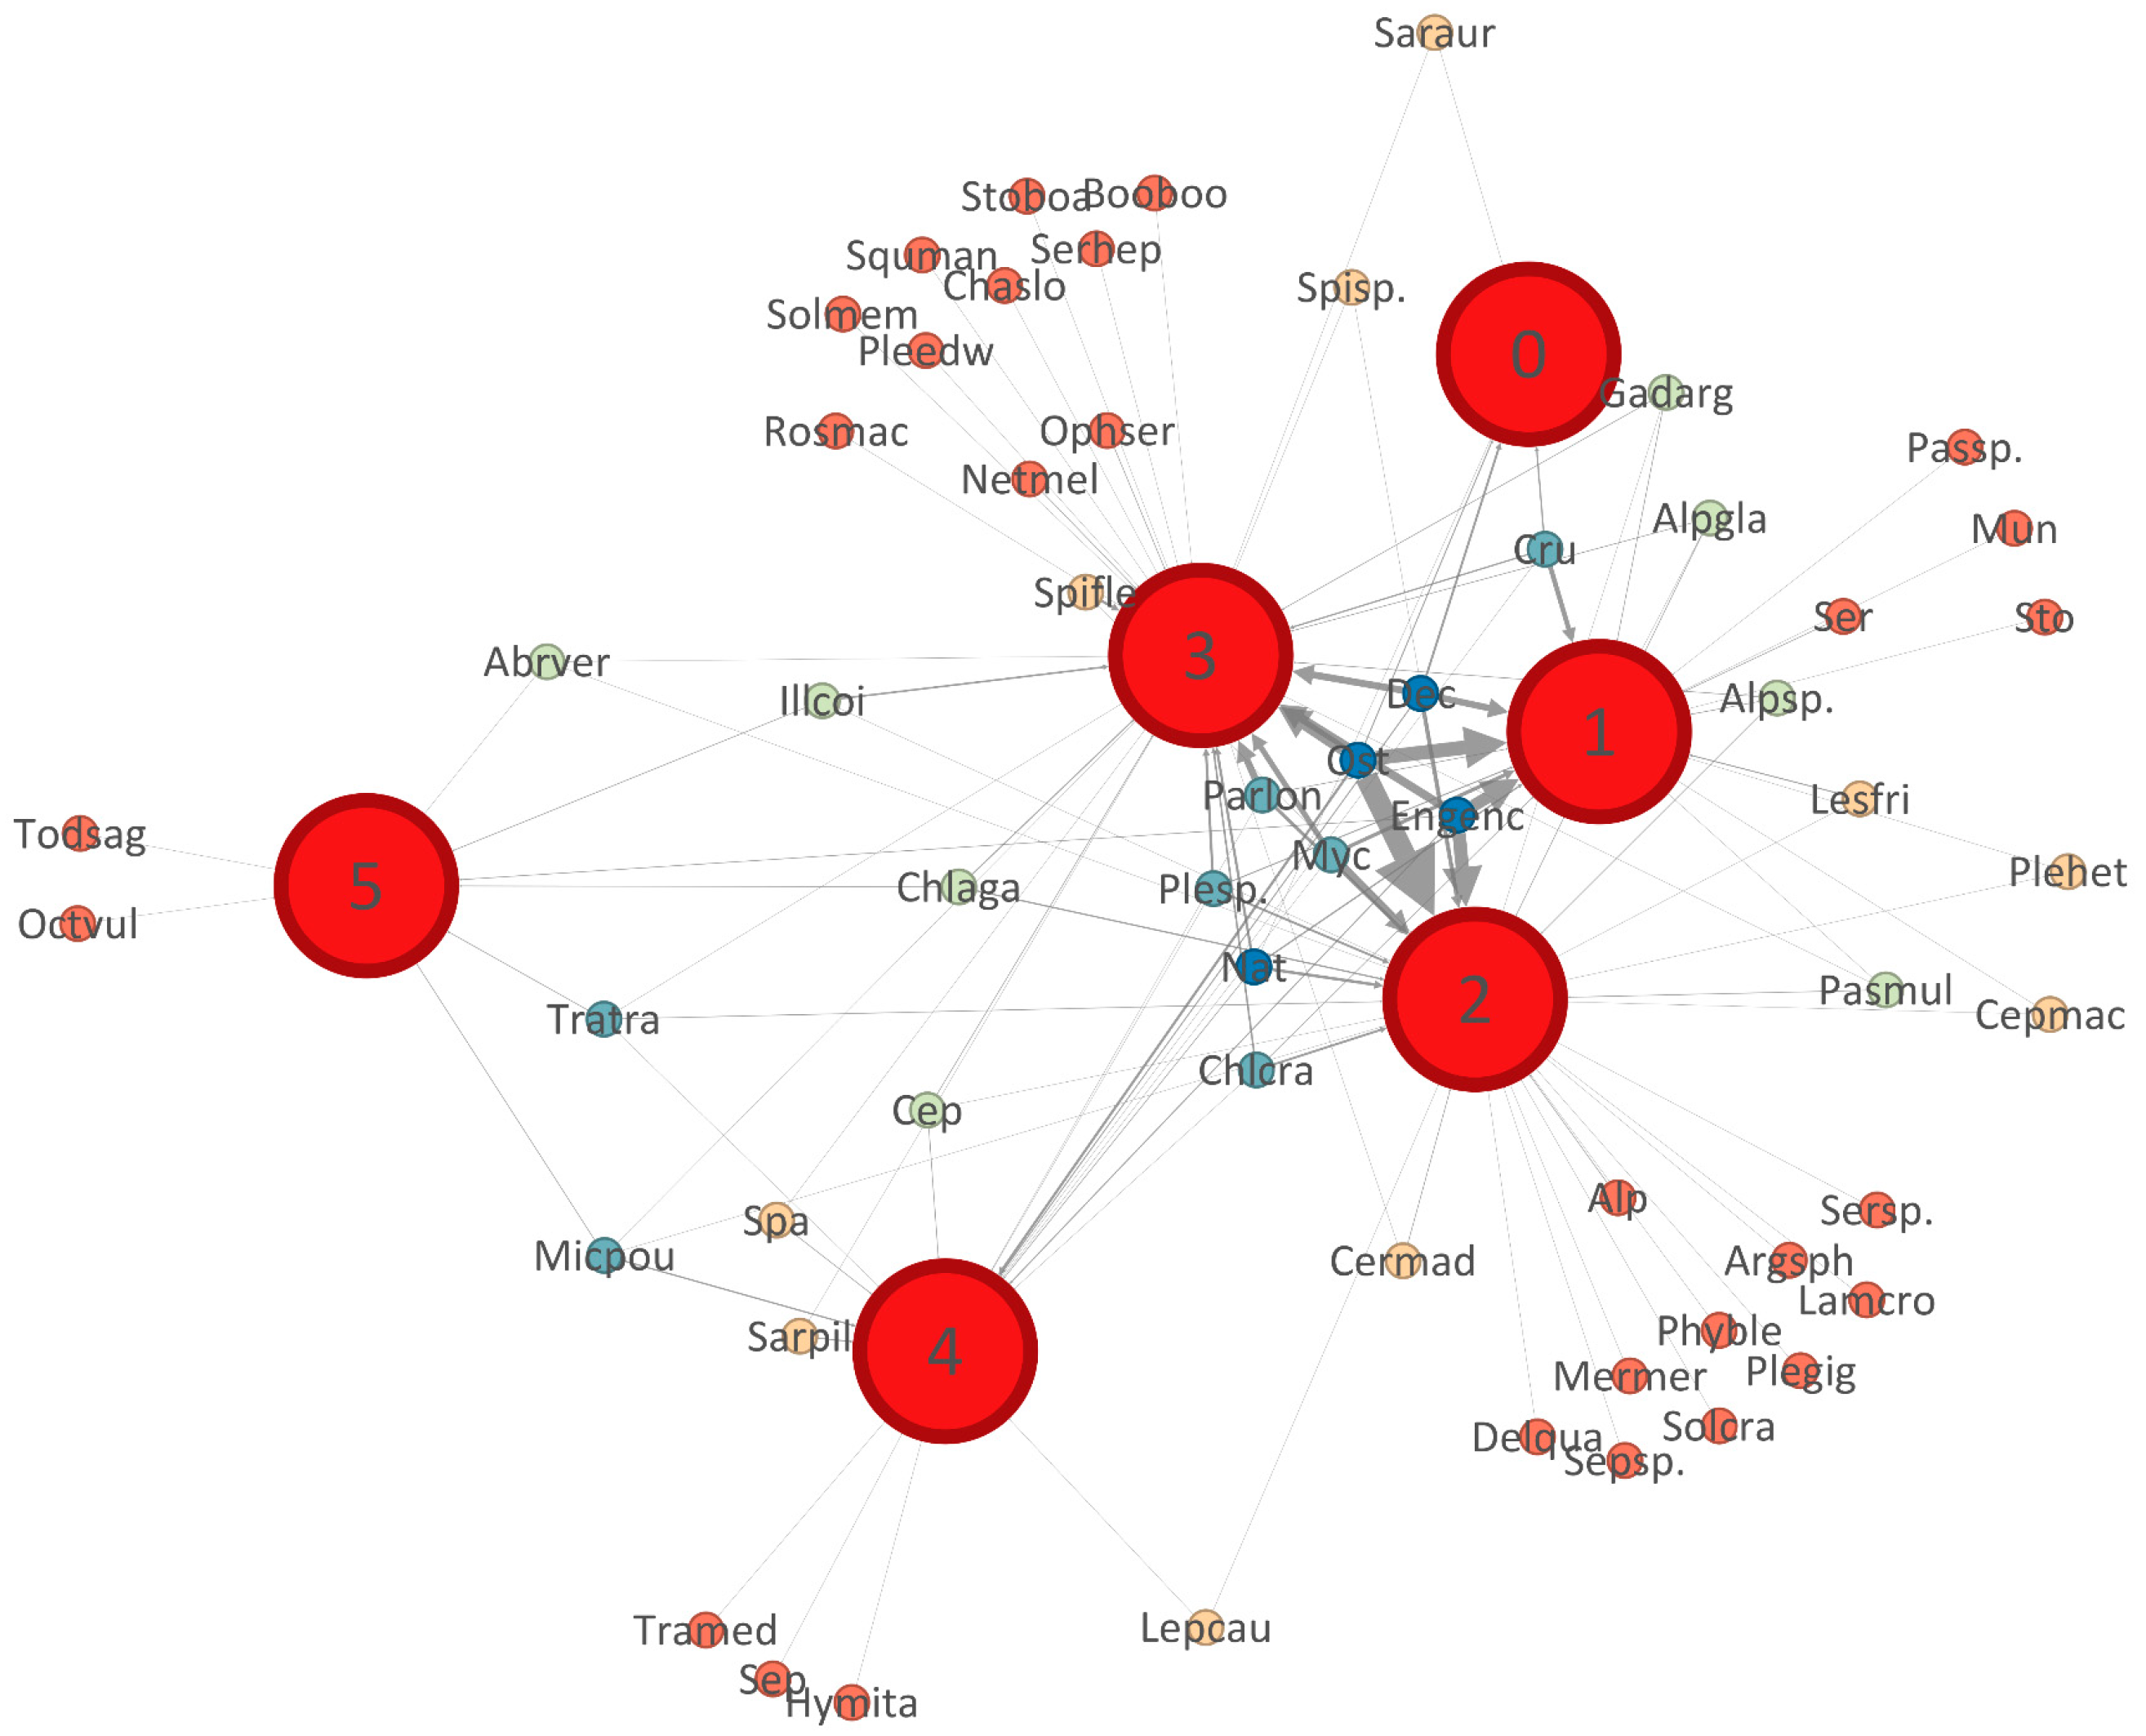
The trophic links between hake size classes and their prey were represented in a prey–predator network graph, aiming to depict the trophic preferences of size classes while distinguishing between shared and size-class specific prey. The network graph allowed the differentiation of prey according to their out degrees, which correspond to the number of hake size classes that used them. It also depicts the strength of the trophic links via variations in edge width. The graph was laid out with the “force-atlas” algorithm.
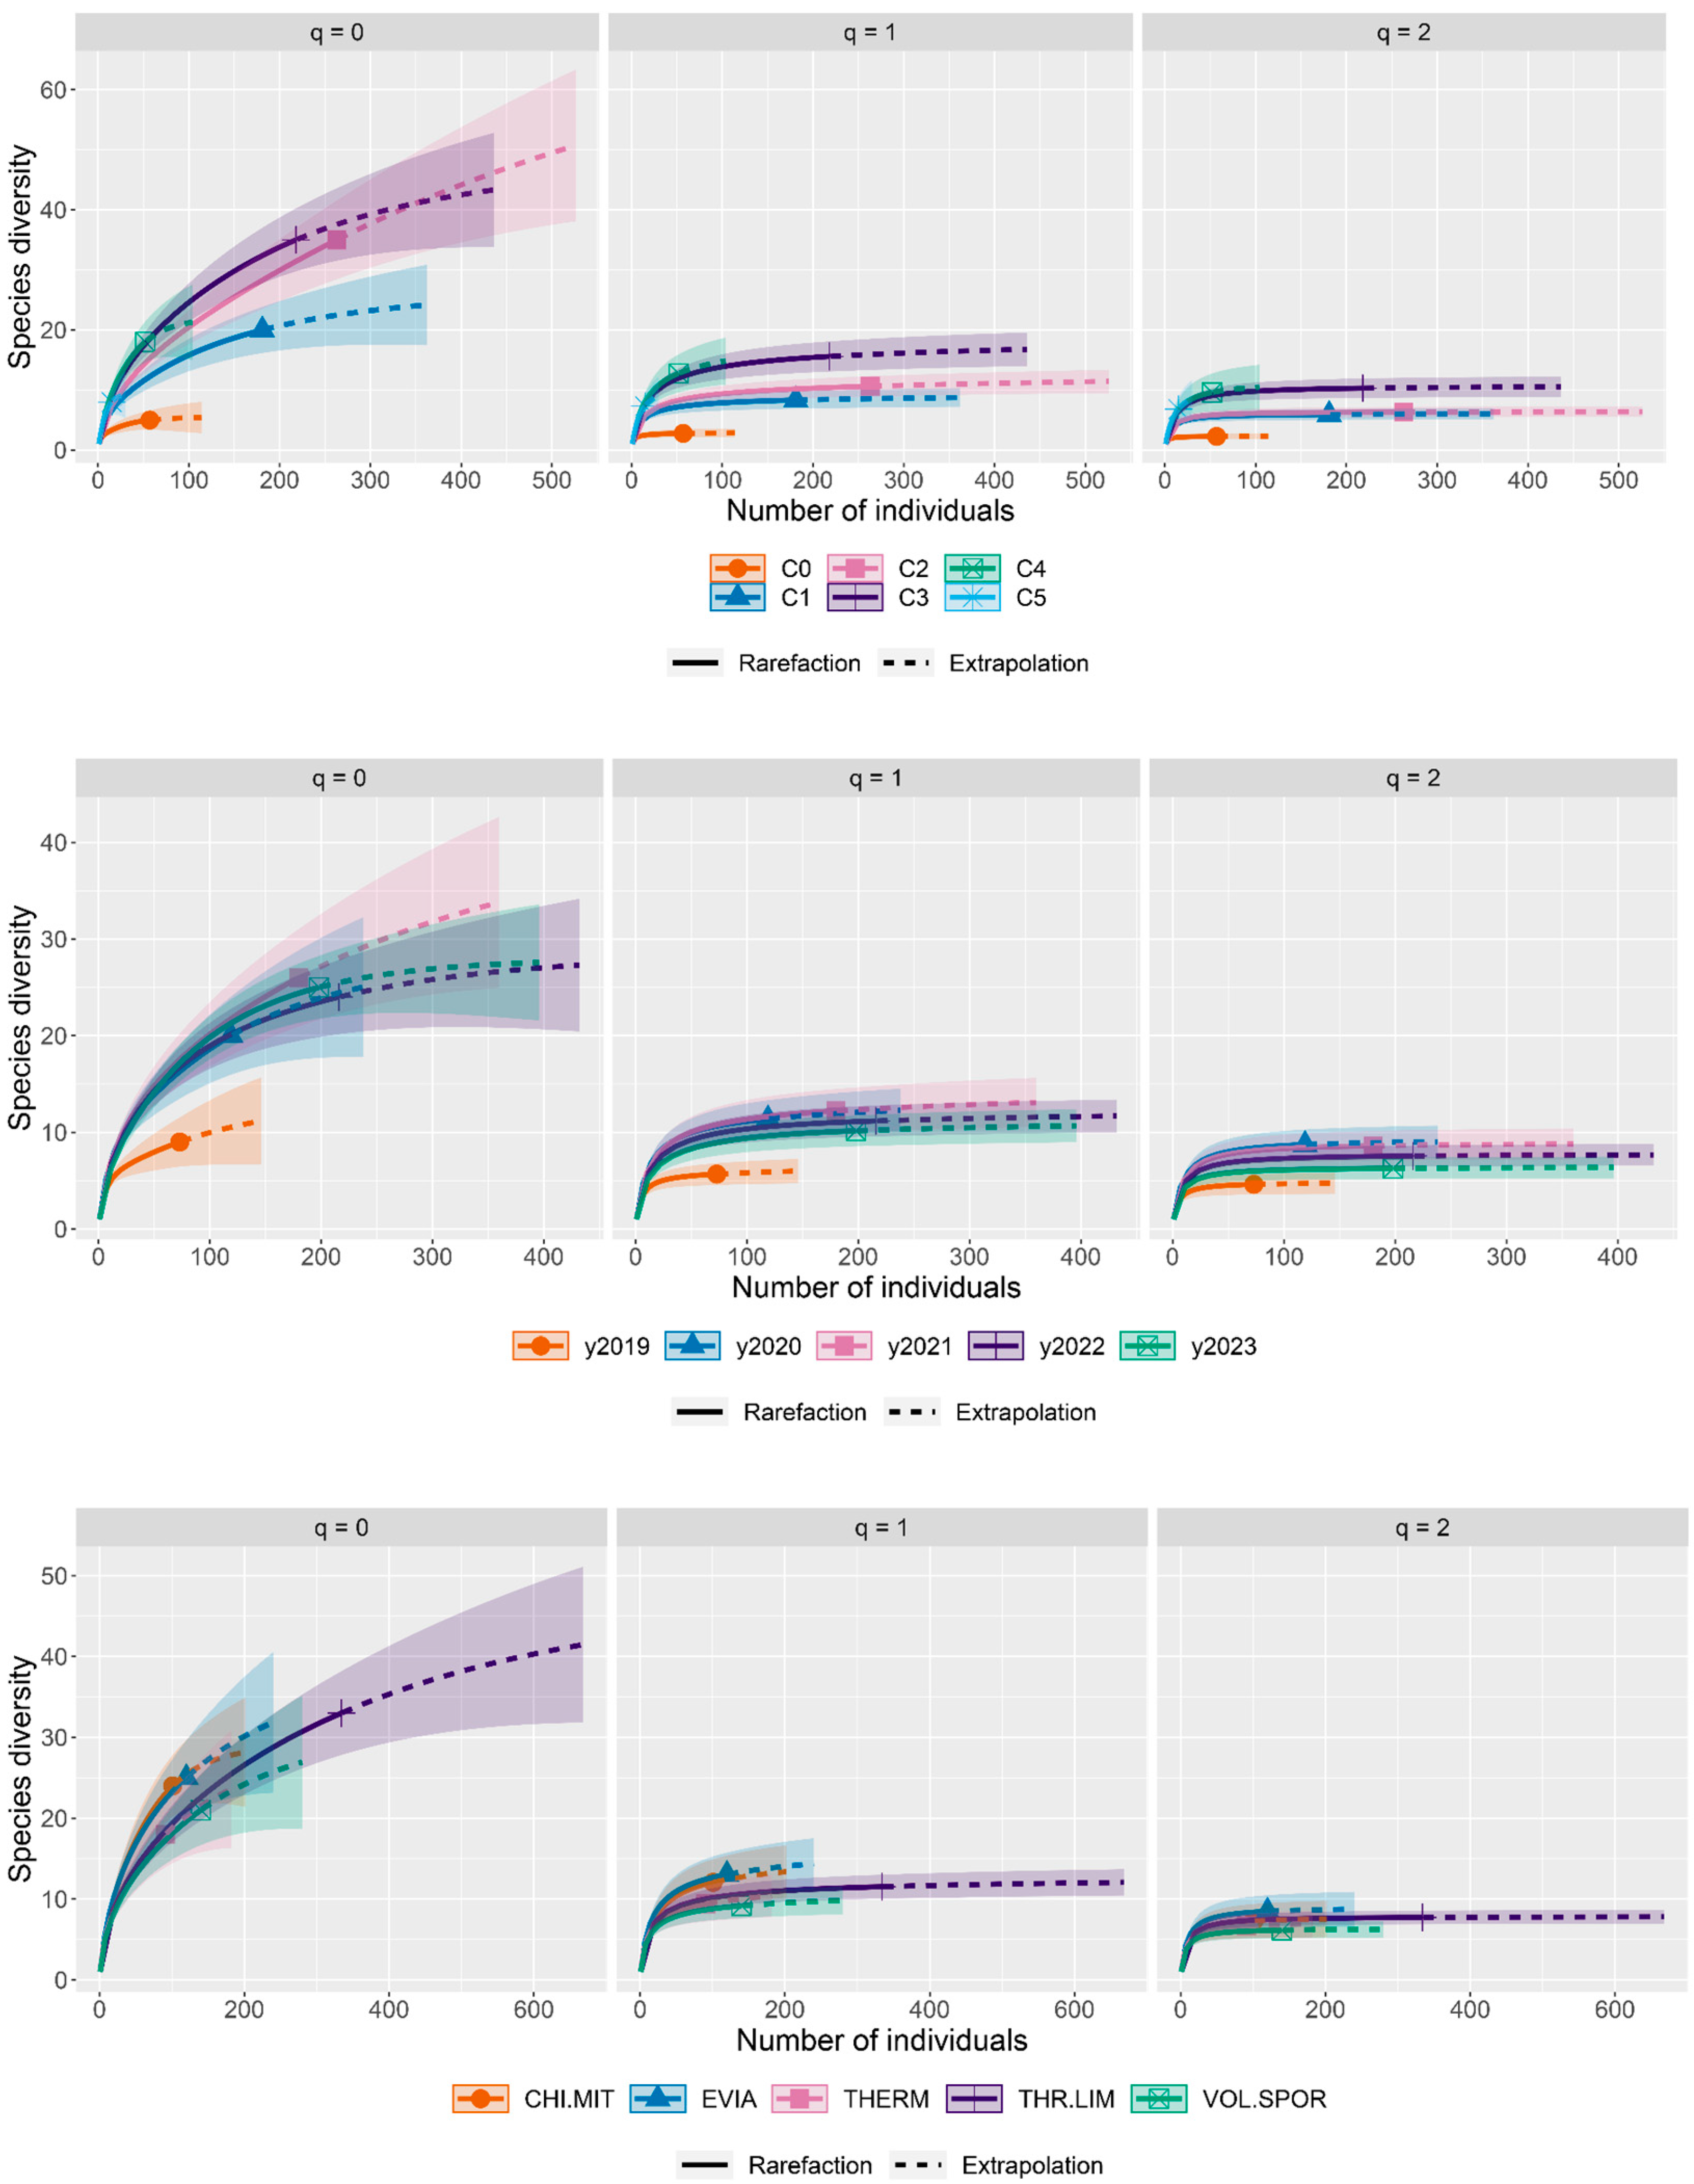
The richness and diversity of prey taxa in stomach contents were estimated aiming to quantify the width of the trophic niche width of hake and assess its variability between body-size classes, years, and subareas. The indices used measure diversity in units of effective numbers of species; i.e., the number of equally abundant species that would be needed to give the same value of a diversity measure [50,51]. Moreover, diversity accumulation curves [52] for 0D (taxon richness), 1D (the exponential of Shannon entropy), and 2D (the reciprocal of Simpson concentration) were computed with the iNEXT R package [53] to rigorously compare diversities by taking into account the effect of sample size. Differences in diversity were considered significant (at a level of p = 0.05) when the 95% CI bands of the diversity accumulation curves did not overlap [52]. Confidence intervals were computed with bootstrap resampling and 100 bootstrap replications. The methodology of this analysis is presented in detail in Appendix A.
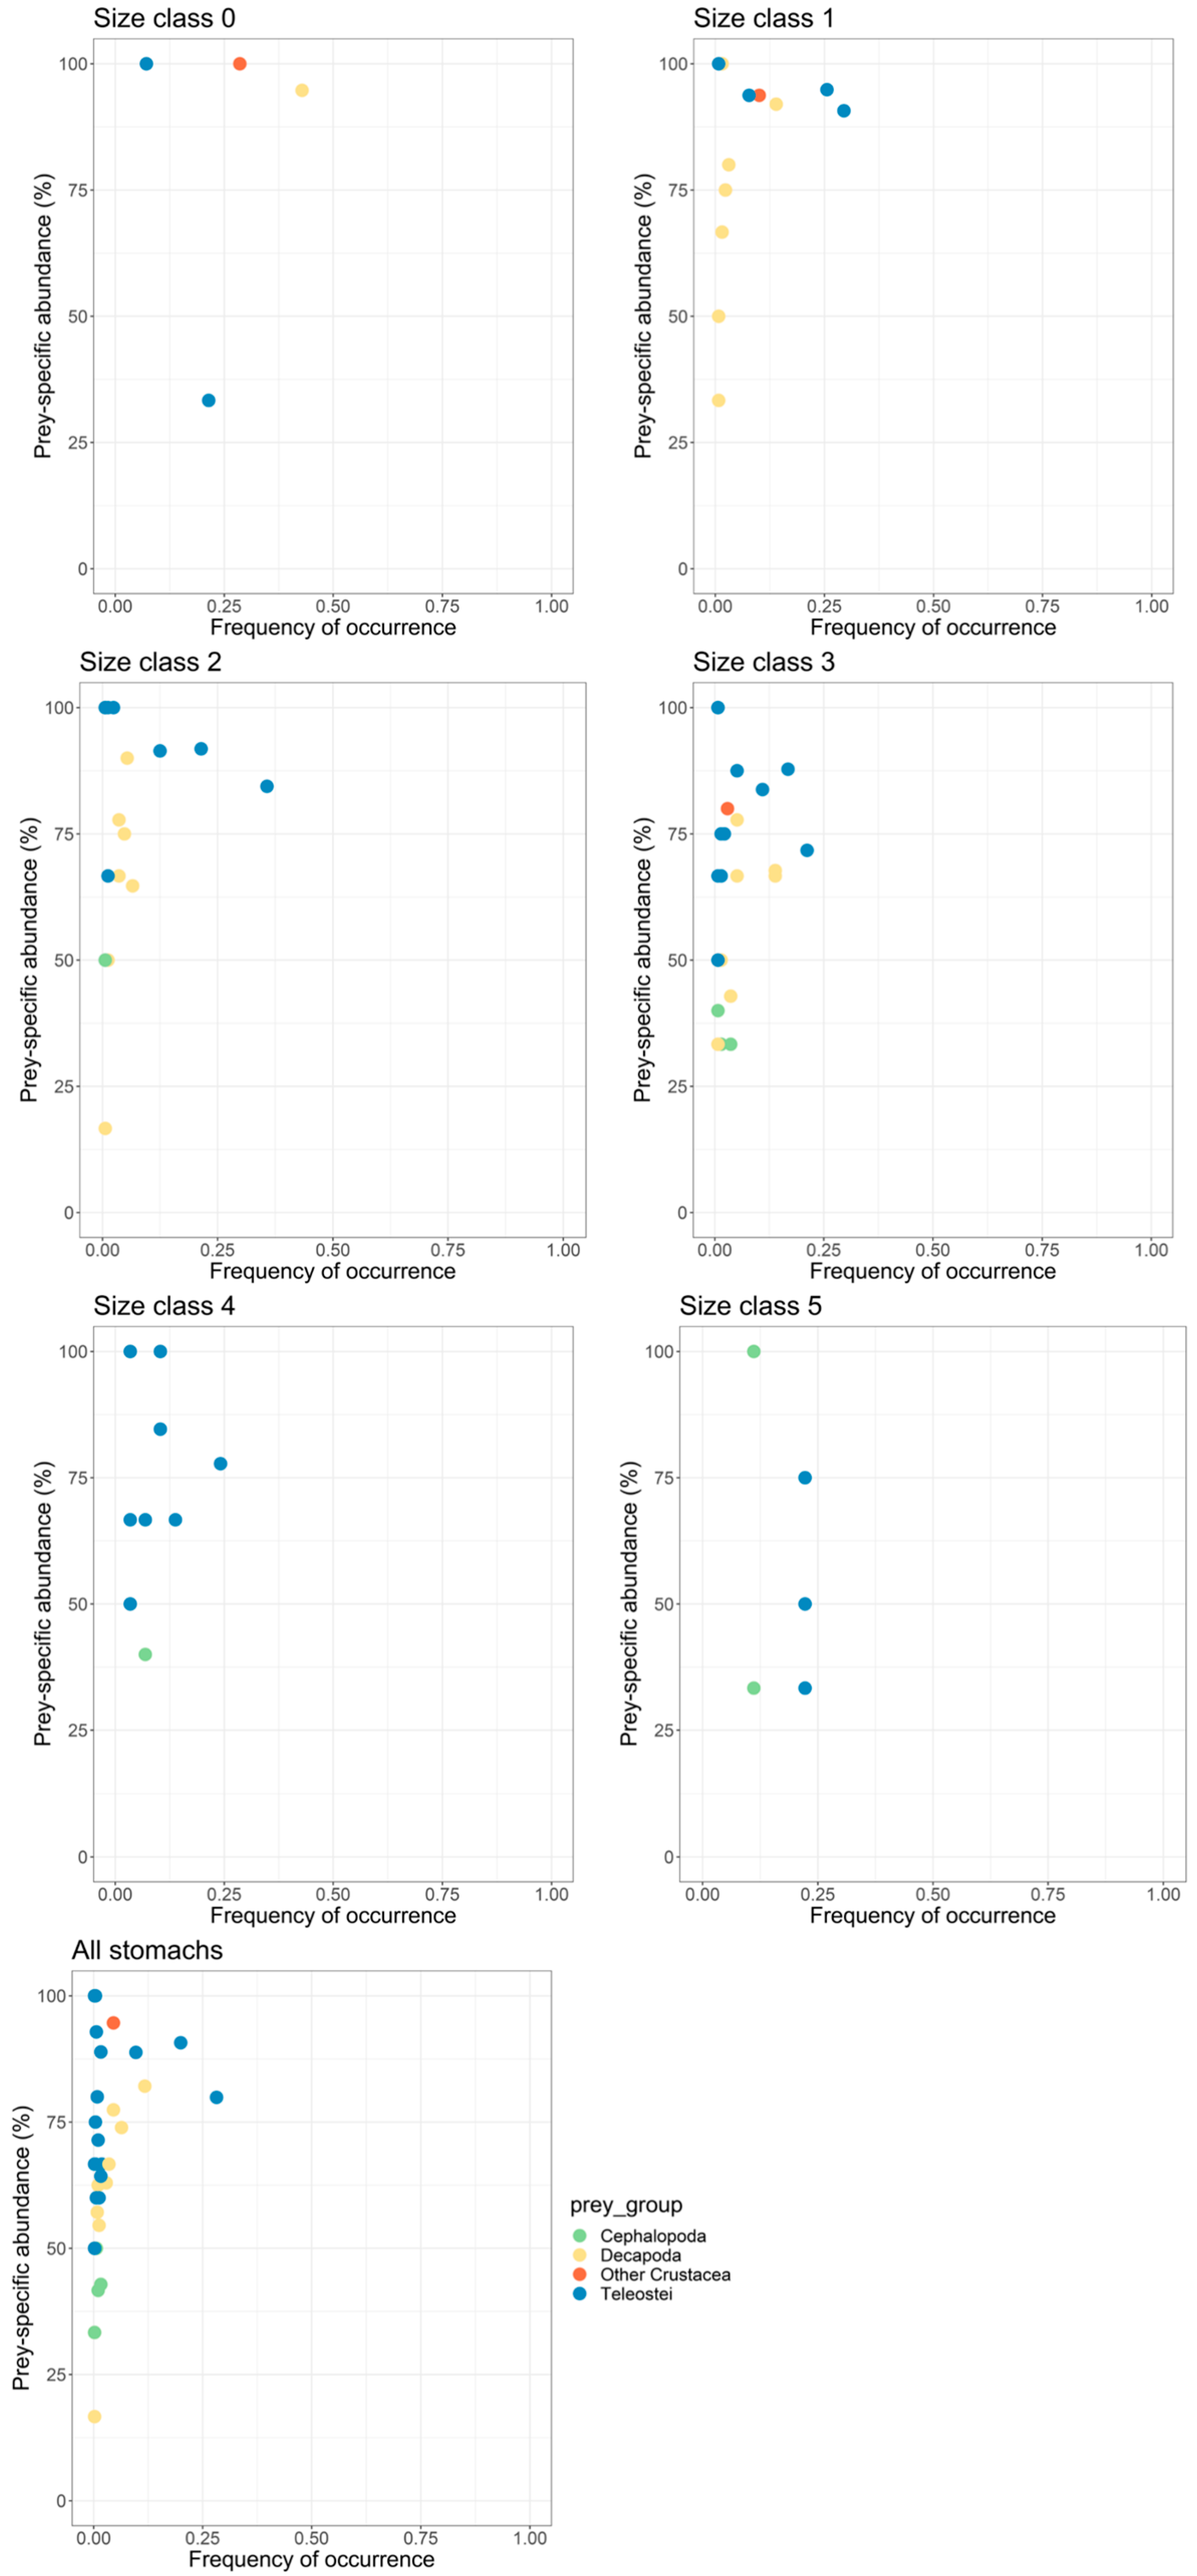
Intraspecific variation in resource use has been argued to have significant ecological effects and be important in niche theory [54,55,56]. Total niche width (or degree of specialization) of a population can be broken down into two components [57]: the individual niche width (within-individual component), and the variance in resource use between individuals (between-individuals component). The relative importance of the components of hake total niche width, as a facet of the feeding strategy of the species, was assessed with the modified Costello graphical analysis [58,59]. In this method, species feeding strategy is graphically depicted using a 2-D representation, where the prey-specific abundance of prey taxon i was plotted against its frequency of occurrence in the stomachs with food contents. The prey-specific abundance of prey taxon i was calculated with the following formula [59]:
P i = S i S t × 100
where Pi is the prey-specific abundance of prey taxon, Si is the stomach content in numbers corresponding to prey i, and St the total stomach content only in stomachs that contained prey i. This method assesses simultaneously prey importance, feeding strategy, and inter- and intra-individual components of the population trophic niche width. This information is obtained by the visual inspection of the distribution of the points representing prey in the produced plots across the bottom left-top right diagonal (rare vs. dominant prey groups), top-bottom axis (specialization vs. generalization in the diet), and top left-bottom right axis (specialization at the individual vs. at the population level).
Hake diet overlap between body-size classes, years, and subareas was quantified with the Renkonen (or Schoener) proportional overlap index [60]:
C x y = 1 0.5 × ( p x i p y i )
where pxi and pyi are the proportions of prey i (in terms of numerical abundance) in the diet of the species in the size class, year, and area x and y, respectively. Cxy ranges from 1 (same prey items in the same proportions) to 0 (no common prey items). This index is a measure of the actual area of overlap of resource utilization curves and is not sensitive to how resource states are divided [60].
All analyses were performed using the R Statistical Software (v4.3.2) [61] except the prey–predator network graph, which was plotted using the Gephi graph visualization and manipulation software [62], and the PERMANOVA tests, which were carried out in PERMANOVA 1.0.8 [63].

3. Results

3.1. Sampling Effort

A total of 769 hake stomachs were collected during the five annual MEDITS samplings that were conducted in the study area from 2019 to 2023 (Table 1). The number of stomach samples varied between years, ranging from 95 to 232, and between subareas, ranging from 90 to 303. Most stomach samples were collected from hake individuals of body-size classes 1 (225), 2 (261), and 3 (203). Sample sizes for classes 0, 4, and 5 were 26, 40, and 14 stomachs, respectively. The overall length range of hake individuals that had stomachs with prey in their contents was 72–572 mm (TL).

3.2. Feeding Intensity

Out of the 769 collected stomachs, 522 were categorized as full and 247 as empty. Thirty-six stomachs contained only mucus that exceeded 0.2% of body weight. These stomachs were regarded as full in the calculations of the VI and RI indices but were not considered in further analyses. VI values ranged between body-size classes from 25 to 35.71%, between years from 17.11 to 37.89%, and between subareas from 24.11 to 46.41% (Table 1). However, the χ2 test of independence failed to reject the respective null hypotheses that the percentages of full and empty stomachs were independent of body-size classes, years, or subareas.
No significant effect of body size, year, or subarea on RI was revealed by PERMANOVA using a three-way layout. However, one-way PERMANOVA revealed that mean RI significantly differed among body-size classes (Pseudo-F = 6.95, p(perm) < 0.001), with mean RI values ranging from 21.05 to 77.10‰ (Table 1). Pairwise PERMANOVA tests indicated that mean RI was significantly higher in class 5 individuals compared to class 0 (t = 2.18, p < 0.05), 2 (t = 3.23, p < 0.01), 3 (t = 4.74, p < 0.001), or 4 individuals (t = 3.33, p < 0.01). The lowest mean RI value was observed in class 3, individuals, which was significantly lower than in class 1 (t = 4.43, p < 0.001), 2 (t = 3.52, p < 0.001), or 5 individuals (t = 4.74, p < 0.001). One-way PERMANOVA did not reveal any significant differences in mean RI between years or between subareas.

3.3. Sufficiency of the Number of Examined Fish Stomachs

The prey accumulation curves analysis results suggest that the sampling effort was not entirely sufficient for any of the body-size classes or for all stomachs pooled (Figure 2).

3.4. Diet Composition

The prey items found in the stomach contents analysis were classified into 58 taxa (Table 2). Among these, 40 taxa were identified at the species level, 6 at the genus level, and 7 at the family level, while the remaining 5 taxa were classified at higher taxonomic levels.
Among the identified prey taxa, 28 were benthic, demersal, or bathydemersal, while 21 were pelagic or bathypelagic. Additionally, four taxa were benthopelagic. The bathymetric ranges of the prey taxa varied, ranging from shallow-water continental shelf species (e.g., Sepiola sp., Alpheus glaber, Solenocera crassicornis, Lesueurigobius friesii, Sardina pilchardus, Serranus hepatus, Spicara flexuosum) to bathypelagic species (e.g., Pasiphaea multidentata, Sergestidae, Micromesistius poutassou, Nettastoma melanura, Myctophidae, Stomiidae), and bathydemersal species (Argentina sphyraena, Chlorophthalmus agassizi).
The identified prey taxa were also categorized into 10 functional groups based on their taxonomy, ecological roles, and preferred habitat (Table 2). These groups comprised octopuses and cuttlefish, squids, benthic decapods, bathypelagic decapods, benthopelagic decapods, non-decapod crustaceans, demersal fish, bathydemersal fish, bathypelagic fish, and benthopelagic fish.
The factors that had a significant effect on the composition by weight of the diet of hake were year (Pseudo-F = 1.6022, p(perm) = 0.0249), body-size class (Pseudo-F = 1.8251, p(perm) = 0.0007), and the interactions year × subarea (Pseudo-F = 1.3094, p(perm) = 0.006), year × body-size class (Pseudo-F = 1.2923, p(perm) = 0.0075), subarea × body-size class (Pseudo-F = 1.2124, p(perm) = 0.0004), and year × subarea × body-size class (Pseudo-F = 1.3875, p(perm) = 0.0006). Regarding diet composition by numbers, the factors that had a significant effect were body-size class (Pseudo-F = 1.6532, p(perm) = 0.0078), and the interactions year × subarea (Pseudo-F = 1.3572, p(perm) = 0.0066), year × body-size class (Pseudo-F = 1.2591, p(perm) = 0.0262), and year × subarea x body-size class (Pseudo-F = 1.3523, p(perm) = 0.0004).

3.5. Importance of Prey Taxa in Hake Diet

Crustacean taxa were important prey for body-size class 0 individuals (%IRI = 77.64). Their importance was reduced for classes 1–4 individuals (%IRI = 5.57–19.29), whereas they were not present in the diet of the individuals of class 5. The %IRI of crustacean prey across body-size classes was 11.7. Crustaceans other than Decapoda were important prey essentially only for class 0 individuals (%IRI = 30.91). Notably, Parapenaeus longirostris emerged as the most important decapod prey for hake, with a maximum %IRI of 13.45 corresponding to the class 4 individuals. Its %IRI value across body-size classes was 2.72 (Table 2, Figure 3).
The relative importance of Cephalopoda in the diet of hake peaked in body-size class 5 individuals (%IRI = 36.44), while cephalopods were also present in the diet of class 2–4 individuals (%IRI = 0.04–0.76). The %IRI of cephalopods across body-size classes was 0.91. Illex coindetii stood out as the most important cephalopod prey for hake, registering an %IRI of 34.45 in class 5 individuals and 1.28 across body-size classes (Table 2, Figure 3).
Teleostei was by far the most important prey group in the diet of hake, with an %IRI of 87.4. Teleostei were more important prey for the individuals of the intermediate size classes, where their %IRI ranged from 79.95 (class 3) to 93.68 (class 4). Their importance was comparatively less for class 5 (%IRI = 63.56) and especially for class 1 individuals (%IRI = 22.36) (Table 2, Figure 3).
Engraulis encrasicolus stood out for its importance in the diet of hake, with an overall %IRI of 32.18. Its %IRI for the different size classes ranged from 8.6 (class 5) to 54.68 (class 1), while it was absent only from the diet of class 0 individuals. Unidentified Myctophidae were also important in the diet of individuals of the intermediate size classes, with their %IRI ranging from 0.32 (class 4) to 14.71 (class 2), while their %IRI across body-size class was 9.09. Other fish species that were among the main prey for hake included S. flexuosum, with an %IRI of 6.08 for class 3 individuals, M. poutassou, which was important for class 4 (%IRI = 14.86) and class 5 individuals (%IRI = 25.84), and S. pilchardus, which was of particular importance for class 4 individuals (%IRI = 30.38). Lastly, Trachurus trachurus and C. agassizi were among the main prey for class 5 individuals (%IRI = 14.05 and 8.26, respectively) (Table 2, Figure 3).
Across the years, the following persistent pattern regarding the relative importance of prey taxonomic groups was observed (Figure 3): Teleostei were the prey of the highest relative importance, the importance of Crustacea was intermediate, and the importance of Cephalopoda was the lowest. However, the relative importance of Teleostei and Crustacea varied between years, with the relative importance of Crustacea being higher in 2019, 2020, and 2023 (%IRI = 25.58, 24.37, and 31.87, respectively). Engraulis encrasicolus was the most important prey among fish species across the entire period (%IRI = 14.27–43.3), and Myctophidae was the second most important (%IRI = 6.24–14.58). The relative importance of S. flexuosum in 2021 was also notable (%IRI = 15.73).
A similar pattern in the relative importance of prey taxonomic groups was also observed across subareas (Figure 3): Teleostei and Crustacea were the most important prey groups in all subareas. Cephalopoda, represented mainly by I. coindetii, were less important prey for hake in THERM and THR-LIM (%IRI = 0.53 and 0.06, respectively) than in the other subareas (%IRI = 2.47–3.75). Engraulis encrasicolus was particularly important in THERM, THR-LIM, and VOL-SPOR (%IRI = 32.24, 54.85, and 52.82, respectively). However, its importance in CHIO-MIT and EVIA was greatly reduced (%IRI = 1.41 and 1.04, respectively), whereas the relative importance of Myctophidae there was the highest (%IRI = 20.87 and 18.56, respectively). The relative importance of C. agassizi and M. poutassou was also remarkable in CHI-MIT (%IRI = 5.23 and 2.61, respectively) and EVIA (%IRI = 1.23 and 4.55, respectively). Parapenaeus longirostris was relatively important in CHI-MIT, THR-LIM, and EVIA (%IRI = 2.43, 4.16, and 1.56, respectively). In the latter area, the relative importance of Plesionika shrimps was particularly notable (%IRI = 9.43).
In a force-based network graph layout algorithm like the “force-atlas” employed in the present study, linked nodes attract each other within the graph, while non-linked nodes repel each other. Indeed, prey with low out-degrees, i.e., linked to one to few hake body-size classes, were plotted at more peripheral locations in the network, whereas prey with high out-degrees, i.e., that were shared by several body-size classes, were plotted more centrally in the graph (Figure 4). Similarly, body-size classes 1–3 were clustered together because of their comparable trophic preferences. The strongest links were those between the prey taxa E. encrasicolus, unidentified Teleostei, unidentified Decapoda, and unidentified Crustacea, other than decapods and hake body-size classes 1, 2, and 3. All body-size classes, except class 0, exhibited connections with both exclusive (prey out-degree = 1) and shared prey taxa (prey out-degree > 1).

3.6. Trophic Niche Breadth

Prey numerical abundance in the stomach contents varied from 1 to 30, with most occurrences involving single individuals. Prey taxa with more than a few individuals in a stomach belonged to crustacean species other than decapods (up to 30 individuals), Decapoda (up to 15 individuals), and the Teleostei E. encrasicolus, S. pilchardus, and Myctophidae (up to 8 individuals). The richness of prey taxa in the stomachs ranged from 1 to 3 per stomach, with most stomachs containing a single prey taxon.
A statistically significant rank ordering of body-size classes in terms of prey diversity of order 0 was 2, 3 > 1, 4 (Figure 5, Supplementary Table S2). Also, prey diversity of order 0 in class 0 was significantly lower than all other classes except class 5, while the confidence intervals for class 5 curve overlapped also with those for class 4. In terms of prey diversity of orders 1 and 2, the rank ordering was 3, 4 > 1, 2 > 0, while the confidence intervals for class 5 overlapped with those for classes 2–4.
Regarding interannual differences in prey diversity, a statistically significant rank ordering of years in terms of prey diversity of all orders was 2020, 2021, 2022, and 2023 > 2019 (Figure 5, Supplementary Table S2).
A statistically significant rank ordering of subareas in terms of prey diversity of order 0 was not possible at all due to overlapping confidence intervals (Figure 5, Supplementary Table S2). For prey diversity of order 1, the only statistically significant difference was EVIA > VOL-SPOR.
Most of the prey taxa are depicted in the modified Costello graph situated in the upper-left section, having low frequencies of occurrence, but high prey-specific abundances. This pattern was observed in the plot for the pooled stomachs and in the plots for individual body-size classes, but to a lesser degree in class 5 (Figure 6).

3.7. Diet Overlap

Diet overlap, as quantified with the percentage overlap index (Table 3), was found to be higher between the intermediate body-size classes 1–4 (Cxy range = 0.45–0.69, mean = 0.56) and comparatively low between the extreme classes 0 and 5 and the intermediate classes 1–4 (Cxy range = 0–0.41, mean = 0.18). The index values exhibited a mean of 0.52 across years, with a range spanning from 0.36 to 0.63. The lowest diet overlap was observed between 2019 and the other years. The mean of the Renkonen index for diet overlap between subareas was 0.54, with values ranging from 0.40 to 0.70.

4. Discussion

The trophic preferences of M. merluccius were investigated in the North Aegean Sea during the summers of 2019 to 2023 with visual stomach contents analysis to assess its composition, diversity, and variability across body-size classes, years, and subareas. The principal prey were pelagic and benthopelagic organisms that are abundant in the area, and, in many cases, also primary targets for local fisheries. The identified prey are functionally diverse and inhabit a broad array of depths and habitats, underscoring hake’s importance as a pivotal component of the marine food web in the area. The ontogenetic trophic niche of hake was characterized by two distinct shifts: from a diet predominantly comprising crustaceans in individuals smaller than 10 cm, to a diet primarily including teleosts at intermediate body sizes, and ultimately transitioning to a diet based on teleosts and cephalopods in individuals larger than 50 cm. Cephalopods were a prevalent dietary component for large hake individuals, a finding that, to our knowledge, has not been reported in the literature. In comparison to the extreme body-size classes, the intermediate classes demonstrated greater trophic niche breadth concerning prey diversity and absolute prey-size ranges. Furthermore, a feeding strategy characterized by specialization of individuals was revealed, implying a dominant between-individuals component of the total trophic niche width. The effect of the temporal and spatial context on the hake diet was less pronounced than the ontogenetic changes and involved variability in the relative importance of prey groups and taxa that was occasionally correlated with spatiotemporal variations in the sizes of their populations.

4.1. Ontogenetic Shifts in the Diet of Hake

Numerous species undergo ontogenetic shifts in their food and habitat utilization, driven by variations in their vital rates, resource acquisition capacities, and predation risk relative to body size. Shifts in the species’ ontogenetic niche are thought to optimize their growth rates or surplus energy [64], while they are also considered to influence community and food web structure and functioning [65,66]. Ontogenetic dietary shifts are widespread among fishes [64,66], and several fish species have been used as models in studies of trophic ontogeny across all types of aquatic habitats [67,68,69,70]. The number of dietary shifts observed in fishes during their life histories varies considerably among species [64,66]. Similarly to hake in the study area, two dietary shifts have also been observed in Perca fluviatilis, in that case from planktivorous in juveniles to feeding on benthic invertebrates at intermediate sizes, and finally, when individuals become large enough, to a diet based mainly on fish [71]. Furthermore, profound multiple shifts in the diet occurring over the life cycle are frequently seen in piscivorous fish species [66,67]. The number of ontogenetic dietary shifts has also been found to vary between populations of the same fish species. For example, two dietary shifts were observed in the life history of Micropterus salmoides in Japan [72], whereas several shifts in the diet of the same species were observed in Spain [73].
In the present study, an abrupt shift from a diet based on crustaceans to one primarily based on teleosts was identified to occur in hake at a size threshold of 10 cm (TL). This shift was apparent under all approaches used to measure prey importance. Similar ontogenetic diet shifts have been regularly reported for hake in the Mediterranean and beyond, although the body sizes at which the shifts occurred often differed between studies. For example, in the area of the Ionian Sea, fish were found to gradually become the dominant prey of hake in terms of weight in individuals with sizes between 150 and 200 mm (TL) and in terms of frequency of occurrence in individuals between 200 and 300 mm long. In terms of numbers, crustaceans remained the dominant prey group across all body-size classes [25]. On the other hand, in the Tyrrhenian Sea, hake changed its diet from crustacean-based to one based on decapods and teleosts at a size of 10.5 cm (TL) [19], which coincides with the threshold identified in the present study. Beyond the Mediterranean, hake was found to be completely piscivorous in the Bay of Biscay and the Celtic Sea in individuals over 25 cm long, while individuals <20 cm in length fed primarily on crustaceans, mainly euphausiids [13,74].
A further notable change in the diet of hake that was observed in the present study concerned the significant increase in the relative importance and percentage, both by numbers and weight, of cephalopods, primarily I. coindetii, among hake individuals larger than 50 cm. Although cephalopods were part of the diet of hake also in body-size classes 2–4, their importance in those classes was comparatively low. Body-size class 5 individuals that fed on cephalopods were collected at sampling stations over the continental slope, with a mean depth of 410 m. Similarly, the body-size classes 2–4 individuals that preyed on cephalopods were collected at sampling stations with a mean depth of 271 m. Large hake individuals are capable of capturing prey at the size of cephalopods, which they may prefer as a food source because of their higher energetic values and digestibility compared to fish [75]. Additionally, cephalopods are more readily available in deep waters, where large hake are predominantly distributed [76]. For example, I. coindetii, an important cephalopod prey for hake in the study area, is known to be more abundant in deeper bathymetric zones [77].
Cephalopods generally comprise important food resources for fish, and generalist predators like various species of hake have occasionally been shown to consume large quantities of them [78]. Indeed, small cephalopods have been found to be important prey for small hake individuals in the Central Mediterranean, thought to reflect the local abundances of these species [79], while hake fed almost exclusively on the locally abundant cephalopods in Pomo Pit, in the Adriatic [22]. However, no cephalopods were found in the stomach contents of large hake individuals that exceeded 50 cm in length collected in a previous study in Greece [28], while the presence of cephalopods in the diet of hake collected in Saronikos Gulf was considered incidental [24]. The significance of cephalopods in hake diet was minimal also in the Egyptian Mediterranean waters [18], the Tyrrhenian Sea [19], and the Bay of Biscay, whereas they were not found among hake’s prey in the Celtic Sea [13]. Nevertheless, the transition in large individuals to a diet almost equally reliant on teleosts and cephalopods as was observed in the present study, to our knowledge, has not been previously documented for European hake, although it has been observed in the congeneric Merluccius paradoxus in the Southeastern Atlantic [75].
Diet overlap was low between the extreme and the intermediate body-size classes, while diet overlap between the latter was much larger. The findings of the present study support the delineation of three distinct phases in the ontogenetic trophic niche of hake in the North Aegean Sea, delimited by 10 and 50 cm (TL) body-size thresholds. However, it is important to note that these phases do not appear to align with specific life stages of the species. Specifically, the <10 cm phase corresponds to immature individuals less than 1 year old, as young-of-the-year lengths were reported to range in the Aegean Sea from 10 to 16 cm (TL) [10]. Additionally, in Thermaikos Bay, which is located in the North Aegean Sea, M. merluccius was observed to mature at lengths of 350 mm and 410 mm (TL) for males and females, respectively [10]. Consequently, the 10–50 cm phase corresponds to both immature and mature individuals, while the >50 cm phase includes only mature individuals.
Euphausiacea and/or Mysida are relatively small-sized crustaceans that have been shown to be important prey for hake in several studies across its distribution range [10,13,19]. It can thus be safely assumed that the unidentified small-sized crustaceans that were important for the diet of body-size class 0 individuals included mainly Euphausiacea and/or Mysida. Despite larger hake individuals primarily feeding upon larger, energetically richer teleosts, decapods, and cephalopods, small-sized crustaceans were also present in their diets, except in individuals larger than 50 cm. Feeding upon both small- and large-sized prey in the intermediate size classes indicates a widening of the range of absolute prey-size ratios with increasing predator size in hake, a finding that is in agreement with the results of previous studies for fish predators [80]. This pattern is considered to reflect improvements with increasing body size in predator behavioral and morphological capacities for capturing and ingesting larger prey, as well as increased encounter rates with smaller prey, which are also more susceptible to capture [80].

4.2. Spatial Variability in the Diet of Hake

While teleosts and crustaceans constitute the primary prey groups for hake across its range, their proportions and species composition in the diet of hake have often exhibited significant spatial variability, usually attributed to differences in their local abundances [10]. Indeed, the major hake prey in the study area, i.e., E. encrasicolus and Myctophidae, followed by P. longirostris and I. coindetii, are species whose populations are abundant in the North Aegean Sea ecosystem [35]. In particular, 75% of European anchovy production in Greece in 2022 was caught in the Northern Aegean [36]. Engraulis encrasicolus and Myctophidae were found to be significant prey for hake also in Western Greece [25], as well as in the Tyrrhenian Sea [19]. However, in Egyptian Mediterranean waters, Sardinella aurita and Caranx rhonchus were identified as more important prey for hake than E. encrasicolus [18]. Likewise, in the Celtic Sea, E. encrasicolus was less significant compared to T. trachurus or small hake [13].
Nevertheless, large-scale spatial variability in hake’s diet has not been attributed solely to differences in prey availability. In the Celtic Sea, variations in the proportions of main prey such as M. poutassou, T. trachurus, Scomber scombrus, and clupeoids across the different subareas were considered an indicator of hake “appetite” rather than reflecting spatial variability in prey abundances [74]. A more formal explanation is offered by the optimal foraging theory [81], which posits that predators strategically select prey that offer the highest energetic return relative to the effort expended in capturing and consuming them, thereby maximizing their fitness. Moreover, fish foraging behavior may also be influenced by past experience, the presence of competitors, or predation risk [64,82].
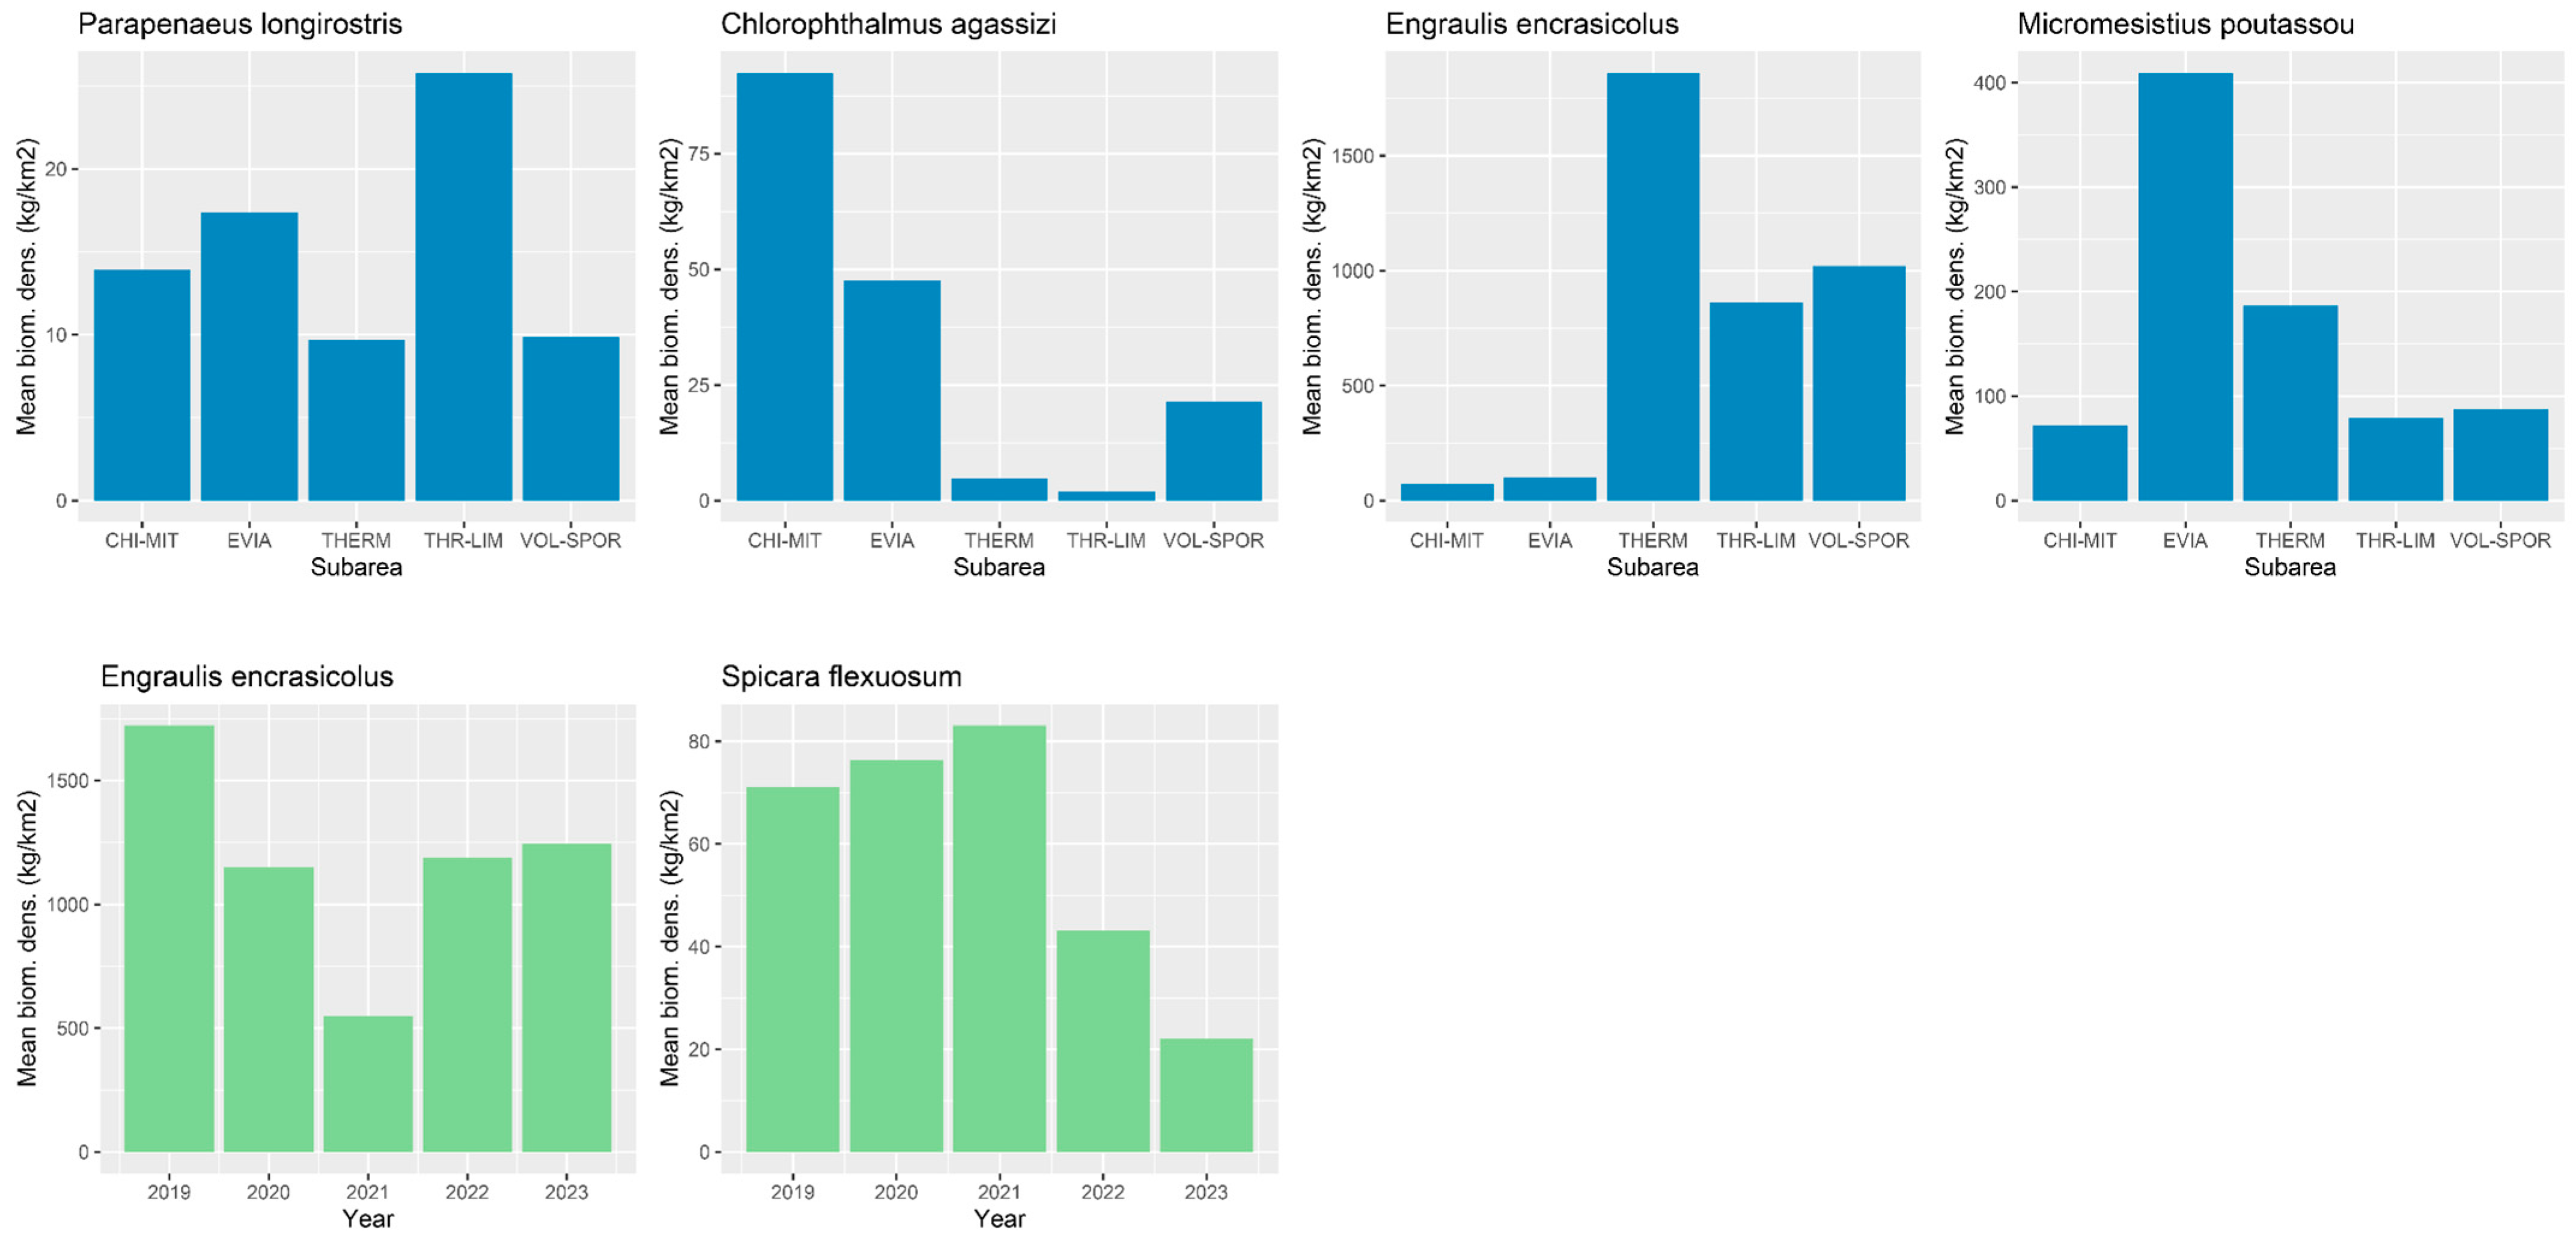
The influence of prey availability on the composition of the diet of hake in the study area was also evident when considering its variability between subareas. Indeed, the relative importance of E. encrasicolus as a prey for hake was diminished in CHIO-MIT and EVIA, where its biomass density was lower compared to the other subareas. Similarly, the increased relative importance of C. agassizi in CHI-MIT and EVIA, as well as of M. poutassou in EVIA, could be attributed to the higher biomass densities of these species in those areas. Likewise, P. longirostris was relatively more important as a prey for hake in subareas with a higher supply of this species, namely, CHI-MIT, THR-LIM, and EVIA. However, spatial variability in the relative importance of other prey in the diet of hake, like Cephalopoda, Myctophidae, and Plesionika spp., did not appear to be linked to the spatial variability of their biomass densities (Figure 7 and Supplementary Figure S7).

4.3. Interannual Variability in the Diet of Hake

The results of the PERMANOVA that was performed on the multivariate diet composition data revealed that the effect of the year was less important than the effect of body size, becoming significant only when diet composition was measured by weight. However, the effect of body-size class on hake diet composition was found to depend on the year, regardless of how prey proportions were calculated. This is also illustrated in the interannual variability in the %N and %W indices, as well as in the %IRI index, across body-size classes (Supplementary Figures S4–S6). Indeed, although the importance of Crustacea and Cephalopoda as prey for body-size classes 0 and 5, respectively, was evident across all years, the respective indices’ values differed considerably between years. However, this may be a biased result, as sample sizes were low for body-size classes 0 and 5. On the other hand, Teleostei was the most important prey group for all intermediate body-size classes across years, with few exceptions that occurred mostly when prey proportions were calculated in terms of numbers.
Studies of the trophic preferences of hake that are based on time-series data are scarce [20]. The results of the present study revealed that hake diet overlapped between years only to an intermediate extent, indicating that temporal factors had a less pronounced effect than body size/ontogenesis. The interannual variations in the diet of hake involved changes in the relative importance of Teleostei and Crustacea. At the species level, the prevalence of S. flexuosum in the diet of hake in 2021, rivaling the importance of hake’s main fish prey, E. encrasicolus, for that year, is particularly noteworthy. This finding can be attributed to the temporal biomass fluctuations of these species in the study area, as they experienced their respective minimum and maximum biomass densities for the study period in 2021 (Figure 7 and Supplementary Figure S7). The reduced abundance of E. encrasicolus in the North Aegean Sea in 2021 is possibly linked to the exceptional plankton bloom that occurred in the area during the spring and summer of that year. Furthermore, although P. longirostris was noted to be absent from hake stomach contents in previous analyses conducted in Greek seas, despite this species consistently constituting a significant proportion of Greek trawl catches [10], we identified P. longirostris as the primary decapod prey for hake in the study area during the study period across all body-size classes except class 5.

4.4. Cannibalism

Cannibalism was essentially not detected in the diet of hake in the study area during the sampling period (summer), as it was observed in only one individual. However, hake cannibalism has been observed in Greek seas [25]. The limited cannibalism observed in hake in the Celtic Sea [65] was attributed to spatial segregation of hake according to size. Cannibalism on young hake was also found to be important in the Mediterranean Iberian coasts [15], possibly related to the high abundance of hake recruits in the sampling period. However, it has been reported that cannibalism was absent in the populations of hake in the Tyrrhenian Sea [19]. The degree of cannibalism in hake has been associated with the presence of spatial overlap of predator and prey individuals and/or the availability of other prey [83]. In the study area, the MEDITS hauls during 2019–2023 that captured hake individuals of body-size class 0 also contained individuals of all other classes (Supplementary Figure S8). However, as hake individuals <10 cm long were collected mostly at sampling stations <350 m deep (Supplementary Figure S8) and hake body size was found to increase with depth (Supplementary Figure S9), the hypothesis of spatial segregation of hake in the study area according to size cannot be refuted.
Nevertheless, the availability of prey other than conspecific recruits has probably played an important role in the observed absence of cannibalism in hake in the study area. Less than one-third of the stomachs collected were empty, suggesting that, on average, food availability was not a significant limiting factor for hake in the North Aegean Sea during the study period. Furthermore, repletion was notably higher in individuals of body-size class 5 compared to most other classes. Similar substantial increases in food consumption among hake individuals longer than 30 cm have been reported in previous studies on the Greek seas [28,29]. Increased repletion in large hake individuals could be attributed to their capacity to prey upon fish and cephalopods of greater body sizes.

4.5. Trophic Niche Breadth

As sample sizes differed considerably between body-size classes, years, and subareas, the computation of diversity accumulation curves was considered necessary to estimate prey diversity. In terms of prey taxa richness (order 0 diversity), hake individuals of intermediate-size classes were found to have significantly more diverse diets. A similar pattern was observed when prey abundances in the stomach contents were also considered (orders 1 and 2 diversities). On the other hand, the lower prey diversity in size class 5 suggests enhanced dietary specialization in that class. As hake individuals > 50 cm long consumed only fish and cephalopods, it is assumed that ratio-based prey-size range in the particular body-size class was also reduced. This result is in agreement with previous studies [80] that found that ratio-based trophic-niche breadths in marine fish predators tended to narrow during ontogenesis for the largest predators (>50 cm long).

4.6. Feeding Strategy

Regarding the feeding strategy of hake and its variations between body-size classes, most prey taxa were depicted in the modified Costello graphs in the upper-left quadrant, i.e., were present in a few stomachs but with medium-to-high prey-specific abundances. This pattern, which was identified in both the plot for the pooled stomachs and the plots for the individual body-size classes, suggests that hake exhibited significant between-individuals variation (specialization of individuals) in its diet in the study area [59]. Most of the dietary niche width of hake was thus attributable to the between-individuals component [57]. However, prey-specific abundances of prey in body-size class 5 individuals were comparatively decreased, indicating reduced specialization of individuals, while the unsatisfactory taxonomic resolution of crustacean prey in body-size class 0 did not allow for a robust assessment of feeding strategy in the particular class.

4.7. Study Shortcomings and Future Directions

Seasonal variability in the diet of hake has been observed in the Greek seas and is considered to be related to the seasonal availability of its prey [10], with exceptions; for example, little seasonal changes in hake diet were found in the area of the Ionian Sea [25]. The reliance on samples collected only during summer is an important limitation of the present study, thereby not allowing the assessment of potential seasonal variability in hake diet in the study area. Additionally, the unsatisfactory taxonomic resolution attained for small-sized crustacean prey did not permit an unbiased estimation of trophic niche breadth and feeding strategy for individuals of body-size class 0. Nevertheless, limited taxonomic resolution in species diets is considered a characteristic shortcoming of visual analysis of stomach contents that modern DNA metabarcoding techniques are promising to overcome [84]. Furthermore, a sample size for body-size class 5 larger than that obtained in the present study would permit more robust conclusions to be made regarding the relative importance of cephalopods as prey for large hake in the study area. However, obtaining a large sample size for hake individuals larger than 50 cm is challenging, as they are typically collected from deeper waters, and their stomachs often become everted when the trawl net is lifted onboard. Lastly, although a considerable number of hake stomachs containing prey items were collected in the present study, the prey accumulation curves indicated that larger sample sizes would still reveal more prey taxa. This may be due to the high spatial resolution and multiannual temporal scale of the present study, while it also likely reflects the opportunistic nature of hake predatory behavior [74,85]. However, similar issues were also encountered in other visual studies of the trophic preferences of hake [21].
Important directions that future research could follow regarding the trophic preferences of hake comprise the investigation of seasonal variability and the evaluation of similarities and differences between different areas. Additionally, a comparative assessment of the diet of the species via alternative methods, e.g., with visual stomach content analysis and DNA barcoding, would provide a more comprehensive and accurate picture of its trophic interactions and its role as a component of the food web. Finally, as environmental variables have been shown by previous studies to influence the feeding and diet of hake [15], an investigation of the effects of the abiotic environment, for example, temperature, on the variability of the diet of hake in the study area would also be important. Indeed, variability in seawater temperature has been shown to affect the growth rates and the metabolic demands of predators, as well as the behavior of prey species, e.g., their movement and activity rates, which have an impact on encounter rates and probability of capture success [86,87]. In addition, spatiotemporal variability in temperature, for example, the sea temperature rise due to global climate change, has been shown to drive the distributions of many marine species, thus affecting predator–prey dynamics [88,89,90].
Assessments of food web structure and functioning offer a broad perspective on ecosystem dynamics by considering the trophic interactions between multiple species. Such approaches complement single-species assessments, contributing to a comprehensive understanding of ecosystems that is essential in EBFM [91,92]. Indeed, quantification of species trophic interactions and food web structure can inform the formulation of promising new harvesting strategies for highly exploited multispecies fisheries, such as balanced harvesting [93,94]. However, gathering comprehensive data on marine species diets is challenging, as omnivory is widespread in marine food webs [95], trophic preferences typically change during species ontogenesis [66], and spatiotemporal changes in prey availability often affect diet composition in opportunistic predators [96]. The findings of the present study underscore that DCF represents a unique framework to obtain a time series of ontogenetic stage-specific and spatially comprehensive data regarding the trophic interactions of key biological resources, following a systematic and comprehensive approach.

5. Conclusions

This study provides comprehensive recent information on the ontogenetic and spatiotemporal variability of the diet of European hake in the North Aegean Sea in summer, thereby contributing to filling important knowledge gaps regarding a major biological resource and key component of the marine food web in the Mediterranean. European hake was found to be a generalist predator in the study area, with its wide trophic niche resulting from a combination of individual specialization and a high variance in resource use between individuals. Ontogenesis is accompanied by two major changes in the trophic preferences of the species early and late in its life history, while spatiotemporal variability in its diet was occasionally correlated with spatiotemporal variations in the sizes of prey populations. European hake is a key node in the food web of the Mediterranean and an overexploited major fisheries target. Data on its trophic interactions, such as the information presented in this study, are critical for the ecosystem-based approach to fisheries management to ensure the sustainable use of its populations.

Supplementary Materials

The following supporting information can be downloaded at: https://www.mdpi.com/article/10.3390/fishes9070257/s1, Table S1 and Table S2, Figure S1, Figure S2, Figure S3, FigureS4, Figure S5, Figure S6, Figure SS9. The R scripts for the calculation of the %F, %N, %W, and %IRI indices and the production of the pie-donut plots and the modified Costello graphs are available on GitHub at https://github.com/athevangelopoulos/diet_analyses, accessed on 13 February 2024.

Author Contributions

Conceptualization, A.E.; formal analysis, A.E.; investigation, A.G.; data curation, A.E.; writing—original draft preparation, A.E.; writing—review and editing, A.G., N.K. and E.K.; visualization, A.E.; project administration, N.K. and E.K.; funding acquisition, E.K. All authors have read and agreed to the published version of the manuscript.

Funding

The MEDITS data analyzed in this article were collected in the framework of the Greek multiannual program according to DCF, for which the Ministry of Agriculture and Food is responsible. The publication of this article was funded by the Greek multiannual program according to DCF and the Ministry of Agriculture and Food.

Institutional Review Board Statement

Ethical review and approval were waived for this study. The fish were selected from the samples of the MEDITS surveys in Greece, which are carried out annually as a national obligation in the framework of the Multiannual Union Programme for the Data Collection in the Fisheries and Aquaculture sectors (EU MAP).

Data Availability Statement

Restrictions apply to the availability of stomach content analysis data. Data were obtained from the Greek Multiannual Union Programme for the Data Collection in the Fisheries and Aquaculture sectors (EU MAP) and are available from the authors with the permission of the Greek Ministry of Agriculture and Food.

Acknowledgments

The authors thank the Greek Ministry of Agriculture and Food, which is responsible for the implementation in Greece of the Multiannual Union Programme for the Data Collection in the Fisheries and Aquaculture sectors (EU MAP), and the staff involved in commercial fisheries sampling and the scientific survey MEDITS, which is part of the EU MAP programme. The authors are also grateful to Evina Karasavva for her assistance in the lab work. Finally, the authors would like to thank the anonymous reviewers for their careful reading of the manuscript and their many insightful comments and suggestions.

Conflicts of Interest

The authors declare no conflicts of interest. The collection of hake stomachs and the analysis of stomach contents were carried out in the framework of the Greek Multiannual Union Programme for the Data Collection in the Fisheries and Aquaculture sectors (EU MAP), for which the Ministry of Agriculture and Food is responsible.

Appendix A

Diversity Accumulation Curves Methodology

The richness and diversity of prey taxa in stomach contents were estimated aiming to quantify the width of the trophic niche width of hake in the study area and assess its variability between body-size classes, years, and subareas. To this end, indices that are typically used in modern studies of biodiversity measurement were used. These indices measure diversity in units of effective numbers of species, i.e., the number of equally abundant species that would be needed to give the same value of a diversity measure [50,51]. Such indices possess desirable properties that traditional indices of diversity lack and allow for rigorous comparisons of diversities between assemblages [97]. They constitute special cases of the following general formula, differing only in the value of parameter q:
D q = i = 1 S p i q 1 1 q
where S is the number of species in the sample and q is the order of diversity, which determines the degree of sensitivity to the species abundance distribution [50,51].
Comparisons of diversities between assemblages are rigorously carried out when the dependence of sample diversity on sample size or, preferably, sample completeness are taken into account [98]. The latter is measured by sample coverage, i.e., the percentage of the assemblage individuals that belongs to the species represented in the sample [99]. The recently developed method of diversity accumulation curves [52] is such an approach: diversity of a particular order, measured in units of effective numbers of species, is estimated as a function of sample size and sample completeness. The resulting diversity curves are combinations of rarefaction and extrapolation curves that join smoothly at a point that corresponds to the size or completeness and diversity of the actual sample (the “reference sample” for the particular curve). Extrapolation is guided by an asymptotic estimate of the true assemblage diversity [52]. Diversity curves are preferred over the traditional rarefaction curves because they extract information from the collected samples more efficiently [6].
Diversity accumulation curves for 0D (taxon richness), 1D (the exponential of Shannon entropy), and 2D (the reciprocal of Simpson concentration) were computed to compare prey diversity between size classes, years, and subareas with the iNEXT R package [53]. 1D is interpretable as the number of common prey taxa, while 2D represents the number of abundant (dominant) prey taxa [50]. Reference sample sizes varied up to one order of magnitude, but reference sample coverage was similarly high in all cases (0.93 on average). Diversities were thus estimated as a function of sample size only. Statistically significant differences in diversity between assemblages were assessed by visual inspection of the diversity accumulation curves up to a base sample size [52]. The base size was defined as double the smallest reference sample size or the maximum reference sample size, whichever was larger [6]. Differences in diversity were considered significant (at a level of p = 0.05) when the 95% CI bands of the diversity accumulation curves did not overlap. Estimates of diversity with their 95% CI at base sample size were also taken into account in diversities comparisons. Confidence intervals were computed with bootstrap resampling and 100 bootstrap replications. Reference sample species richness, Shannon entropy H = p i ln p i [100], Simpson concentration D = p i 2 [101], Shannon diversity (=eH’), and Simpson diversity (=1/D) [50] were also calculated to facilitate comparisons with other studies.

References

  1. Lloris, D.; Matallanas, J.; Oliver, R. Hakes of the World (Family Merlucciidae): An Annotated and Illustrated Catalogue of Hake Species Known to Date; Food and Agriculture Organization of the United Nations: Rome, Italy, 2005; Available online: https://openknowledge.fao.org/items/19194d7a-7b27-4066-836a-d95b16e9bc46 (accessed on 29 April 2024).
  2. Pitcher, T.J.; Alheit, J. What makes a hake? A review of the critical biological features that sustain global hake fisheries. In Hake; Alheit, J., Pitcher, T.J., Eds.; Springer: Dordrecht, The Netherlands, 1995; pp. 1–14. [Google Scholar]
  3. Cardinale, M.; Osio, G.C.; Scarcella, G. Mediterranean Sea: A failure of the European fisheries management system. Front. Mar. Sci. 2017, 4, 72. [Google Scholar] [CrossRef]
  4. FAO. The State of the Mediterranean and Black Sea Fisheries 2023; General Fisheries Commission for the Mediterranean: Rome, Italy, 2023; Available online: https://openknowledge.fao.org/items/3869b6d2-c06c-45d1-9f4a-899865dfe817 (accessed on 29 April 2024).
  5. Tsagarakis, K.; Carbonell, A.; Brčić, J.; Bellido, J.M.; Carbonara, P.; Casciaro, L.; Edridge, A.; García, T.; González, M.; Šifner, S.K.; et al. Old info for a New Fisheries Policy: Discard Ratios and Lengths at Discarding in EU Mediterranean Bottom Trawl Fisheries. Front. Mar. Sci. 2017, 4, 99. [Google Scholar] [CrossRef]
  6. EC. Council Regulation No 1967/2006 of 21 December 2006, Concerning Management Measures for the Sustainable Exploitation of Fishery Resources in the Mediterranean Sea, Amending Regulation (EEC) no 2847/93 and Repealing Regulation (EC) no 1626/94. Official Journal of the European Union, 30-12-2006, L 409/11. Available online: https://eur-lex.europa.eu/legal-content/en/ALL/?uri=CELEX%3A32006R1967 (accessed on 29 April 2024).
  7. GFCM. Recommendation GFCM/33/2009/2 on the Minimum Mesh Size in the Codend of Demersal Trawl Nets. Available online: https://gfcm.sharepoint.com/CoC/_layouts/15/guestaccess.aspx?docid=0f0a719040a464e78ad76682d9858b5ff&authkey=ASSjcmI7_zXp75a_mgie4P8 (accessed on 29 April 2024).
  8. Stergiou, K.I.; Moutopoulos, D.K.; Tsikliras, A.C. Spatial and temporal variability in Hellenic marine fisheries landings. In State of Hellenic Fisheries; Papaconstantinou, C., Zenetos, A., Vassilopoulou, V., Tserpes, G., Eds.; Hellenic Centre for Marine Research: Athens, Greece, 2007; pp. 141–150. [Google Scholar]
  9. Stergiou, K.I.; Moutopoulos, D.K.; Tsikliras, A.C.; Papaconstantinou, C. Hellenic marine fisheries: A general perspective from the national statistical service data. In State of Hellenic Fisheries; Papaconstantinou, C., Zenetos, A., Vassilopoulou, V., Tserpes, G., Eds.; Hellenic Centre for Marine Research: Athens, Greece, 2007; pp. 132–140. [Google Scholar]
  10. Papaconstantinou, C.; Stergiou, K.I. Biology and fisheries of eastern Mediterranean hake (M. merluccius). In Hake; Alheit, J., Pitcher, T.J., Eds.; Springer: Dordrecht, The Netherlands, 1995; pp. 149–180. [Google Scholar]
  11. FAO. FishStatJ—Software for Fishery and Aquaculture Statistical Time Series. Available online: https://www.fao.org/fishery/en/statistics/software/fishstatj (accessed on 29 April 2024).
  12. Froese, R.; Winker, H.; Coro, G.; Demirel, N.; Tsikliras, A.C.; Dimarchopoulou, D.; Scarcella, G.; Quaas, M.; Matz-Lück, N. Status and rebuilding of European fisheries. Mar. Pol. 2018, 93, 159–170. [Google Scholar] [CrossRef]
  13. Mahe, K.; Amara, R.; Bryckaert, T.; Kacher, M.; Brylinski, J.M. Ontogenetic and spatial variation in the diet of hake (Merluccius merluccius) in the Bay of Biscay and the Celtic Sea. ICES J. Mar. Sci. 2007, 64, 1210–1219. [Google Scholar] [CrossRef]
  14. Murua, H. The Biology and Fisheries of European Hake, Merluccius merluccius, in the North-East Atlantic. Adv. Mar. Biol. 2010, 58, 97–154. [Google Scholar] [CrossRef]
  15. Cartes, J.E.; Rey, J.; Lloris, D.; Gil de Sola, L. Influence of environmental variables on the feeding and diet of European hake (Merluccius merluccius) on the Mediterranean Iberian coasts. J. Mar. Biol. Ass. UK 2004, 84, 831–835. [Google Scholar] [CrossRef]
  16. Ferraton, F.; Harmelin-Vivien, M.; Mellon-Duval, C.; Souplet, A. Spatio-temporal variation in diet may affect condition and abundance of juvenile European hake in the Gulf of Lions (NW Mediterranean). Mar. Ecol. Prog. Ser. 2007, 337, 197–208. [Google Scholar] [CrossRef]
  17. Stagioni, M.; Montanini, S.; Vallisneri, M. Feeding habits of European hake, Merluccius merluccius (Actinopterygii: Gadiformes: Merlucciidae), from the Northeastern Mediterranean Sea. Acta Ichthyol. Piscat. 2011, 41, 277–284. [Google Scholar] [CrossRef]
  18. Philips, A.E. Feeding behavior of the European hake Merluccius merluccius Linnaeus, 1758 (Family: Gadidae) from Egyptian Mediterranean waters off Alexandria. Egypt. J. Aquat. Res. 2012, 38, 39–44. [Google Scholar] [CrossRef]
  19. D’Iglio, C.; Porcino, N.; Savoca, S.; Profeta, A.; Perdichizzi, A. Ontogenetic shift and feeding habits of the European hake (Merluccius merluccius L., 1758) in Central and Southern Tyrrhenian Sea (Western Mediterranean Sea): A comparison between past and present data. Ecol. Evol. 2022, 12, e8634. [Google Scholar] [CrossRef] [PubMed]
  20. D’Iglio, C.; Famulari, S.; Albano, M.; Giordano, M.; Rinelli, P.; Capillo, G.; Spanò, N.; Savoca, S. Time-Scale Analysis of Prey Preferences and Ontogenetic Shift in the Diet of European Hake Merluccius merluccius (Linnaeus, 1758) in Southern and Central Tyrrhenian Sea. Fishes 2022, 7, 167. [Google Scholar] [CrossRef]
  21. Riccioni, G.; Stagioni, M.; Piccinetti, C.; Libralato, S. A metabarcoding approach for the feeding habits of European hake in the Adriatic Sea. Ecol. Evol. 2018, 8, 10435–10447. [Google Scholar] [CrossRef] [PubMed]
  22. Riccioni, G.; Stagioni, M.; Manfredi, C.; Tinti, F.; Piccinetti, C.; Libralato, S. DNA metabarcoding suggests dietary niche partitioning in the Adriatic European hake. Sci. Rep. 2022, 12, 1343. [Google Scholar] [CrossRef] [PubMed]
  23. Gül, G. Feeding ecology of European hake: Insights from stomach content and stable isotope analyses. Reg. Stud. Mar. Sci. 2024, 69, 103314. [Google Scholar] [CrossRef]
  24. Caragitsou, E.; Tsimenidis, N. The food of hake (Merluccius merluccius) in the Saronikos Gulf. Thalassographica 1977, 1, 232–244. [Google Scholar]
  25. Papaconstantinou, C.; Caragitsou, E. The food of hake (Merluccius merluccius) in Greek seas. Vie Milieu 1987, 37, 21–29. [Google Scholar]
  26. Labropoulou, M.; Markakis, G. Morphological-dietary relationships within two assemblages of marine demersal fishes. Environ. Biol. Fishes 1998, 51, 309–319. [Google Scholar] [CrossRef]
  27. Karachle, P. Feeding Ecology of the Most Important Fish Stock in the North Aegean Sea. Ph.D. Thesis, Aristotle University of Thessaloniki, Thessaloniki, Greece, 2008. [Google Scholar]
  28. Yannopoulos, C. The feeding niche of Merluccius merluccius L. and its influence on Length-Weight relationship. Rapp. Comm. Int. Mer Médit. 1976, 24, 69–71. [Google Scholar]
  29. Papaconstantinou, C.; Caragitsou, E. Diet of juvenile hake (M. merluccius) on the nursery grounds. In Proceedings of the 1st World Fisheries Congress, Athens, Greece, January 1992; pp. 341–350. [Google Scholar]
  30. Link, J.S. What does ecosystem-based fisheries management mean. Fisheries 2002, 27, 18–21. [Google Scholar]
  31. Pikitch, E.K.; Santora, C.; Babcock, E.A.; Bakun, A.; Bonfil, R.; Conover, D.O.; Dayton, P.; Doukakis, P.; Fluharty, D.; Heneman, B.; et al. Ecosystem-based fishery management. Science 2004, 305, 346–347. [Google Scholar] [CrossRef]
  32. EU. Regulation (EU) No 1380/2013 of the European Parliament and the Council of 11 December 2013 on the Common Fisheries Policy, Amending Council Regulations (EC) No 1954/2003 and (EC) No 1224/2009 and repealing Council Regulations (EC) No 2371/2002 and (EC) No 639/2004 and Council Decision 2004/585/EC. Official Journal of the European Union, 28.12.2013, L 354/22. Available online: https://eur-lex.europa.eu/eli/reg/2013/1380/oj (accessed on 29 April 2024).
  33. EC. Directive 2008/56/EC of the European Parliament and of the Council of 17 June 2008 Establishing a Framework for Community Action in the Field of Marine Environmental Policy (Marine Strategy Framework Directive). Official Journal of the European Union, 25-6-2008, L 164/19. Available online: https://eur-lex.europa.eu/eli/dir/2008/56/oj (accessed on 29 April 2024).
  34. EU. Directive 2014/89/EU of the European Parliament and of the Council of 23 July 2014 Establishing a Framework for Maritime Spatial Planning. Official Journal of the European Union, 28-8-2014, L 257/135. Available online: https://eur-lex.europa.eu/legal-content/EN/TXT/?uri=celex%3A32014L0089 (accessed on 29 April 2024).
  35. Tsagarakis, K.; Coll, M.; Giannoulaki, M.; Somarakis, S.; Papaconstantinou, C.; Machias, A. Food-web traits of the North Aegean Sea ecosystem (Eastern Mediterranean) and comparison with other Mediterranean ecosystems. Estuar. Coast. Shelf Sci. 2010, 88, 233–248. [Google Scholar] [CrossRef]
  36. ELSTAT. Hellenic Statistical Authority. Sea Fisheries Statistics. Available online: https://www.statistics.gr/en/statistics/-/publication/SPA03/- (accessed on 29 April 2024).
  37. RCG Med&BS. Strengthening regional cooperation in the area of fisheries data collection in the Mediterranean and Black Sea, D0.2. Final Report: Deliverable 3.3. Protocols and guidelines for sampling, processing and analysing the stomach contents. Agreement number MARE/2014/19–SI2.705484.
  38. RCG Med&BS. Workshop on Sampling, Processing and Analysing the Stomach Contents (WKSTCON). WKSTCON Report 2018, 24–27 April 2018, Palma de Mallorca, Spain.
  39. RCG Med&BS. Strengthening Regional Cooperation in the Area of Fisheries Data Collection in the Mediterranean and Black Sea (STREAM), D0.3 Final Report: Deliverable, D. 4.1. Updated Protocols and Guidelines for Collection, Processing and Analysis of Stomach Contents. Agreement Number MARE/2016/22–SI2.770115. Available online: https://datacollection.jrc.ec.europa.eu/documents/d/dcf/med-and-bs_stream_mare-2016-22 (accessed on 29 April 2024).
  40. RCG NA, NS & EA, RCG Baltic. ISSG Regionally Coordinated Stomach Sampling. Intersessional Subgroup (ISSG) 2022–2023 Reports. Available online: https://datacollection.jrc.ec.europa.eu/documents/d/dcf/2023_rcg_nansea-rcg-baltic_tm-rpt_part-iii (accessed on 29 April 2024).
  41. Ferry, L.A.; Cailliet, G.M. Sample size and data analysis: Are we characterizing and comparing diet properly? In GUTSHOP ’96, Feeding Ecology and Nutrition in Fish, Proceedings of the International Congress on the Biology of Fishes, San Francisco, CA, USA, 14–18 July 1996; American Fisheries Society: Washington, DC, USA, 1996; pp. 71–80. [Google Scholar]
  42. Tiralongo, F.; Messina, G.; Cazzolla Gatti, R.; Tibullo, D.; Lombardo, B.M. Some biological aspects of juveniles of the rough ray, Raja radula Delaroche, 1809 in Eastern Sicily (central Mediterranean Sea). J. Sea Res. 2018, 142, 174–179. [Google Scholar] [CrossRef]
  43. Hureau, J.-C. Biologie comparee de quelques poissons antarctiques (Nototheniidae). Bull. Mus. Oceanogr. Monaco 1970, 68, 1–244. [Google Scholar]
  44. Graham, B.S.; Grubbs, D.; Holland, K.; Popp, B.N. A rapid ontogenetic shift in the diet of juvenile yellowfin tuna from Hawaii. Mar. Biol. 2007, 150, 647–658. [Google Scholar] [CrossRef]
  45. Anderson, M. A new method for non-parametric multivariate analysis of variance. Austral. Ecol. 2001, 26, 32–46. [Google Scholar] [CrossRef]
  46. Hyslop, J. Stomach content analysis: A review of methods and their application. J. Fish Biol. 1980, 17, 411–429. [Google Scholar] [CrossRef]
  47. Pinkas, L.; Oliphant, M.; Iverson, K. Food habits of albacore, bluefin tuna and bonito in California waters. Calif. Dep. Fish Game Fish. Bull. 1971, 152, 1–150. [Google Scholar]
  48. Hacunda, S. Trophic relationships among demersal fishes in a coastal area of the Gulf of Maine. Fish. Bull. 1981, 79, 775–788. [Google Scholar]
  49. Cortes, E. A critical review of methods of studying fish feeding based on analysis of stomach contents: Application to elasmobranch fishes. Can. J. Fish. Aquat. Sci. 1997, 54, 726–738. [Google Scholar] [CrossRef]
  50. Hill, M.O. Diversity and evenness: A unifying notation and its consequences. Ecology 1973, 54, 427–432. [Google Scholar] [CrossRef]
  51. Jost, L. Entropy and diversity. Oikos 2006, 113, 363–375. [Google Scholar] [CrossRef]
  52. Chao, A.; Gotelli, N.J.; Hsieh, T.C.; Sander, E.L.; Ma, K.H.; Colwell, R.K.; Ellison, A.M. Rarefaction and extrapolation with Hill numbers: A framework for sampling and estimation in species diversity studies. Ecol. Monogr. 2014, 84, 45–67. [Google Scholar] [CrossRef]
  53. Hsieh, T.C.; Ma, K.H.; Chao, A. iNEXT: An R package for rarefaction and extrapolation of species diversity (Hill numbers). Methods Ecol. Evol. 2016, 7, 1451–1456. [Google Scholar] [CrossRef]
  54. Van Valen, L. Morphological variation and width of ecological niche. Am. Nat. 1965, 99, 377–389. [Google Scholar] [CrossRef]
  55. Bolnick, D.I.; Svanback, R.; Fordyce, J.A.; Yang, L.H.; Davis, J.M.; Hulsey, C.D.; Forister, M.L. The ecology of individuals: Incidence and implications of individual specialization. Am. Nat. 2003, 161, 1–28. [Google Scholar] [CrossRef]
  56. Bolnick, D.I.; Yang, L.H.; Fordyce, J.A.; Davis, J.M.; Svanback, R. Measuring individual-level resource specialization. Ecology 2002, 83, 2936–2941. [Google Scholar] [CrossRef]
  57. Roughgarden, J. Evolution of niche width. Am. Nat. 1972, 106, 683–718. [Google Scholar] [CrossRef]
  58. Costello, M.J. Predator feeding strategy and prey importance: A new graphical analysis. J. Fish Biol. 1990, 36, 261–263. [Google Scholar] [CrossRef]
  59. Amundsen, P.-A.; Gabler, H.-M.; Staldvik, F.J. A new method for graphical analysis of feeding strategy from stomach contents data. J. Fish Biol. 1996, 48, 607–614. [Google Scholar] [CrossRef]
  60. Krebs, C.J. Ecological Methodology, 3rd ed.; Addison-Wesley Educational Publishers, Inc.: Boston, MA, USA, 2014. [Google Scholar]
  61. R Core Team. R: A Language and Environment for Statistical Computing; R Foundation for Statistical Computing: Vienna, Austria, 2024; Available online: https://www.R-project.org/ (accessed on 30 January 2024).
  62. Bastian, M.; Heymann, S.; Jacomy, M. Gephi: An open-source software for exploring and manipulating networks. In Proceedings of the Third International AAAI Conference on Weblogs and Social Media, San Jose, CA, USA, 17–20 May 2009; pp. 361–362. [Google Scholar]
  63. Anderson, M.J.; Gorley, R.N.; Clarke, K.R. PERMANOVA+ for PRIMER: Guide to Software and Statistical Methods; PRIMER-E: Plymouth, UK, 2008. [Google Scholar]
  64. Werner, E.E.; Gilliam, J.F. The ontogenetic niche and species interactions in size-structured populations. Ann. Rev. Ecol. Syst. 1984, 15, 393–425. [Google Scholar] [CrossRef]
  65. Nakazawa, T. Ontogenetic niche shifts matter in community ecology: A review and future perspectives. Popul. Ecol. 2015, 57, 347–354. [Google Scholar] [CrossRef]
  66. Sánchez-Hernández, J.; Nunn, A.D.; Adams, C.E.; Amundsen, P.-A. Causes and consequences of ontogenetic dietary shifts: A global synthesis using fish models. Biol. Rev. 2019, 94, 539–554. [Google Scholar] [CrossRef]
  67. Amundsen, P.-A.; Bøhn, T.; Popova, O.A.; Staldvik, F.J.; Reshetnikov, Y.S.; Kashulin, N.A.; Lukin, A. Ontogenetic niche shifts and resource partitioning in a subarctic piscivore fish guild. Hydrobiologia 2003, 497, 109–119. [Google Scholar] [CrossRef]
  68. Kolasinski, J.; Frouin, P.; Sallon, A.; Rogers, K.; Bruggemann, H.J.; Potier, M. Feeding ecology and ontogenetic dietary shift of yellowstripe goatfish Mulloidichthys flavolineatus (Mullidae) at Reunion Island, SW Indian Ocean. Mar. Ecol. Prog. Ser. 2009, 386, 181–195. [Google Scholar] [CrossRef]
  69. Sánchez-Hernández, J.; Prati, S.; Henriksen, E.H.; Smalås, A.; Knudsen, R.; Klemetsen, A.; Amundsen, P.-A. Exploring temporal patterns in fish feeding ecology: Are ontogenetic dietary shifts stable over time? Rev. Fish Biol. Fish. 2022, 32, 1141–1155. [Google Scholar] [CrossRef]
  70. Loutrage, L.; Brind’Amour, A.; Chouvelon, T.; Spitz, J. Ontogenetic shift or not? Different foraging trade-offs within the meso- to bathypelagic fish community. Ecol. Evol. 2023, 14, e11129. [Google Scholar] [CrossRef]
  71. Hjelm, J.; Persson, L.; Christensen, B. Growth, morphological variation and ontogenetic niche shifts in perch (Perca fluviatilis) in relation to resource availability. Oecologia 2000, 122, 190–199. [Google Scholar] [CrossRef]
  72. Yasuno, N.; Fujimoto, Y.; Shimada, T.; Shikano, S.; Kikuchi, E. Ontogenetic dietary shifts of largemouth bass do not increase trophic position in a shallow eutrophic lake in Japan. Ann. Limnol. Int. J. Lim. 2016, 52, 355–364. [Google Scholar] [CrossRef]
  73. García-Berthou, E. Ontogenetic Diet Shifts and Interrupted Piscivory in Introduced Largemouth Bass (Micropterus salmoides). Internat. Rev. Hydrobiol. 2002, 4, 353–363. [Google Scholar] [CrossRef]
  74. Du Buit, M.H. Diet of hake (Merluccius merluccius) in the Celtic Sea. Fish. Res. 1996, 28, 381–394. [Google Scholar] [CrossRef]
  75. Punt, A.T.; Leslie, R.W.; Duplessis, S.E. Estimation of the annual consumption food by cape hake, Merluccius capensis and M. paradoxus, off the South African west coast. S. Afr. J. Mar. Sci. 1992, 12, 611–634. [Google Scholar] [CrossRef]
  76. Lloret-Lloret, E.; Navarro, J.; Giménez, J.; López, N.; Albo-Puigserver, M.; Grazia Pennino, M.; Coll, M. The Seasonal Distribution of a Highly Commercial Fish Is Related to Ontogenetic Changes in Its Feeding Strategy. Front. Mar. Sci. 2020, 7, 566686. [Google Scholar] [CrossRef]
  77. Perdichizzi, A.; Pirrera, L.; Giordano, D.; Perdichizzi, F.; Busalacchi, B.; Profeta, A.; Bottari, T.; Rinelli, P. Distribution patterns and population structure of Illex coindetii (Cephalopoda: Ommastrephidae) in the Southern Tyrrhenian Sea: Historical series of 14 years trawl survey. Fish. Res. 2011, 109, 342–350. [Google Scholar] [CrossRef]
  78. Smale, M.J. Cephalopods as prey. IV. Fishes. Phil. Trans. R. Soc. Lond. B 1996, 351, 1067–1081. [Google Scholar] [CrossRef]
  79. Fanelli, E.; Rumolo, P.; Barra, M.; Basilone, G.; Genovese, S.; Bonnano, A. Mesoscale variability in the trophic ecology of the European hake Merluccius merluccius in the Strait of Sicily. Hydrobiologia 2018, 821, 57–72. [Google Scholar] [CrossRef]
  80. Scharf, F.S.; Juanes, F.; Rountree, R.A. Predator size—Prey size relationships of marine fish predators: Interspecific variation and effects of ontogeny and body size on trophic-niche breadth. Mar. Ecol. Prog. Ser. 2000, 208, 229–248. [Google Scholar] [CrossRef]
  81. Pyke, G.H. Optimal foraging theory: A critical review. Ann. Rev. Ecol. Syst. 1984, 15, 523–575. [Google Scholar] [CrossRef]
  82. Dill, L.M. Adaptive Flexibility in the Foraging Behavior of Fishes. Can. Fish. Aquat. Sci. 1983, 40, 398–408. [Google Scholar] [CrossRef]
  83. Preciado, I.; Punzón, A.; Velasco, F. Spatio-temporal variability in the cannibalistic behaviour of European hake Merluccius merluccius: The influence of recruit abundance and prey availability. J. Fish. Biol. 2015, 86, 1319–1334. [Google Scholar] [CrossRef]
  84. Nielsen, J.M.; Clare, E.L.; Hayden, B.; Brett, M.T.; Kratina, P. Diet tracing in ecology: Method comparison and selection. Methods Ecol. Evol. 2017, 9, 278–291. [Google Scholar] [CrossRef]
  85. Carpentieri, P.; Colloca, F.; Cardinale, M.; Belluscio, A.; Ardizzone, G.D. Feeding habits of European hake (Merluccius merluccius) in the central Mediterranean Sea. Fish. Bull. 2005, 103, 411–416. [Google Scholar]
  86. Hurst, T.P.; Duffy, T.A. Activity patterns in northern rock sole are mediated by temperature and feeding history. J. Exp. Mar. Biol. Ecol. 2005, 325, 201–213. [Google Scholar] [CrossRef]
  87. Peck, M.A.; Buckley, L.J.; Bengtson, D.A. Effects of temperature and body size on the swimming speed of larval and juvenile Atlantic cod (Gadus morhua): Implications for individual based modelling. Environ. Biol. Fishes 2006, 75, 419–429. [Google Scholar] [CrossRef]
  88. Walther, G.R.; Post, E.; Convey, P.; Menzel, A.; Parmesan, C.; Beebee, T.J.C.; Fromentin, J.-M.; Hoegh-Guldberg, O.; Bairlein, F. Ecological responses to recent climate change. Nature 2002, 416, 389–395. [Google Scholar] [CrossRef]
  89. Doney, S.C.; Ruckelshaus, M.; Emmett Duffy, J.; Barry, J.P.; Chan, F.; English, C.A.; Galindo, H.M.; Grebmeier, J.M.; Hollowed, A.B.; Knowlton, N.; et al. Climate change impacts on marine ecosystems. Ann. Rev. Mar. Sci. 2012, 4, 11–37. [Google Scholar] [CrossRef]
  90. Free, C.M.; Thorson, J.T.; Pinsky, M.L.; Oken, K.L.; Wiedenmann, J.; Jensen, O.P. Impacts of historical warming on marine fisheries production. Science 2019, 363, 979–983. [Google Scholar] [CrossRef]
  91. Zhou, S.; Smith, A.D.M.; Punt, A.E.; Richardson, A.J.; Gibbs, M.; Fulton, E.; Pascoe, S.; Bulman, C.; Bayliss, P.; Sainsbury, K. Ecosystem-based fisheries management requires a change to the selective fishing philosophy. Proc. Natl. Acad. Sci. USA 2010, 107, 9485–9489. [Google Scholar] [CrossRef]
  92. Punt, A.E.; Ortiz, I.; Aydin, K.Y.; Hunt, G.L., Jr.; Wiese, F.K. End-to-end modeling as part of an integrated research program in the Bering Sea. Deep-Sea Res. II Top. Stud. Oceanogr. 2016, 134, 413–423. [Google Scholar] [CrossRef]
  93. Zhou, S.; Kolding, J.; Garcia, S.M.; Plank, M.J.; Bundy, A.; Charles, A.; Hansen, C.; Heino, M.; Howell, D.; Jacobsen, N.S.; et al. Balanced harvest: Concept, policies, evidence, and management implications. Rev. Fish Biol. Fish. 2019, 29, 711–733. [Google Scholar] [CrossRef]
  94. Sun, R.; Sun, P.; Fu, C.; Liu, G.; Liang, Z.; Shin, Y.-J.; Barrier, N.; Tian, Y. Exploring balanced harvest as a potential strategy for highly exploited multispecies fisheries. ICES J. Mar. Sci. 2023, 80, 897–910. [Google Scholar] [CrossRef]
  95. Thompson, R.M.; Hemberg, M.; Starzomski, B.M.; Shurin, J.B. Trophic levels and trophic tangles: The prevalence of omnivory in real food webs. Ecology 2007, 88, 612–617. [Google Scholar] [CrossRef]
  96. Pinnegar, K.; Trenkel, V.M.; Tidd, A.N.; Dawson, W.A.; Du Buit, M.H. Does diet in Celtic Sea fishes reflect prey availability? J. Fish Biol. 2003, 63, 197–212. [Google Scholar] [CrossRef]
  97. Roswell, M.; Dushoff, J.; Winfree, R. A conceptual guide to measuring species diversity. Oikos 2021, 130, 321–338. [Google Scholar] [CrossRef]
  98. Gotelli, N.J.; Colwell, R.K. Estimating species richness. In Biological Diversity: Frontiers in Measurement and Assessment; Magurran, A.E., McGill, B.J., Eds.; Oxford University Press: New York, NY, USA, 2011; pp. 39–54. [Google Scholar]
  99. Chao, A.; Jost, L. Coverage-based rarefaction and extrapolation: Standardizing samples by completeness rather than size. Ecology 2012, 93, 2533–2547. [Google Scholar] [CrossRef]
  100. Shannon, C. A mathematical theory of communication. Bell Syst. Tech. J. 1948, 27, 379–423. [Google Scholar] [CrossRef]
  101. Simpson, E.H. Measurement of Diversity. Nature 1949, 163, 688. [Google Scholar] [CrossRef]
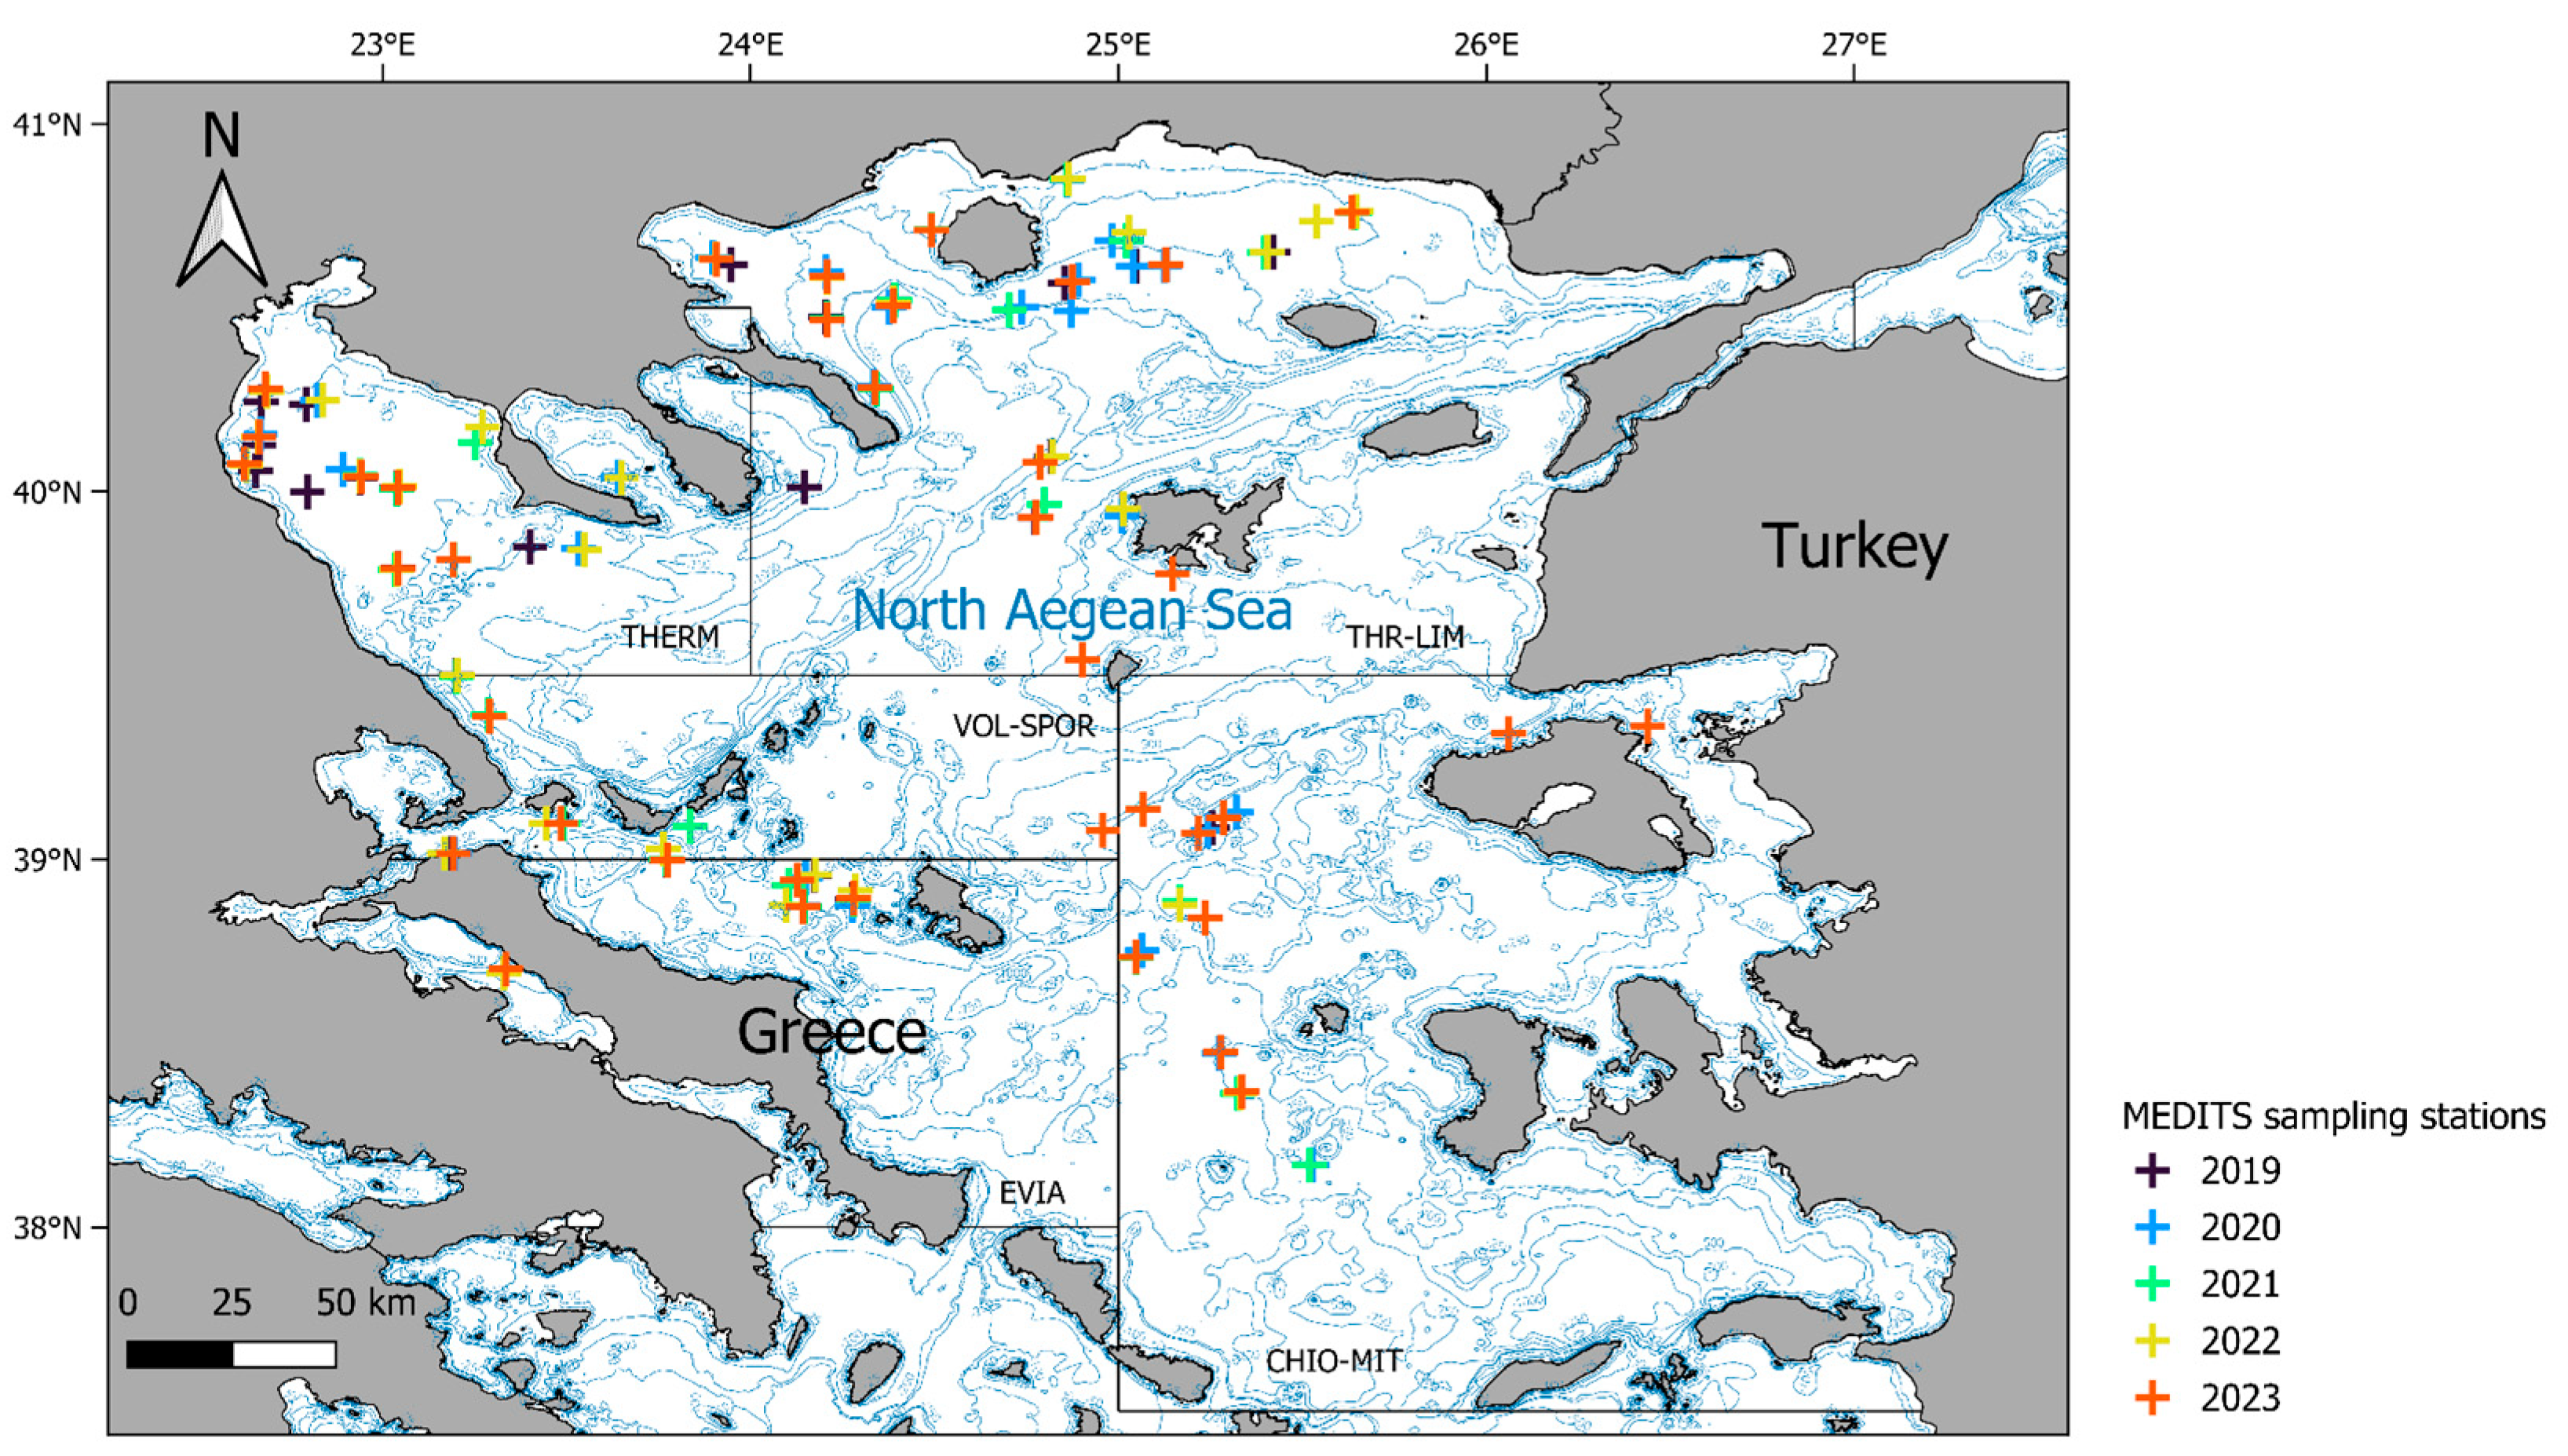
Figure 1. Map of the study area, indicating the locations of the International Bottom Trawl Survey in the Mediterranean (MEDITS) sampling stations where hake stomach samples were collected in the present study during 2019–2023.
Fishes 09 00257 g001
Figure 2. Accumulation curve plots for prey taxa found in the hake stomachs collected in the present study in the North Aegean Sea during 2019–2023. Body-size classes: 0 = <100 mm, 1 = 100–199 mm, 2 = 200–299 mm, 3 = 300–399 mm, 4 = 400–499 mm, and 5 = >500 mm.
Fishes 09 00257 g002
Figure 3. Pie-donut plots depicting the variability of the relative importance of prey taxa and taxonomic groups in the diet of hake between body-size classes, sampling years, and subareas in the North Aegean Sea, based on the data collected in the present study. The inner parts of the plots are partitioned according to the %IRI values of taxonomic groups, whereas the outer parts according to the %IRI values of prey taxa. The full names of the prey taxa are given in Table 2. Only species with %IRI > 1% are labeled in the plots. Body-size classes: 0 = <100 mm, 1 = 100–199 mm, 2 = 200–299 mm, 3 = 300–399 mm, 4 = 400–499 mm, and 5 = >500 mm. Subareas: Northeastern Aegean Sea (CHIO-MIT), Evia (EVIA), Thermaikos Gulf and adjacent seas (THERM), Thracian Sea (THR-LIM), and Thessaly and Sporades Islands (VOL-SPOR). Taxonomic groups: C = Cephalopoda, D = Decapoda, O = Other Crustacea, T = Teleostei.
Fishes 09 00257 g003
Figure 4. Predator–prey network graph depicting the trophic links between hake body-size classes and their prey, based on the data collected in the present study. The prey nodes are colored with respect to their out degrees: cold colors correspond to higher out-degrees, while warm colors correspond to lower out-degrees. The width of the edges is proportional to the number of times the respective prey–predator link was found in the samples. The full names of the prey taxa are given in Table 2. Body-size classes: 0 = <100 mm, 1 = 100–199 mm, 2 = 200–299 mm, 3 = 300–399 mm, 4 = 400–499 mm, and 5 = >500 mm.
Fishes 09 00257 g004
Figure 5. Diversity accumulation curves for hake prey diversity of orders 0, 1, and 2 for the different body-size classes, years, and subareas in the North Aegean Sea, based on the data collected in the present study. Body-size classes: 0 = <100 mm, 1 = 100–199 mm, 2 = 200–299 mm, 3 = 300–399 mm, 4 = 400–499 mm, and 5 = >500 mm. Subareas: Northeastern Aegean Sea (CHIO-MIT), Evia (EVIA), Thermaikos Gulf and adjacent seas (THERM), Thracian Sea (THR-LIM), and Thessaly and Sporades Islands (VOL-SPOR).
Fishes 09 00257 g005
Figure 6. Feeding strategy plots for hake in the North Aegean Sea, based on the data collected in the present study. The plots correspond to the different body-size classes except the last plot, which corresponds to the pooled stomachs.
Fishes 09 00257 g006
Figure 7. Spatial and interannual variations in mean biomass density of key hake prey species in the North Aegean Sea during 2019–2023, based on MEDITS surveys data. Subareas: Northeastern Aegean Sea (CHIO-MIT), Evia (EVIA), Thermaikos Gulf and adjacent seas (THERM), Thracian Sea (THR-LIM), and Thessaly and Sporades Islands (VOL-SPOR).
Fishes 09 00257 g007
Table 1. Variability in the numbers of hake stomachs collected and the values of the vacuity (VI) and repletion (RI) indices between size classes, years, and subareas during the present study.
Stomachs (n)VI (%)Mean RI (‰)
Body-size class
02630.7730.80
122532.4443.50
226133.3334.67
320331.5321.05
44025.0022.94
51435.7177.10
Year
20199537.8928.36
202013836.2336.48
202115237.5027.03
202223233.6234.21
202315217.1138.02
Subarea
CHI-MIT9024.4438.94
EVIA11224.1132.78
THERM15346.4135.26
THR-LIM30330.3636.15
VOL-SPOR11131.5320.56
Table 2. %IRI index values for prey taxa and taxonomic groups identified in hake stomachs collected during the present study in the North Aegean Sea from 2019 to 2023. The indices are presented for the different body-size classes separately, as well as after pooling all stomachs across body-size classes. Additionally, the table shows for the prey taxa the abbreviations of their names used in Figure 3 and the corresponding functional groups (FG): 1 = octopuses and cuttlefish, 2 = squids, 3 = benthic decapods and non-decapod crustaceans, 4 = bathypelagic decapods, 5 = benthopelagic decapods, 6 = demersal fish, 7 = bathydemersal fish, 8 = bathypelagic fish, 9 = benthopelagic fish, 10 = small pelagic fish, 0 = not classified to functional groups unidentified cephalopods, decapods and non-decapod crustaceans, and fish.
Body-Size Classes
Prey TaxaAbbreviationFG012345All Stomachs
Cephalopoda 0.040.760.7536.440.91
Abralia veranyiAbrver2 0.010.05 1.840.02
Illex coindetiiIllcoi2 0.011.04 34.451.28
Octopus vulgarisOctvul1 2.820.01
Rossia macrosomaRosmac1 0.22 0.02
SepiidaeSep1 1.07 0.01
Sepiola sp.Sepsp.1 0.02 *
Todarodes sagittatusTodsag2 4.140.03
CephalopodaCep0 0.010.081.28 0.04
Decapoda 46.7412.066.5019.205.52 11.40
AlpheidaeAlp3 0.03 0.01
Alpheus glaberAlpgla3 0.020.040.08 0.04
Alpheus sp.Alpsp.3 0.050.030.08 0.05
Chlorotocus crassicornisChlcra3 0.070.390.670.73 0.39
MunididaeMun3 0.01 *
NatantiaNat01.280.230.661.351.43 0.89
Parapenaeus longirostrisParlon5 0.081.3013.451.36 2.72
Pasiphaea multidentataPasmul4 0.020.060.03 0.03
Pasiphaea sp.Passp.4 0.01 *
Plesionika edwardsiiPleedw3 0.03 *
Plesionika giglioliPlegig3 0.01 *
Plesionika heterocarpusPlehet3 0.010.01 0.01
Plesionika sp.Plesp.3 0.180.421.470.38 0.57
SergestidaeSer4 0.14 0.01
Sergestes sp.Sersp.4 0.01 *
Solenocera crassicornisSolcra3 0.01 *
Solenocera membranaceaSolmem3 0.03 *
DecapodaDec043.9010.290.947.994.52 8.09
Other Crustacea 30.910.76 0.090.05 0.30
Squilla mantisSquman3 0.02 *
CrustaceaCru039.782.25 0.350.35 1.59
Teleostei 22.3687.1893.4679.9593.6863.5687.40
Argentina sphyraenaArgsph7 0.04 *
Boops boopsBooboo6 0.06 *
Cepola macrophthalmaCepmac6 0.020.01 0.01
Ceratoscopelus maderensisCermad8 0.320.03 0.08
Chauliodus sloaniChaslo8 0.08 0.01
Chlorophthalmus agassiziChlaga7 0.530.75 8.260.41
Deltentosteus quadrimaculatusDelqua6 0.01 *
Engraulis encrasicolusEngenc10 54.6832.8725.569.088.6032.18
Gadiculus argenteusGadarg10 0.080.020.19 0.07
Hymenocephalus italicusHymita9 0.90 *
Lampanyctus crocodilusLamcro8 0.03 *
Lepidopus caudatusLepcau9 0.02 1.61 0.03
Lesueurigobius friesiiLesfri6 0.160.01 0.03
Merluccius merlucciusMermer6 0.03 *
Micromesistius poutassouMicpou8 0.010.0214.8625.840.98
MyctophidaeMyc8 3.5514.7110.240.32 9.09
Nettastoma melanuraNetmel8 0.20 0.02
Ophisurus serpensOphser6 0.34 0.03
Phycis blennoidesPhyble9 0.03 *
Sardinella auritaSaraur103.27 0.33 0.05
Sardina pilchardusSarpil10 0.1030.38 0.32
Serranus hepatusSerhep6 0.05 *
SparidaeSpa6 0.032.69 0.03
Spicara flexuosumSpifle6 0.046.08 0.58
Spicara sp.Spisp.6 0.080.07 0.03
StomiidaeSto8 0.05 *
Stomias boaStoboa8 0.06 *
Trachurus mediterraneusTramed10 0.69 *
Trachurus trachurusTratra10 0.090.120.8914.050.39
OsteichthyesOst011.7828.0747.1928.7927.46 39.81
* <0.01%.
Table 3. Variability in the percentage index of overlap in diet composition (Cxy) between pairs of hake body-size classes, years, and subareas in the North Aegean Sea, based on the data collected in the present study.
Body-Size ClassesCxyYearsCxySubareasCxy
010.41201920200.46CHI-MITEVIA0.70
020.13201920210.53CHI-MITTHERM0.46
030.21201920220.41CHI-MITTHR-LIM0.57
040.18201920230.36CHI-MITVOL-SPOR0.40
050.00202020210.57EVIATHERM0.44
120.61202020220.63EVIATHR-LIM0.57
130.61202020230.51EVIAVOL-SPOR0.45
140.45202120220.62THERMTHR-LIM0.60
150.13202120230.54THERMVOL-SPOR0.63
230.69202220230.58THR-LIMVOL-SPOR0.57
240.46
250.17
340.53
350.19
450.23
Disclaimer/Publisher’s Note: The statements, opinions and data contained in all publications are solely those of the individual author(s) and contributor(s) and not of MDPI and/or the editor(s). MDPI and/or the editor(s) disclaim responsibility for any injury to people or property resulting from any ideas, methods, instructions or products referred to in the content.