Article

Environmental DNA Characterization of the Fish Species Composition in the Mukawa River and Adjacent Habitats

by
Hyojin Ahn
1,*,† and
Michael J. Miller
2,*,‡
1
Research and Educational Unit for Studies on Connectivity of Hills, Humans and Oceans, Kyoto University, Kyoto 606-8501, Japan
2
Department of Aquatic Bioscience, The University of Tokyo, Bunkyo, Tokyo 113-8657, Japan
*
Authors to whom correspondence should be addressed.
Current address: Faculty of Fisheries Science, Hokkaido University, Hakodate 041-8611, Japan.
Retired.
Fishes 2024, 9(4), 147; https://doi.org/10.3390/fishes9040147
Submission received: 15 March 2024 / Revised: 16 April 2024 / Accepted: 18 April 2024 / Published: 21 April 2024
(This article belongs to the Section Biology and Ecology)

Abstract

:
The diverse freshwater fish fauna of the Japanese archipelago is distributed among four main island landmasses, which include Hokkaido in the north, with many diadromous species. One relatively well-preserved river drainage along the southern coast of Central Hokkaido is the Mukawa River. Fish fauna surveys in the Mukawa River were mostly in downstream areas and the fish diversity is not well-documented among the upper, lower river, and coastal environments. Fish communities in the river, estuary, and sea were sampled using eDNA analysis to evaluate upstream and downstream species detections, and tidal and spatial detection variation near the river mouth. The number of species was higher at the river mouth and nearshore sites compared to the river and offshore. Fish detections reflected life history categories (freshwater resident, diadromous, brackish, or marine) and the environments. Similarity analysis showed that fish species compositions were divided into (1) upstream and midstream, (2) downstream and river mouth, (3) adjacent shore, and (4) offshore. Salmonid, cyprinid, loach, and sculpin species were detected in the river, compared to a mixture of species downstream and along the coast. This rapid assessment type study demonstrated that eDNA survey methodology would be effective for multiple river comparative surveys, seasonality studies, or evaluating possible effects of cross-river weirs or dams.
Key Contribution: Surveying aquatic fish faunas is important for conservation and fisheries ecology, but traditional capture-based sampling methods are highly labor intensive. A low-effort, rapid assessment type survey of the fish fauna in different environments of the Mukawa River and nearby areas along the southern coast of Central Hokkaido, Japan was conducted using eDNA analyses of water samples. A total of 51 taxa of fishes of four groups of species were detected that mostly corresponded to individual species with freshwater, migratory, or coastal marine life histories, which demonstrated that carefully designed rapid assessment sampling strategies seem possible using eDNA methodology for monitoring fish communities, such as those in the rivers of Hokkaido.

Graphical Abstract

1. Introduction

The many islands of the Japanese archipelago that spread across 3000 km of latitude (20–46° N) have a diverse fauna of freshwater and marine fishes, because of their phylogeographic history and location in relation to ocean currents, such as the Kuroshio Current [1]. The fish fauna of Japan includes 4476 valid species, which is 12% of the world’s ichthyofauna [2]. The main islands are generally mountainous with relatively short river drainages compared to continental areas (Figure 1a; [3]). The freshwater fish fauna of Japan presently consists of 512 species including estuarine, diadromous, and introduced species, and many native species are endangered [4,5]. However, the number of primary freshwater species that are strictly confined to freshwater in Japan is much fewer (152), as listed by Endo and Matsuura [2]. Many freshwater fish in Japan have been impacted by anthropogenic changes to river systems such as dams, weirs, or revetments, and changes to rice paddy farming styles or earlier periods of pollution have negatively affected many species [3,5,6].
The freshwater fish diversity in the rivers and lakes of Japan ranging from Kyushu in the south to Hokkaido in the north, Figure 1a), includes both resident species such as cyprinids and loaches, and diadromous species such as anadromous salmonids (salmon, trout, char), catadromous anguillid eels (Anguilla japonica, A. marmorata), amphidromous ayu (Plecoglossus altivelis), amphidromous gobies and cyprinids (anadromous dace), which include some landlocked forms [7,8,9]. Diadromous species are especially impacted by dams and weirs, which can obstruct their movements between freshwater and the sea, as reported in Japan [10,11,12].
In the far north, the relatively cold marine waters around Hokkaido (Sea of Japan, Sea of Okhotsk, Pacific coast) are inhabited by 771 species of 51 orders, as listed by Kai [13]. The freshwater fish fauna in Hokkaido has far fewer species, but includes a diverse fauna of diadromous fishes, as well as some resident species (Figure 2; [14,15]); but the number of freshwater species is much lower than in Southern Japan [16]. Hokkaido includes numerous mountain areas and two large flat plain areas with single large drainage systems on the Sea of Japan (Ishikari River) and Pacific (Tokachi River) sides of the island (Figure 1b).
Most other Hokkaido river drainages are much shorter and extend from the coastline and into higher elevations in the mountains. This is the case along the southern coast of Central Hokkaido, where a series of rivers extend into the southwestern side of the Hidaka Mountains (Figure 1b). One of those rivers at the western end of that coast is the relatively pristine Mukawa River (also called the Mu River), which is 135 km in length with a 1270 km2 of basin area, with 80% shoreline forest coverage along the river (Ministry of Land, Infrastructure, Transport and Tourism, Japan, https://www.mlit.go.jp/; accessed on 19 July 2021). This river area has probably been studied more than most rivers in Hokkaido because it is a fisheries area that is especially famous for shishamo smelt (Spirinchus lanceolatus). Because it is a commercially important and threatened endemic species that enters freshwater for spawning, the spawning migrations of shishamo smelt have been monitored in this area [17,18].
The Mukawa River is inhabited by a variety of fish species with different life histories [15]. The anadromous dace species are present in many regions of Northern Japan [19] and their biology has been studied in the Mukawa River and other rivers [20], but most species in the river have not been studied in the readily available literature. Even though the Mukawa coast is highly productive for fisheries, previous reports that included this river area were mostly limited to the downstream and coastal areas of the Mukawa River [21,22] (National Census of River Environments by Mistry of Land, Infrastructure, Transport and Tourism, Japan, http://www.nilim.go.jp/lab/fbg/ksnkankyo/; accessed on 5 April 2023), or were related to flooding and water quality effects on fish or shellfish [23,24].
Like other research on fish species composition, studies on the presence and distributions of freshwater fishes in single river systems such as the Mukawa River (e.g., [25,26,27]) or in large river drainages (e.g., [28,29,30]) have traditionally been sampled by scientific surveys using various combinations of nets, traps, hook and line, and electrofishing. An example of these methods is the study by Miyazaki et al. [15] on the fish fauna in the Shibuto River on the Sea of Japan coast of Southwestern Hokkaido (see Figure 1b and Figure 2).
In recent years, however, environmental DNA (eDNA: DNA released by macroorganisms into the environment) metabarcoding techniques have increasingly been used in freshwater aquatic environments for biodiversity monitoring and biological surveys of the presence of fishes or other animals (reviewed by [31,32]). This is also true in Japan where studies have recently been conducted on the diversity and distribution of fishes in estuarine or coastal waters [33,34,35,36], in specific rivers or regions [37,38], or to document seasonal changes in species composition [39]. Specific species have also been studied for different life stages, such as salmonids [40,41] and the Japanese eel (Anguilla japonica) [6,34,42,43,44,45].
These eDNA techniques are also being used in Hokkaido because the fieldwork effort to collect water samples is much less than traditional fish capture methodology. Iwamura et al. [39] used eDNA in an upper reach of the Ishikari River drainage for evaluating salmonid species and the presence of introduced rainbow trout Oncorhynchus mykiss. In a geographically larger study, 120 rivers of Hokkaido were sampled using eDNA to detect the presence of the endangered Sakhalin taimen (Parahucho perryi), which found their eDNA in seven rivers. Yatsuyanagi et al. [18] used eDNA sampling to study shishamo smelt (Spirinchus lanceolatus) in four rivers including the Mukawa River along the coastline southwest of the Hidaka Mountains. Yatsuyanagi and Araki [17] analyzed the eDNA from coastal sites to study the seasonal presence of the shishamo smelt near river mouths or along the coast where detections were much higher in spring.
The main reason that the eDNA sampling technique is increasingly being used to study aquatic species worldwide [32] is the convenience of sampling only water and not having to capture and preserve the target species, which requires intense effort, complicated logistics, and expensive equipment. In comparison, eDNA research requires processing temporarily stored water samples that will be filtered, with the water eventually or immediately discarded after filtration. Having this new method is important because survey data about fish distribution and abundance provides information about fisheries and invasive and endangered species, so eDNA studies are important for resource management and the protection of ecosystems [46,47,48,49,50].
In this context, the present study provides a simplified example of a low-cost method for using eDNA metabarcoding to make a rapid assessment of the biodiversity of the fishes present at different locations in and near a river system, such as those found in Hokkaido. Water samples were analyzed from upstream and downstream sections of the Mukawa River, at high and low tide at the river mouth, at two distances from the river mouth along the left and right shorelines, and at a comparative station offshore off the southern coast of Hokkaido (Figure 3). This provided information about possible water sampling strategies in relation to the species that were detected. The Mukawa River has two water control weirs in the lower part of the river, so the species detections also documented some of the fishes present in the upstream reaches above the barriers in comparison to those in the lower river.

2. Materials and Methods
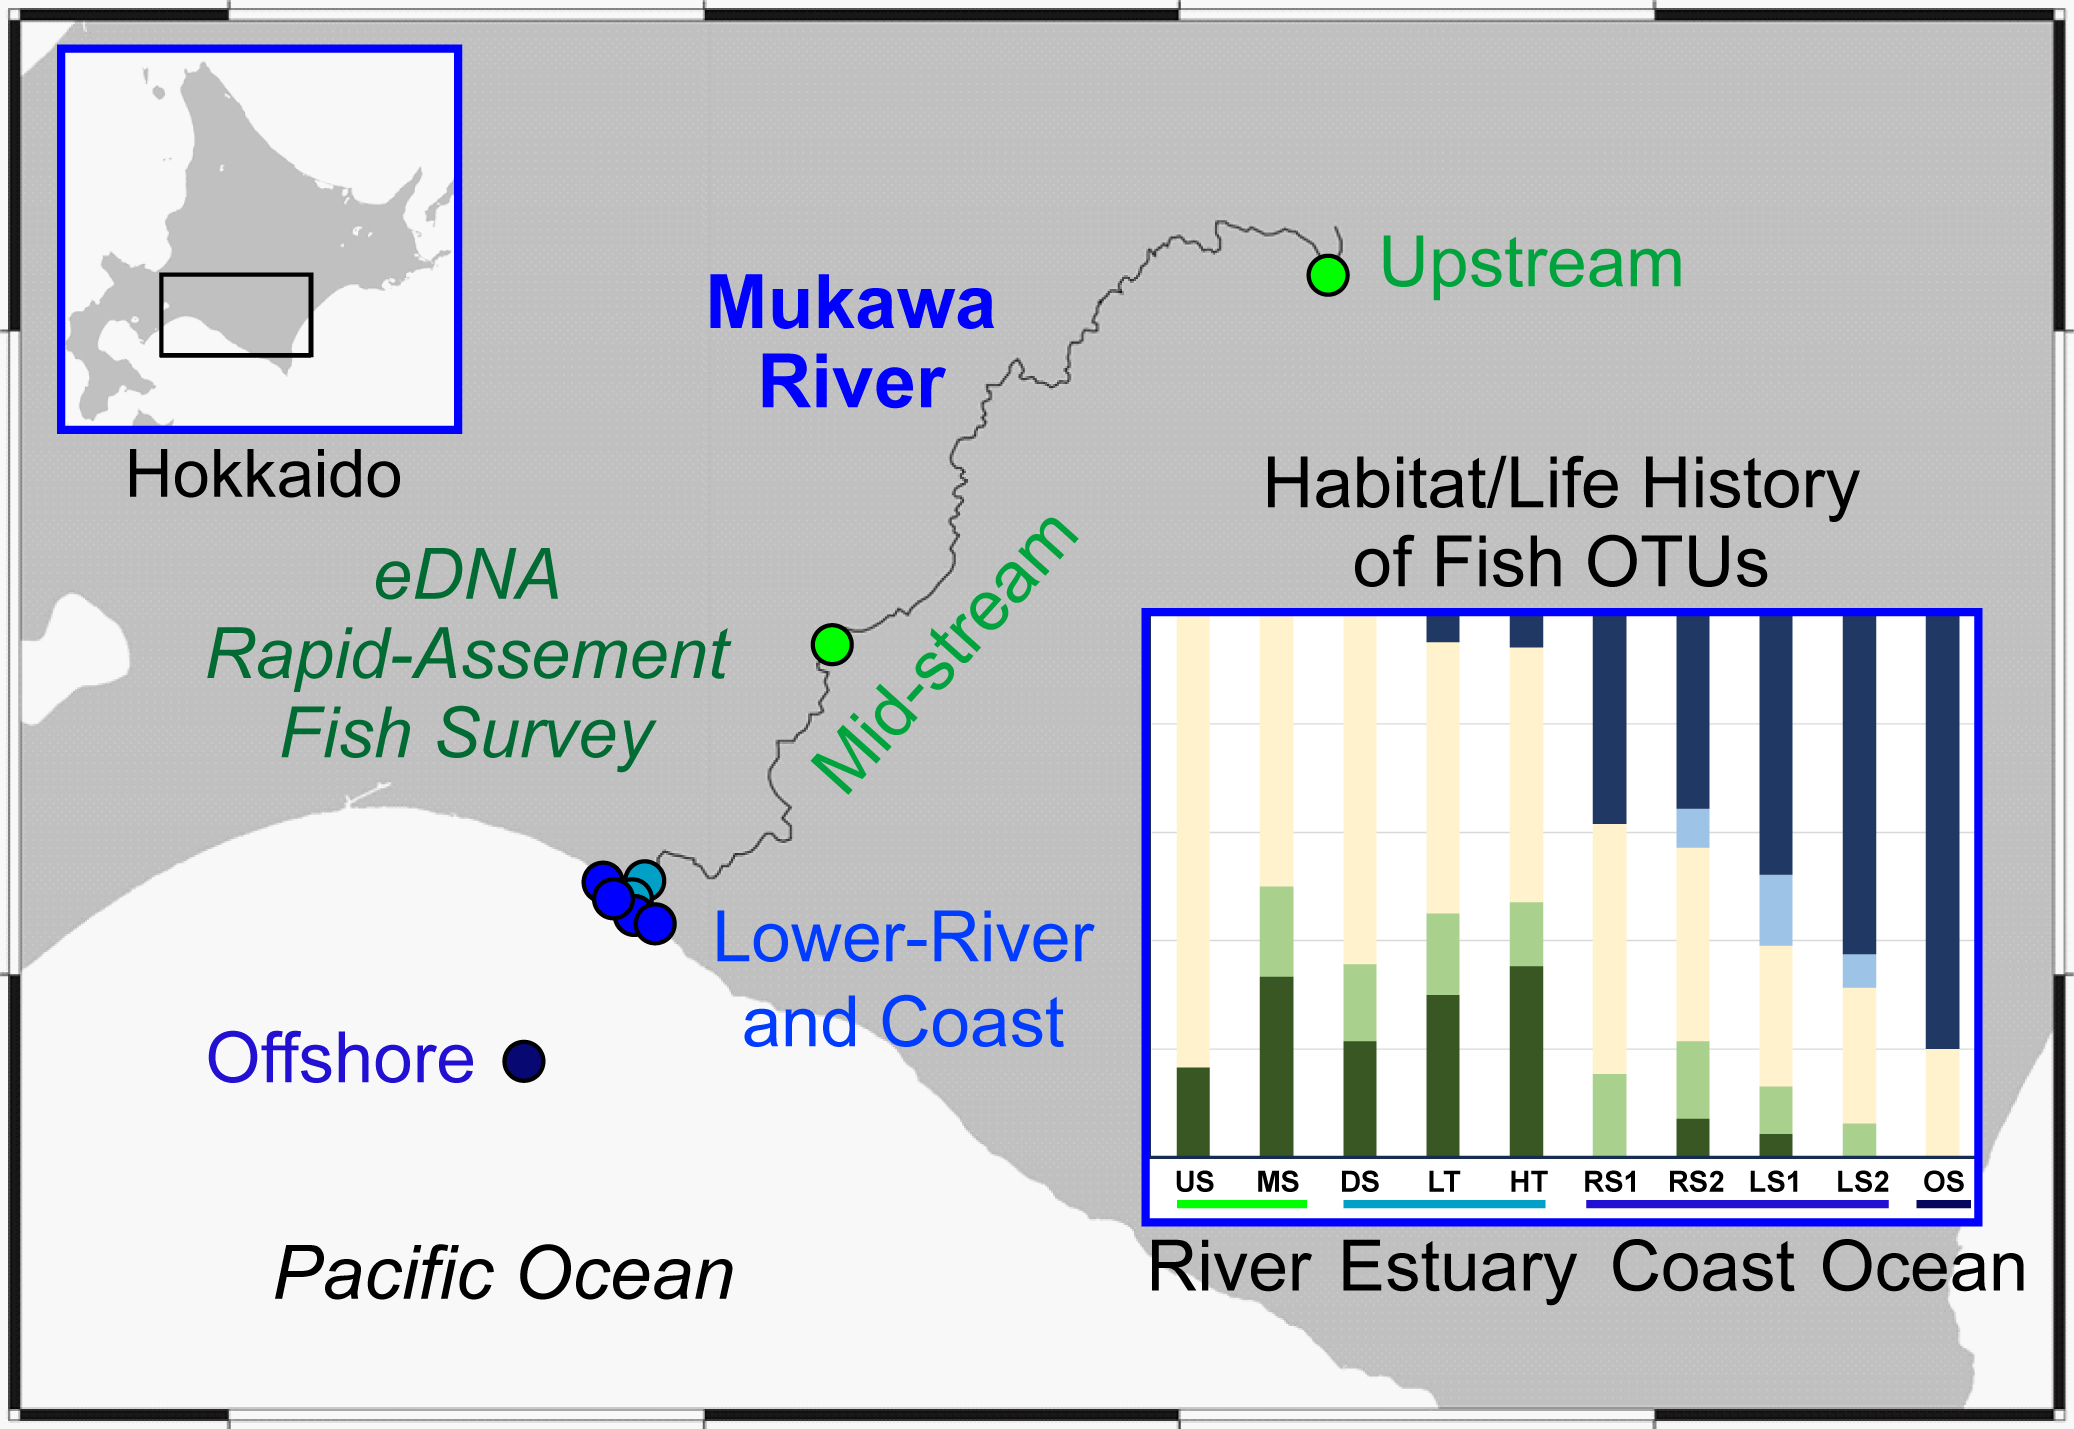
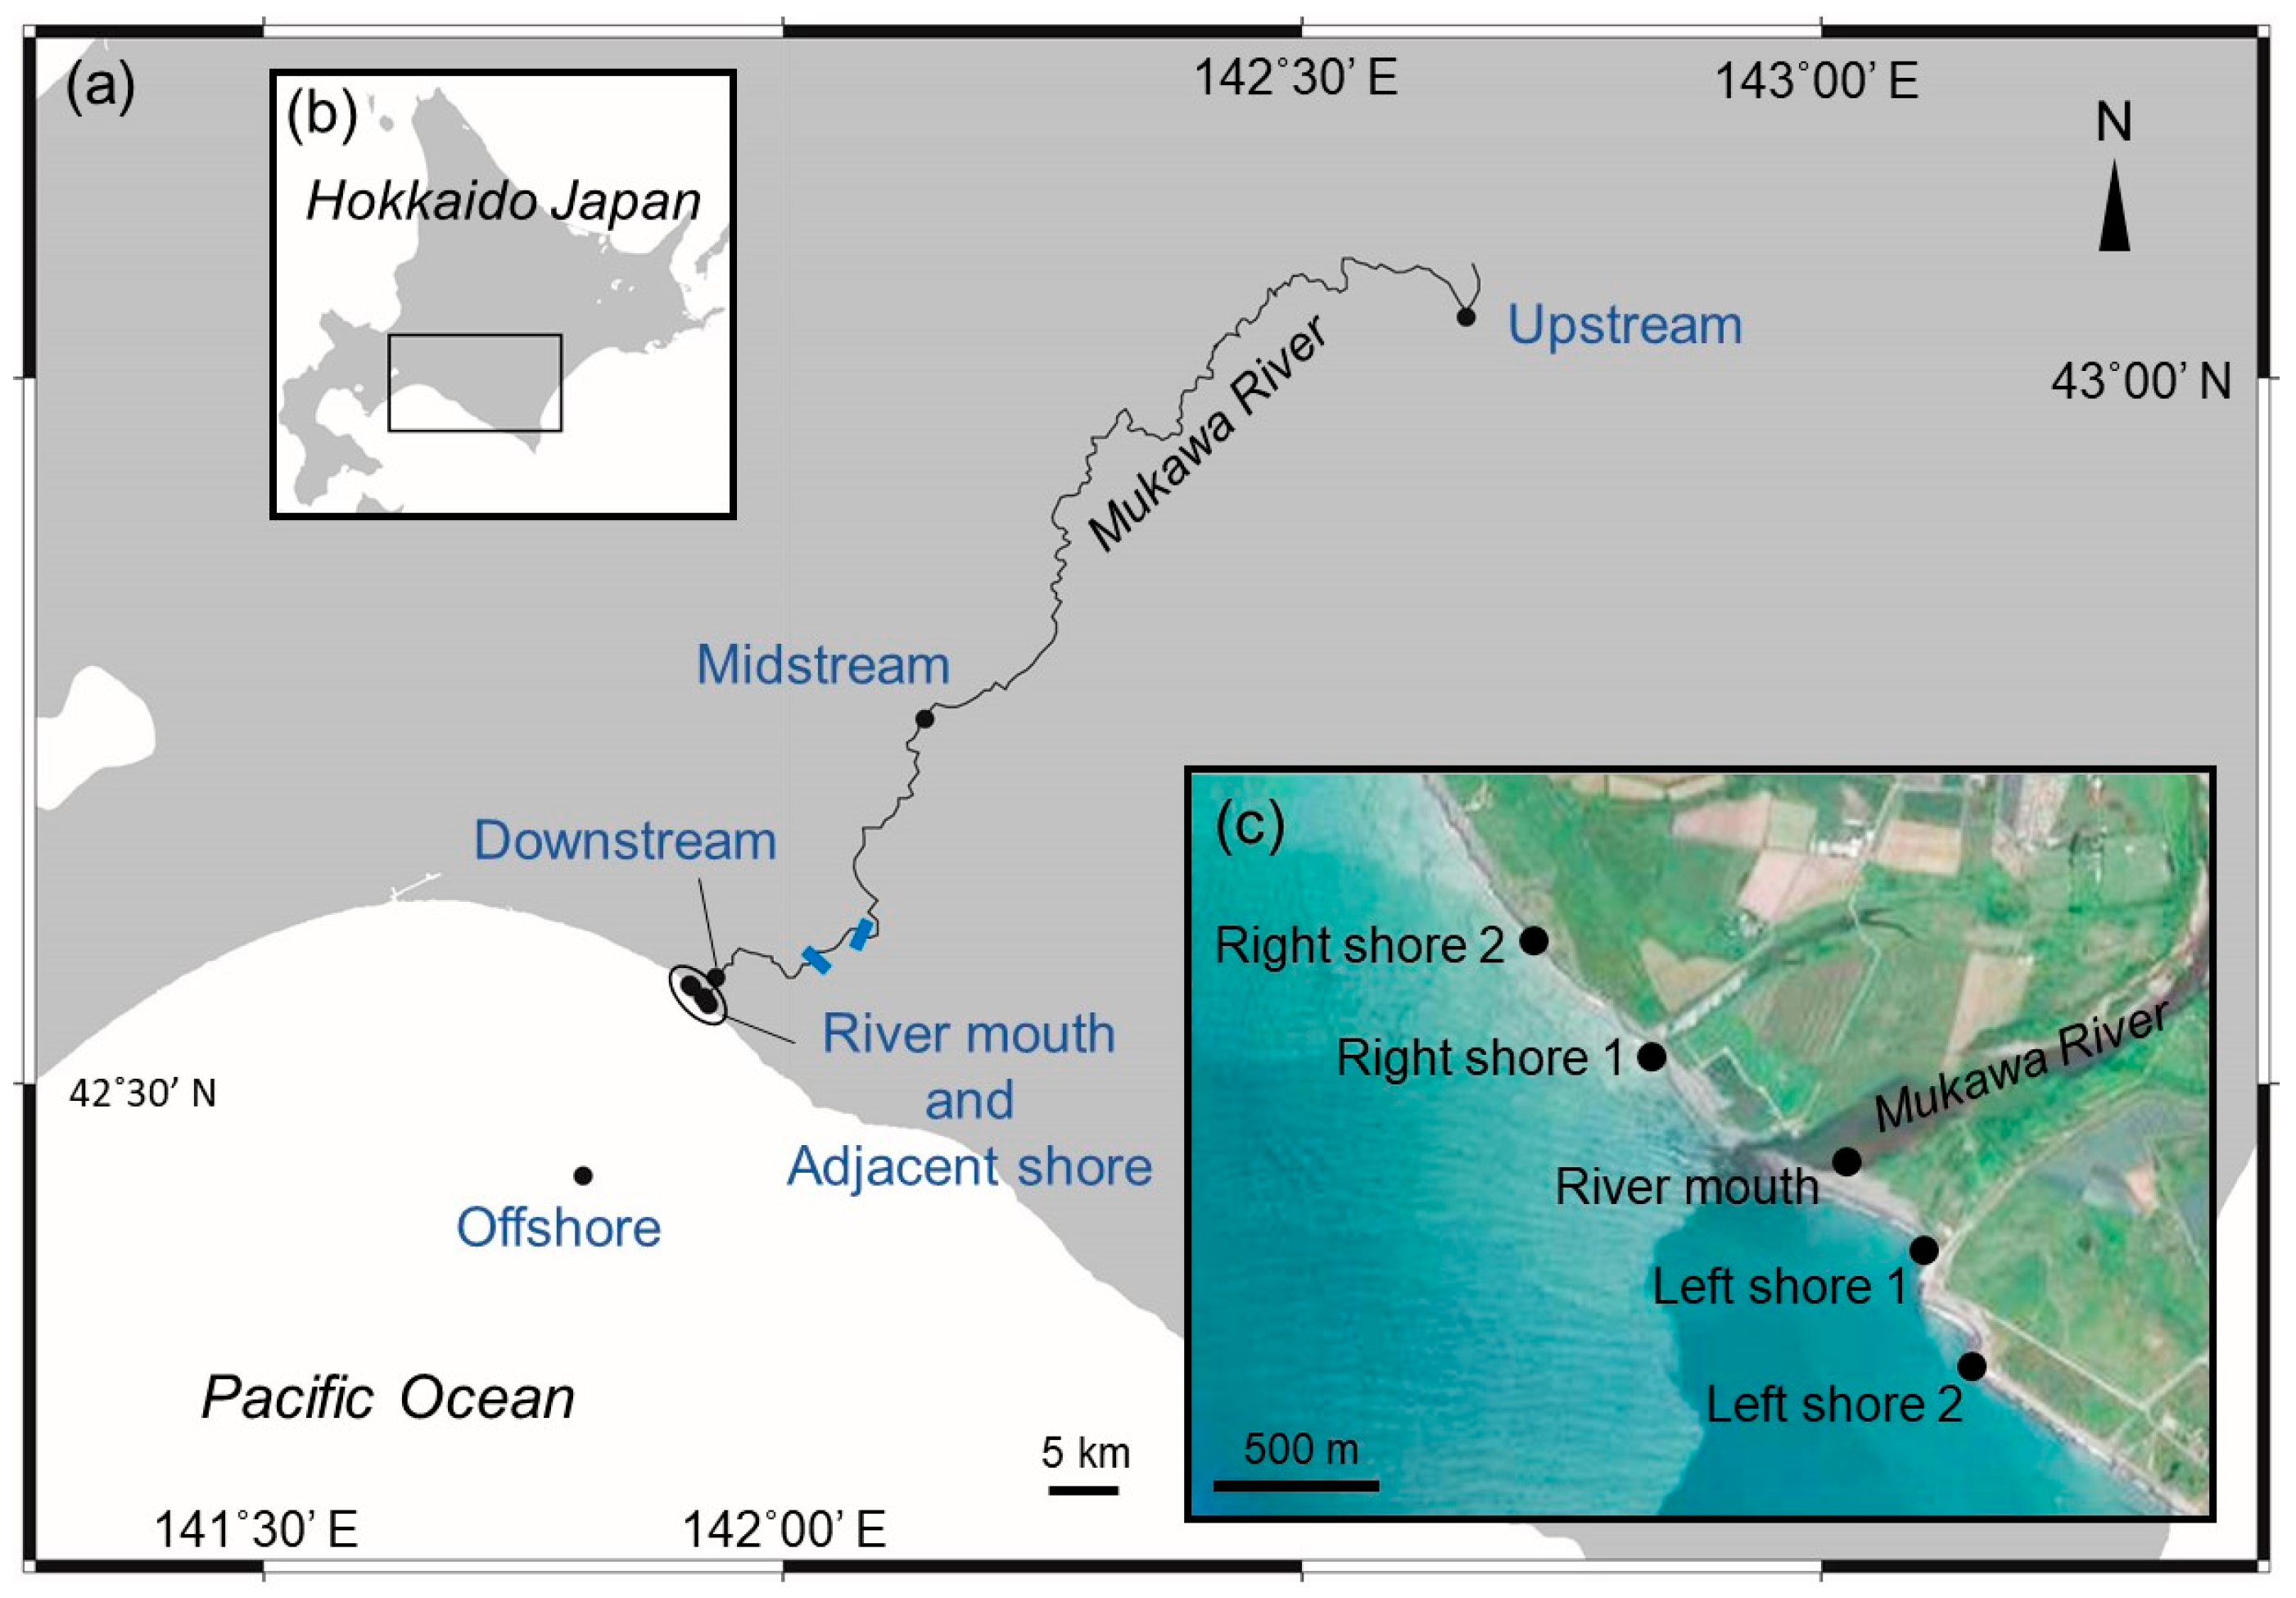
2.1. Water Sampling

Water sampling was conducted at various types of sites including different river reaches, in the estuary, the adjacent coastlines, and offshore in June 2019 (Figure 3). Onboard water sampling was conducted approximately 16.8 km offshore from the Mukawa River mouth on 21 June 2019 where surface water was obtained by the pump system of the Oshoro-maru, which is the training ship of Hokkaido University. The onboard pump kept moving seawater through the continuous flow-through system enabling a sample to be taken in real time. Within the Mukawa River, surface water samples were taken at sites upstream (125 km from river mouth) and midstream (40 km from river mouth) on 26 June. There are weirs across the river at 12.5 km upstream along the course of the river, and then another at 14.4 km upstream (Figure S1). On 27 June, samples were taken at a downstream site (2.5 km from river mouth), at the river mouth, and at the adjacent shorelines of the ocean. Sampling sites in the river were selected to be as far away from towns or a hatchery as possible to avoid possible contamination. Water was sampled once at both high tide and low tide at the river mouth. Along the adjacent shorelines, surface water samples were taken at 500 m and 1 km from both right and left sides of the river mouth, between high and low tide. Right side of the river mouth was a sand beach, and the left side was a rocky shore. A negative control in field consisting of commercially purchased purified water was made in the middle of sampling (between upstream and midstream on 26 June, downstream and adjacent shore on 27 June). Every water sample was made using a syringe (50 mL, Terumo, Tokyo, Japan) to directly transfer water to be immediately filtered at the site using single Sterivex filter units (0.45 μm pore size; Merck Millipore, Billerica, MA, USA) until the filter cartridge became clogged, following Minamoto et al. [51]. The total water volumes of each sample are listed in Table 1.

2.2. Molecular Experiments on eDNA

All filter samples were immersed in 1.6 mL of RNA later stabilization solution (Thermo Fisher Science, Waltham, MA, USA) immediately after filtration, and kept cool until they were transported back to the laboratory, where they were frozen at −30 °C. Total DNA was extracted following the manufacturer’s protocol using DNeasy Blood and Tissue Kits (Qiagen, Hilden, Germany). Two-step PCR for paired-end library preparation was performed for next-generation sequencing (MiSeq; Illumina, San Diego, CA, USA). Details of experimental procedures are described in the Supplementary Methods.

2.3. Bioinformatics Analysis

The raw read data from MiSeq were analyzed by pipeline (PMiFish ver. 2.4) with USEARCH v11.0.667, as detailed in the Supplementary Methods. The aligned sequences obtained by pipeline were checked using the NCBI Basic Local Alignment Search Tool (http://blast.ncbi.nlm.nih.gov/Blast.cgi; accessed on 30 May 2021) to make a species list. Species whose read numbers were less than 0.05% of total reads were deleted following Andruszkiewicz et al. [52], as they may be present from contamination. Also, the number of reads corresponding to every fish detected in the negative control was deleted. When multiple species shared the same aligned sequence or more than 99% similarity, and they could not be determined by their species geographic range distributions, they were combined as a genus or family. For example, Gasterosteus spp. could include Gasterosteus aculeatus and Gasterosteus nipponicus, which have over 99% similarity, and both of them are common species in Japan. Also, Hexagrammos spp. had many candidate species that are present in Hokkaido. Those combined genus and family groups were treated as one operational taxonomic unit (OTU) in the following analyses. Other species such as Salvelinus leucomaenis leucomaenis, Gymnogobius castaneus, and Tridentiger brevispinis were identified to the species or subspecies level based on well-established species ranges in Japan [4,53,54] and within the specific Mukawa River area (National Census of River Environments by Mistry of Land, Infrastructure, Transport and Tourism, Japan), even if other closely related species that do not occur there could not be excluded genetically.

2.4. Data Analysis

The relationships between the environment and species richness were determined by measured water temperature, salinity, and number of detected OTUs (sometimes used interchangeably with “species”) at each sampling site. To show the generalized species composition at each sampling site in a sort of continuum from upstream and out into the ocean, the relative OTU percentage of species types classified by the general life history types and the habitats used by each type of fish [55] was calculated by the number of detected OTUs. These categories are generally defined as freshwater (F), freshwater–brackish (FB), freshwater–brackish–seawater (FBS), brackish–seawater (BS), or seawater (S), but for the FBS category, most species of anadromous salmonids have both migratory and freshwater resident forms. Statistical and multivariate analyses were carried out by R version 4.0.5 [56]. The principal component analysis (PCA) was applied to produce an ordination graph among sampling sites based on the Bray–Curtis index [57], followed by Ward’s hierarchical joining clustering analysis (Euclidean distance) to group sampling sites according to their similarity in fish community composition [58]. The axes of PCA were assessed by combination of stopping rule of the Kaiser–Guttman criterion and the broken stick model criterion of average eigenvalues from random data [59,60]. Environmental variables (water temperature, salinity, distance from headwater, latitude, and longitude) were also represented as vectors and fitted to the PCA to evaluate the correlation between the fish distribution and environmental factors. A permutation test (9999 permutations) was performed to assess the fit of these variables with the ordination, and only significant variables (p < 0.05) were presented in the PCA biplots.

3. Results

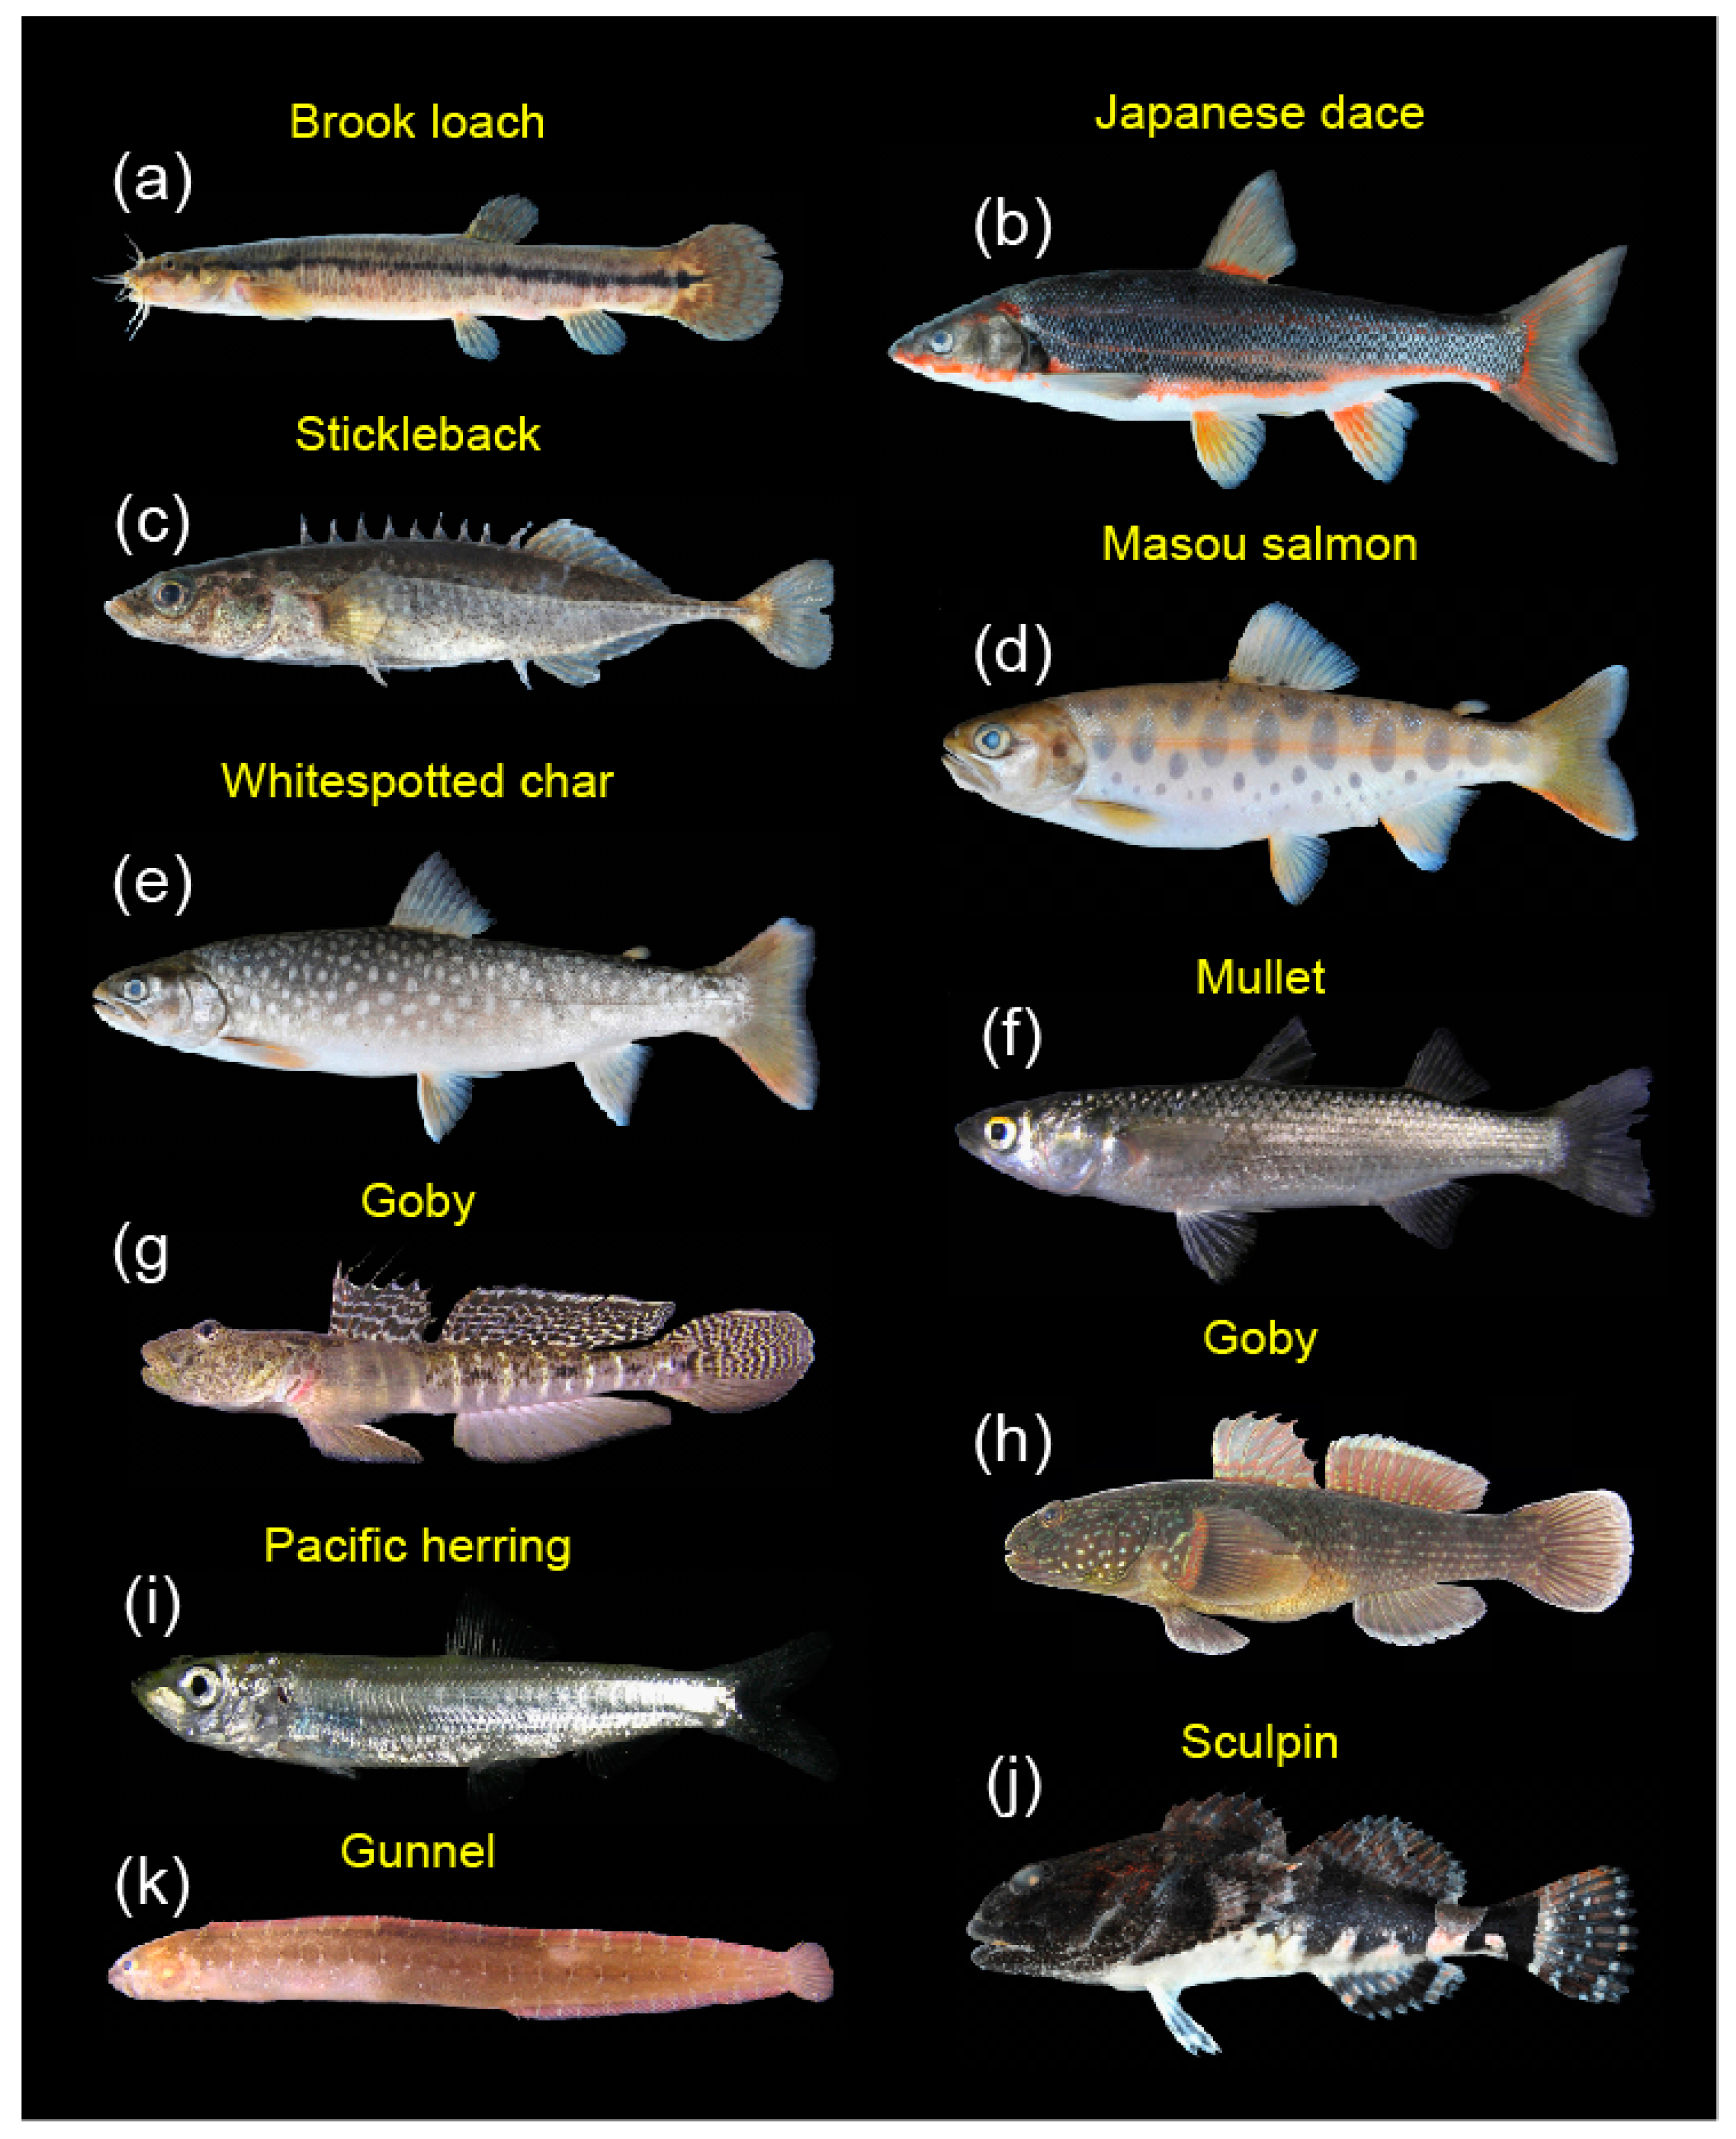
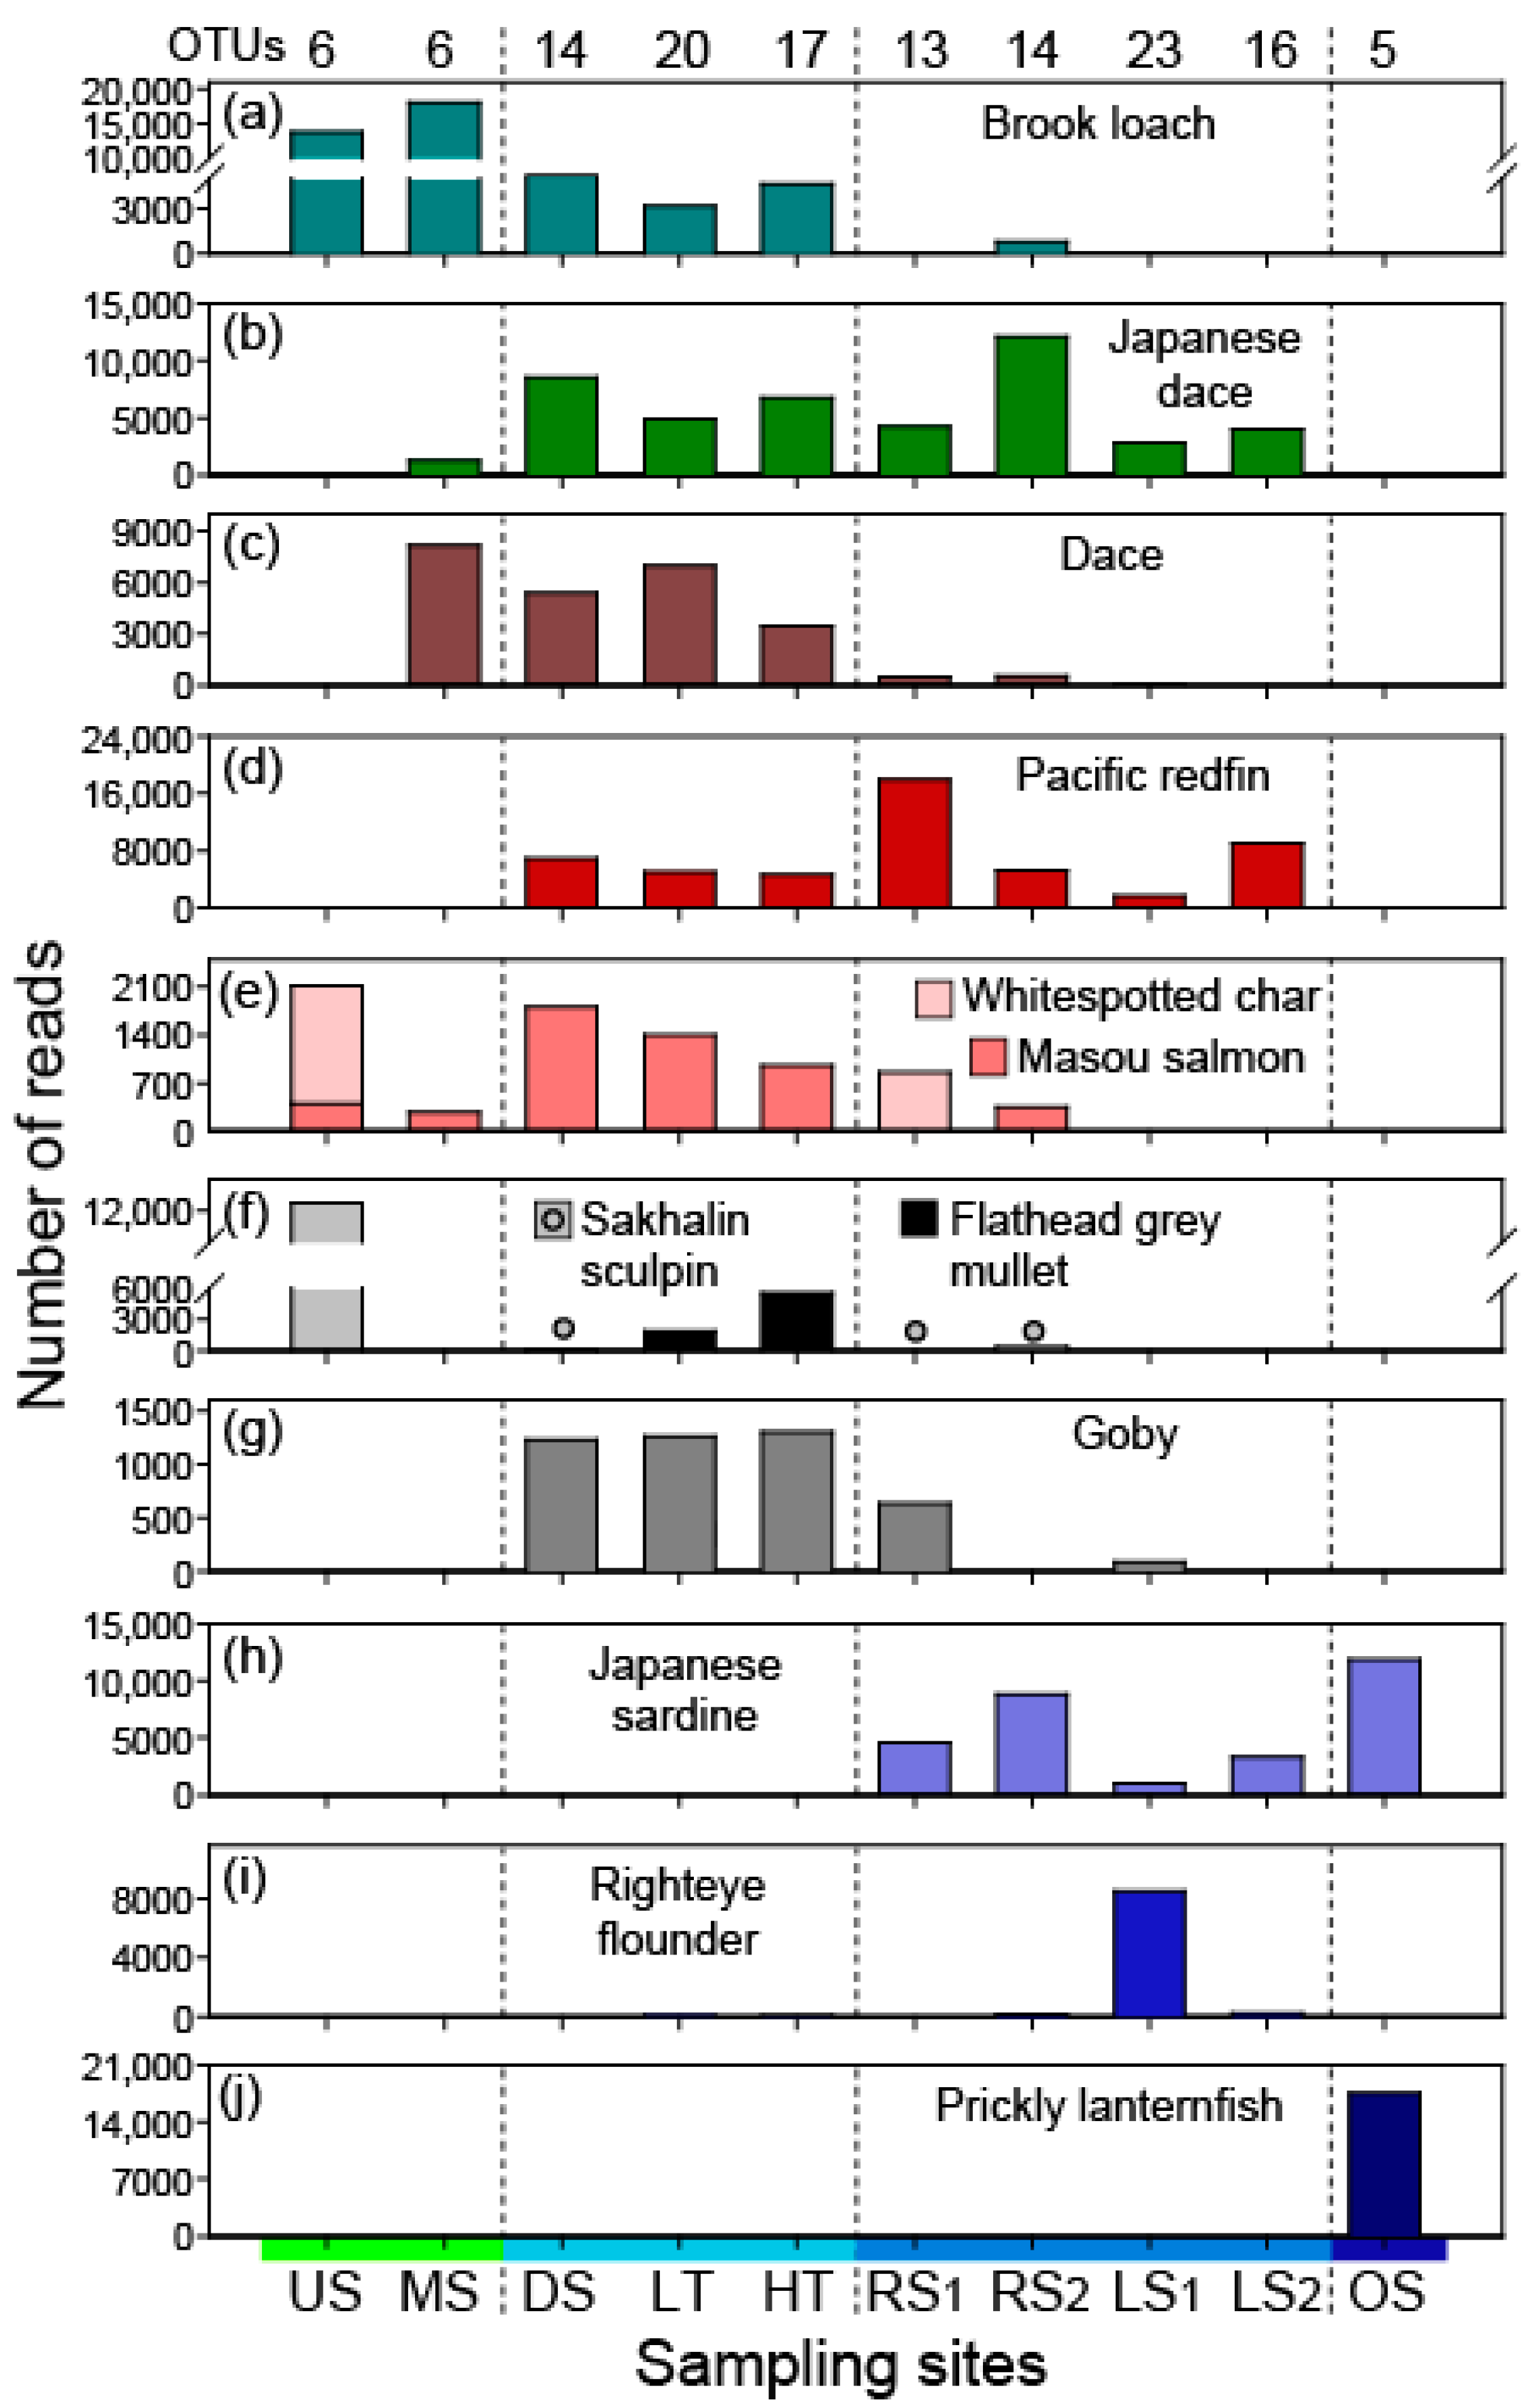
3.1. Species Detections in Each Environment

There were 51 OTUs detected in all of the sampling sites of the study, which included several different environments. A total of 24 OTUs were detected in the river, downstream, and river mouth sites in the Mukawa River. The river flows downstream from higher elevations of mountainous terrain to the west of the Hidaka Mountains (Figure 1b). Water temperature was lowest at the 125 km upstream site (18.9 °C at 2 p.m.), it was highest at the midstream site (23.8 °C at 4 p.m.), and it decreased at the downstream, and shoreline sites; with water temperature being lowest at the offshore station (11.8 °C at 2 p.m.) (Table 1, Figure 4). Salinity was near 0 in the river, around 30 at the adjacent shores, and 32.3 at the offshore site. Salinity at the river mouth varied from 0.7 to 6.1 according to the tidal cycle. The number of OTUs detected was higher at the river mouth and nearshore sites (13–23 OTUs) than in the river (6–14 OTUs) or offshore (5 OTUs) (Figure 4).
The upstream site only included detections of six OTUs (Table 1), which consisted of a loach, four salmonids (salmon, trout, char), and a sculpin. The midstream site also had six OTUs that included two species of loach, two of the same salmonids (masou salmon, rainbow trout) as detected upstream, and two species of dace (nine total species at the two upstream sites; Table S1). Figure 5 shows the presence of some of the species with high read count numbers (copies of DNA) at each sampling site. Species with the highest number of reads in the upstream and midstream sites were the brook loach, Noemacheilus barbatulus toni (image shown in Figure 2a), a dace, Pseudaspius sachalinensis, Japanese dace, (Figure 2b), the Sakhalin sculpin, Cottus amblystomopsis, and the whitespotted char, Salvelinus leucomaenis leucomaenis (Figure 2e) (Figure 5a–c,e,f). Masou salmon, Oncorhynchus masou masou, reads were detected at both river stations in lower numbers, and higher counts occurred at the downstream and river mouth sites (Figure 5e).
Larger numbers of species were detected in the downstream and river mouth tidal sites, where a wider range of 22 total OTUs was found at the three sites. The downstream site detected 14 OTUs that included several species of dace, a mullet, and three amphidromous gobies (Table S1). Some of the same species, as found upstream, had high read counts in those lower river areas (Brook loach, two dace, Masou salmon), and the first detections of the Pacific redfin, Tribolodon brandtii maruta, and the goby, Tridentiger brevispinis occurred there (Figure 5d,g). The river mouth low and high tide samples overlapped in composition with the downstream species including for the high read count species (Figure 5), but additional cyprinids and gobies, three sticklebacks, and a flounder were also detected at the river mouth (Table S1). There were 17 species detected at both low tide (20 total species) and high tide (17 total species) stations, but 3 species were only detected by low read numbers at low tide.
The shoreline samples also detected a variety of species including some present in the river and tidal sites. There were marine fishes such as sardine, herring, sculpin, snailfish, eelpout, and flounder species that were detected at more than one station with relatively high sequence read counts (Table S1). There were also a variety of species detected at only one shoreline site. There were 16 species detections made at only one or the other of the right shore stations (6 species at both; 21 total for both), 13 at only one of the left shore stations (12 at both; 25 total for both), and 33 total species were found in all four shoreline samples combined. Only Japanese dace and Pacific redfin were detected at the shoreline sites and all the downstream and tidal sites, and Japanese sardine was detected at all of the left or right shore samples (Figure 5).
Only five OTUs were detected at the offshore site (including a mesopelagic fish, two mackerels, and a flounder), which included what appears to be a coastal species (saffron cod), but only the Japanese sardine that was detected there, was also detected at the coastal sites (Figure 5; Table S1). Neither water temperature (r2 = 0.03) nor salinity (r2 = 0.02) showed a correlation between the number of species detections (Table 1, Figure 2), but the species compositions corresponded well with the environments the species would be expected to use.

3.2. Proportions of Fish Types by Habitat Groups

The proportion of detected freshwater/diadromous species was higher in the river than along the shoreline adjacent to the river mouth where they might reach through the outflow of river water (Table S1). Based on the habitat use categories of Nelson [55], the fish species OTU composition shifted from those using freshwater during all or part of their life histories to those using seawater (Figure 6). The pure freshwater species (cyprinids, gudgeon, loaches) were present even in some of the shoreline sites, with freshwater and fresh–brackish water species decreasing from the river mouth (45%) to offshore (0%). The fresh–brackish–seawater (FBS) included the anadromous, amphidromous, and coastal brackish types of species as shown in Table S1. The seawater and sea–brackish water species changed from the river mouth (5%), and shoreline (38.5–68.8%), to offshore (80%) (Figure 6).

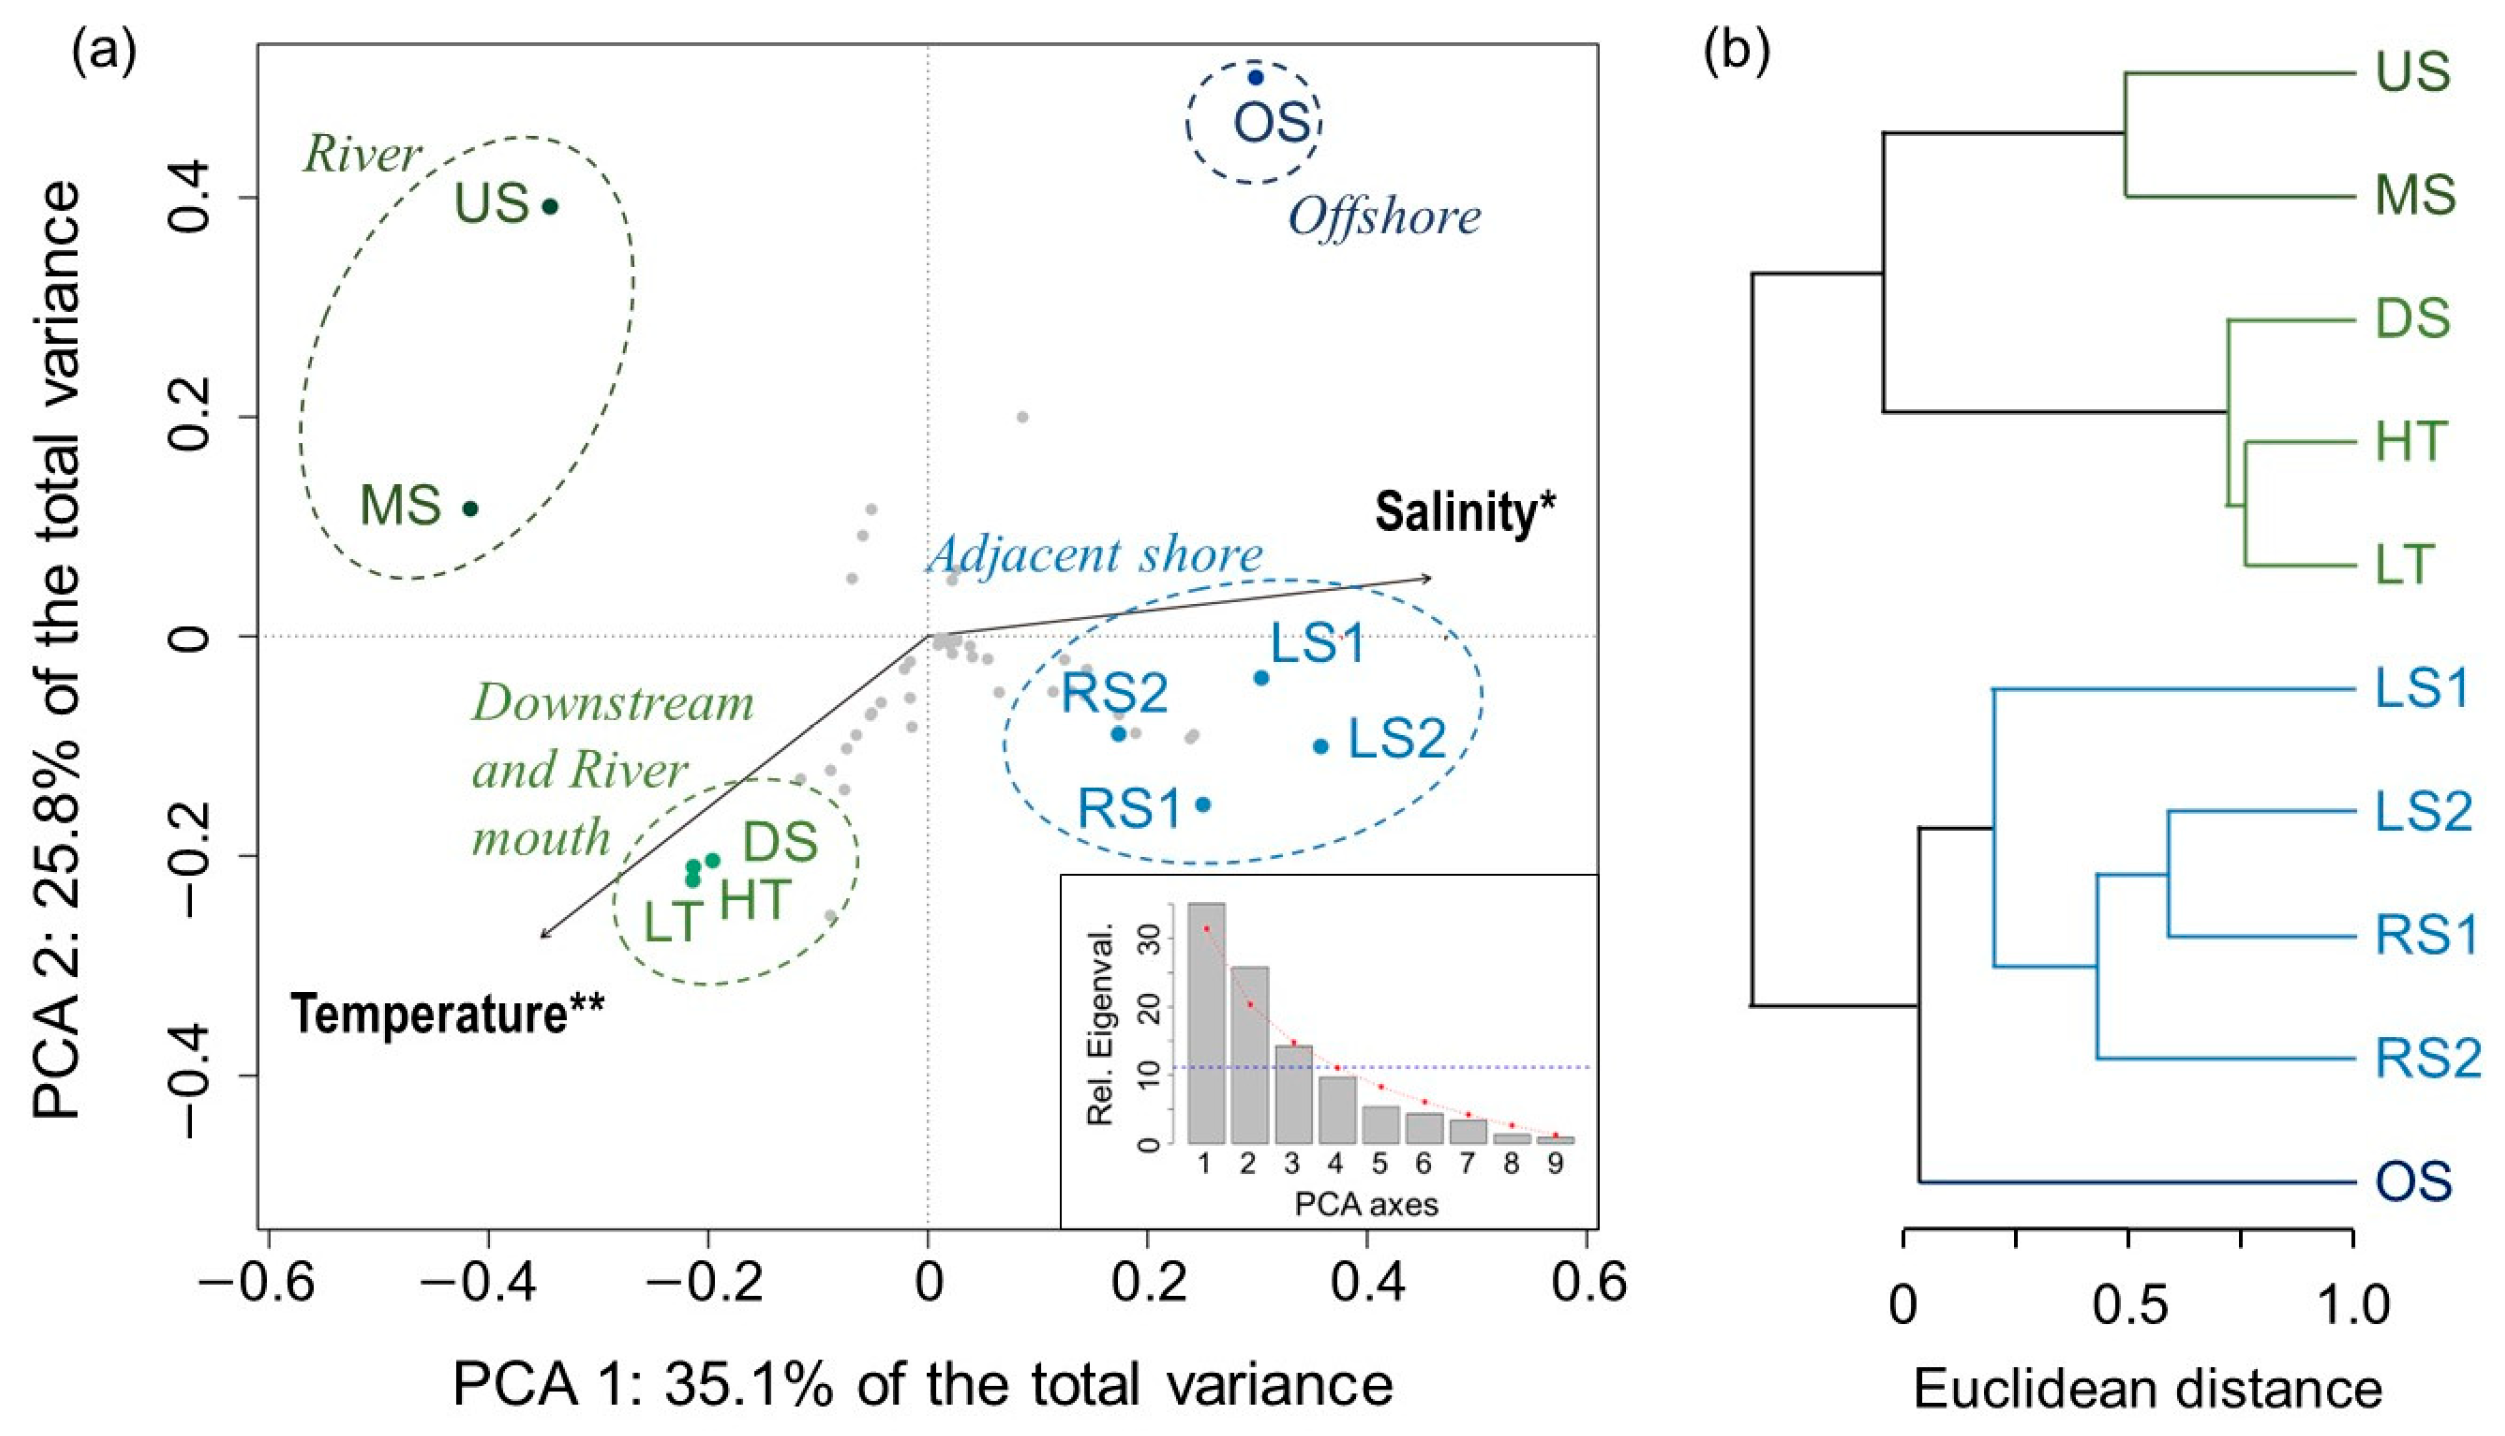
3.3. Similarity of Species Compositions

Principal component analysis (PCA) was performed to represent the variations in the fish OTUs that were detected among sampling sites with the basic environmental variables. The ordination axes used in the present study accounted for 60.9% of the total variance and those axes were selected by the broken stick model and the Kaiser–Guttman’s criterion [59,60] (Figure 7a). The species compositions were divided into the four groups of the river (upstream, midstream; dark green), downstream and river mouth (high tide, low tide; yellow-green), adjacent shore (light blue), and offshore (dark blue) by cluster analysis (Figure 7b). A Venn diagram shows the number of detected OTUs shared among the four groups of sampling sites and the number that were unique to individual groups (Figure S2). Water temperature and salinity appeared to be correlated with those groups. Water temperature was positively correlated (p < 0.001) with the downstream and river mouth groups, and negatively correlated with the other groups. Salinity was positively correlated (p < 0.01) with the adjacent shore and offshore sites, and negatively correlated with the river and river mouth sites (Figure 7a).
Figure 6. Relative OTU percentage of each type of species of detected fish separated by the habitat groups of Nelson [55] as shown by color in Table S1 (F: freshwater, FB: fresh–brackish water, FBS: fresh–brackish–seawater, BS: brackish–seawater, S: seawater) present at the sampling stations (US: upstream, MS: midstream, DS: downstream, LT: river mouth at low tide, HT: river mouth at high tide, RS1: right shore 50 m from river mouth, RS2: right shore 1 km from river mouth, LS1: left shore 500 m from river mouth, LS2: left shore 1 km from river mouth, OS: offshore).
Fishes 09 00147 g006
Figure 7. Ordination analysis of PCA (a) and Ward’s hierarchical joining clustering analysis based on Euclidean distances (b) depicting similarity in fish species compositions based on detected OTUs (grey dots). Bar plot represents the broken stick model (red line) and the Kaiser–Guttman’s criterion (blue line) that were used to assess the number of interpretable axes in the PCA. ** p < 0.001, * p < 0.01. Site abbreviations are same as in Figure 6 caption.
Fishes 09 00147 g007

4. Discussion

The present study found that from six (upstream freshwater sites) to twenty (river mouth low tide) species–OTUs could be detected by single eDNA samples taken from the shallow shorelines of the Mukawa River, and up to twenty-three were detected in samples along the adjacent marine coastline (salinities of 29.4–30.6). Including the 5 species detected offshore, 51 OTUs were found and linked to fish species, with 13 OTUs being found in four or more of the water samples excluding the offshore station. The higher number of fish species detected in the downstream, estuarine, and coastal sites is consistent with general ecological observations made worldwide where the hydrodynamics, complex structures, and higher productivity of those areas result in higher biodiversity than in the adjoining freshwater habitats [61,62,63,64].
Almost all of the OTU sequences found in the Mukawa River and nearby areas could be matched with individual species or genera of fishes that corresponded with their likely habitats and life history types. The upstream site was the only place where four species of salmonids were detected (salmon, trout, char) along with an amphidromous sculpin and a brook loach species that was found at every river site. These were the typical salmonids of Hokkaido, including the introduced rainbow trout, which was detected at all three freshwater stations of this study, and was a target species of the monthly eDNA survey of Iwamura et al. [39]. That study was in the Upper Ishikari River drainage in West Central Hokkaido where 11–20 species out of 23 total taxa were found at each station, which included salmonids, loaches, cyprinids, lamprey, and sculpins. The eDNA of rainbow trout was found at all 16 of their sites, along with some other introduced species. Brown trout, Salmo trutta, has also been introduced into Hokkaido and Honshu [65,66], but was not detected in the Mukawa River or by Iwamura et al. [39].
The midstream site in the Mukawa River had similarly few species as the upper site, with only two salmonids, dace, and loaches. In the downstream and river mouth sites there was a mix of species including various types of cyprinids (dace, minnows, and loaches), masou salmon, sticklebacks, amphidromous goby species, a mullet, and a flounder that enters estuaries. This showed that the eDNA technique was successful for detecting clear differences in the species composition within the general river-reach regions of the Mukawa River. This type of species composition of resident and diadromous fishes is similar to what has been documented for the fish fauna of Japanese rivers, including in Hokkaido [7,8,9,14,15].
Examination or analysis of the species detection data of the present study might help to design more intensive, but still rapid, low-cost eDNA assessments of the fish communities associated with river–estuary systems, such as those found in the Mukawa River. The multivariate analyses using PCA and cluster analysis of the study clearly showed that the purely freshwater sampling sites grouped together and that the downstream sites grouped with the low and high tide samples. The left and right shore samples also grouped together, with the offshore sample being clearly different as shown by the ordination (Figure 7a). The low tide water sample included all the OTUs found at high tide, but three additional OTUs were identified in the low tide sample. More variability was found among the two samples on each side of the river mouth, suggesting a single sample would not adequately characterize the fish species present there. This may also be true for upstream reaches, where more samples would probably be needed to make an accurate rapid assessment of the freshwater reaches, but the number of species present there is expected to be lower.
The rapid assessment concept of obtaining the maximum amount of information for a minimum of effort and cost [67] to determine species presence or compositions of a particular location or type of habitat [68] has been applied using various sampling methods such as visual census [69,70], remotely operated vehicles (ROV) [71], or more recently using eDNA samples, so as to evaluate the distributions of invasive species (e.g., [72,73]). An expanded version of the low-effort present study that would include a few more water samples taken in freshwater reaches where there is easy access, could for example, be used to compare the fish species present in a series of nearby river systems over a few days, such as those on either side of the Mukawa River, which includes rivers flowing out of the Hidaka Mountains, as seen in Figure 1b. Seasonal comparison studies within a single river or several rivers could also be conducted.
From a general ecological perspective, the present study found a high proportion of diadromous fish species in all of the different habitats except offshore. Part of this may be that the study was conducted during the summer season when at least some of the detected diadromous species (e.g., Oncorhynchus masou masou, Cottus amblystomopsis) spend the summer in the river. Some may even stay in the river for their entire life for species that have both migratory and resident forms [74,75]. The various species of minnow-like species such as the Japanese dace, Pseudaspius hakonensis (formerly genus Tribolodon) were among the species with the highest numbers of sequence reads, and this species was detected at all sites except upstream and offshore. The detections of that species and the other dace or Phoxinus cyprinids suggest that the relatively natural Mukawa River would be a good river system and coastal area to study the ecology of these and other diadromous fishes. This is especially true for Japanese dace in the Mukawa River, which were included in a previous biological study of that species and other dace in Japan (the Mu River in Sakai [20]).
This low-effort, and low-cost type of study reported here, appears to be relatively successful when compared to previously obtained information about the fish compositions found in the Mukawa River. Previously in the Mukawa River, the Ministry of Land, Infrastructure, Transport and Tourism, Japan made a long-term national census from 1993 to 2017 using traditional sampling methods (e.g., fish nets, electro-fishing), mainly from the midstream reaches to the river mouth, and 19 species were in common (http://www.nilim.go.jp/lab/fbg/ksnkankyo/; accessed on 5 April 2023) with the 29 species detected from the river and shoreline sites of this study. Akamatsu et al. [21] compared the fish list from the national census with their results using both traditional methods and eDNA from samples taken in downstream parts of the Mukawa River. They found a high match with 27 out of 31 species being in common with the previous investigation and 20 overlapped with the present study. Interestingly, Akamatsu et al. [21] found that at all stations, more species were detected by the eDNA method than by the traditional net sampling methods for fish capture. Also, Lavergne et al. [22] conducted a survey on fish biodiversity in 32 selected rivers across Japan, including the Mukawa River, using eDNA. Water samples were taken from the river mouth and 12 OTUs (out of 16 at high tide, and 17 at low tide) that were detected in the river mouth were also detected in the present study. All eight of the species shown in Figure 5a–g were also reported in all three (five species) or two (four species) of those previous studies (government ministry study and [21,22]). However, our study detected several species that were not reported in any of the other three studies, such as two smelt species (Hypomesus japonicus, H. olidus), the locally important shishamo smelt (Spirinchus lanceolatus), Dolly Varden trout (Salvelinus malma krascheninnikovi), a Eurasian minnow (Phoxinus), and a mullet (Chelon).
Despite the simple design of sampling sites in the present study, this does not appear to have been a problem other than the possibility that an increased number of water samples might have increased the number of species detected. For example, even though the water volume of each sample for eDNA collection varied by site due to different rates of the filters becoming clogged, the negative correlation of sample volume and number of OTUs was very weak (r2 = 0.24). This agrees with a previous eDNA study in which sample volume did not affect the detection rate in the river mouths and adjacent coasts of five rivers [76]. The concentration of total DNA also had no correlation with sample volume (r2 = 0.08) or number of OTUs (r2 = 0.06), because total DNA from MiFish primer included all vertebrate taxa present in the water. This included fish, deer, cattle, raccoons, and mallard ducks also detected from the river and nearshore areas, whereas dolphins (harbour porpoise) were detected offshore.
There were a few detections that do not seem to correspond to the known life histories or habitat use expectations in the present study though. A seawater flounder species (Pleuronectidae) was detected at the river mouth at both low and high tide where surface salinity only varied from 0.7 to 6.1 (Table 1, Table S1). Previous studies on eDNA during tidal changes reported that the effect of the tide was not significant, and the fish community detected by eDNA did not change with tides [77,78]. Freshwater species (family Cyprinidae and brook loach, Noemacheilus barbatulus toni) were detected at both the left and right adjacent shore sites, so considering their physiology of osmoregulation and salinity tolerance [79], their eDNA may have been transported out of freshwater into the coastal waters. Numerous studies described the downstream transport of fish eDNA from riverine environments [80,81,82].
The detections of mostly freshwater species along the right shore sites may have been related to the predominantly westward flow along the coastline of Hokkaido from the Coastal Oyashio Current [83]. The salinity at the right side of the river mouth was relatively low (30.6 at RS1, 29.4 at RS2; Table 1) and the right shoreline sites also had fewer purely marine species detections than the left side, which suggests a strong influence of river outflow there. The river mouth and adjacent shore can be considered as the interface between riverine and marine habitats [61], so those seawater species in the river mouth and freshwater species in nearshore waters detected by eDNA likely resulted from the mixing of waters of different origins, as evidenced by the relatively small number of reads that were detected (Table S1).
A different factor to consider when evaluating the fish fauna of the upper reaches of the Mukawa River, compared to lower reaches is the presence of two relatively low water control structures, or weirs, that cross the river at 12–14 km upstream from the river mouth (Figure S1). It is well-known that dams and some weirs can prevent diadromous fishes from moving upstream and sometimes affect their safe movements downstream, as is the case in Japan and Hokkaido [10,11,12]. The cross-river weirs on the Mukawa River might have fish ladders or be designed to facilitate the upstream passage of fish such as salmonids based on the satellite imagery (Figure S1), but we are unaware of information about this being published. eDNA sampling might be a useful method to evaluate the fish communities above and below these types of weirs and dams.
Fukushima et al. [11] show numerous dams in the drainages along the southern coast of Central Hokkaido south of the Hidaka Mountains. That study used a database of 7848 fish presence/absence data points from surveys conducted between 1953 and 2003 in Hokkaido to model the influence of dams and found that eight taxa (arctic lamprey, far eastern brook lamprey, whitespotted char, masu salmon, chum salmon, Chinese ninespine stickleback, Sakhalin sculpin, and starry flounder) were influenced negatively by the presence of downstream dams and that three taxa (Japanese smelt, silver crucian carp, and rosyface dace) were positively influenced. Masou salmon and whitespotted char both have landlocked populations [11], so their presence upstream of the weirs in the Mukawa River might be related to that, or their returning adults may be able to pass over the weirs (Figure S1). Further investigations might help determine the effects of these weirs on the Mukawa River.

5. Conclusions

The present study was only a snapshot of data from just the late spring/early summer season at a limited number of sites, but it provided some interesting basic information about the general presence of different life history types of fishes in this region. It demonstrated that by using eDNA metabarcoding, fish could be detected with minimal effort in the field by only sampling water. This low-cost and low-time-investment method was able to obtain useful data on the biodiversity of fish species in the Mukawa River and nearby areas within only a two-day period in the field to collect the filter samples for eDNA analysis. The freshwater areas above two weirs included nine total species of pure freshwater or diadromous species, and life history types were mixed in the downstream sites. The tidal phase did not have a major effect on detections, but low tide might be a preferable water sampling time. Detections of species from the river were higher along the right shore in the likely direction of the prevailing coastal current flow, but higher numbers of marine fish were detected on the left shore. The multivariate analyses showed that there were essentially four groups of species that were present within and near the river (river, downstream/river mouth, adjacent shore, offshore). Shishamo smelt, the endemic species (Ministry of the Environment, Japan, https://www.env.go.jp/index.html; accessed on 30 May 2021) was successfully detected in this study and the season of occurrence of shishamo smelt was in accordance with a previous report [17]. Future studies for monitoring the fish community in this or similar rivers could use a similar low-effort eDNA rapid assessment methodology and could also examine seasonal variations in species compositions that would be important for conservation and resource management efforts for the fish species that use the rivers of Hokkaido or other regions of the world.

Supplementary Materials

The following supporting information can be downloaded at: https://www.mdpi.com/article/10.3390/fishes9040147/s1, Supplementary Materials including Supplementary Methods, Figure S1: Imagery of two weirs on the Mukawa River, Figure S2: Venn diagram of the OTUs shared among the four groups of stations; Table S1: Number of reads for each OTU/species of fish.

Author Contributions

Conceptualization, H.A. and M.J.M.; data curation, formal analysis, funding acquisition, investigation, methodology, validation, H.A.; visualization, writing original draft, review and editing, H.A. and M.J.M. All authors have read and agreed to the published version of the manuscript.

Funding

This research was funded by the Nippon Foundation as a part of the Link Again Program, and was partly supported by the Hirose Foundation.

Institutional Review Board Statement

Not applicable.

Data Availability Statement

Relevant data are included in Supplementary Materials. The FASTQ files are available on request to the first author.

Acknowledgments

The crew members of T/S Oshoro-maru are appreciated for the offshore sampling (cruise: C073-Leg 1-2019), and we are grateful to Natsuko Kondo for conducting next-generation sequence analysis, and Edouard Lavergne for advice on statistical analysis.

Conflicts of Interest

The authors declare no conflicts of interest.

References

  1. Kai, Y.; Motomura, H.; Matsuura, K. (Eds.) Fish Diversity in Japan; Springer: Singapore, 2022. [Google Scholar]
  2. Endo, H.; Matsuura, K. Geography, currents, and fish diversity of Japan. In Fish Diversity in Japan; Kai, Y., Motomura, H., Matsuura, K., Eds.; Springer: Singapore, 2022; pp. 7–18. [Google Scholar]
  3. Yoshimura, C.; Omura, T.; Furumai, H.; Tockner, K. Present state of rivers and streams in Japan. River Res. Appl. 2005, 21, 93–112. [Google Scholar] [CrossRef]
  4. Hosoya, K. Freshwater Fishes of Japan; Yama-Kei Publishers: Tokyo, Japan, 2015. (In Japanese) [Google Scholar]
  5. Hosoya, K. Conservation of Freshwater Fish Diversity in Japan. In Fish Diversity in Japan; Kai, Y., Motomura, H., Matsuura, K., Eds.; Springer: Singapore, 2022; pp. 395–408. Available online: https://link.springer.com/chapter/10.1007/978-981-16-7427-3_23.
  6. Itakura, H.; Kitagawa, T.; Miller, M.J.; Kimura, S. Declines in catches of Japanese eels in rivers and lakes across Japan: Have riverbank and lakeshore revetments reduced fishery catches? Landsc. Ecol. Eng. 2015, 11, 147–160. [Google Scholar] [CrossRef]
  7. Yuma, M.; Hosoya, K.; Nagata, Y. Distribution of the freshwater fishes of Japan: An historical overview. In Fish Biology in Japan: An Anthology in Honour of Hiroya Kawanabe; Developments in environmental biology of, fishes, Yuma, M., Nakamura, I., Fausch, K.D., Eds.; Springer: Dordrecht, The Netherlands, 1998; pp. 97–124. [Google Scholar] [CrossRef]
  8. Taniguchi, Y.; Inoue, M.; Kawaguchi, Y. Stream fish habitat science and management in Japan: A review. Aquat. Ecosyst. Health Manag. 2001, 4, 357–365. [Google Scholar] [CrossRef]
  9. Watanabe, K.; Tominaga, K.; Nakajima, J.; Kakioka, R.; Tabata, R. Japanese Freshwater Fishes: Biogeography and Cryptic Diversity. In Species Diversity of Animals in Japan; Diversity and Commonality in Animals; Motokawa, M., Kajihara, H., Eds.; Springer: Tokyo, Japan, 2017; pp. 183–227. [Google Scholar] [CrossRef]
  10. Fukushima, M. The dam-related decline of freshwater fish diversity—analyses of the data collected from Hokkaido during the last half century. Jpn. J. Ecol. 2005, 55, 349–357. [Google Scholar]
  11. Fukushima, M.; Kameyama, S.; Kaneko, M.; Nakao, K.; Steel, E.A. Modelling the effects of dams on freshwater fish distributions in Hokkaido, Japan. Freshw. Biol. 2007, 52, 1511–1524. [Google Scholar] [CrossRef]
  12. Han, M.; Fukushima, M.; Kameyama, S.; Fukushima, T.; Matsushita, B. How do dams affect freshwater fish distributions in Japan? Statistical analysis of native and nonnative species with various life histories. Ecol. Res. 2008, 23, 735–743. [Google Scholar] [CrossRef]
  13. Kai, Y. Fish diversity of subarctic waters in Japan. In Fish Diversity in Japan; Kai, Y., Motomura, H., Matsuura, K., Eds.; Springer: Singapore, 2022; pp. 111–124. [Google Scholar]
  14. Goto, A.; Nakanishi, T.; Utoh, H.; Hamada, K. A preliminary study of the freshwater fish fauna of rivers in southern Hokkaido. Bull. Fac. Fish. Hokkaido Univ. 1978, 29, 118–130. [Google Scholar]
  15. Miyazaki, Y.; Senou, H.; Terui, A.; Washitani, I. Illustrated checklist of fishes from the Shubuto River System, southwestern Hokkaido, Japan. Check List 2013, 9, 63–72. [Google Scholar] [CrossRef]
  16. Nakae, M.; Matsuura, K. Ichthyology and collection building in Japan. In Fish Diversity in Japan; Kai, Y., Motomura, H., Matsuura, K., Eds.; Springer: Singapore, 2022; pp. 33–60. [Google Scholar]
  17. Yatsuyanagi, T.; Araki, H. Understanding seasonal migration of Shishamo smelt in coastal regions using environmental DNA. PLoS ONE 2020, 15, e0239912. [Google Scholar] [CrossRef]
  18. Yatsuyanagi, T.; Ishida, R.; Sakata, M.K.; Kanbe, T.; Mizumoto, H.; Kobayashi, Y.; Kamada, S.; Namba, S.; Nii, H.; Minamoto, T.; et al. Environmental DNA monitoring for short-term reproductive migration of endemic anadromous species, Shishamo smelt (Spirinchus lanceolatus). Environ. DNA 2020, 2, 130–139. [Google Scholar] [CrossRef]
  19. Sakai, H.; Goto, A.; Jeon, S.-R. Speciation and dispersal of Tribolodon species (Pisces, Cyprinidae) around the Sea of Japan. Zool. Sci. 2002, 19, 1291–1303. [Google Scholar] [CrossRef] [PubMed]
  20. Sakai, H. Life-histories and genetic divergence in three species of Tribolodon (Cyprinidae). Mem. Fac. Fish. Hokkaido Univ. 1995, 42, 1–98. Available online: http://hdl.handle.net/2115/21893.
  21. Akamatsu, Y.; Tsuzuki, T.; Yokoyama, R.; Funahashi, Y.; Ohta, M.; Azegami, M.; Naito, D.; Inui, R. Comparative study between fish collection by National Census on River Environment and environmental DNA metabarcoding. J. Japan Soc. Civil Eng. Ser. B1 Hydraul. Eng. 2018, 74, 415–420. [Google Scholar] [CrossRef]
  22. Lavergne, E.; Kume, M.; Ahn, H.; Henmi, Y.; Terashima, Y.; Ye, F.; Kameyama, S.; Kai, Y.; Kadowaki, K.; Kobayashi, S.; et al. Effects of forest cover on richness of threatened fish species in Japan. Conservation Biol. 2022, 36, e13449. [Google Scholar] [CrossRef] [PubMed]
  23. Ohashi, M.; Yamamoto, J.; Sudo, K.; Muzugaki, S.; Montani, S.; Tanaka, H. Influence of a river flood on the environment of fishing ground in the Mukawa coast, Hokkaido. J. Japan Soc. Civ. Eng. Ser. B2 (Coast. Eng.) 2012, 68, 1121–1125. [Google Scholar] [CrossRef]
  24. Ohashi, M.; Yamamoto, J.; Sudo, K.; Muzugaki, S.; Montani, S. Effect of snowmelt flood for primary production in Mukawa coast, Hokkaido. J. Japan Soc. Civ. Eng. Ser. B2 (Coast. Eng.) 2013, 692, 1191–1195. [Google Scholar] [CrossRef]
  25. Meador, M.R.; Matthews, W.J. Spatial and temporal patterns in fish assemblage structure of an intermittent Texas stream. Amer. Midl. Nat. 1992, 127, 106–114. [Google Scholar] [CrossRef]
  26. Humpl, M.; Pivnicka, K. Fish assemblages as influenced by environmental factors in streams in protected areas of the Czech Republic. Ecol. Freshw. Fish. 2006, 15, 96–103. [Google Scholar] [CrossRef]
  27. Taylor, C.M.; Holder, T.L.; Fiorillo, R.A.; Williams, L.R.; Thomas, R.B.; Warren, M.L. Distribution, abundance, and diversity of stream fishes under variable environmental conditions. Can. J. Fish. Aquat. Sci. 2006, 63, 43–54. [Google Scholar] [CrossRef]
  28. Oberdorff, T.; Pont, D.; Hugueny, B.; Chessel, D. A probabilistic model characterizing fish assemblages of French rivers: A framework for environmental assessment. Freshw. Biol. 2001, 46, 399–415. [Google Scholar] [CrossRef]
  29. Pont, D.; Hugueny, B.; Oberdorff, T. Modelling habitat requirement of European fishes: Do species have similar responses to local and regional constraints? Can. J. Fish. Aquat. Sci. 2005, 62, 163–173. [Google Scholar] [CrossRef]
  30. Hoeinghaus, D.J.; Winemiller, K.O.; Birnbaum, J.S. Local and regional determinants of stream fish assemblage structure: Inferences based on taxonomic vs. functional groups. J. Biogeogr. 2007, 34, 324–338. [Google Scholar] [CrossRef]
  31. Coble, A.A.; Flinders, C.A.; Homyack, J.A.; Penaluna, B.E.; Cronn, R.C.; Weitemier, K. eDNA as a tool for identifying freshwater species in sustainable forestry: A critical review and potential future applications. Sci. Total Environ. 2019, 649, 1157–1170. [Google Scholar] [CrossRef] [PubMed]
  32. Schenekar, T. The current state of eDNA research in freshwater ecosystems: Are we shifting from the developmental phase to standard application in biomonitoring? Hydrobiologia 2023, 850, 1263–1282. [Google Scholar] [CrossRef]
  33. Yamamoto, S.; Masuda, R.; Sato, Y.; Sado, T.; Araki, H.; Kondoh, M.; Minamoto, T.; Miya, M. Environmental DNA metabarcoding reveals local fish communities in a species-rich coastal sea. Sci. Rep. 2017, 7, 40368. [Google Scholar] [CrossRef] [PubMed]
  34. Ahn, H. Variation of Japanese eel eDNA in sequentially changing conditions in different sample volumes. J. Fish. Biol. 2020, 97, 1238–1241. [Google Scholar] [CrossRef]
  35. Hongo, Y.; Nishijima, S.; Kanamori, Y.; Sawayama, S.; Yokouchi, K.; Kanda, N.; Oori, S.; Onitsuka, T.; Kurogi, H.; Yamazaki, T.; et al. Fish environmental DNA in Tokyo Bay: A feasibility study on the availability of environmental DNA for fisheries. Reg. Stud. Mar. Sci. 2021, 47, 101950. [Google Scholar] [CrossRef]
  36. Kume, M.; Lavergne, E.; Ahn, H.; Terashima, Y.; Kadowaki, K.; Ye, F.; Kameyama, S.; Henmi, Y.; Kai, Y.; Yamashita, Y.; et al. Factors structuring estuarine and coastal fish communities across Japan using environmental DNA metabarcoding. Ecol. Indic. 2021, 121, 107216. [Google Scholar] [CrossRef]
  37. Ito, G.; Yamauchi, H.; Shigeyoshi, M.; Ashino, K.; Yonashiro, C.; Asami, M.; Goto, Y.; Duda, J.J.; Yamanaka, H. Using eDNA metabarcoding to establish targets for freshwater fish composition following river restoration. Global Ecol. Conserv. 2023, 43, e02448. [Google Scholar] [CrossRef]
  38. Nakagawa, H.; Yamamoto, S.; Sato, Y.; Sado, T.; Minamoto, T.; Miya, M. Comparing local- and regional-scale estimations of the diversity of stream fish using eDNA metabarcoding and conventional observation methods. Freshw. Biol. 2018, 63, 569–580. [Google Scholar] [CrossRef]
  39. Iwamura, A.; Hayami, K.; Sakata, M.K.; Minamoto, T. Environmental DNA revealed the fish community of Hokkaido Island, Japan, after invasion by rainbow trout. Biodiv. Data J. 2020, 8, e56876. [Google Scholar] [CrossRef]
  40. Minegishi, Y.; Wong, M.K.-S.; Kanbe, T.; Araki, H.; Kashiwabara, T.; Ijichi, M.; Kogure, K.; Hyodo, S. Spatiotemporal distribution of juvenile chum salmon in Otsuchi Bay, Iwate, Japan, inferred from environmental DNA. PLoS ONE 2019, 14, e0222052. [Google Scholar] [CrossRef] [PubMed]
  41. Mizumoto, H.; Mitsuzuka, T.; Araki, H. An environmental DNA survey on distribution of an endangered salmonid Species, Parahucho perryi, in Hokkaido, Japan. Front. Ecol. Evol. 2020, 8, 569425. [Google Scholar] [CrossRef]
  42. Takeuchi, A.; Iijima, T.; Kakuzen, W.; Watanabe, S.; Yamada, Y.; Okamura, A.; Horie, N.; Mikawa, N.; Miller, M.J.; Kojima, T.; et al. Release of eDNA by different life history stages and during spawning activities of laboratory-reared Japanese eels for interpretation of oceanic survey data. Sci. Rep. 2019, 9, 6074. [Google Scholar] [CrossRef] [PubMed]
  43. Takeuchi, A.; Watanabe, S.; Yamamoto, S.; Miller, M.J.; Fukuba, T.; Miwa, T.; Okino, T.; Minamoto, K.; Tsukamoto, K. First use of oceanic environmental DNA to study the spawning ecology of the Japanese eel Anguilla japonica. Mar. Ecol. Prog. Ser. 2019, 609, 187–196. [Google Scholar] [CrossRef]
  44. Takeuchi, A.; Higuchi, T.; Kuroki, M.; Watanabe, S.; Miller, M.J.; Okino, T.; Miwa, T.; Tsukamoto, T. Environmental DNA detects a possible Japanese eel spawning event near a video-recorded anguillid eel in the open ocean. Mar. Ecol. Prog. Ser. 2022, 689, 95–107. [Google Scholar] [CrossRef]
  45. Kasai, A.; Yamazaki, A.; Ahn, H.; Yamanaka, H.; Kameyama, S.; Masuda, R.; Azuma, N.; Kimura, S.; Karaki, T.; Kurokawa, Y.; et al. Distribution of Japanese eel Anguilla japonica revealed by environmental DNA. Front. Ecol. Evol. 2021, 9, 83. [Google Scholar] [CrossRef]
  46. Sala, O.E. Global biodiversity scenarios for the year 2100. Science 2000, 287, 1770–1774. [Google Scholar] [CrossRef] [PubMed]
  47. Gozlan, R.E.; St-Hilaire, S.; Feist, S.W.; Martin, P.; Kent, M.L. Disease threats on European fish. Nature 2005, 435, 1045–1046. [Google Scholar] [CrossRef]
  48. Dudgeon, D.; Arthington, A.H.; Gessner, M.O.; Kawabata, Z.; Knowler, D.J.; Leveque, C.; Naiman, R.J.; Prieur-Richard, A.H.; Soto, D.; Stiassny, M.L.; et al. Freshwater biodiversity: Importance, threats, status and conservation challenges. Biol. Rev. 2006, 81, 163–182. [Google Scholar] [CrossRef]
  49. Worm, B.; Barbier, E.B.; Beaumont, N.; Duffy, J.E.; Folke, C.; Halpern, B.S.; Jackson, J.B.C.; Lotze, H.K.; Micheli, F.; Palumbi, S.R.; et al. Impacts of biodiversity loss on ocean ecosystem services. Science 2006, 314, 787–790. [Google Scholar] [CrossRef] [PubMed]
  50. Coulthard, S.; Johnson, D.; McGregor, J.A. Poverty, sustainability and human wellbeing: A social wellbeing approach to the global fisheries crisis. Global Environ. Change 2011, 21, 453–463. [Google Scholar] [CrossRef]
  51. Minamoto, T.; Miya, M.; Sado, T.; Seino, S.; Doi, H.; Kondoh, M.; Nakamura, K.; Takahara, T.; Yamamoto, S.; Yamanaka, H.; et al. An illustrated manual for environmental DNA research: Water sampling guidelines and experimental protocols. Environ. DNA. 2021, 3, 8–13. [Google Scholar] [CrossRef]
  52. Andruszkiewicz, E.A.; Starks, H.A.; Chavez, F.P.; Sassoubre, L.M.; Block, B.A.; Boehm, A.B. Biomonitoring of marine vertebrates in Monterey Bay using eDNA metabarcoding. PLoS ONE 2017, 12, e0176343. [Google Scholar] [CrossRef] [PubMed]
  53. Nakabo, T. Fishes of Japan with Pictorial Keys to the Species, 3rd ed.; Tokai University Press: Kanagawa, Japan, 2013. [Google Scholar]
  54. Nakajima, J. Loaches of Japan; Yama-Kei Publishers: Tokyo, Japan, 2017. (In Japanese) [Google Scholar]
  55. Nelson, J.S. Fishes of the World, 4th ed.; Wiley John & Sons: Hoboken, NJ, USA, 2006. [Google Scholar]
  56. R Core Team, 2020. R: A Language and Environment for Statistical Computing: R Foundation for Statistical Computing. Vienna, Austria. Available online: https://www.R-project.org/ (accessed on 1 July 2021).
  57. Borcard, D.; Gillet, F.; Legendre, P. Numerical Ecology with R; Springer International Publishing: Cham, Switzerland, 2011. [Google Scholar]
  58. Kindt, R.; Coe, R. Tree Diversity Analysis: A Manual and Software for Common Statistical Methods for Ecological and Biodiversity Studies; World Agroforestry Centre: Nairobi, Kenya, 2018. [Google Scholar]
  59. Guttman, L. Some necessary conditions for common-factor analysis. Psychometrika 1954, 19, 149–161. [Google Scholar] [CrossRef]
  60. Frontier, S. Étude de la décroissance des valeurs propres dans une analyse en composantes principales: Comparaison avec le modd́le du bâton brisé. J. Exp. Mar. Biol. Ecol. 1976, 25, 67–75. [Google Scholar] [CrossRef]
  61. Meire, P.; Ysebaert, T.; Damme, S.V.; Van den Bergh, M.E.T.; Struyf, E. The Scheldt estuary: A description of a changing ecosystem. Hydrobiologia 2005, 540, 1–11. [Google Scholar] [CrossRef]
  62. Hewitt, J.E.; Thrush, S.F.; Dayton, P.D. Habitat variation, species diversity and ecological functioning in a marine system. J. Exp. Mar. Biol. Ecol. 2008, 366, 116–122. [Google Scholar] [CrossRef]
  63. França, S.; Vasconcelos, R.P.; Fonseca, V.F.; Tanner, S.E.; Reis-Santos, P.; Costa, M.J.; Cabral, H.N. Predicting fish community properties within estuaries: Influence of habitat type and other environmental features. Estuar. Coast. Shelf Sci. 2012, 107, 22–31. [Google Scholar] [CrossRef]
  64. Brun, P.; Zimmermann, N.E.; Graham, C.H.; Lavergne, S.; Pellissier, L.; Münkemüller, T.; Thuiller, W. The productivity-biodiversity relationship varies across diversity dimensions. Nat. Commun. 2019, 10, 5691. [Google Scholar] [CrossRef]
  65. Hasegawa, K. Invasions of rainbow trout and brown trout in Japan: A comparison of invasiveness and impact on native species. Ecol. Freshw. Fish. 2020, 29, 419–428. [Google Scholar] [CrossRef]
  66. Morita, K. Ups and downs of non-native and native stream-dwelling salmonids: Lessons from two contrasting river. Ecological Res. 2021, 37, 188–196. [Google Scholar] [CrossRef]
  67. Hansen, G.J.A.; Jones, M.L. A rapid assessment approach to prioritizing streams for control of Great Lakes sea lampreys (Petromyzon marinus): A case study in adaptive management. Can. J. Fish. Aquat. Sci. 2008, 65, 2471–2484. [Google Scholar] [CrossRef]
  68. Pederson, J.; Carlton, J.T.; Bastidas, C.; David, A.; Grady, S.; Green-Gavrielidis, L.; Hobbs, N.-V.; Kennedy, C.; Knack, J.; McCuller, M.; et al. 2019 Rapid Assessment Survey of marine bioinvasions of southern New England and New York, USA, with an overview of new records and range expansions. BioInvasions Rec. 2021, 10, 227–237. [Google Scholar] [CrossRef]
  69. Allen, G.R.; McKenna, S.A. A Marine Rapid Assessment of the Togean and Banggai Islands, Sulawesi, Indonesia; RAP Bulletin of Biological Assessment 20; Conservation International: Washington, DC, USA, 2001. [Google Scholar]
  70. Tiberti, R.; Buchaca, T.; Cruset, E.; Iacobelli, L.; Maini, M.; Victor, O.; Mariangels, P.; Quim, P.R.; Ibor, S.; Marc, V.; et al. Evaluation of visual encounter surveys as a method for the rapid assessment of fish presence and relative density in high mountain lakes. Aquatic Conserv. Mar. Freshw. Ecosyst. 2022, 2022, 1–9. [Google Scholar] [CrossRef]
  71. Ajemian, M.J.; Wetz, J.J.; Shipley-Lozano, B. Rapid assessment of fish communities on submerged oil and gas platform reefs using remotely operated vehicles. Fish. Rese. 2015, 167, 143–155. [Google Scholar] [CrossRef]
  72. Minchin, D.; White, B. A rapid assessment method for an invasive mollusc in an Irish lake. Manag. Biol. Invasions 2014, 5, 63–72. [Google Scholar] [CrossRef]
  73. Davison, P.I.; Copp, G.H. A rapid assessment of non-native fish distributions in two English river basins using environmental, D.N.A.J. Vertebr. Biol. 2023, 72, 22068. [Google Scholar]
  74. Goto, A. Alternative life-history styles of Japanese freshwater sculpins revisited. Environ. Biol. Fishes 1990, 28, 101–112. [Google Scholar] [CrossRef]
  75. Tamate, T.; Maekawa, K. Life cycle of masu salmon (Oncorhynchus masou) in Shumarinai Lake, northern Hokkaido, Japan. Eurasian J. Forest Res. 2000, 1, 39–42. Available online: http://hdl.handle.net/2115/22122.
  76. Ahn, H.; Kume, M.; Terashima, Y.; Ye, F.; Kameyama, S.; Miya, M.; Yamashita, Y.; Kasai, A. Evaluation of fish biodiversity in estuaries using environmental DNA metabarcoding. PLoS ONE 2020, 15, e0231127. [Google Scholar] [CrossRef] [PubMed]
  77. Lafferty, K.D.; Garcia-Vedrenne, A.E.; McLaughlin, J.P.; Childress, J.N.; Morse, M.F.; Jerde, C.L. At Palmyra Atoll, the fish-community environmental DNA signal changes across habitats but not with tides. J. Fish Biol. 2021, 98, 415–425. [Google Scholar] [CrossRef] [PubMed]
  78. Larson, W.A.; Barry, P.; Dokai, W.; Maselko, J.; Olson, J.; Baetscher, D. Leveraging eDNA metabarcoding to characterize nearshore fish communities in Southeast Alaska: Do habitat and tide matter? Environ. DNA 2022, 4, 868–880. [Google Scholar] [CrossRef]
  79. Evans, D.H.; Piermarini, P.M.; Choe, K.P. The multifunctional fish gill: Dominant site of gas exchange, osmoregulation, acid-base regulation, and excretion of nitrogenous waste. Physiol. Rev. 2005, 85, 97–177. [Google Scholar] [CrossRef] [PubMed]
  80. Laporte, M.; Berger, C.S.; García-Machado, E.; Côté, G.; Morissette, O.; Bernatchez, L. Cage transplant experiment shows weak transport effect on relative abundance of fish community composition as revealed by eDNA metabarcoding. Ecol. Indic. 2022, 137, 108785. [Google Scholar] [CrossRef]
  81. Jo, T.; Yamanaka, H. Meta-analyses of environmental DNA downstream transport and deposition in relation to hydrogeography in riverine environments. Freshw. Biol. 2022, 67, 1333–1343. [Google Scholar] [CrossRef]
  82. Van Driessche, C.; Everts, T.; Neyrinck, S.; Brys, R. Experimental assessment of downstream environmental DNA patterns under variable fish biomass and river discharge rates. Environ. DNA 2023, 5, 102–116. [Google Scholar] [CrossRef]
  83. Kono, T.; Foreman, M.; Chandler, P.; Kashiwai, M. Coastal Oyashio south of Hokkaido, Japan. J. Phys. Oceanogr. 2004, 34, 1477–1494. [Google Scholar] [CrossRef]
Figure 1. Map of (a) Northern East Asia showing the location of Hokkaido, the northernmost main island of Japan, and (b) the location of the Mukawa River along the southern coast of Central Hokkaido, where the fish community composition was studied using eDNA sampling. SO: Sea of Okhotsk. Modified from imagery from (a) (https://japanmap360.com/japan-geography-map; accessed on 21 March 2024) and (b) from Wikimedia Commons, (https://commons.wikimedia.org/wiki/File:Hokkaido_Central_topographic_map.png; accessed on 29 January 2024).
Fishes 09 00147 g001
Figure 2. Photographs of examples of the various types and body forms of freshwater or estuarine fish species that live in the rivers of Hokkaido and were detected in the Mukawa River during the present study showing (a) Lefua nikkonis (70.7 mm), (b) Pseudaspius hakonensis (268.7 mm), (c) Pungitius pungitius (53.0 mm), (d) Oncorhynchus masou masou (126.8 mm), (e) Salvelinus leucomaenis leucomaenis (236.6 mm), (f) Chelon haematocheila (69.6 mm), (g) Acanthogobius lactipes (54.6 mm), (h) Tridentiger brevispinis (67.0 mm), (i) Clupea pallasii (42.7 mm) (j) Myoxocephalus stelleri (57.0 mm), (k) Pholis crassispina (55.9 mm) (lengths are standard lengths). Images were modified from Miyazaki et al. [15].
Fishes 09 00147 g002
Figure 3. Map of the study area (a) showing the eDNA water sampling sites (black circles), and two weirs (blue lines; see Figure S1) in the Mukawa River and nearby areas, and its location on Hokkaido (b), with the inset image (c) showing the river mouth and adjacent shoreline sampling sites, which was modified from Google Earth Pro 7.3.4.
Fishes 09 00147 g003
Figure 4. Number of species (OTUs; diamonds) at each sampling station (US: upstream, MS: midstream, DS: downstream, RM: river mouth, AS: adjacent shore, OS: offshore), and schematic representations of water temperature (blue line) and salinity (red line) along the length of the river and in the ocean based on measurements at the sampling stations.
Fishes 09 00147 g004
Figure 5. Plots of the number of reads detected of 12 of the fish species that were found at each sampling station for (a) brook loach (Noemacheilus barbatulus toni), (b) Japanese dace (Pseudaspius hakonensis), (c) a dace (Pseudaspius sachalinensis), (d) Pacific redfin (Tribolodon brandtii maruta), (e) whitespotted char (Salvelinus leucomaenis leucomaenis) and masou salmon (Oncorhynchus masou masou), (f) Sakhalin sculpin (Cottus amblystomopsis) and flathead grey mullet (Mugil cephalus), (g) a goby (Tridentiger brevispinis), (h) Japanese sardine (Sardinops melanostictus), (i) righteye flounder (Pleuronectidae), and (j) prickly lanternfish (Myctophum asperum). Stations are arranged from in the river left and towards the ocean (right). See Figure 3 for locations and Table 1 for site abbreviations.
Fishes 09 00147 g005
Table 1. Information about samples and each station (Code: station code, Lat: latitude (north), Long: longitude (east), Dist: distance from river mouth (km), Temp: water temperature (°C), Sal: salinity, Vol: volume of sampled water (L), Conc: concentration of total DNA (pg/μL), OTU: number of operational taxonomic units).
StationCodeLatLongDistTempSalVolConcOTU
UpstreamUS43.0433142.657712518.900.55240.66
MidstreamMS42.7587142.13684023.80.10.51617.66
DownstreamDS42.5752141.93592.520.70.10.41497.714
River mouth at low tideLT42.5616141.9239022.80.70.4932.120
River mouth at high tideHT42.5614141.9231020.56.10.32149.717
Right shore 1 (500 m)RS142.5687141.91210.517.930.60.4514.313
Right shore 2 (1 km)RS242.5702141.9098118.729.40.43232.714
Left shore 1 (500 m)LS142.5586141.92630.517.230.30.55110.623
Left shore 2 (1 km)LS242.5561141.9286116.730.40.64258.816
OffshoreOS42.4343141.807616.811.832.33.04000.75
Negative controlNC-----0.5--
Disclaimer/Publisher’s Note: The statements, opinions and data contained in all publications are solely those of the individual author(s) and contributor(s) and not of MDPI and/or the editor(s). MDPI and/or the editor(s) disclaim responsibility for any injury to people or property resulting from any ideas, methods, instructions or products referred to in the content.

