Article

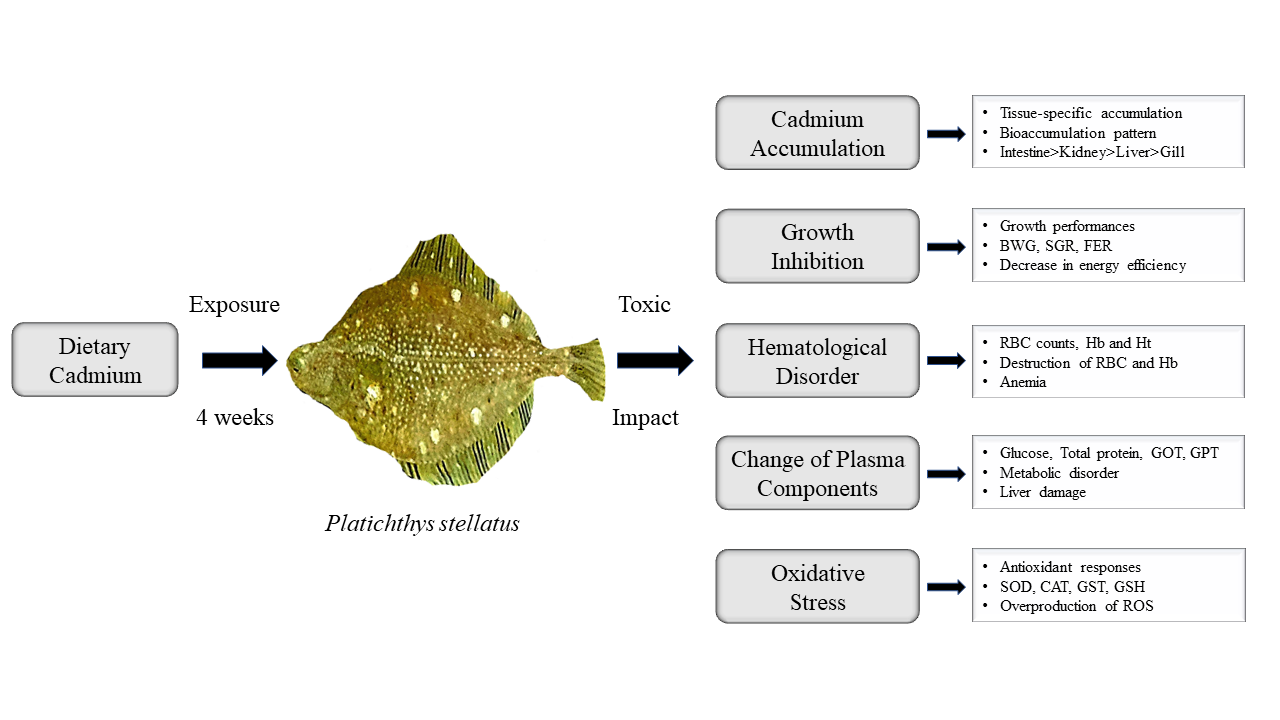
Toxic Impact of Dietary Cadmium on Bioaccumulation, Growth, Hematological Parameters, Plasma Components, and Antioxidant Responses in Starry Flounder (Platichthys stellatus)

1
Department of Aquatic Life Medicine, Pukyong National University, Busan 48513, Republic of Korea
2
Department of Marine Life Sciences, College of Ocean Sciences, Jeju National University, Jeju 63243, Republic of Korea
*
Authors to whom correspondence should be addressed.
Fishes 2024, 9(2), 59; https://doi.org/10.3390/fishes9020059
Submission received: 29 December 2023 / Revised: 24 January 2024 / Accepted: 29 January 2024 / Published: 30 January 2024

Abstract

:
Starry flounders (Platichthys stellatus) (average weight—114.69 ± 13 g, length—19.0 ± 0.21 cm) underwent a 4-week exposure to varying dietary cadmium (Cd) concentrations: 0, 10, 20, 40, 60, and 80 mg/kg. Bioaccumulation patterns were revealed in the intestine, kidney, liver, and gills in descending order of accumulation. Significant declines in growth indicators—body weight gain (BWG), specific growth rate (SGR), and feed efficiency ratio percentage (FER)—were evident at 80 mg Cd/kg for 2 weeks and beyond 60 mg Cd/kg for 4 weeks. Hematological parameters, including red blood cell (RBC) count, hematocrit (Ht), and hemoglobin (Hb), remarkably reduced at 80 mg Cd/kg for both 2 and 4 weeks. The total plasma protein reduced significantly after exposure to Cd for 2 and 4 weeks, alongside increased glucose levels, glutamic oxaloacetic transaminase (GOT), and glutamic pyruvate transaminase (GPT). Considerable increases in antioxidant responses—superoxide dismutase (SOD), catalase (CAT), glutathione S-transferase (GST), and glutathione (GSH) levels—were observed after exposure to Cd for 2 and 4 weeks. P. stellatus exhibits a high accumulation of dietary Cd in specific tissues. Moreover, concentrations above 60 mg Cd/kg adversely affected the growth performance, hematological parameters, plasma components, and antioxidant responses.
Key Contribution: The manuscript presents a comprehensive investigation into the impact of dietary cadmium (Cd) exposure on Platichthys stellatus (starry flounder). It highlights the intricate patterns of Cd accumulation influenced by exposure pathways, concentrations, and duration, while emphasizing the critical effects of elevated dietary Cd levels (above 60 mg Cd/kg) on the growth, hematological parameters, plasma components, and antioxidant responses in P. stellatus. This study illuminates the potential risks of Cd-induced energy imbalances, metabolic disturbances, and oxidative stress in this aquatic species, underscoring the significance of understanding and mitigating the repercussions of Cd contamination in aquatic surroundings.

Graphical Abstract

1. Introduction

Cadmium (Cd) is a significant environmental threat, adversely affecting aquatic organisms. Its augmented usage, driven by human activities encompassing agriculture (e.g., insecticides, fungicides, and fertilizers) and industry (e.g., nickel–cadmium batteries, plastics, and paint pigments) [1], has elevated its presence within aquatic ecosystems. This increased prevalence raises concerns regarding potential risks to aquatic life. In aquatic settings, Cd exists in diverse chemical compounds due to its low solubility [2]. Cd demonstrates an affinity for both inorganic ligands, such as F, Cl, SO42−, and HCO3, as well as organic ligands like salicylate, oxalate, citrate, amino acids, fulvic acids, and humic acids. Notably, water-soluble inorganic Cd compounds dissolve and form various ions and complexes, displaying diverse chemical properties that lead to distinct accumulation patterns and toxic effects on aquatic animals [2]. Hence, understanding the intricate interplay of Cd in aquatic environments is imperative to comprehensively grasp its impact on ecosystems and resident organisms.
Elevated exposure to metals in aquatic environments induces the bioaccumulation of these substances within specific tissues of aquatic animals [3]. Cd, in particular, poses a substantial threat to marine life due to its extended biological half-life [4]. Fish accumulate Cd through pathways that include absorption via the epithelial or mucosal layers found on the skin, gills, and gastrointestinal tract. Subsequently, it redistributes to other tissues through blood circulation [5]. This intricate process is influenced by tissue-specific factors such as uptake pathways, uptake and elimination rates, and bioavailability [6]. Consequently, Cd tends to accumulate primarily in specific organs, like the liver and kidneys, which are crucial for detoxification and excretion [5]. Thus, the analysis of Cd accumulation serves as a critical indicator when assessing Cd toxicity in aquatic animals, aiding in identifying structural and functional disorders, exposure pathways, biotransformation, and excretion [7].
Exposure to Cd triggers adverse effects on hematological parameters by directly or indirectly attacking hemoglobin molecules and polyunsaturated fatty acids within erythrocyte membranes [8]. This attack initiates alterations in erythrocyte morphology, protein cross-linking, and membrane proteins [9]. Moreover, Cd’s impact extends beyond the erythrocyte membrane, inducing a range of nuclear anomalies in aquatic organisms. These anomalies encompass vacuolated nuclei, micronuclei, binuclei, irregular nucleus shapes, and nuclear buds [10]. Such abnormalities result in erythrocyte lysis and severe anemia, primarily stemming from deformations in the cell membrane and nucleus [9,10]. Cd can potentially disrupt ion homeostasis, including that of calcium and sodium, by competing with calcium at its binding site, because its physicochemical properties are similar to those of divalent calcium [11]. Notably, Cd interferes with the activity of key enzymes such as sodium/potassium ATPase and carbonic anhydrase, causing an imbalance in sodium homeostasis [12]. Moreover, the toxic effects of Cd extend to metabolic pathways, disrupting enzymes associated with glucose, lipid, protein, and amino acid metabolism [13]. This multifaceted effect underscores the comprehensive nature of Cd-induced toxicity, which affects both the cellular structure and vital physiological processes in organisms exposed to this heavy metal.
Cd exposure causes an elevation in reactive oxygen species (ROS). This occurs by promoting the release of a free iron in the Fenton reaction induced by Cd. When ROS production surpasses antioxidant capacities, oxidative stress occurs [14]. Furthermore, Cd disrupts the complex enzyme operations in the electron transport system, increasing mitochondrial ROS production [15]. Excessive Cd exposure induces DNA damage, resulting in nuclear breakage, chromatin condensation, and oxidative damage via lipid and protein peroxidation [16]. To counteract oxidative stress, fish activate defense systems comprising enzymatic antioxidants, including superoxide dismutase (SOD), catalase (CAT), and glutathione S-transferase (GST), as well as non-enzymatic antioxidants, such as glutathione (GSH) [17]. These defense systems are activated to scavenge ROS under oxidative stress, and the analysis of antioxidant systems serves as a vital indicator for assessing Cd-induced oxidative stress in fish.
Fish serve as crucial bioindicators for evaluating the deleterious effects of metal contamination. This significance is heightened due to their position as predators in aquatic ecosystems, making them highly susceptible to toxic substances that can accumulate significantly throughout the food chain. The starry flounder, Platichthys stellatus, holds substantial economic value within the Republic of Korea’s aquaculture industry, owing to its resilience to high salinity, disease resistance, and market desirability. The aquaculture of P. stellatus has demonstrated consistent growth, reaching approximately 3373 tons in 2018 and 3669 tons in 2019 [18]. Anthropogenic activities contribute to escalated levels of Cd in aquatic surroundings, potentially posing a toxic threat to P. stellatus. However, limited research has explored the detrimental impacts of dietary Cd exposure on P. stellatus. Accordingly, this study aimed to appraise the toxicity of dietary Cd by examining its impact on bioaccumulation, growth performance, hematological parameters, and antioxidant responses in P. stellatus.

2. Materials and Methods

2.1. Diet Preparation

The dietary Cd concentrations in the present study were determined by considering the habitat environments and feeding habits of P. stellatus, which primarily feed on small crustaceans, mollusks, and bristle worms. In the Republic of Korea, in 2010, the highest detected concentration of Cd in mollusks, a major prey for P. stellatus, reached 31.2 mg/kg [19]. Ref. [20] reported that Cd exhibited the second highest concentration of heavy metals in sea algae, crustaceans, mollusks, and echinoderms. Additionally, Cd has been detected in Thais bronni from Sanmen Bay in China, reaching up to 9.64 mg/kg [21]. This implies the risk of P. stellatus being exposed to high concentrations of Cd through the food chain. The dietary composition details are provided in Table 1. To create the Cd premix for Cd exposure, 5 g of Cd (CdCl2, Sigma, St. Louis, MO, USA) was mixed with 95 g of α-cellulose (Sigma, USA). Subsequently, the Cd premix was added to six experimental diets at concentrations of 0, 10, 20, 40, 60, and 80 mg Cd/kg. All components were thoroughly mixed, and 12% water was added. The pelleted diets underwent a drying process at 25 °C for 1 week and were subsequently stored at −20 °C. A proximate analysis of the diets revealed a minimum crude protein content of 50.3%, a minimum crude liquid content of 10.2%, and a maximum ash content of 12.4%. After the diets were prepared, the actual Cd concentration was determined using ICP-MS (ELAN DRC).

2.2. Experimental Fish and Conditions

The fish, P. stellatus, were sourced from the Hwanam fish hatchery located in Busan, the Republic of Korea. Before entering into the experimental phase, 300 fish underwent a 2-week acclimatization period under controlled conditions, as outlined in Table 2. Throughout this period, the fish were provided with diets free of Cd. Following acclimation, a total of 180 robust fish (average weight—114.69 ± 13 g, length—19.0 ± 0.21 cm) were selected at random. These selected fish were then evenly distributed into 500 L cylindrical water tanks, taking into account the concentration of dietary Cd. Each concentration accommodated 30 fish, divided into 6 groups, and placed in 6 tanks. During the exposure experiments, a quantity of dietary Cd equivalent to 2% of the body weight was administered daily through 2 feedings per day. The regimen, lasting for 4 weeks, involved promptly removing any unconsumed feed. After the conclusion of the 2-week and 4-week periods, three groups from each concentration (a total of 15 fish) underwent MS-222 anesthesia for three sets of repeated experiments. Subsequently, tissue and blood samples were collected. A protocol authorized by the Institutional Animal Care and Use Committee of Pukyong National University was followed during all experimental procedures (Permission No. PKNUIACUC-2023-26).

2.3. Bioaccumulation

Liver, kidney, gills, and intestine tissues were freeze-dried for over 48 h to determine their dry weight. The thoroughly dried samples were weighed and then subjected to a wet digestion method with the addition of 65% HNO3. Subsequently, the samples were digested at 140 °C. This process was repeated until complete decomposition of the organic matter was achieved. Diluted using 1% HNO3, the completely dissolved samples underwent filtration employing a syringe filter with a pore diameter of 0.45 μm (Hyundai micro, Inc., Seoul, Republic of Korea) and were then utilized for analysis. The ICP-MS (ELAN 6600DRC, PerkinElmer, Inc., Shelton, CT, USA) equipment was utilized for analyzing Cd concentrations, with PERKINELMER ICP Ⅳ (PerkinElmer, Inc., Shelton, CT, USA) used for external calibration. To demonstrate accuracy and validity, the certified reference material DORM-4 (fish protein, the National Research Council, Ontario, Canada) was processed and analyzed using the same method used for the samples. The limit of quantification (LOQ) was established at threefold the limit of detection (LOD). The LOD was determined using the formula 3 × standard deviation of the blank/slope of the calibration curve. The recovery rate of Cd ranged from 91 to 103%, with an LOD of 0.028 μg/kg and LOQ of 0.084 μg/kg. Cd bioaccumulation in tissues was indicated as μg/g dry weight.

2.4. Growth Performance

The weight (g) and length (cm) of P. stellatus were assessed immediately before exposure, as well as at 2 and 4 weeks, with measurements conducted for each group consisting of five fish at each concentration. Using the provided formulas, various growth parameters, including body weight gain (BWG), specific growth rate (SGR), and feed efficiency ratio percentage (FER), were subsequently calculated [22,23,24].
BWG (%) = (final body weight − initial body weight)/initial body weight × 100
SGR (%) = [{Ln (final weight) − Ln (initial weight)}/period] × 100
FER (%) = increase in biomass of fish/feed intake × 100

2.5. Hematological Parameters

Using a single-use syringe treated with sodium heparin, blood samples were gathered. Following collection, the samples underwent immediate analysis for the total red blood cell (RBC) count, hematocrit (Ht), and hemoglobin (Hb). To determine the total RBC count, the blood sample was diluted in a ratio of 1:400 with Hayem’s solution. Subsequently, the diluted sample was placed on a hemocytometer (Improved Neubauer, Superior, Ltd., Bad Mergentheim, Germany), and the examination was conducted using an optical microscope. For Ht values, a capillary tube containing the blood underwent centrifugation using a micro-hematocrit centrifuge (model: 01501, HAWKSLEY AND SONS, Ltd., Lancing, UK) at 12,000 rpm for 5 min. The resulting values were then determined using a micro-hematocrit reader (HAWKSLEY AND SONS, Ltd., England). The concentrations of Hb were assessed using a clinical kit (Asan Pharm. Co., Ltd., Seoul, Republic of Korea), employing the cyan-methemoglobin method.

2.6. Plasma Components

To obtain plasma samples, the blood samples underwent centrifugation 3000× g and 4 °C for a duration of 10 min. The subsequent analysis involved examining various plasma components such as organic and enzymatic substances. The levels of glucose and total protein in the plasma were assessed using the glucose oxidase/peroxidase (GOD/POD) method and the Biuret method, respectively. These analyses were conducted with the use of a clinical kit (Asan Pharm. Co., Ltd.) Besides measuring glucose and the total protein, the levels of both glutamic oxalate transaminase (GOT) and glutamic pyruvate transaminase (GPT) were determined. Utilizing the Reitman–Frankel method, both GOT and GPT were evaluated with a clinical kit (Asan Pharm. Co., Ltd., Seoul, Republic of Korea).

2.7. Antioxidant Responses

Furthermore, 0.1 g of liver, kidney, and gill tissues was excised. Using a Teflon–glass homogenizer (099CK4424, Glas-Col, Terre Haute, IN, USA), homogenization of the tissues was performed using 10-fold ice-cold 0.1 M phosphate buffer (pH 7.4). Subsequently, the obtained homogenate underwent centrifugation at 4 °C and 12,000× g for 30 min. This process was conducted by referencing the method outlined by Kim and Kang [17]. The supernatant was then utilized for analysis. The protein concentration in each tissue was quantified using a clinical kit (Biorad Co., Ltd., Hercules, CA, USA). Superoxide dismutase (SOD) activity was determined utilizing an SOD assay kit (Dojindo Molecular Technologies, Inc., Kumamoto, Japan) by assessing the 50% inhibition rate for the reduction reaction of WST-1 (2-(4-Iodophenyl)-3-(4-nitrophenyl)-5-(2,4-disulfophenyl)-2H-tetrazolium, monosodium salt). The quantity of enzymes within a 20 μL sample solution that reduced the WST-1 reaction with the superoxide anion by 50% defined a unit of SOD activity. The results were presented as units/mg protein. Catalase (CAT) activity was assessed utilizing a CAT assay kit (Cell Biolabs, Inc., San Diego, CA, USA) with H2O2 serving as the substrate. A defined unit of CAT activity corresponded with the quantity of enzymes capable of decomposing 1.0 μmol of H2O2 per minute. CAT activity was then quantified and presented as units/mg protein. The activity of glutathione S-transferase (GST) was assessed following the method outlined by Kim and Kang [17]. The samples were reacted by mixing them with a solution containing 0.2 M phosphate buffer (pH 6.5), 10 mM glutathione (GSH), and 10 mM 1-chloro-2-dinitrobenzene (CDNB). The absorbance was then measured at 340 nm at 30 s intervals over a span of 5 min, and the calculations were based on the section displaying the most significant change. GST activity was quantified and presented as nmol/min/mg protein. Glutathione (GSH) was measured using Kim and Kang’s method [17]. The samples were mixed with 3 mL of a precipitate solution containing 1.67 g of metaphosphoric acid, 0.2 g of EDTA, and 30 g of NaCl in 100 mL of distilled water. One milliliter of the supernatant, obtained after centrifugation at 4500× g for 10 min, was combined with 4.0 mL of a 0.3 M NaHPO4 solution, and 0.5 mL of 5,5′-dithiobis-2-nitrobenzoic acid (DTNB) was added to initiate the reaction. GSH was quantified by measuring absorbance at 412 nm and presented as nmol GSH/mg protein.

2.8. Statistical Analysis

Each experimental section was performed in triplicate. Using the SPSS/PC+ statistical package version 27 (SPSS Inc, Chicago, IL, USA), statistical analysis was conducted. To identify significant differences among the groups at 2 and 4 weeks, one-way ANOVA and the Tukey’s HSD test were utilized. The defined level of significance was p < 0.05.

3. Results

3.1. Bioaccumulation

The levels of Cd accumulation in the liver, kidney, gills, and intestine tissues of P. stellatus after 2- and 4-week dietary Cd exposure are demonstrated in Figure 1. In the liver, significant Cd accumulation was detected after both 2 and 4 weeks of exposure to concentrations above 40 mg Cd/kg. The peak recorded accumulation level in the liver was 6.81 ± 0.58 μg Cd/g after 4 weeks at 80 mg Cd/kg concentration. The kidney showed a considerable increase in Cd accumulation after exposure to concentrations above 10 mg Cd/kg at both 2 and 4 weeks, reaching a level of 11.68 ± 1.02 μg Cd/g after 4 weeks at 80 mg Cd/kg concentration. For the gills, a substantial increase in Cd accumulation was indicated after 2 weeks of exposure to concentrations above 60 mg Cd/kg and 4 weeks above 40 mg Cd/kg. The highest recorded accumulation level in the gills was 0.56 ± 0.04 μg Cd/g at 80 mg Cd/kg concentration for 4 weeks. Cd accumulation in the intestine was significantly elevated for both 2 and 4 weeks after exposure to concentrations above 20 mg Cd/kg. The peak recorded accumulation level in the intestine was 65.21 ± 4.99 μg Cd/g after exposure to 80 mg Cd/kg concentration for 4 weeks. Consequently, the pattern of Cd bioaccumulation was demonstrated in the sequence: intestine > kidney > liver > gill.

3.2. Growth Performance

After 2 and 4 weeks of exposure to dietary Cd, no cases of mortality were observed, and the growth performance of P. Stellatus during this period is presented in Table 3. A significant decrease in BWG, SGR, and FER was noted after 2 weeks of exposure to 80 mg Cd/kg concentration and after 4 weeks at concentrations above 60 mg Cd/kg.

3.3. Hematological Parameters

After 2 and 4 weeks of exposure to dietary Cd, hematological parameters for P. stellatus were recorded, as detailed in Table 4. A substantial increase in the RBC count was indicated after exposure to 80 mg Cd/kg concentration for both 2 and 4 weeks. Similarly, a notable reduction in the Ht value occurred after exposure to 80 mg Cd/kg concentration for both 2 and 4 weeks. Furthermore, the Hb concentration showed a considerable decrease after exposure to concentrations of 80 mg Cd/kg for both 2 and 4 weeks.

3.4. Plasma Components

After exposure to dietary Cd for 2 and 4 weeks, blood plasma components for P. stellatus were recorded, as demonstrated in Table 4. Glucose levels were considerably elevated after exposure to concentrations above 60 mg Cd/kg for both 2 and 4 weeks, while the total protein notably decreased after 2 weeks at 80 mg Cd/kg concentration. Additionally, a remarkable reduction was noted after 4 weeks following exposure to concentrations above 60 mg Cd/kg. Moreover, there were considerable increases in both GOT and GPT after exposure to concentrations of 80 mg Cd/kg for both 2 and 4 weeks.

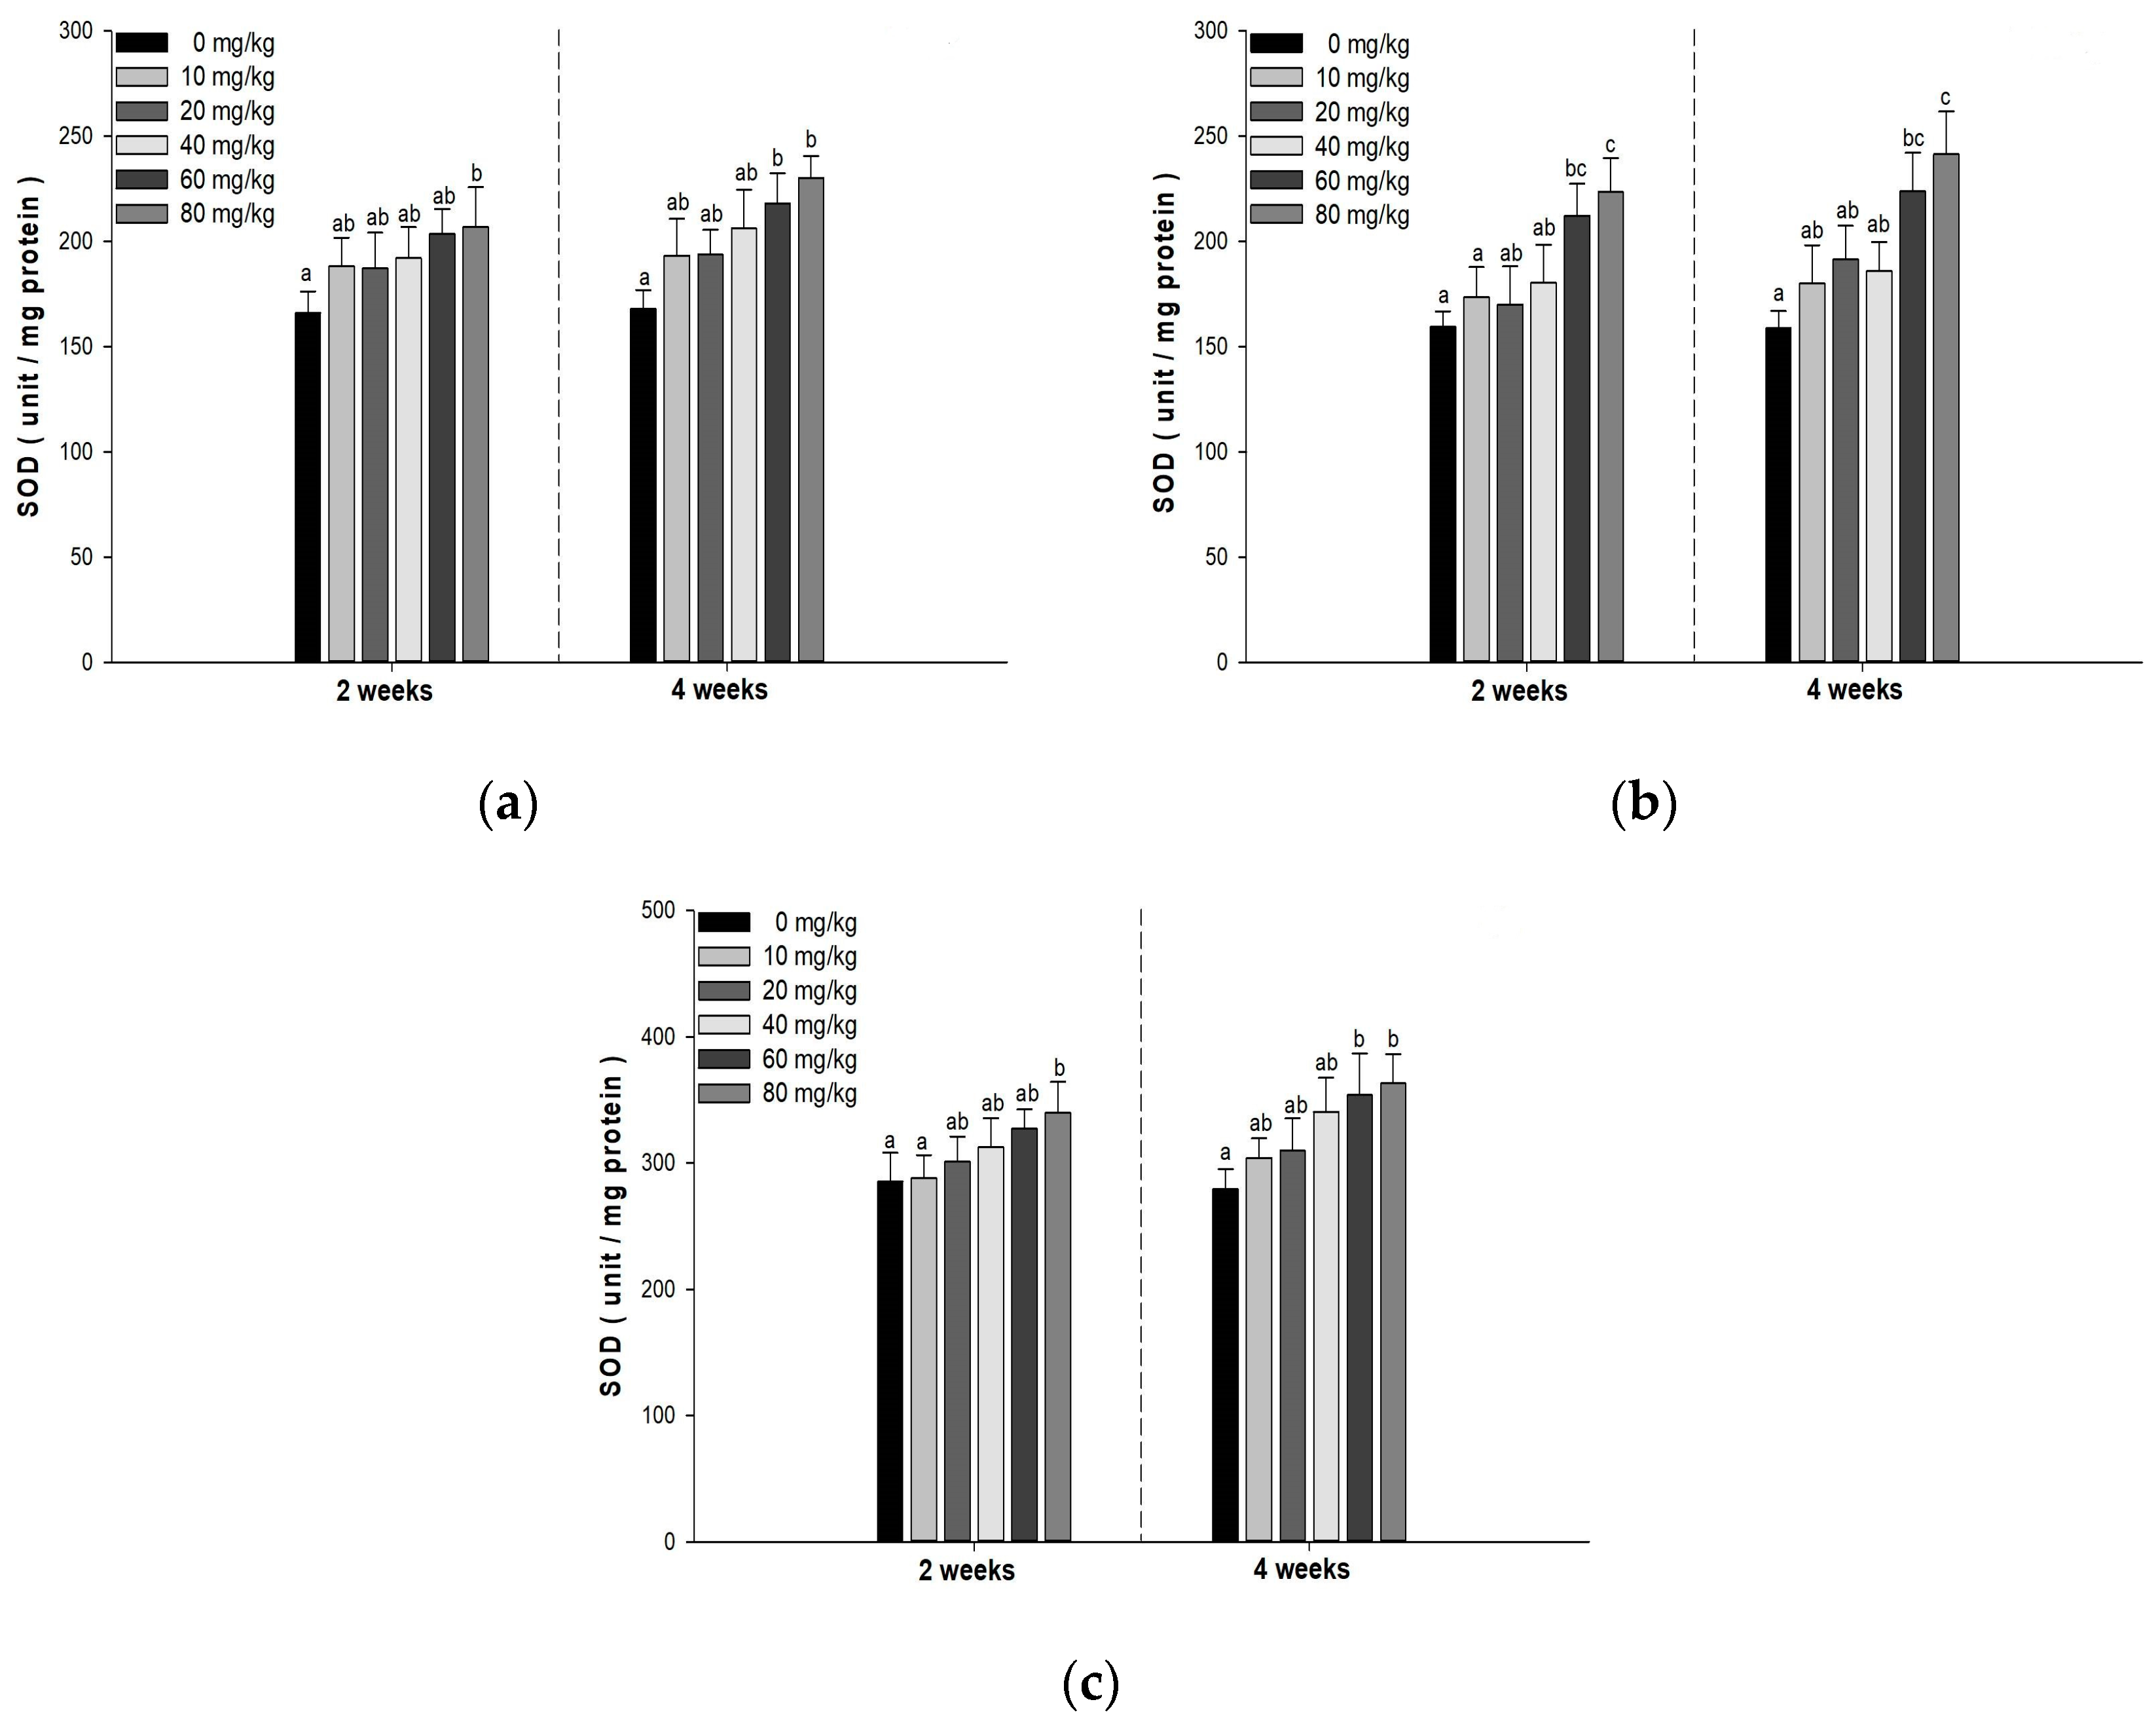
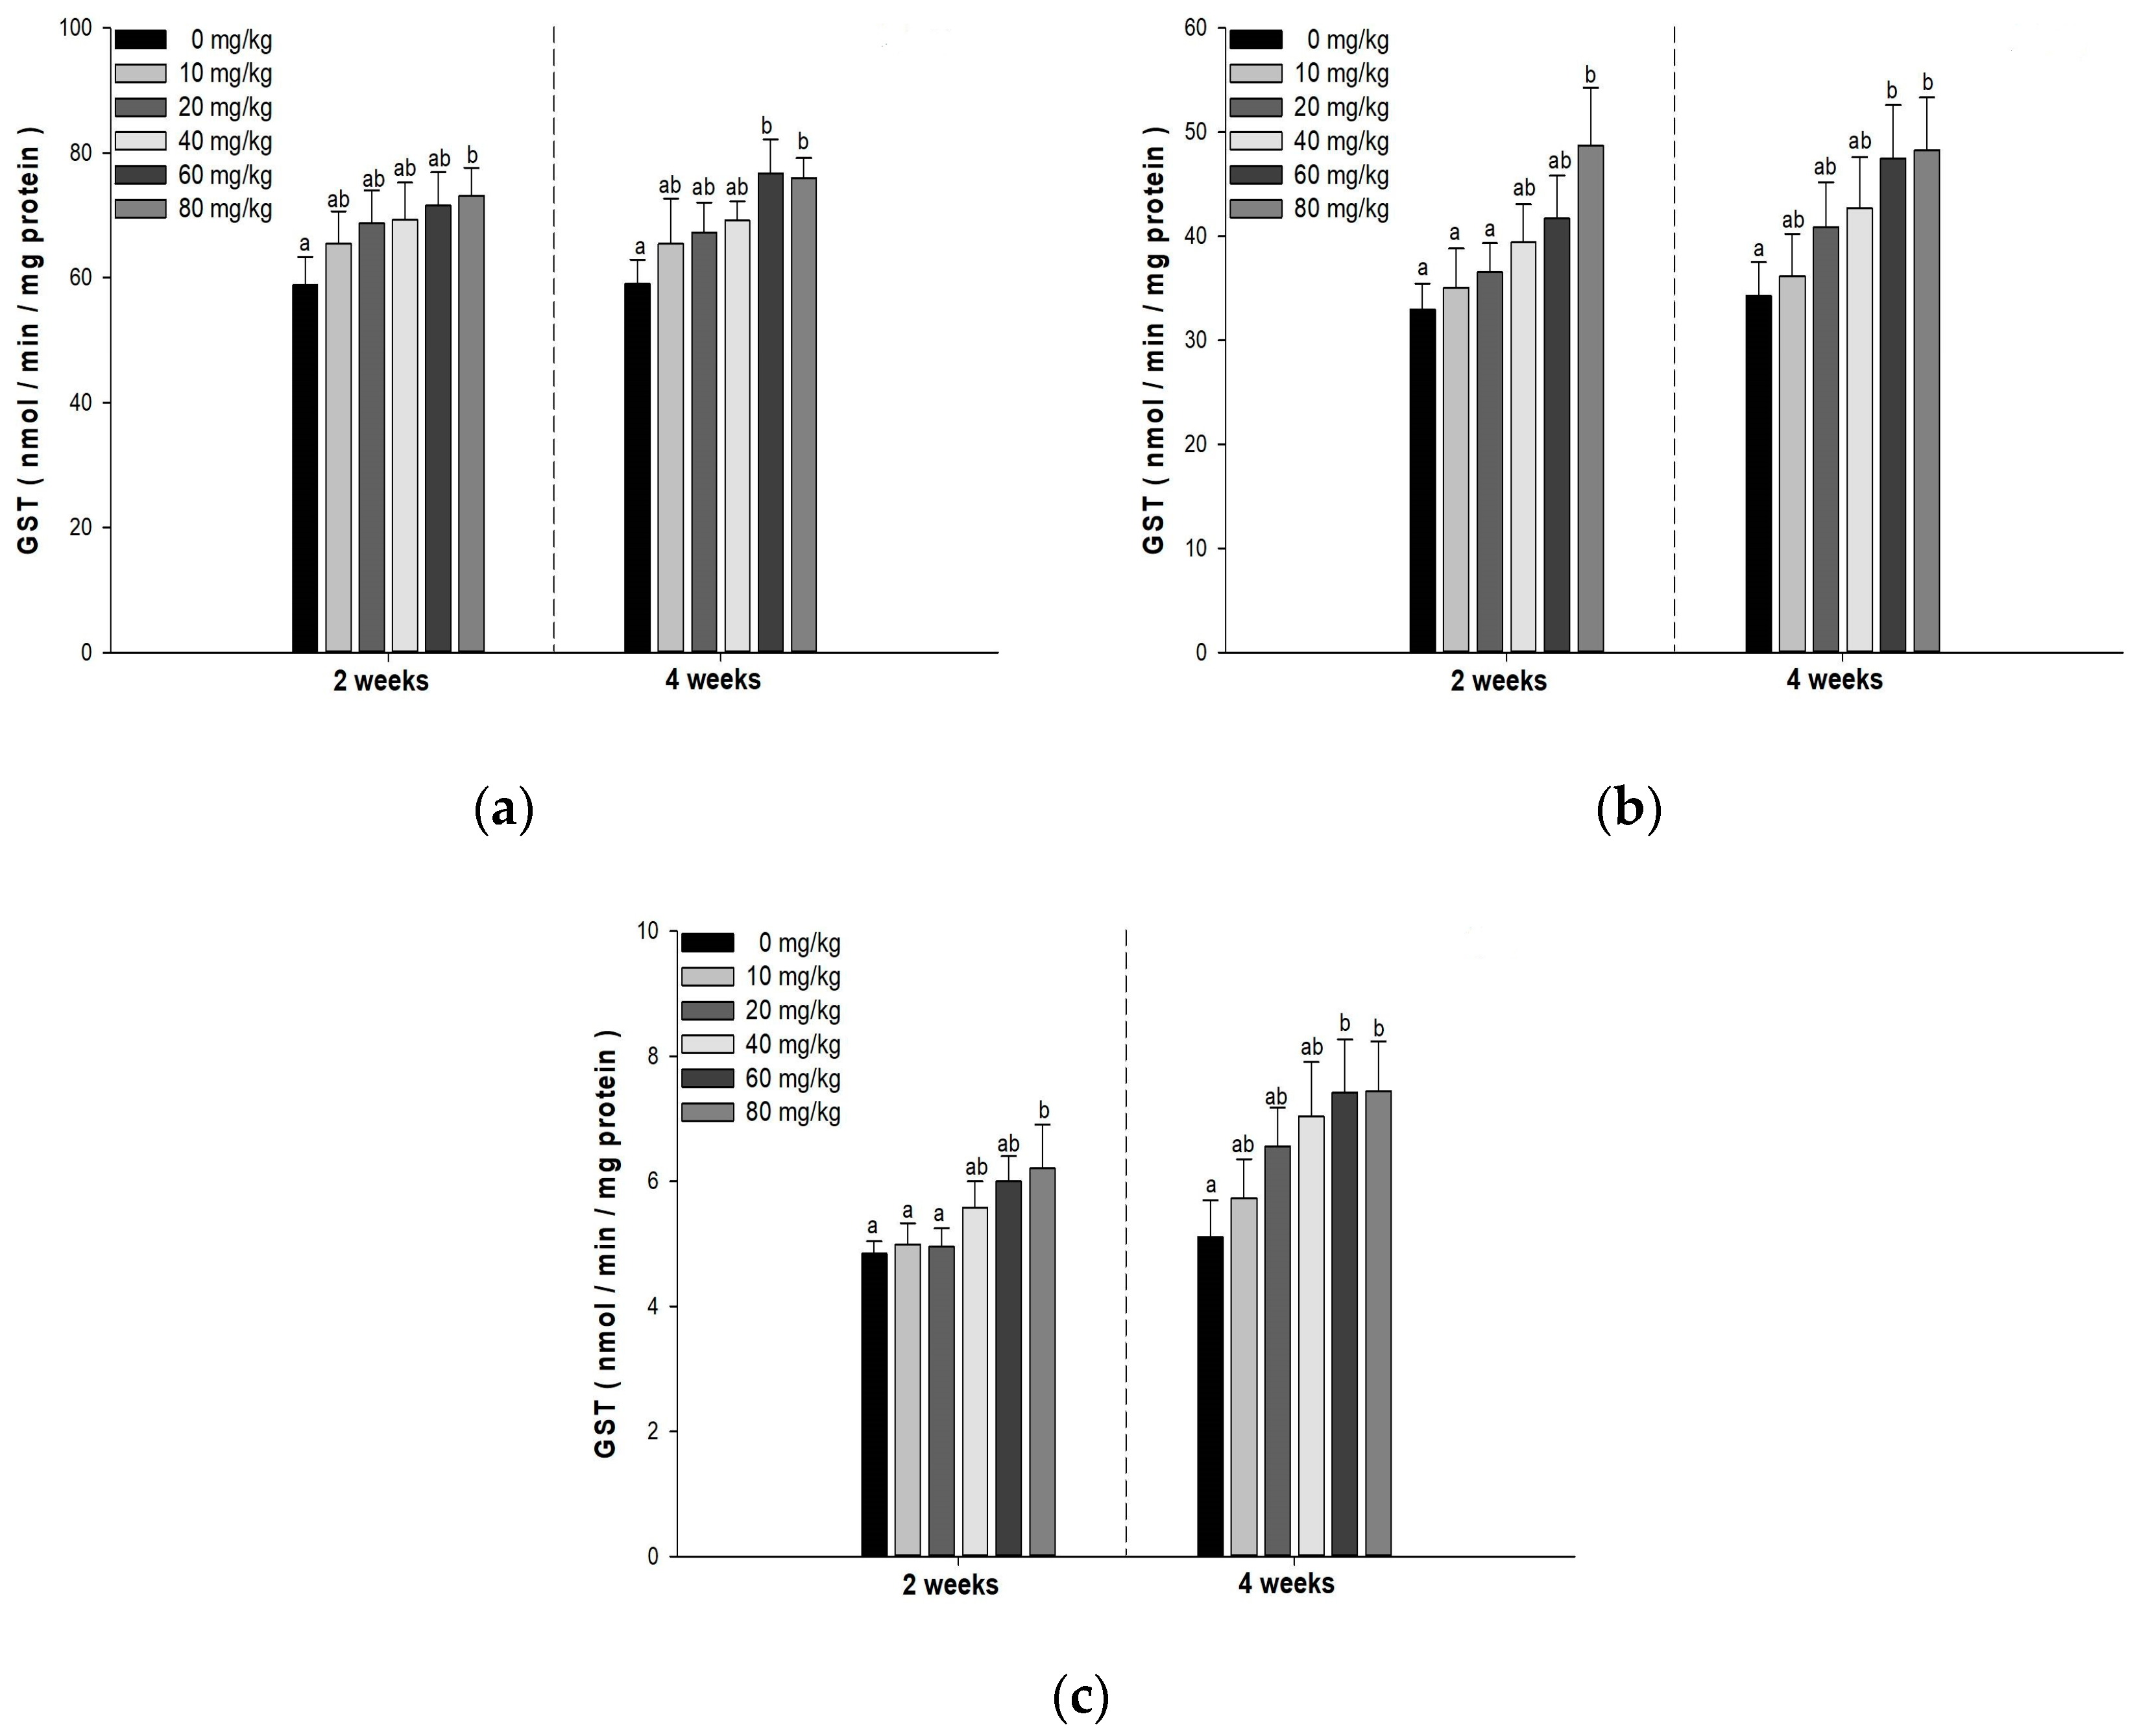
3.5. Antioxidant Responses

Figure 2, Figure 3, Figure 4 and Figure 5 demonstrate antioxidant responses in the liver, kidney, and gill of P. stellatus after 2 and 4 weeks of exposure to dietary Cd. After exposure to concentrations of 80 mg Cd/kg for 2 weeks, there was a remarkable elevation in SOD activity in the liver and gill. Additionally, it also led to a notable elevation in SOD activity in the liver and gills at concentrations above 60 mg Cd/kg for 4 weeks. In the kidney, a considerable elevation was noted at 2 and 4 weeks at concentrations above 60 mg Cd/kg. CAT activity in the liver and kidney elevated remarkably after exposure to 80 mg Cd/kg concentration for 2 weeks and after 4 weeks at concentrations above 60 mg Cd/kg. In the gills, a remarkable increase was indicated after exposure to 80 mg Cd/kg concentrations for 2 and 4 weeks. GST activity in the liver, kidney, and gills indicated a notable increase after exposure at 80 mg Cd/kg concentration for 2 weeks and after 4 weeks at concentrations above 60 mg Cd/kg. GSH levels showed a notable elevation in the liver and gills after 2 and 4 weeks of exposure to concentrations of 80 mg Cd/kg. Notably, in the kidney, GSH levels considerably increased after exposure to concentrations of 80 mg Cd/kg for 2 weeks and above 60 mg Cd/kg for 4 weeks.

4. Discussion

The growth of aquatic animals hinges on multiple factors encompassing their interaction with energy intake (dietary), utilization (metabolic and stress-related processes), loss (excreta), and various physiological functions (e.g., digestion, assimilation, respiration, and excretion) [25]. Metrics reflecting growth performance, such as BWG, SGR, and FER, are profoundly influenced by environmental conditions and play a critical role in assessing metabolic, nutritional, and health status amid environmental stressors [25]. Among these stressors, exposure to metals disrupts metabolism and physiological functions, leading to impaired growth performance [26]. In the current study, the exposure of P. stellatus to 80 mg Cd/kg caused notable declines in BWG, SGR, and FER. These declines could be attributed to increased metabolic energy demands for detoxification and/or reduced feed intake induced by Cd toxicity. In line with our findings, numerous studies have documented the detrimental impacts of Cd exposure on growth performance. In [22], the authors reported substantial reductions in BWG and SGR in Nile tilapia, Oreochromis niloticus, after exposure to a 10 g/kg Cd concentration, indicating reduced dietary intake impacted by Cd exposure and heightened energy requirements for detoxification. Similarly, [23] observed marked decreases in BWG and SGR in yellow catfish, Pelteobagrus fulvidraco, subsequent to Cd exposure at 50 μg/L and 200 μg/L concentrations, suggesting the inhibition of digestive activities like lipase and amylase in P. fulvidraco due to Cd exposure.
Metal accumulation patterns depend on the organism (e.g., fish species, tissue-specific bioavailability, uptake, and elimination rates), metal factors (e.g., exposure route, periods of exposure, and concentrations), and environmental factors (e.g., pH, salinity, and temperature) [6,27]. In the present study, P. stellatus exhibited the following Cd accumulation pattern: intestine > kidney > liver > gills. The uptake of Cd initially occurs in the intestine, and Cd diffuses from the intestinal tissues to other organs via membrane transporters, transporter proteins, or channels associated with essential elements, including calcium, copper, iron, and zinc, resulting in increased accumulation in the intestine [28]. In response to metal exposure, the liver and kidneys function as primary tissues for metal accumulation, given their crucial roles in excretion and detoxification [29]. The liver produces metallothionein (MT), which binds to divalent cations such as Cd, and the Cd-MT complex is subsequently redistributed to the kidney. Upon reaching the kidney, proteases break down the Cd-MT complexes and release Cd, leading to a substantial contribution to Cd accumulation in the kidney [30]. Consistent with the results of this study, similar patterns of Cd accumulation resulting from dietary exposure have been noted in other fish species, such as the discus fish Symphysodon sp. [31] and the juvenile rockfish Sebastes schlegelii [29].
Given their high sensitivity to metal toxicity, hematological parameters are valuable indicators for evaluating fish health in response to metal exposure [32]. Cd exposure can reduce hematological parameters by damaging erythrocytes and hemoglobin, consequently diminishing the ability to transport oxygen to tissues, resulting in severe anemia [33,34]. In this study, exposure to 80 mg Cd/kg induced a notable decline in RBC counts, Hb concentrations, and Ht values of P. stellatus, suggesting that Cd might induce the destruction of erythrocytes and hemoglobin and is considered to have caused anemia in the fish. Similarly, reductions in RBC counts, Hb concentrations, and Ht values were noted in Nile tilapia, O. niloticus, and silver catfish, Rhamdia quelen, exposed to Cd. This reduction could be attributed to the destruction of mature erythrocytes and the suppression of their production [6,35].
Plasma glucose levels in fish serve as indicators reflecting carbohydrate metabolism and can surge in response to the increased energy demand when counteracting environmental stress [36]. The exposure of fish to Cd disrupts insulin secretion and hampers glucose transport, leading to hyperglycemia and an imbalance in glucose homeostasis [37,38]. In this study, significant elevations in plasma glucose levels in P. stellatus were noted after exposure to 60 and 80 mg Cd/kg. This increase could be attributed to the heightened energy demand triggered by Cd-related stress and Cd’s interference with glucose metabolism. Consistent with these findings, [39] observed a considerable rise in glucose levels in gibel carp, Carassius gibelio, exposed to Cd due to Cd-induced stress. Additionally, [32] suggested that Cd exposure induces elevated glucose levels in olive flounder Paralichthys olivaceus, potentially stemming from disruptions in glucose homeostasis and metabolic disorders induced by Cd toxicity.
Proteins are essential for cellular metabolism and significantly contribute to the structure and operation of cells [40]. Proteins and glucose serve as energy sources and are used to meet increased energy demands under stressful conditions [41]. Cadmium exposure causes hypoproteinemia by destroying the subcellular structures involved in protein synthesis and suppressing the hepatic production of blood proteins [6]. In this study, markedly reduced levels of total protein concentrations were found in P. stellatus after exposure to dietary Cd, indicating that proteins were converted into energy to cope with the increased energy requirements and/or that Cd toxicity might disrupt homeostasis. A similar result was observed for the total proteins in yellowfin seabream, Acanthopagrus latus, exposed to Cd. This suggests that Cd-induced liver damage caused by Cd leads to decreased protein synthesis and increased protein loss [40].
GOT and GPT are pivotal for amino acid and protein metabolic processes and serve as indicators of liver damage and dysfunction. When liver cells are damaged by environmental pollutants, the release of these enzymes into the bloodstream occurs [32]. In this study, plasma GOT and GPT were considerably elevated in P. stellatus exposed to dietary Cd, indicating that Cd exposure may induce liver damage and disrupt the processing of amino acids and proteins in metabolic pathways. Consistent with the results of this study, increased levels of GOT and GPT resulting from exposure to Cd have been documented in other fish varieties, including P. olivaceus [32] and catfish species, such as Clarias gariepinus [42,43]. These findings suggest that Cd exposure contributes to liver injury by causing changes in GOT and GPT levels, thereby affecting the physiological and metabolic activities.
Oxidative stress arises from a disturbance in the homeostasis between the generation of reactive oxygen species (ROS) and antioxidant capacity. This imbalance leads to damage to DNA, proteins, and cellular membranes [44]. Antioxidant systems have a vital role in neutralizing surplus ROS, and assessing antioxidant responses is a pivotal measure of oxidative stress [45]. SOD facilitates the transformation of O2•- to H2O2; subsequently, CAT converts H2O2 into H2O and O2 [44,46]. In this study, SOD and CAT activities were considerably elevated in the gills, liver, and kidneys of P. stellatus after exposure to dietary Cd, which may be due to the neutralization for the overproduction of ROS resulting from Cd toxicity. Similar to this study, refs. [47] and [48] suggested that Cd toxicity induces an elevation in SOD and CAT activities in the liver of zebra blenny, Salaria basilisca, and in the gills of the rare minnow Gobiocypris rarus. They suggested that the elevated SOD and CAT activities were responses to the excessive generation of ROS triggered by Cd toxicity, and [32] suggested that Cd toxicity significantly increases SOD and CAT activities in the liver and gills of P. olivaceus. Elevated SOD activity is related to an antioxidant mechanism that copes with excessive ROS production, and CAT activity is related to an increase in H2O2 produced by SOD activity.
GST represents a group of phase II detoxification enzymes that are crucial for cellular protective mechanisms [49]. GST facilitates the conjugation of GSH to endogenous (e.g., metabolites within cells) and exogenous (e.g., drugs, metals, and pesticides) materials, thereby facilitating their elimination [32]. GSH consists of cysteine, glutamic acid, and glycine, which predominantly reside intracellularly and contribute to enzymatic activity and protein synthesis [50]. GSH also safeguards cells from ROS damage caused by metal toxicity because it exhibits a strong attraction to metals such as cadmium, mercury, and lead, forming bonds with the -SH group of cysteine [50]. After exposure to dietary Cd, GST activity and GSH levels in P. stellatus were notably elevated, indicating that Cd-induced an imbalance between ROS and antioxidants. Elevated GST activity and GSH levels may protect cells against Cd-induced oxidative stress. Similar to the results of this study, GST activity and GSH levels in the liver of O. niloticus L. were significantly elevated after exposure to Cd. This increase could be due to the chelation of Cd cations and detoxification of ROS [51]. Increased GST activity in the liver, kidney, and gills has been observed in Channa punctatus exposed to Cd, and these results might be ascribed to the conjugations associated with detoxification phase II [52]. Significantly elevated GSH levels are observed in the liver of Cyprinus carpio var. color exposed to Cd. This suggests that GSH is an initial defense mechanism against oxidative stress, thereby mitigating Cd toxicity [53].

5. Conclusions

Our findings demonstrate that the accumulation pattern of Cd in P. stellatus is influenced by various factors, including exposure pathways, concentrations, the duration of exposure, and tissue-specific bioavailability. Furthermore, exposure to dietary Cd levels exceeding 60 mg Cd/kg led to significant changes in the growth performance, hematological parameters, plasma components, and antioxidant responses of P. stellatus. Consequently, dietary exposure to Cd may prompt energy imbalances, metabolic disruptions, and oxidative stress in P. stellatus. These effects are expected to differ based on the dietary habits and habitat environments of the fish species. Therefore, research on dietary Cd toxicity effects is deemed necessary for various fish species, considering the potential differences in their diets and habitats.

Author Contributions

H.-C.J.: Conceptualization, validation, investigation, data curation, writing—original draft preparation, visualization. J.-H.K.: methodology, writing—review and editing, supervision. J.-C.K.: methodology, writing—review and editing, supervision, funding acquisition. All authors have read and agreed to the published version of the manuscript.

Funding

This research was funded by a Research Grant of Pukyong National University (2023).

Institutional Review Board Statement

In this study, the guidelines dictated by the Institutional Animal Care and Use Committee of Pukyong National University were followed during all experimental procedures. Permission No. PKNUIACUC-2023-26.

Data Availability Statement

Data will be made available on request.

Acknowledgments

This work was supported by a Research Grant of Pukyong National University (2023).

Conflicts of Interest

The authors declare no conflicts of interest. The funders had no role in the design of the study; in the collection, analyses, or interpretation of data; in the writing of the manuscript; or in the decision to publish the results.

References

  1. Kumar, P.; Singh, A. Cadmium toxicity in fish: An overview. GERF Bull. Biosci. 2010, 1, 41–47. [Google Scholar]
  2. Zhang, H.; Reynolds, M. Cadmium exposure in living organisms: A short review. Sci. Total Environ. 2019, 678, 761–767. [Google Scholar] [CrossRef]
  3. Lee, J.W.; Choi, H.; Hwang, U.K.; Kang, J.C.; Kang, Y.J.; Kim, K.I.; Kim, J.H. Toxic effects of lead exposure on bioaccumulation, oxidative stress, neurotoxicity, and immune responses in fish: A review. Environ. Toxicol. Pharmacol. 2019, 68, 101–108. [Google Scholar] [CrossRef]
  4. Tewari, S.; Bajpai, S.; Tripathi, M. Effect of cadmium on glycogen content in muscle, liver, gill and kidney tissues of freshwater fish Channa punctatus (Bloch). J. Appl. Nat. Sci. 2019, 11, 575–580. [Google Scholar] [CrossRef]
  5. Luo, W.; Wang, D.; Xu, Z.; Liao, G.; Chen, D.; Huang, X.; Wang, Y.; Yang, S.; Zhao, L.; Huang, H.; et al. Effects of cadmium pollution on the safety of rice and fish in a rice-fish coculture system. Environ. Int. 2020, 143, 105898. [Google Scholar] [CrossRef]
  6. Al-Asgah, N.A.; Abdel-Warith, A.W.; Younis el, S.M.; Allam, H.Y. Haematological and biochemical parameters and tissue accumulations of cadmium in Oreochromis niloticus exposed to various concentrations of cadmium chloride. Saudi J. Biol. Sci. 2015, 22, 543–550. [Google Scholar] [CrossRef] [PubMed]
  7. Yeşilbudak, B.; Erdem, C. Cadmium accumulation in gill, liver, kidney and muscle tissues of common carp, Cyprinus carpio, and Nile tilapia, Oreochromis niloticus. Bull. Environ. Contam. Toxicol. 2014, 92, 546–550. [Google Scholar] [CrossRef]
  8. Demchenkov, E.L.; Nagdalian, A.A.; Budkevich, R.O.; Oboturova, N.P.; Okolelova, A.I. Usage of atomic force microscopy for detection of the damaging effect of CdCl(2) on red blood cells membrane. Ecotoxicol. Environ. Saf. 2021, 208, 111683. [Google Scholar] [CrossRef]
  9. Nazima, B.; Manoharan, V.; Miltonprabu, S. Oxidative stress induced by cadmium in the plasma, erythrocytes and lymphocytes of rats: Attenuation by grape seed proanthocyanidins. Hum. Exp. Toxicol. 2016, 35, 428–447. [Google Scholar] [CrossRef] [PubMed]
  10. Witeska, M.; Kondera, E.; Szczygielska, K. The Effects of Cadmium on Common Carp Erythrocyte Morphology. Pol. J. Environ. Stud. 2011, 20, 783–788. [Google Scholar]
  11. Choong, G.; Liu, Y.; Templeton, D.M. Interplay of calcium and cadmium in mediating cadmium toxicity. Chem. Biol. Interact. 2014, 211, 54–65. [Google Scholar] [CrossRef] [PubMed]
  12. McRae, N.K.; Gaw, S.; Glover, C.N. Effects of waterborne cadmium on metabolic rate, oxidative stress, and ion regulation in the freshwater fish, inanga (Galaxias maculatus). Aquat. Toxicol. 2018, 194, 1–9. [Google Scholar] [CrossRef] [PubMed]
  13. Sobha, K.; Poornima, A.; Harini, P.; Veeraiah, K. A study on biochemical changes in the fresh water fish, Catla catla (Hamilton) exposed to the heavy metal toxicant cadmium chloride. Kathmandu Univ. J. Sci. Eng. Technol. 2007, 1, 1–11. [Google Scholar] [CrossRef]
  14. Nair, A.R.; Degheselle, O.; Smeets, K.; Van Kerkhove, E.; Cuypers, A. Cadmium-Induced Pathologies: Where is the Oxidative Balance Lost (or Not)? Int. J. Mol. Sci. 2013, 14, 6116–6143. [Google Scholar] [CrossRef] [PubMed]
  15. Okoye, C.N.; MacDonald-Jay, N.; Kamunde, C. Effects of bioenergetics, temperature and cadmium on liver mitochondria reactive oxygen species production and consumption. Aquat. Toxicol. 2019, 214, 105264. [Google Scholar] [CrossRef] [PubMed]
  16. Zhu, Q.L.; Li, W.Y.; Zheng, J.L. Life-cycle exposure to cadmium induced compensatory responses towards oxidative stress in the liver of female zebrafish. Chemosphere 2018, 210, 949–957. [Google Scholar] [CrossRef]
  17. Kim, J.H.; Kang, J.C. Effects of sub-chronic exposure to lead (Pb) and ascorbic acid in juvenile rockfish: Antioxidant responses, MT gene expression, and neurotransmitters. Chemosphere 2017, 171, 520–527. [Google Scholar] [CrossRef]
  18. KOSTAT (Statistics Korea). Agriculture & Fishery Products, KOSTAT. 2019. Available online: https://kostat.go.kr/board.es?mid=a20102080000bid=11715 (accessed on 26 March 2020).
  19. Ahn, J.-J. The small octopus cadmium shock and risk communication. J. Environ. Health Sci. 2010, 36, 435–439. [Google Scholar] [CrossRef]
  20. Kim, D.-Y.; Jeon, H.; Shin, H.-S. Risk Assessment and Determination of Arsenic and Heavy Metals in Fishery Products in Korea. Foods 2023, 12, 3750. [Google Scholar] [CrossRef]
  21. Liu, Q.; Liao, Y.; Shou, L. Concentration and potential health risk of heavy metals in seafoods collected from Sanmen Bay and its adjacent areas, China. Mar. Pollut. Bull. 2018, 131, 356–364. [Google Scholar] [CrossRef]
  22. Abdel-Tawwab, M.; Wafeek, M. Influence of water temperature and waterborne cadmium toxicity on growth performance and metallothionein-cadmium distribution in different organs of Nile tilapia, Oreochromis niloticus (L.). J. Therm. Biol. 2014, 45, 157–162. [Google Scholar] [CrossRef]
  23. Xie, D.; Li, Y.; Liu, Z.; Chen, Q. Inhibitory effect of cadmium exposure on digestive activity, antioxidant capacity and immune defense in the intestine of yellow catfish (Pelteobagrus fulvidraco). Comp. Biochem. Physiol. C Toxicol. Pharmacol. 2019, 222, 65–73. [Google Scholar] [CrossRef]
  24. Okorie, O.E.; Bae, J.Y.; Lee, J.H.; Lee, S.; Park, G.H.; Mohseni, M.; Bai, S.C. Effects of Different Dietary Cadmium Levels on Growth and Tissue Cadmium Content in Juvenile Parrotfish, Oplegnathus fasciatus. Asian-Australas. J. Anim. Sci. 2014, 27, 62–68. [Google Scholar] [CrossRef] [PubMed]
  25. Ferrari, L.; Eissa, B.L.; Salibián, A. Energy balance of juvenile Cyprinus carpio after a short-term exposure to sublethal water-borne cadmium. Fish. Physiol. Biochem. 2011, 37, 853–862. [Google Scholar] [CrossRef]
  26. Gandar, A.; Jean, S.; Canal, J.; Marty-Gasset, N.; Gilbert, F.; Laffaille, P. Multistress effects on goldfish (Carassius auratus) behavior and metabolism. Environ. Sci. Pollut. Res. Int. 2016, 23, 3184–3194. [Google Scholar] [CrossRef]
  27. Moiseenko, T.; Gashkina, N. Distribution and bioaccumulation of heavy metals (Hg, Cd and Pb) in fish: Influence of the aquatic environment and climate. Environ. Res. Lett. 2020, 15, 115013. [Google Scholar] [CrossRef]
  28. Le Croizier, G.; Lacroix, C.; Artigaud, S.; Le Floch, S.; Raffray, J.; Penicaud, V.; Coquillé, V.; Autier, J.; Rouget, M.L.; Le Bayon, N.; et al. Significance of metallothioneins in differential cadmium accumulation kinetics between two marine fish species. Environ. Pollut. 2018, 236, 462–476. [Google Scholar] [CrossRef]
  29. Kim, S.G.; Eom, K.H.; Kim, S.S.; Jin, H.G.; Kang, J.C. Kinetics of Cd accumulation and elimination in tissues of juvenile rockfish (Sebastes schlegeli) exposed to dietary Cd. Mar. Environ. Res. 2006, 62, 327–340. [Google Scholar] [CrossRef]
  30. Asagba, S.O.; Eriyamremu, G.E.; Igberaese, M.E. Bioaccumulation of cadmium and its biochemical effect on selected tissues of the catfish (Clarias gariepinus). Fish. Physiol. Biochem. 2008, 34, 61–69. [Google Scholar] [CrossRef] [PubMed]
  31. Maunder, R.J.; Buckley, J.; Val, A.L.; Sloman, K.A. Accumulation of dietary and aqueous cadmium into the epidermal mucus of the discus fish Symphysodon sp. Aquat. Toxicol. 2011, 103, 205–212. [Google Scholar] [CrossRef] [PubMed]
  32. Lee, D.C.; Choi, Y.J.; Kim, J.H. Toxic effects of waterborne cadmium exposure on hematological parameters, oxidative stress, neurotoxicity, and heat shock protein 70 in juvenile olive flounder, Paralichthysolivaceus. Fish. Shellfish. Immunol. 2022, 122, 476–483. [Google Scholar] [CrossRef]
  33. Ovie, K.-S.; Ikomi, U. Alterations in some haematological parameters of the African Snakehead: Parachanna africans exposed to cadmium. Not. Sci. Biol. 2011, 3, 29–34. [Google Scholar] [CrossRef]
  34. Ahmed, I.; Zakiya, A.; Fazio, F. Effects of aquatic heavy metal intoxication on the level of hematocrit and hemoglobin in fishes: A review. Front. Environ. Sci. 2022, 10, 919204. [Google Scholar] [CrossRef]
  35. Pereira, L.S.; Ribas, J.L.; Vicari, T.; Silva, S.B.; Stival, J.; Baldan, A.P.; Valdez Domingos, F.X.; Grassi, M.T.; Cestari, M.M.; Silva de Assis, H.C. Effects of ecologically relevant concentrations of cadmium in a freshwater fish. Ecotoxicol. Environ. Saf. 2016, 130, 29–36. [Google Scholar] [CrossRef] [PubMed]
  36. Mukherjee, M.; Moniruzzaman, M.; Ghosal, I.; Pegu, T.; Das, D.N.; Chakraborty, S.B. Evaluating the role of dietary plant extracts to allow adaptation to thermal stress in a cold stream ornamental fish, Botia rostrata (Günther, 1868). J Therm Biol 2022, 105, 103224. [Google Scholar] [CrossRef] [PubMed]
  37. Edwards, J.R.; Prozialeck, W.C. Cadmium, diabetes and chronic kidney disease. Toxicol. Appl. Pharmacol. 2009, 238, 289–293. [Google Scholar] [CrossRef] [PubMed]
  38. Fitzgerald, R.; Olsen, A.; Nguyen, J.; Wong, W.; El Muayed, M.; Edwards, J. Pancreatic Islets Accumulate Cadmium in a Rodent Model of Cadmium-Induced Hyperglycemia. Int. J. Mol. Sci. 2020, 22, 360. [Google Scholar] [CrossRef] [PubMed]
  39. Li, H.; Xu, W.; Wu, L.; Dong, B.; Jin, J.; Han, D.; Zhu, X.; Yang, Y.; Liu, H.; Xie, S. Differential regulation of endoplasmic reticulum stress-induced autophagy and apoptosis in two strains of gibel carp (Carassius gibelio) exposed to acute waterborne cadmium. Aquat. Toxicol. 2021, 231, 105721. [Google Scholar] [CrossRef]
  40. Vaboonian, A.; Movahedinia, A.; Safahieh, A.; Hedayati, A. Serum biochemical changes of yellowfin sea bream (Acanthopagrus latus) in response to sublethal cadmium toxicity. Comp. Clin. Pathol. 2015, 24, 35–39. [Google Scholar] [CrossRef]
  41. Santos, G.; Schrama, J.; Mamauag, R.; Rombout, J.; Verreth, J. Chronic stress impairs performance, energy metabolism and welfare indicators in European seabass (Dicentrarchus labrax): The combined effects of fish crowding and water quality deterioration. Aquaculture 2010, 299, 73–80. [Google Scholar] [CrossRef]
  42. El-Boshy, M.E.-S.; Gadalla, H.A.; El-Hamied, F. Immunological, hematological and biochemical changes induced by short term exposure to cadmium in catfish (Clarias gariepinus). J. Coast. Life Med. 2014, 2, 175–180. [Google Scholar] [CrossRef]
  43. Tabat, J.L.; Jehu, A.; Kogi, E.; Habila, J.D. Sublethal toxicity effects of cadmium (Cd2+) on serum biochemistry in fingerlings and juveniles of fresh water catfish, Clarias gariepinus (Burchell, 1822). Int. J. Fish. Aquat. Stud. 2021, 9, 1–6. [Google Scholar]
  44. Biller, J.D.; Takahashi, L.S. Oxidative stress and fish immune system: Phagocytosis and leukocyte respiratory burst activity. An. Acad. Bras. Cienc. 2018, 90, 3403–3414. [Google Scholar] [CrossRef]
  45. Regoli, F.; Giuliani, M.E. Oxidative pathways of chemical toxicity and oxidative stress biomarkers in marine organisms. Mar. Environ. Res. 2014, 93, 106–117. [Google Scholar] [CrossRef]
  46. Hoseinifar, S.H.; Yousefi, S.; Van Doan, H.; Ashouri, G.; Gioacchini, G.; Maradonna, F.; Carnevali, O. Oxidative stress and antioxidant defense in fish: The implications of probiotic, prebiotic, and synbiotics. Rev. Fish. Sci. Aquac. 2020, 29, 198–217. [Google Scholar] [CrossRef]
  47. Messaoudi, I.; Barhoumi, S.; Saïd, K.; Kerken, A. Study on the sensitivity to cadmium of marine fish Salaria basilisca (Pisces: Blennidae). J. Environ. Sci. 2009, 21, 1620–1624. [Google Scholar] [CrossRef] [PubMed]
  48. Wu, L.; Yu, Q.; Zhang, G.; Wu, F.; Zhang, Y.; Yuan, C.; Zhang, T.; Wang, Z. Single and combined exposures of waterborne Cu and Cd induced oxidative stress responses and tissue injury in female rare minnow (Gobiocypris rarus). Comp. Biochem. Physiol. C Toxicol. Pharmacol. 2019, 222, 90–99. [Google Scholar] [CrossRef] [PubMed]
  49. Hellou, J.; Ross, N.W.; Moon, T.W. Glutathione, glutathione S-transferase, and glutathione conjugates, complementary markers of oxidative stress in aquatic biota. Environ. Sci. Pollut. Res. Int. 2012, 19, 2007–2023. [Google Scholar] [CrossRef] [PubMed]
  50. Srikanth, K.; Pereira, E.; Duarte, A.C.; Ahmad, I. Glutathione and its dependent enzymes’ modulatory responses to toxic metals and metalloids in fish—A review. Environ. Sci. Pollut. Res. Int. 2013, 20, 2133–2149. [Google Scholar] [CrossRef] [PubMed]
  51. El-Gazzar, A.M.; Ashry, K.E.; El-Sayed, Y.S. Physiological and Oxidative Stress Biomarkers in the Freshwater Nile Tilapia, Oreochromis niloticus L., exposed to sublethal doses of cadmium. Alex. J. Vet. Sci. 2014, 40, 29–43. [Google Scholar] [CrossRef]
  52. Dabas, A.; Nagpure, N.S.; Kumar, R.; Kushwaha, B.; Kumar, P.; Lakra, W.S. Assessment of tissue-specific effect of cadmium on antioxidant defense system and lipid peroxidation in freshwater murrel, Channa punctatus. Fish. Physiol. Biochem. 2012, 38, 469–482. [Google Scholar] [CrossRef] [PubMed]
  53. Jia, X.; Zhang, H.; Liu, X. Low levels of cadmium exposure induce DNA damage and oxidative stress in the liver of Oujiang colored common carp Cyprinus carpio var. color. Fish. Physiol. Biochem. 2011, 37, 97–103. [Google Scholar] [CrossRef] [PubMed]
Figure 1. The levels of Cd accumulation in the liver, kidney, gills, and intestine of P. stellatus were assessed after 2 and 4 weeks of exposure to dietary Cd; (a) liver; (b) kidney; (c) gill; (d) intestine. The data are presented as mean ± standard error (S.E.). Superscript letters not sharing a common letter represent significant differences among groups at 2 and 4 weeks (p < 0.05), as identified using Tukey’s HSD test.
Fishes 09 00059 g001
Figure 2. Superoxide dismutase (SOD) activities in the liver, kidney, and gills of starry flounder, Platichthys stellatus, were assessed after 2 and 4 weeks of exposure to dietary Cd; (a) liver; (b) kidney; (c) gill. The data are presented as mean ± standard error (S.E.). Superscript letters not sharing a common letter represent significant differences among groups at 2 and 4 weeks (p < 0.05), as identified using Tukey’s HSD test.
Fishes 09 00059 g002
Figure 3. Catalase (CAT) activities in the liver, kidney, and gills of starry flounder, Platichthys stellatus, were assessed after 2 and 4 weeks of exposure to dietary Cd; (a) liver; (b) kidney; (c) gill. The data are presented as mean ± standard error (S.E.). Superscript letters not sharing a common letter represent significant differences among groups at 2 and 4 weeks (p < 0.05), as identified using Tukey’s HSD test.
Fishes 09 00059 g003
Figure 4. Glutathione-S-transferase (GST) activities in the liver, kidney, and gills of starry flounder, Platichthys stellatus, were assessed after 2 and 4 weeks of exposure to dietary Cd; (a) liver; (b) kidney; (c) gill. The data are presented as mean ± standard error (S.E.). Superscript letters not sharing a common letter represent significant differences among groups at 2 and 4 weeks (p < 0.05), as identified using Tukey’s HSD test.
Fishes 09 00059 g004
Figure 5. Glutathione (GSH) activities in the liver, kidney, and gills of starry flounder, Platichthys stellatus, were assessed after 2 and 4 weeks of exposure to dietary Cd; (a) liver; (b) kidney; (c) gill. The data are presented as mean ± standard error (S.E.). Superscript letters not sharing a common letter represent significant differences among groups at 2 and 4 weeks (p < 0.05), as identified using Tukey’s HSD test.
Fishes 09 00059 g005
Table 1. Feed composition of the experimental diets.
Ingredients (%)Cadmium Concentration (mg/kg)
01020406080
White fish meal 1626262626262
Casein 2101010101010
Dextrin 3202020202020
Fish oil 4222222
Squid liver oil 5222222
Carboxymethylcellulose 6111111
α-Cellulose 60.20.180.160.120.080.04
Vitamin premix 71.21.21.21.21.21.2
Mineral premix 8111111
Cadmium premix 900.020.040.080.120.16
Colin salt 100.50.50.50.50.50.5
Actual Cadmium levels (mg/kg)0.117.6516.5136.8747.3264.14
1 Dajeon Co., Ltd., Pusan, Republic of Korea; 2 The Feed Co., Ltd., Pusan, the Republic of Korea; 3 TS Co., Ltd., Incheon, the Republic of Korea; 4 Sigma Chemical Co., St. Louis, MO, USA; 5 squid liver oil, Sigma, USA; 6 Sigma, USA; 7 Vitamin premix (mg/kg diet): ascorbic acid, 240; dl-calciumpantothenate, 400; choinechloride, 200; inositol, 20; menadione, 2; nicotinamide, 60; pyridoxin·HCl, 44; riboflavin, 36; thiamine mononitrate, 120; dl-a-tocopherolacetate, 60; retinyl acetate, 20,000IU; Biotin, 0.04; folicacide, 6; vitamin B12, 0.04; and chloecalcifero, 4000IU. 8 Mineral premix (mg/kg): ferrous fumarate, 12.5; dried ferrous sulfate, 20; manganese sulfate, 11.25; dried cupric sulfate. 12.5; cobaltous sulfate, 0.75; zinc sulfate, 13.75; calcium iodate, 0.75; magnesium sulfate, 80.2; aluminum hydroxide, 0.75. 9 Cadmium premix (mg/kg diet): 50,000 mg Cd/kg diet. 10 Kofavet Co., Ltd., Ulsan, the Republic of Korea.
Table 2. The chemical ingredients of seawater and experimental settings applied in the experiments.
ItemValue
Temperature (°C)20.8 ± 1.2
pH8.0 ± 0.6
Salinity (‰)32.9 ± 1.1
Dissolved Oxygen (mg/L)7.2 ± 0.4
Chemical Oxygen Demand (mg/L)1.0 ± 0.4
Ammonia (μg/L)12.1 ± 0.8
Nitrite (μg/L)1.3 ± 0.3
Nitrate (μg/L)11.5 ± 0.9
Table 3. Growth performances of starry flounder, Platichthys stellatus, were assessed after 2 and 4 weeks of exposure to dietary Cd.
Growth PerformancesExposure PeriodCadmium Concentration (mg/kg)
01020406080
BWG (%)2 weeks19.93 ± 1.02 a18.51 ± 1.49 ab18.64 ± 1.66 ab18.31 ± 1.49 ab17.20 ± 1.14 ab16.30 ± 0.93 b
4 weeks29.95 ± 2.75 a24.50 ± 2.52 ab25.18 ± 1.96 ab24.88 ± 2.17 ab23.14 ± 1.11 b22.12 ± 1.60 b
SGR (%)2 weeks1.29 ± 0.08 a1.18 ± 0.08 ab1.20 ± 0.09 ab1.23 ± 0.09 ab1.16 ± 0.05 ab1.06 ± 0.07 b
4 weeks0.92 ± 0.08 a0.76 ± 0.08 ab0.77 ± 0.05 ab0.78 ± 0.06 ab0.73 ± 0.04 b0.67 ± 0.03 b
FER (%)2 weeks71.17 ± 2.22 a66.09 ± 3.04 ab66.56 ± 4.06 ab68.07 ± 2.31 ab65.40 ± 3.60 ab61.44 ± 2.65 b
4 weeks53.47 ± 4.48 a45.57 ± 4.08 ab44.42 ± 3.44 ab43.74 ± 4.07 ab41.31 ± 2.34 b39.51 ± 3.57 b
The data are presented as mean ± standard error (S.E.). Superscript letters not sharing a common letter represent significant differences among groups at 2 and 4 weeks (p < 0.05), as identified using Tukey’s HSD test.
Table 4. Hematological parameters and plasma components of starry flounder, Platichthys stellatus, were assessed after 2 and 4 weeks of exposure to dietary Cd.
Hematological ParametersExposure PeriodCadmium Concentration (mg/kg)
01020406080
RBC count
(×104/mm3)
2 weeks220.0 ± 15.8 a205.4 ± 13.7 ab192.6 ± 11.3 ab197.1 ± 13.1 ab185.1 ± 13.0 ab179.4 ± 9.8 b
4 weeks215.1 ± 19.4 a204.0 ± 18.1 ab190.3 ± 12.4 ab184.6 ± 14.7 ab178.6 ± 11.8 ab164.0 ± 12.3 b
Ht
(%)
2 weeks21.43 ± 0.90 a19.71 ± 1.36 ab18.86 ± 0.88 ab19.14 ± 1.65 ab18.29 ± 0.89 ab17.14 ± 0.99 b
4 weeks20.43 ± 1.69 a18.43 ± 1.44 ab17.57 ± 1.10 ab17.00 ± 1.36 ab17.07 ± 1.14 ab16.43 ± 1.00 b
Hb
(mg/dL)
2 weeks5.73 ± 0.51 a5.53 ± 0.38 ab5.23 ± 0.41 ab5.25 ± 0.25 ab4.80 ± 0.32 ab4.53 ± 0.36 b
4 weeks5.69 ± 0.52 a5.15 ± 0.48 ab4.69 ± 0.37 ab4.73 ± 0.42 ab4.53 ± 0.42 ab4.13 ± 0.39 b
Glucose
(mg/dL)
2 weeks48.39 ± 1.84 a53.89 ± 2.87 ab54.80 ± 2.25 ab53.59 ± 2.04 ab55.20 ± 3.05 b55.13 ± 2.34 b
4 weeks47.98 ± 2.07 a54.25 ± 3.06 ab53.85 ± 1.74 ab55.35 ± 2.47 ab57.78 ± 4.10 b61.59 ± 3.42 b
Total protein
(g/dL)
2 weeks4.56 ± 0.20 a4.45 ± 0.13 a4.34 ± 0.18 ab4.39 ± 0.21 ab4.10 ± 0.21 ab3.94 ± 0.15 b
4 weeks4.58 ± 0.14 a4.46 ± 0.15 a4.29 ± 0.22 ab4.16 ± 0.19 ab3.83 ± 0.16 b3.86 ± 0.17 b
GOT
(Karmen/mL)
2 weeks52.43 ± 2.61 a53.29 ± 2.15 ab53.46 ± 2.87 ab55.87 ± 3.22 ab56.83 ± 3.26 ab60.52 ± 2.67 b
4 weeks51.43 ± 2.24 a55.20 ± 2.45 ab57.34 ± 2.73 ab57.15 ± 3.35 ab59.00 ± 3.58 ab62.66 ± 3.37 b
GPT
(Karmen/mL)
2 weeks34.33 ± 2.12 a35.03 ± 1.80 a36.44 ± 1.46 ab36.14 ± 1.17 ab36.63 ± 1.83 b39.95 ± 1.66 b
4 weeks34.54 ± 1.50 a34.97 ± 1.79 a35.30 ± 1.47 a36.95 ± 1.99 ab37.71 ± 1.98 ab40.24 ± 1.52 b
The data are presented as mean ± standard error (S.E.). Superscript letters not sharing a common letter represent significant differences among groups at 2 and 4 weeks (p < 0.05), as identified using Tukey’s HSD test.
Disclaimer/Publisher’s Note: The statements, opinions and data contained in all publications are solely those of the individual author(s) and contributor(s) and not of MDPI and/or the editor(s). MDPI and/or the editor(s) disclaim responsibility for any injury to people or property resulting from any ideas, methods, instructions or products referred to in the content.

