Article

Genetic Characterization of Procambarus clarkii Cultured in Sichuan Province Based on Microsatellite Markers

1
College of Life Sciences, Sichuan Agricultural University, Ya’an 625000, China
2
Department of Aquaculture, Sichuan Agricultural University, Chengdu 611130, China
*
Author to whom correspondence should be addressed.
Fishes 2024, 9(10), 419; https://doi.org/10.3390/fishes9100419
Submission received: 24 August 2024 / Revised: 18 October 2024 / Accepted: 18 October 2024 / Published: 21 October 2024
(This article belongs to the Section Genetics and Biotechnology)

Abstract

The Procambarus clarkii production sector in Sichuan Province, China, is experiencing rapid growth. However, the industry faces significant challenges, including on-farm breeding and the widespread “Catch Big, Keep Small” farming practice, which have led to substantial genetic degradation within P. clarkii populations. Moreover, the uncertainty surrounding the origins of breeding stocks poses an additional obstacle to the local selection and cultivation of high-quality juvenile P. clarkii. With the objective of inferring the genetic lineage of cultivated P. clarkii in Sichuan, twelve microsatellite loci were employed to investigate the genetic characters of six P. clarkii populations from Sichuan and two from Hubei Province, China. The results revealed that the Sichuan populations exhibited higher levels of heterozygosity (Ho = 0.549~0.699, He = 0.547~0.607) and genetic diversity than the Hubei populations (Na = 4.00~5.250, PIC = 0.467~0.535). Notably, the DY population located in northeastern Sichuan showed the highest heterozygosity (Ho = 0.699, He = 0.607) and genetic diversity (Na = 5.250, PIC = 0.535) among the eight populations. Population structure, principal coordinate analysis and clustering analysis illuminated a close genetic relationship between the Qionglai population in Sichuan and the Jianli population in Hubei. Additionally, the remaining five Sichuan populations (Luxian, Nanxi, Xingwen, Neijiang and Daying) exhibited strong genetic affinity with the QianJiang population in Hubei, and particularly high genetic exchange may have occurred between Daying and Qianjiang (Fst = 0.001, Nm = 217.141). These results suggest that the primary cultivated P. clarkii populations in Sichuan likely originated from Qianjiang and Jianli counties in Hubei, with Qianjiang contributing a more substantial proportion. The genetic diversity of Sichuan populations was higher than those of some other Chinese P. clarkii farming provinces and even some native populations. Specifically, the Daying population emerges as a potential breeding germplasm source for crayfish in Sichuan. In contrast, the Qionglai population exhibits relatively low genetic diversity, highlighting the need for strategic enhancement through interactions with other populations to promote diversity and resilience. Furthermore, fostering genetic exchange among locally cultivated populations within the southern Sichuan basin is strategic to elevate the quality of P. clarkii germplasm resources.
Key Contribution: This study investigated the genetic origin of the germplasm from the major P. clarkii breeding sites in Sichuan Province, elucidated their relationship with the seed source in Hubei Province, and assessed their levels of genetic diversity. These findings offer insights into the selection and breeding of P. clarkii in China, thereby facilitating the sustainable development of the P. clarkii industry.

Graphical Abstract

1. Introduction

Procambarus clarkii, commonly known as crayfish or red swamp crayfish, is a species native to North America, specifically the southern United States and northern Mexico [1,2]. Subsequent to its introduction to Hawaii, Europe, Africa and Asia, P. clarkii established a widespread global distribution, becoming one of the most invasive species worldwide. Notwithstanding its ecological impacts, P. clarkii enjoys widespread popularity as a food source owing to its rich nutrient content and distinctive flavor [3,4]. The species was introduced to China from Japan in 1929, and farmers in Hubei Province initiated its cultivation in 1974. In 1983, scientists from the Chinese Academy of Sciences (CAS) championed the development and utilization of P. clarkii, which rapidly spread across the country and became a significant aquaculture species [1,5]. Currently, China is the world’s largest producer and consumer of P. clarkii, with an aquaculture pond area totaling 18,667 square kilometers and a production output of 2.89 million tons in 2022. The provinces of Hubei, Anhui, Hunan, Jiangsu, and Jiangxi stand out as the top five P. clarkii production regions in China [6].
Sichuan Province, located in southwestern China along the upper reaches of the Yangtze River, exhibits a distinct geographical dichotomy, encompassing an eastern basin region and a western terrain characterized by mountainous areas and plateaus [7]. While the P. clarkii breeding industry in Sichuan was initiated relatively recently, it has experienced rapid growth. In recent years, three prominent breeding areas for P. clarkii have emerged: the center urban agglomerations, the southeastern basin, and the northeastern basin of Sichuan. However, due to the rapid expansion of the scale of P. clarkii farming, and the production practice of on-farm propagation and the “catch large, keep small” approach, a relatively high proportion of slow-growing individuals on the farm materializes, and the offspring produced by them might suffer from germplasm degradation, susceptibility to disease, slow growth, small size-at-maturity, and other issues, seriously affecting the yield and quality of P. clarkii, posing a substantial threat to the sustainable development of the P. clarkii industry in the province [6].
The genetic composition and characteristics of germplasm resources hold substantial sway over the breeding potential of cultured species. Comprehensive assessments of a species’ genetic diversity and structure provide valuable insights into its genetic background and the quality of its offspring, which can serve as a valuable reference for designing efficient selective breeding programs [8,9,10]. Thus, investigating, preserving, and safeguarding the genetic resources of P. clarkii is crucial for the vitality and prosperity of its industry. Microsatellite markers, also known as simple sequence repeats (SSRs), represent DNA sequences comprising repetitive motifs of 2~6 nucleotides arranged in tandem arrays [11]. Their ubiquitous utilization in population genetic study stems from their polymorphic nature, the ease of PCR amplification, straightforward detection protocols, and codominant expression [12,13,14,15]. Moreover, these markers have gained traction in P. clarkii research, notably for parentage assignments and genetic character evaluations [16,17,18,19,20]. In the pioneering study, Wang [21] developed 18 SSRs to accurately trace parentage in P. clarkii, achieving a remarkable 94.7% accuracy rate for identifying familial relationships between 15 maternal parents and their 75 offspring. Liu [18] utilized 15 SSRs to elucidate the genetic relationships within and among three P. clarkii aquaculture populations in Chongming, Gaoyou, and Xuancheng, and showed that rich genetic diversity was present in all the populations, as well as that the Chongming and Xuancheng populations shared similar genetic structures. Zhang [20] evaluated the genetic characteristics of five artificially propagated P. clarkii populations scattered across Guangxi province through the use of eight SSRs, and the results revealed that the southern populations exhibited relatively low genetic diversity compared to their central and northern counterparts, emphasizing the necessity for germplasm improvement.
The Provincial Fisheries Bureau of Sichuan Province is currently engaging in substantial endeavors to propel the growth of the P. clarkii industry. However, there have been few reports assessing the genetic diversity of P. clarkii farming populations within the province’s borders, and the provenance of the original breeding stocks remains uncertain. The internal reports of the Sichuan provincial government show that the initial population of P. clarkii in the main aquaculture bases in Sichuan can be traced back to Hubei Province. Hubei was the pioneering province and main production area for P. clarkii in China, ranking first in terms of production and output value in the country for 15 consecutive years. The Qianjiang and Jianli areas are the main production areas in Hubei Province, recognized as the center of Chinese P. clarkii by the Ministry of Agriculture of the People’s Republic of China (MAPRC). The present study has undertaken a comprehensive analysis utilizing a total of 12 SSRs. The objectives of this study are three-fold: (i) to explore the genetic diversity across six major P. clarkii culture sites in Sichuan Province and two in Hubei Province; (ii) to elucidate the ancestral gene pools that underpin P. clarkii stocks cultivated in Sichuan Province; and (iii) to devise effective strategies to foster the sustainable and robust development of the P. clarkii industry within Sichuan Province.

2. Materials and Methods

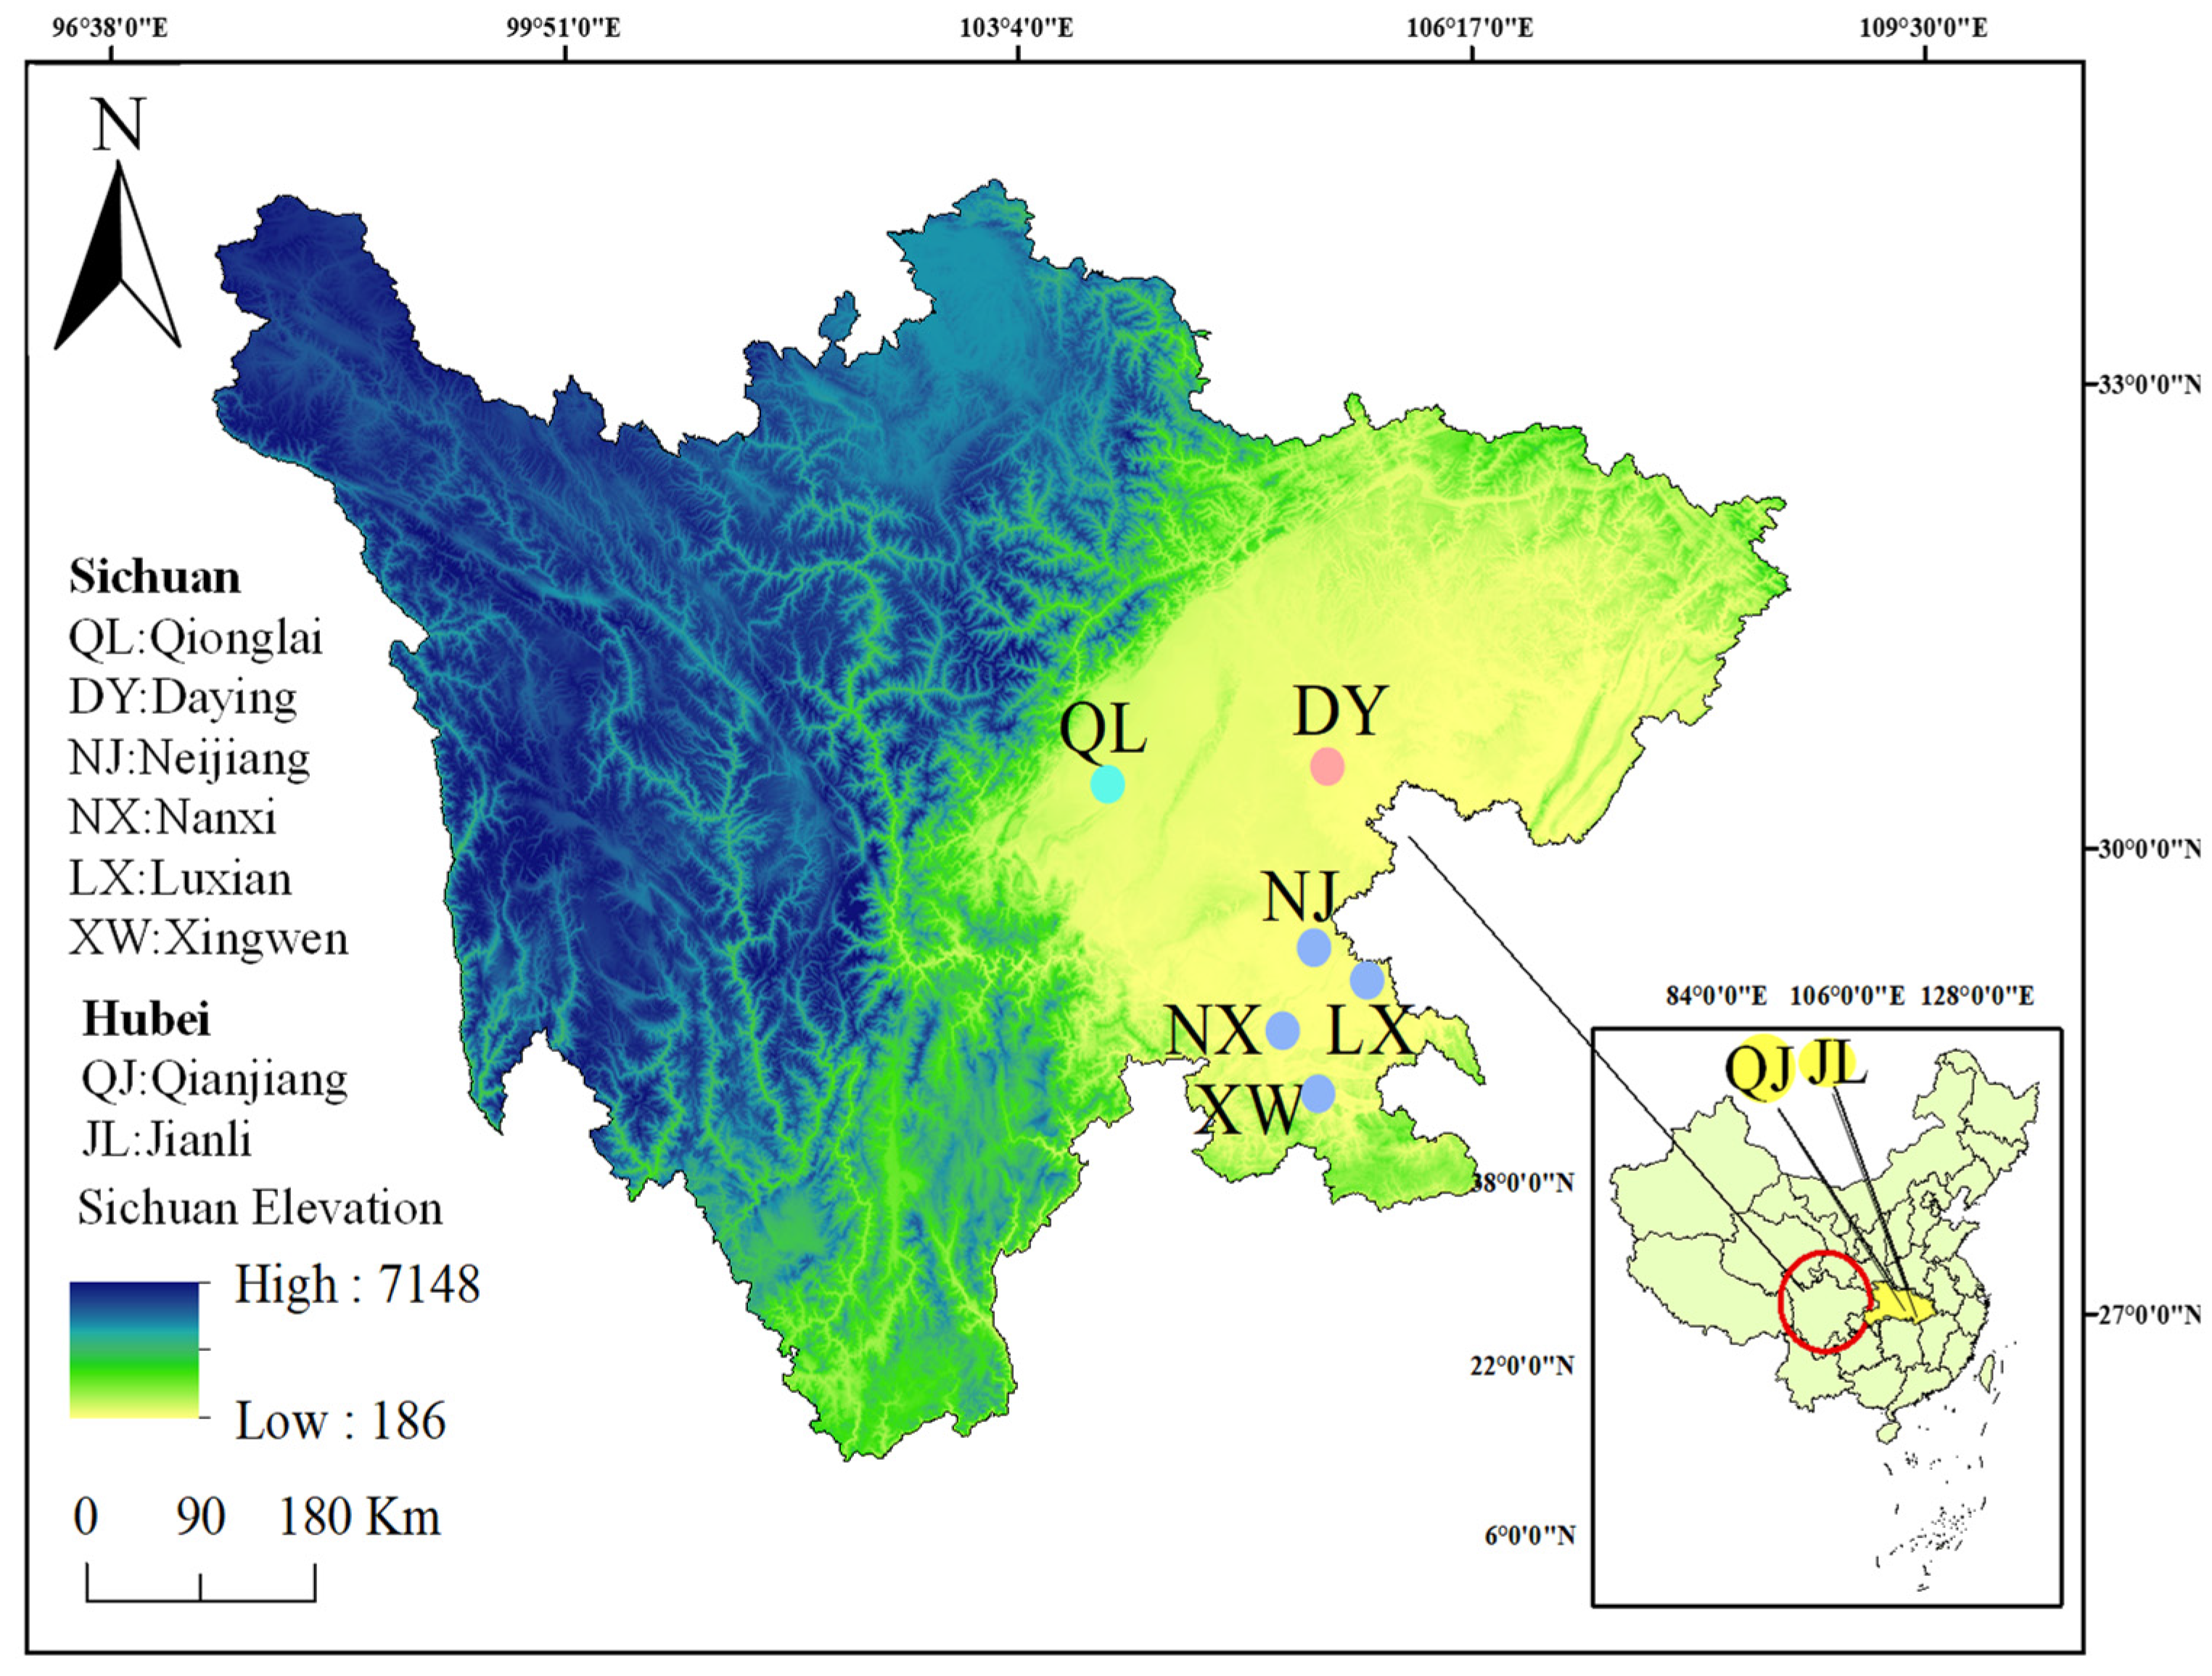
2.1. Sample Collection and DNA Extraction

A total of 300 cultivated P. clarkii from Sichuan Province and an additional 100 specimens from Hubei Province were collected from May to July 2023 (Table 1, Figure 1). These six Sichuan populations were from the three primary breeding regions of Sichuan Province, including QL from the center urban agglomerations, and NX, XW, LX, and NJ from the southern basin, alongside DY from the northeastern basin. Additionally, two populations were sourced from Hubei Province’s traditional P. clarkii production area, namely QJ and JL.
All of the P. clarkii were promptly transported to the laboratory, where genomic DNA was subsequently extracted from their muscle tissue in adherence to the standardized protocol of the Genomic DNA Extraction Kit (Tiangen Biotech Co., Ltd., Beijing, China). The quantity and purity of the extracted DNA were assessed using a NanoDrop 2000 spectrophotometer (Thermo Scientific, Waltham, MA, USA). Once validated, the DNA samples were stored at −20 °C for subsequent analysis.

2.2. Microsatellite Markers

Twelve pairs of microsatellite markers specific to P. clarkii were employed in this study [16,22,23]. To facilitate identification and analysis, distinct fluorescent labels (FAM, TAMRA and HEX) were appended to the 5’ terminus of each of the microsatellite primers (Table 2). These primers were synthesized by Yuewei, Medical Treatment Technology Co., Ltd. (Beijing, China). The total volume of the PCR reaction was 25 μL, containing 20 μL of PCR Mix (Cwbio, Biotechnology Co., Ltd., Beijing, China), 8.5 μL of ddH2O, 0.5 μL of each primer (10 μM), and 0.5 μL of genomic DNA (100 ng/μL). The amplification process was carried out using a Thermocycler PTC 200™ Programmable Thermal Controller (Thermo Scientific, Waltham, MA, USA), adhering to the following thermal profile: an initial denaturation step of 30 s at 98 °C; followed by 34 cycles of 10 s at 94 °C, 15 s for annealing at the specific primer annealing temperatures, and 6 s of extension at 72 °C. A final extension step of 1 min at 72 °C was also included. The PCR products were analyzed by 1.5% agarose gel electrophoresis. DNA-labeling DL2000 (Takara Biomedical Technology Co., Ltd., Beijing, China) was used as a molecular marker. The PCR products were serotyped by Yuewei, Medical Treatment Technology Co., Ltd. (Beijing, China).

2.3. Data Analysis

The software package MICRO-CHERCKER version 2.2.3 [24] was utilized to consolidate the obtained typing results and detect null alleles. CERVUS version 3.0.3 [25] was used to calculate pivotal genetic diversity parameters (Table S1), including the number of alleles (Na), observed heterozygosity (Ho), expected heterozygosity (He), and the polymorphic information content index (PIC). POPGENE version 1.32 [26] was utilized to estimate the effective allele number (Ne), gene flow (Nm), Shannon’s information index (I), Nei’s genetic distance, and the inbreeding coefficient (Fis). Allelic richness (AR) was calculated by the software FSTAT version 2.9.3 [27]. ARLEQUIN version 3.5.1.3 [28] was used to quantify the inter-population genetic differentiation coefficient (Fst), calculate the G-W value, and perform an analysis of molecular variance (AMOVA). Principal Coordinates Analysis (PCoA) was performed to present a visualization of the coordinates of similarities or differences using of the poppr package [29] within the R language. For clustering analysis among populations, the neighbor-joining (NJ) method was executed using MEGA version 3.1 [30]. The population genetic structure was visualized by STRUCTURE version 2.3.1 [31]. The K-value was set as 1 to 10, and 20 independent calculations were performed with 10,000 burn-in iterations and 100,000 Markov Chain Monte Carlo (MCMC). The optimal K value was calculated using the online tool STRUCTURE HARVESTER (http://taylor0.biology.ucla.edu/structureHarvester/, accessed on 15 March 2024). The potential existence of a bottleneck effect within the sampled populations was evaluated using BOTTLENECK version 1.2.02 [32].

3. Results

3.1. Genetic Diversity Analysis of Different P. clarkii Populations

The Na varied across populations, ranging from 4.000 (LX) to 5.250 (DY), while the Ne spanned from 2.287 (LX) to 2.681 (XW). The Ho ranged from 0.549 (LX) to 0.699 (DY), and the He varied from 0.547 (LX) to 0.607 (DY). Shannon’s information index (I) exhibited a range of 0.939 (LX) to 1.121 (DY), and allelic richness (AR) spanned from 3.778 (LX) to 4.875 (DY) (Table 3). The PIC ranged from 0.467 (LX) to 0.535 (DY), with LX (0.467) and JL (0.494) displaying a moderate level of polymorphism, whereas the remaining six populations exhibited high polymorphism. The mean values of genetic diversity indicators among the six populations from Sichuan Province (Ne: 2.542; Ho: 0.629; He: 0.587; I: 1.061; AR: 4.462) were higher than those of the two populations from Hubei Province (Ne: 2.423; Ho: 0.622; He: 0.578; I: 1.004; AR: 4.320) (Table 3), suggesting a richer genetic diversity in cultured P. clarkii populations within Sichuan Province compared to Hubei Province. The FIS for all eight P. clarkii populations were less than zero, accompanied by Ho values exceeding He values (Table 3). This finding implies that these eight populations predominantly engage in outbreeding, leading to an overall excess of heterozygotes.

3.2. AMOVA and Genetic Differenation of P. clarkii Populations

The paired Fst and Nm of the eight populations are presented in Table 4. The Fst values among these populations ranged from 0.001 to 0.109. Notably, the population pairs QJ-NX, QJ-JL, NX-QL, NX -XW, NX-DY, QL-DY, QL-JL, XW-JL, NJ-JL, and DY-JL exhibited Fst values lying between 0.051 and 0.109, exceeding the threshold of 0.05, indicative of moderate levels of genetic differentiation. Conversely, the remaining pairs displayed Fst values ranging from 0.048 to 0.001, falling within the category of slight genetic differentiation. The Nm values observed among the eight populations varied within a range of 2.3 to 217.1, consistently exceeding the threshold of 1, indicating a substantial gene flow between these populations.
The results of the Analysis of Molecular Variance (AMOVA) (Table 5) showed that the overwhelming majority of molecular variation occurred within individuals (84.788%), whereas the contribution of variation among groups of populations accounted for a negligible fraction 0.137%. This suggests that the genetic variation within the eight studied populations of cultured P. clarkii is predominant among the population within the groups, highlighting the minimal genetic differentiation between the two populations from Hubei and the six populations from Sichuan.

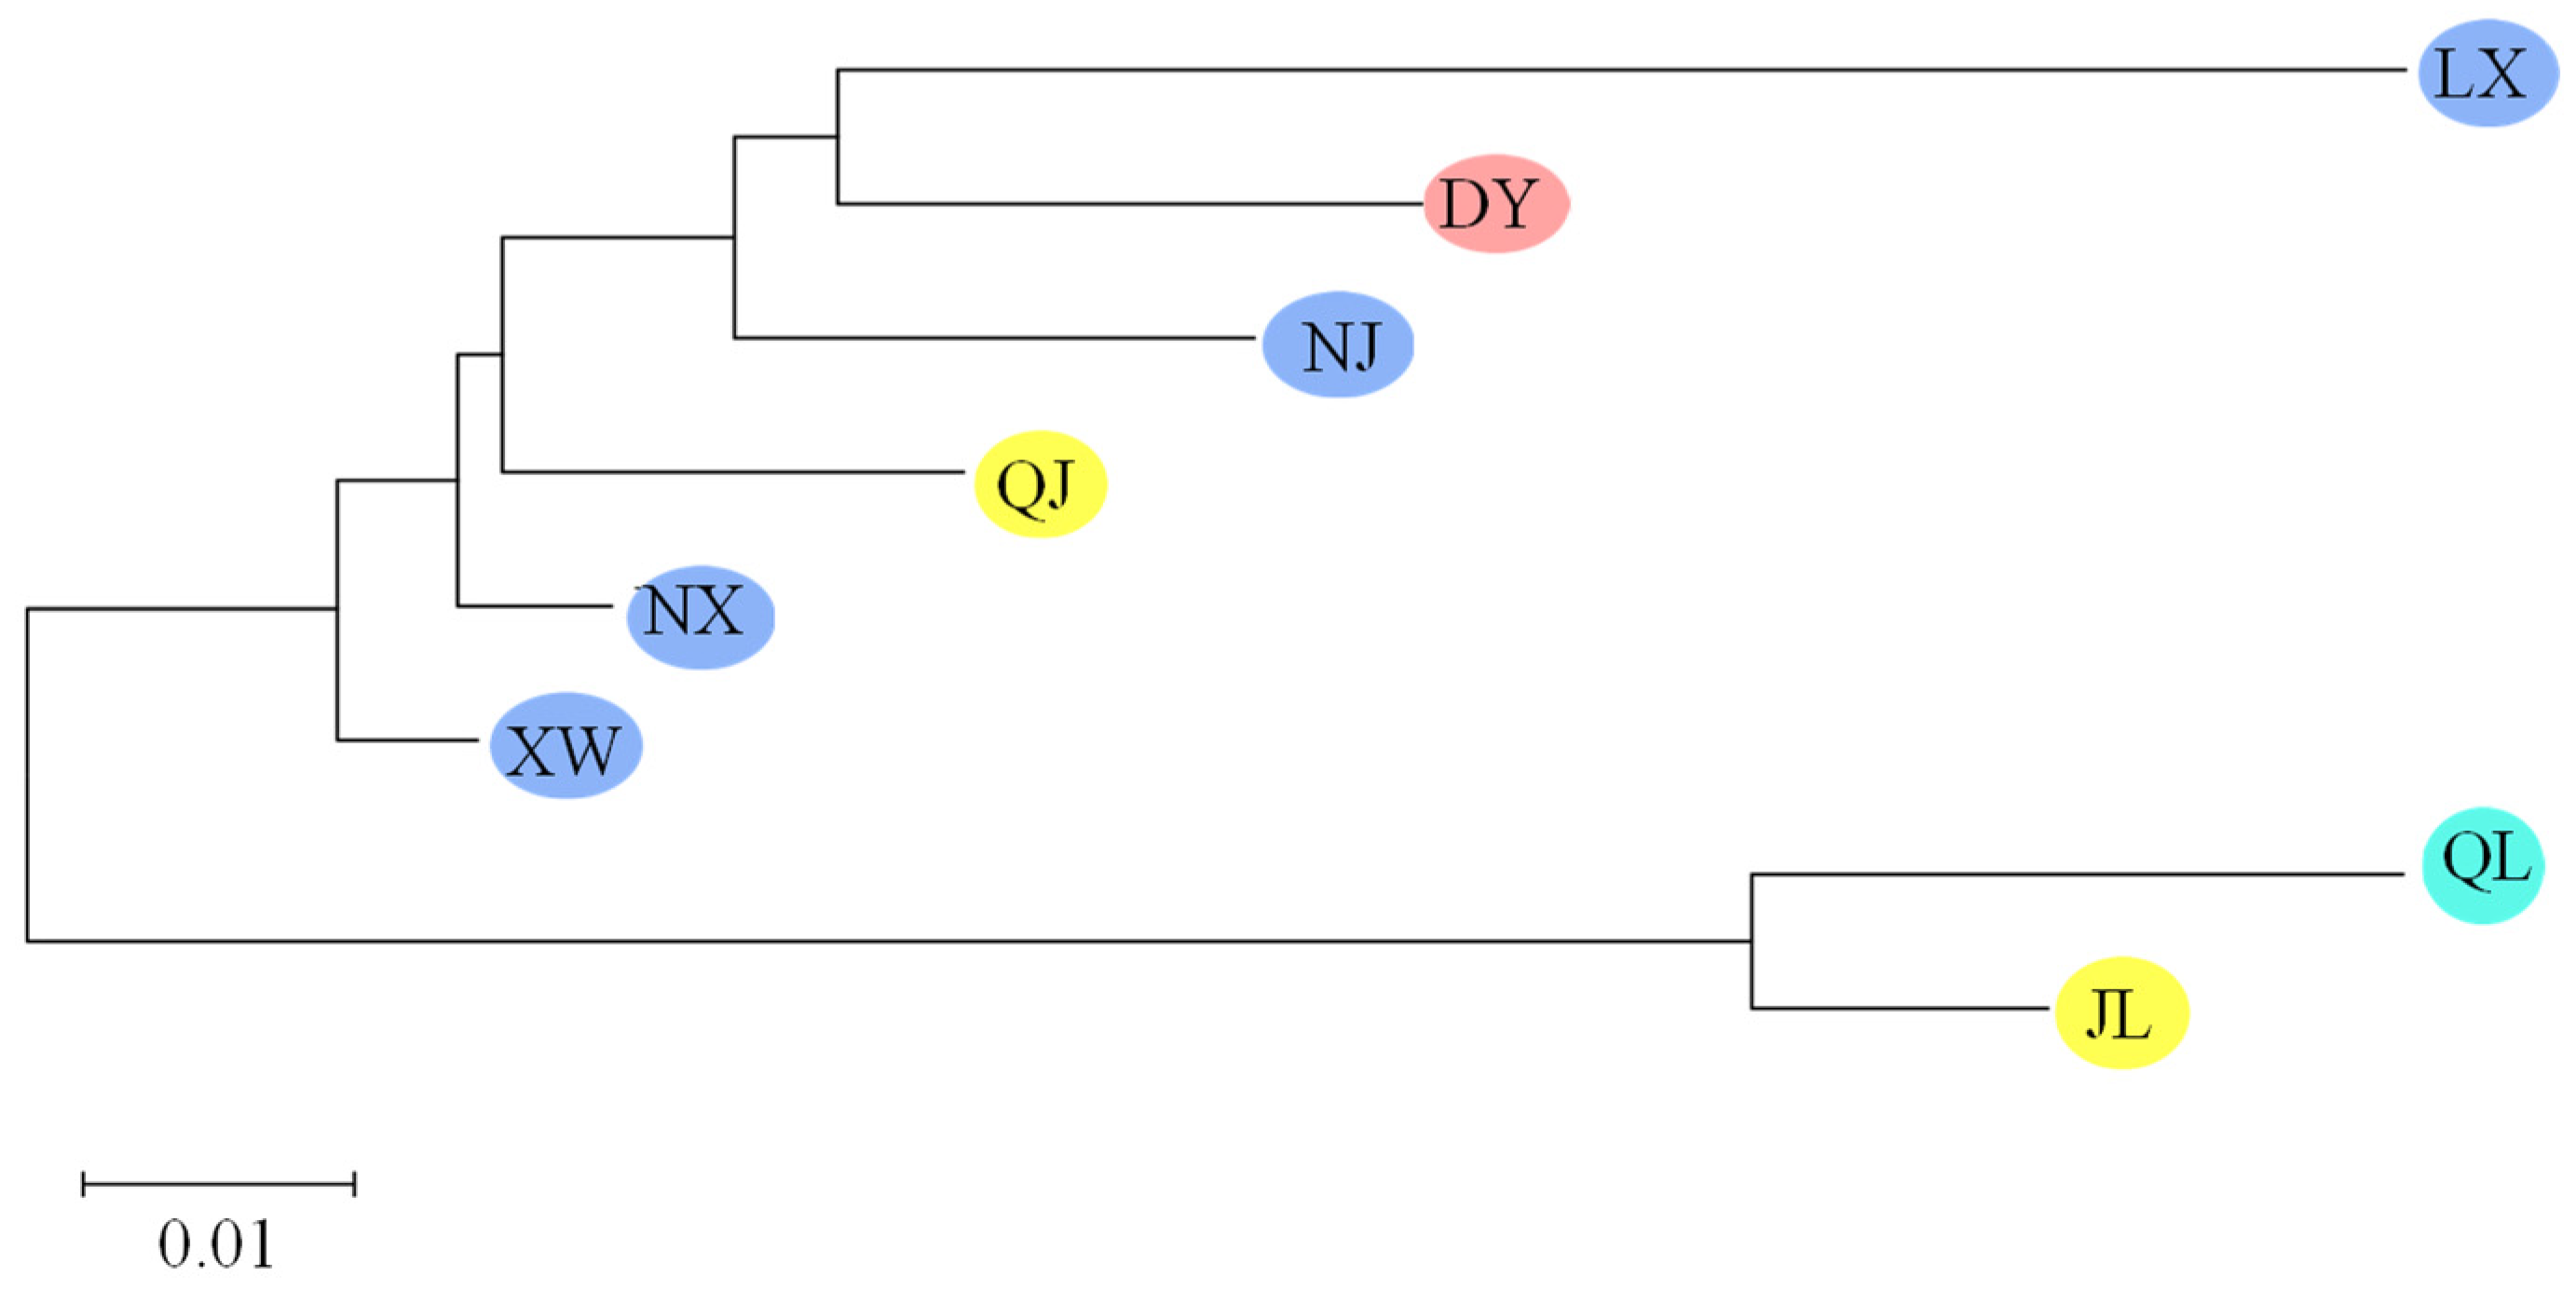
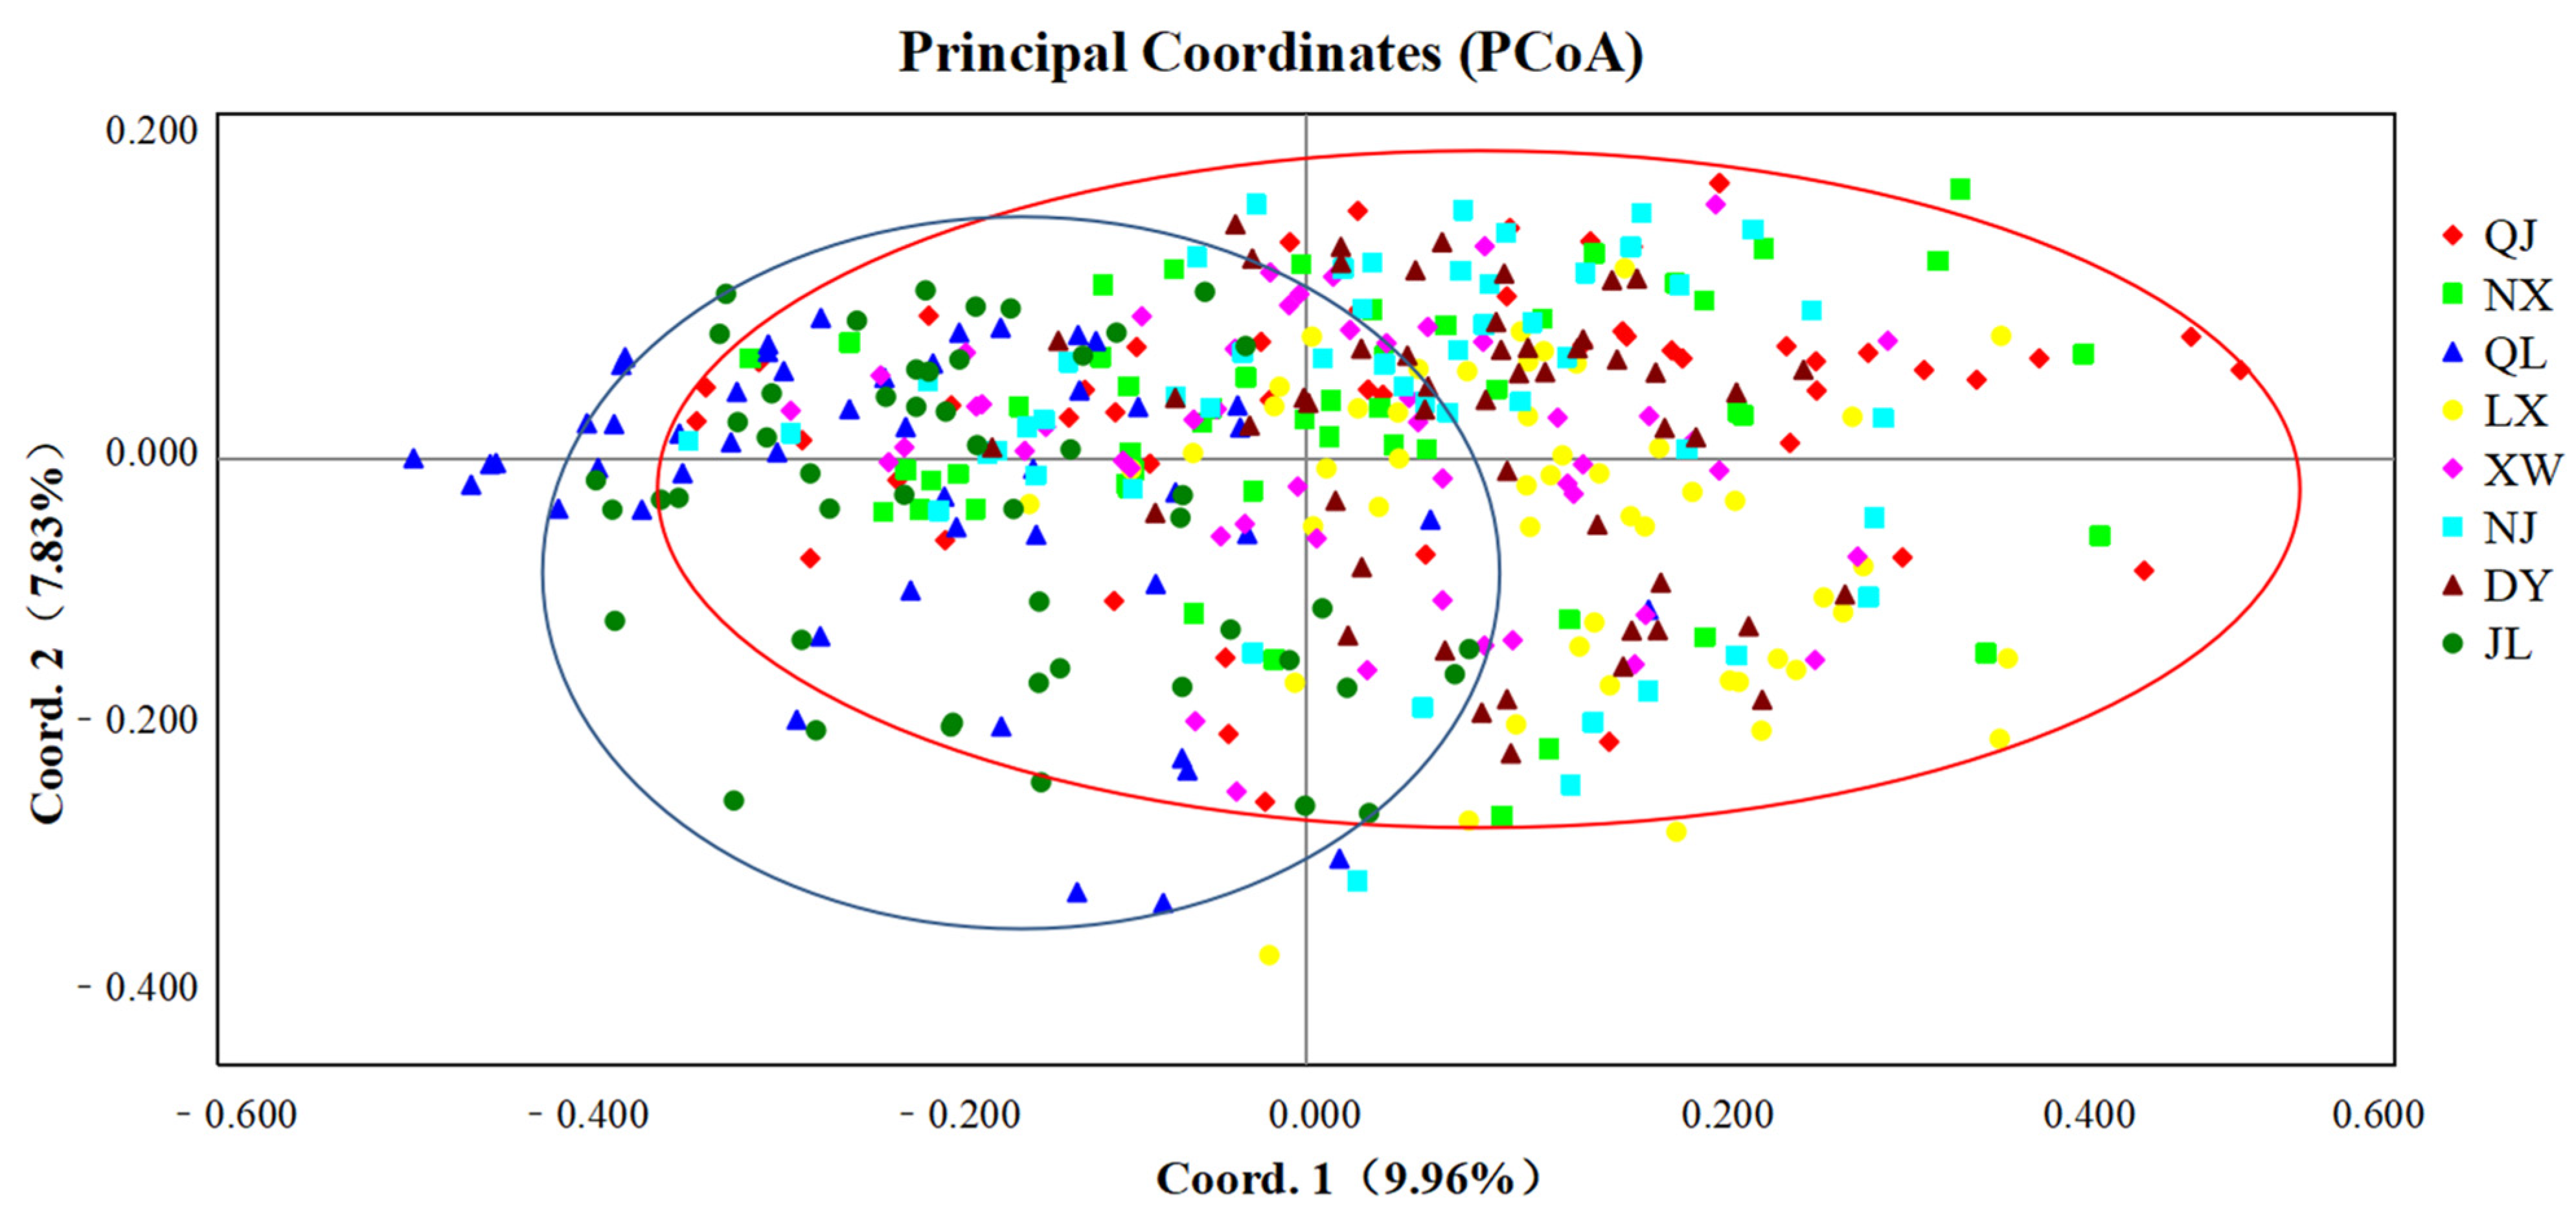
3.3. Genetic Structure of P. clarkii Populations

The NJ tree constructed using Nei’s genetic distance (Figure 2) demarcated the eight P. clarkii populations into two distinct phylogenetic clades. Cluster I comprises populations from the northeastern basin (DY) and the southern basin (NX, XW, NJ, and LX), as well as the QJ population from Hubei Province. Conversely, Cluster II is formed by the population hailing from the center urban agglomerations (QL) and the JL population from Hubei Province.
The SSR markers of the eight populations were subjected to PCoA (Figure 3). The results shown in the scatter plot and the clustering plot were consistent, showing that the Sichuan QL populations and the Hubei JL populations were closely located and clustered together, while the Hubei QJ populations were grouped with other Sichuan populations. The percentage variances explained by PCoA1 and PCoA2 were 9.96% and 7.83%, respectively, as most of the variation occurred within individuals. AMOVA analysis further indicated that a significant portion of the variation (84.8%) occurred within individuals, while the differences between the populations were minimal, accounting for only 0.137% (Table 5).
The population structure that was analyzed (Figure 4) confirmed the presence of two distinct genetic clusters among the eight P. clarkii farm populations. Specifically, DY, XW, NX, NJ, LX, and QJ populations shared a common genetic structure, I, whereas QL and JL populations constituted a separate genetic structure, II. The result was completely consistent with the conclusion drawn from the NJ tree analysis, reinforcing the existence of two genetically distinct groups among the studied P. clarkii populations.

3.4. Genetic Status of Cultured P. clarkii Populations in Sichuan

The results of the Wilcoxon test indicated that none of the eight populations had undergone statistically significant bottleneck events in recent generations (Table 6). Notably, however, the observed G-W values of the eight populations ranged from 0.035 to 0.602, all of which fell below the critical threshold of 0.68, indicating that each of the eight populations has experienced a recent population shrinkage.

4. Discussion

4.1. Genetic Diversity of Cultured Populations of P. clarkii

Genetic diversity stems from the prolonged evolutionary process within species or populations. The abundance of genetic variability within a population is intimately linked to its adaptability to environmental fluctuations and potential for selective breeding [33,34,35,36]. Genetic diversity is responsive to factors such as artificial selection, genetic drift, migration patterns, and breeding systems [36]. Key metrics of genetic diversity include PIC, Ne, Ho, He, and I, which serve as vital parameters for assessing population diversity [37,38]. Heterozygosity, particularly expected heterozygosity, stands as a valuable index for evaluating the richness of genetic diversity [39].
In this study, the LX population from Sichuan (PIC = 0.467, He = 0.547) and the JL population from Hubei (PIC = 0.494, He = 0.565) exhibited moderate genetic diversity, whereas all the other populations exhibited high diversity with PIC values ranging from 0.509 to 0.535. Previous investigations by Tian [40] and Sun [41] utilizing 8 and 50 microsatellite markers, respectively, on P. clarkii populations from Jianli, Hubei, concurred with our findings, reporting moderate genetic diversity (PIC = 0.37–0.49, He = 0.39–0.52). The genetic diversity of cultured P. clarkii in Sichuan (mean values Ne: 2.542; Ho: 0.629; He: 0.587; I: 1.061; AR: 4.462) surpassed those of Hubei (mean values Ne: 2.423; Ho: 0.622; He: 0.578; I: 1.004; AR: 4.320) in this study. Guo [23] analyzed the genetic diversity of P. clarkii aquaculture populations in Qianjiang and Honghu, Hubei Province, using 20 pairs of microsatellite markers. Their findings revealed that the genetic diversity indices of these populations were Na = 3.05–3.50, Ne = 2.13–2.30, Ho = 0.451–0.471, He = 0.468–0.523, and I = 0.782–0.879. Liu [42] analyzed the genetic diversity of P. clarkii populations from five aquaculture sites in Hubei Province using 35 pairs of microsatellite markers. The results indicated that the genetic diversity indices of these populations were PIC = 0.37–0.41, Ho = 0.38–0.41, and He = 0.40–0.43. The genetic diversity of P. clarkii populations in Hubei Province, as reported in the aforementioned studies, was consistently lower than those of the Sichuan populations in this study (Na = 4.000–5.250, Ne = 2.287–2.681, Ho = 0.549–0.699, He = 0.547–0.607, I = 0.939–1.121, PIC = 0.467–0.535). This further supports the findings of this study, that the genetic diversity of P. clarkii aquaculture populations in Sichuan Province is higher than in Hubei Province. Within Sichuan, the northeastern basin population (DY) exhibited the highest genetic diversity (Na = 5.250, PIC = 0.535, Ne = 2.646, Ho = 0.699, He = 0.607), followed by the southern basin populations (XW, NJ, NX, LX), and lastly, the urban population (QL). This variation in genetic diversity may be due to different aquaculture operations employing different breeding strategies or engaging in genetic exchange with different geographic populations [43]. Wang [44] analyzed the genetic diversity of 12 cultured P. clarkii populations in Anhui Province, China, using 9 pairs of microsatellite markers, and the results showed that the genetic diversity of these populations (Na = 4.333–5.556, He = 0.570–0.660, PIC = 0.498–0.588, I = 1.018–1.196) was slightly higher than those of the Sichuan populations in this study, except for the Changfeng population (Na = 3. 556, He = 0.483, PIC = 0.422, I = 0.841), which exhibited lower diversity. Liu [42] examined the genetic diversity of P. clarkii cultured in six sites in Jiangxi Province and three in Zhejiang Province using 35 pairs of microsatellite markers. Compared with the results of Liu’s study, both the Jiangxi (PIC = 0.33–0.40, Ho = 0.38–0.41, He = 0.36–0.42) and Zhejiang (PIC = 0.38–0.43, Ho = 0.40–0.41, He = 0.40–0.44) provinces harbored lower genetic diversity in P. clarkii than the Sichuan populations in this study. Outside of China, Barbaresi [45] utilized five pairs of microsatellite markers to investigate the genetic diversity of P. clarkii populations from Louisiana and Mexico (the P. clarkii origins), and ten invasive Western European populations. The genetic diversity of the P. clarkii from Sichuan Province (Ho = 0. 549–0.699, He = 0.547–0.607) in this study was higher than that of the two US populations (Ho = 0.361–0.556, He = 0.372–0.542) and the five Western European populations (He = 0.319–0.515) of Barbaresi’s; however, it was lower than the other five Western European regions (He = 0.554–0.618). We note, however, that the direct comparison of the results among the studies using different marker sets should be regarded with caution.

4.2. Genetic Differentiation and Historical Dynamics of P. clarkii Population

In this study, the lowest FST (0.001) was observed between the QJ and DY populations, accompanied by the highest estimated Nm (217.141), suggesting high genetic exchange and a strong genetic affinity between them. The LX and QJ populations exhibited the next highest degree of genetic similarity, followed by the LX and DY populations. Substantial genetic exchange was apparent among these eight populations, as evidenced by the Nm value consistently exceeding 1, suggesting robust intergroup interactions. The QJ and DY populations, distinguished by their high level of gene flow, may represent higher genetic quality and breeding potential.
Based on the concordant outcomes of the NJ tree and STRUCTURE analyses, the two populations from Hubei Province, QJ and JL, were segregated into separate clusters. Conversely, the five Sichuan populations, DY from the northeastern basin, alongside NX, XW, NJ, and LX from the southern basin, were grouped together with the QJ population. The QL population, from the center urban agglomeration, was clustered with Hubei population JL. These findings suggest a close ancestral relationship between the DY, NX, XW, NJ and LX populations, and the Hubei population QJ. Additionally, the QL population might be traced back to the Hubei population JL. Despite being cultivated in varied environmental conditions across different sites in Sichuan, these populations genetically interacted and may have adapted to their respective locales, ultimately contributing to the formation of distinct populations entities.
None of the eight P. clarkii populations analyzed in this study exhibited a significant heterozygote excess through the population historical dynamics evaluation, with P ≤ 0.05 and the G-W value ranging from 0.035 to 0.602, or fell below the critical threshold of 0.68, indications that all of the populations had experienced more ancient population bottleneck. However, these populations did not exhibit signs of recent bottlenecks or expansions. It is commonly observed that invasive species manifest low genetic diversity owing to bottlenecks or genetic drift, as exemplified by the significantly reduced genetic diversity of invasive Impatiens glandulifera in Europe compared to its native populations; as well as Lithobates catesbeianus in China, which also displays diminished genetic diversity compared to native US populations [9,46]. Contrary to these trends, the P. clarkii populations in this study did not undergo a significant reduction in genetic diversity post-invasion. Previous research has suggested that introductions can potentially enhance genetic diversity within species [47]. However, specific research indicates that P. clarkii populations in China stemmed from Japanese stocks initially introduced into Nanjing, without subsequent introductions of additional populations [48]. The high genetic diversity in these populations might result from interbreeding among distinct genetic backgrounds, potentially facilitated by commercial aquaculture practices or natural dispersal. Similarly, Liu [49] demonstrated increased genetic diversity in hybrids obtained through the artificial reproduction of Scapharca broughtonii populations from China and Korea, compared to self-crossed offspring, as evidenced by analyses using mitochondrial genes (16S rRNA, COI) and nuclear ribosomal ITS-1 markers. Additionally, Wang [50] used a 3 × 3 complete diallel cross using Odontobutis potamophila populations from various Chinese locations and revealed higher genetic diversity in diallel hybrid offspring, based on microsatellite markers. Furthermore, it is plausible that after successfully invading new environments, P. clarkii, may have undergone genetic diversification via mutations [51]. In China, the absence of natural predators, rapid growth, early maturation, high reproductive and foraging abilities, along with a wide tolerance of temperature variation, confer a competitive advantage to P. clarkii, enabling them to thrive across diverse ecological niches and adapt to various environmental challenges [52].

4.3. Recommendations

In contrast to the well-established P. clarkii industry in Hubei Province, the P. clarkii industry in Sichuan Province remains relatively nascent. Nonetheless, with robust backing of the local government, the production of P. clarkii in Sichuan Province had reached 83,000 tons in 2023, indicating a remarkable increase of 28.5% from 2022. The southern basin of Sichuan Province enjoys the benefits of an extended frost-free season and swift spring warming, presenting climate advantages, which have fostered the emergence of the “Southern Sichuan Early P. clarkia” industry. This regional variant of P. clarkii, marketed as “Southern Sichuan Early P. clarkia”, gains a competitive edge by reaching the market approximately two months ahead of those from Hubei, Jiangsu, and other prominent P. clarkii-producing provinces, effectively addressing the winter market gap where P. clarkii is scarce or limited. The “Southern Sichuan Early P. clarkia” industry adopts a strategic staggered marketing approach to sustain seasonal market dominance. However, the national P. clarkii culture industry confronts formidable challenges, primarily due to the serious degradation of seed quality attributed to on-farm propagation practices and the “Catch Big, Keep Small” farming method. Additionally, the uncertainty of the original stock sources of the P. clarkii culture population in Sichuan Province complicates the local selection and cultivation of high-quality seed. The findings of this study revealed that the DY population from the northeastern Sichuan basin exhibits the highest genetic diversity and a relatively high level of genetic exchange, positioning it as a suitable germplasm source. Moreover, the original populations of Sichuan’s primary P. clarkii culture bases trace their ancestry back to Qianjiang and Jianli countries from Hubei Province. Specifically, the DY, NX, XW, NJ and LX populations are derivatives of the Hubei QJ population, while the QL population originates from the Hubei JL population.
To foster the healthy development of the P. clarkii industry in Sichuan Province, it is recommended that local managers prioritize enhancing P. clarkii germplasm resources by bolstering genetic exchange between local breeding populations and those characterized by high genetic diversity. Within the southern Sichuan basin, a purification of P. clarkii germplasm resources can be achieved through intensifying genetic interactions amongst local breeding strains, while cautiously avoiding the introduction of germplasm with similar genetic character that could lead to inbreeding depression. Specifically, the implementation of genetic exchanges between the DY population and the QL population is advisable, with a focus on increasing the frequency of such exchanges among P. clarkii populations (NX, XW, NJ, LX) residing in the Southern Sichuan basin. Nevertheless, the introduction of resources from the JL population should be approached with meticulous consideration to avoid potential adverse effects on the local genetic pool. Furthermore, it is highly recommended to regularly incorporate superior P. clarkii varieties from other regions and actively incorporate wild resources into the breeding programs. At the same time, it is recommended to adopt scientific breeding methodologies that involve selecting parents from diverse populations as the source groups for P. clarkii, with the aim of avoiding the issue of down-selection and enhancing genetic variation through the incorporation of novel stocks sourced from their native habitats. This strategic approach will not only maintain but also enrich the genetic diversity of cultivated P. clarkii in Sichuan Province, thereby contributing to the sustainable and healthy development of the P. clarkii industry, and ensuring a stable supply of high-quality P. clarkii products.

5. Conclusions

In conclusion, this research has revealed the lineage for the prominent P. clarkii breeding stocks in Sichuan Province, which primarily stem from Qianjiang and Jianli in Hubei Province. Most of Sichuan’s P. clarkii populations can be traced back to Qianjiang, with the exception of the Qionglai population, uniquely derived from Jianli. The Daying P. clarkii population, situated in the northeastern Sichuan basin, exhibited a significantly higher level of genetic diversity and apparent genetic exchange, underscoring its potential as a breeding germplasm source for the sustainable development of the P. clarkii industry in Sichuan Province. In contrast, the Qionglai population exhibits relatively low genetic diversity compared to its contemporaries in Sichuan, highlighting the need for strategic enhancement. This can be addressed by fostering increased genetic interactions with other populations, thereby promoting diversity and resilience. Furthermore, the southern Sichuan basin should prioritize fostering genetic exchange among local cultivated populations as a strategy to elevate the quality of P. clarkii germplasm resources and subsequently propel the development of the “Southern Sichuan Early P. clarkia” industry.

Supplementary Materials

The following supporting information can be downloaded at: https://www.mdpi.com/article/10.3390/fishes9100419/s1, Table S1: The SSR banding patterns.

Author Contributions

C.D., Q.L., Y.R. and W.S. conceived and conducted the experiment. C.D., Y.L., X.D. and S.Y. performed the molecular analysis. C.D. and J.W. analyzed the results. C.D. and J.W. wrote the manuscript. The project was performed under the supervision of S.Y. and J.W. All authors have read and agreed to the published version of the manuscript.

Funding

Natural Science Foundation of Sichuan Province of China (2022NSFSC0070), Youth Foundation of Natural Science Foundation of Sichuan Province (2022NSFSC1723, 23NSFSC5806), Project of Sichuan Innovation Team of National Modern Agricultural Industry Technology System (SCCXTD-2024-15), the Sichuan Science and Technology Program (2021YFYZ0015).

Institutional Review Board Statement

The P. clarkii were sampled and treated according to the recommendations in the Guide for the Care and Use of Laboratory Animals of the Institute of Sichuan Agricultural University, China (code: 20220057; date: 1 March 2023).

Data Availability Statement

The raw data supporting the conclusions of this article will be made available by the authors on request.

Acknowledgments

We thank Sichuan Run Zhao Fisheries Co., Ltd. and Xinxing Aquatic Products Co., Ltd. for providing test sites and sample collection.

Conflicts of Interest

The authors declare no conflicts of interest.

References

  1. Oficialdegui, F.J.; Clavero, M.; Sánchez, M.I.; Green, A.J.; Boyero, L.; Michot, T.C.; Klose, K.; Kawai, T.; Lejeusne, C. Unravelling the global invasion routes of a worldwide invader, the red swamp crayfish (Procambarus clarkii). Freshw. Biol. 2019, 64, 1382–1400. [Google Scholar] [CrossRef]
  2. Pennak, R.W. Fresh-water Invertebrates of the United States. J. Aquat. Ecosyst. Stress Recovery (Former. J. Aquat. Ecosyst. Health) 1955, 7, 126. [Google Scholar] [CrossRef]
  3. Tian, J.; Xu, Q.Q.; Tian, L.; Hu, W.; Yang, C.G.; Gao, W.H. The muscle composition analysis and flesh quality of Procambarus clarkii in the Dongting Lake. Acta Hydrobiol. Sin. 2017, 41, 870–877. [Google Scholar]
  4. Xiao, F.; Liu, Z.S.; Guo, Y.F.; Zhu, Z.W.; Ma, D.W.; Qing, T.J. Report on the development of crayfish industry in China (2017). China Fish. 2017, 7, 8–17. [Google Scholar]
  5. Luo, Y.T.; Liu, Y.; Liu, J.M.; Xiao, T.Y.; Lin, L.Q. Analysis of Muscle Nutritional Components of Different Sizes of Procambarus clarkii Cultured in Rice Field in Hunan Province. Chin. J. Anim. Nutr. 2021, 33, 4592–4603. [Google Scholar]
  6. Yu, X.J.; Hao, X.J.; Yang, L.K.; Dang, Z.Q.; Wang, X.G.; Zhang, Y.H.; Xi, Z. Report on the development of crayfish industry in China (2023). China Fish. 2023, 7, 26–31. [Google Scholar]
  7. Peng, W.F.; Zhang, D.M.; Luo, Y.M.; Tao, S.; Liang, X.X. Influence of natural factors on vegetation NDVI using geographical detection in Sichuan Province. Acta Geogr. Sin. 2019, 74, 1758–1776. [Google Scholar]
  8. Alvanou, M.V.; Apostolidis, A.P.; Lattos, A.; Michaelidis, B.; Giantsis, I.A. The Coding Mitogenome of the Freshwater Crayfish Pontastacus leptodactylus (Decapoda:Astacidea:Astacidae) from Lake Vegoritida, Greece and Its Taxonomic Classification. Genes 2023, 14, 494. [Google Scholar] [CrossRef]
  9. Ren, S.; Mather, P.B.; Tang, B.; Hurwood, D.A. Levels of genetic diversity and inferred origins of Penaeus vannamei culture resources in China: Implications for the production of a broad synthetic base population for genetic improvement. Aquaculture 2018, 491, 221–231. [Google Scholar] [CrossRef]
  10. Zhou, L.; Gao, J.C.; Yang, Y.P.; Nie, Z.J.; Liu, K.; Xu, G.C. Genetic Diversity and Population Structure Analysis of Chinese Mitten Crab (Eriocheir sinensis) in the Yangtze and Liaohe Rivers. Fishes 2023, 8, 253. [Google Scholar] [CrossRef]
  11. Weber, J.L. Informativeness of human (dC-dA)n.(dG-dT)n polymorphisms. Genomics 1990, 7, 524–530. [Google Scholar] [CrossRef] [PubMed]
  12. Han, C.H.; Ma, H.T.; Jiang, H.B.; Liu, Y.; Han, H.Z.; Wang, F. Isolation of microsatellite markers for black rockfish Sebastes schlegeli and genetic diversity of wild and cultured populations. Oceanol. Limnol. Sin. 2016, 47, 213–220. [Google Scholar]
  13. Fazzi-Gomes, P.F.; Aguiar, J.; Marques, D.; Fonseca, C.G.; Moreira, F.C.; Rodrigues, M.; Silva, C.S.; Hamoy, I.; Santos, S. Novel Microsatellite Markers Used for Determining Genetic Diversity and Tracing of Wild and Farmed Populations of the Amazonian Giant Fish Arapaima gigas. Genes 2021, 12, 1324. [Google Scholar] [CrossRef] [PubMed]
  14. Gong, S.R.; Wang, T.; Song, L.L.; Yang, Y.; Zhong, C.Y.; Tao, Y.H.; Liu, X.C. Genetic diversity among breeding populations of giant grouper (Epinephelus lanceolatus). Fish. China 2024, 48, 49616. [Google Scholar]
  15. Zhou, Y.; Tong, J.T.; Wang, J.R.; Yu, X.M. Development of microsatellite markers and genetic diversity in wild and cultured populations of black carp (Mylopharyngodon piceus) along the Yangtze River. Aquac. Int. 2020, 28, 1867–1882. [Google Scholar] [CrossRef]
  16. Cui, W.T.; Zhou, Y.F.; Bai, Z.Y.; Wang, Z.Y.; Zhong, L.D. Genetic diversity and structure analysis of Procambarus clarkii populations in Anhui Province. J. Fish. China 2023, 47, 90–99. [Google Scholar]
  17. Duan, B.H.; Kang, T.X.; Wan, H.F.; Liu, W.B.; Zhang, F.H.; Mu, S.M.; Guan, Y.Q.; Li, Z.J.; Tian, Y.; Kang, X.J. Microsatellite markers reveal genetic diversity and population structure of Portunus trituberculatus in the Bohai Sea, China. Sci. Rep. 2023, 13, 8668. [Google Scholar] [CrossRef]
  18. Liu, J.Q.; Sun, Y.F.; Chen, Q.Q.; Wang, M.; Li, Q.; Zhou, W.Z.; Cheng, Y.X. Genetic Diversity Analysis of the Red Swamp Crayfish Procambarus clarkii in Three Cultured Populations Based on Microsatellite Markers. Animals 2023, 13, 1881. [Google Scholar] [CrossRef]
  19. Wang, W.; Ma, C.Y.; Ouyang, L.L.; Chen, W.; Zhao, M.; Zhang, F.; Fu, Y.; Jiang, K.J.; Liu, Z.Q.; Zhang, H.; et al. Genetic diversity and population structure analysis of Lateolabrax maculatus from Chinese coastal waters using polymorphic microsatellite markers. Sci. Rep. 2021, 11, 15260. [Google Scholar] [CrossRef]
  20. Zhong, Y.Z.; Tang, Z.S.; Huang, L.M.; Wang, D.P.; Lu, Z.L. Genetic diversity of Procambarus clarkii populations based on mitochondrial DNA and microsatellite markers in different areas of Guangxi, China. Mitochondrial DNA Part A DNA Mapp. Seq. Anal. 2020, 31, 48–56. [Google Scholar] [CrossRef]
  21. Wang, Q.S.; Hu, Q.; Yang, S.Q.; Li, Y.H. Isolation of tetrameric microsatellite markers and its application on parentage identification in Procambarus clarkii. Aquac. Int. 2023, 31, 2099–2111. [Google Scholar] [CrossRef]
  22. Belfiore, N.M.; May, B. Variable microsatellite loci in red swamp crayfish, Procambarus clarkii, and their characterization in other crayfish taxa. Mol. Ecol. 2000, 9, 2231–2234. [Google Scholar] [CrossRef] [PubMed]
  23. Guo, X.F.; Liu, M.; Zhou, Y.L.; Wen, W.Y.; Li, Z.; Li, Z.; Wang, Z.W.; Gui, J.F. Genetic Diversity Evaluation and Population Structure Analysis of Red Swamp Crayfish (Procambarus clarkii) from Lakes and Rice Fields by SSR Markers. Fishes 2022, 4, 142. [Google Scholar] [CrossRef]
  24. Oosterhout, C.V.; Hutchinson, W.F.; Wills, D.P.M.; Shipley, P. micro-checker: Software for identifying and correcting genotyping errors in microsatellite data. Mol. Ecol. Notes 2004, 4, 535–538. [Google Scholar] [CrossRef]
  25. Kalinowski, S.T.; Taper, M.L.; Marshall, T.C. Revising how the computer program CERVUS accommodates genotyping error increases success in paternity assignment. Mol. Ecol. 2007, 16, 1099–1106. [Google Scholar] [CrossRef]
  26. Yeh, F.; Yang, R.; Boyle, T. POPGENE Version 1.32 Microsoft Windows-Based Freeware for Populations Genetic Analysis; University of Alberta: Edmonton, Canada, 1999. [Google Scholar]
  27. Goudet, J. FSTAT, a Program to Estimate and Test Gene Diversities and Fixation Indices, Version 2.9.3; Updated from Goudet (1995). 2001. Available online: http://www.unil.ch/izea/softwares/fstat.html (accessed on 23 August 2024).
  28. Excoffier, L.; Lischer, H.E. Arlequin suite ver 3.5: A new series of programs to perform population genetics analyses under Linux and Windows. Mol. Ecol. Resour. 2010, 10, 564–567. [Google Scholar] [CrossRef]
  29. Kamvar, Z.N.; Tabima, J.F.; Grünwald, N.J. Poppr: An R package for genetic analysis of populations with clonal, partially clonal, and/or sexual reproduction. PeerJ 2014, 2, e281. [Google Scholar] [CrossRef]
  30. Kumar, S.; Stecher, G.; Li, M.; Knyaz, C.; Tamura, K. MEGA X: Molecular Evolutionary Genetics Analysis across Computing Platforms. Mol. Biol. Evol. 2018, 35, 1547–1549. [Google Scholar] [CrossRef]
  31. Porras-Hurtado, L.; Ruiz, Y.; Santos, C.; Phillips, C.; Carracedo, A.; Lareu, M.V. An overview of STRUCTURE: Applications, parameter settings, and supporting software. Front. Genet. 2013, 4, 98. [Google Scholar] [CrossRef]
  32. Piry, S.; Luikart, G.; Cornuet, J. Computer note. BOTTLENECK: A computer program for detecting recent reductions in the effective size using allele frequency data. J. Hered. 1999, 90, 502–503. [Google Scholar] [CrossRef]
  33. Freeland, J.R.; Petersen, S.D.; Kirk, H. Molecular Ecology, 2nd ed.; Wiley: Hoboken, NJ, USA, 2011. [Google Scholar]
  34. Liu, F.; Qu, Y.K.; Geng, C.; Wang, A.M.; Zhang, J.H.; Li, J.F.; Chen, K.J.; Liu, B.; Tian, H.Y.; Yang, W.P.; et al. Analysis of the population structure and genetic diversity of the red swamp crayfish (Procambarus clarkii) in China using SSR markers. Electron. J. Biotechnol. 2020, 47, 59–71. [Google Scholar] [CrossRef]
  35. Shen, Y.B.; Wang, L.; Fu, J.J.; Xu, X.Y.; Yue, G.H.; Li, J.L. Population structure, demographic history and local adaptation of the grass carp. BMC Genom. 2019, 20, 467. [Google Scholar] [CrossRef] [PubMed]
  36. Zhou, Q.; Mu, K.M.; Ni, Z.X.; Liu, X.H.; Li, Y.G.; Xu, L.A. Analysis of genetic diversity of ancient Ginkgo populations using SSR markers. Ind. Crops Prod. 2020, 145, 111942. [Google Scholar] [CrossRef]
  37. Shete, S.; Tiwari, H.; Elston, R.C. On Estimating the Heterozygosity and Polymorphism Information Content Value. Theor. Popul. Biol. 2000, 57, 265–271. [Google Scholar] [CrossRef] [PubMed]
  38. Waples, R.S.; Gaggiotti, O. What is a population? An empirical evaluation of some genetic methods for identifying the number of gene pools and their degree of connectivity. Mol. Ecol. 2006, 15, 1419–1439. [Google Scholar] [CrossRef]
  39. Duan, B.H.; Mu, S.M.; Guan, Y.Q.; Li, S.Q.; Yu, Y.; Liu, W.B.; Li, Z.J.; Ji, X.D.; Kang, X.J. Genetic diversity and population structure of the swimming crab (Portunus trituberculatus) in China seas determined by genotyping-by-sequencing (GBS). Aquaculture 2022, 555, 738233. [Google Scholar] [CrossRef]
  40. Tan, Y.F.; Peng, G.H.; Xiong, L.J.; Peng, B.; Wu, Y.B.; Song, C.W.; Feng, B.X. Genetic diversity and structure analysis of 13 red swamp crayfish (Procambarus clarkii) populations in Yangtze River basin. J. Huazhong Agric. Univ. 2020, 39, 33–39. [Google Scholar]
  41. Sun, J.X.; Peng, G.H.; Xiong, L.J.; Chen, C.; Li, Y.H.; Bai, X.F. Genome-wide SSR marker development and application in genetic diversity analysis of the red swamp crayfish, Procambarus clarkii (Girard, 1852) in China. Crustaceana 2021, 94, 189–205. [Google Scholar] [CrossRef]
  42. Liu, X.Y.; Xiong, L.J.; Peng, B.; Luo, C.R.; Peng, G.H.; Zhu, X.; Bai, X.F. Genetic Diversity Analysis of 14 Cultured Populations of Red Swamp Crayfish Procambarus clarkii in China. Fish. Sci. 2023, 42, 457–465. [Google Scholar]
  43. Herborg, L.; Weetman, D.; Oosterhout, C.V.; Hänfling, B. Genetic population structure and contemporary dispersal patterns of a recent European invader, the Chinese mitten crab, Eriocheir sinensis. Mol. Ecol. 2007, 2, 231–242. [Google Scholar] [CrossRef]
  44. Balloux, F.; Lugon-Moulin, N. The estimation of population differentiation with microsatellite markers. Mol. Ecol. 2002, 11, 155–165. [Google Scholar] [CrossRef] [PubMed]
  45. Frankham, R.; Ballou, J.D.; Briscoe, D.A.; McInnes, K.H. Introduction to Conservation Genetics; Cambridge University Press: New York, NY, USA, 2002. [Google Scholar]
  46. Zhang, J.Q.; Xu, C.X.; Wang, S.F.; Wang, S.Q.; Li, Y.M. Variations in Genetic Diversity of Invasive Species Lithobates catesbeianus in China. Animals 2024, 14, 1287. [Google Scholar] [CrossRef] [PubMed]
  47. Berg, D.J.; Garton, D.W.; Macisaac, H.J.; Panov, V.E.; Telesh, I.V. Changes in genetic structure of North American Bythotrephes populations following invasion from Lake Ladoga, Russia. Freshw. Biol. 2002, 47, 275–282. [Google Scholar] [CrossRef]
  48. Kolbe, J.J.; Glor, R.E.; Rodríguez Schettino, L.; Lara, A.C.; Larson, A.; Losos, J.B. Genetic variation increases during biological invasion by a Cuban lizard. Nature 2004, 431, 177–181. [Google Scholar] [CrossRef] [PubMed]
  49. Liu, T.; Wang, Y.J.; Wu, Y.Y.; Zhou, Y.; Lv, F.; Wu, H.Y.; Li, J.M.; Song, A.H. Genetic Diversity Analysis of 3 Populations and Their Hybrid Progenies inBlood Clam Scapharca broughtonii. Fish. Sci. 2024, 43, 561–570. [Google Scholar]
  50. Wang, P.P.; Ding, Y.D.; Yu, X.D.; Jia, X.Q.; Zhang, G.S.; Yin, S.W.; Chen, S.Q.; Zhou, G.Q. Growth Trait and Genetic Diversity in the F Progeny of Dark SleeperOdontobutis potamophila from Three Different Populations. Fish. Sci. 2016, 35, 528–534. [Google Scholar]
  51. Shi, G.R.; Ma, C.C. Biological characteristics of alien plants successful invasion. Chin. J. Appl. Ecol. 2006, 17, 727–732. [Google Scholar]
  52. Kouba, A.; Liptak, B.; Kubec, J.; Blaha, M.; Vesely, L.; Haubrock, P.J.; Oficialdegui, F.J.; Niksirat, H.; Patoka, J.; Buric, M. Survival, Growth, and Reproduction: Comparison of Marbled Crayfish with Four Prominent Crayfish Invaders. Biology 2021, 10, 422. [Google Scholar] [CrossRef]
Figure 1. Sampling of P. clarkii. Maps provided by the Map Technical Review Center of the Ministry of Natural Resources of China. Colored solid dots on maps indicate sample sites. The same color indicates populations in the same area. In the center of the map is Sichuan Province; there are 6 sampling sites in Sichuan Province. The yellow part of the map of China in the lower right corner is Hubei Province; there are 2 sampling sites in Hubei Province.
Fishes 09 00419 g001
Figure 2. NJ cluster analysis diagram of eight Chinese P. clarkii breeding populations based on Nei’s genetic distance using 12 polymorphic SSR loci. The same color indicates populations in the same area. Population abbreviation as in Table 1.
Fishes 09 00419 g002
Figure 3. Principal coordinates analysis (PCoA) based on SSR data for P. clarkii. The blue circle refers to the JL population and the red circle refers to the QJ population. The different colors and shapes represent the different P. clarkii populations. Population abbreviations are as in Table 1, in parentheses along the X- and Y-axes. Percent variance explained by PCoA1 and PCoA2.
Fishes 09 00419 g003
Figure 4. Structure analysis for eight P. clarkii breeding populations. The same color indicates populations in the same area. (a). Plot of delta K values from structure analysis; (b). bar plot from structure clustering analysis with K = 2. Population abbreviations as in Table 1.
Fishes 09 00419 g004
Table 1. Information on P. clarkii populations analyzed in this paper.
CodeLocationSample SizeDate of SamplingTotal Length (mm)Weight (g)
QJ *Hubei Qianjiang5013 April 2023108.3 ± 1.041.9 ± 14.7
JL *Hubei Jianli5018 July 202397.0 ± 7.729.9 ± 6.6
NXSichuan Nanxi5013 April 202391.4 ± 4.027.0 ± 3.2
QLSichuan Qionglai501 April 202395.8 ± 7.027.1 ± 7.3
LXSichuan Luxian5012 May 2023102.8 ± 5.935.9 ± 6.8
XWSichuan Xingwen5012 May 202391.6 ± 8.126.1 ± 9.2
NJSichuan Neijiang505 July 2023104.8 ± 5.739.7 ± 6.7
DYSichuan Daying507 July 202393.0 ± 4.325.1 ± 2.7
* Represents the population of Hubei.
Table 2. Marker information for 12 polymorphic SSR loci.
LocusPrimer Sequence (5′-3′)Repeat MotifRanges (bp)Tm (°C)Fluorochromes
PCL02F:ATCAAATCAAACGAAGCAAGAAAG
R:GAAGACGGGACACCACGAG
(TG)30245–27147TAMRA
PC2F:ATTGGAAGACCGGGTTCGAGGG
R:GGCGTAGAGGAGGTGGTGGT
(CAC)7210–22852FAM
PC17F:TCGTTTCTCCTGTATATCTACCGAGC
R: ACACACCAGGCCAGGTCCATCTT
(ATA)9187–21158TAMRA
PC19F:CAGATCAGATTTGCTATGCAGTGTTGTGT
R:AGGAATCTAATTGCTTATTCATTGCCTCC
(GCT)12158–19152FAM
PclG03F:AAGCTTACAATAAATATAGATAGAC
R:CTCTCCACCAGTCATTTCTT
(TCTA)20216–42052HEX
PclG07F:CCTCCCACCAGGGTTATCTATTCA
R: GTGGGTGTGGCGCTCTTGTT
(TCTA)8100–16058TAMRA
PclG08F:ACGATAAATGGATAGATGGATGAA
R: CCGGGTCTGTCTGTCTGTCA
(GATA)16148–22058HEX
PclG09F: TATGCACCTTTACCTGAAT
R: TGTTGGTGTGGTCATCA
(TCTA)1480–16047FAM
PclG13F:CTCTCCTGGCGCTGTTATTTAGC
R:TGAAGAGGCAGAGTGAGGATTCTC
(TCTA)12130–15058HEX
PclG17F: GTC GGG AAC CTA TTT ACA GTG TAT
R: AAG AGC GAA GAA AGA GAT AAA GAT
(TCTA)14156–19058TAMRA
PclG29F: GAA AGTCATGGGTGT AGG TGT AAC
R: TTT TTG GGC TAT GTG ACG AG
(TATC)995–16552HEX
PclG33F:TTCGAGGCGTTGCTGATTGTAAGT
R: CAAGGAAGCGTATAGCCGGAGTCT
(GT)21120–18058FAM
Table 3. Genetic diversity with different P. clarkii populations.
PopulationNaNeHoHePICIARFIS
QJ *5.1672.3800.6140.5920.5250.9964.365−0.175
JL *4.5002.4660.6290.5650.4941.0124.275−0.195
Hubei Mean4.8342.4230.6220.5780.5091.0044.320-
NX5.1672.6030.6140.5920.5251.1004.827−0.081
QL4.5802.4810.6360.5750.5091.0474.379−0.187
LX4.0002.2870.5490.5470.4670.9393.778−0.140
XW4.7502.6810.6310.6040.5311.0914.493−0.126
NJ4.9172.5530.6450.5950.5221.0684.423−0.138
DY5.2502.6460.6990.6070.5351.1214.875−0.261
Sichuan Mean4.7772.5420.6290.5870.5151.0614.462-
Na: number of alleles; Ne: number of effective alleles; Ho: observed heterozygosity; He: expected heterozygosity; PIC: polymorphic information content index. AR: allelic richness. I: Shannon’s information index; FIS: inbreeding coefficient. Mean: mean values of the genetic diversity parameter of total, Sichuan and Hubei populations. * Represents the population of Hubei.
Table 4. Matrix of pairwise Fst (below diagonal) and gene flow Nm (above diagonal) among 8 populations.
QJ *NXQLLXXWNJDYJL*
QJ *-4.1384.96967.68521.68025.208217.1414.287
NX0.057-2.3025.5844.5595.8793.54918.632
QL0.0480.098-5.3325.1675.6744.4492.045
LX0.0040.0430.045-4.34512.84634.4725.056
XW0.0110.0520.0460.010-18.07816.6654.026
NJ0.0100.0410.0420.0190.014-17.6714.621
DY0.0010.0660.0530.0070.0150.014-4.039
JL*0.0550.0130.1090.0470.0580.0510.058-
Below the diagonal is the Fst value, genetic differentiation index (Fst), and above the diagonal is the Nm value, gene flow value (Nm). The significant P value for each pairwise genetic distance was less than 0.05. * Represents the populations of Hubei.
Table 5. Analysis of Molecular variance (AMOVA) for 8 P. clarkii populations.
Source of VariationDegree of FreedomSum of SquaresMean of SquaresVariance ComponentsPercentage of VariationF-Statisticsp-Value
Among groups111.30711.3070.004 Va0.137FCT = 0.0020.505 (Va and FCT)
Among populations within groups676.21812.7030.081 Vb3.165FSC = 0.042<0.0001 (Vb and FSC)
Among individuals Within populations392804.8202.0530.304 Vc11.910FIS = 0.163<0.0001 (Vc and FIS)
within individuals4001142.0002.8552.167 Vd84.788FIT = 0.117<0.0001 (Vd and FIT)
Total7992034.345 2.556100
The values of Va, Vb, Vc, and Vd correspond, respectively, to FCT, FSC, FIS and FIT metrics.
Table 6. P-value for Wilcoxon’s test for heterozygosity excess conducted in Bottleneck [31] for 8 P. clarkii populations.
PopulationQJ *JL *NXQLLXXWNJDY
H deficiencyTPM0.3390.6040.3670.6890.6040.6610.6610.170
H excessTPM0.6890.4250.6610.3340.4250.3680.3670.849
Wilcoxon Test probability
H excess or deficiency
TPM0.6770.8500.7330.6770.8500.7330.7330.340
Model shift testLLLLLLLL
G-W value0.5490.5660.5960.5920.6020.5810.5270.643
TPM: two-phased model of mutation; G-W value: Garza–Williamson index; * represents the populations of Hubei; L: allelic shift pattern exhibited a standard L-shaped configuration with no evidence of bottleneck occurrences.
Disclaimer/Publisher’s Note: The statements, opinions and data contained in all publications are solely those of the individual author(s) and contributor(s) and not of MDPI and/or the editor(s). MDPI and/or the editor(s) disclaim responsibility for any injury to people or property resulting from any ideas, methods, instructions or products referred to in the content.

