Article

Genetic Diversity and Population Structure of Chinese Longsnout Catfish (Leiocassis longirostris) Using Microsatellite DNA Markers

1
Key Laboratory of Freshwater Biodiversity Conservation, Ministry of Agriculture and Rural Affairs, Yangtze River Fisheries Research Institute, Chinese Academy of Fishery Sciences, Wuhan 430223, China
2
Shishou Longsnout Catfish Original Seed Farm, Shishou 434400, China
3
College of Animal Science, Guizhou University, Guiyang 550025, China
4
Key Laboratory of Freshwater Fisheries and Germplasm Resources Utilization, Ministry of Agriculture and Rural Affairs, Freshwater Fisheries Research Center, Chinese Academy of Fishery Sciences, Wuxi 214081, China
*
Author to whom correspondence should be addressed.
These authors contributed equally to this work.
Fishes 2024, 9(1), 35; https://doi.org/10.3390/fishes9010035
Submission received: 20 November 2023 / Revised: 12 January 2024 / Accepted: 12 January 2024 / Published: 15 January 2024

Abstract

:
The Chinese longsnout catfish (Leiocassis longirostris) is an economically important freshwater fish in China; however, its wild resources have declined dramatically in recent decades. Understanding the genetic structure of Chinese longsnout catfish populations is crucial to guide breeding programs and fishy restoration. In this study, 15 highly polymorphic microsatellite DNA loci were used to evaluate its genetic diversity and population structure. Chinese longsnout catfish populations show high genetic diversity; they do not show significant genetic differentiation or systematic geographic pattern of variation. From the upper to the lower reaches of the Yangtze River, the genetic diversity of Chinese longsnout catfish populations showed an increasing trend. The Gezhouba and Three Gorges dams, which physically divide the Yangtze River into upstream and mid-downstream sections, did not contribute to the genetic differentiation of Chinese longsnout catfish populations. Hence, the source of broodstock is not critical for within-river breeding programs and stock enhancement to restore the wild population. In addition, possible effects of dams on differentiation among populations are crucial and long-term evaluation is essential.
Key Contribution: This study, revealing that wild populations of Chinese longsnout catfish maintain a high level of genetic diversity and show no significant genetic differentiation, will inform fishery management actions.

1. Introduction

Different individuals of the same species are not genetically identical; difference in nucleic acid sequences contribute to the genetic diversity of the species [1]. Genetic diversity is a fundamental source of biodiversity and provides the raw material for adaptive evolution [2]; increasing genetic diversity within species can improve the survival rate of individuals and their fitness in the environment [3,4,5]. Molecular markers are important tools for assessing levels and patterns of genetic diversity. Microsatellites, useful DNA markers, have attracted attention due to their extensive genomic distribution, highly conserved characteristics, and high polymorphism [6,7]. Microsatellites, or simple sequence repeats (SSRs), are short regions of 2–6 base tandem repeats observed in all prokaryotic and eukaryotic genomes [8,9]. Due to the characteristics of microsatellites and the convenience of analysis using PCR, they have been applied to evaluate the genetic diversity and population structure of numerous aquatic animals [10,11], such as walleye pollock (Theragra Chalcogramma) [12], large yellow croaker (Larimichthys crocea) [13], gibel carp (Carassius auratus gibelio Bloch) [14], hard clam (Meretrix meretrix) [15], and red swamp crayfish (Procambarus clarkii) [16,17].
The Chinese longsnout catfish (Leiocassis longirostris), also known as Jiangtuan in some regions, belongs to the family Bagridae, which comprises >220 species [18]; it is primarily distributed in the Yangtze River and Pearl River drainages, and is found in the Liaohe River, Huaihe River, and other drainage in eastern China [19]. The Chinese longsnout catfish is a semi-migratory fish; however, its historical migration route has been disrupted by river damming; anthropogenic activities, such as overfishing and environmental pollution, have led to the degradation and fragmentation of its habitat in the Yangtze River Basin and the loss of spawning grounds [20], resulting in a decline in its wild population. Due to its nutritional value and flavor, Chinese longsnout catfish has become an important commercial fish species in China [21]. Artificial propagation of Chinese longsnout catfish has been achieved, and its domestic supply is currently almost entirely artificially bred [22]. Poorly designed breeding programs, which can be caused by inbreeding associated with the use of a small number of parents to establish and maintain a strain, can lead to decreased genetic variability [23]. Therefore, knowledge of genetic diversity and population structure is crucial for understanding population dynamics, defining management units, and maintaining sustainable fisheries [24]. In Chinese longsnout catfish, one previous microsatellite study showed no significant genetic differentiation or systematic geographic pattern of this species in the Yangtze River [25]. Notably, high genetic diversity was observed in the cultured populations of Chinese longsnout catfish [26]. However, recently, the genetic diversity and differentiation of wild Chinese longsnout catfish have not been analyzed, which is vital to guide artificial proposition and release to restore wild populations and assess the impact of the ten-year fishing ban in the Yangtze River.
In the present study, 15 microsatellite markers developed using transcriptome sequencing were used to evaluate the genetic diversity of Chinese longsnout catfish collected from the Yangtze and Pearl River basins. Additionally, genetic differentiation and structure among populations were analyzed, to provide useful information for the artificial propagation, release, and enhancement of wild populations.

2. Materials and Methods

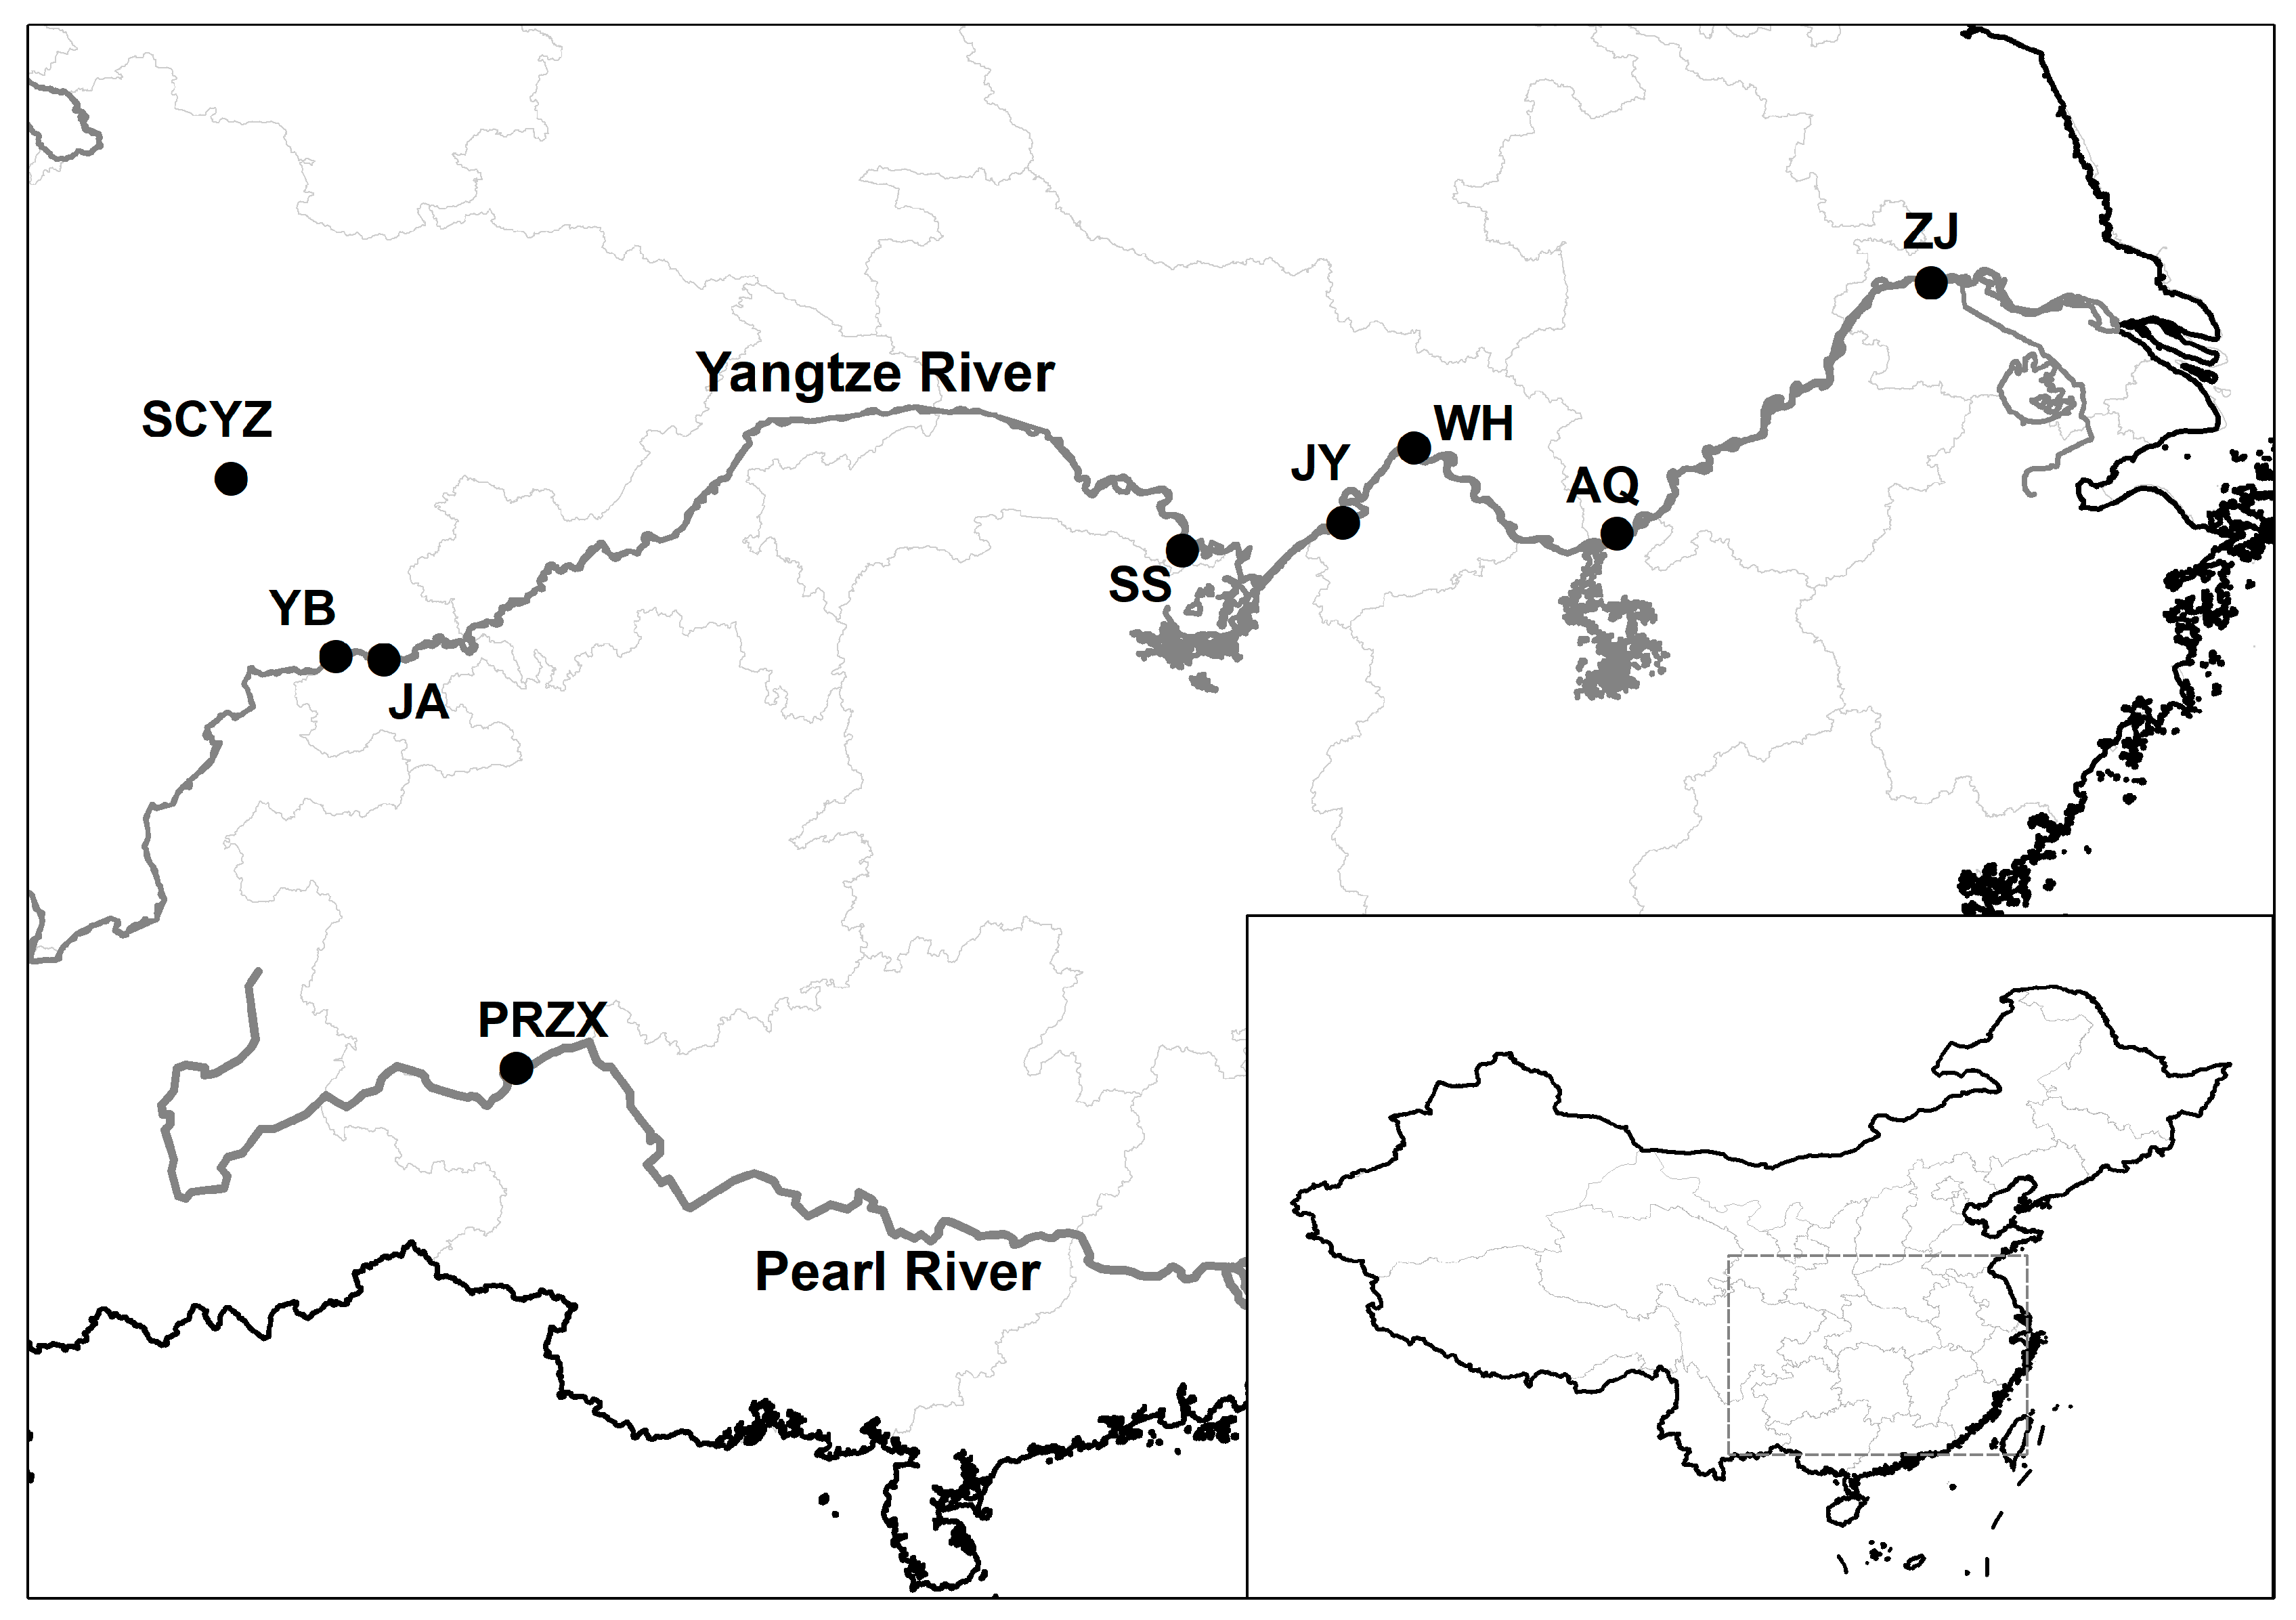
2.1. Sample Collection and DNA Extraction

A total of 170 Chinese longsnout catfish were collected from eight wild populations from the Yangtze and Pearl River basins and one seed stock population from the Sichuan Chinese Longsnout Catfish Foundation Seed Farm (Figure 1, Table 1). Blood or caudal fin (preserved in absolute ethanol) was collected from fresh specimens and frozen at −20 °C. All experimental procedures were performed according to the Guiding Principles for the Care and Use of Laboratory Animals at the Yangtze River Fisheries Research Institute, Chinese Academy of Fishery Sciences, China. Genomic DNA was extracted from each fish according using the Genomic DNA Extraction Kit (Wuhan Tianyi Huayu Gene Technology Co., Ltd., Wuhan, China). The quantity and quality of isolated DNA were determined using a NanoDrop 8000 spectrophotometer (Thermo Fisher Scientific, Waltham, MA, USA) and agarose gel electrophoresis, respectively. The extracted DNAs were stored at −20 °C for further analysis.

2.2. Microsatellite Loci

SSR searches and analyses were performed using Chinese longsnout catfish transcriptome data. Primers for 192 SSR loci were designed using Primer premier 5 [27]. Eight individuals were randomly selected for the assessment of SSR polymorphisms and applicability of primers using PCR and 10% polyacrylamide gel electrophoresis, and the population structure study was conducted using 15 screened polymorphic loci.
The 5′ ends of the forward primers of each pair were labeled with fluorescent dyes (TAMRA, HEX or FAM). The PCR reaction system (10 μL) contained 1 μL template DNA (20 ng), 5 μL 2× Taq PCR Master Mix (Genetech, Shanghai, China), 0.5 μL forward and reverse primers, and 3 µL sterile water. The PCR amplification program was performed as follows: initial denaturation at 95 °C for 5 min; 10 cycles at 95 °C for 30 s (denaturation); 52–62 °C for 30 s (annealing; each cycle decreased by 1 °C); and at 72 °C for 30 s (extension); 25 cycles at 95 °C for 30 s (denaturation); 52 °C for 30 s (annealing), 72 °C for 30 s (extension); and a final extension step at 72 °C for 20 min; and stored at 4 °C. After the PCR reaction, the amplified products were detected by fluorescence capillary electrophoresis using an ABI3730xl DNA sequencer (Applied Biosystems, Inc., Carlsbad, CA, USA). GeneMarker software (version 2.6.4) was used to analyze the results, and the allele number, peak map, and genotype of each sample were obtained [28].

2.3. Microsatellite Analyses

GenAlEx software (version 6.501) was used to calculate the genetic diversity indices of the SSR loci and populations, including the observed number of alleles (Na), effective number of alleles (ne), Shannon index (I), polymorphism information index (PIC), observed heterozygosity (Ho), expected heterozygosity (He), and inbreeding coefficient (Fis) [29,30,31,32,33].
The genetic distance between populations was calculated using the PowerMarker software (version 3.25) [34,35]. The neighbor-joining method was used for cluster analysis, and a cluster plot was drawn [36]. STRUCTURE 2.3.4 was used to analyze the population structure of 170 samples [37,38]. The following parameters were set: K = 1~20, burn-in period of 10,000, and Markov chain Monte Carlo (MCMC) of 100,000, and each K value was run 20 times; the online tool STRUCTURE HARVESTER was used to calculate the best ΔK value (the best population stratification situation) [39]. The structural analysis result plot was generated using CLUMPP and DISTRUCT software (version 1.1; version 1.1) [40,41].
Analysis of molecular variance (AMOVA) was used to partition the genetic variation within and among individuals and populations and calculate the paired genetic differentiation coefficient to evaluate the genetic differentiation between populations. Principal coordinate analysis (PCoA) was used to visualize similarities or differences between the respective populations [42,43]. Based on the results of the population genetic structure analysis, the variation and differentiation between and within populations were calculated using GenAlEx software (version 6.501), and significance was tested. The gene flow (Nm) was estimated according to the formula of Wright (1931): Nm = 0.25 (1 − Fst)/Fst [44,45].

3. Results

3.1. Polymorphism of Markers

Based on the transcriptome data of the Chinese longsnout catfish, 192 SSR loci were identified. After detecting potential primer-binding sites in eight randomly selected samples, 15 SSR loci with high polymorphism and stable amplification were identified (Table 2). Population genetic diversity analysis was performed on the collected samples using the 15 loci.
In total, 185 alleles were observed among 170 samples (Table 3). The number of alleles per locus ranged from 9 (Lli093) to 16 (Lli079), and the average number of alleles per locus was 12.3. The total ne was 72.9, with a numerical range of 2.4 (Lli075) to 8.9 (Lli167) and an average of 4.9. The I value ranged from 1.24 (Lli075) to 2.27 (Lli167), with an average value of 1.78. The numerical range of Ho was 0.49 (Lli075) to 0.93 (Lli167), with a mean of 0.74. The numerical range of He was 0.59 (Lli075) to 0.89 (Lli167), with a mean value of 0.77. The value range of PIC was 0.55 (Lli075) to 0.88 (Lli167), with an average value of 0.74. Based on these results, all 15 microsatellite loci showed high polymorphism (PIC > 0.5).

3.2. Genetic Variation within Different Populations

The Na values of all populations ranged from 5.2 (SCYZ) to 8.9 (AQ) with an average of 6.3, and the ne values ranged from 2.94 (SCYZ) to 5.30 (AQ) with an average of 4.11. The I value ranged from 1.19 (SCYZ) to 1.80 (AQ), with an average of 1.47. The Ho ranged from 0.70 (ZJ) to 0.78 (SS) and He ranged from 0.61 (SCYZ) to 0.79 (ZJ), with mean values of 0.73 and 0.72, respectively (Table 4). The Ho values of six populations (JA, SCYZ, SS, WH, YB, and PRZX) were greater than their He values, indicating that these populations were slightly heterozygote-surplus, whereas the Ho values of the other three populations (AQ, JY, and ZJ) were lower than their He values, indicating that these populations were slightly heterozygote-deficient.

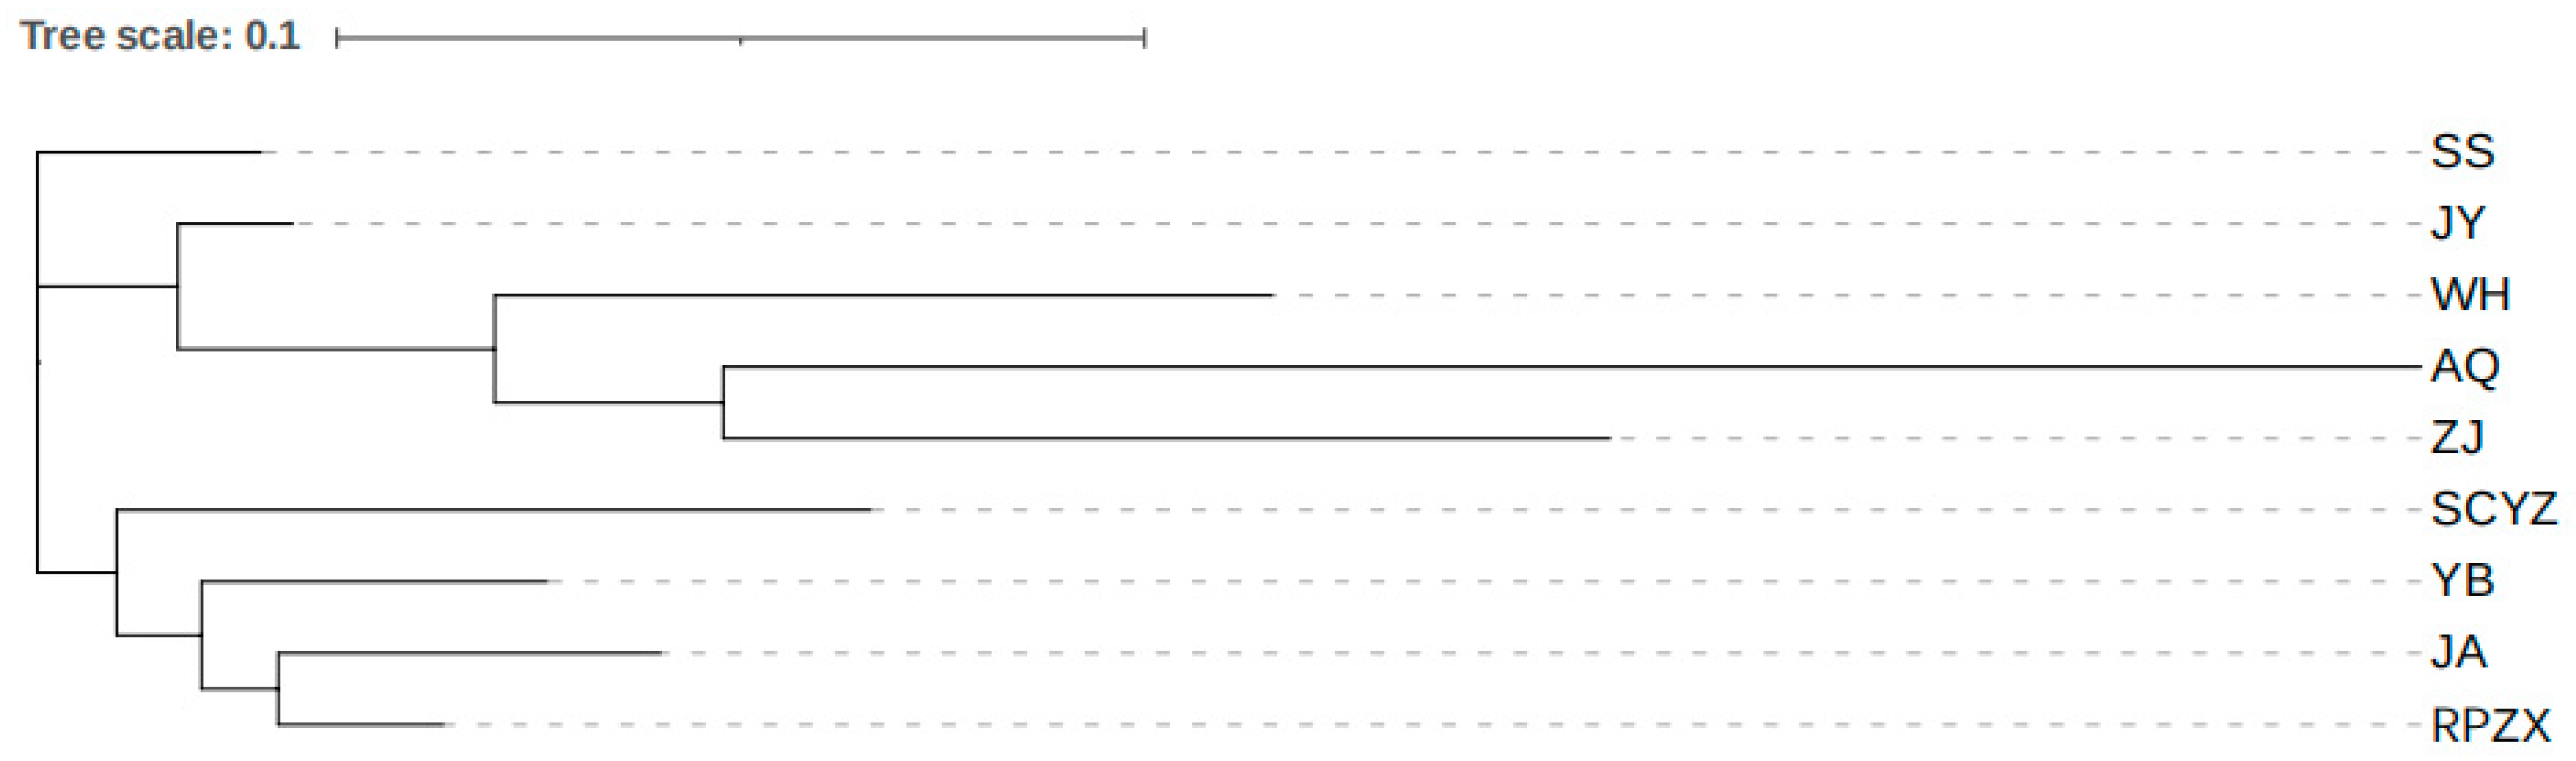
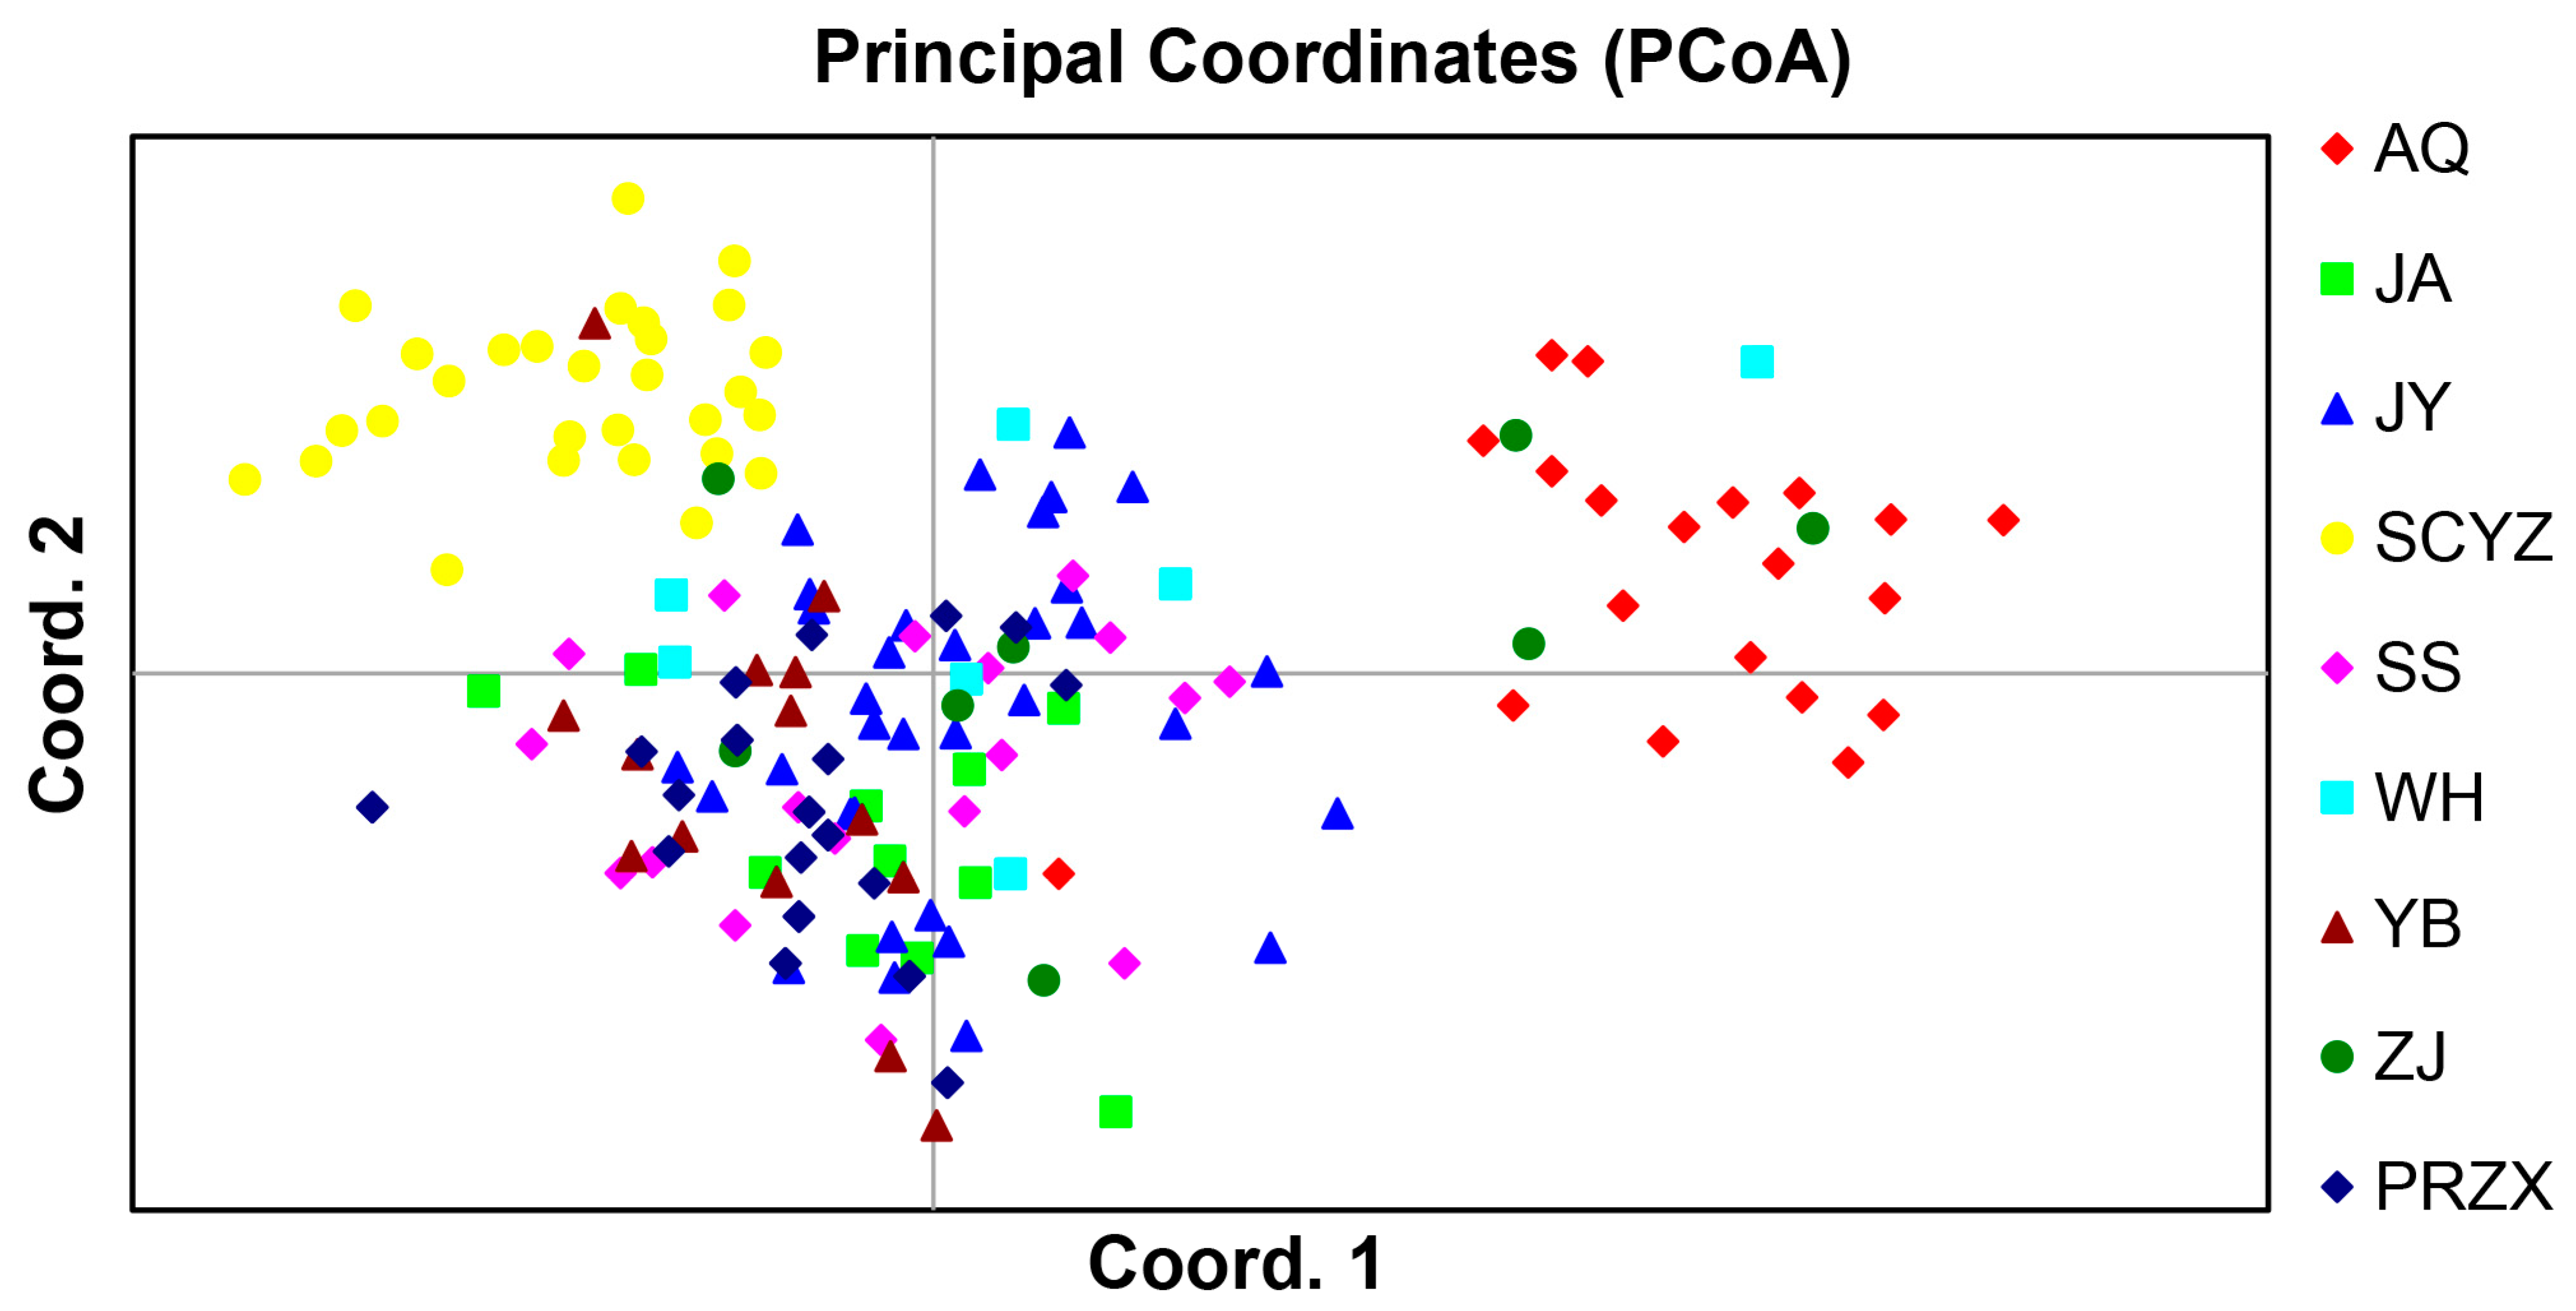
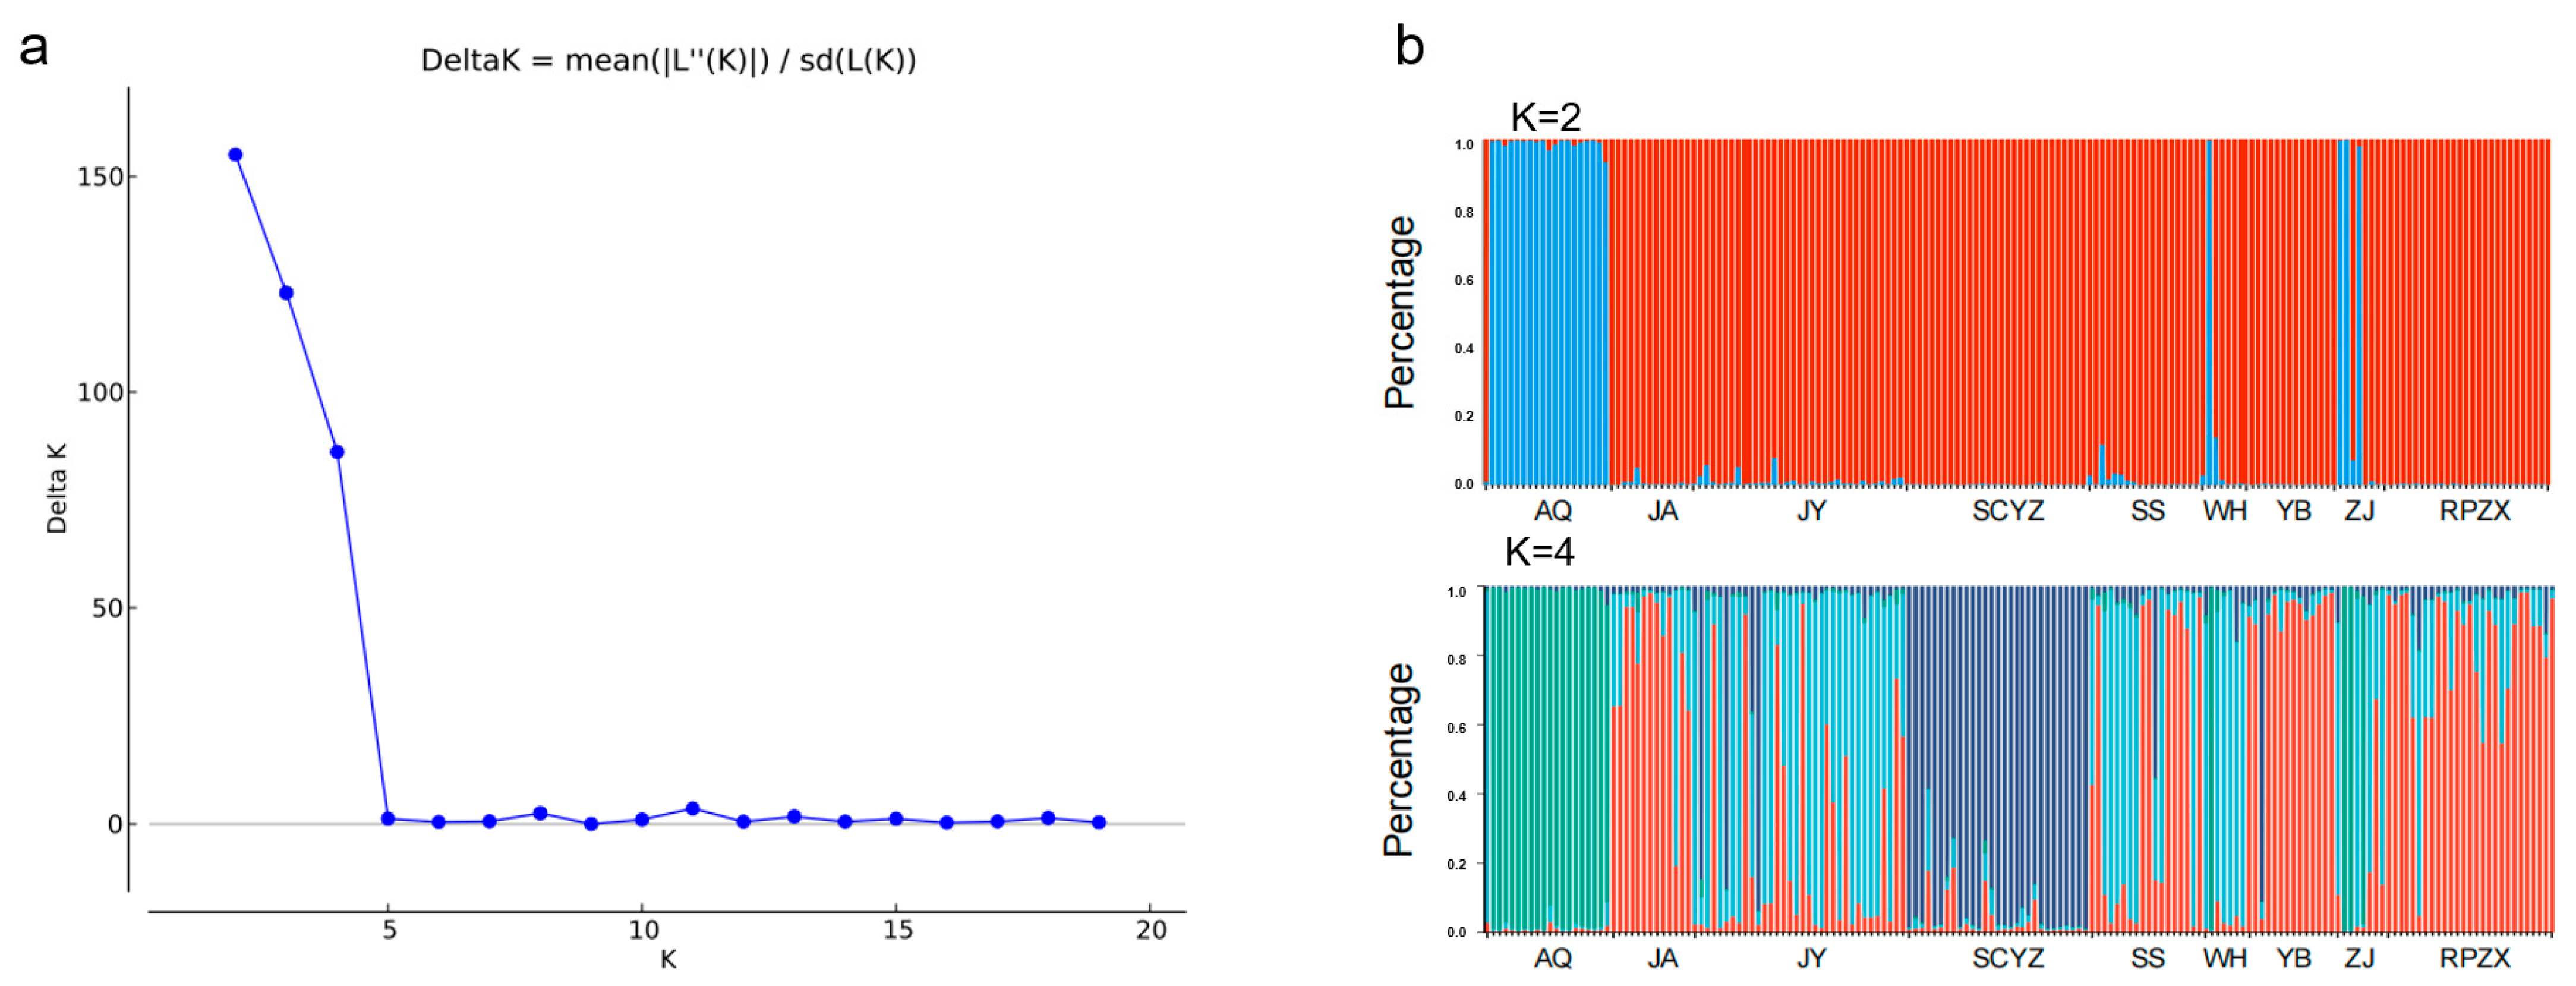
3.3. Population Genetic Differentiation and Structure

The genetic differentiation among the nine populations showed pairwise Fst values ranging from 0.013 (SS/JY) to 0.110 (AQ/SCYZ), indicating that there were different degrees of genetic differentiation, but they were relatively low (Table 5). The estimated number of migrants per generation (Nm) among the nine populations ranged from 2.0 to 18.9, indicating a moderate to high level of gene flow among the populations, with JY showing the highest gene flow among the populations and AQ demonstrating the lowest.
The maximum genetic distance among the nine populations was 0.401 (AQ/SCYZ), and the minimum was 0.065 (JY/SS) (Table 6). The neighbor-joining method based on Nei genetic distance was used for cluster analysis, which showed that there were two independent branches; populations in the mid-downstream of the Yangtze River were located in one independent branch, and the other four populations were located in the other (Figure 2). The clustering analysis results did not show a clear systematic geographical pattern.
Within population genetics, PCoA can be used to visualize the similarity or dissimilarity of sampled populations. The scatter plot (Figure 3) shows that the AQ and SCYZ populations clustered separately, and the other populations were clustered together. AMOVA was used to partition genetic variation between genotypes or collection of genotypes; results revealed that 6% of the genetic variation occurred among populations, 1% among individuals within populations, and 93% within individuals, with variation within individuals being the primary source of total variation (Table 7). All populations in the Yangtze River were divided into two groups (upstream and mid-downstream populations), and AMOVA was conducted. The results showed that 3% of genetic variation occurred among populations, 8% among individuals within population, and 90% within individuals (Table 8).
Structuring within and among the nine populations were evaluated using 15 microsatellite loci. Applying the maximum likelihood algorithm within STRUCTURE [37,38] resulted in the best-supported K value being 2, and the nine populations could be divided into two subgroups (Figure 4a,b). In addition, the result with K value being 4 showed that the AQ and SCYZ were the most distinct populations, revealing the distinction of the most downstream natural population and the genetically bottlenecked cultured population.

4. Discussion

4.1. Genetic Diversity

The availability of DNA sequences from the transcriptome enabled the random selection of 192 SSR loci; 15 polymorphic loci were identified from the transcriptome data in this study. According to previous studies, loci with PIC values > 0.5 were highly informative [46]; PIC values of the 15 microsatellite loci selected in this study ranged from 0.55–0.88, indicating that all the loci were highly informative and sufficient to discriminate individuals and populations of Chinese longsnout catfish. Genetic diversity is crucial to the adaption of a population to environmental changes. It can be understood as the ability of a wild population to cope with natural selection by altering its allele frequencies [47,48,49]. The results showed that the average He of the microsatellite loci was 0.77, and the average number of alleles was 12.3, indicating a high level of genetic diversity; this was higher than the mean genetic diversity of 30 freshwater fishes (average He = 0.46, Na = 7.50) [50]. The high genetic diversity of Chinese longsnouted catfish suggests that its historic effective population could have been very large.
However, the genetic diversity in this study was lower than that of a previous study conducted in 2012 that used 20 microsatellite loci to evaluate the genetic diversity of Chinese longsnout catfish in the Yangtze River valley (He = 0.8095; Na = 18.5) [51]. This could be attributed to the different polymorphism of the respective collections of microsatellite markers and the number of samples, as different loci have different degrees of polymorphism and the sample size used for microsatellite analysis is positively correlated with the average values PIC and Na [52]. Another possible reason is the decline in Chinese longsnout catfish wild resource over the past decades due to overfishing, habitat degradation, and pollution, consequently resulting in a decrease in genetic diversity. Therefore, it is crucial to monitor the genetic diversity of Chinese longsnout catfish.

4.2. Population Structure

The pairwise Fst values of Chinese longsnout catfish (0.014–0.110) were considered small, indicating that different populations of Chinese longsnout catfish show relatively low genetic differentiation [53]. Gene mutations and random genetic drift primarily cause genetic differentiation among populations. Although the PRZX population belonged to the Pearl River basin, its genetic differentiation from the other eight populations remained low, and this population clustered with JA and YB populations from the upper reaches of the Yangtze River. This could be because the PRZX population was derived from individuals that escaped from the cultured population, and their seeds came from breeding farms located in the upper reaches of the Yangtze River. In contrast, the SCYZ population collected from the Sichuan Chinese Longsnout Catfish Foundation Seed Farm showed the lowest genetic diversity, which could be attributed to the fact that it was the offspring of only a few parents. Furthermore, this population clustered with populations from the upper and middle reaches of the Yangtze River, further demonstrating minimal genetic differentiation among the populations collected from different geographic sites.
Phylogenetic tree results revealed that Chinese longsnout catfish did not show a systematic geographic pattern, and pairwise Fst analysis and genetic distance analyses further confirmed this result. This indicates that geographic distance does not predict the phylogenetic structure of Chinese longsnout catfish. Additionally, the genetic diversity of Chinese longsnout catfish populations in the upper, middle, and lower reaches of the Yangtze River gradually increased, and a similar result was obtained in a previous study [51]. With increasing genetic diversity, the downstream populations exhibited more unique alleles. Because the sampling site of the AQ population is located in the Aquatic Germplasm Resources Conservation Zone of Chinese longsnout catfish, many individuals are available to provide a lot of raw material for genetic variation. This may explain why the downstream populations (AQ and ZJ) of the Yangtze River grouped into a single cluster.
The Yangtze River originates in the southwest of Qinghai Province, flows from west to east, and finally flows into the East China Sea. The Gezhouba and Three Gorges dams are located in Yichang City, Hubei Province, and physically divide the Yangtze River into upstream and mid-downstream areas; the mid-stream and downstream reaches of the Yangtze River are continuous areas. According to the pairwise Fst values and AMOVA results, the degree of genetic differentiation between the upstream and mid-downstream populations of Chinese longsnout catfish was low, indicating that these dams did not cause significant genetic differentiation between the upstream and mid-downstream populations. A previous study on the genetic structure of Chinese longsnout catfish revealed similar results [51]. This may have been due to the short time since construction of these dams. In addition, the escape of individuals from the hatchery population to the wild or artificially released individuals could lead to the exchange of gene pools between different populations and increase the genetic homogeneity of the populations. A similar situation has been observed in other fishes, such as marble trout (Salmo trutta marmoratus) [54], brown trout (Salmo trutta) [55], and Arctic charr (Salvelinus alpinus) [56]. However, dams hinder the gene flow between the upstream and mid-downstream populations, potentially impacting the genetic structure. Therefore, it is critical to conduct long-term monitoring of the population structure to assess the ongoing influence of dams on the genetic structure of Chinese longsnout catfish.

4.3. Conservation Implications

Habitat and spawning ground protection and stock enhancement have effectively improved some declining wild freshwater fish resources. In the present study, Chinese longsnout catfish populations showed high genetic diversity and a relatively low degree of genetic differentiation among different populations. Consequently, in the Yangtze River basin, the origin of individuals is not significant for breeding programs of Chinese longsnout catfish; therefore, when artificial propagation and release of cultured fish is practiced, the source of parents is not as critical as obtaining a large broodstock and implementing practices to maintain genetic variation. On 1 January 2021, the Chinese government implemented the ten-year fishing ban on the Yangtze River, which can significantly protect the Yangtze River ecosystem; therefore, it is necessary to analyze the genetic diversity and structural variation of Chinese longsnout catfish to evaluate the effects of the ban. Further research, such as the genomic study of SNP (single nucleotide polymorphism) variation and the analysis of adaptive genetic variation of Chinese longsnout catfish, are of great significance.

5. Conclusions

In this study, 15 new microsatellite DNA loci were developed for Chinese longsnout catfish and used for the genetic analysis of eight wild populations from the Yangtze and Pearl River basins and one stocked seed population from the Sichuan Chinese Longsnout Catfish Foundation Seed Farm. Genetic diversity within these populations was relatively high, and genetic differentiation was low, even among populations from the Yangtze and Pearl River basins. Therefore, when implementing breeding programs and stock enhancement of Chinese longsnout catfish to restore the wild population, the sources of parents and individuals should not be considered as significant a factor as collecting broodstock and maintaining genetic variation. In addition, long-term evaluation of the effects of the Gezhouba and Three Gorges dams on the genetic differentiation and structure of Chinese longsnout catfish should be conducted.

Author Contributions

Conceptualization, H.Y. (Huan Ye) and C.L.; methodology, H.Y. (Huan Ye), J.F. and H.Y. (Huamei Yue); software, X.S., J.S., Y.W. and R.R.; validation, J.L., J.S. and Y.W.; investigation, D.L.; data curation and writing—original draft preparation, Y.H.; writing—review and editing, H.Y. (Huan Ye); supervision and project administration, C.L. All authors have read and agreed to the published version of the manuscript.

Funding

This research was funded by the Central Public-Interest Scientific Institution Basal Research Fund, CAFS (Nos. 2022XT0301, 2023TD23, and 2023TD11), Central Public-Interest Scientific Institution Basal Research Fund (YFI202206), and the Science and Technology Project of Guizhou Province (No. [2020]4Y027).

Institutional Review Board Statement

The animal study was examined and approved by the Laboratory Animal Center of the Yangtze River Fisheries Research Institute of the Chinese Academy of Fishery Sciences, and the approval number is YFIYH02, and the approval date is 30 December 2020.

Data Availability Statement

Data are contained within the article.

Acknowledgments

The authors would like to express thanks to the staffs of the Yangtze River Fisheries Research Institute of the Chinese Academy of Fishery Sciences. The authors also thank the reviewers for elaborating on the manuscript through their comments.

Conflicts of Interest

The authors declare no conflicts of interest.

References

  1. Ellegren, H.; Galtier, N. Determinants of genetic diversity. Nat. Rev. Genet. 2016, 17, 422–433. [Google Scholar] [CrossRef]
  2. Hughes, A.R.; Inouye, B.D.; Johnson, M.T.; Underwood, N.; Vellend, M. Ecological consequences of genetic diversity. Ecol. Lett. 2008, 11, 609–623. [Google Scholar] [CrossRef]
  3. Gamfeldt, L.; Källström, B. Increasing intraspecific diversity increases predictability in population survival in the face of perturbations. Oikos 2007, 116, 700–705. [Google Scholar] [CrossRef]
  4. Schäfer, D.; Vincent, H.; Fischer, M.; Kempel, A. The importance of genetic diversity for the translocation of eight threatened plant species into the wild. Glob. Ecol. Conserv. 2020, 24, e01240. [Google Scholar] [CrossRef]
  5. Frankham, R. Genetics and extinction. Biol. Conserv. 2005, 126, 131–140. [Google Scholar] [CrossRef]
  6. Liu, Z.J.; Cordes, J.F. DNA marker technologies and their applications in aquaculture genetics. Aquaculture 2004, 238, 1–37. [Google Scholar] [CrossRef]
  7. Li, J.; Wang, G.; Bai, Z. Genetic variability in four wild and two farmed stocks of the Chinese freshwater pearl mussel (Hyriopsis cumingii) estimated by microsatellite DNA markers. Aquaculture 2009, 287, 286–291. [Google Scholar] [CrossRef]
  8. Rassmann, K.; Schlötterer, C.; Tautz, D. Isolation of simple-sequence loci for use in polymerase chain reaction-based DNA fingerprinting. Electrophoresis 1991, 12, 113–118. [Google Scholar] [CrossRef]
  9. Zane, L.; Bargelloni, L.; Patarnello, T. Strategies for microsatellite isolation: A review. Mol. Ecol. 2002, 11, 1–16. [Google Scholar] [CrossRef]
  10. Abdul Muneer, P.M.; Gopalakrishnan, A.; Musammilu, K.K.; Mohindra, V.; Lal, K.K.; Basheer, V.S.; Lakra, W.S. Genetic variation and population structure of endemic yellow catfish, Horabagrus brachysoma (Bagridae) among three populations of Western Ghat region using RAPD and microsatellite markers. Mol. Biol. Rep. 2009, 36, 1779–1791. [Google Scholar] [CrossRef]
  11. Bardakci, F.; Skibinski, D.O.F. Application of the RAPD technique in tilapia fish: Species and subspecies identification. Heredity 1994, 73, 117–123. [Google Scholar] [CrossRef]
  12. O’Reilly, P.T.; Canino, M.F.; Bailey, K.M.; Bentzen, P. Inverse relationship between FST and microsatellite polymorphism in the marine fish, walleye pollock (Theragra chalcogramma): Implications for resolving weak population structure. Mol. Ecol. 2004, 13, 1799–1814. [Google Scholar] [CrossRef] [PubMed]
  13. Guo, W.; Wang, Z.Y.; Wang, Y.L.; Zhang, Z.P.; Gui, J.F. Isolation and characterization of six microsatellite markers in the large yellow croaker (Pseudosciaena crocea Richardson). Mol. Ecol. Notes 2005, 5, 369–371. [Google Scholar] [CrossRef]
  14. Li, F.B.; Gui, J.F. Clonal diversity and genealogical relationships of gibel carp in four hatcheries. Anim. Genet. 2008, 39, 28–33. [Google Scholar] [CrossRef]
  15. Lu, X.; Wang, H.; Dai, P.; Liu, B. Characterization of EST-SSR and genomic-SSR markers in the clam, Meretrix meretrix. Conserv. Genet. Resour. 2011, 3, 655–658. [Google Scholar] [CrossRef]
  16. Yue, G.H.; Li, J.; Bai, Z.; Wang, C.M.; Feng, F. Genetic diversity and population structure of the invasive alien red swamp crayfish. Biol. Invasions 2010, 12, 2697–2706. [Google Scholar] [CrossRef]
  17. Guo, X.F.; Liu, M.; Zhou, Y.L.; Wei, W.Y.; Li, Z.; Zhou, L.; Wang, W.Z.; Gui, J.F. Genetic Diversity Evaluation and Population Structure Analysis of Red Swamp Crayfish (Procambarus clarkii) from Lakes and Rice Fields by SSR Markers. Fishes 2022, 7, 142. [Google Scholar] [CrossRef]
  18. Ferraris, C.J. Checklist of catfishes, recent and fossil (Osteichthyes: Siluriformes), and catalogue of siluriform primary types. Zootaxa 2007, 1418, 1–628. [Google Scholar] [CrossRef]
  19. Shen, T.; He, X.; Lei, M.; Wang, J.; Li, X.; Li, J. Cloning and structure of a histocompatibility class IIA gene (Lelo-DAA) in Chinese longsnout catfish (Leiocassis longirostris). Genes Genome 2014, 36, 745–753. [Google Scholar] [CrossRef]
  20. Luo, H.; Li, Y.; Zheng, S.; Zhou, J.; Zou, X.; Li, C.; Ye, H.; Li, Z.; Zhou, C.; Lv, G.; et al. Identification of male sex-specific markers using genome re-sequencing in the Chinese longsnout catfish Leiocassis longirostris. Aquaculture 2022, 558, 738392. [Google Scholar] [CrossRef]
  21. Wang, Z.; Zhou, J.; Ye, Y.; Wei, Q.; Wu, Q. Genetic structure and low-genetic diversity suggesting the necessity for conservation of the Chinese longsnout catfish, Leiocassis longirostris (Pisces: Bagriidae). Environ. Biol. Fishes 2006, 75, 455–463. [Google Scholar] [CrossRef]
  22. Zhu, L.; Li, Z.H.; Li, X.X.; Yang, Z.Q. Artificial breeding and culture techniques of Leiocassis longirostris. Aquac. 2020, 41, 54–55. [Google Scholar]
  23. Yu, H.; Li, Q. Genetic variation of wild and hatchery populations of the Pacific oyster Crassostrea gigas assessed by microsatellite markers. J. Genet. Genom. 2007, 34, 1114–1122. [Google Scholar] [CrossRef] [PubMed]
  24. Thorpe, J.P.; Solé-Cava, A.M.; Watts, P.C. Exploited marine invertebrates: Genetics and fisheries. Mar. Genet. 2000, 144, 165–184. [Google Scholar]
  25. Xiao, M.; Yang, G. Isolation and characterization of 17 microsatellite loci for the Chinese longsnout catfish (Leiocassis longirostris). Mol. Ecol. Resour. 2009, 9, 1039–1041. [Google Scholar] [CrossRef] [PubMed]
  26. Zhang, L.; Mou, C.; Zhou, J.; Ye, H.; Wei, Z.; Ke, H.; Hang, Z.; Duan, Y.; Zhao, Z.; Zhao, H.; et al. Genetic Diversity of Chinese Longsnout Catfish (Leiocassis longirostris) in Four Farmed Populations Based on 20 New Microsatellite DNA Markers. Diversity 2022, 14, 654. [Google Scholar] [CrossRef]
  27. Lalitha, S. Primer Premier 5. Biotech Sofw. Int. Rep. 2000, 1, 270–272. [Google Scholar] [CrossRef]
  28. Holland, M.M.; Parson, W. GeneMarker® HID: A reliable software tool for the analysis of forensic STR data. J. Forensic Sci. 2011, 56, 29–35. [Google Scholar] [CrossRef]
  29. Peakall, R.; Smouse, P.E. GenAlEx 6.5: Genetic analysis in Excel. Population genetic software for teaching and research–an update. Bioinformatics 2012, 28, 2537–2539. [Google Scholar] [CrossRef]
  30. Meirmans, P.G. Using the AMOVA framework to estimate a standardized genetic differentiation measure. Evolution 2006, 60, 2399–2402. [Google Scholar] [CrossRef]
  31. Meirmans, P.G.; Hedrick, P.W. Assessing population structure: FST and related measures. Mol. Ecol. Resour. 2011, 11, 5–18. [Google Scholar] [CrossRef] [PubMed]
  32. Balloux, F.; Goudet, J. Statistical properties of population differentiation estimators under stepwise mutation in a finite island model. Mol. Ecol. 2002, 11, 771–783. [Google Scholar] [CrossRef] [PubMed]
  33. Excoffier, L.; Lischer, H.E.L. Arlequin suite ver 3.5: A new series of programs to perform population genetics analyses under Linux and Windows. Mol. Ecol. Resour. 2010, 10, 564–567. [Google Scholar] [CrossRef] [PubMed]
  34. Cavalli-Sforza, L.L.; Edwards, A.W. Phylogenetic analysis. Models and estimation procedures. Am. J. Hum. Genet. 1967, 19, 233–257. [Google Scholar] [PubMed]
  35. Kimura, M. Process Leading to Quasi-Fixation of Genes in Natural Populations Due to Random Fluctuation of Selection Intensities. Genetics 1954, 39, 280–295. [Google Scholar] [CrossRef] [PubMed]
  36. Kumar, S.; Stecher, G.; Tamura, K. MEGA7: Molecular evolutionary genetics analysis version 7.0 for bigger datasets. Mol. Biol. Evol. 2016, 33, 1870–1874. [Google Scholar] [CrossRef] [PubMed]
  37. Pritchard, J.K.; Stephens, M.; Donnelly, P. Inference of population structure using multilocus genotype data. Genetics 2000, 155, 945–959. [Google Scholar] [CrossRef]
  38. Evanno, G.; Regnaut, S.; Goudet, J. Detecting the number of clusters of individuals using the software STRUCTURE: A simulation study. Mol. Ecol. 2005, 14, 2611–2620. [Google Scholar] [CrossRef]
  39. Earl, D.A.; VonHoldt, B.M. STRUCTURE HARVESTER: A website and program for visualizing STRUCTURE output and implementing the Evanno method. Conserv. Genet. Resour. 2012, 4, 359–361. [Google Scholar] [CrossRef]
  40. Jakobsson, M.; Rosenberg, N.A. CLUMPP: A cluster matching and permutation program for dealing with label switching and multimodality in analysis of population structure. Bioinformatics 2007, 23, 1801–1806. [Google Scholar] [CrossRef]
  41. Rosenberg, N.A. DISTRUCT: A program for the graphical display of population structure. Mol. Ecol. Notes 2004, 4, 137–138. [Google Scholar] [CrossRef]
  42. Kalinowski, S.T.; Taper, M.L.; Marshall, T.C. Revising how the computer program CERVUS accommodates genotyping error increases success in paternity assignment. Mol. Ecol. 2007, 16, 1099–1106. [Google Scholar] [CrossRef]
  43. Dray, S.; Legendre, P.; Peres-Neto, P.R. Spatial modelling: A comprehensive framework for principal coordinate analysis of neighbour matrices (PCNM). Ecol. Model. 2006, 196, 483–493. [Google Scholar] [CrossRef]
  44. Rice, W.R. Analyzing tables of statistical tests. Evolution 1989, 43, 223–225. [Google Scholar] [CrossRef]
  45. Wright, S. Evolution in Mendelian populations. Genetics 1931, 16, 97. [Google Scholar] [CrossRef]
  46. Botstein, D.; White, R.L.; Skolnick, M.; Davis, R.W. Construction of a genetic linkage map in man using restriction fragment length polymorphisms. Am. J. Hum. Genet. 1980, 32, 314. [Google Scholar]
  47. Conover, D.O. Local adaptation in marine fishes: Evidence and implications for stock enhancement. Bull. Mar. Sci. 1998, 62, 477–493. [Google Scholar]
  48. Hughes, A.R.; Stachowicz, J.J. Genetic diversity enhances the resistance of a seagrass ecosystem to disturbance. Proc. Natl. Acad. Sci. USA 2004, 101, 8998–9002. [Google Scholar] [CrossRef]
  49. Hoban, S.; Arntzen, J.A.; Bruford, M.W.; Godoy, J.A.; Rus Hoelzel, A.; Segelbacher, G.; Vilà, C.; Bertorelle, G. Comparative evaluation of potential indicators and temporal sampling protocols for monitoring genetic erosion. Evol. Appl. 2014, 7, 984–998. [Google Scholar] [CrossRef]
  50. DeWoody, J.A.; Avise, J.C. Microsatellite variation in marine, freshwater and anadromous fishes compared with other animals. J. Fish Biol. 2000, 56, 461–473. [Google Scholar] [CrossRef]
  51. Yang, G.; Xiao, M.; Yu, Y.; Xu, S. Genetic variation at mtDNA and microsatellite loci in Chinese longsnout catfish (Leiocassis longirostris). Mol. Biol. Rep. 2012, 39, 4605–4617. [Google Scholar] [CrossRef]
  52. Reiner, G.; Lang, M.; Willems, H. Impact of different panels of microsatellite loci, different numbers of loci, sample sizes, and gender ratios on population genetic results in red deer. Eur. J. Wildl. Res. 2019, 65, 25. [Google Scholar] [CrossRef]
  53. Liu, F.; Xia, J.H.; Bai, Z.Y.; Fu, J.J.; Li, J.L.; Yue, H.G. High genetic diversity and substantial population differentiation in grass carp (Ctenopharyngodon idella) revealed by microsatellite analysis. Aquaculture 2009, 297, 51–56. [Google Scholar] [CrossRef]
  54. Berrebi, P.; Jesenšek, D.; Crivelli, A.J. Natural and domestic introgressions in the marble trout population of Soča River (Slovenia). Hydrobiologia 2017, 785, 277–291. [Google Scholar] [CrossRef]
  55. Berrebi, P.; Povz, M.; Jesensek, D.; Cattaneo-Berrebi, G.; Crivelli, A.J. The genetic diversity of native, stocked and hybrid populations of marble trout in the Soca river, Slovenia. Heredity 2000, 85, 277–287. [Google Scholar] [CrossRef]
  56. Gross, R.; Gum, B.; Reiter, R.; Kühn, R. Genetic introgression between Arctic charr (Salvelinus alpinus) and brook trout (Salvelinus fontinalis) in Bavarian hatchery stocks inferred from nuclear and mitochondrial DNA markers. Aquac. Int. 2004, 12, 19–32. [Google Scholar] [CrossRef]
Figure 1. Sampling localities for Leiocassis longirostris populations. YB—Yibin; JA—Jiangan; SS—Shishou; JY—Jiayu; WH—Wuhan; AQ—Anqing; ZJ—Zhejiang; PRZX—Zhexiang; SCYZ—Stock seed.
Fishes 09 00035 g001
Figure 2. Neighbor-joining phylogram for 9 populations of Leiocassis longirostris.
Fishes 09 00035 g002
Figure 3. Principal coordinate analysis of 9 populations of Leiocassis longirostris.
Fishes 09 00035 g003
Figure 4. (a) K value change diagram drawn using the ΔK method of Leiocassis longirostris structure analysis. (b) Structure results of 9 populations of Leiocassis longirostris for K = 2 and K = 4 (different colors represent different clustering subgroups).
Fishes 09 00035 g004
Table 1. Information on Leiocassis longirostris samples.
LocationSample NameSample SizeGeographic LocationsCollection Date
Upper reaches of Yangtze RiverYibin (YB)14Sichuan (28.7669° N, 104.6279° E)June 2022
Jiangan (JA)13Sichuan (28.7359° N, 105.0724° E)October 2021
Middle reaches of Yangtze RiverShishou (SS)18Hubei (29.7382° N, 112.3955° E)June 2022
Jiayu (JY)34Hubei (29.9956° N, 113.8760° E)October 2021
Wuhan (WH)7Hubei (30.6827° N, 114.5270° E)July 2021
Lower reaches of Yangtze RiverAnqing (AQ)20Anhui (29.8971° N, 116.3881° E)May 2022
Zhenjiang (ZJ)8Jiangsu (32.1976° N, 119.2702° E)December 2021
Upper reaches of Pearl RiverZhexiang (PRZX)27Guizhou (25.1621° N, 106.2552° E)May 2022
Sichuan ProvinceStock seed (SCYZ)29Sichuan (30.3958° N, 103.6672° E)October 2021
Table 2. Information of 15 SSR loci in Leiocassis longirostris.
LocusRepeat MotifForward Primer Sequence (5′-3′)Reverse Primer Sequence (5′-3′)Allele Ranges (bp)
Lli033(CA)11GCTTGCACACGTCTGTGTTTGCATCTGGTCAGGTGTTTCA192–198
Lli060(GT)22GAACGAGGTGCAGCAGTACACAACATCAGCAAGTTCCAGC195–212
Lli075(AT)8GAGAGCCTTCTGTCACTCGGTGAGCTTTGTTCTTGCGATG254–264
Lli079(GT)19CAGGGTTCTTTGGCACCTTAATGTGTTCAGGGATTCCAGC209–215
Lli081(TG)15TGTTCTGTGGTGGCTTTACGGCTCGTTAAAGGAGGGAAGG143–147
Lli083(AC)12CAGACAAAGGCACTGATGGACTGCTGCTGTGATGTGTTGA237–251
Lli093(ATC)9TGACGCCTCGTCATATCAGTTACCGAGGTGAAACTTTGGC286–303
Lli102(TTA)16TTTCACACTTCCTCGTGCATACTCCACTGAGGGTGAAACG239–245
Lli104(AC)6AGGTTGCGTAAAGGTTGTGGCGTTGCTGTTGTAACGGAGA336–346
Lli128(CT)11ACAAGATCATGCTAGGCGCTTGAGACCAGGCTGTGATGTC260–278
Lli134(AG)14TGGGTGGAGCTAATTTCTGGTGAGACTGTGCTGCTGTTCC282–295
Lli159(CT)11CTGCCACAGAAAGCACAGTCCCTAAAGACACGAGGAAGCG237–252
Lli167(AAT)22AGCCGTGAACAGAAGGAGTTGGGACGGAAAGATGTTCTGA217–238
Lli181(GT)16ACAATGACGCAGGAAGAGGATACCCTGGCCTTTGTGAGAC230–245
Lli190(CTCA)11TGGATCCCTAGCCCTATCCTTTGCATGTCGTTCACAGTCA252–271
Table 3. Genetic variability at 15 SSR loci in 170 samples of Leiocassis longirostris.
LocusNaneIHoHeFisPICProbSignif
Lli03310 3.3 1.50 0.66 0.70 −0.03 0.66 0.00 ***
Lli06013 6.7 2.11 0.80 0.85 −0.02 0.84 0.00 ***
Lli07510 2.4 1.24 0.49 0.59 0.11 0.55 0.00 ***
Lli07916 4.7 1.81 0.76 0.79 −0.03 0.76 0.00 ***
Lli08112 3.9 1.59 0.71 0.74 0.01 0.70 0.00 ***
Lli08313 4.6 1.83 0.74 0.78 −0.03 0.76 0.00 ***
Lli0939 5.1 1.76 0.74 0.80 0.06 0.78 0.00 ***
Lli10212 3.8 1.58 0.69 0.73 −0.01 0.69 0.00 ***
Lli10411 5.1 1.84 0.80 0.80 0.00 0.78 0.07 ns
Lli12815 6.8 2.14 0.85 0.85 −0.05 0.84 0.00 ***
Lli13414 6.2 2.05 0.78 0.84 0.01 0.82 0.00 ***
Lli15914 2.6 1.33 0.60 0.62 −0.08 0.58 0.00 ***
Lli16712 8.9 2.27 0.93 0.89 −0.13 0.88 0.02 *
Lli18113 5.0 1.95 0.77 0.80 −0.04 0.78 0.00 ***
Lli19011 3.9 1.69 0.73 0.75 −0.03 0.72 0.00 ***
Mean12.3 4.9 1.78 0.74 0.77 −0.02 0.74
St Dev1.95 1.73 0.30 0.10 0.08
Na, observed alleles; ne, effective allele; I, Shannon index; Ho, observed heterozygosity; He, expected heterozygosity; Fis, inbreeding coefficient within population; PIC, polymorphic information index; Prob, probability of genotype frequency randomly deviating from Hardy–Weinberg expectation; Signif, significance (ns represents not significant, the population conforms to HWE; * represents significant difference p < 0.05 and *** represents significant difference p < 0.001).
Table 4. Statistical values of genetic diversity of 15 microsatellite loci in 9 populations of Leiocassis longirostris.
Population NaneIHoHeF
AQMean8.9 5.30 1.80 0.77 0.78 0.02
SE0.6 0.55 0.10 0.04 0.02 0.04
JAMean5.5 3.65 1.41 0.72 0.70 −0.04
SE0.4 0.28 0.09 0.05 0.03 0.05
JYMean7.3 4.48 1.62 0.75 0.75 0.00
SE0.5 0.38 0.08 0.02 0.02 0.02
SCYZMean5.2 2.94 1.19 0.72 0.61 −0.18
SE0.3 0.28 0.08 0.05 0.04 0.02
SSMean6.6 4.28 1.56 0.78 0.74 −0.06
SE0.6 0.39 0.09 0.04 0.03 0.03
WHMean5.3 4.04 1.42 0.71 0.70 −0.02
SE0.5 0.44 0.11 0.06 0.04 0.06
YBMean5.6 3.44 1.37 0.71 0.68 −0.07
SE0.4 0.26 0.08 0.04 0.03 0.04
ZJMean7.1 5.12 1.77 0.70 0.79 0.12
SE0.2 0.29 0.04 0.04 0.01 0.05
PRZXMean5.7 3.73 1.42 0.71 0.70 −0.01
SE0.4 0.33 0.09 0.04 0.03 0.04
TotalMean6.3 4.11 1.51 0.73 0.72 −0.03
SE0.2 0.13 0.03 0.01 0.01 0.01
Na, observed alleles; ne, effective alleles; I, Shannon index; Ho, observed heterozygosity; He, expected heterozygosity; F, fixation index.
Table 5. Matrix showing pairwise differentiation estimates (Fst) among 9 populations of Leiocassis longirostris (below the diagonal), and estimated number of migrants per generation (Nm) among samples (above the diagonal).
AQJAJYSCYZSSWHYBZJPRZX
AQ-2.89 3.66 2.02 3.39 3.20 2.48 4.57 2.89
JA0.080 -11.08 4.05 13.51 4.07 10.30 5.34 16.14
JY0.064 0.022 -5.53 18.90 8.75 8.85 9.86 11.33
SCYZ0.110 0.058 0.043 -5.16 3.96 5.05 3.65 4.76
SS0.069 0.018 0.013 0.046 -6.38 10.79 7.32 17.02
WH0.072 0.058 0.028 0.059 0.038 -3.56 5.76 4.27
YB0.092 0.024 0.027 0.047 0.023 0.066-4.77 14.14
ZJ0.052 0.045 0.025 0.064 0.033 0.042 0.050 -5.77
PRZX0.080 0.015 0.022 0.050 0.014 0.055 0.017 0.042 -
Light blue indicates little to no genetic differentiation between the two populations, and blue indicates a relatively low degree of genetic differentiation between the two populations.
Table 6. Genetic distance among 9 populations of Leiocassis longirostris.
AQJAJYSCYZSSWHYBZJPRZX
AQ
JA0.362
JY0.308 0.103
SCYZ0.401 0.181 0.135
SS0.321 0.088 0.065 0.139
WH0.310 0.238 0.140 0.225 0.172
YB0.382 0.100 0.099 0.135 0.085 0.255
ZJ0.320 0.255 0.194 0.291 0.220 0.259 0.275
PRZX0.346 0.068 0.086 0.135 0.073 0.213 0.072 0.234
Light blue indicates that the genetic relationship between the two populations is close, and blue indicates that the genetic relationship between the two populations is moderate.
Table 7. Molecular variance analysis (AMOVA) of 9 populations of Leiocassis longirostris.
SourcedfSSMSEst. Var.%
Among Pops8149.01218.6270.3556%
Among Indiv161899.0055.5840.0711%
Within Indiv170925.0005.4415.44193%
Total3391973.018 5.868100%
Source, source of variation; df, degree of freedom; SS, total variance; MS, mean square error; Est. Var., estimated difference value; %, percentage of variation; Among Pops, among populations; Among Indiv, among individuals within population; Within Indiv, within individuals.
Table 8. Molecular variance analysis (AMOVA) of upstream populations (YB and JA) and mid-downstream populations (SS, JY, WH, AQ, and ZJ) of Leiocassis longirostris in the Yangtze River.
SourcedfSSMSEst. Var.%
Among Pops119.54519.5450.1593%
Among Indiv112720.7756.4350.4798%
Within Indiv114624.5005.4785.47890%
Total2271364.820 6.116100%
Source, the source of variation; df, degree of freedom; SS, total variance; MS, mean square error; Est. Var., estimated difference value; %, percentage of variation; Among Pops, among populations; Among Indiv, among individuals within population; Within Indiv, within individuals.
Disclaimer/Publisher’s Note: The statements, opinions and data contained in all publications are solely those of the individual author(s) and contributor(s) and not of MDPI and/or the editor(s). MDPI and/or the editor(s) disclaim responsibility for any injury to people or property resulting from any ideas, methods, instructions or products referred to in the content.

