

Small-Scale Fisheries in the Colombian Pacific: Understanding the Impact of Climate Change on Fishermen’s Livelihoods

Abstract
:1. Introduction
2. Methods
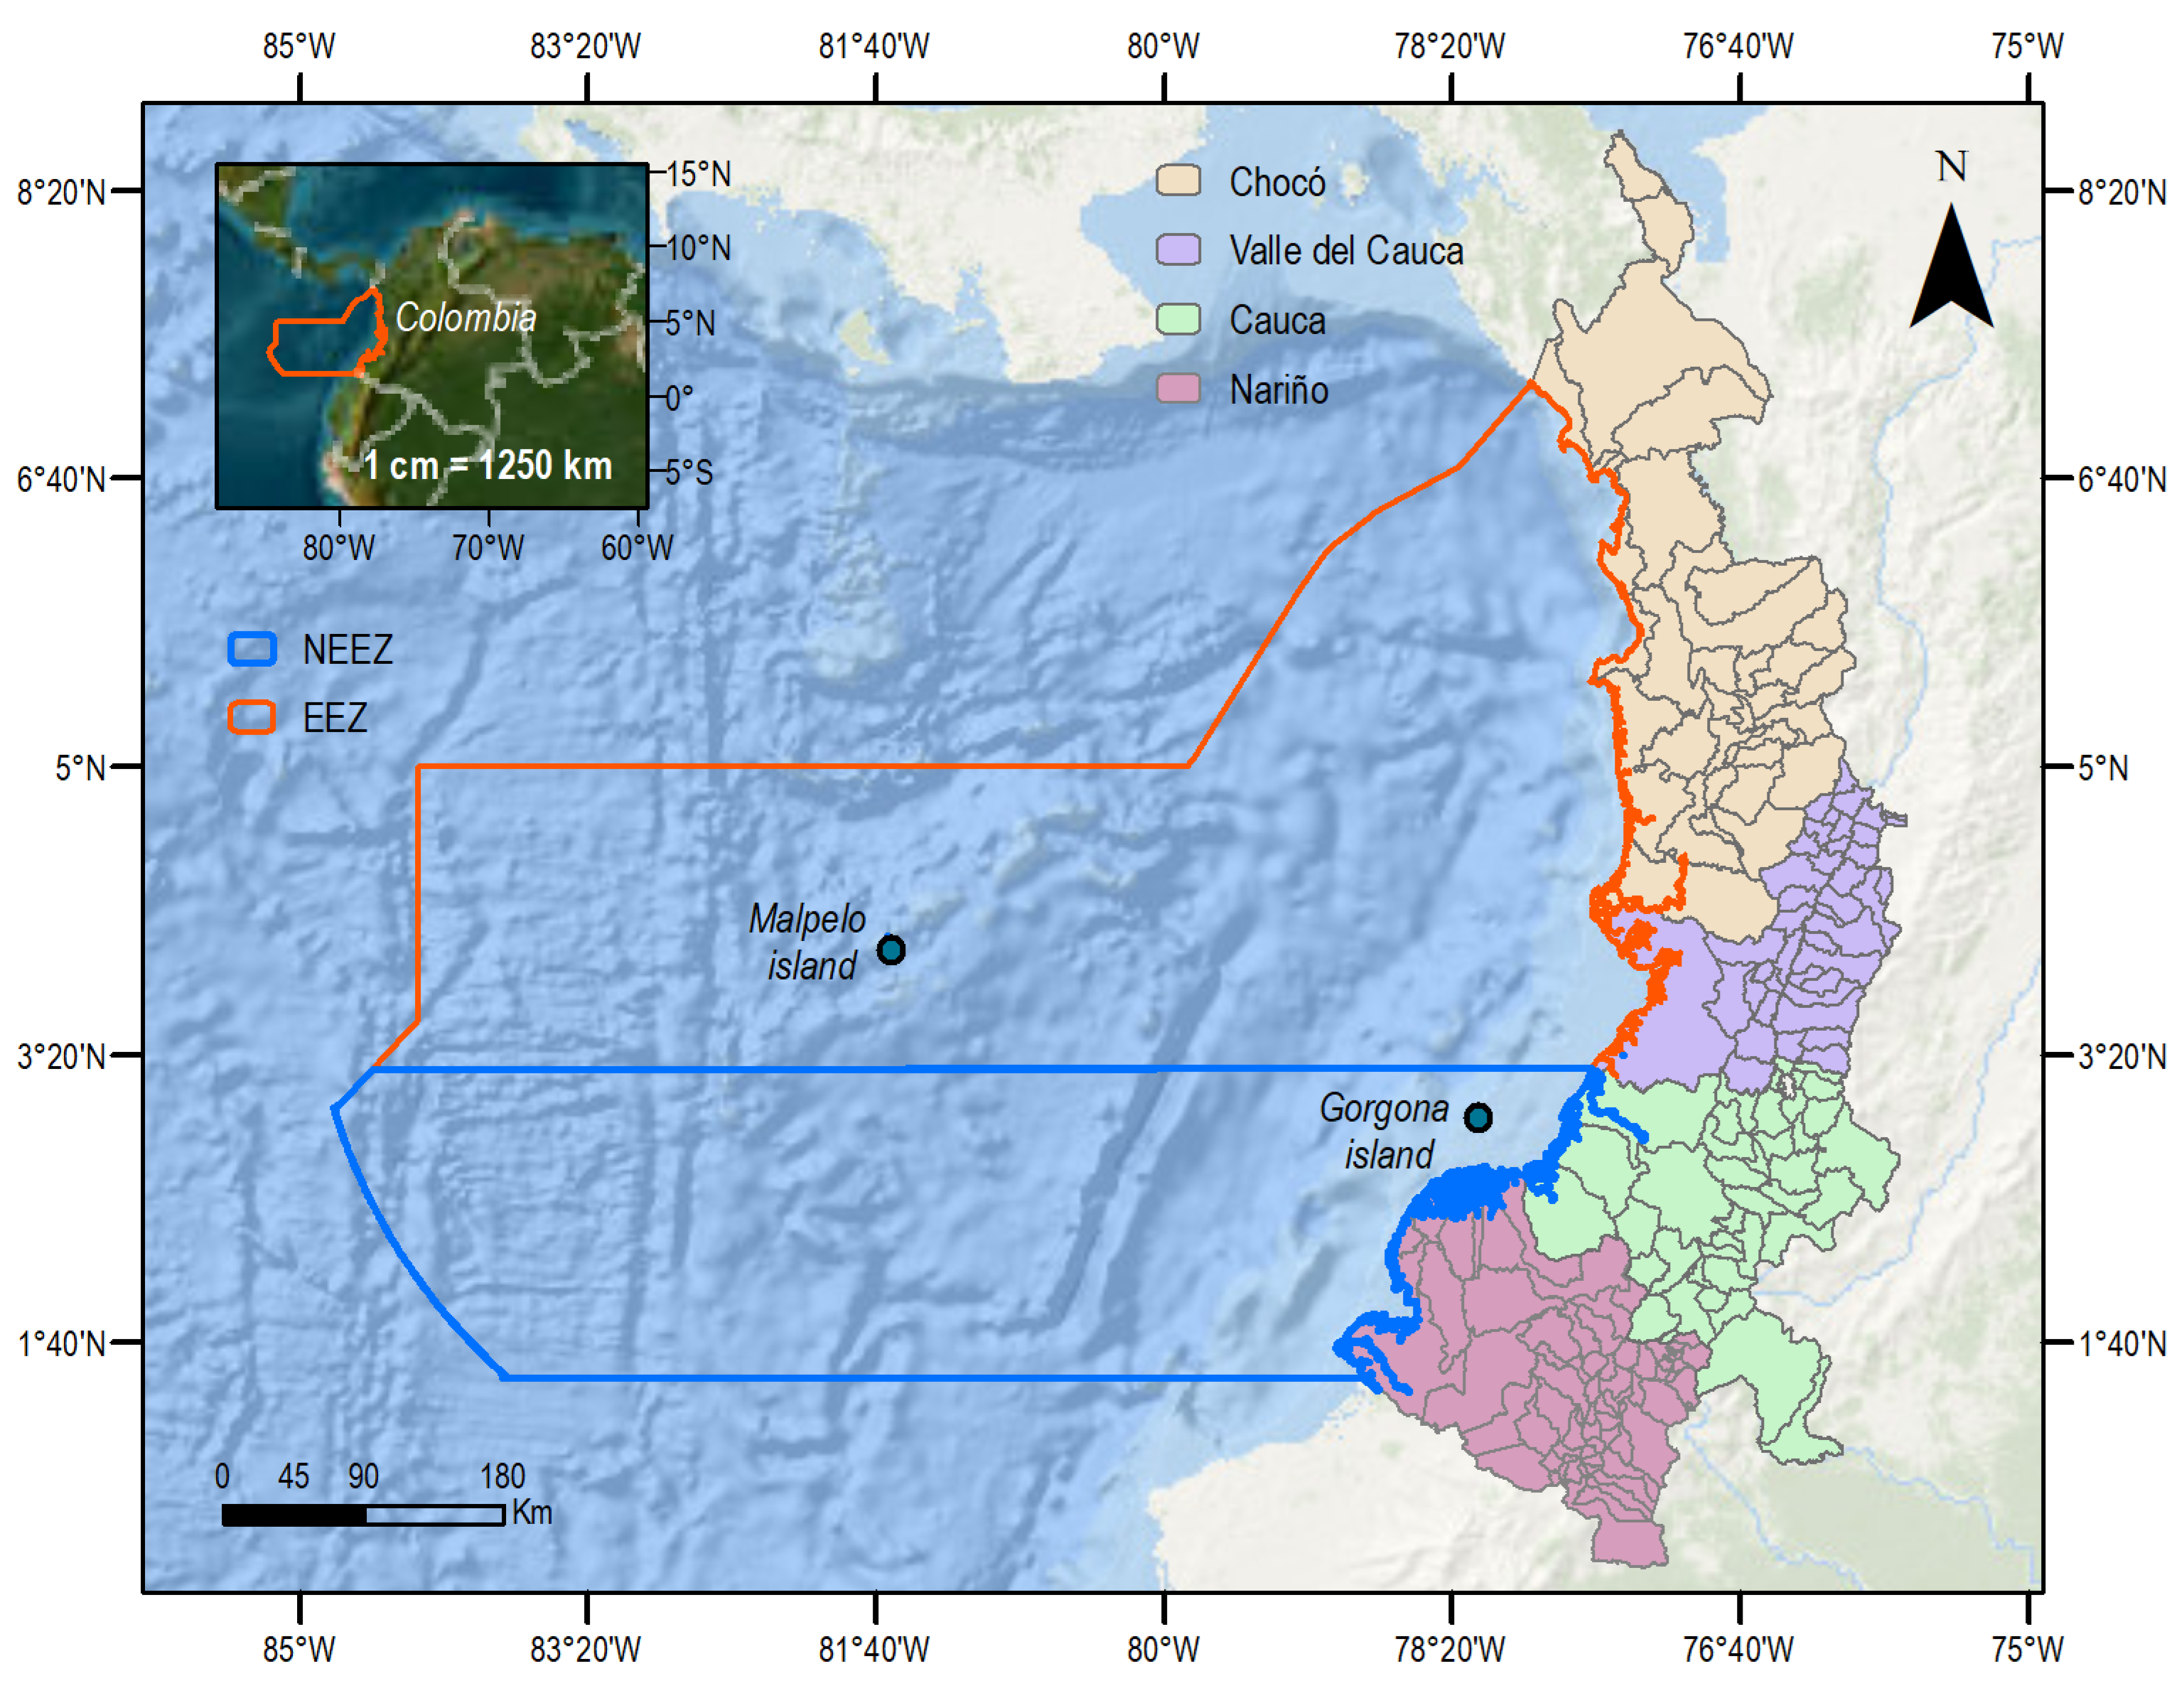
2.1. Study Area
2.2. Semi-Structured Survey
- The sociodemographic profile of the fishermen and their households;
- The characteristics of their fishing activity;
- Information on the main fishing species of commercial interest and used for household food;
- Fishermen’s perception of the effects of climate change.
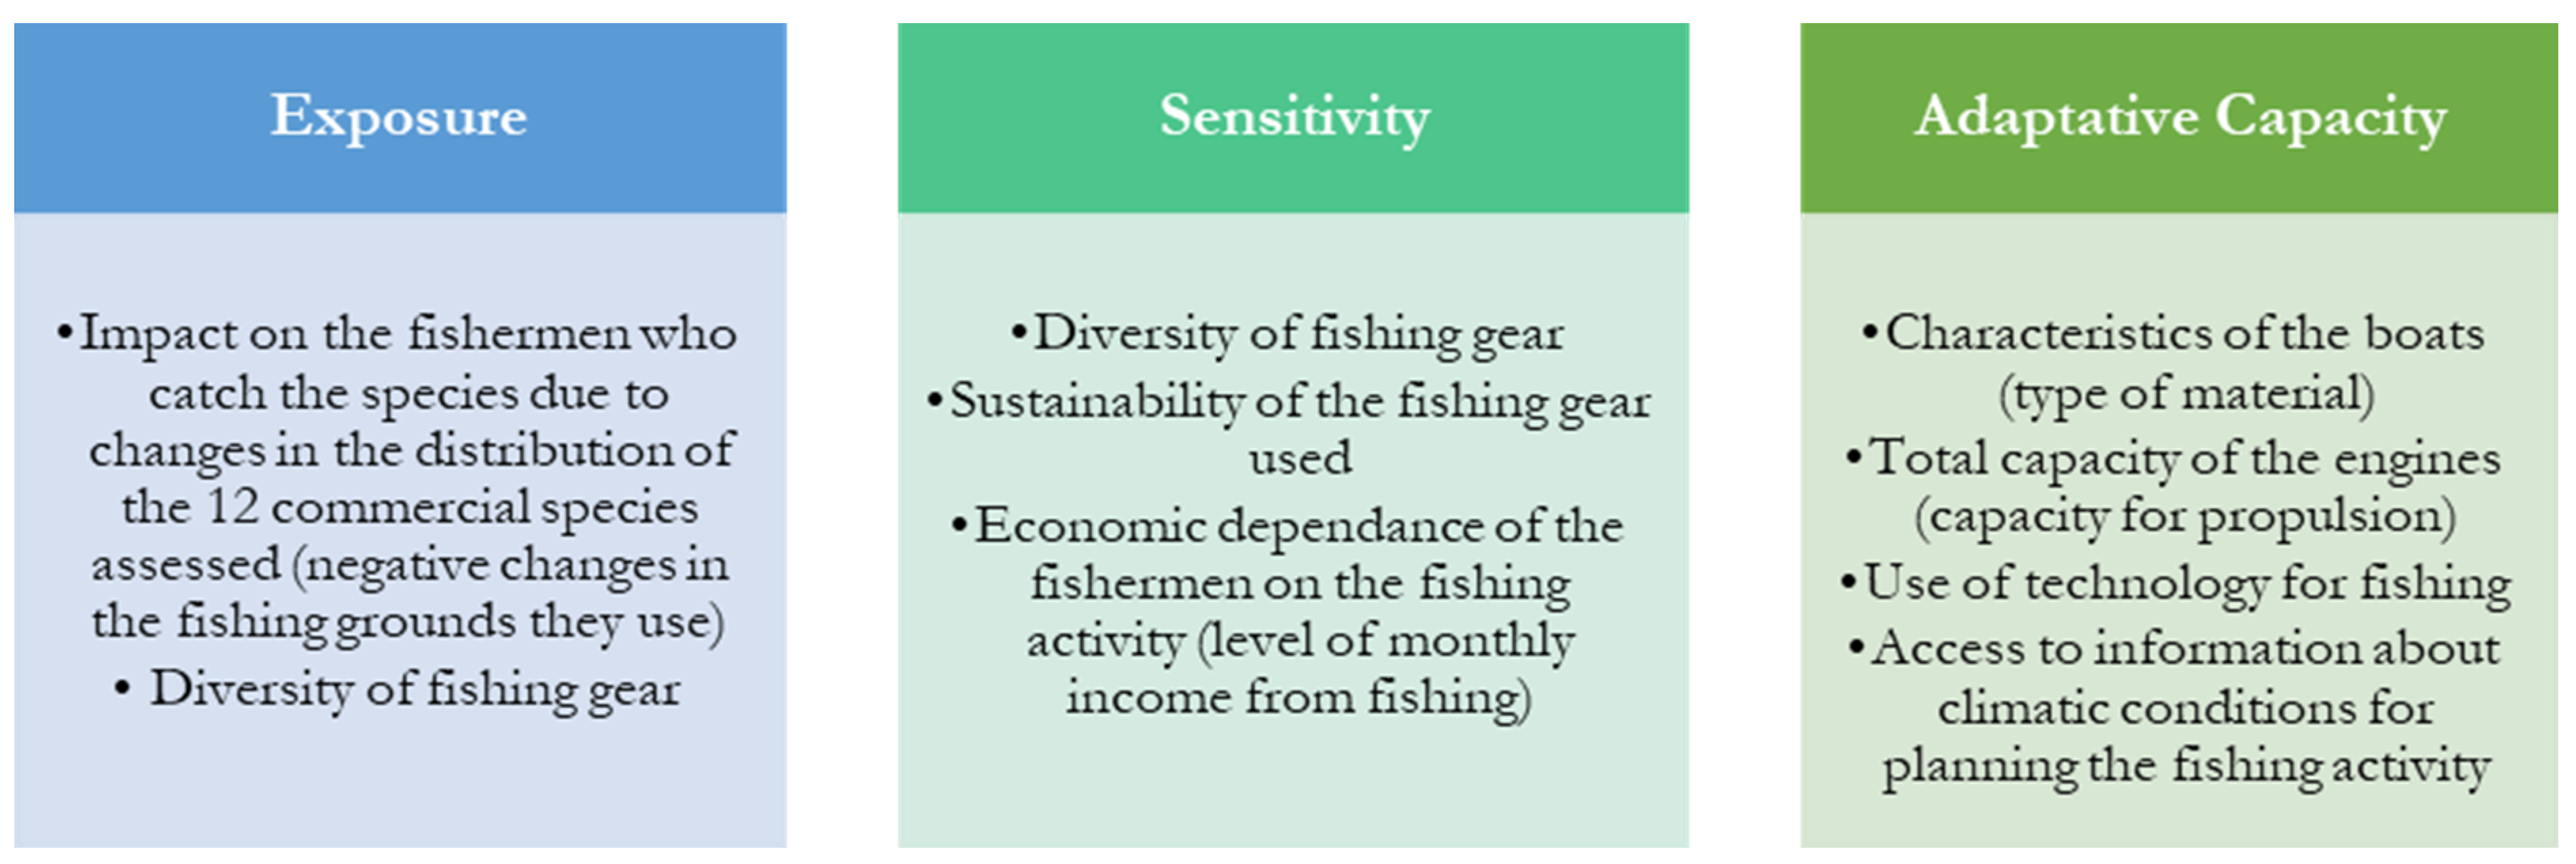
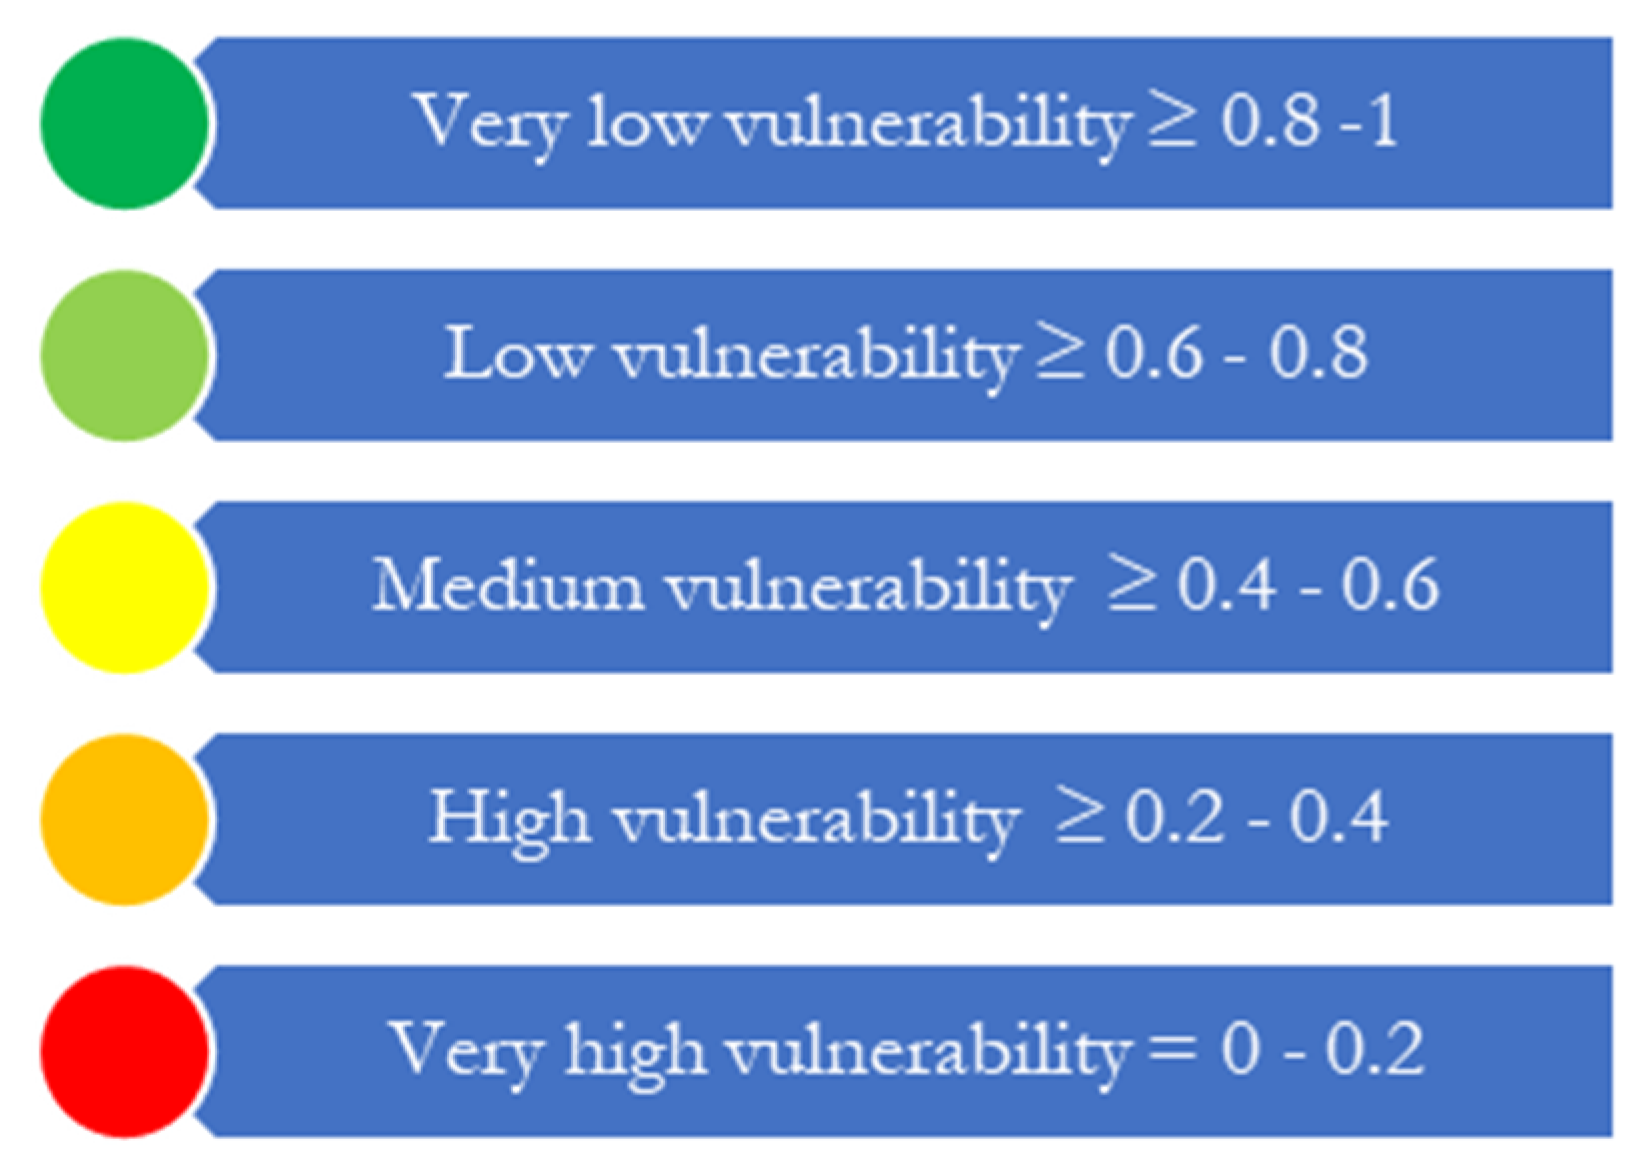
2.3. Climate Change Vulnerability Model
2.4. Data Analysis
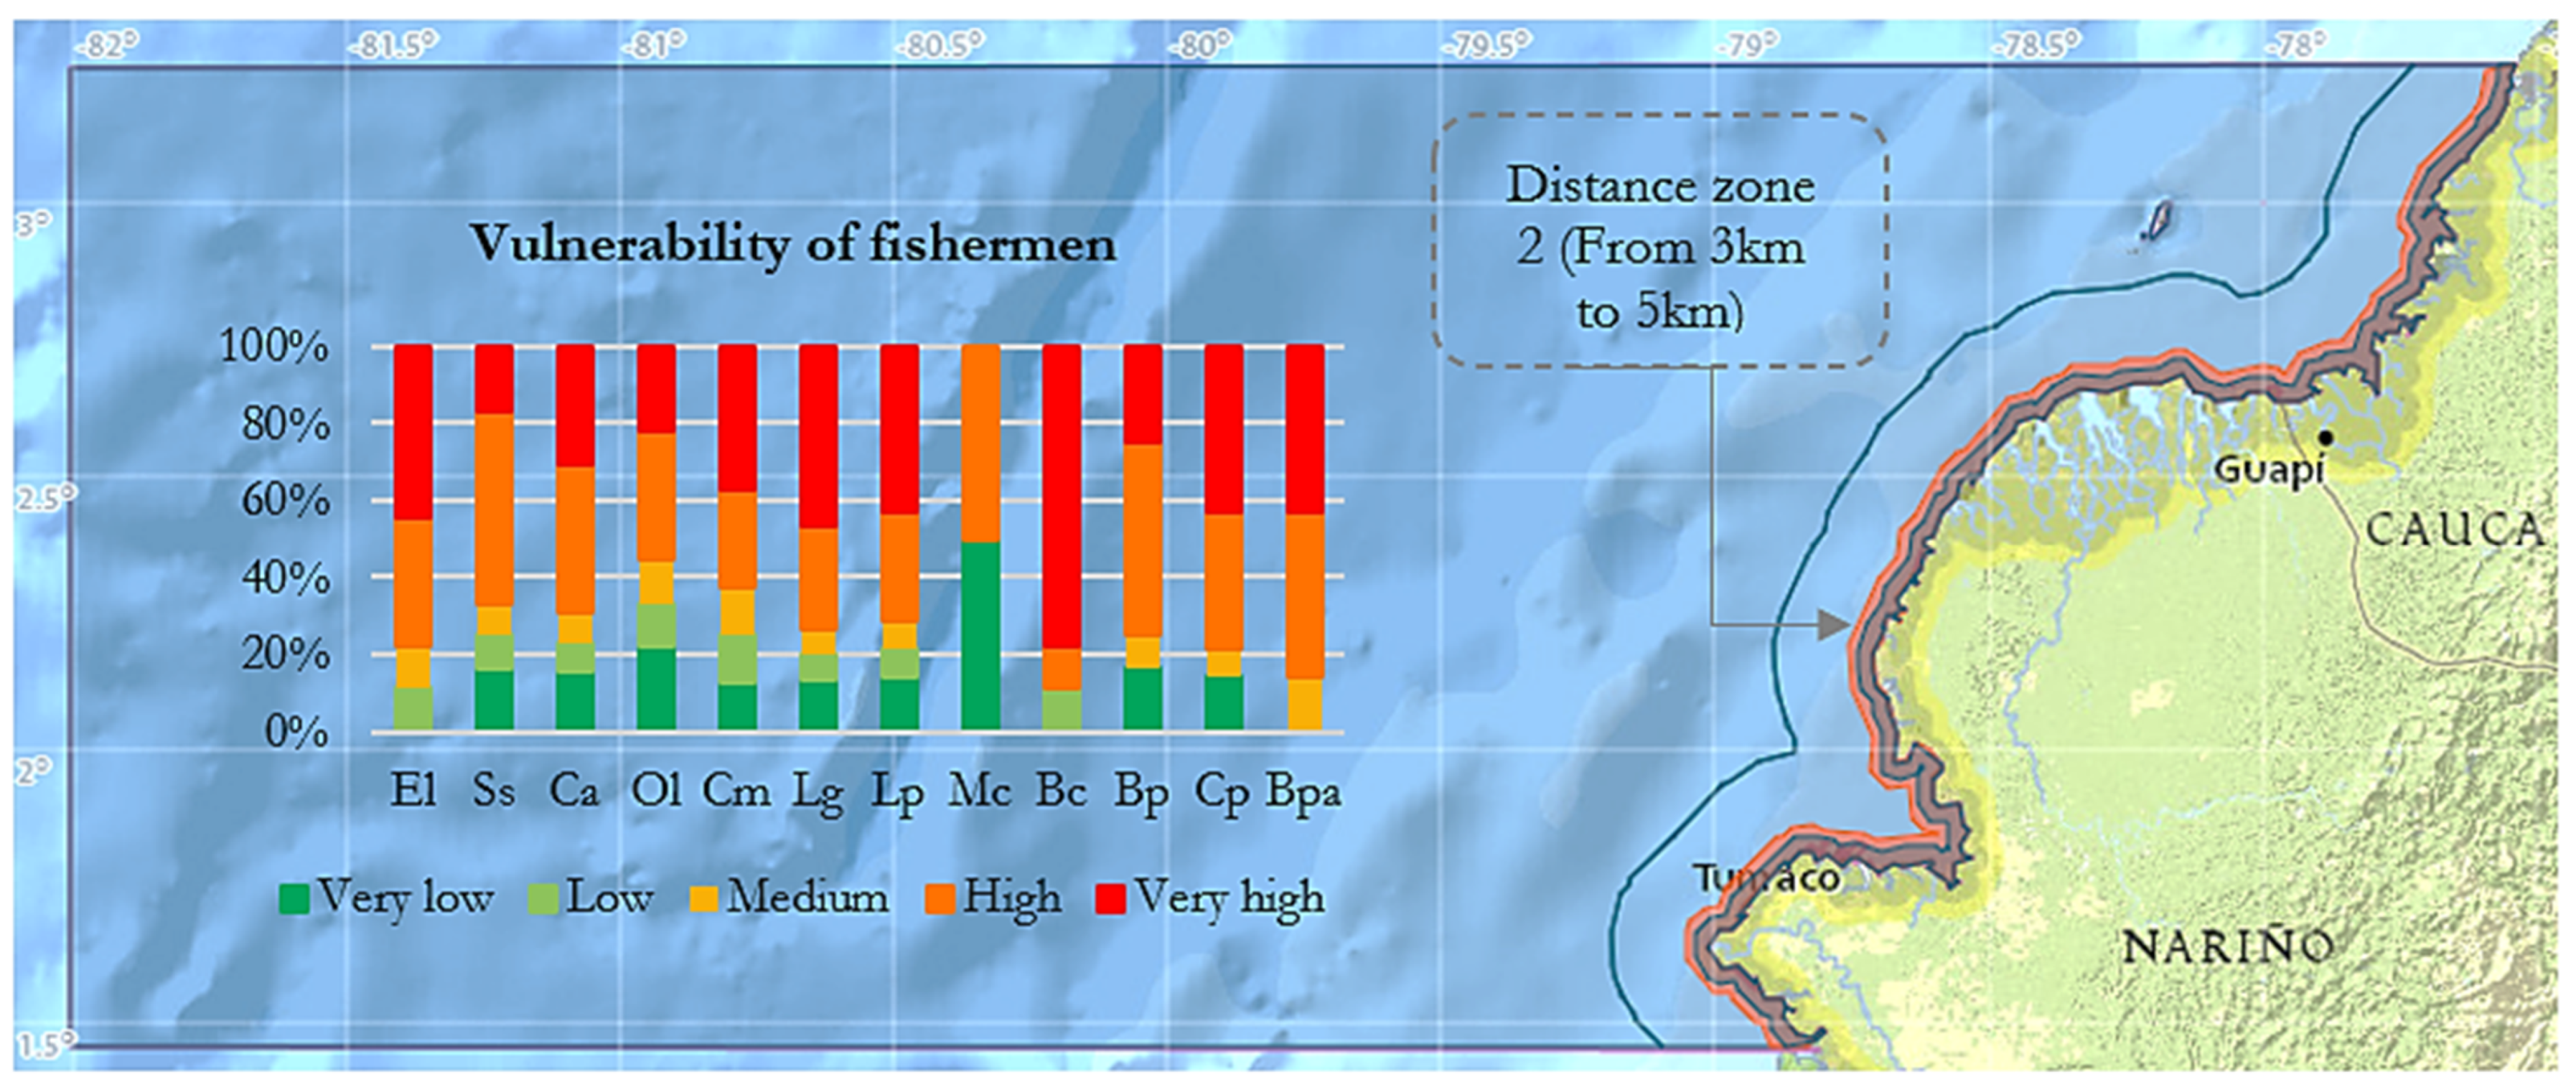
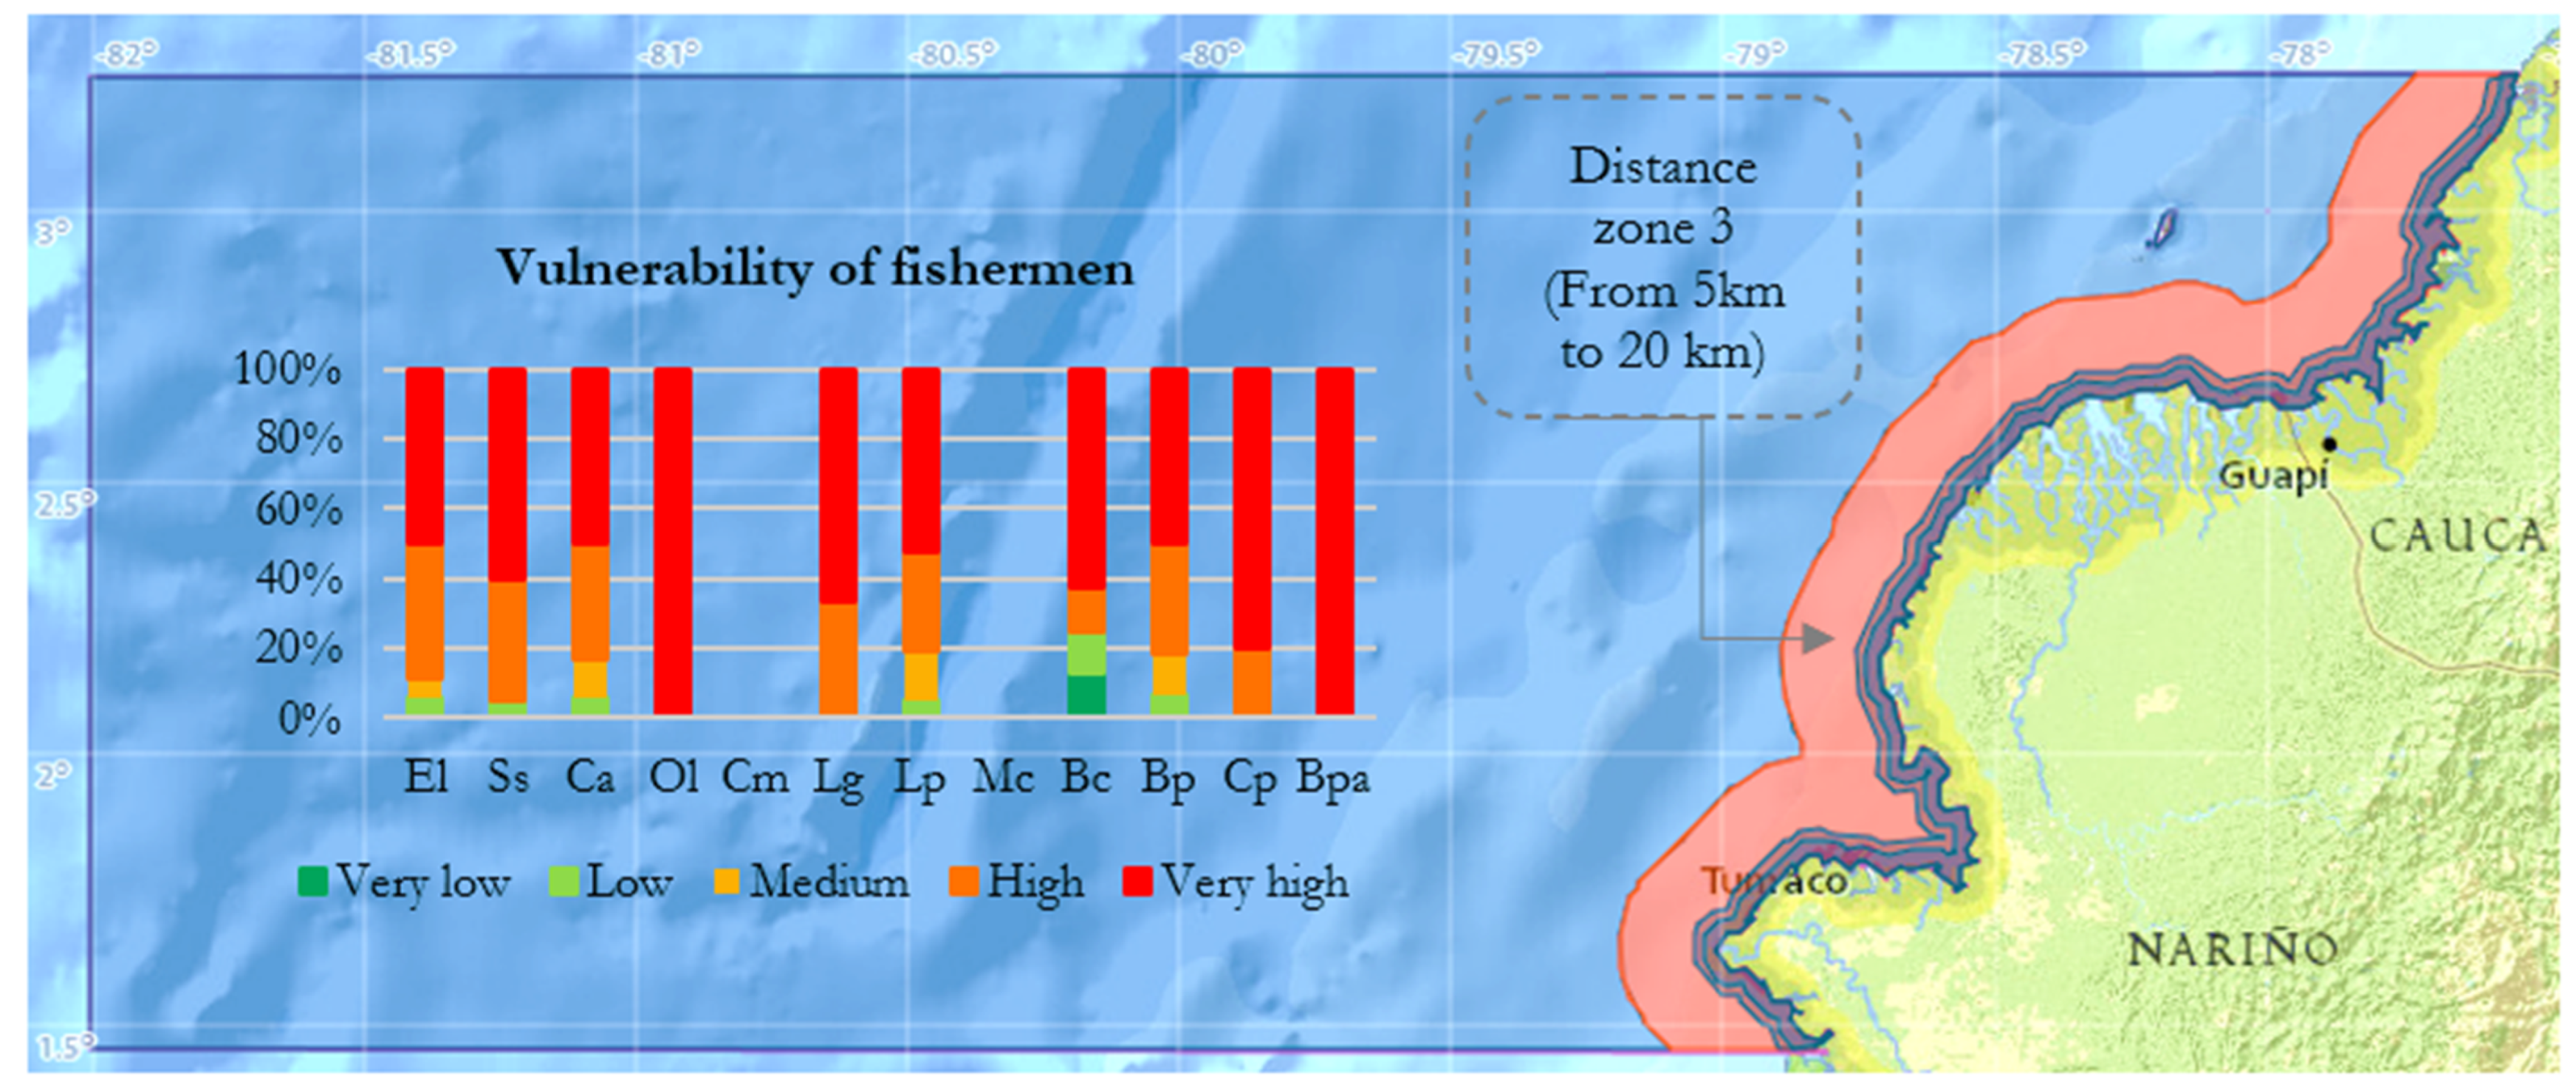
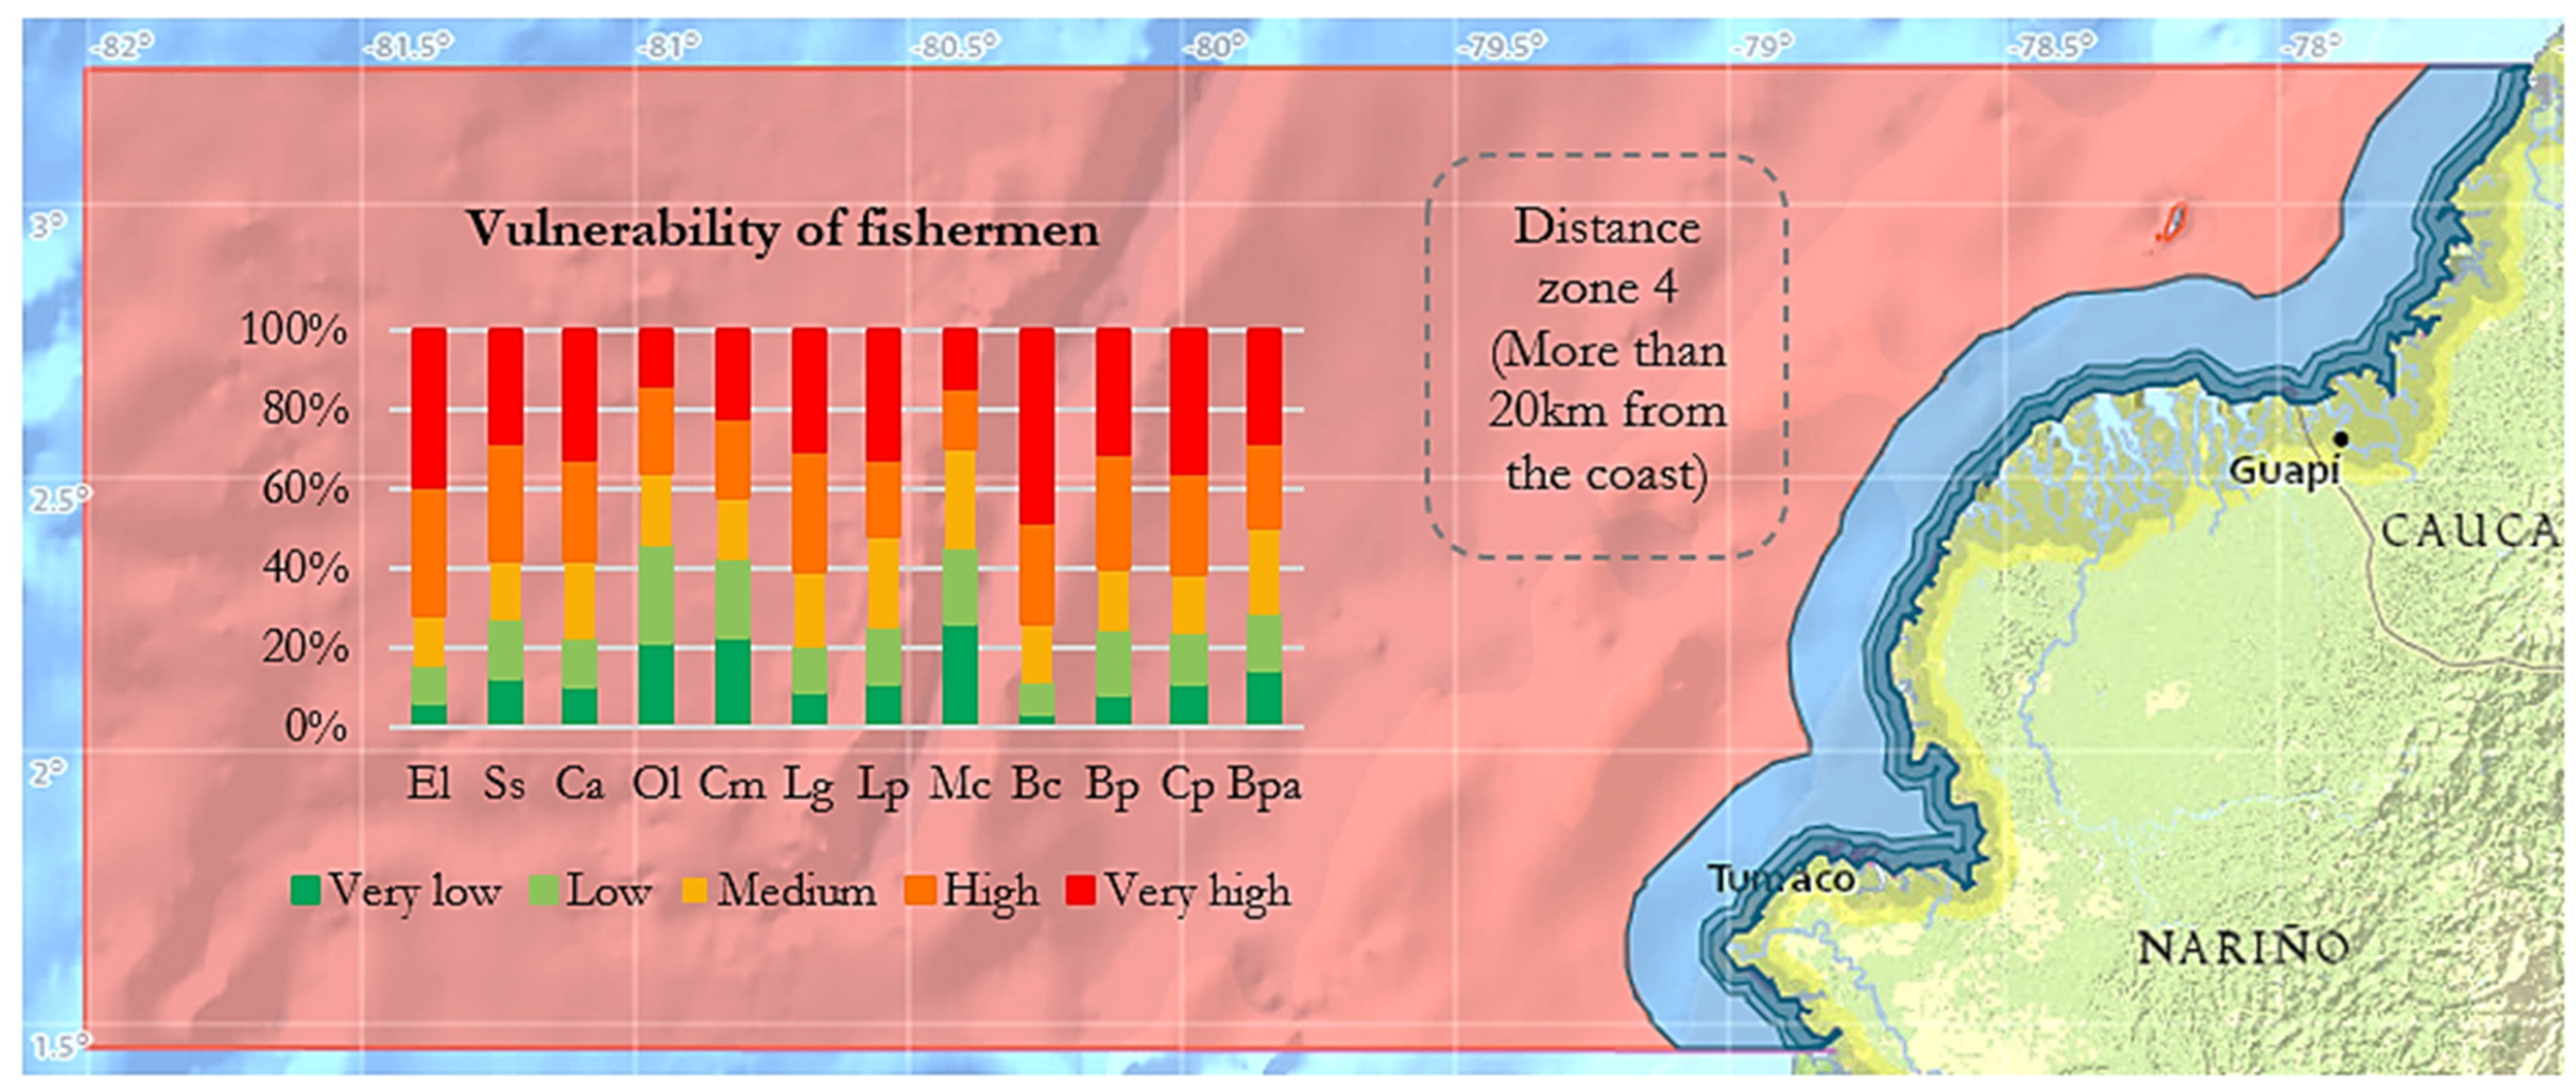
2.5. Vulnerability by Distances from the Coast
- Distance Zone 1 includes fishing sites less than 3 km from the coast and Tumaco Bay; it includes all the fishing spots in the estuaries of the rivers that flow into the coast and the fishing spots in Tumaco Bay
- Distance Zone 2 includes fishing sites between 3 and 5 km from the coast
- Distance Zone 3 includes fishing sites between 5 and 20 km from the coast
- Distance Zone 4 includes fishing sites located more than 20 km from the coast, including all those in the open sea.
3. Results and Discussion
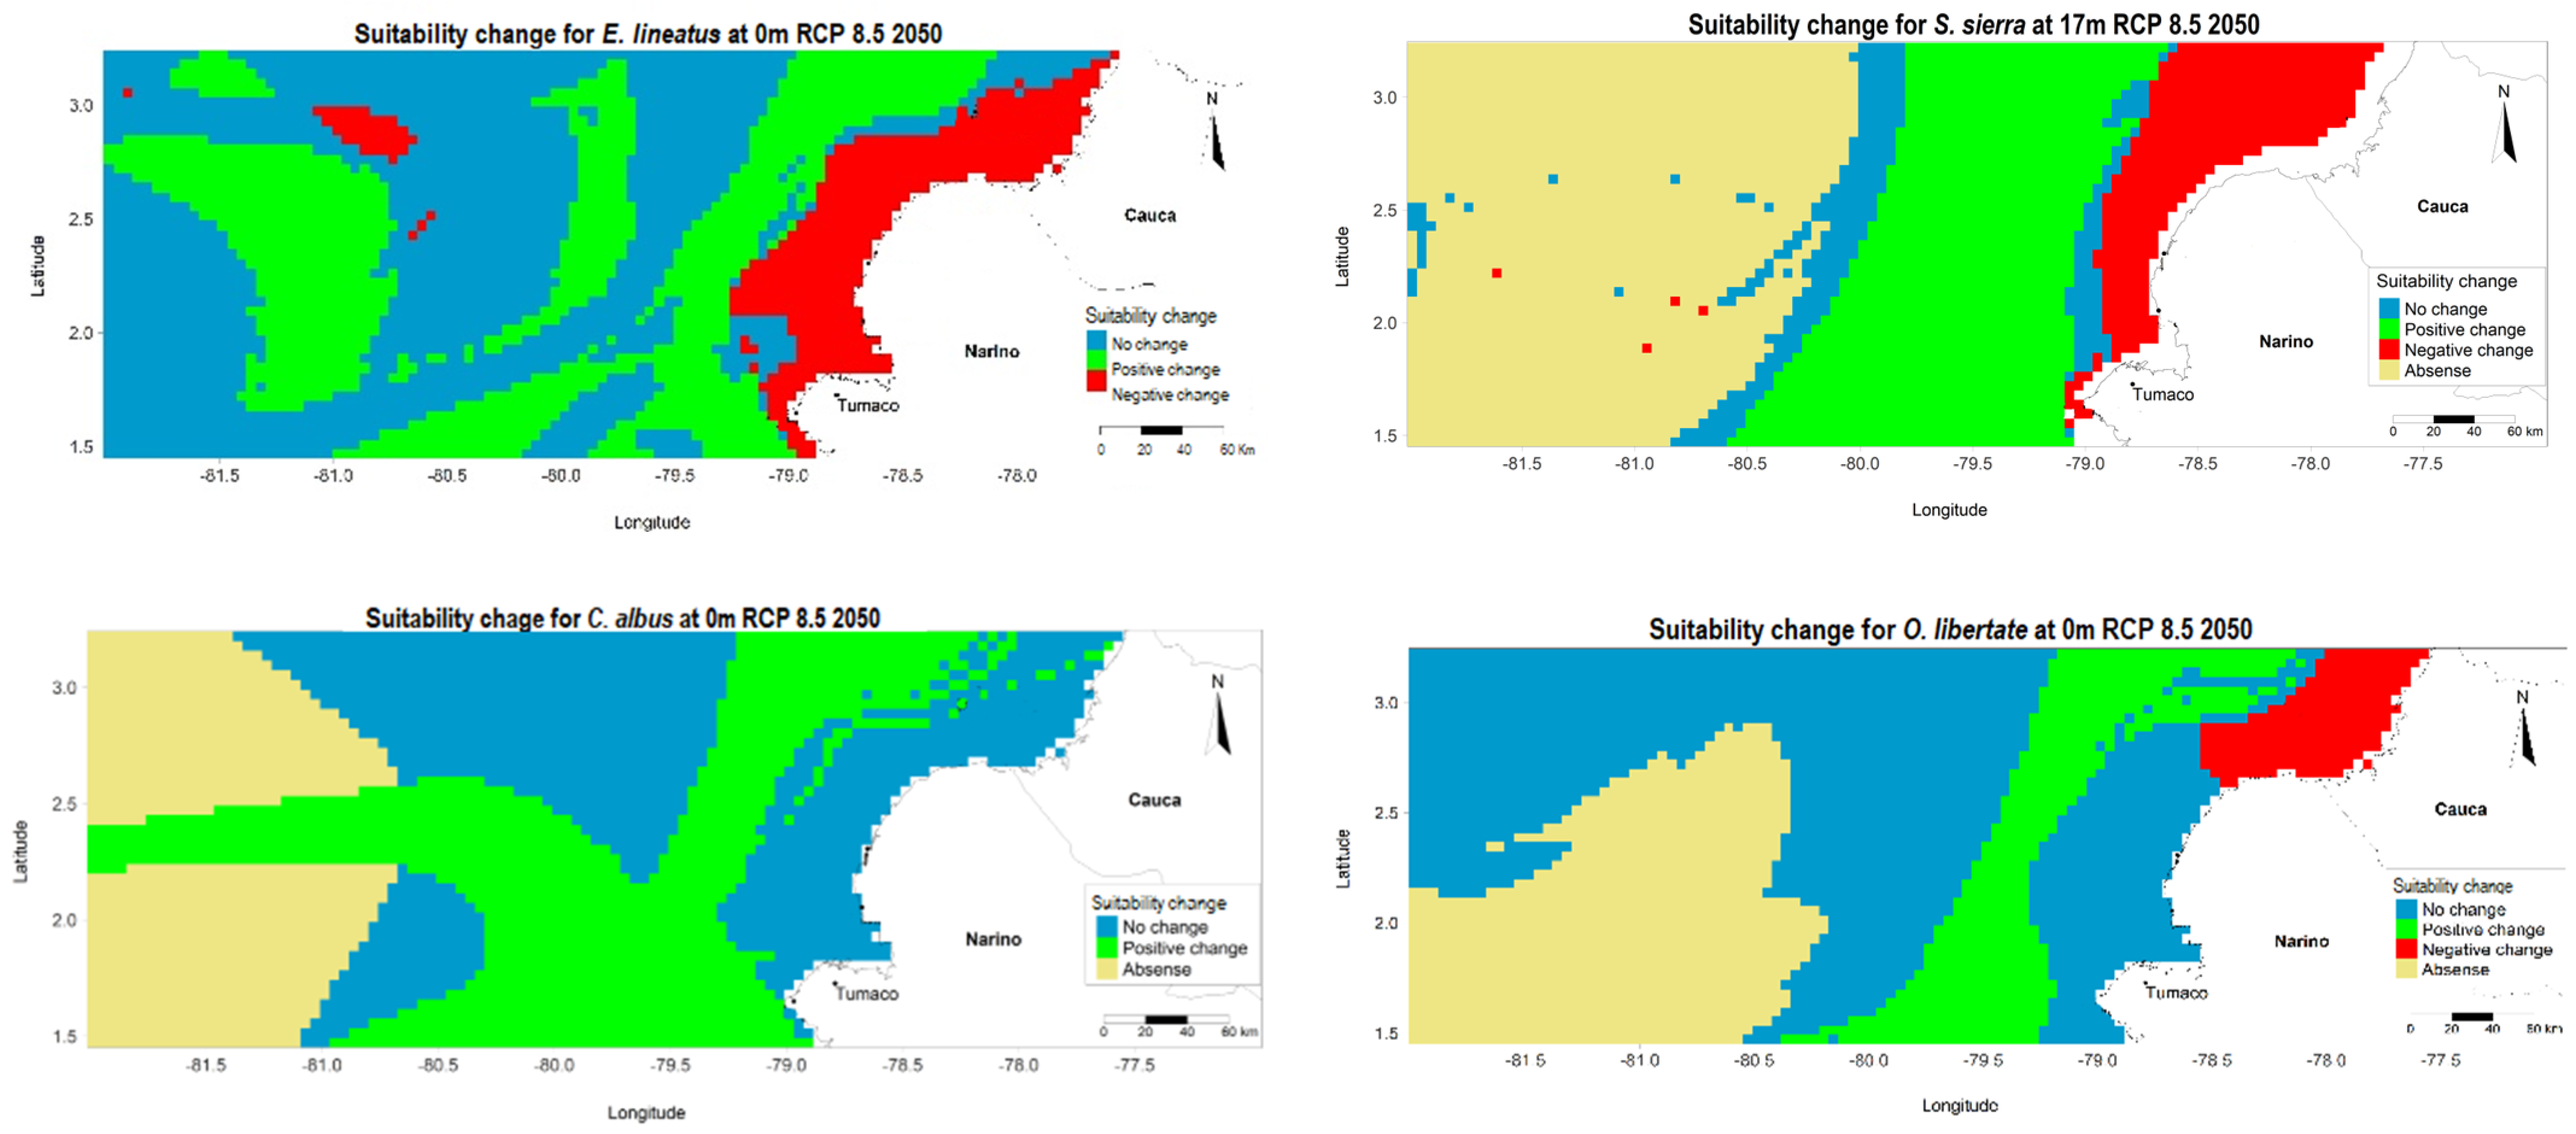
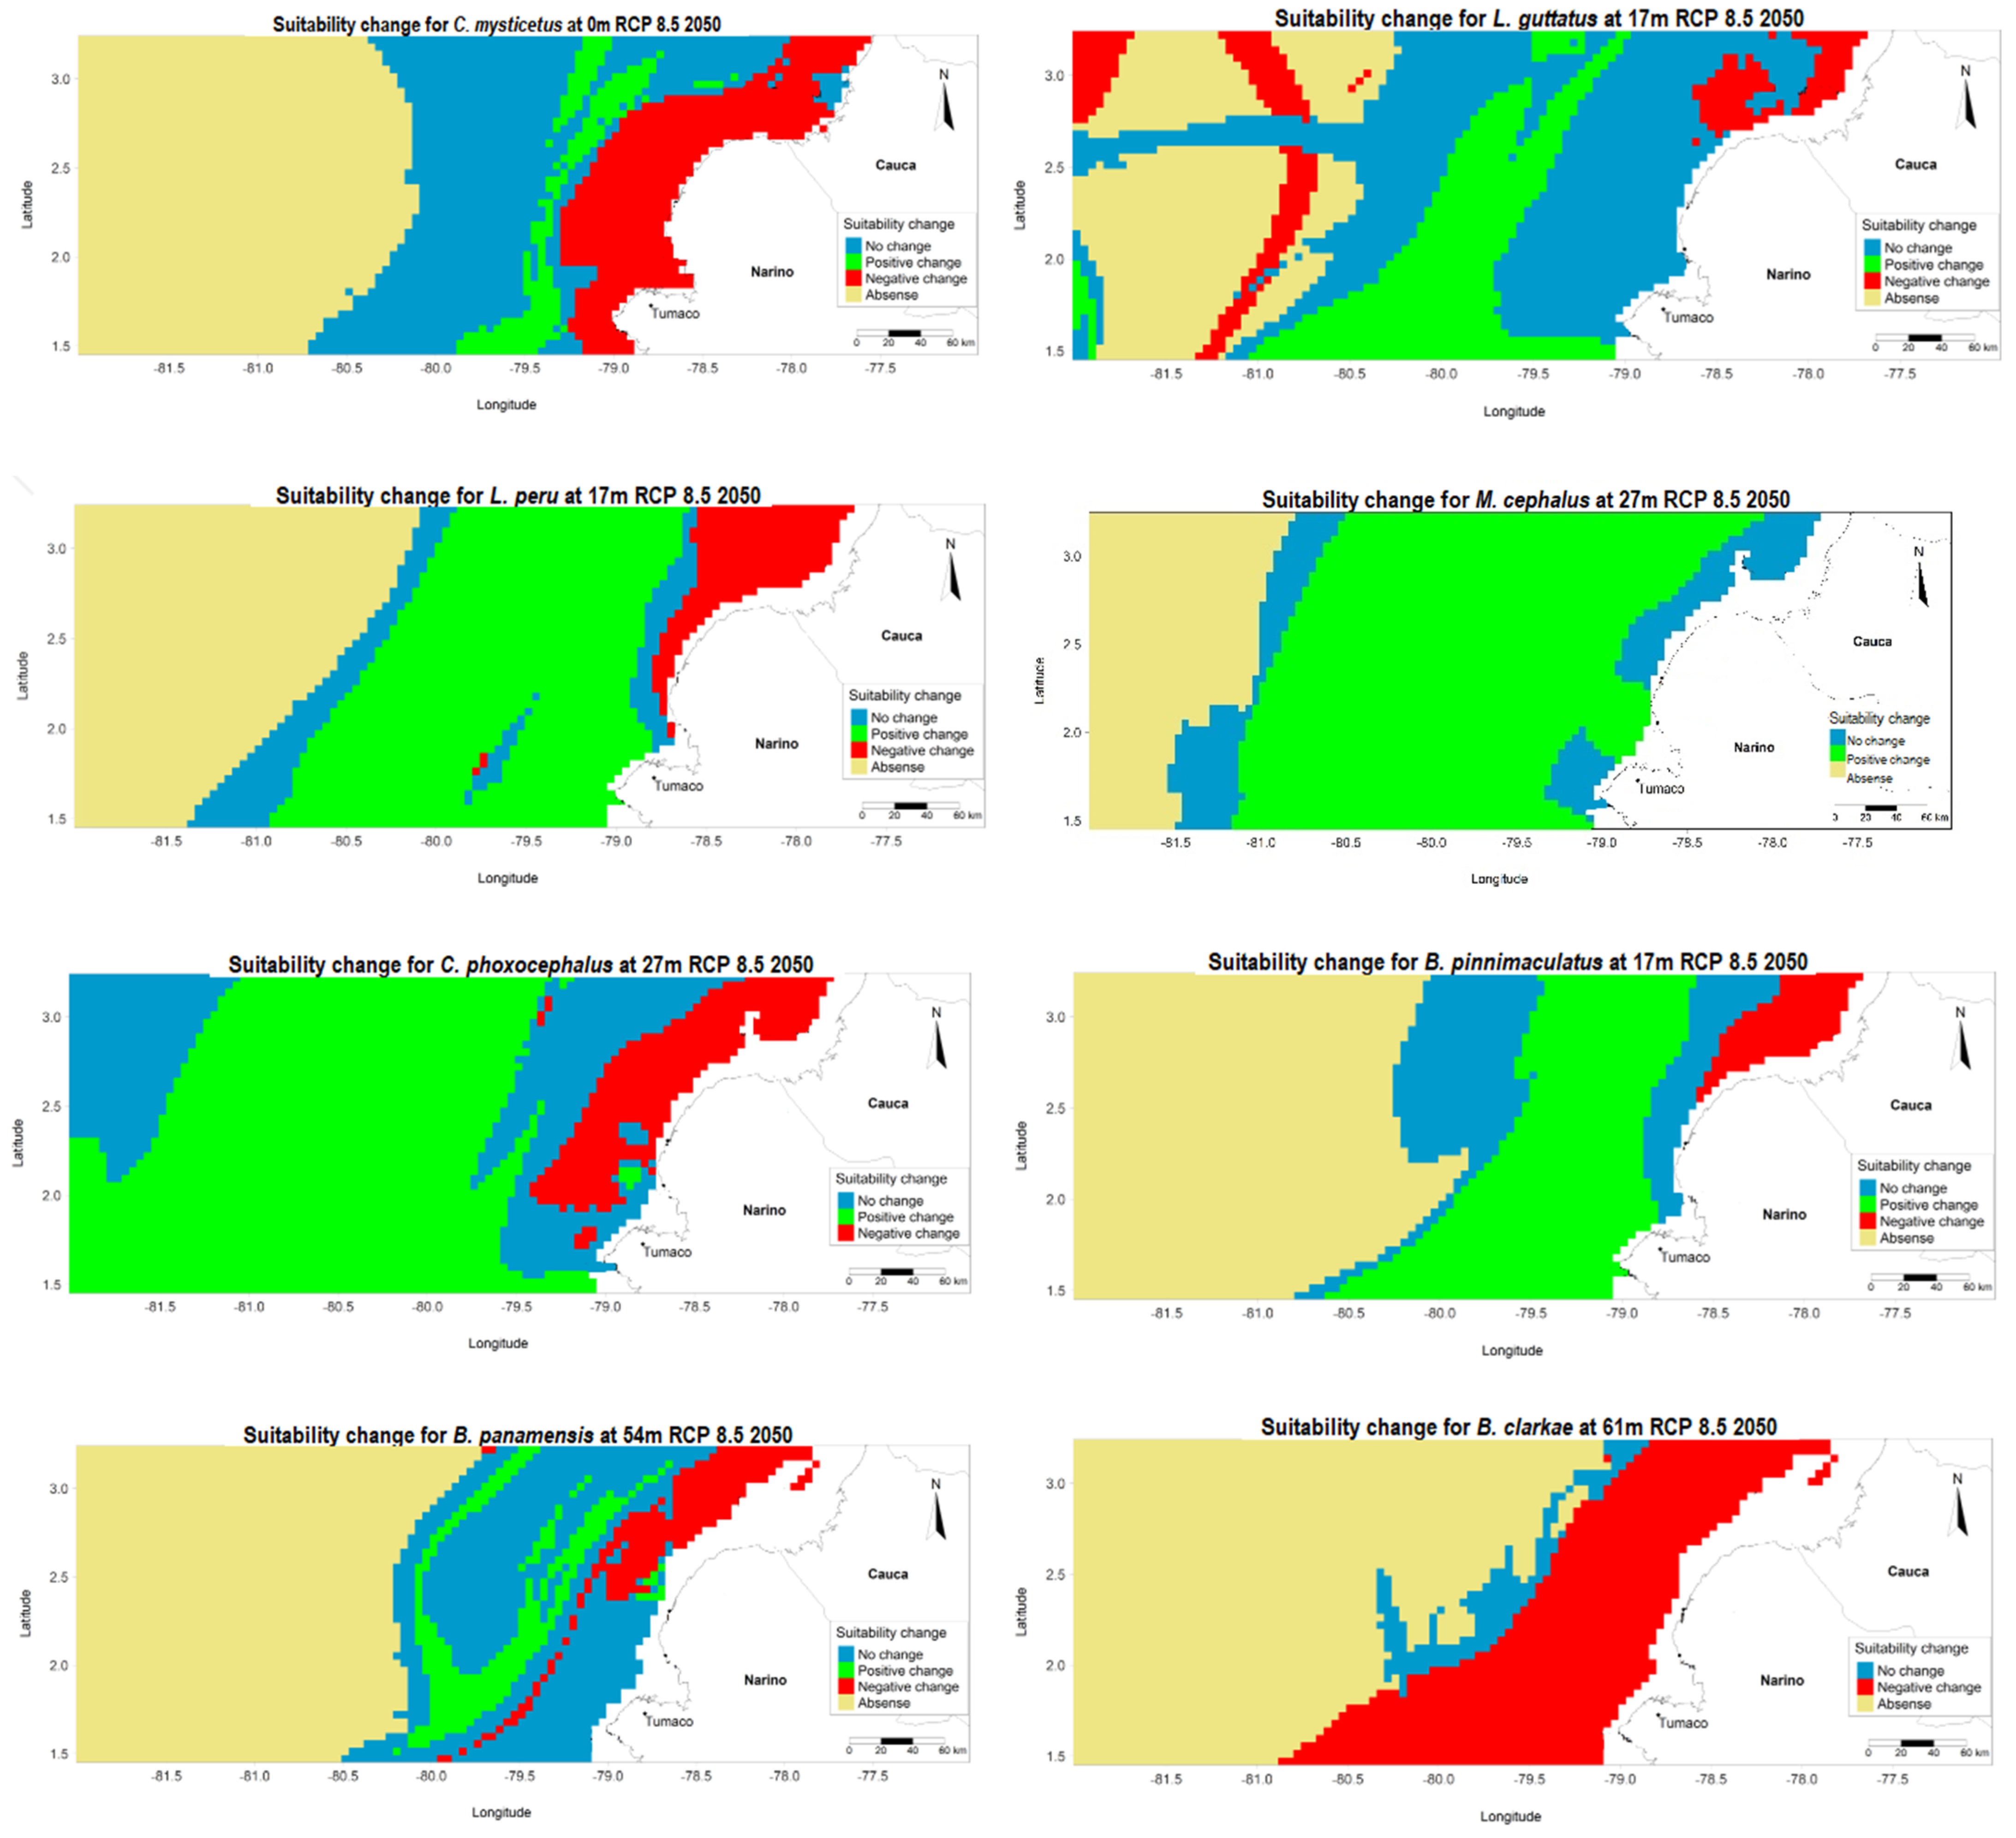
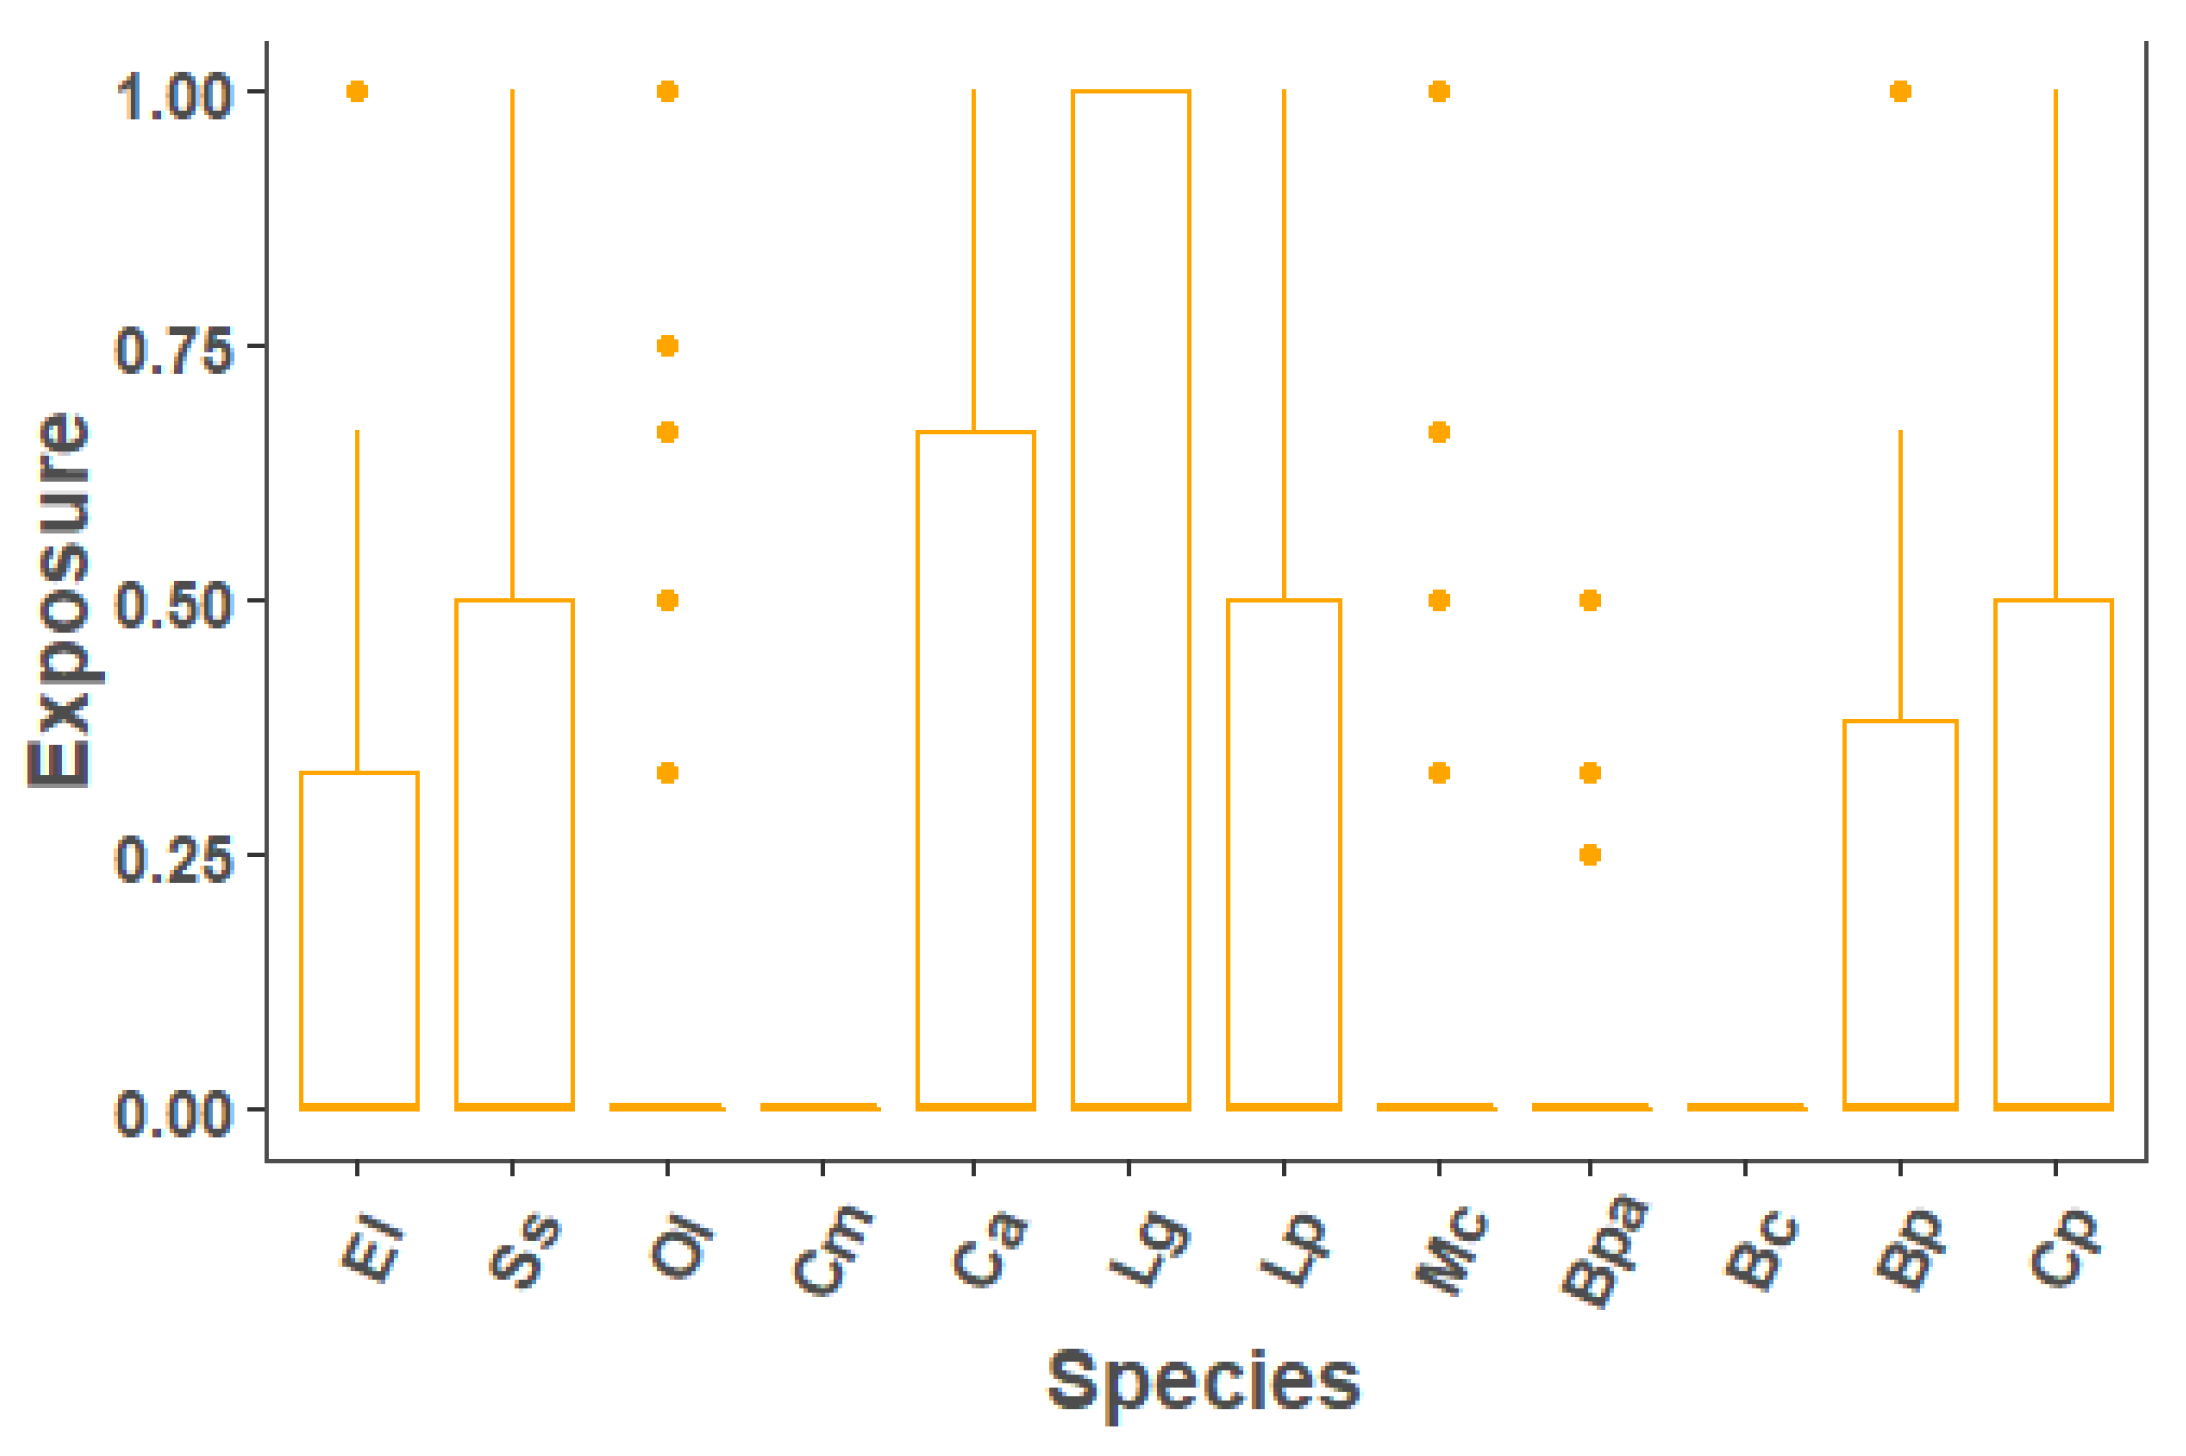
3.1. Exposure
3.2. Adaptive Capacity
3.3. Sensitivity
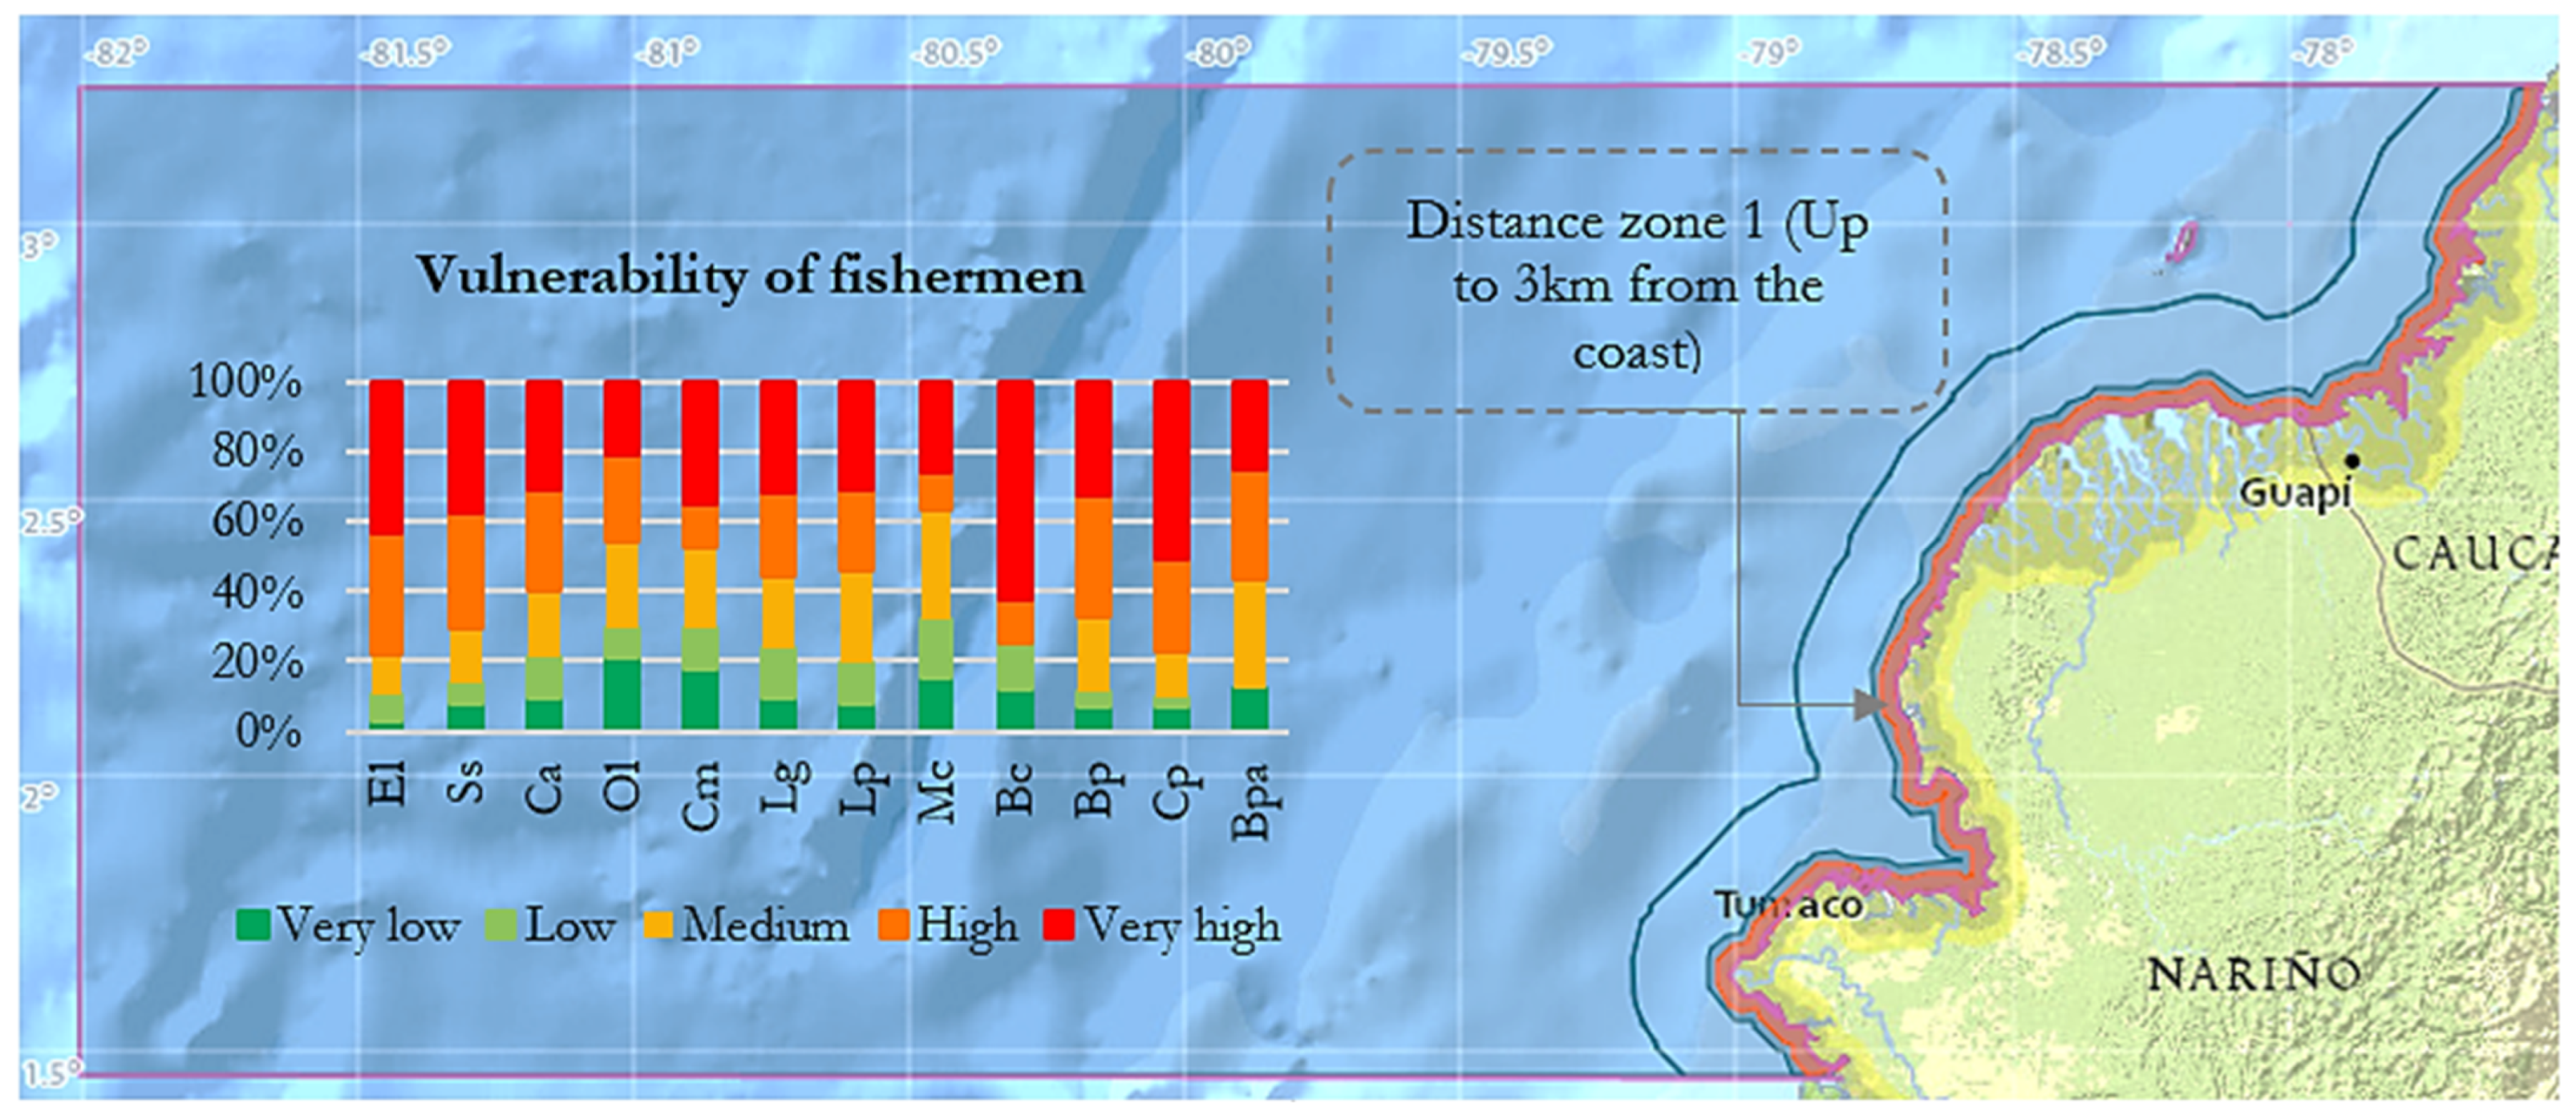
3.4. Vulnerability by Distances from the Coast
4. Conclusions
Author Contributions
Funding
Institutional Review Board Statement
Informed Consent Statement
Data Availability Statement
Acknowledgments
Conflicts of Interest
References
- Herrón, P.; Castellanos-Galindo, G.A.; Stäbler, M.; Díaz, J.M.; Wolff, M. Toward Ecosystem-Based Assessment and Management of Small-Scale and Multi-Gear Fisheries: Insights from the Tropical Eastern Pacific. Front. Mar. Sci. 2019, 6, 17. [Google Scholar] [CrossRef]
- Tilley, A.; Herrón, P.; Espinosa, S.; Angarita, J.L.; Box, S. Predicting vulnerability to management changes in data-limited, small-scale fisheries. Mar. Policy 2018, 94, 39–45. [Google Scholar] [CrossRef]
- Boyd, C. Fisheries Sector. In Importance of Biodiversity and Ecosystems in Economic Growth and Equity in Latin America and the Caribbean: An Economic Valuation of Ecosystems; Alpizar, F., Bovernick, A., Schnell, C., Eds.; United Nations Development Programme (UNDP). Technical Report, 1–44; UNDP: New York, NY, USA, 2010; pp. 1–327. Available online: https://www.undp.org/sites/g/files/zskgke326/files/publications/Report_ENG.pdf (accessed on 13 March 2022).
- Pörtner, H.-O. Oxygen- and capacity-limitation of thermal tolerance: A matrix for integrating climate-related stressor effects in marine ecosystems. J. Exp. Biol. 2010, 213, 881–893. [Google Scholar] [CrossRef]
- Jennings, S.; Collingridge, K. Predicting Consumer Biomass, Size-Structure, Production, Catch Potential, Responses to Fishing and Associated Uncertainties in the World’s Marine Ecosystems. PLoS ONE 2015, 10, e0133794. [Google Scholar] [CrossRef]
- Lotze, H.K.; Tittensor, D.P.; Bryndum-Buchholz, A.; Eddy, T.D.; Cheung, W.W.L.; Galbraith, E.D.; Barange, M.; Barrier, N.; Bianchi, D.; Blanchard, J.; et al. Global ensemble projections reveal trophic amplification of ocean biomass declines with climate change. Proc. Natl. Acad. Sci. USA 2019, 116, 12907–12912. [Google Scholar] [CrossRef] [PubMed]
- Panayotou, T. Management Concepts for Small-Scale Fisheries: Economic and Social Aspects [Conceptos de Ordenación para las Pesquerías en Pequeña Escala: Aspectos Económicos y Sociales]; Documentos técnicos de pesca; FAO: Rome, Italy, 1983; Volume 228, 60p. [Google Scholar]
- National Code of Renewable Natural Resources and Environmental Protection. 1993. Available online: https://cvc.gov.co/sites/default/files/Normatividad/Nacional/Leyes/Decreto-Ley2811-74-Codigo-Recursos-Naturales-Renovables-y-Proteccion-Medio-Ambiente.pdf (accessed on 20 December 2022).
- Castellanos-Galindo, G.A.; Chong-Montenegro, C.; Baos, R.A.; Zapata, L.A.; Tompkins, P.; Graham, R.T.; Craig, M. Using landing statistics and fishers’ traditional ecological knowledge to assess conservation threats to Pacific goliath grouper in Colombia. Aquat. Conserv. Mar. Freshw. Ecosyst. 2018, 28, 305–314. [Google Scholar] [CrossRef]
- Raemaekers, S.; Sowman, M. Community-Level Socio-Ecological Vulnerability Assessments in the Benguela Current Large Marine Ecosystem; FAO Fisheries and Aquaculture Circular No. 1110.; FAO: Rome, Italy, 2015; pp. 1–127. ISBN 978-92-5-108908-8. Available online: https://www.fao.org/documents/card/es/c/38f3dc32-08e6-4d5a-bce4-da9135729756/ (accessed on 10 November 2021).
- IPCC. Climate Change 2007: Impacts, Adaptation and Vulnerability. Contribution of Working Group II to the Fourth Assessment Report of the Intergovernmental Panel on Climate Change; Parry, M., Canziani, O., Palutikof, J., Van der Linden, P., Hanson, C., Eds.; Cambridge University Press: Cambridge, UK, 2007; 976p, Available online: https://www.ipcc.ch/site/assets/uploads/2018/03/ar4_wg2_full_report.pdf (accessed on 10 November 2021).
- IPCC. Managing the Risks of Extreme Events Disasters to Advance Climate Change Adaptation; Field, C.B., Barros, T.F.V., Stocker, D., Qin, D.J., Dokken, K.L., Ebi, M.D., Mastrandrea, K.J., Mach, G.-K., Plattner, S.K., et al., Eds.; Cambridge University Press: Cambridge, UK, 2012; 582p, Available online: https://www.ipcc.ch/report/managing-the-risks-of-extreme-events-and-disasters-to-advance-climate-change-adaptation/ (accessed on 10 November 2021).
- IPCC. Climate Change 2014: Impacts Adaptation Vulnerability Summaries Frequently Asked Questions Multi-Chapter Boxes Contribution of Working Group II to the Fifth Assessment Report of the Intergovernmental Panel on Climate Change; Field, C.B., Barros, D.J.V.R., Dokken, K.J., Mach, M.D., Mastrandrea, T.E., Bilir, M., Chatterjee, K.L., Ebi, Y.O., Estrada, R.C., Genova, B., et al., Eds.; World Meteorological Organization: Geneva, Switzerland, 2014; 200p, Available online: https://www.ipcc.ch/site/assets/uploads/2018/03/WGIIAR5-IntegrationBrochure_es-1.pdf (accessed on 10 November 2021).
- FAO. Assessing Climate Change Vulnerability in Fisheries and Aquaculture: Available Methodologies and their Relevance for the Sector, by Cecile Brugère and Cassandra De Young; FAO Fisheries and Aquaculture Technical Paper No. 597.; FAO: Rome, Italy, 2015; Available online: https://www.fao.org/documents/card/es/c/3a200d99/ (accessed on 15 January 2022).
- Cinner, J.; McClanahan, T.; Wamukota, A.; Darling, E.; Humphries, A.; Hicks, C.; Huchery, C.; Marshall, N.; Hempson, T.; Graham, N.; et al. Social–Ecological Vulnerability of Coral Reef Fisheries to Climatic Shocks; FAO Fisheries and Aquaculture Circular No. 1082.; FAO: Rome, Italy, 2013; 63p, Available online: https://www.fao.org/3/ap972e/ap972e.pdf (accessed on 15 January 2022).
- Koomson, D.; Davies-Vollum, K.S.; Raha, D. Characterising the vulnerability of fishing households to climate and environmental change: Insights from Ghana. Mar. Policy 2020, 120, 104142. [Google Scholar] [CrossRef]
- Gallopín, G.C. Linkages between vulnerability, resilience, and adaptive capacity. Glob. Environ. Chang. 2006, 16, 293–303. [Google Scholar] [CrossRef]
- Morton, J.F. The impact of climate change on smallholder and subsistence agriculture. Proc. Natl. Acad. Sci. USA 2007, 104, 19680–19685. [Google Scholar] [CrossRef]
- Martins, I.M.; Gasalla, M.A. Perceptions of climate and ocean change impacting the resources and livelihood of small-scale fishers in the South Brazil Bight. Clim. Chang. 2018, 147, 441–456. [Google Scholar] [CrossRef]
- Martins, I.M.; Gasalla, M.A. Adaptive Capacity Level Shapes Social Vulnerability to Climate Change of Fishing Communities in the South Brazil Bight. Front. Mar. Sci. 2020, 7, 481. [Google Scholar] [CrossRef]
- Badjeck, M.-C.; Allison, E.H.; Halls, A.S.; Dulvy, N.K. Impacts of climate variability and change on fishery-based livelihoods. Mar. Policy 2010, 34, 375–383. [Google Scholar] [CrossRef]
- Eitzinger, A.; Läderach, P.; Bunn, C.; Quiroga, A.; Benedikter, A.; Pantoja, A.; Gordon, J.; Bruni, M. Implications of a changing climate on food security and smallholders’ livelihoods in Bogotá, Colombia. Mitig. Adapt. Strat. Glob. Chang. 2014, 19, 161–176. [Google Scholar] [CrossRef]
- Martínez, C.I.P. Climate Change in Colombia: Trends and Perspective to Achieve Sustainable Development. Eur. J. Sustain. Dev. 2018, 7, 247–254. [Google Scholar] [CrossRef]
- Roncancio, D.; Cutter, S.; Nardocci, A. Social vulnerability in Colombia. Int. J. Disaster Risk Reduct. 2020, 50, 101872. [Google Scholar] [CrossRef]
- McMartin, D.W.; Merino, B.H.H.; Bonsal, B.; Hurlbert, M.; Villalba, R.; Ocampo, O.L.; Upegui, J.J.V.; Poveda, G.; Sauchyn, D.J. Limitations of Water Resources Infrastructure for Reducing Community Vulnerabilities to Extremes and Uncertainty of Flood and Drought. Environ. Manag. 2018, 62, 1038–1047. [Google Scholar] [CrossRef]
- Coca-Domínguez, O.; Ricaurte-Villota, C. Validation of the Hazard and Vulnerability Analysis of Coastal Erosion in the Caribbean and Pacific Coast of Colombia. J. Mar. Sci. Eng. 2019, 7, 260. [Google Scholar] [CrossRef]
- Berrouet, L.; Villegas-Palacio, C.; Botero, V. Vulnerability of Rural Communities to Change in an Ecosystem Service Provision: Surface water supply. A Case Study in the Northern Andes, Colombia. Land Use Policy 2020, 97, 104737. [Google Scholar] [CrossRef]
- Bejarano, A.; Toline, C.; Horsman, J.; Zarza-González, E.; Cogollo, K. A climate change vulnerability framework for Corales del Rosario y San Bernardo National Natural Park, Colombia. Clim. Res. 2016, 70, 18. [Google Scholar] [CrossRef]
- Montiel, S.A.H.; Coronado-Franco, K.V.; Selvaraj, J.J. Predicted changes in the potential distribution of seerfish (Scomberomorus sierra) under multiple climate change scenarios in the Colombian Pacific Ocean. Ecol. Inform. 2019, 53, 100985. [Google Scholar] [CrossRef]
- Selvaraj, J.J.; Rosero-Henao, L.V.; Cifuentes-Ossa, M.A. Projecting future changes in distributions of small-scale pelagic fisheries of the southern Colombian Pacific Ocean. Heliyon 2022, 8, e08975. [Google Scholar] [CrossRef]
- DIMAR (General Maritime Directorate of Colombia). Bol. Inf. 1988, 2, 1–3.
- Correa, I.; Morton, R. Pacific Coast of Colombia. In Encyclopedia of the World’s Coastal Landforms; Springer: Dordrecht, The Netherlands, 2010; pp. 193–198. [Google Scholar] [CrossRef]
- Díaz-Merlano, J.M.; Vieira-Betancourt, C.A.; Melo-Saldarriaga, G.J. (Eds.) Diagnóstico de las Principales Pesquerías del Pacífico Colombiano; Fundación Marviva: Bogotá, Colombia, 2011; 242p, Available online: https://marviva.net/wp-content/uploads/2021/11/pesquerias_baja.pdf (accessed on 20 February 2023).
- Escobar, A. Territories of Difference: Place, Movements, Life, Redes; Duke University Press: Durham, NC, USA, 2008; Available online: https://books.google.com.co/books?id=v2ttzsWSEpEC&printsec=frontcover&dq=Territories+of+difference:+place,+movements,+life,+redes.&hl=es&sa=X&ved=2ahUKEwi94dmswd3sAhVizlkKHROmDN8Q6AEwAHoECAQQAg#v=onepage&q=Territories%20of%20difference%3A%20place%2C%20movements%2C%20life%2C%20redes.&f=false (accessed on 10 January 2023).
- Castellanos-Galindo, G.A.; Padilla, L.A.Z. Small-Scale Fisheries on the Pacific Coast of Colombia: Historical Context, Current Situation, and Future Challenges. In Viability and Sustainability of Small-Scale Fisheries in Latin America and The Caribbean; Salas, S., Barragán-Paladines, M., Chuenpagdee, R., Eds.; MARE Publication Series (19); Springer: Cham, Switzerland, 2019; pp. 79–100. [Google Scholar] [CrossRef]
- De La Hoz, J.; Narváez, J.; Manjarrés, L.; Nieto, L.; Rivera, R.; Cuello, F.; Alvarez, T. Boletín Estadístico Enero—Diciembre 2013; Autoridad Nacional de Acuicultura y Pesca (AUNAP): Bogotá, Colombia, 2013; p. 60. [Google Scholar]
- Ripley, B.D. Pattern Recognition and Neural Networks; Cambridge University Press: Cambridge, UK, 2014; pp. 1–403. [Google Scholar] [CrossRef]
- Phillips, S.J.; Anderson, R.P.; Schapire, R.E. Maximum entropy modeling of species geographic distributions. Ecol. Model. 2006, 190, 231–259. [Google Scholar] [CrossRef]
- Elith, J.; Leathwick, J.R.; Hastie, T. A working guide to boosted regression trees. J. Anim. Ecol. 2008, 77, 802–813. [Google Scholar] [CrossRef] [PubMed]
- Breiman, L. Random forests. Mach. Learn. 2001, 45, 5–32. [Google Scholar] [CrossRef]
- Breiman, L.; Friedman, J.H.; Olshen, R.A.; Stone, C.J. Classification and Regression Trees; Taylor Francis: Abingdon, UK, 2017; pp. 1–358. [Google Scholar]
- Zanchettin, D.; Rubino, A.; Matei, D.; Bothe, O.; Jungclaus, J.H. Multidecadal-to-centennial SST variability in the MPI-ESM simulation ensemble for the last millennium. Clim. Dyn. 2013, 40, 1301–1318. [Google Scholar] [CrossRef]
- Jones, C.D.; Hughes, J.K.; Bellouin, N.; Hardiman, S.C.; Jones, G.S.; Knight, J.; Liddicoat, S.; O’Connor, F.M.; Andres, R.J.; Bell, C.; et al. The HadGEM2-ES implementation of CMIP5 centennial simulations. Geosci. Model Dev. 2011, 4, 543–570. [Google Scholar] [CrossRef]
- Voldoire, A.; Sanchezgomez, E.; Y Mélia, D.S.; Decharme, B.; Cassou, C.; Senesi, S.; Valcke, S.; Beau, I.; Alias, A.; Chevallier, M.; et al. The CNRM-CM5.1 global climate model: Description and basic evaluation. Clim. Dyn. 2013, 40, 2091–2121. [Google Scholar] [CrossRef]
- Selvaraj, J.J.; Guerrero, D.; Cifuentes-Ossa, M.A.; Alvis, I.G. The economic vulnerability of fishing households to climate change in the south Pacific region of Colombia. Heliyon 2022, 8, e09425. [Google Scholar] [CrossRef]
- Tilley, A.; Box, S. Análisis de Vulnerabilidad de las Pesquerías Artesanales del Municipio de Buenaventura, Pacífico Colombiano (USAID, BIOREDD+). Reporte del Subcontrato (BR-SUBK-FP-029); Programa BIOREDD+; USAID Colombia: Bogotá, Colombia, 2014. [Google Scholar] [CrossRef]
- AUNAP (National Authority of Aquaculture and Fisheries of Colombia); UNIMAGDALENA. Characterization of the Main Fishing Gear in Colombia and Consolidated Report of the Type and Number of Gear, Vessels and UEP’s Used by Fishermen Linked to the Fishing Activity. [Caracterización de los Principales Artes de Pesca de Colombia y Reporte del Consolidado del Tipo y Número de Artes, Embarcaciones y UEP’s Empleadas por los Pescadores Vinculados a la Actividad Pesquera]; Contract for the Provision of Services No. 190, signed between the National Authority of Aquaculture and Fisheries and the University of Magdalena; AUNAP: Santa Marta, Colombia; Bogotá, Colombia, 2014; 72p. [Google Scholar]
- FAO. A Fishery Manager’s Guidebook—Management Measures and their Application; Fisheries Technical Paper 424; FAO: Rome, Italy, 2002; ISBN 92-5-10473204. Available online: http://www.fao.org/3/y3427e/y3427e00.htm#Contents (accessed on 13 January 2023).
- AUNAP (National Authority of Aquaculture and Fisheries of Colombia). Resolution 2254 of 2015; AUNAP: Bogotá, Colombia, 2015. [Google Scholar]
- INDERENA (National Institute of Renewable Natural Resources and the Environment of Colombia). Resolution 2526 of 1981; INDERENA: Bogotá, Colombia, 1981. [Google Scholar]
- INCODER (Colombian Institute of Rural Development). Resolution 695 of 2004; INCODER: Bogotá, Colombia, 2004. [Google Scholar]
- Colombian Congress. Law 13 of 1990; Colombian Congress: Bogotá, Colombia, 1990. [Google Scholar]
- Uddin, N.; Islam, A.S.; Bala, S.K.; Islam, G.T.; Adhikary, S.; Saha, D.; Haque, S.; Fahad, G.R.; Akter, R. Mapping of climate vulnerability of the coastal region of Bangladesh using principal component analysis. Appl. Geogr. 2019, 102, 47–57. [Google Scholar] [CrossRef]
- Macusi, E.D.; Macusi, E.S.; Jimenez, L.A.; Catam-Isan, J.P. Climate change vulnerability and perceived impacts on small-scale fisheries in eastern Mindanao. Ocean Coast. Manag. 2020, 189, 105143. [Google Scholar] [CrossRef]
- Allison, E.H.; Perry, A.L.; Badjeck, M.-C.; Adger, W.N.; Brown, K.; Conway, D.; Halls, A.S.; Pilling, G.M.; Reynolds, J.D.; Andrew, N.L.; et al. Vulnerability of national economies to the impacts of climate change on fisheries. Fish Fish. 2009, 10, 173–196. [Google Scholar] [CrossRef]
- Espinosa-Corrales, C.A. “We live from this, this is our work”: Artisanal fishing methods and arts in The Valley Corregimiento, Solano Bay (Chocó). [“Nosotros de esto vivimos, este es nuetro trabajo”: Métodos y artes de pesca artesanal en el corregimiento El Valle, Bahía Solano (Chocó)]. Boletín Científico CIOH 2021, 40, 59–65. [Google Scholar]
- Aroca-Araújo, A. Spatial orientation forms of fishermen Buenaventura, Colombia [Las formas de orientación espacial de los pescadores de Buenaventura, Colombia. Rev. U.D.C. A Actual. Divulg. Científica 2012, 15, 457–465. [Google Scholar]
- Murciano, M.G.; Liu, Y.; Ünal, V.; Lizaso, J.L.S. Comparative analysis of the social vulnerability assessment to climate change applied to fisheries from Spain and Turkey. Sci. Rep. 2021, 11, 13949. [Google Scholar] [CrossRef]
- Ojea, E.; Lester, S.E.; Salgueiro-Otero, D. Adaptation of Fishing Communities to Climate-Driven Shifts in Target Species. One Earth 2020, 2, 544–556. [Google Scholar] [CrossRef]


| Sections in the Questionnaire | Summary of Information Obtained |
|---|---|
| 1. Sociodemographic information | Residence location (urban or rural) Household location (commune) Age Marital status Family composition Education level Income level Length of time living in the region |
| 2. Characteristics of Fishing Activity | Duration of time working in the fishing activity Details of the fishing boat and gear (materials, propulsion type, capacity) Usage of technology in the fishing activity Time invested in carrying out the fishing activity |
| 3. Commercially important and food-security-relevant species (marine fish) | Presence of species in the fisherman’s catch Months of the year when the species is caught Fishing gear used to catch the species Depth at which the species is caught Distance from the coast where the species is caught Fishing ground used |
| 4. Fishermen’s perception of the effects of climate change | Changes in environmental variables (water temperature, tides, currents, rain) Changes in frequency of extreme events (floods, storms, red tides, coastal erosion) Opinion on the causes of climate change Source of information on climate change Opinion on the potential measures for adapting to climate change Opinion on who should be managing climate change |
| Biological Category | Species | Depths of Analysis | ||
|---|---|---|---|---|
| Common Name | Scientific Name | Acronym | ||
| Pelagic | Black skipjack | Euthynnus lineatus | El | 0 m |
| Pacific sierra/seerfish | Scomberomorus sierra | Ss | 17 m | |
| Whitefin weakfish | Cynoscion albus | Ca | 0 m | |
| Pacific thread herring | Opisthonema libertate | Ol | 0 m | |
| Pacific anchoveta | Cetengraulis mysticetus | Cm | 0 m | |
| Benthopelagic | Spotted rose snapper | Lutjanus guttatus | Lg | 17 m |
| Pacific red snapper | Lutjanus peru | Lp | 17 m | |
| Flathead grey mullet | Mugil cephalus | Mc | 27 m | |
| Demersal | Cachema weakfish | Cynoscion phoxocephalus | Cp | 27 m |
| Red sea catfish | Bagre pinnimaculatus | Bp | 17 m | |
| Chilhuil sea catfish | Bagre panamensis | Bpa | 54 m | |
| Pacific bearded brotula | Brotula clarkae | Bc | 61 m | |
| Change Detection Classes | Criterion 1 | Criterion 2 | Criterion 3 |
|---|---|---|---|
| No change | If the fishing site is located in an area where the SDM result is “no change”, the current distribution of the species should be evaluated to find out if it currently has a high or low probability of occurrence | If it has a low probability of occurrence (<50% probability), a value of “0” is assigned. If it has a high probability (>50%), a value of “1” is assigned | If the fishing site or the fishing area falls between two classes, the percentage of area occupied by said class over the area of influence of the fishing bank must be estimated to assign the class that comprises the largest area |
| Positive change | The fishing site is completely located within a zone of “positive change”. A value of “1” is assigned | If the fishing site is partially located in a zone of “positive change” and another class, the percentage of area occupied by said class must be estimated to assign the value of “1” with respect to the area of influence of the fishing bank | |
| Negative change | The fishing site is located entirely within a zone of “negative change”. A value of 0 is assigned | If the fishing site is partially located in a zone of “each class” and another class, the percentage of area occupied by said class must be estimated to assign the value of “0” with respect to the area of influence of the fishing bank | |
| Absence | The fishing site is located entirely within a zone of “absence”. A value of “0” is assigned | ||
| None | The fishing site is located outside the change detection raster due to the evaluated depth | In this case, a value of “0” is assigned, because that fishing site does not have that depth. For example, when the fishing site is located near the coast and the evaluation of the species is being performed at a depth of more than 0 m (17 m, 27 m, 54 m, or 61 m) | If the fishing site is located outside the change detection raster, despite the fact that the evaluated depth is 0 m deep, the point must be included in the evaluation, assigning a score of “0” or “1” as appropriate in the evaluation change detection. For example, when the evaluation is performed at 0 m depth and the fishing site is located near the coast |
| Classification of Fishing Gear Based on AUNAP (2014) | Criteria for the Evaluation of Sustainability Based on FAO (2002) | ||||||||||||
|---|---|---|---|---|---|---|---|---|---|---|---|---|---|
| Fishing Gear | Effects of Fishing Gear on Habitats | Selectivity of the Fishing Gear in Size of the Species | Selectivity of the Fishing Gear in the Type of Species to Be Captured | Bycatch Level | Susceptibility of Fishing Gear Abandoned at Sea | Final Score | |||||||
| International General Classification | Associated Fishing Gear 3 | Survey Responses «Local Name» | Impact | Score | Impact | Score | Impact | Score | Impact | Score | Impact | Score | |
| Purse seine nets | Purse seine net Beach seine Seine net without purse | «Ruche 1» «Red de barco» «Red de cerco» | Medium | 2 | Low | 1 | Medium | 2 | Medium | 2 | Low | 3 | 10 |
| Dragnet fishing nets | Cast net | «Malla» «Atarraya» «Boliche de mano» | Medium | 2 | Low | 1 | Low | 1 | Medium | 2 | Low | 3 | 9 |
| Trawling gear | Trawl net Boat dredges | «Riflillo 2» «Changa 2» «Chinchorro» | Alto | 1 | Low | 1 | Low | 1 | Alto | 1 | Low | 3 | 7 |
| Gillnets or mesh nets | Trammel (gill net) Electronic trammel Monofilament/multifilament mesh | «Trasmallo» «Red de Enmalle» «Zangarreo o Calambuqueo» | Low | 3 | Medium | 2 | Low | 1 | Medium | 2 | Alto | 1 | 9 |
| Fishing traps | Traps | No registration in the survey | N/A | N/A | N/A | N/A | N/A | N/A | N/A | N/A | N/A | N/A | N/A |
| No Classification | Dynamite | «Dinamita» | N/A | N/A | N/A | N/A | N/A | N/A | N/A | N/A | N/A | N/A | N/A |
| Hooks and lines | Fixed or anchored handline or troll | «Línea de Mano» «Correteo, Trolling, Curricán» «Línea de mano fija o anclada» «Palangre/Nylono Anzuelos» | Low | 3 | Low | 1 | Low | 1 | Medium | 2 | Medium | 2 | 9 |
| Drifting longline or bottom-set longline | «Calandro» «Espinel de fondo Palangre/Espinel de fondo» | Low | 3 | Medium | 2 | Medium | 2 | Medium | 2 | Low | 3 | 12 | |
| Longline or shallow longline | «Boyao» «Palangre o Espinel somero» | Low | 3 | Medium | 2 | Medium | 2 | Medium | 2 | Low | 3 | 12 | |
| Diversity of fishing gear (total number of different types of fishing gear used by the fishermen) | If the fishermen use only one (1) type of fishing gear, assign a score of “0” | If the fishermen use two (2) or three (3) types of fishing gear, assign a score of “0.5” | If the fishermen use four (4) or more types of fishing gear, assign a score of “1” |
| Sustainability of the fishing gear (assessed according to the total number of fishing gear types that are considered as sustainable) | If the amount of sustainable fishing gear is greater than the less sustainable fishing gear, a score of 1 is assigned in the sensitivity component for the sustainability of fishing gear | If the number of less sustainable fishing gear is greater than the number of fishing gear considered sustainable, we proceeded to assign the score as follows: | “0.5” if the fisher uses at least one (1) sustainable fishing gear |
| “1” if among the fishing gear used, there are two (2) or more classified as sustainable | |||
| “0” if the fisherman does not have any fishing gear considered sustainable |
| Assigned Score | Boat Materials | Technological Aids Used for Fishing | Access and Use of Information on Weather Conditions |
|---|---|---|---|
| 0 | Wood only | Does not use any help | Does not access or use information on weather conditions for fishing activity |
| 0.5 | Combination of wood and fiberglass | Use some combination of compass and/or radio | Access information on weather conditions through newspapers, television, and/or radio |
| 1 | Combination of iron and fiberglass | Use some combination of GPS, web browser, sonar, compass, and/or radio | Access information on weather conditions through the port authority, weather stations, cell phone, and/or internet |
| Fiberglass only |
| Sum of the Horsepower of the Engines | Assigned Score |
|---|---|
| No engines | 0 |
| Up to 15 HP | 0.2 |
| Up to 50 HP | 0.3 |
| Up to 75 HP | 0.5 |
| Up to 90 HP | 0.7 |
| Up to 120 HP | 0.9 |
| 121 HP or more | 1 |
| Vulnerability Analysis | Monthly Income from Fishing Activity | ||
|---|---|---|---|
| Categories | Categories | ||
| % Fishing household with the Colombian legal monthly minimum wage (2020) | % Fishing household with income above the Colombian legal monthly minimum * wage (2020) | % Fishing household with income below the Colombian legal monthly minimum * wage (2020) | |
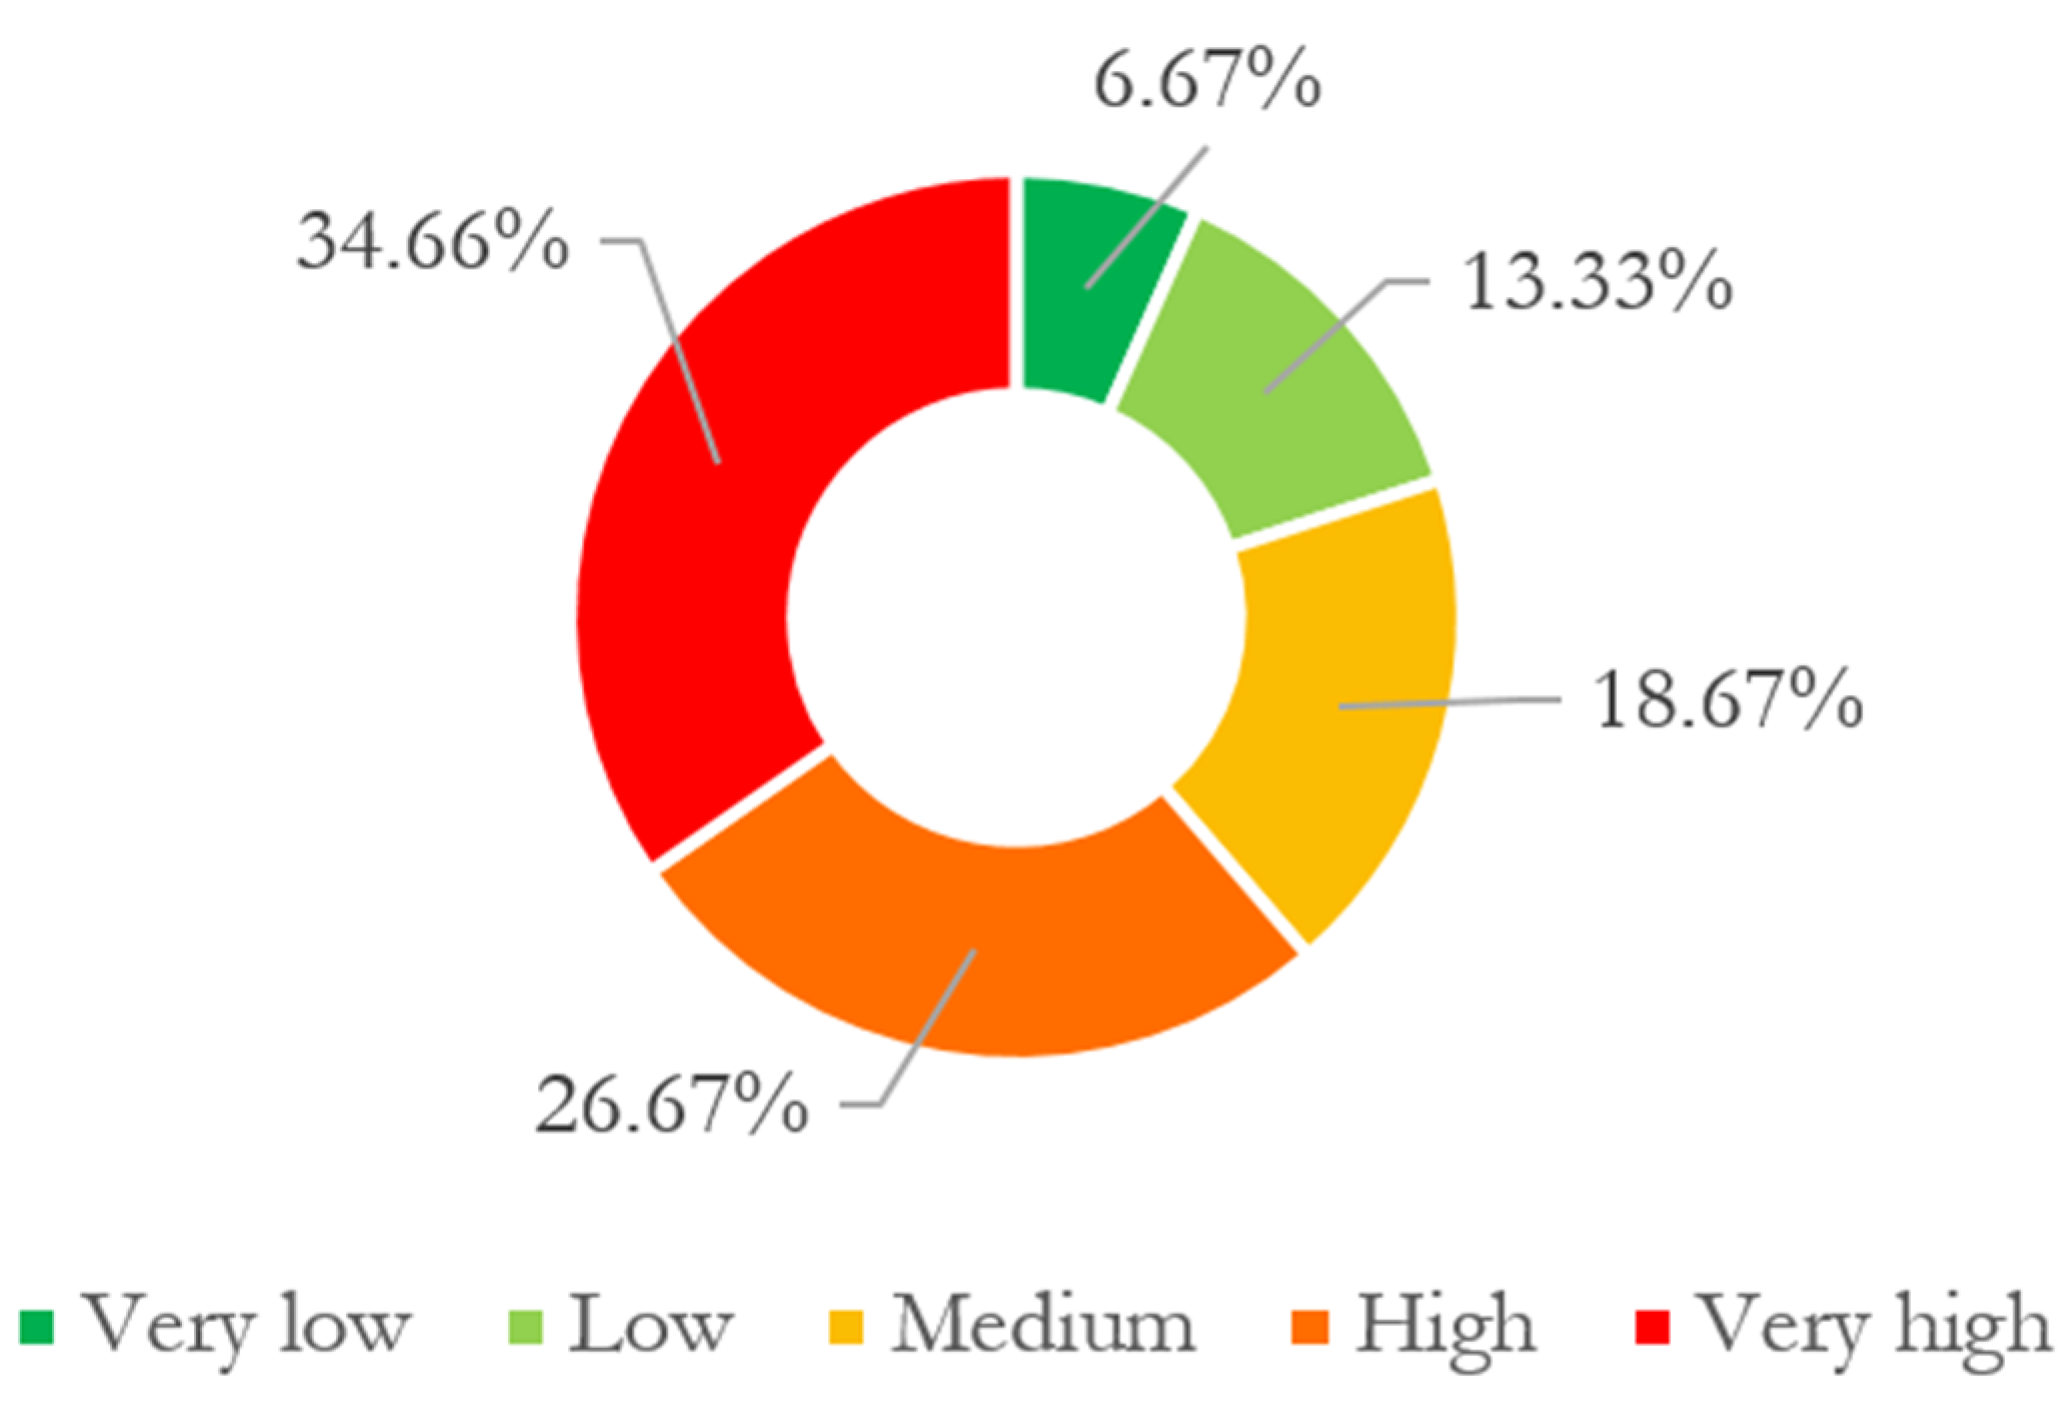
| Very high | 41.82% | 14.54% | 43.64% |
| High | 36.84% | 18.42% | 44.74% |
| Medium | 20% | 16.67% | 63.33% |
| Low | 22.22% | 5.56% | 72.22% |
| Very low | --- | ---- | 100% |
| Variable | PC1 | PC2 | |
|---|---|---|---|
| Adaptive Capacity | Use of technologies for fishing | 0.616 | |
| Total engine capacity of the boats (sum of total HP of the engines) | 0.447 | ||
| Access to meteorological conditions for fishing | 0.338 | ||
| Construction materials of the boat | 0.159 | ||
| Sensitivity | Total amount of fishing gear | 0.013 | |
| Sustainability of fishing gear | −0.660 | ||
| Monthly incomes from fishing | −0.556 |
Disclaimer/Publisher’s Note: The statements, opinions and data contained in all publications are solely those of the individual author(s) and contributor(s) and not of MDPI and/or the editor(s). MDPI and/or the editor(s) disclaim responsibility for any injury to people or property resulting from any ideas, methods, instructions or products referred to in the content. |
© 2023 by the authors. Licensee MDPI, Basel, Switzerland. This article is an open access article distributed under the terms and conditions of the Creative Commons Attribution (CC BY) license (https://creativecommons.org/licenses/by/4.0/).
Share and Cite
Selvaraj, J.J.; Rosero-Henao, L.V.; Cifuentes-Ossa, M.A. Small-Scale Fisheries in the Colombian Pacific: Understanding the Impact of Climate Change on Fishermen’s Livelihoods. Fishes 2023, 8, 453. https://doi.org/10.3390/fishes8090453
Selvaraj JJ, Rosero-Henao LV, Cifuentes-Ossa MA. Small-Scale Fisheries in the Colombian Pacific: Understanding the Impact of Climate Change on Fishermen’s Livelihoods. Fishes. 2023; 8(9):453. https://doi.org/10.3390/fishes8090453
Chicago/Turabian StyleSelvaraj, John Josephraj, Leidy Viviana Rosero-Henao, and Maria Alejandra Cifuentes-Ossa. 2023. "Small-Scale Fisheries in the Colombian Pacific: Understanding the Impact of Climate Change on Fishermen’s Livelihoods" Fishes 8, no. 9: 453. https://doi.org/10.3390/fishes8090453
APA StyleSelvaraj, J. J., Rosero-Henao, L. V., & Cifuentes-Ossa, M. A. (2023). Small-Scale Fisheries in the Colombian Pacific: Understanding the Impact of Climate Change on Fishermen’s Livelihoods. Fishes, 8(9), 453. https://doi.org/10.3390/fishes8090453