Article

Randall’s Threadfin Bream (Nemipterus randalli, Russell 1986) Poses a Potential Threat to the Northeastern Mediterranean Sea Food Web

1
Department of Biological Sciences, Middle East Technical University, 06800 Ankara, Türkiye
2
Institute of Marine Sciences, Middle East Technical University, 33731 Erdemli, Türkiye
*
Author to whom correspondence should be addressed.
Fishes 2023, 8(8), 402; https://doi.org/10.3390/fishes8080402
Submission received: 30 June 2023 / Revised: 30 July 2023 / Accepted: 31 July 2023 / Published: 3 August 2023
(This article belongs to the Section Biology and Ecology)

Abstract

:
The eastern Mediterranean Sea is one of the most invaded marine ecosystems due to the introduction of Lessepsian species, which migrated from the Red Sea to the Mediterranean Sea following the construction of the Suez Canal. Some of these species may initially appear to be beneficial for fisheries by providing additional income sources for fishers; however, this usually occurs at the expense of negatively impacted native species and, thus, the ecosystem, which leads to greater economic losses for the fisheries in the long term. Therefore, this study aims to quantify the impact of N. randalli, which is one of the Lessepsian species with increasing commercial importance for the fisheries, on the food web dynamics in a coastal ecosystem in the northeastern Mediterranean Sea using a mass-balance food web modelling approach by capitalising on field data obtained from trawl samplings conducted within the scope of the study. Results showed that the ecosystem was in a developmental stage and experienced an autotrophic succession. The keystone fish group with a structuring role in the food web was sea breams and porgies. Although N. randalli had positive impacts on certain commercially exploited indigenous demersal fish species by mitigating the negative impact of another Lessepsian species, i.e., Saurida undosquamis (Richardson, 1848), in the food web, it had a negative impact on the keystone group of the food web, i.e., sea breams and porgies. Therefore, N. randalli poses a potential threat to the ecosystem’s structure, and the interactions of N. randalli with other species in the food web may instigate an ecosystem reorganisation in the future. We suggest targeted fisheries exploitation and incentives for the fishery of N. randalli as management strategies to mitigate its negative impacts. However, the mitigating role of N. randalli in regulating the negative impacts of S. undosquamis could be adversely affected by its increasing exploitation; therefore, future modelling studies should consider scenario simulations to test such effects.
Key Contribution: Randall’s threadfin bream has a mitigating role against negative impacts of other Lessepsian fish species, whereas it could be a potential instigator of drastic reorganisations in the northeastern Mediterranean Sea food web.

1. Introduction

Species that move or are introduced beyond their past or present distribution and are capable of surviving and reproducing in their new environment are called alien species, and alien species that threaten the biological diversity in their new environment are called invasive alien species [1]. The Levantine Sea is considered one of the marine regions most impacted by biological invasions, with an alien-to-native species richness ratio of 0.69 [2], and was tremendously affected by two anthropogenic stressors other than fisheries: the constructions of the Suez Canal and the Aswan Dam. Both have a crucial role in the species migration from the Red Sea to the Mediterranean Sea, which is known as the Lessepsian migration (named after the engineer and developer of the canal Ferdinand de Lesseps) or Erythraean invasion. The Suez Canal was completed in 1869 to provide a shorter maritime route between the western Pacific, the Indian Ocean and the Mediterranean Sea, and the Atlantic Ocean. Initially, the Suez Canal was 8 m deep, and its depth gradually increased to 24 m. This further deepening of the Suez Canal facilitated the migration of species to the Mediterranean Sea from the Red Sea [3]. Furthermore, the construction of the Aswan Dam in 1965 reduced the fresh water inflow from the River Nile, which is in proximity to the Suez Canal, that previously provided a biogeographic barrier against the Lessepsian migrants [4,5].
The abundance and biomass of invasive fish species have doubled during the last two decades in the Levantine Basin [6]. Increasing sea surface temperatures in the Levantine Sea due to global warming is hypothesised to have facilitated the successful establishment of the invasive species from the Red Sea [7]. Furthermore, the Red Sea has similar conditions to those in the Levantine Sea, i.e., poor nutrient levels and high salinity (38.7 practical salinity unit (PSU) in the Levantine Sea, 40–41 PSU in the northern Red Sea and around 41 PSU in the Gulf of Suez); therefore, the Mediterranean Sea provides a familiar environment for the Lessepsian migrants and, thus, increases their chances of successful establishment [8].
Ecopath with Ecosim (EwE) is one of the most widely adopted food web models that is used to delineate the structure and function of marine food webs and ecosystems [9]. Modelling studies using EwE were previously conducted to represent the food web interactions, impact of fisheries and introduction of alien species in the eastern Mediterranean Sea. In the Aegean Sea, fisheries exploitation was high and the microbial food web influenced the functioning of the ecosystem [10], and different fishery management scenarios indicated an inevitable reduction in pelagic species biomasses [11]. In the Thermaikos Gulf in the north Aegean Sea, changing environmental factors and fishing activities instigated biomass declines in fish assemblages, and the best mitigation option was to decrease the exploitation levels by fisheries [12]. Similarly, the declines in the biomasses and catches of marine living resources were due to the changing environmental factors and fisheries exploitation in the Pagasitikos Gulf located in the central Aegean Sea, and a reduction in fisheries exploitation levels was suggested to mitigate adverse changes in the ecosystem [13]. In the Saronikos Gulf in the central Aegean Sea, fisheries exploitation levels were unsustainable and exerted negative impacts on a wide spectrum of species [14]. In a modelling study of the whole Aegean Sea, similar to previous efforts, high fisheries exploitation and its impact on the ecosystem was prominent [15]. Along the coasts of western and southwestern Cyprus island, which is located in the northeastern Mediterranean Sea, alien species had significant impacts on phytobenthos, and eels and morays in the ecosystem [16]. In a study that compared the ecosystem conditions on the Israeli coasts between the 1990s and 2010s, the increasing impact of alien species were evident as the contribution of alien species to the fish biomass and catch in the region increased [17]. In the Mersin Bay in the Cilician Basin, alien species played a key role in benthic–pelagic coupling in the food web, and fisheries mediated the role of alien species [18]. Overall, the impact of fisheries was prevalent in previous modelling studies on the eastern Mediterranean Sea and had the potential to mediate the roles of fish species in the ecosystem. Previously, fisheries, i.g., strategic overfishing, were suggested as a management tool to mitigate the adverse effects of alien and/or invasive species in the food web, e.g., lionfish (Pterois miles, Bennett, 1828) in the northwest Atlantic and invasive freshwater crayfish in North America [19]. Therefore, fisheries can play a role in regulating the negative impacts of alien species in the northeastern Mediterranean Sea.
One of the common Lessepsian species observed on the Turkish coasts is N. randalli. It has recently become abundant in the catch composition [20] and is a commercially important fish species in Turkey. Following its first recorded sighting in Haifa Bay in 2005 [21], it was observed on the Lebanon coast [22], in İskenderun Bay [23], Gökova Bay [24] and İzmir Bay [25] in 2007, 2007, 2011 and 2016, respectively. N. randalli was considered a species with a high potentiality for being invasive in the Mediterranean Sea [26,27]. Furthermore, N. randalli is famous for its resemblance to one of the iconic commercial species, i.e., P. erythrinus, in the region, and has increasingly been marketed as P. erythrinus [28]. Hence, it is critical to assess the impact of N. randalli on the food web of the Levantine Sea and explore possible mitigation strategies, considering its interactions with commercially important indigenous species.
In this study, we investigated the impacts of N. randalli on the food web and native species in the Lamas (Limonlu) region in the Cilician Basin. We further identified the vulnerable native species that could be negatively impacted by further establishment of N. randalli and proposed possible mitigation strategies. Specifically, we sought answers to three fundamental questions related to the role of N. randalli in the study region: (i) what is the impact of N. randalli on the indigenous species in the Lamas region? (ii) how can N. randalli affect the food web dynamics? and (iii) how could the impacts of N. randalli be mitigated?

2. Materials and Methods
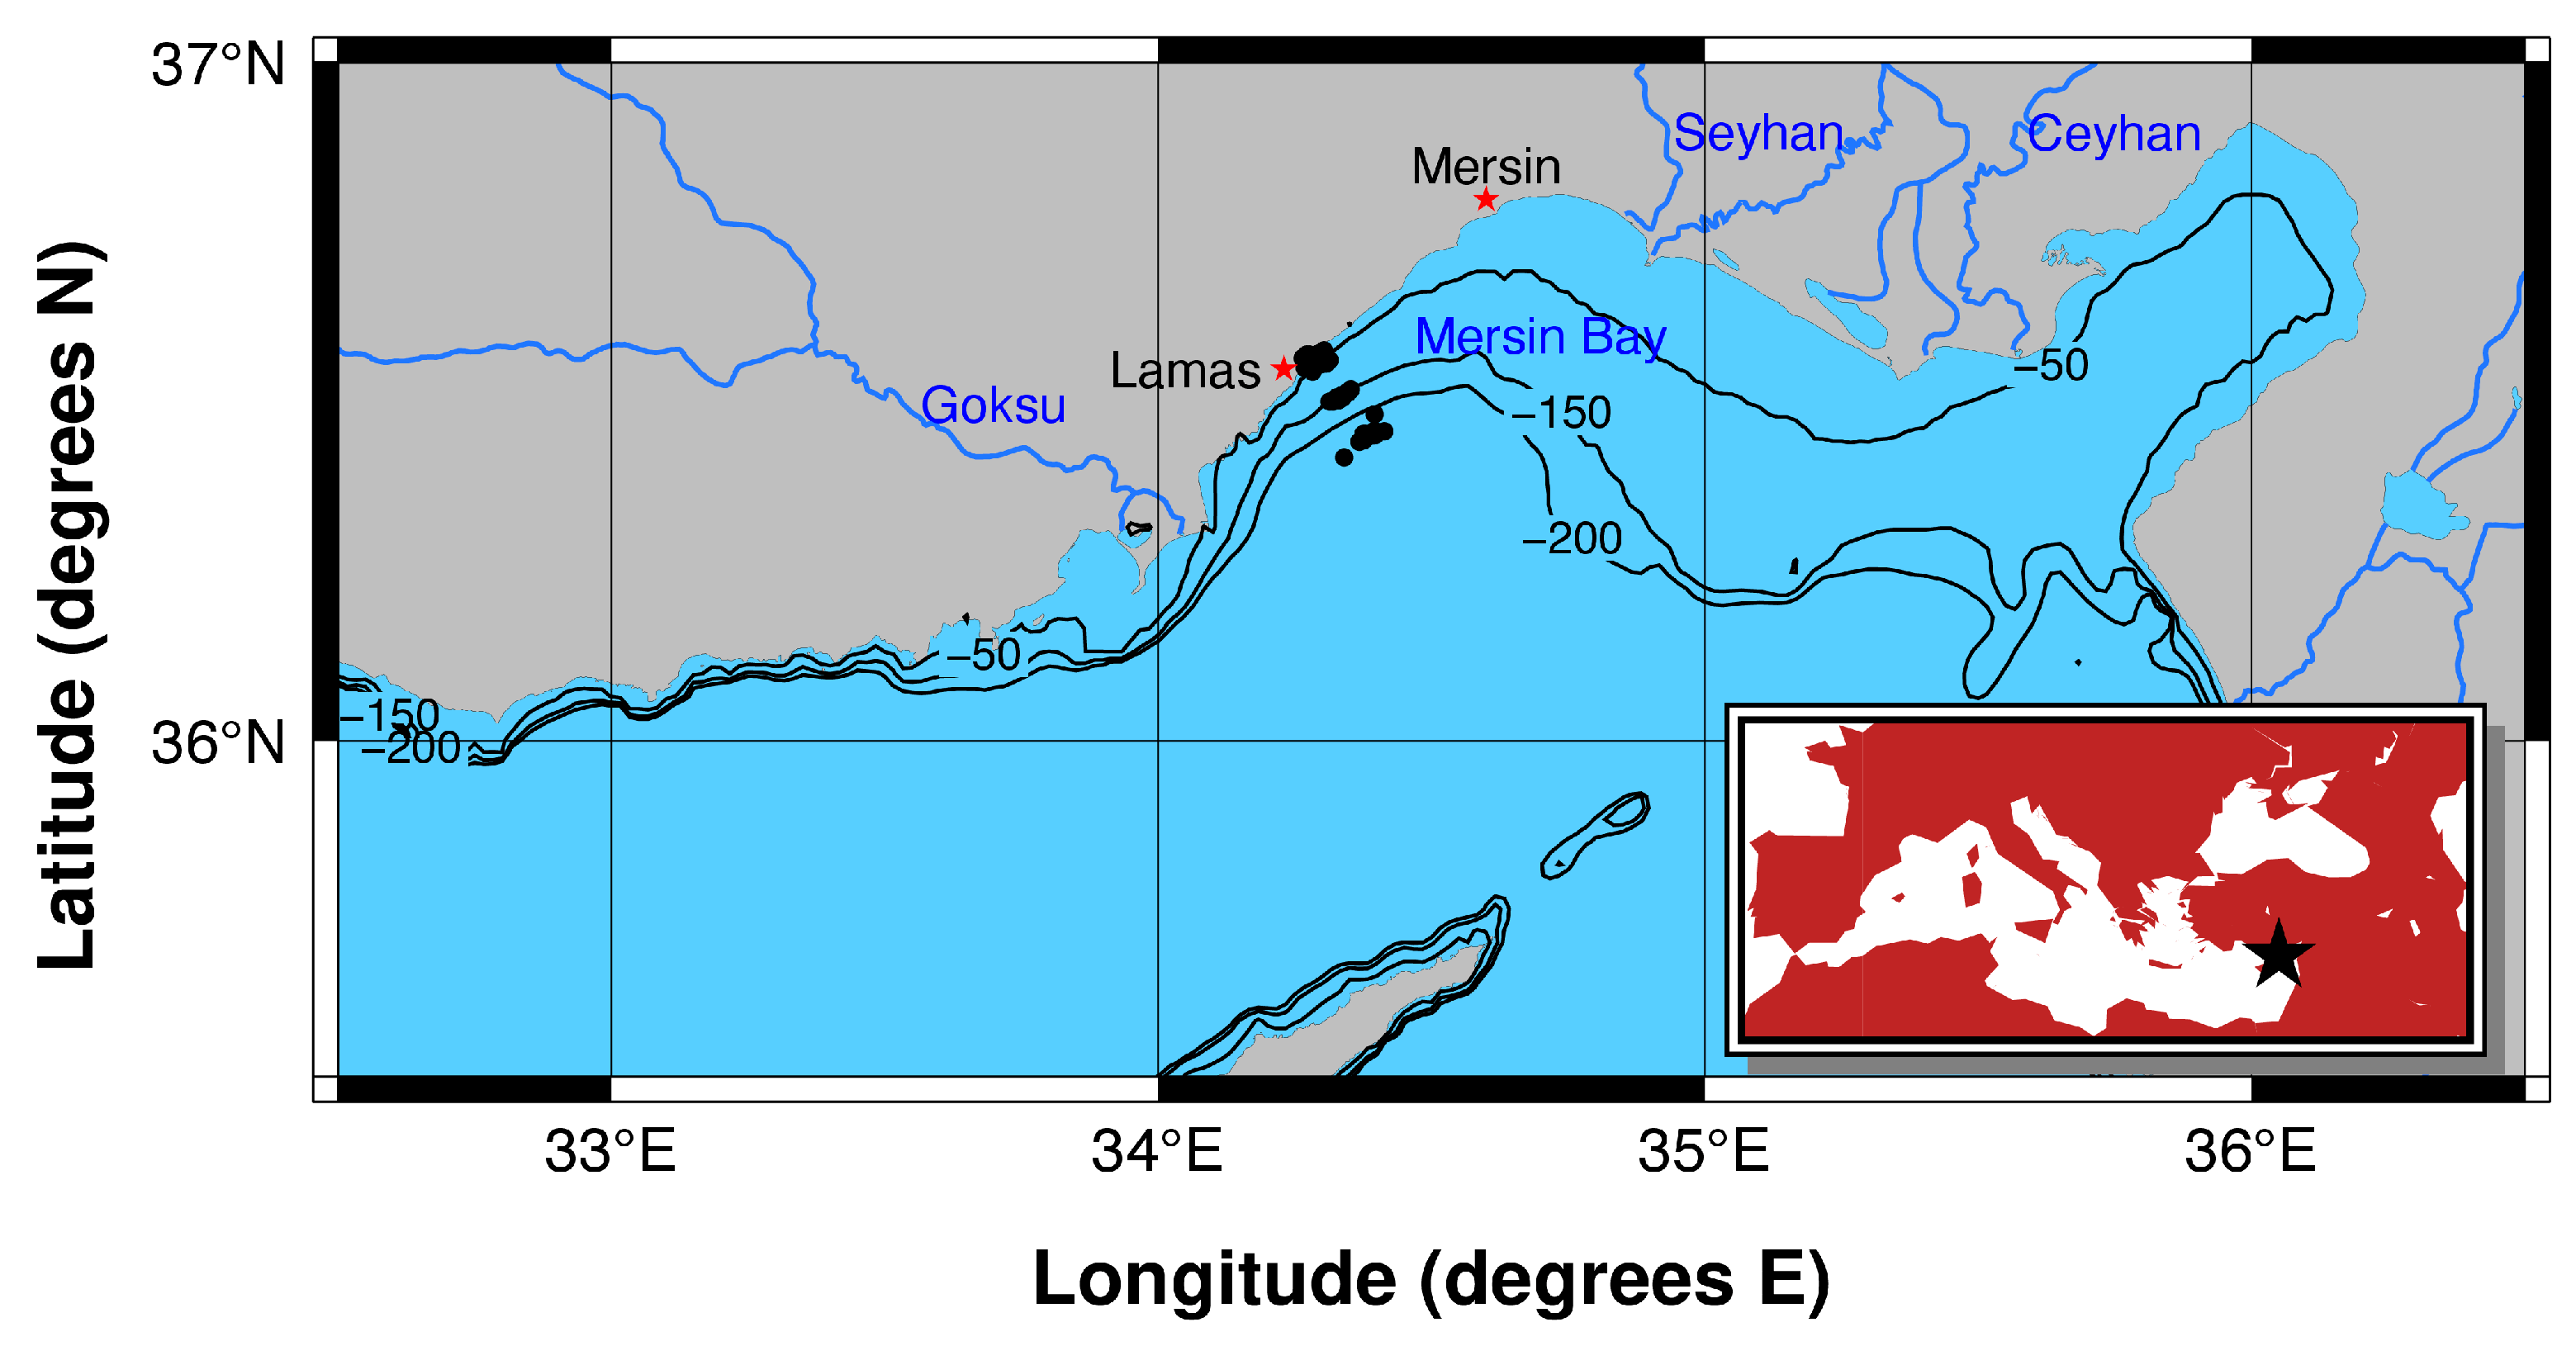
2.1. Study Area

The Lamas (Limonlu) marine region is located towards the west of Gulf of Mersin, an important coastal area where the wide continental shelf in the eastern part of the Cilician Basin starts to narrow towards the west to the Pamphylia and Lycia basins located in the vicinities of Anamur and Antalya (Figure 1). Therefore, the coastal area of the Lamas region is an amalgamation of the characteristics of narrow- and wide-shelf marine coastal regions and a habitat to a diverse range of fish assemblages that is typical to both coastal regions. The Lamas River also discharges in close proximity to the west of the study area, and therefore provides a productive marine environment due to the nutrients provided via its flow. These characteristics of the region make the coastal zone of the Lamas region a perfect area for investigating the impacts of alien species in a typical northeastern Mediterranean Sea marine coastal ecosystem.

2.2. Sampling

The study site covered 1.76 km2 of the coastal region in front of the town of Limonlu in the Lamas region of Erdemli, Mersin. Fish samples were collected monthly from 68 stations between January 2019 and January 2020 (Figure 1). Here, 18 mm trawl nets were used at depths extending from 16 m to 210 m, classified under four depth strata at 0–49 m (26 hauls), 50–99 m (15 hauls), 100–149 m (13 hauls) and 200–249 m (14 hauls). For each trawl haul, the sampling time was 15 min for the 0–49 m depth stratum, 30 min for 50–99 and 100–149 m depth strata, and 60 min for the 200–249 m depth stratum. The samples were collected with R/V Lamas of the Institute of Marine Sciences, Middle East Technical University.

2.3. Stomach Content Analysis

The stomach contents of N. randalli specimens were studied using individuals collected from trawl hauls to parameterise the diet composition of the species for the modelling study. First, the lengths of the specimens were measured to the nearest millimetre. The upper tail of the caudal fin of N. randalli is elongated, like a filament; therefore, fork lengths were measured as suggested in the literature [29]. Then, the specimens were gutted and the stomachs were extracted, weighed and stored in the freezer for later analysis. At least three stomach samples from each length group were sampled from a total of 16 length classes, ranging between 6 cm and 21 cm, to avoid bias for certain length classes. A total of 64 stomach samples were analysed: 22 from spring, 16 from summer, 11 from autumn and 15 from winter. Prior to identification, the wet weights of stomachs were measured by a precision scale (Precisa XB 220A) with a sensitivity of 0.01 mg. Afterwards, the stomach membranes were removed from the stomach contents. The stomach contents were rinsed with water to remove microscopic organisms and placed on blotter paper to remove excess water before weighing. For the identification of samples, a light microscope (Olympus SZX12) was used at a 20× magnification. Finally, each item in the stomach contents was weighed separately and relative diet compositions by weight for each identified stomach sample were calculated. Contents such as endoparasites, unidentified digested organic material and lophotrochozoans were grouped under the detritus group.

2.4. Modelling Approach

Ecopath with Ecosim (EwE) version 6.6.8 ([9], available at www.ecopath.org (accessed on 16 March 2023) was used to set up a food web model of the study area. The Lamas region Ecopath model used in this study is an updated version of the model by [30]. Ecopath is the mass-balance trophodynamic model of the EwE modelling suite and is based on two master equations that ensure mass and energy balance. The first master equation ensures mass balance as
P i M 2 i M 0 i E i Y i B A i = 0
where Pi is the total production of functional group or species i, M2i is the predation mortality rate of i, M0i is the other mortality rate of i due to diseases, starvation or old age, Ei is the net migration rate of i, Yi is the total fishery catch rate of i, and BAi is the biomass accumulation rate of i.
This equation can be re-expressed as
B i P B i j = 1 n B j Q B j D C j i 1 E E i B i P B i E i Y i B A i = 0
where Bi is the biomass of functional group or species i, (P/B)i is the production-to-biomass ratio of i, (Q/B)i is the consumption-to-biomass ratio of i, DCji is the fraction of prey, i, in the diet of predator j, and EEi is the ecotrophic efficiency of i, that is, the fraction of the production of i that is not exported and is used in the system. In addition to the specifications of the relative diet composition matrix (DC), Ecopath requires three of the four parameters, namely B, P/B, Q/B and EE, to be specified. Furthermore, catches for the exploited species/groups can be specified.
Ecopath ensures the energy balance of a functional group or species as
Q i = P i + R i + E i
where Qi, Pi, Ri and Ei are the consumption, production, respiration and egestion of group i, respectively.
Fourteen functional groups and six species, as well as a detritus compartment, were defined in the model (Table 1). The species/groups included in the model met three criteria: (i) having a direct prey–predator interaction with N. randalli, (ii) having an indirect relationship, i.e., trophic competition, with N. randalli, or (iii) being first-order prey or predators of groups/species that interacted directly or indirectly with N. randalli. Functional groups in the model were constituted based on similarity of their diets and predators.
The initial conditions, i.e., the biomasses of species and functional groups except phytoplankton, zooplankton, polychaetes and detritus, of the Ecopath model were calculated from trawl sampling conducted in the study, and the rest were obtained by capitalising on published literature in the region and, if necessary, data from adjacent areas (Table A1). Biomasses were calculated using the swept area method using data from the monthly trawl surveys. The swept area (a) was estimated by
a = D h X 2
where D is the distance covered during each trawl tow, h is the length of the head rope and X2 is the fraction of the head rope length that is equal to the width of the path swept by the trawl net. The distance covered was calculated as
D = 60 ( L a t 1 L a t 2 ) 2 + ( L o n 1 L o n 2 ) 2 cos 2 ( 0.5 L a t 1 + L a t 2 )
where Lat1 and Lon1 are the starting latitude and longitude, and Lat2 and Lon2 are the final latitude and longitude of the trawl operation, respectively.
The catch per unit of area (CPUA) of species in the haul was calculated as
C P U A = C W a
where Cw is the catch weight and a is the swept area by the trawl. Fishing gear cannot retain all the fish in the environment; therefore, assuming that there is a relationship between the CPUA and the true biomass of the fish, CPUA values should be converted to biomass values using a proportionality constant [31]. The CPUA values were converted to biomasses as
B = C P U A X 1
where X1 is the proportion of the fish in the path of the tow that was retained by the fishing gear. For practicality, we assumed that all fish in the path of the tow were retained [32].
The P/B is assumed to be equal to the total mortality (Z) under steady-state conditions [33]. Therefore, if no literature data were available from the study area, we calculated P/B ratios for teleost fishes as
ln Z = 1.46 1.01 ln ( A m a x )
where Amax is the maximum age for the species [34]. The P/B ratios of fish functional groups were calculated by averaging the calculated P/B ratios of each species in the functional group by its corresponding biomass in the group. Mortalities of other fish groups were obtained from the literature (Table A1). P/B ratios of other benthic invertebrates, polychaetes, crabs, shrimps and prawns, and octopuses, cuttlefish and squids groups were obtained from previous studies.
The Q/B ratios for fish groups and species were calculated empirically as
log ( Q B ) = 7.964 0.204 log W 1.965 T + 0.083 A + 0.532 h + 0.398 d
where W is the asymptotic weight of the fish, A is the aspect ratio of the caudal fin, T’ is the mean ambient water temperature of the fish’s habitat expressed in 1000/degrees Kelvin, and h and d are the diet parameters depending on the feeding type. If the fish is a carnivore, then h and d are equal to 0; if the fish is a herbivore, the values of h and d are equal to 1 and 0, respectively; and, if the fish is a detritivore, the values of h and d are equal to 0 and 1, respectively [35]. The Q/B ratios of functional groups other than fish were taken from previous modelling and empirical studies in the Mediterranean Sea (Table A1). Aspect ratios of all fish groups except N. randalli were obtained from the literature [36]. The aspect ratio of N. randalli was calculated by capitalizing on the measurements on the sampled specimens as
A = h 2 s
where h and s are the height and surface area of the caudal fin, respectively. Fifty tail samples from individuals that ranged between 4 and 21 cm fork lengths were processed. The tails were photographed with a microscope camera (Olympus DP26). The heights and surface areas of the caudal fins were measured using ImageJ image processing software (https://imagej.nih.gov/ij/, accessed on 7 September 2020).
The relative diet composition of N. randalli was calculated within the scope of this study and complemented by available literature in the region, and diet information for other groups and species was obtained from the literature (Table A1). The relative diet composition matrix for the Ecopath model is given in Table A2. All the data sources used to parameterise the Lamas region Ecopath model are listed in Table A1.
Statistical catch data were obtained from the official national landing statistics [37], except Clupeidae, which was obtained from the Sea Around Us project [38]. The statistical data covered all of the Mediterranean coast of Turkey, and did not differentiate geographical regions. Therefore, the annual statistical landings were divided by the total area of the Turkish Exclusive Economic Zone (EEZ) to obtain annual catch rates in tonnes per square kilometre per year. A total area of 72,195 km2 was used to represent the EEZ of Türkiye in the Mediterranean Sea where fisheries operated [38]. Turkish landing statistics did not have records for N. randalli; therefore, its catch was assumed nil for the Ecopath model.
We balanced the Ecopath model ensuring that: (i) EE values were less than unity, (ii) P/Q values were between 0.1 and 0.5 [39], (iii) production-to-respiration and respiration-to-assimilation ratios were less than unity, and (iv) the respiration-to-biomass ratios ranged between 1 and 10 for fish groups and higher for lower-trophic groups, in line with ecological and thermodynamic principles [40]. The pedigree index that classifies the model input data based on their sources was also calculated. The pedigree index scales between zero and one, and assigns high values to data from local sampling-based studies with high precision and low values to empirically estimated parameters and statistically collected data. A pedigree index close to one indicates higher input-data quality. Furthermore, we used pre-balance (PREBAL) diagnostics to assess the data quality of the input data in the Ecopath model [41]. PREBAL expects a linear positive slope for B, P/B, Q/B and P/Q from higher-trophic-level groups/species to lower-trophic-level groups/species.
The model results were evaluated using the ecosystem’s statistical properties, calculated by capitalising on flows in the food web. Total system throughput (TST), which is the sum of all flows related to consumption, respiration, exports and detrital flows in the ecosystem, shows the size of the ecosystem and is akin to gross domestic product (GDP) in economic terms [42]. Furthermore, relative ascendancy and overhead (resilience) of the ecosystem were calculated. Ascendancy is a measure of the ecosystem’s organisation and overhead is the strength of the ecosystem to resist stress [43]. Ascendancy is the power of an ecosystem to recover from perturbed conditions and resilience is the strength of its immune system; therefore, a balanced degree of ascendancy and resilience is required in an healthy ecosystem [44]. Furthermore, the ratios of total primary production to total respiration (Pp/R), total primary production to total biomass (Pp/B), total biomass to TST (B/T), and net system production, which is the difference between total primary production and system respiration, were calculated. In mature ecosystems, Pp/R is expected to approach unity, Pp/B is expected to be low, B/T, i.e., the amount of biomass supported per unit of energy, is expected to be high and net system production is expected to be close to zero [45].
Synthetic ecological indicators were also calculated using flows in the food web. Finn’s cycling index (FCI) and Finn’s mean path length (PL) were calculated. FCI shows the relative amount of flows being cycled in the food web, and PL is the average number of groups that a unit of flow (inflow or outflow) passes through, and both are expected to be high in mature ecosystems [46]. Furthermore, the predatory cycling index (PCI), which is the proportion of TST cycled excluding the detritus compartment, was also calculated. The mean trophic level of the catch (mTLc) and relative amount of primary production required to sustain fisheries’ catches (PPRc) were calculated to delineate the fisheries’ impact on the ecosystem [47]. When an ecosystem is first fished, the mTLc is high and the PPRc is low and, as fishing intensifies, the mTLc is expected to decrease, creating a fishing down the food web effect [48], and the PPRc is expected to increase [49]. The system omnivory index (SOI) was also calculated to quantify the breadth of feeding interactions in the food web. The SOI is high when the ecosystem includes species/groups with a high variety of prey items in their diets, and low when the ecosystem is comprised of specialised consumers.
Transfer efficiencies between trophic levels in the food web were analysed using Lindeman spines, which show mean transfer efficiencies of energy flows between trophic levels by grouping flows and biomasses by integer trophic levels [50]. Mixed trophic impact (MTI) analysis was used to delineate the interactions between groups/species in the system. MTI analysis shows the direct and indirect trophic impacts between functional groups [51] and can be considered a prognostic analysis showing what would happen to other groups/species if a given group’s/species’ biomass in the system increases or decreases. A direct impact between groups/species occurs due to prey–predator interactions, e.g., the prey has a positive impact on its predator and the predator has a negative impact on its prey. An indirect impact occurs due to competition for the same resources or when a group/species has a direct impact on a prey or a predator of the other group, and this indirect impact outcompetes, if any, the direct impacts between the two groups. The value of MTI scales between −1, a strong negative impact, and 1, a strong positive impact. Furthermore, the keystoneness index (KS) was calculated to define keystone groups that have relatively low biomasses but structuring roles in the food web [52].

3. Results

3.1. Stomach Content Analysis
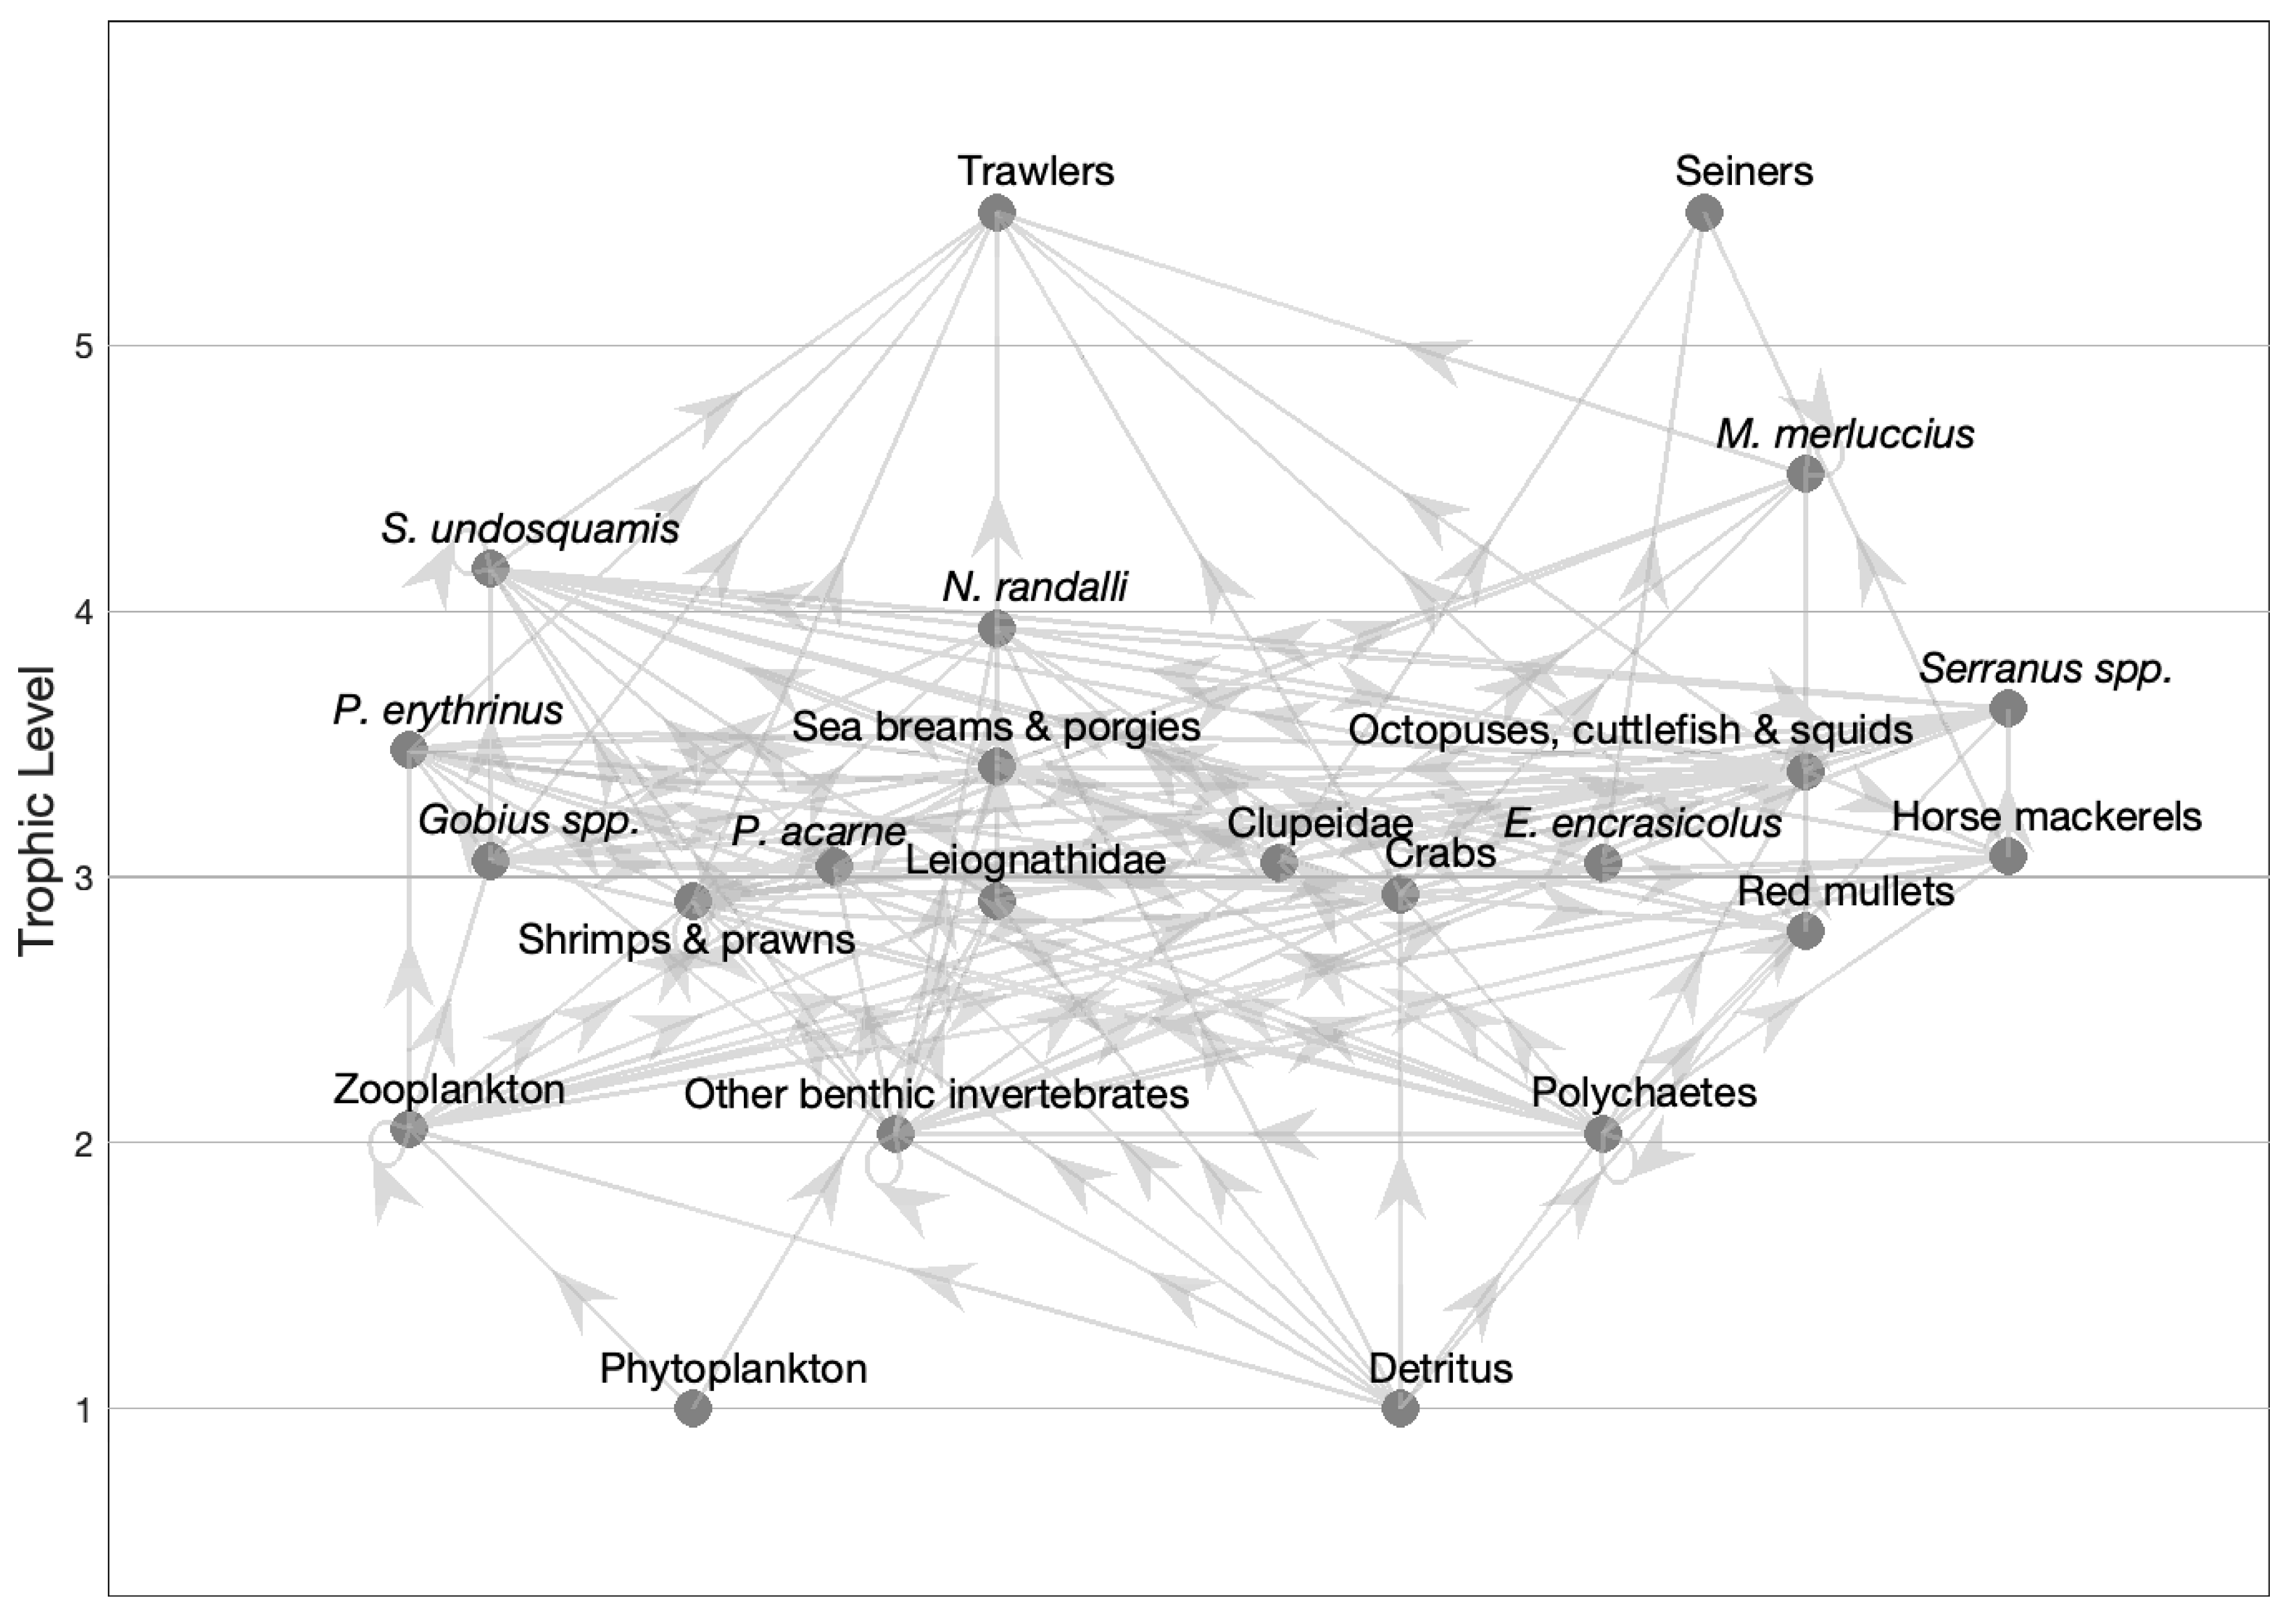
A total of thirteen stomachs were empty: seven in winter, three in spring, one in summer and two in autumn. The shortest specimen with an empty stomach was 11 cm, and the longest specimen with an empty stomach was 21 cm. Benthic crustaceans constituted the main prey of N. randalli and was dominated by shrimps, prawns and crabs. Considering fish species, the diet of N. randalli included species from the Clupeidae, Serranidae, Leiognathidae and Sparidae families (Table 2). The stomach contents of N. randalli intriguingly included S. undosquamis.

3.2. The Model

The Ecopath model of the Lamas region included 21 functional groups from phytoplankton with the lowest trophic level, to M. merluccius and Lessepsian S. undosquamis with the two highest trophic levels (Table 3). The majority of living biomass in the system was in TLs I, II and III (34.68%, 51.9% and 12.43%, respectively). The flow diagram of the Lamas region Ecopath model is given in Figure 2.

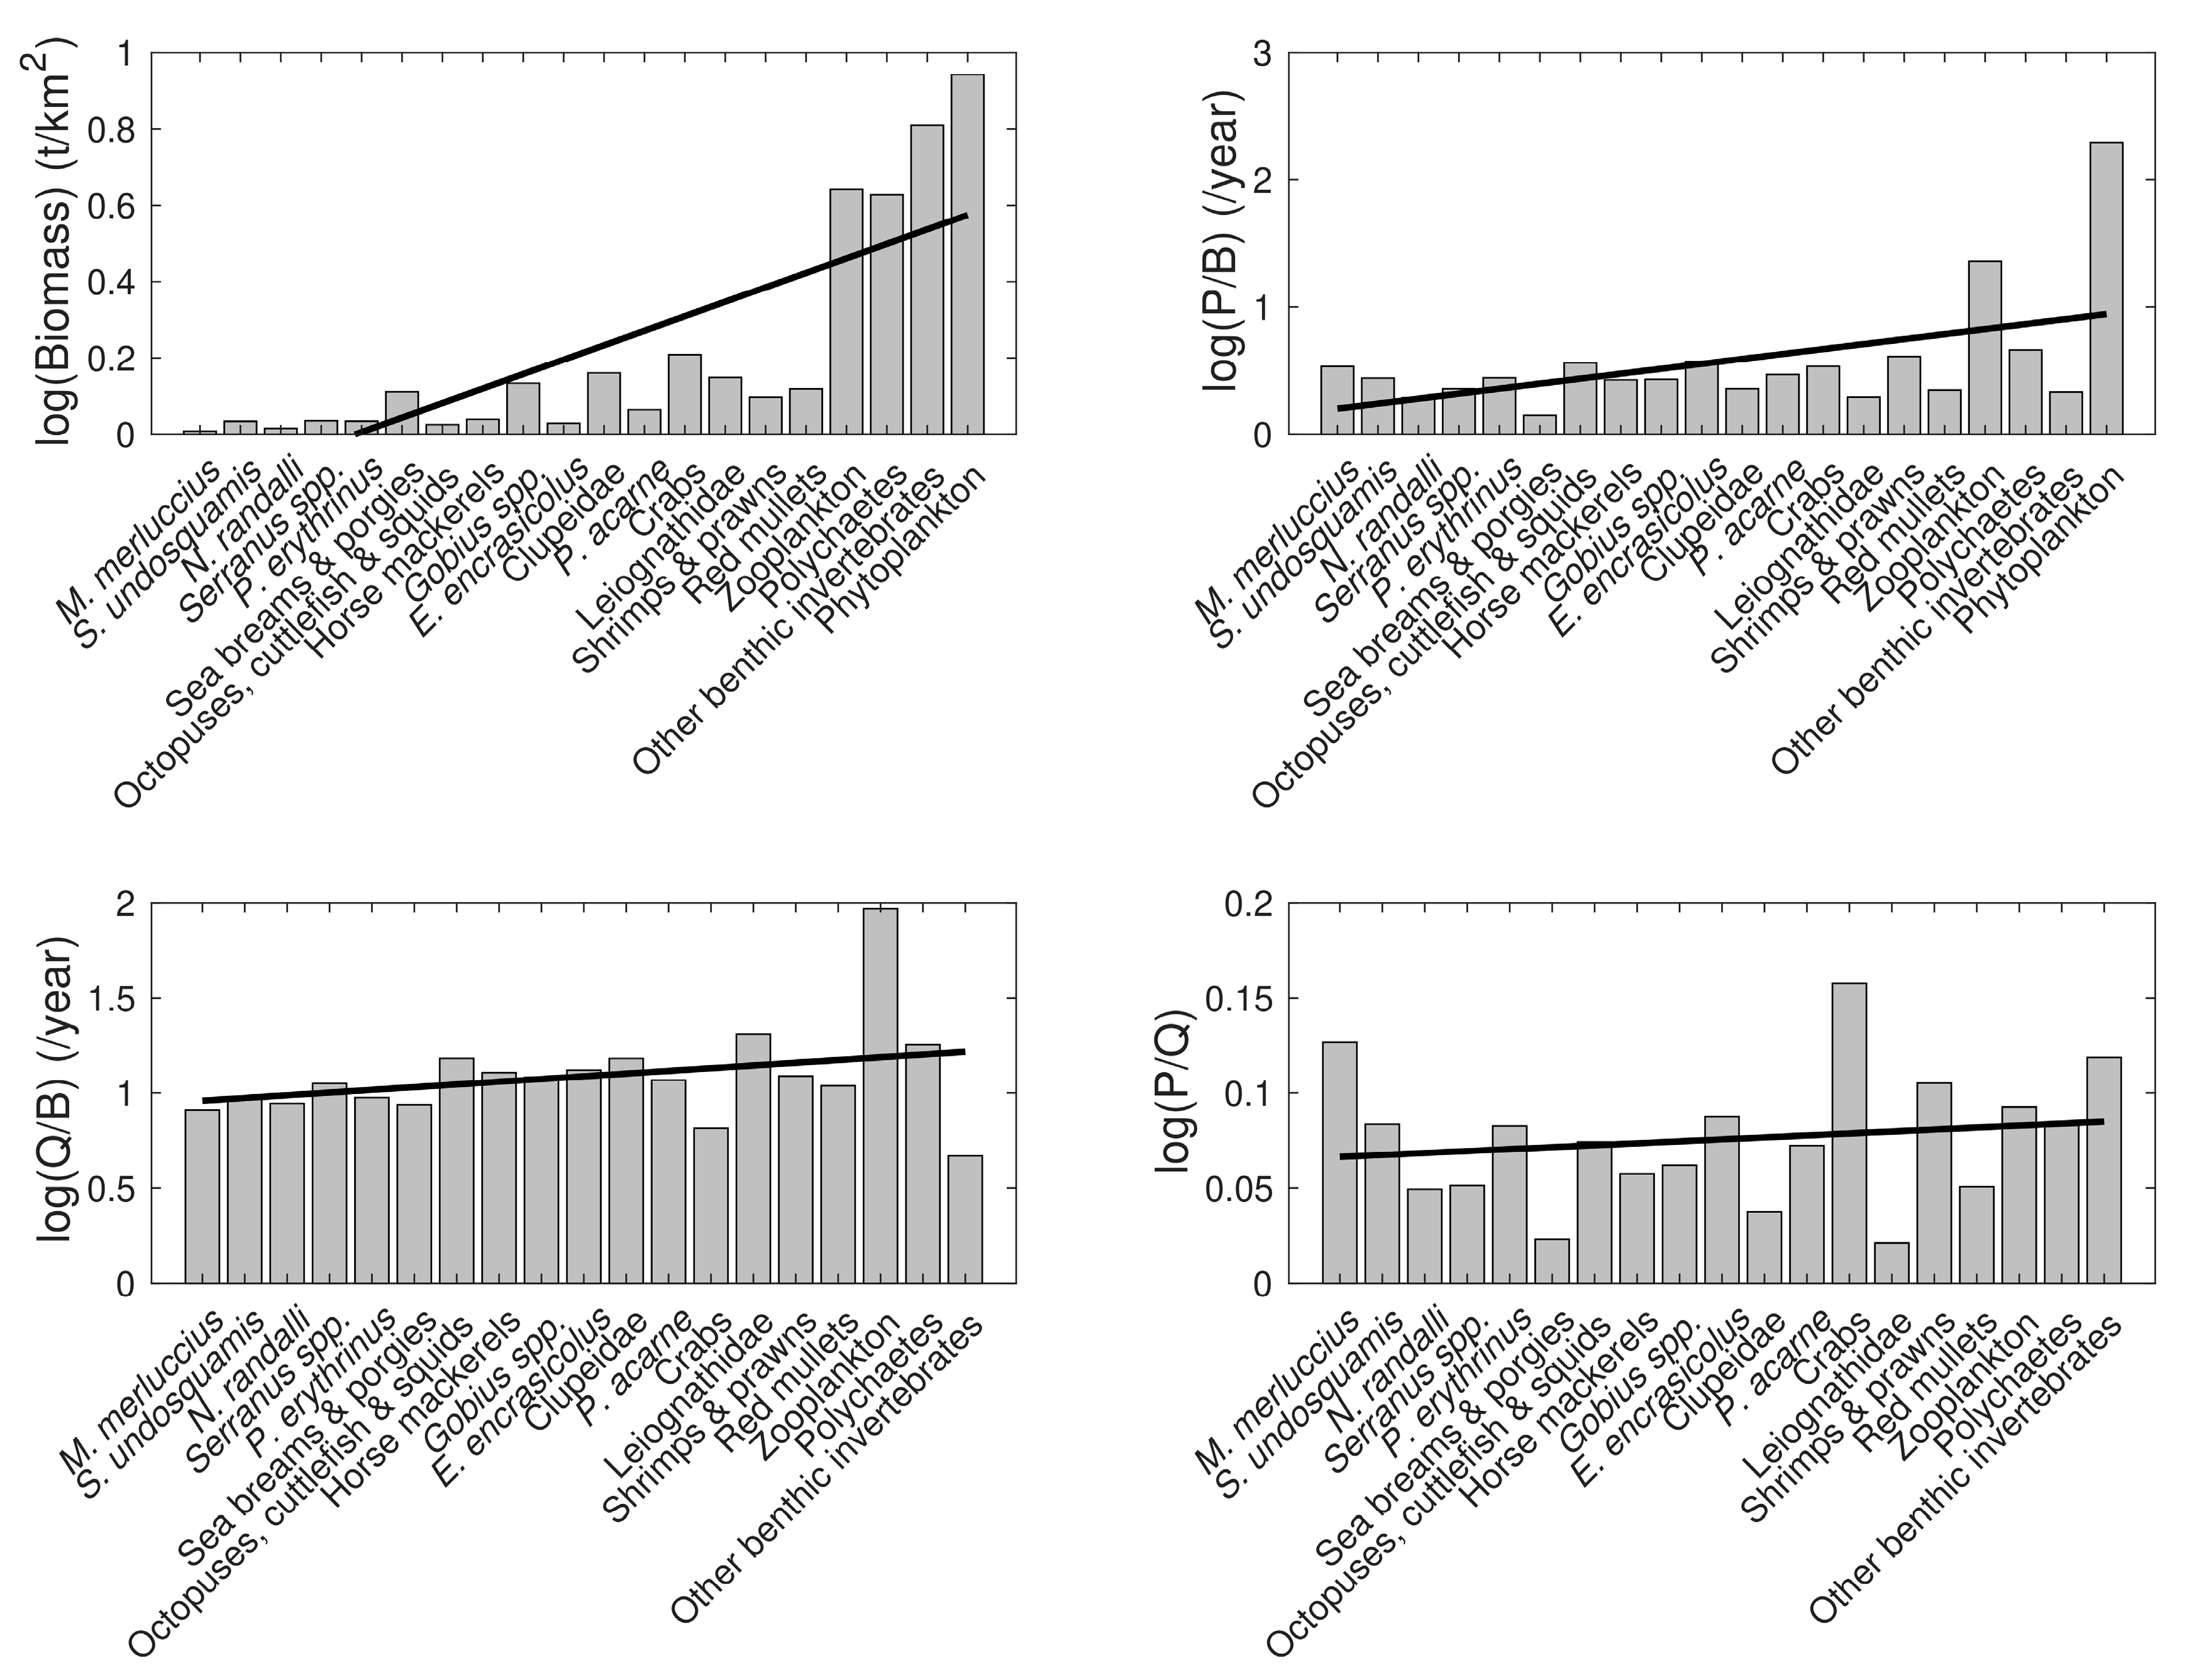
3.3. Model Data Quality

The pedigree index of the Lamas region Ecopath model was 0.63, indicating a high level of input data quality.
The PREBAL analysis showed that the model input parameters conformed to a linear increasing trend from high to low trophic levels (Figure 3). The biomass values of sea breams and porgies, the octopuses, cuttlefish and squids group, E. encrasicolus, P. acarne, crabs, Leiognathidae, the shrimps and prawns group, and red mullets could be underestimated, whereas the biomass values of zooplankton, polychaetes, other benthic invertebrates and phytoplankton could be overestimated. The P/B values of sea breams and porgies, Clupeidae, Leiognathidae, red mullets, polychaetes and other benthic invertebrates could be underestimated, whereas the P/B values of M. merluccius, zooplankton and phytoplankton could be overestimated. The Q/B values of crabs and other benthic invertebrates could be underestimated, whereas the Q/B value of zooplankton could be overestimated. Finally, the P/Q values of N. randalli, Serranus spp., sea breams and porgies, Clupeidae, Leiognathidae and red mullets could be underestimated, whereas the P/Q values of M. merluccius, crabs and other benthic invertebrates could be overestimated.

3.4. Model Summary Statistics

The summary statistics of the Ecopath model are given in Table 4. The TST consisted of 12.6%, 37.8%, 7.2% and 42.4% of consumption, export, respiratory flows and flows into detritus compartments, respectively. The system’s net primary production, net system production, and Pp/R and Pp/B ratios were high and the B/T ratio was low.
Considering the impact of fisheries on the ecosystem, the mTLc and mean trophic level of community (TL ≥ 3.25) were less than four, and the PPRc and the total fisheries catch were low.
Regarding the food web dynamics, the SOI was low, the connectance index was at moderate levels and the Shannon’s diversity index was low. The transfer efficiency of energy from primary producers was lower than the transfer efficiency from detritus, and, overall, the transfer efficiency of energy along the food web was close to the theoretical ecological value of 10%. The PCI and FCI were at moderate levels, and the PL was low.
The capacity of the Lamas region marine ecosystem consisted of a balanced degree of system ascendancy and overhead.

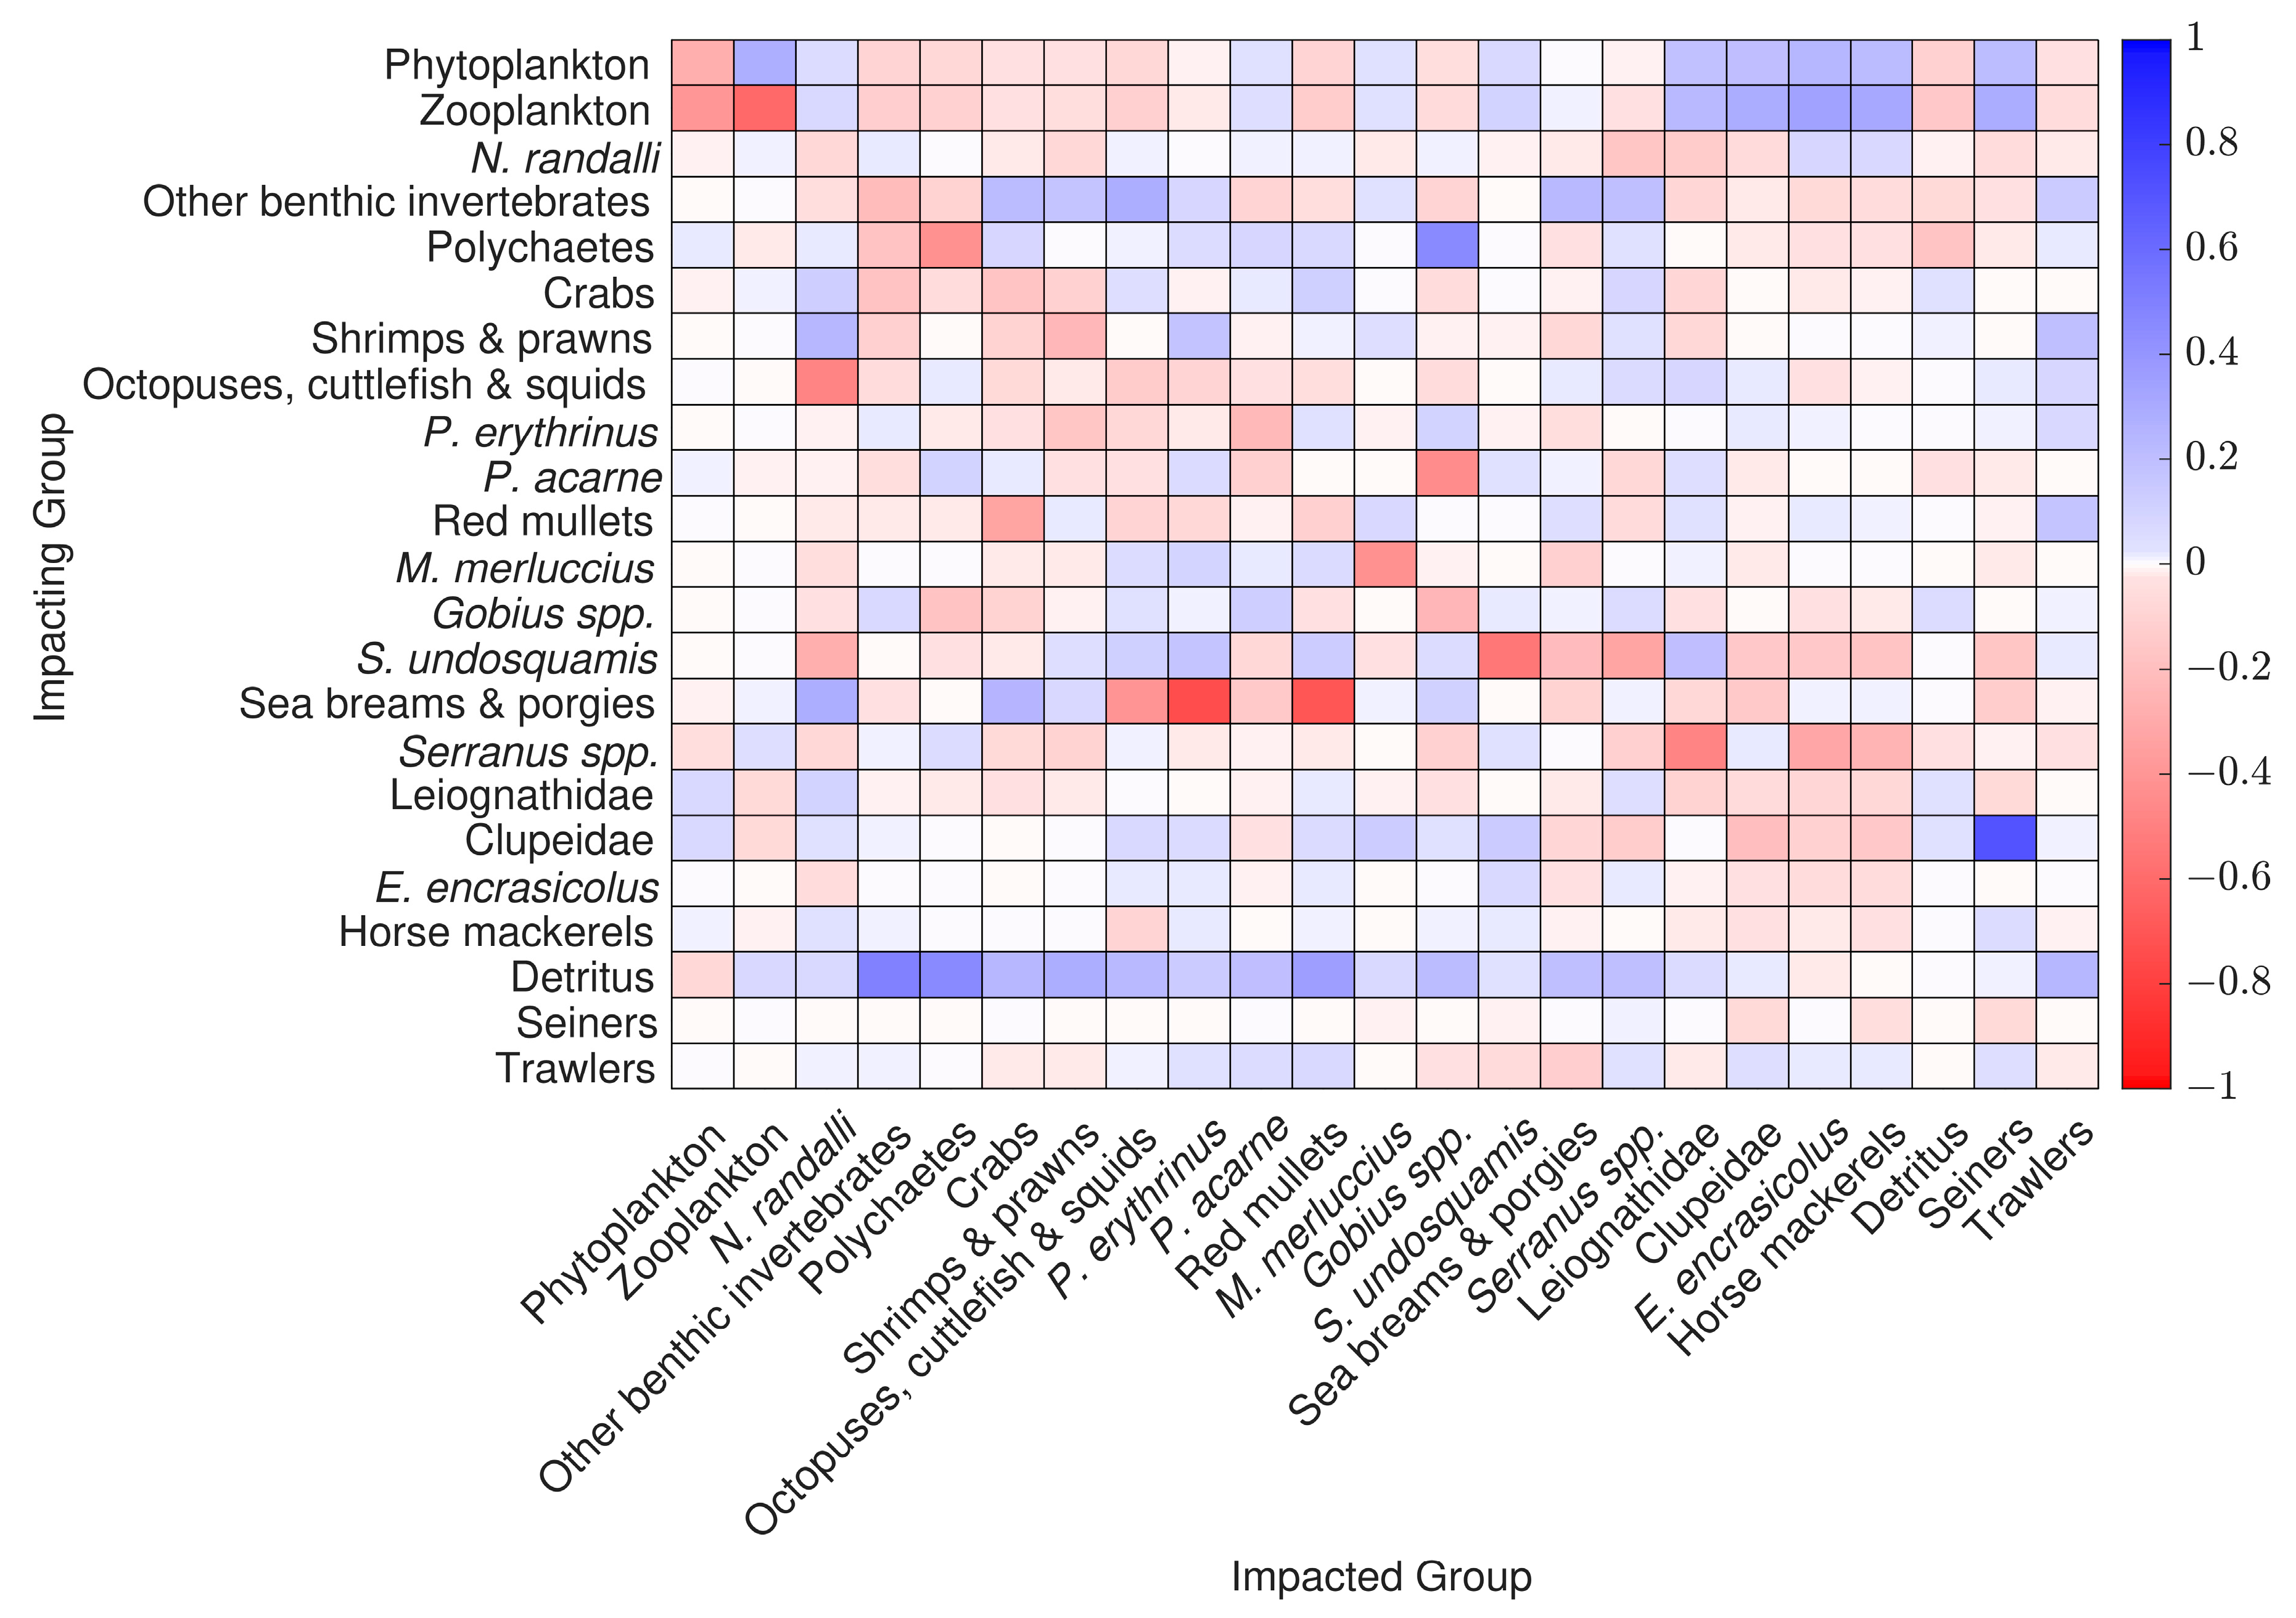
3.5. Mixed Trophic Impact Analysis

The MTI analysis was performed to show interactions between groups in the food web (Figure 4). N. randalli had direct negative impacts on crabs, shrimps and prawns, Serranus spp., sea breams and porgies, and Leiognathidae and Clupeidae groups due to being their predator. It had indirect negative impacts on the indigenous M. merluccius due to competition. Although N. randalli is a prey to Lessepsian S. undosquamis, it had a negative impact on this species because N. randalli’s direct positive impact on S. undosquamis due to being its prey was outcompeted by its indirect negative impact due to competition for similar prey items. N. randalli had indirect positive impacts on indigenous P. erythrinus, P. acarne and red mullets due to negatively impacting important predators of these species, i.e., S. undosquamis and M. merluccius, because of competition. N. randalli had indirect positive impact on the octopuses, cuttlefish and squids group due to its indirect negative impact on predators of this group, i.e., sea breams and porgies, and S. undosquamis. N. randalli had indirect positive impacts on E. encrasicolus and horse mackerels due to its negative impacts on the predators of these groups, i.e., S. undosquamis and Serranus spp. Although N. randalli is a predator of Gobius spp., it had an indirect positive impact on this group due to its negative impacts on Gobius spp.’s predators, i.e., sea breams and porgies, S. undosquamis and Serranus spp. Finally, N. randalli’s direct negative impacts due to predation on other benthic invertebrates and polychaetes were outcompeted by its indirect positive impacts, i.e., the negative impacts of N. randalli on their main predators, namely, sea breams and porgies, Serranus spp., Leiognathidae and Clupeidae.
Lessepsian S. undosquamis is a predator of N. randalli, and therefore had a direct negative impact. S. undosquamis had strong direct negative impacts on indigenous fish species, i.e., P. acarne, sea breams and porgies, Serranus spp., E. encrasicolus and horse mackerels due to predation. S. undosquamis had an indirect negative impact on indigenous M. merluccius due to competition. S. undosquamis had positive impacts on Gobius spp., red mullets, octopuses, cuttlefish and squids, and shrimps and prawns, because its direct negative impacts, i.e., predation on these groups, were outcompeted by its indirect positive impacts due to negatively impacting competitors and/or other predators of these groups. S. undosquamis had an indirect positive impact on P. erythrinus because of its direct negative impact on one of the predators of this group, i.e., sea breams and porgies, due to being their predator.
The indigenous sea breams and porgies group had direct negative impacts on P. erythrinus, P. acarne, octopuses, cuttlefish and squids, and red mullets due to predation. The sea breams and porgies group had an indirect negative impact on Lessepsian S. undosquamis, due to competition, and an indirect positive impact on Serranus spp., due to their negative impact on S. undosquamis, which is a predator of Serranus spp. Furthermore, the sea breams and porgies group had a direct positive impact on M. merluccius as prey. The sea breams and porgies group had indirect positive impacts on E. encrasicolus and horse mackerels due to negatively impacting their main predator, i.e., S. undosquamis.
Trawlers had direct negative impacts on crabs, shrimps and prawns, Gobius spp., S. undosquamis, sea breams and porgies, and M. merluccius due to exploitation, and an indirect negative impact on Leiognathidae due to exploiting their main predator, S. undosquamis. Trawlers had indirect positive impacts on P. erythrinus, P. acarne, red mullets, octopuses, cuttlefish and squids, and Serranus spp. because their direct negative impacts due to exploiting these species/groups were outcompeted by their indirect positive impacts, i.e., exploiting their predators, namely M. merluccius and S. undosquamis. Furthermore, trawlers had indirect positive impacts on Clupeidae, E. encrasicolus and horse mackerels due to exploiting their predators, i.e., S. undosquamis and M. merluccius. Seiners had direct negative impacts on Clupeidae and horse mackerels due to fisheries exploitation and indirect negative impacts on S. undosquamis and M. merluccius because of exploiting the main prey of these groups, i.e., Clupeidae, E. encrasicolus and horse mackerels. Although seiners directly exploited E. encrasicolus, they had an indirect positive impact because the indirect negative impact of seiners on E. encrasicolus’s predator, S. undosquamis, outcompeted their direct negative impact.

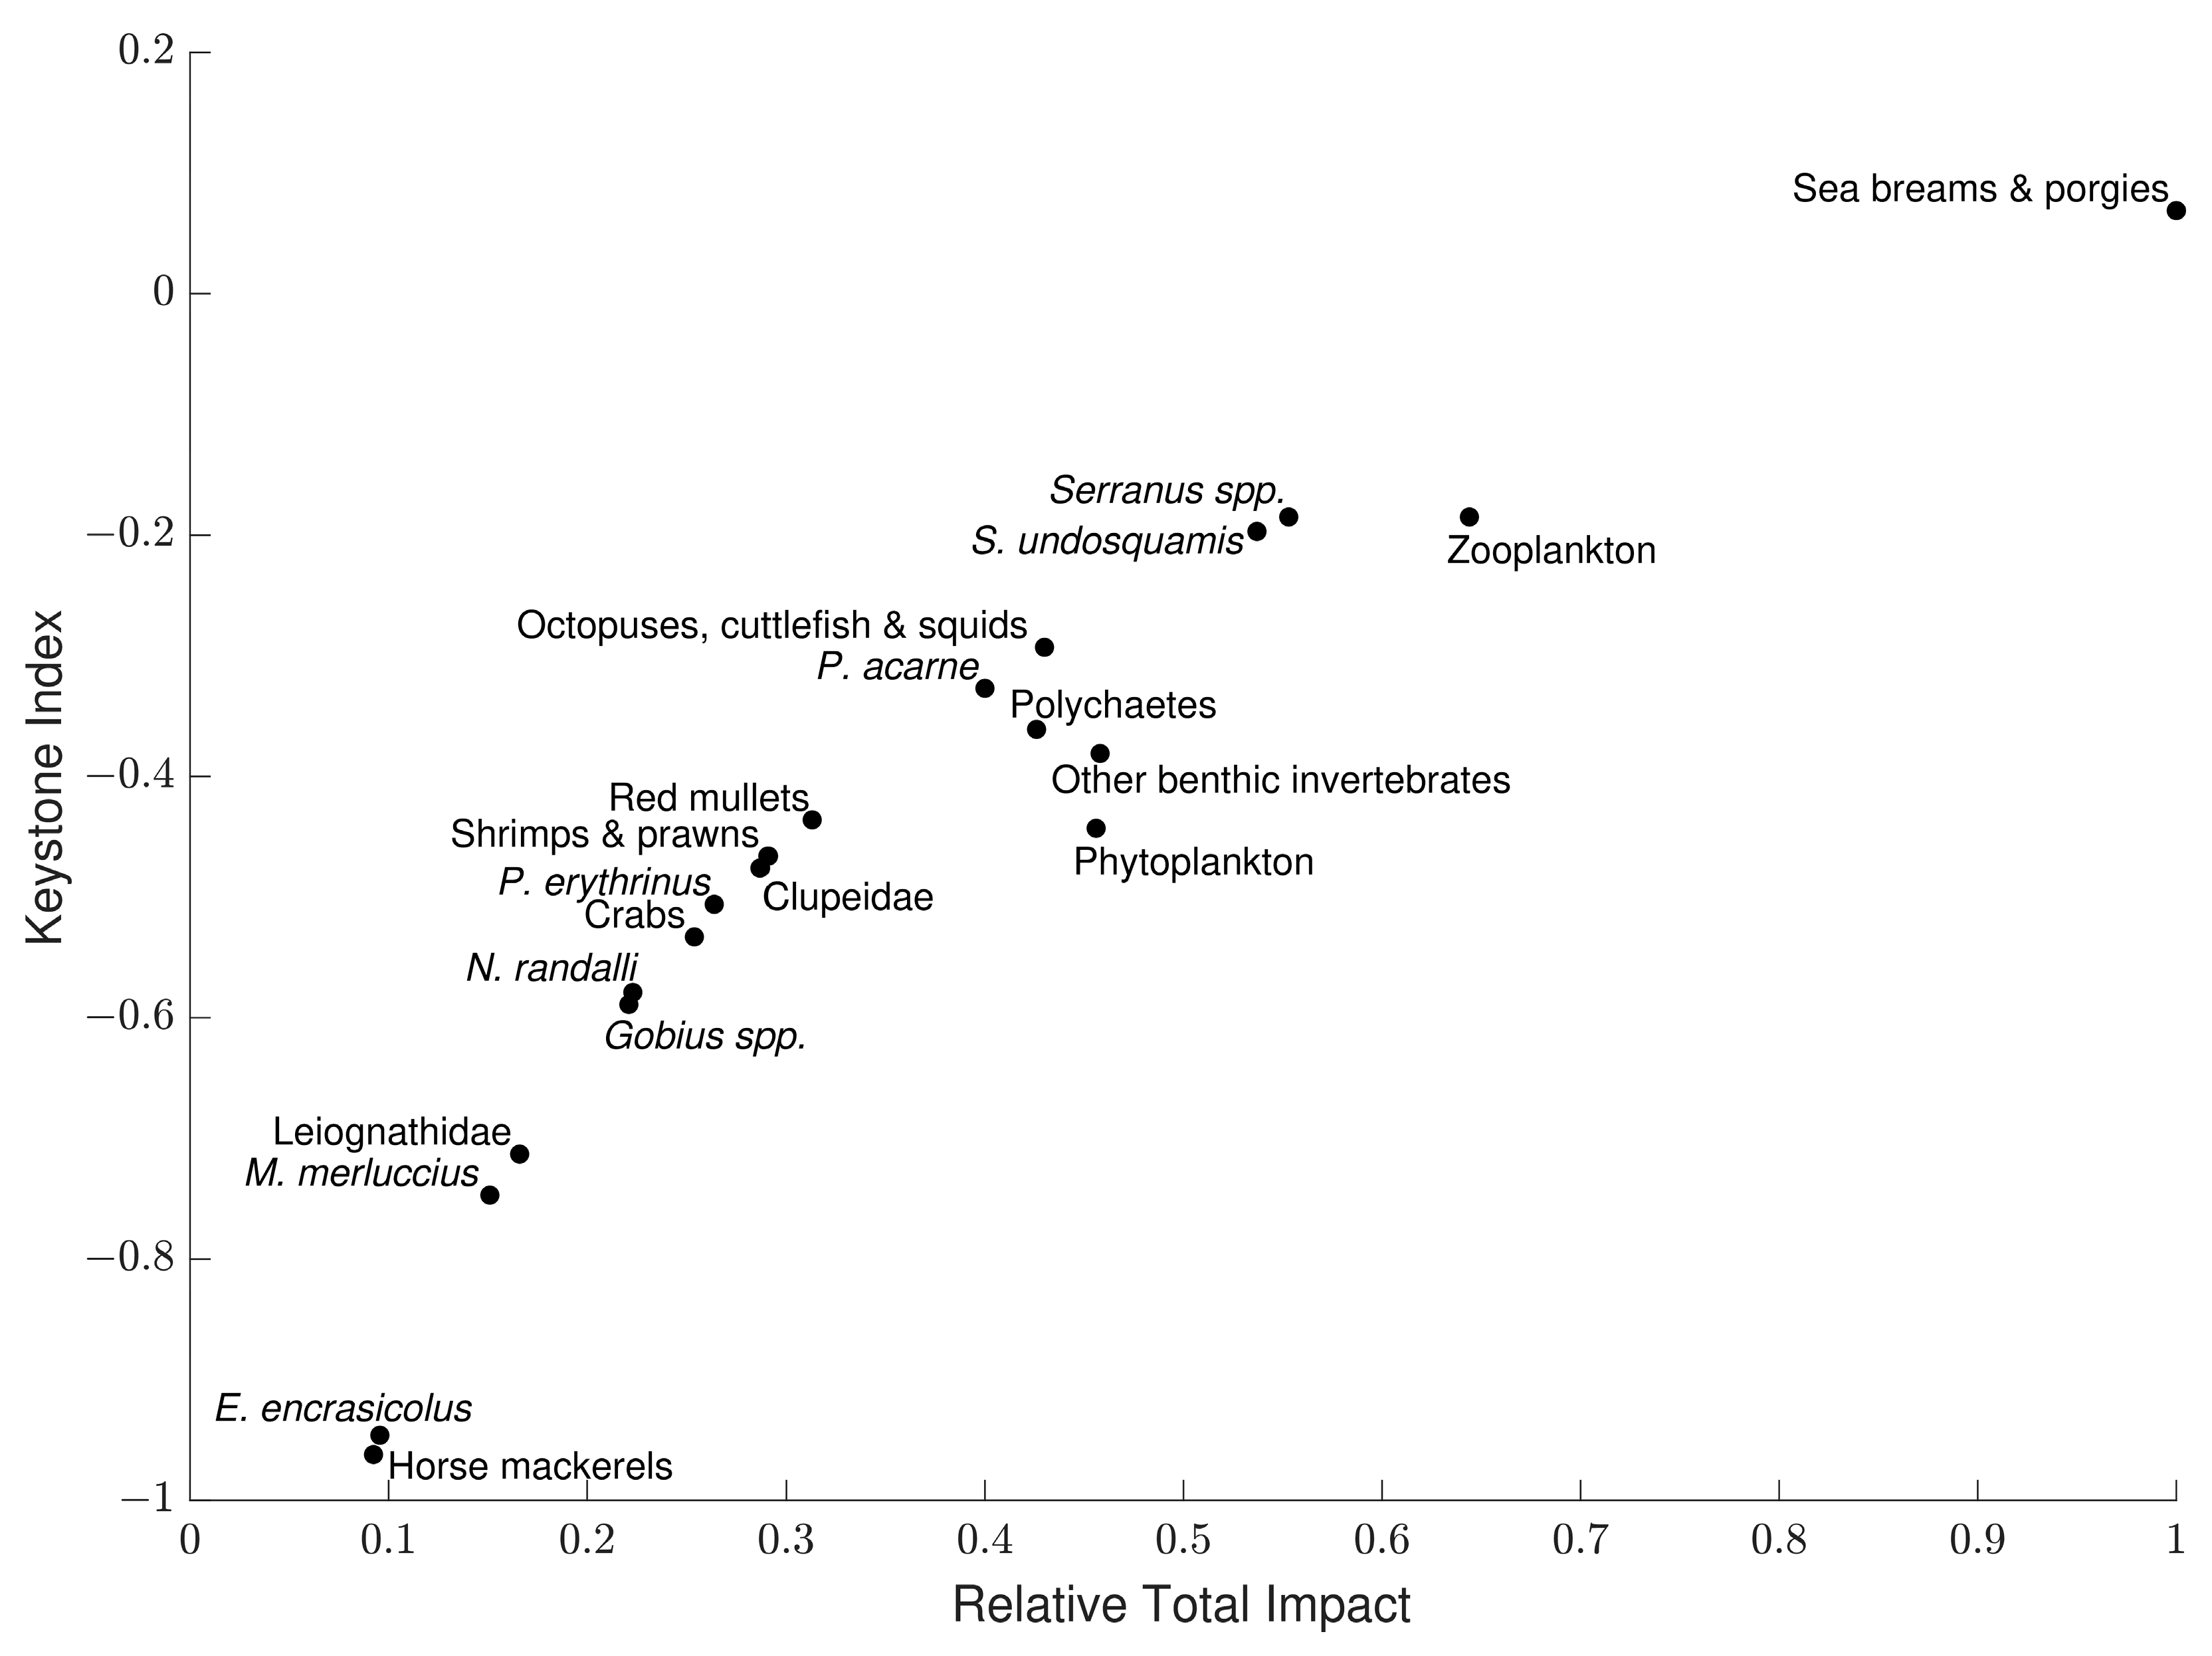
3.6. Keystoneness Analysis
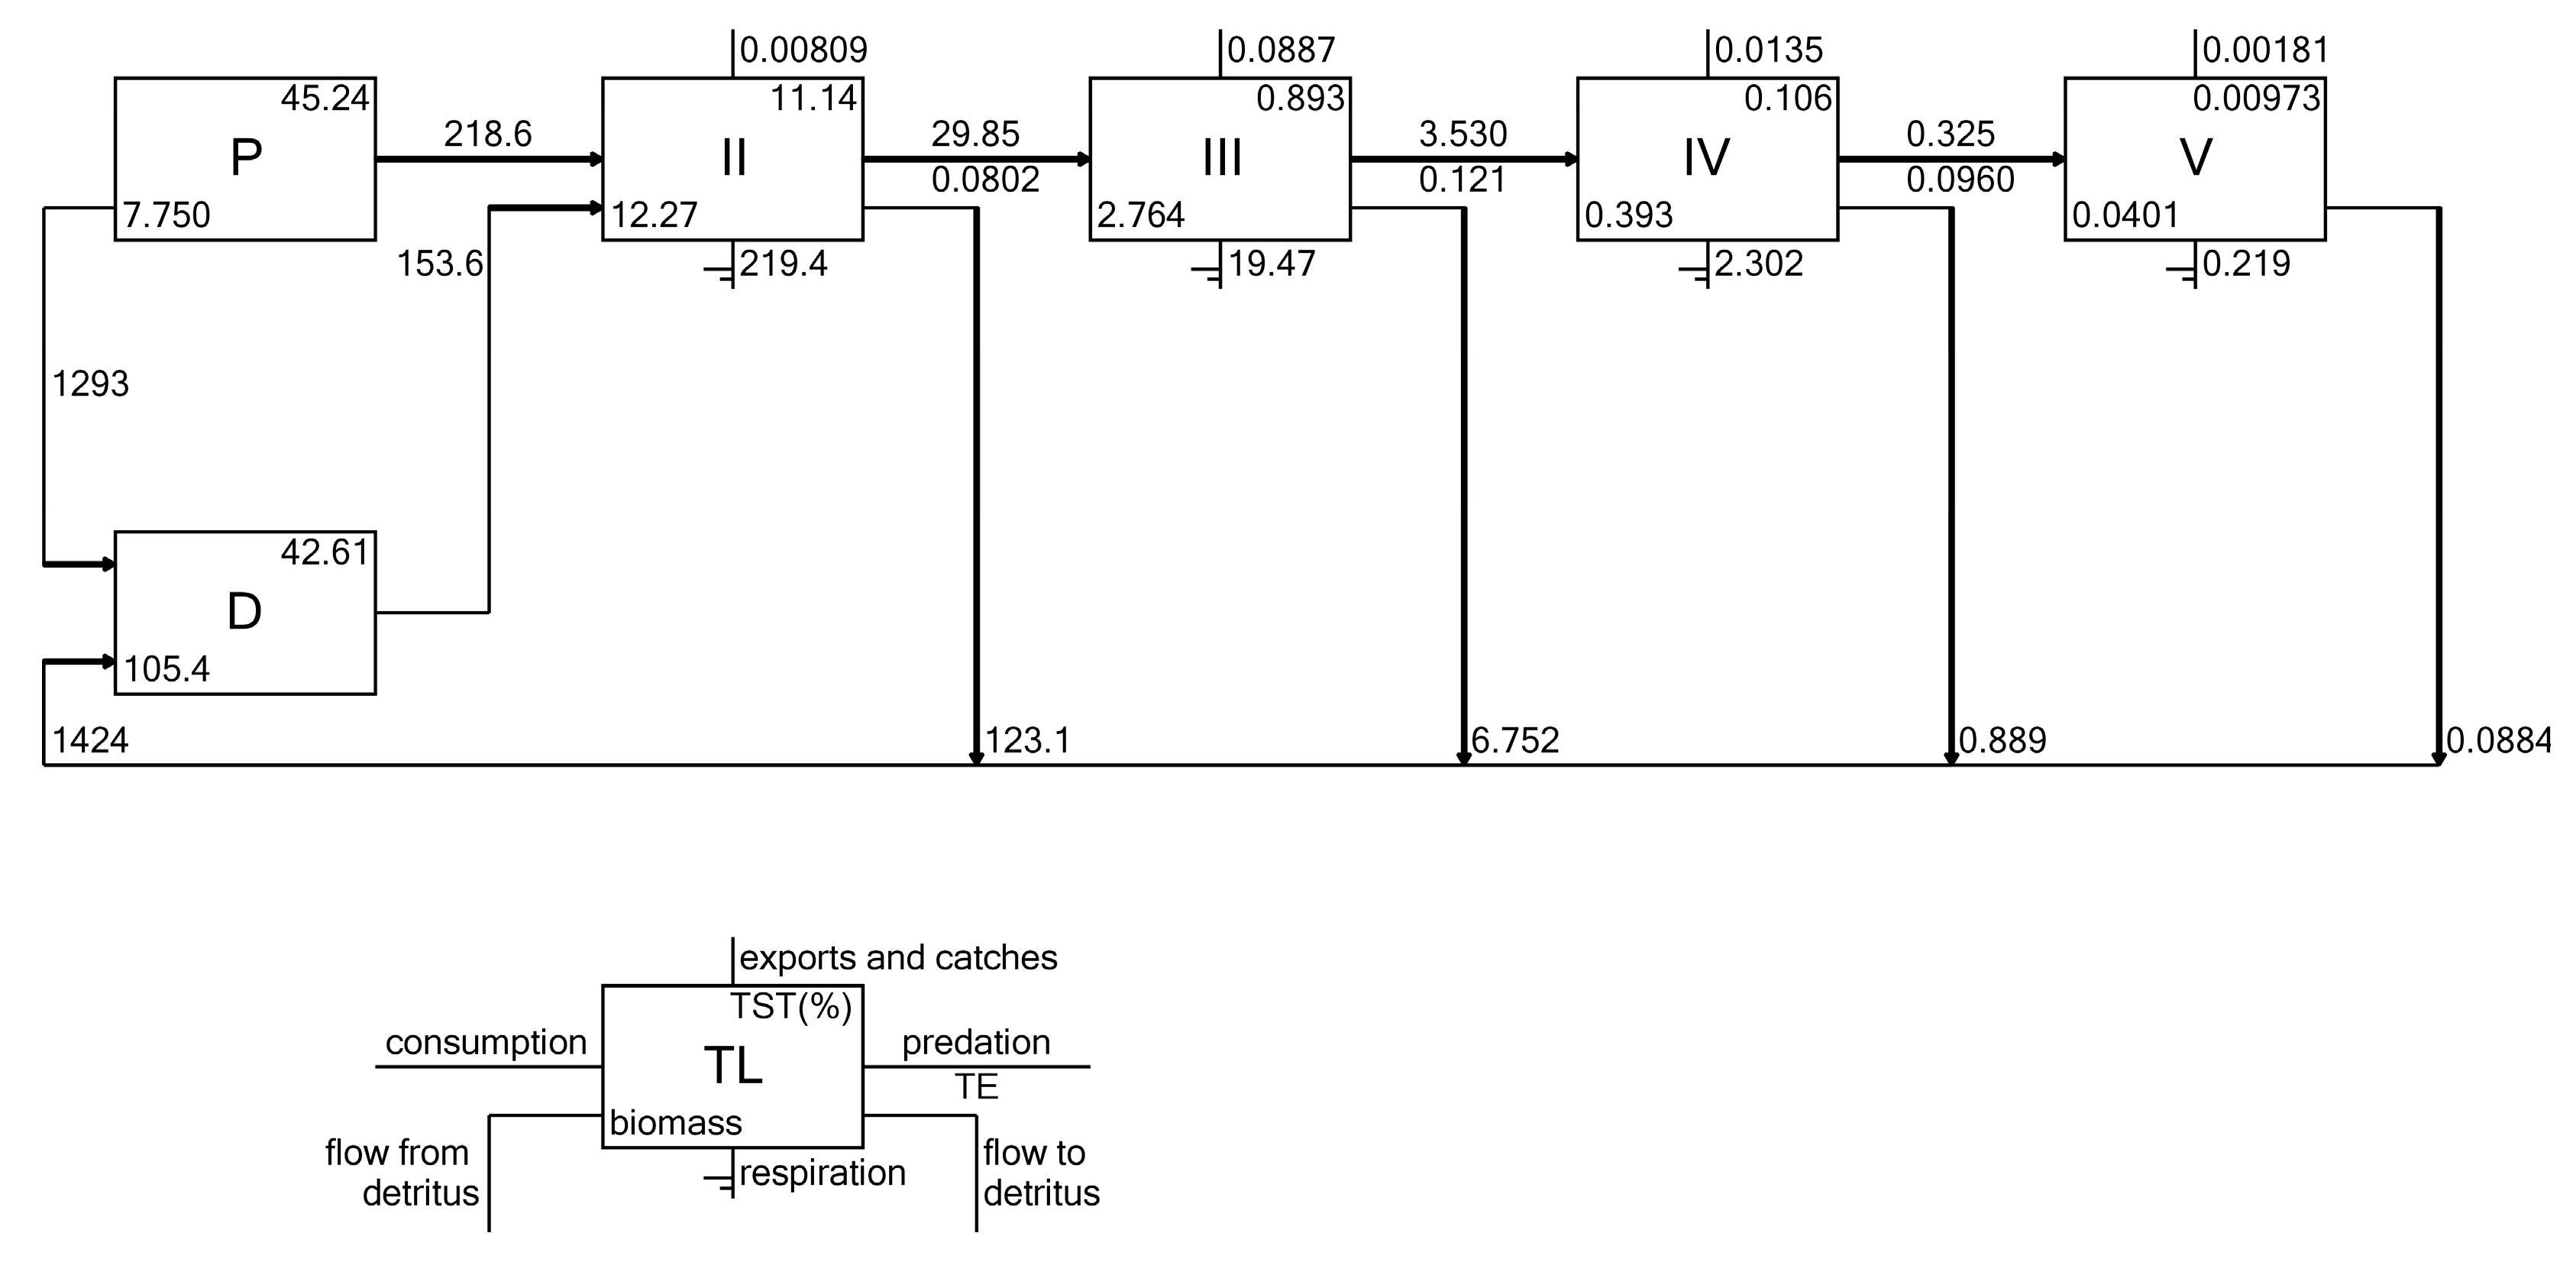
The keystoneness index (KS) was used to identify functional groups and species that have a structuring role on the food web dynamics (Figure 5). The sea breams and porgies group had the highest keystone index value of 0.07 and the highest relative total impact (1.0) in the Lamas region ecosystem. Serranus spp. and zooplankton groups had the second highest keystone index value of −0.19, with relative total impact values of 0.55 and 0.64, affecting many of the groups/species as a predator and prey, respectively. Lessepsian S. undosquamis had the third highest keystone index value of −0.20, with a relative total impact of 0.54. Two pelagic species, namely E. encrasicolus and horse mackerels, had the lowest keystone index values of 0.95 and 0.96, and relative total impact values of 0.096 and 0.092, respectively.

3.7. Energy Flows

The flows through trophic levels consisted of 41.3% of flows from detritus and 28.7% of flows from primary producers, indicating the dominance of the grazing food chain (Figure 6). The transfer efficiencies of flows were below 10% from TL II to TL III, above 10% from TL III to TL IV and close to 10% from TL IV to TL V. The highest respiratory flows and flows to detritus occurred from TL II. Exports were highest at TL III due to fisheries exploitation. The biomasses gradually decreased from TL II to TL V.

4. Discussion

Our study highlighted that: (i) the diet composition of N. randalli mainly comprised invertebrates and fish, and the smooth brittle star was identified as a diet item for the first time; (ii) the ecosystem of the Lamas marine region was in a development state sensu [45] and characterised by a high net system production and Pp/R ratio, and relatively low FCI and PL indicators; (iii) the keystone group in the ecosystem was the indigenous sea breams and porgies group, having a strong structuring role in the ecosystem; (iv) N. randalli had indirect positive impacts on commercially exploited native demersal fish species due to its mitigating role against the predation exerted by Lessepsian S. undosquamis on the demersal fish assemblages; and (v) N. randalli had a negative impact on the keystone group of the ecosystem, i.e., sea breams and porgies, and poses a risk to the ecosystem if this negative impact intensifies in the future.
Stomach content analysis showed that approximately 50% of the stomachs during the winter season were empty. Therefore, time of sampling is important for stomach content studies and indicated a difficulty for N. randalli in finding prey during winter. The diet items, namely Charybdis longicollis, Squilla mantis, Penaeus spp. and Echinodermata species, identified in this study were due to the overlap between N. randalli’s natural habitat and those species. Similar to earlier studies in the region [28,53], our study found that the subphylum Crustacea constituted the main prey items of N. randalli. However, the smooth brittle star (Ophiaderma longicaudum) was identified for the first time in N. randalli’s stomach in the eastern Mediterranean Sea. The presence of S. undosquamis in the stomach contents of N. randalli was hypothesised to be due to consumption in the trawl’s cod-end during the haul rather than a natural phenomenon; therefore, the species was not included in the diet of N. randalli in the Ecopath model. Furthermore, the presence of endoparasites in the stomach contents was remarkable. Therefore, the impact of endoparasites on N. randalli and its possible effects on human health due to consumption should be analysed in future studies, as the species has attained increasing commercial importance in recent years [28].
The majority of the published Ecopath models had a pedigree index value between 0.4 and 0.59, and only 10% of the models had pedigree values that were above 0.6 [54]. The calculated pedigree index of the Lamas region Ecopath model was high and indicated a high degree of data quality for the Ecopath model because we capitalised on local sampling data for calculating the majority of the biomasses, and population and diet studies from the region, especially for fish groups. PREBAL analysis indicated some over- and underestimated parameters for certain groups, especially for the parameters that were borrowed from other models in the region or empirically calculated. In addition, the pedigree analysis of biomasses could have been affected by groups with high levels of aggregation at lower trophic levels, e.g., zooplankton and phytoplankton. Therefore, the respective increasing linear trend could be overestimated; however, because we balanced the models in line with thermodynamics and ecosystem theory [39,40], the Ecopath model of the Lamas region could be considered successful in representing the ecosystem conditions in the area.
A suite of summary statistics and synthetic ecological indicators of the Lamas region Ecopath model are given in Table 5 in comparison with other ecosystems in the Mediterranean Sea. The high net system production and Pp/R ratio indicated that the ecosystem of the Lamas region was in a developmental stage sensu [45]. The lower values of Pp/R calculated in previous modelling studies in other ecosystems across the Mediterranean Sea were due to the low levels of primary production modelled, although respiratory flows were similar. Furthermore, due to the higher levels of primary production estimated in our study, the TST was higher than other studies in the region; however, it was comparable to the values in the whole Mediterranean Sea, and North and Central Adriatic Sea ecosystems (Table 5). The relative ascendancy and overhead (resilience) values were balanced contrary to the other Mediterranean ecosystems, except the whole Mediterranean Sea ecosystem. In heathy ecosystems, a balanced degree of ascendancy and resilience is required to recover from perturbed conditions and to withstand against stress, respectively [44]. Therefore, the status of the Lamas region ecosystem could be considered healthy with respect to ascendancy and resilience indicators, although it is in a developmental stage based on net system production and high Pp/B and low B/T ratios, and the ecosystem experienced an autotrophic succession considering the Pp/R ratio.
The FCI and PL were low, indicating significant flows to detritus from lower trophic levels. Indeed, a significant input to detrital compartments was calculated at TL II (Figure 6). The values of these two indicators increase as ecosystems develop, and high values are expected in mature ecosystems [45]. Therefore, the FCI and PL indicated the developmental status of the Lamas region ecosystem. The overall transfer efficiency of energy was close to the theoretical value, i.e., 10%, and lower from primary producers and higher from detritus compartments. Furthermore, the grazing food chain dominated the flows, again indicating the developmental status of the ecosystem.
Although the mTLc and PPRc were lower than those in the majority of the Mediterranean Sea ecosystems, mTLc was similar to those in the South Catalan Sea and whole Mediterranean Sea ecosystems. Furthermore, the total fisheries catch was orders of magnitude lower than those in the majority of the Mediterranean Sea ecosystems, indicating a low degree of fisheries impact.
Ref. [18] found that N. randalli had negative impacts on P. erythrinus and P. acarne. In addition, [17] reached a similar result, capitalizing on a modelling study with two aggregated functional groups defined as new alien demersal fishes and small indigenous demersal fishes, which included N. randalli, P. erythrinus and P. acarne, respectively. N. randalli had a positive and a negative impact on S. undosquamis in [17,18], respectively. Contrary to those previous findings, in our study, although N. randalli had similar dietary requirements and therefore, competed with P. erythrinus, P. acarne and, to some extent, red mullets, it had positive impacts on these species/groups due to its negative impact on the Lessepsian predator S. undosquamis. Therefore, MTI analysis suggested that N. randalli developed a favourable mitigating role in the food web against the negative impact of S. undosquamis on commercially important indigenous demersal species as a predator. However, the keystone group in the Lamas region ecosystem, i.e., sea breams and porgies, was negatively impacted by N. randalli; therefore, attention should be paid to the interaction between these two groups/species in future studies because an increase in the biomass of N. randalli in the region may instigate a reorganisation in the food web by obliterating the dynamics of sea breams and porgies.
N. randalli was suggested to have a high potential of being invasive [26]. Although N. randalli bears the potential to impact the ecosystem significantly, as shown in our MTI analysis, its impacts on other species in the food web have not yet reached the limits of causing biodiversity loss in the ecosystem. Therefore, N. randalli can be considered an alien species with the potential of being invasive, and ecosystem-based management activities should consider pre-emptive measures. On the Turkish coasts of the Mediterranean and Aegean Seas, N. randalli has increasingly been sold as P. erythrinus [28], and the species can be beneficial for the industrial fishery in the region. Furthermore, by capitalising on experiences employed against invasive aquatic species in other regions [19], fisheries can be utilised as a management tool to alleviate negative impacts exerted by N. randalli on the food web in addition to other management measures. However, a former modelling study on alien lionfish in the Mexican Caribbean showed that a suite of management measures is required to control populations of alien species successfully, such as restoration of habitat conditions to the advantage of indigenous species, regulating fisheries on native fish populations to increase competition and predation pressure on alien species [57]. If management strategies are not put in place, N. randalli may further establish its population with increasing biomass levels. With an optimistic outlook, N. randalli may cause a decrease in the native species’ populations that it competes with or feeds on, causing an economical loss in fisheries, or, with a pessimistic outlook, it could trigger a cascading effect in the food web and cause a reorganisation in the ecosystem due to its negative impact on the ecosystem’s keystone group, i.e., sea breams and porgies, hence creating unprecedented ecological and economic losses in the region.
In Gökova Bay in the Aegean Sea, the amount of Lessepsian fish in the landings was 22%, and its economic value constituted 9.6% of the economic value of the landings in 2019, and N. randalli constituted 12.8% of landings, and its economic value was 6.3% of landings [58]. Therefore, N. randalli has already started to become an important commercial species in the catches and should be increasingly exploited to prevent its negative impacts on the indigenous species. However, the mitigating role of N. randalli in regulating the negative impacts of S. undosquamis on native small demersal fish species as well as M. merluccius could be adversely affected by its increasing exploitation, and future modelling studies should employ scenario simulations to assess the changes in this mitigating effect under different harvesting scenarios.
The Mediterranean is a transition region with a temperate climate influenced by a colder and wetter European climate and a warmer and drier African climate; therefore, it is a critical region for future climate changes [59]. Global warming is expected to increase seawater temperatures, and this creates a risk for native species to be replaced by Lessepsian species such as N. randalli in the Mediterranean Sea. Increasing sea temperatures in the Red and the Mediterranean Seas [60,61] in the recent decades have created more favourable conditions for the Red Sea species in the Mediterranean Sea [62,63] and facilitated an increase in the number of tropical species [64]. Therefore, the trophic impacts of, in general Lessepsian species and in particular N. randalli, on the food web of the northeastern Mediterranean Sea will likely increase as climate change can favour thermophilic species [11].
Fisheries management is complicated in the northeastern Mediterranean Sea [65]. However, several methods can be applied to mitigate the negative impacts of N. randalli in the eastern Mediterranean Sea. Targeted exploitation or a bounty system can be promoted to decrease the negative impact of N. randalli on the native species. Incentives for marketing of N. randalli can be another management strategy to decrease its population. Furthermore, implementation of marine protected areas (MPAs) can be used as a management strategy to decrease Lessepsian species’ impacts with species-targeted removals. However, there is still debate about the impact of MPAs on invasive species, as MPAs in the northeastern Mediterranean Sea are already dominated (concerning number of species and biomass) by invasive species of Lessepsian origin [66,67]. Therefore, although N. randalli cannot be considered an invasive alien species yet, it has the potential to pose significant risks to the ecosystem, and its negative impacts should be counteracted by employing ecosystem-based fisheries management (EBFM) strategies.

Limitations and Future Considerations

The Lamas region Ecopath model capitalised on local sampling data from bottom trawl hauls. Bottom trawling is a fishing practice that can efficiently sample the demersal environment but cannot retain pelagic organisms effectively, and pelagic species either are underestimated or can be totally missing in the samples. Furthermore, benthic species are not effectively retained by bottom trawl nets. Therefore, in our Ecopath model of the Lamas region, certain groups could have been underestimated in the ecosystem. In addition, our model did not include any temporal dynamics due to lack of time series fish stock assessment studies that can be used to validate the temporal model; therefore, it was not possible to test fisheries management strategies under different harvesting levels and changing environmental conditions. Future modelling studies should work towards including temporal dynamics and scenario simulations to assess different fisheries management options for mitigating the negative impacts of N. randalli.

5. Conclusions

This study is the first species-specific Ecopath model showing the impact of one of the most common Lessepsian species, N. randalli, on the northeastern Mediterranean Sea food web using the Lamas region as a case study. In addition to assessing the ecosystem status and functioning by capitalising on synthetic ecological indicators and network analysis, we focused on the impact of N. randalli and its interaction with other species and fisheries. Our study used the most recent available data to describe the current state of the ecosystem functioning and structure in the region. We found that N. randalli had both the potential to mitigate negative impacts of other Lessepsian species in the region and to instigate significant negative changes in the ecosystem. Targeted exploitation could be implemented to control the population of N. randalli; however, it may also bring adverse impacts, as N. randalli mitigates the negative effects of certain Lessepsian fish species on indigenous ones. Therefore, future modelling work should include temporal scenario simulations to delineate the impact of N. randalli on the ecosystem under different harvesting, food web and climate change scenarios.

Author Contributions

Conceptualization, E.A.; methodology, E.A. and Y.A.; formal analysis, Y.A. and E.A.; investigation, Y.A.; data curation, Y.A.; validation; E.A., writing—original draft preparation, Y.A. and E.A.; writing—review and editing, E.A. and Y.A.; visualization, E.A. and Y.A.; supervision, E.A. All authors have read and agreed to the published version of the manuscript.

Funding

This research was funded by The Scientific and Technological Research Council of Türkiye (TÜBİTAK), project number 117Y396.

Institutional Review Board Statement

The animal study protocol was approved by the Institutional Ethics Committee of Middle East Technical University (protocol code 2017/05 and date of approval 21 August 2017).

Informed Consent Statement

Not applicable.

Data Availability Statement

The data presented in this study are available in the tables provided in the article and in Appendix A.

Acknowledgments

The authors thank Meltem Ok for leading the field sampling and laboratory analyses, the crew of R/V Lamas 1 for facilitating the field operations and Gülşah Can for her guidance in laboratory analysis.

Conflicts of Interest

The authors declare no conflict of interest. The funders had no role in the design of the study; in the collection, analyses or interpretation of data; in the writing of the manuscript; or in the decision to publish the results.

Appendix A

Table A1. Data and related sources regarding the input parameters for the Lamas region Ecopath model.
Functional GroupsOriginal ValueCalibrated ValueSources
Phytoplankton
Biomass7.757.75[68]
P/B195.1195.1Calculated to match 151.2 gC/m2/y annual primary production as per [69]
Zooplankton
Biomass3.3853.385[70]
P/B30.4230.42[71]
Q/B92.1892.18[18]
Diet[18]
N. randalli
Biomass0.03740.0374Trawl survey
P/B0.9360.936[72]
Q/B9.7817.781Empirical equation by [35] using length–weight relationship and L values from [73] and aspect ratio from trawl survey
DietStomach content analysis, [28,53,74]
Other benthic invertebrates
Biomass0.05465.456Trawl survey
P/B1.151.15[10]
Q/B3.6583.658[10] adjusted with Opitz’s correction factor [75]
DietModified from [10]
Polychaetes
Biomass1.623.24[76]
P/B3.613.61[18]
Q/B16.9316.93[10] adjusted with Opitz’s correction factor [75]
DietModified from [10]
Crabs
Biomass0.06180.618Trawl survey
P/B2.422.42[10]
Q/B5.5265.526[10] adjusted with Opitz’s correction factor [75]
DietModified from [10]
Shrimps and prawns
Biomass0.2510.251Trawl survey
P/B3.093.09[18]
Q/B12.2711.27[18]
DietModified from [10]
Octopuses, cuttlefish and squids
Biomass0.1020.0612Trawl survey
P/B2.6522.652[10]
Q/B14.2214.22[10] adjusted with Opitz’s correction factor [75]
Diet[77]
P. erythrinus
Biomass0.1400.0837Trawl survey
P/B1.7691.769[78]
Q/B8.4328.432Empirical equation by [35] using length–weight relationship and L (as (weighted average of max length divided by 0.95 [79]) values from [80]
Diet[81]
P. acarne
Biomass0.2300.161Trawl survey
P/B1.941.94[82]
Q/B10.6910.69Empirical equation by [35] using length–weight relationship and L values from [83]
Diet[83]
Red mullets
Biomass0.450.315Trawl survey
P/B1.2251.225[78]
Q/B9.8949.894Empirical equation by [35] using length–weight relationship and L values from [78]
Diet[84]
M. merluccius
Biomass0.02090.0209Trawl survey
P/B2.412.41[85]
Q/B7.1157.115Empirical equation by [35] using length–weight relationship and L values from [85]
Diet[86]
Gobius spp.
Biomass0.00180.360Trawl survey
P/B0.8471.695Empirical equation by [34] using maximum age value from [87].
Q/B11.0711.07Empirical equation by [35] using length–weight relationship and L values from [87]
Diet[87]
S. undosquamis
Biomass0.08290.0829Trawl survey
P/B1.761.76[88]
Q/B8.2858.285Empirical equation by [35] using length–weight relationship from [89] and L from [88]
Diet[90]
Sea breams and porgies
Biomass0.4190.293Trawl survey
P/B0.4150.415Empirical equation by [34] capitalising on weighted averages of calculated Z values using maximum age values from [36]
Q/B8.6547.654Empirical equation by [35] using length–weight relationship from [91] and L from [92]
Diet[93]
Serranus spp.
Biomass0.01230.0864Trawl survey
P/B1.281.28[94]
Q/B12.21510.215Empirical equation by [35] using W from [95]
Diet[96]
Leiognathidae
Biomass0.4080.408Trawl survey
P/B0.9610.961[97]
Q/B19.3619.36Empirical equation by [35] using W from [97]
Diet[98]
Clupeidae
Biomass0.002240.447Trawl survey
P/B1.2821.282[99]
Q/B14.2114.21Empirical equation by [35] using length–weight relationship and L from [99]
Diet[100]
E. encrasicolus
Biomass0.007030.0703Trawl survey
P/B2.732.73[18]
Q/B12.2312.23Empirical equation by [35] using length–weight relationship and L from [101]
Diet[102]
Horse mackerels
Biomass0.0950.095Trawl survey
P/B1.661.6[101]
Q/B11.8011.80[101]
Diet[39,40]
Detritus
Biomass105.4105.4Empirical equation by [103] using 151.2 gC/m2/y primary production and euphotic zone depth of 37 from [69]
Table A2. Relative diet composition matrix for the Lamas region Ecopath model.
#Prey/Predator234567891011121314151617181920
1Phytoplankton0.7 0.03
2Zooplankton0.05 0.020.11 0.10.338 0.11 0.2840.150.7250.971.00.975
3N. randalli 0.01 0.01
4Other benthic invertebrates 0.0090.005 0.410.40.540.3310.0860.209 0.0010.3070.1830.0420.02 0.003
5Polychaetes 0.0030.0270.0340.420.220.090.1070.1060.235 0.863 0.0370.0290.1020.01 0.001
6Crabs 0.227 0.020.0250.1750.0760.0390.1740.0010.027 0.040.2 0.003
7Shrimps and prawns 0.329 0.010.0550.0750.2260.016 0.114 0.0050.020.134 0.003
8Octopuses, cuttlefish and squids 0.020.023 0.0010.041 0.015
9P. erythrinus 0.01 0.05
10P. acarne 0.010.1 0.10.05
11Red mullets 0.005 0.134 0.0350.126
12M. merluccius 0.31
13Gobius spp. 0.025 0.0550.0240.184 0.0280.0090.104
14S. undosquamis 0.008
15Sea breams and porgies 0.016 0.013 0.164 0.08
16Serranus spp. 0.062 0.128
17Leiognathidae 0.135 0.031 0.1
18Clupeidae 0.17 0.01 0.277 0.3780.0360.01
19E. encrasicolus 0.143 0.07
20Horse mackerels 0.051 0.02
21Detritus0.250.0260.9680.9660.120.19 0.2320.382 0.101
Import

References

  1. Convention on Biological Diversity (CBD). Guiding Principles for the Prevention, Introduction and Mitigation of Impacts of Alien Invasive Species That Threaten Ecosystems, Habitats or Species; Convention on Biological Diversity (CBD): The Hague, The Netherlands, 2002. [Google Scholar]
  2. Katsanevakis, S.; Coll, M.; Piroddi, C.; Steenbeek, J.; Ben Rais Lasram, F.; Zenetos, A.; Cardoso, A.C. Invading the Mediterranean Sea: Biodiversity Patterns Shaped by Human Activities. Front. Mar. Sci. 2014, 1, 32. [Google Scholar]
  3. Öztürk, B. Status of Alien Species in the Black and Mediterranean Seas. Stud. Rev. Gen. Fish. Comm. Mediterr. 2010, 87, 103. [Google Scholar]
  4. Merkado, G.; Abramovich, S.; Abdu, U.; Almogi-Labin, A.; Pawlowski, J.; Holzmann, M. Breaking Biogeographic Barriers: Molecular and Morphological Evidences for the Lessepsian Invasion of Soritid Foraminifers to the Mediterranean Sea. In Proceedings of the EGU General Assembly Conference Abstracts, Vienna, Austria, 22–27 April 2012; p. 560. [Google Scholar]
  5. Spanier, E.; Galil, B.S. Lessepsian Migration: A Continuous Biogeographical Process. Endeavour 1991, 15, 102–106. [Google Scholar] [CrossRef]
  6. Edelist, D.; Rilov, G.; Golani, D.; Carlton, J.T.; Spanier, E. Restructuring the Sea: Profound Shifts in the World’s Most Invaded Marine Ecosystem. Divers. Distrib. 2013, 19, 69–77. [Google Scholar] [CrossRef]
  7. Bilecenoğlu, M. Demersal Lessepsian Fish Assemblage Structure in the Northern Levant and Aegean Seas. J. Black Sea/Mediterr. Environ. 2016, 22, 46–59. [Google Scholar]
  8. Zakaria, H.Y. Article Review: Lessepsian Migration of Zooplankton through Suez Canal and Its Impact on Ecological System. Egypt. J. Aquat. Res. 2015, 41, 129–144. [Google Scholar] [CrossRef] [Green Version]
  9. Christensen, V.; Walters, C.J.; Pauly, D. Ecopath with Ecosim: A User’s Guide; Fisheries Centre, University of British Columbia: Vancouver, BC, Canada, 2005; Volume 154, p. 31. [Google Scholar]
  10. Tsagarakis, K.; Coll, M.; Giannoulaki, M.; Somarakis, S.; Papaconstantinou, C.; Machias, A. Food-Web Traits of the North Aegean Sea Ecosystem (Eastern Mediterranean) and Comparison with Other Mediterranean Ecosystems. Estuar. Coast. Shelf Sci. 2010, 88, 233–248. [Google Scholar] [CrossRef]
  11. Papapanagiotou, G.; Tsagarakis, K.; Koutsidi, M.; Tzanatos, E. Using Traits to Build and Explain an Ecosystem Model: Ecopath with Ecosim Modelling of the North Aegean Sea (Eastern Mediterranean). Estuar. Coast. Shelf Sci. 2020, 236, 106614. [Google Scholar] [CrossRef]
  12. Dimarchopoulou, D.; Tsagarakis, K.; Sylaios, G.; Tsikliras, A.C. Ecosystem Trophic Structure and Fishing Effort Simulations of a Major Fishing Ground in the Northeastern Mediterranean Sea (Thermaikos Gulf). Estuar. Coast. Shelf Sci. 2022, 264, 107667. [Google Scholar] [CrossRef]
  13. Dimarchopoulou, D.; Keramidas, I.; Tsagarakis, K.; Tsikliras, A.C. Ecosystem Models and Effort Simulations of an Untrawled Gulf in the Central Aegean Sea. Front. Mar. Sci. 2019, 6, 648. [Google Scholar]
  14. Papantoniou, G.; Giannoulaki, M.; Stoumboudi, M.T.; Lefkaditou, E.; Tsagarakis, K. Food Web Interactions in a Human Dominated Mediterranean Coastal Ecosystem. Mar. Environ. Res. 2021, 172, 105507. [Google Scholar] [CrossRef]
  15. Keramidas, I.; Dimarchopoulou, D.; Tsikliras, A.C. Modelling and Assessing the Ecosystem of the Aegean Sea, a Major Hub of the Eastern Mediterranean at the Intersection of Europe and Asia. Reg. Stud. Mar. Sci. 2022, 56, 102704. [Google Scholar] [CrossRef]
  16. Michailidis, N.; Corrales, X.; Karachle, P.K.; Chartosia, N.; Katsanevakis, S.; Sfenthourakis, S. Modelling the Role of Alien Species and Fisheries in an Eastern Mediterranean Insular Shelf Ecosystem. Ocean Coast. Manag. 2019, 175, 152–171. [Google Scholar] [CrossRef]
  17. Corrales, X.; Ofir, E.; Coll, M.; Goren, M.; Edelist, D.; Heymans, J.J.; Gal, G. Modeling the Role and Impact of Alien Species and Fisheries on the Israeli Marine Continental Shelf Ecosystem. J. Mar. Syst. 2017, 170, 88–102. [Google Scholar] [CrossRef]
  18. Saygu, İ.; Heymans, J.J.; Fox, C.J.; Özbilgin, H.; Eryaşar, A.R.; Gökçe, G. The Importance of Alien Species to the Food Web and Bottom Trawl Fisheries of the Northeastern Mediterranean, a Modelling Approach. J. Mar. Syst. 2020, 202, 103253. [Google Scholar] [CrossRef]
  19. Rice, M.A. Intensive Fishing Effort and Market Controls as Management Tools for Invasive Aquatic Species: A Review. Asian Fish. Sci. 2021, 34, 383–392. [Google Scholar]
  20. Yemisken, E.; Dalyan, C.; Eryilmaz, L. Catch and Discardfish Species of Trawl Fisheries in the Iskenderun Bay (Northeastern Mediterranean) with Emphasis on Lessepsian and Chondricthyan Species. Mediterr. Mar. Sci. 2014, 15, 380–389. [Google Scholar] [CrossRef] [Green Version]
  21. Golani, D.; Sonin, O. The Japanese Threadfin Bream Nemipterus Japonicus, a New Indo-Pacific Fish in the Mediterranean Sea. J. Fish Biol. 2006, 68, 940–943. [Google Scholar] [CrossRef]
  22. Lelli, S.; Colloca, F.; Carpentieri, P.; Russell, B.C. The Threadfin Bream Nemipterus randalli (Perciformes: Nemipteridae) in the Eastern Mediterranean Sea. J. Fish Biol. 2008, 73, 740–745. [Google Scholar] [CrossRef]
  23. Bilecenoglu, M.; Russell, B. Record of Nemipterus randalli Russell, 1986 (Nemipteridae) from Iskenderun Bay, Turkey. Cybium Int. J. Ichthyol. 2008, 32, 279–280. [Google Scholar]
  24. Gülşahin, A.; Kara, A. Record of Nemipterus randalli Russell, 1986 from the Southern Aegean Sea (Gökova Bay, Turkey). J. Appl. Ichthyol. 2013, 29, 933–934. [Google Scholar] [CrossRef]
  25. Aydin, İ.; Akyol, O. Occurrence of Nemipterus randalli Russell, 1986 (Nemipteridae) off Izmir Bay, Turkey. J. Appl. Ichthyol. 2017, 33, 533–534. [Google Scholar] [CrossRef]
  26. Uyan, U.; Filiz, H.; Top, N.; Tarkan, A.S. Assessment of Invasiveness Potential of Nemipterus randalli in Mediterranean Sea by Aquatic Species Invasiveness Screening Kit (AS-ISK). In Proceedings of the Workshop on Risk Assessment Tools in Aquatic Species, Proceedings Book, Duzce, Turkey, 28–29 April 2016; pp. 62–63. [Google Scholar]
  27. Bilge, G.; Filiz, H.; Yapici, S.; Tarkan, A.S.; Vilizzi, L. A Risk Screening Study on the Potential Invasiveness of Lessepsian Fishes in the South-Western Coasts of Anatolia. Acta Ichthyol. Piscat. 2019, 49, 23–31. [Google Scholar] [CrossRef] [Green Version]
  28. Yapici, S.; Fïlïz, H. Biological Aspects of Two Coexisting Native and Non-Native Fish Species in the Aegean Sea: Pagellus erythrinus vs. Nemipterus randalli. Mediterr. Mar. Sci. 2019, 20, 594–602. [Google Scholar] [CrossRef]
  29. Uyan, U.; Filiz, H.; Tarkan, A.S.; Çelik, M.; Top, N. Age and Growth of Nemipterus randalli in the Southern Aegean Sea, Turkey. J. Black Sea/Mediterr. Environ. 2019, 25, 140–149. [Google Scholar]
  30. Akgün, Y. The Trophic and Fishery Impact of Invasive Nemipterus randalli (Russell, 1986) in the Northeastern Mediterranean Sea. Master’s Thesis, Middle East Technical University, Ankara, Turkey, 2022. [Google Scholar]
  31. Dunn, A.; Harley, S.J.; Doonan, I.J.; Bull, B. Calculation and Interpretation of Catch-per-Uniteffort (CPUE) Indices. N. Z. Fish. Assess. Rep. 2000, 1, 44. [Google Scholar]
  32. Gulland, J.A. Report of the FAO/IOP Workshop on the Fishery Resources of the Western Indian Ocean South of the Equator Mah? Food and Agriculture Organization of the United Nations: Rome, Italy, 1979. [Google Scholar]
  33. Allen, K.R. Relation between Production and Biomass. J. Fish. Board Can. 1971, 28, 1573–1581. [Google Scholar] [CrossRef]
  34. Hoenig, J.M. Empirical Use of Longevity Data to Estimate Mortality Rates. Fish. Bull. 1983, 81, 898–903. [Google Scholar]
  35. Palomares, M.L.D.; Pauly, D. Predicting Food Consumption of Fish Populations as Functions of Mortality, Food Type, Morphometrics, Temperature and Salinity. Mar. Freshw. Res. 1998, 49, 447–453. [Google Scholar] [CrossRef]
  36. Froese, R.; Pauly, D. FishBase. World Wide Web Electronic Publication. 2023. Available online: www.fishbase.org (accessed on 28 April 2023).
  37. Turkstat Turkish Statistical Institute. 2023. Available online: https://biruni.tuik.gov.tr/medas/?locale=tr (accessed on 21 June 2023).
  38. Sea Around Us Concepts, Design and Data. 2020. Available online: Seaaroundus.Org (accessed on 21 June 2023).
  39. Piroddi, C.; Coll, M.; Steenbeek, J.; Moy, D.M.; Christensen, V. Modelling the Mediterranean Marine Ecosystem as a Whole: Addressing the Challenge of Complexity. Mar. Ecol. Prog. Ser. 2015, 533, 47–65. [Google Scholar]
  40. Heymans, J.J.; Coll, M.; Link, J.S.; Mackinson, S.; Steenbeek, J.; Walters, C.; Christensen, V. Best Practice in Ecopath with Ecosim Food-Web Models for Ecosystem-Based Management. Ecol. Model. 2016, 331, 173–184. [Google Scholar] [CrossRef]
  41. Link, J.S. Adding Rigor to Ecological Network Models by Evaluating a Set of Pre-Balance Diagnostics: A Plea for PREBAL. Ecol. Model. 2010, 221, 1580–1591. [Google Scholar] [CrossRef]
  42. Ulanowicz, R.E. Information Theory in Ecology. Comput. Chem. 2001, 25, 393–399. [Google Scholar] [CrossRef] [PubMed]
  43. Ulanowicz, R.E. Ascendancy: A Measure of Ecosystem Performance. In Handbook of Ecosystem Theories and Management; CRC Press Inc.: Boca Raton, FL, USA, 2000; p. 303. [Google Scholar]
  44. Costanza, R.; Mageau, M. What Is a Healthy Ecosystem? Aquat. Ecol. 1999, 33, 105–115. [Google Scholar] [CrossRef]
  45. Odum, E.P. The Strategy of Ecosystem Development: An Understanding of Ecological Succession Provides a Basis for Resolving Man’s Conflict with Nature. Science 1969, 164, 262–270. [Google Scholar]
  46. Finn, J.T. Measures of Ecosystem Structure and Function Derived from Analysis of Flows. J. Theor. Biol. 1976, 56, 363–380. [Google Scholar] [CrossRef]
  47. Christensen, V.; Pauly, D. Flow Characteristics of Aquatic Ecosystems. In Trophic Models of Aquatic Ecosystems; Christensen, V., Pauly, D., Eds.; ICLARM: Manila, Philippines, 1993; pp. 338–352. [Google Scholar]
  48. Pauly, D.; Christensen, V.; Dalsgaard, J.; Froese, R.; Torres Jr, F. Fishing down Marine Food Webs. Science 1998, 279, 860–863. [Google Scholar] [CrossRef]
  49. Pauly, D.; Christensen, V. Primary Production Required to Sustain Global Fisheries. Nature 1995, 374, 255–257. [Google Scholar] [CrossRef]
  50. Lindeman, R. The Trophic-Dynamic Aspect of Ecology. Ecology 1942, 23, 399–418. [Google Scholar] [CrossRef]
  51. Ulanowicz, R.E.; Puccia, C.J. Mixed trophic impacts in ecosystems. In Coenoses; Springer: Berlin/Heidelberg, Germany, 1990; pp. 7–16. [Google Scholar]
  52. Libralato, S.; Christensen, V.; Pauly, D. A Method for Identifying Keystone Species in Food Web Models. Ecol. Model. 2006, 195, 153–171. [Google Scholar] [CrossRef]
  53. Gurlek, M.; Erguden, S.; Yaglioglu, D.; Turan, F.; Demirhan, S.; Gurlek, M.; Gungor, M.; Ozbalcilar, B.; Ozcan, T.; Univerity, M.K. Feeding Habits of Indo-Pacific Species Nemipterus randalli Russel, 1986 (Nemipteridae) in Iskenderun Bay, Eastern Mediterranean Sea. Rapp. Comm. Int. Médit. 2010, 39, 539. [Google Scholar]
  54. Morissette, L. Complexity, Cost and Quality of Ecosystem Models and Their Impact on Resilience: A Comparative Analysis, with Emphasis on Marine Mammals and the Gulf of St. Lawrence. Ph.D. Thesis, University of British Columbia, Vancouver, BC, Canada, 2007. [Google Scholar]
  55. Coll, M.; Palomera, I.; Tudela, S.; Sardà, F. Trophic Flows, Ecosystem Structure and Fishing Impacts in the South Catalan Sea, Northwestern Mediterranean. J. Mar. Syst. 2006, 59, 63–96. [Google Scholar]
  56. Coll, M.; Santojanni, A.; Palomera, I.; Tudela, S.; Arneri, E. An Ecological Model of the Northern and Central Adriatic Sea: Analysis of Ecosystem Structure and Fishing Impacts. J. Mar. Syst. 2007, 67, 119–154. [Google Scholar] [CrossRef]
  57. Ortiz, M.; Rodriguez-Zaragoza, F.; Hermosillo-Nuñez, B.; Jordán, F. Control Strategy Scenarios for the Alien Lionfish Pterois Volitans in Chinchorro Bank (Mexican Caribbean): Based on Semi-Quantitative Loop Analysis. PLoS ONE 2015, 10, e0130261. [Google Scholar] [CrossRef]
  58. Ünal, V.; Tıraşın, E.M.; Tosunoğlu, Z. An Ecosystem Approach to Fisheries Management for Small-Scale Fisheries in Gökova Marine Protected Area, Turkey: Challenges Encountered during the Transition Process. In Transition towards an Ecosystem Approach to Fisheries in the Mediterranean Sea–Lessons Learned through Selected Case Studies; Food and Agriculture Organization: Rome, Italy, 2022. [Google Scholar]
  59. Giorgi, F. Climate Change Hot-Spots. Geophys. Res. Lett. 2006, 33, L08707. [Google Scholar] [CrossRef]
  60. Shaltout, M. Recent Sea Surface Temperature Trends and Future Scenarios for the Red Sea. Oceanologia 2019, 61, 484–504. [Google Scholar]
  61. García-Monteiro, S.; Sobrino, J.A.; Julien, Y.; Sòria, G.; Skokovic, D. Surface Temperature Trends in the Mediterranean Sea from MODIS Data during Years 2003–2019. Reg. Stud. Mar. Sci. 2022, 49, 102086. [Google Scholar]
  62. Turan, C.; Gürlek, M. Climate Change and Biodiversity Effects in Turkish Seas. Nat. Eng. Sci. 2016, 1, 15–24. [Google Scholar] [CrossRef] [Green Version]
  63. Por, F.D. Climate Optimum Rejuvenates the Mediterranean Marine World. Integr. Zool. 2010, 5, 112–121. [Google Scholar] [CrossRef]
  64. Raitsos, D.E.; Beaugrand, G.; Georgopoulos, D.; Zenetos, A.; Pancucci-Papadopoulou, A.M.; Theocharis, A.; Papathanassiou, E. Global Climate Change Amplifies the Entry of Tropical Species into the Eastern Mediterranean Sea. Limnol. Oceanogr. 2010, 55, 1478–1484. [Google Scholar] [CrossRef]
  65. Gücü, A.C. Impact of Depth and Season on the Demersal Trawl Discard. Turk. J. Fish. Aquat. Sci. 2012, 12, 817–830. [Google Scholar]
  66. Giakoumi, S.; Pey, A.; Di Franco, A.; Francour, P.; Kizilkaya, Z.; Arda, Y.; Raybaud, V.; Guidetti, P. Exploring the Relationships between Marine Protected Areas and Invasive Fish in the World’s Most Invaded Sea. Ecol. Appl. 2019, 29, e01809. [Google Scholar] [CrossRef] [PubMed] [Green Version]
  67. Giakoumi, S.; Katsanevakis, S.; Albano, P.G.; Azzurro, E.; Cardoso, A.C.; Cebrian, E.; Deidun, A.; Edelist, D.; Francour, P.; Jimenez, C. Management Priorities for Marine Invasive Species. Sci. Total Environ. 2019, 688, 976–982. [Google Scholar] [CrossRef]
  68. El Hourany, R.; Fadel, A.; Gemayel, E.; Abboud-Abi Saab, M.; Faour, G. Spatio-Temporal Variability of the Phytoplankton Biomass in the Levantine Basin between 2002 and 2015 Using MODIS Products. Oceanologia 2017, 59, 153–165. [Google Scholar] [CrossRef]
  69. Yucel, N. Spatio-Temporal Variability of the Size-Fractionated Primary Production and Chlorophyll in the Levantine Basin (Northeastern Mediterranean). Oceanologia 2018, 60, 288–304. [Google Scholar] [CrossRef]
  70. Yılmaz, A.Z.; Besiktepe, S. Annual Variations in Biochemical Composition of Size Fractionated Particulate Matter and Zooplankton Abundance and Biomass in Mersin Bay, NE Mediterranean Sea. J. Mar. Syst. 2010, 81, 260–271. [Google Scholar] [CrossRef]
  71. Zervoudaki, S.; Christou, E.D.; Nielsen, T.G.; Siokou-Frangou, I.; Assimakopoulou, G.; Giannakourou, A.; Maar, M.; Pagou, K.; Krasakopoulou, E.; Christaki, U.; et al. The Importance of Small-Sized Copepods in a Frontal Area of the Aegean Sea. J. Plankton Res. 2007, 29, 317–338. [Google Scholar] [CrossRef] [Green Version]
  72. Tartar, Ü.; Yeldan, H. Some Population Dynamic Parameters of Northeastern Mediterranean (Iskenderun Bay) Threadfin Bream, Nemipterus randalli Russell, 1986. Acta Biol. Turc. 2022, 35, 3–7. [Google Scholar]
  73. Erguden, D.; Turan, C.; Gurlek, M.; Yaglioglu, D.; Gungor, M. Age and Growth of the Randall’s Threadfin Bream Nemipterus randalli (Russell, 1986), a Recent Lessepsian Migrant in Iskenderun Bay, Northeastern Mediterranean. J. Appl. Ichthyol. 2010, 26, 441–444. [Google Scholar] [CrossRef]
  74. Gilaad, R.-L.; Galil, B.S.; Diamant, A.; Goren, M. The Diet of Native and Invasive Fish Species along the Eastern Mediterranean Coast (Osteichthyes). Zool. Middle East 2017, 63, 325–335. [Google Scholar] [CrossRef]
  75. Opitz, S. Trophic Interactions in Caribbean Coral Reefs; WorldFish Center: Penang, Malaysia, 1996; Volume 1085. [Google Scholar]
  76. Ergev, M.B. A Baseline Study for Determination of Macrobenthic Epi/ Infaunal Species in the Northeastern Mediterranean. Master’s Thesis, Middle East Technical University, Ankara, Turkey, 2002; p. 364. [Google Scholar]
  77. Martínez-Baena, F.; Navarro, J.; Albo-Puigserver, M.; Palomera, I.; Rosas-Luis, R. Feeding Habits of the Short-Finned Squid Illex Coindetii in the Western Mediterranean Sea Using Combined Stomach Content and Isotopic Analysis. J. Mar. Biol. Assoc. UK 2016, 96, 1235–1242. [Google Scholar] [CrossRef]
  78. Bingel, F. Erdemli-İçel Bölgesi Balıkçılığı Geliştirme Projesi Kesin Raporu (Final Report on the Improvement of the Fishery in Erdemli-İcel Region); Proje No 80070010; Institute of Marine Sciences-Middle East Technical Univiversitesi: Erdemli-Mersin, Turkey, 1981; Volume 154. [Google Scholar]
  79. Pauly, D. Fish Population Dynamics in Tropical Waters: A Manual for Use with Programmable Calculators; WorldFish Center: Penang, Malaysia, 1984; Volume 8. [Google Scholar]
  80. Lteif, M.; Jemaa, S.; Mouawad, R.; Khalaf, G.; Lelli, S.; Fakhri, M. Population Biology of the Common Pandora, Pagellus erythrinus (Linnaeus, 1758) along the Lebanese Coast, Eastern Mediterranean. Egypt. J. Aquat. Res. 2020, 46, 57–62. [Google Scholar] [CrossRef]
  81. Šantić, M.; Paladin, A.; Rađa, B. Feeding Habits of Common Pandora Pagellus erythrinus (Sparidae) from Eastern Central Adriatic Sea. Cybium 2011, 35, 83–90. [Google Scholar] [CrossRef]
  82. Gurbet, R.; Akyol, O.; Yalcin, E. Catch per Unit Effort and Mortality Rates of Two Sparid Species, Pagellus Acarne and Pagellus erythrinus from Bottom Trawl Fishery in Izmir Bay, Aegean Sea. J. Anim. Vet. Adv. 2012, 11, 681–686. [Google Scholar] [CrossRef] [Green Version]
  83. Ilhan, D. Age, Growth, and Diet of Axillary Seabream, Pagellus Acarne (Actinopterygii: Perciformes: Sparidae), in the Central Aegean Sea. Acta Ichthyol. Piscat. 2018, 48, 329–339. [Google Scholar]
  84. Chérif, M.; Amor, M.B.; Selmi, S.; Gharbi, H.; Missaoui, H.; Capapé, C. Food and Feeding Habits of the Red Mullet, Mullus Barbatus (Actinopterygii: Perciformes: Mullidae), off the Northern Tunisian Coast (Central Mediterranean). Acta Ichthyol. Piscat. 2011, 41, 109–116. [Google Scholar] [CrossRef] [Green Version]
  85. Çiçek, E.; Avşar, D. Population Parameters, Mortality and Exploitation Rates of European Hake, Merluccius Merluccius (Linnaeus, 1758) in Iskenderun Bay (Off Karatas Coasts, Adana). Ecol. Life Sci. 2010, 5, 146–154. [Google Scholar]
  86. Cartes, J.E.; Rey, J.; Lloris, D.; De Sola, L.G. Influence of Environmental Variables on the Feeding and Diet of European Hake (Merluccius Merluccius) on the Mediterranean Iberian Coasts. J. Mar. Biol. Assoc. UK 2004, 84, 831–835. [Google Scholar] [CrossRef] [Green Version]
  87. Halit, F.; Toğulga, M. Age and Growth, Reproduction and Diet of the Black Goby, (Gobius Niger) from Aegean Sea, Turkey. JFS.com 2009, 3, 245–265. [Google Scholar] [CrossRef]
  88. Gökçe, G.; Sangün, L.; Özbilgin, H.; Bilecenoglu, M. Growth and Mortality of the Brushtooth Lizardfish (Saurida Undosquamis) in Iskenderun Bay (Eastern Mediterranean Sea) Using Length Frequency Analysis. J. Appl. Ichthyol. 2007, 23, 697–699. [Google Scholar] [CrossRef]
  89. El-Etreby, S.; Saber, M.; El-Ganainy, A.; El-bokhty, A.-A. Age, Growth and Reproduction of the Lizard Fish Saurida Undosquamis from the Gulf of Suez, Red Sea, Egypt. Egypt. J. Aquat. Biol. Fish. 2013, 17, 25–34. [Google Scholar]
  90. Özyurt, C.E.; Yeşilçimen, H.Ö.; Mavruk, S.; Kiyağa, V.B.; Perker, M. Assessment of Some of the Feeding Aspects and Reproduction of S. undosquamis Distributed in the İskenderun Bay. Turk. J. Fish. Aquat. Sci. 2017, 17, 51–60. [Google Scholar]
  91. Cicek, E.; Avsar, D.; Yeldan, H.; Ozutok, M. Length–Weight Relationships for 31 Teleost Fishes Caught by Bottom Trawl Net in the Babadillimani Bight (Northeastern Mediterranean). J. Appl. Ichthyol. 2006, 22, 290–292. [Google Scholar] [CrossRef]
  92. Apostolidis, C.; Stergiou, K.I. Estimation of Growth Parameters from Published Data for Several M Editerranean Fishes. J. Appl. Ichthyol. 2014, 30, 189–194. [Google Scholar] [CrossRef]
  93. Taieb, A.H.; Sley, A.; Ghorbel, M.; Jarboui, O. Feeding Habits of Sparus Aurata (Sparidae) from the Gulf of Gabes (Central Mediterranean). Cah. Biol. Mar. 2013, 54, 263–270. [Google Scholar]
  94. Tserpes, G.; Tsimenides, N. Age, Growth and Mortality of Serranus cabrilla (Linnaeus, 1758) on the Cretan Shelf. Fish. Res. 2001, 51, 27–34. [Google Scholar] [CrossRef]
  95. Soykan, O.; İLKYAZ, A.T.; METİN, G.; Kinacigil, H.T. Growth and Reproduction of Brown Comber (Serranus Hepatus Linnaeus, 1758) in the Central Aegean Sea, Turkey. Turk. J. Zool. 2013, 37, 211–217. [Google Scholar] [CrossRef]
  96. Bilecenoglu, M. Growth and Feeding Habits of the Brown Comber, Serranus Hepatus (Linnaeus, 1758) in Izmir Bay, Aegean Sea. Acta Adriat. 2009, 50, 105–110. [Google Scholar]
  97. Özütok, M.; Avşar, D. Preliminary Estimation of Growth, Mortality and the Exploitation Rates of the Silverbelly (Leiognathus Klunzingeri Steindachner, 1898) Population from the Yumurtalık Bight, Northeastern Mediterranean Coast of Turkey. Turk. J. Fish. Aquat. Sci. 2004, 4, 59–64. [Google Scholar]
  98. Jayabalan, N. Food and Feeding Habits of the “ponyfish Leiognathus Splenden~” (f).Sces, Leiognathidae) from Porto Novo Coast. Indian J. Mar. Sci. 1991, 20, 157–160. [Google Scholar]
  99. Tsikliras, A.C.; Koutrakis, E.T. Growth and Reproduction of European Sardine, Sardina Pilchardus (Pisces: Clupeidae), in Northeastern Mediterranean. Cah. Biol. Mar. 2013, 54, 365–374. [Google Scholar]
  100. Sever, T.M.; Bayhan, B.; Taskavak, E. A Preliminary Study on the Feeding Regime of European Pilchard (Sardina Pilchardus Walbaum 1792) in Izmir Bay, Turkey, Eastern Aegean Sea. Naga 2005, 28, 41–48. [Google Scholar]
  101. Gücü, A.C.; Sakınan, S.; Karataş, E.; Ok, M.; Tüer, M.; Yalçın, E.; Örek, Y.A.; Bingel, F. Kuzeydoğu Akdeniz Küçük Pelajik Balık Stoklarındaki Değişimlerin Araştırılması; 108O566 Project Report; The Scientific and Technological Research Council of Turkey: Ankara, Turkey, 2011. [Google Scholar]
  102. Karachle, P.K.; Stergiou, K.I. Feeding and Ecomorphology of Three Clupeoids in the N Aegean Sea. Mediterr. Mar. Sci. 2014, 15, 9–26. [Google Scholar] [CrossRef]
  103. Pauly, D.; Soriano-Bartz, M.L.; Palomares, M.L.D. Improved Construction, Parametrization and Interpretation of Steady-State Ecosystem Models. In Trophic Models of Aquatic Ecosystems; ICLARM Conference Proceedings, 26, Christensen, V., Pauly, D., Eds.; ICLARM, WorldFish: Penang, Malaysia, 1993; pp. 1–13. [Google Scholar]
Figure 1. The location of the study in the Mediterranean Sea (denoted with a star in the map, located lower right) and sampling locations (black dots) in the Lamas marine region (larger map).
Fishes 08 00402 g001
Figure 2. The flow diagram of the Lamas region Ecopath model.
Fishes 08 00402 g002
Figure 3. PREBAL analysis of the input parameters for the Lamas region Ecopath model.
Fishes 08 00402 g003
Figure 4. Mixed trophic impact analysis of the Lamas region Ecopath model.
Fishes 08 00402 g004
Figure 5. Keystoneness analysis of the species and functional groups in the Lamas region Ecopath model.
Fishes 08 00402 g005
Figure 6. Lindeman spine graph showing energy flows (t/km2/y) originating from primary producers and detritus compartments and biomasses (t/km2) across trophic levels in the Lamas region Ecopath model.
Fishes 08 00402 g006
Table 1. Species and functional groups in the Lamas region Ecopath model.
Functional GroupSpecies and Taxa Included
DetritusSediment and water-column detritus
PhytoplanktonPlanktonic algae
ZooplanktonFodder micro- and mesozooplankton
Nemipterus randalliN. randalli
Other benthic invertebratesPhiline spp., Anseropoda placenta (Pennant, 1777); Echinaster (Echinaster) sepositus (Retzius, 1783); Pennatula phosphorea Linnaeus, 1758; Pennatula rubra (Ellis, 1764); Antedon spp.; Coscinasterias tenuispina (Lamarck, 1816)
Gastropoda
Bivalvia
PolychaetesAll taxa
CrabsPagurus prideaux Leach, 1815; Medorippe lanata (Linnaeus, 1767); Charybdis (Archias) longicollis Leene, 1938
Shrimps and prawnsPenaeus japonicus Spence Bate, 1888; Penaeus kerathurus (Forskål, 1775); Parapenaeus longirostris (Lucas, 1846); Squilla mantis (Linnaeus, 1758); Erugosquilla massavensis (Kossmann, 1880)
Octopuses, cuttlefish and squidsEledone moschata (Lamarck, 1798); Octopus vulgaris Cuvier, 1797; Sepia officinalis Linnaeus, 1758; Illex coindetii (Vérany, 1839); Loligo vulgaris Lamarck, 1798; Rhombosepion elegans (Blainville, 1827); Rhombosepion orbignyanum (Férussac, 1826);
Sepietta oweniana (d’Orbigny, 1841)
Pagellus erythrinus (Linnaeus, 1758)P. erythrinus
Pagellus acarne (Risso, 1827)P. acarne
Red mulletsMullus barbatus Linnaeus, 1758 and Mullus surmuletus Linnaeus, 1758
Merluccius merluccius (Linnaeus, 1758)M. merluccius
Gobius spp.Gobius bucchichi Steindachner, 1870; Gobius niger Linnaeus, 1758; Vanderhorstia mertensi Klausewitz, 1974
Saurida undosquamis (Richardson, 1848)S. undosquamis
Sea breams and porgiesBoops boops (Linnaeus, 1758); Dentex macrophthalmus (Bloch, 1971); Diplodus annularis (Linnaeus, 1758); Diplodus sargus (Linnaeus, 1758); Diplodus vulgaris (Geoffroy Saint-Hilaire, 1817); Lithognathus mormyrus (Linnaeus, 1758); Evynnis ehrenbergii (Valenciennes, 1830); Pagrus pagrus (Linnaeus, 1758); Sparus aurata Linnaeus, 1758; Spicara flexuosum Rafinesque, 1810; Spicara smaris (Linnaeus, 1758)
Serranus spp.Serranus hepatus (Linnaeus, 1758); Serranus cabrilla (Linnaeus, 1758)
LeiognathidaeEquulites elongatus (Günther, 1874); Equulites klunzingeri (Steindachner, 1898)
ClupeidaeDussumieria elopsoides Bleeker, 1849; Sardina pilchardus (Walbaum, 1792); Sardinella aurita Valenciennes, 1847; Sardinella maderensis (Lowe, 1838)
Engraulis encrasicolus (Linnaeus, 1758)E. encrasicolus
Horse mackerelsTrachurus mediterraneus (Steindachner, 1868) and Trachurus trachurus (Linnaeus, 1758)
Table 2. Relative diet composition by weight of N. randalli in the Lamas region.
GroupDiet ItemWeight (%)
CrustaceansSquilla spp.26.99
Charybdis longicollis10.95
Unidentified crabs8.53
Stamatopoda6.11
Penaeus japonicus4.26
Penaeus kerathurus2.95
Unidentified shrimps1.28
Unidentified crustaceans1.2
Macropthalmus spp.0.94
Penaeus spp.0.53
Alpheidae0.12
Other Decapoda0.09
FishClupea spp.12.32
Unidentified teleost fish8.93
Serranus hepatus4.49
Equulites elongatus2.53
Vanderhorstia mertensi1.78
Saurida undosquamis1.44
Sparidae1.12
EchinodermsOphiaderma longicaudum (Bruzelius, 1805)0.75
Anseropoda placenta0.11
Other Echinodermata0.02
OtherLophotrochozoa1.88
Digested organic material0.39
Endoparasites0.29
Table 3. Input and output (bold) parameters of the Lamas region Ecopath Model.
Group/SpeciesTrophic Level (TL)Biomass
(t km−2)
P/B (y−1)Q/B (y−1)EEP/QLandings
(Tonnes km−2 y−1)
By SeinersBy Trawlers
Phytoplankton17.75195.1 0.14
Zooplankton2.053.38521.992.180.430.24
N. randalli3.940.0370.947.780.450.12
Other benthic invertebrates2.035.4561.153.660.870.31
Polychaetes2.043.243.6116.930.850.21
Crabs2.940.6182.425.530.930.44 6.51 × 10⁻⁵
Shrimp and prawns2.910.2513.0911.270.950.27 0.016
Octopuses, cuttlefish and squids3.400.0612.6514.220.930.19 0.008
P. erythrinus3.480.0841.778.430.880.21 0.009
P. acarne3.040.1611.9410.690.830.18
Red mullets2.800.3151.239.890.890.12 0.013
M. merluccius4.510.0212.417.110.930.34 0.001
Gobius spp.3.060.361.6911.070.850.15 0.001
S. undosquamis4.160.0831.768.290.040.21 0.001
Sea breams and porgies3.410.2930.417.650.910.05 0.018
Serranus spp.3.630.0861.2810.210.960.13
Leiognathidae2.910.4080.9619.360.380.05
Clupeidae3.050.4471.2814.210.860.090.042
E. encrasicolus3.050.072.7312.230.840.220.001
Horse mackerels3.080.0951.6711.80.360.140.003
Detritus1105.35 0.11
Table 4. System summary statistics of the Lamas region Ecopath model.
ParameterValueUnit
Sum of all consumption423.93t/km2/year
Sum of all exports1270.62t/km2/year
Sum of all respiratory flows241.38t/km2/year
Sum of all flows to detritus1424.15t/km2/year
Total system throughput3360.08t/km2/year
Sum of all production1609.76t/km2/year
Total net primary production1512t/km2/year
Net system production1270.62t/km2/year
Total biomass (excluding detritus)23.22t/km2
Total biomass/total throughput (B/T)0.007year
Total primary production/total respiration (Pp/R)6.26-
Total primary production/total biomass (Pp/B)65.11/year
Transfer efficiency from primary producers5.77%
Transfer efficiency from detritus12.56%
Mean transfer efficiency (TE)9.77%
Connectance index0.30-
System omnivory index (SOI)0.13-
Shannon diversity index1.90-
Total catch0.11t/km2/year
Mean trophic level of catch (mTLc)3.14-
Gross efficiency (catch/net primary production)0.0001-
Mean trophic level of community (≥3.25)3.61-
Primary production required to sustain catches (PPRc)0.68%
Predatory cycling index (PCI)3.49%
Finn’s cycling index (FCI)2.24%
Finn’s mean path length (PL)2.22-
Ascendancy48.3%
Overhead51.7%
Capacity7954flowbits
Ecopath pedigree index0.63-
Table 5. Summary statistics for the Lamas region Ecopath model in comparison with other regions in the Mediterranean Sea.
IndicatorsThis StudyIsraeli Coast [17]Cyprus Coast
[16]
North Aegean Sea [10]Pagasitikos Gulf, Aegean Sea
[13]
Thermaikos Gulf, Aegean Sea
[12]
Saronikos Gulf, Aegean Sea
[14]
North Aegean Sea
[11]
North and Central Adriatic Sea
[55]
South Catalan Sea
[56]
Mersin Bay, Levant Sea
[18]
Mediterranean Sea
[39]
Unit
Year20192008–20122015.20172003–200620081998–20001998–200019931990s19942009–20132000s
Sum of all respiratory flows241.38--269.48486417571271.68421.09327.16254.63290t/km2/year
Sum of all flows to detritus1424.15--562.537618681297566.461387.46416.91292.121467t/km2/year
Total system throughput3360.08631.8984119762951318539251984.75384416571149.534000t/km2/year
Total net primary production1512--535.487129231243535.471149.85386.68368.651610t/km2/year
Net system production1270.62--265.99227506672263.80728.7659.52114.21320t/km2/year
Total biomass (excluding detritus)23.228.6918.7733.04784038.9433.98130.359.9923.4942.74t/km2
Total biomass/total throughput0.007--0.020.030.010.010.020.030.040.02-year
Total primary production/total respiration6.264.262.041.991.472.212.171.972.731.181.455.55-
Mean transfer efficiency9.771916.9317.4--14.77-1012.69.379.2%
Connectance index0.30-----0.3320.28-0.200.270.1-
System omnivory index0.130.190.230.180.250.20.230.240.190.190.160.27-
Total catch0.110.930.652.35--2.752.932.445.360.42-t/km2/year
Mean trophic level of catch3.143.373.253.47--3.363.473.073.123.293.08-
Gross efficiency (catch/net primary production)0.0001--0.004--0.0020.010.0020.00140.0010.00026-
Primary production required to sustain catches0.6811.347.073.45--4.66-6.599.456.791.46%
Predatory cycling index3.49-----14.77-3.973.333.6710.96%
Finn’s cycling index2.245.789.314.6--12.53-14.725.1910.094.98%
Finn’s mean path length2.222.633.21---3.121-5.414.27---
Ascendancy48.3--21.6--24.5-2725.524.3242.9%
Overhead51.7--78.4--75.5-7374.575.6657.1%
Capacity7954--9162.5--15,785-15,406.77119.34773.98-flowbits
Ecopath pedigree index0.630.540.620.610.530.530.65-0.660.670.63--
Disclaimer/Publisher’s Note: The statements, opinions and data contained in all publications are solely those of the individual author(s) and contributor(s) and not of MDPI and/or the editor(s). MDPI and/or the editor(s) disclaim responsibility for any injury to people or property resulting from any ideas, methods, instructions or products referred to in the content.

