Article

Antimicrobial Effects of Plasma-Activated Simulated Seawater (PASW) on Total Coliform and Escherichia coli in Live Oysters during Static Depuration

1
Department of Biological and Agricultural Engineering, North Carolina State University, Raleigh, NC 27695, USA
2
Department of Food, Bioprocessing and Nutrition Sciences, North Carolina State University, Raleigh, NC 27606, USA
*
Author to whom correspondence should be addressed.
Fishes 2023, 8(8), 396; https://doi.org/10.3390/fishes8080396
Submission received: 30 June 2023 / Revised: 22 July 2023 / Accepted: 26 July 2023 / Published: 31 July 2023
(This article belongs to the Section Processing and Comprehensive Utilization of Fishery Products)

Abstract

:
Recently, our in vitro study on the effects of plasma-activated simulated seawater (PASW) demonstrated its potential as a novel, alternative disinfectant in oyster depuration. In this current study, PASW’s physicochemical and antimicrobial properties were identified and its effects on oyster quality were observed. Simulated seawater (SS) activated by plasma for 10 min (PASW10) increased in temperature, oxidation reduction potential, and electrical conductivity with a decrease in those parameters after 1:1 dilution with SS (PASW10 (1:1)). The pH decreased immediately after plasma activation and subsequently increased after dilution. Nitrate and nitrite concentrations were higher in PASW10 (1:1) compared to PASW10 (3:1). No free available chlorine was detected in undiluted PASW10. Processing using SS and PASW10 (1:1) depuration and refrigeration of E. coli-bioaccumulated oysters was observed. Significantly higher reductions in total coliform and E. coli were noted for PASW10 (1:1) treated oyster samples after 24 h compared to refrigerated samples. No significant differences in values for condition index or biting force of oyster meats were observed for the processed samples after 24 h. Overall, the novel and environment-friendly PASW could be used as an alternative antimicrobial disinfectant in oyster depuration systems because it does not negatively affect an oyster’s viability or quality.
Key Contribution: PASW is a novel and environment-friendly alternative disinfectant that could possibly be used in oyster depuration. The application of PASW during depuration could support microbiologically safer raw oysters for human food products.

Graphical Abstract

1. Introduction

Non-thermal plasma-activated liquids have been investigated extensively recently for applications in medical, food, and agricultural industries [1,2,3,4,5,6,7,8,9,10,11,12]. These solutions are created as a result of the chemical reaction between non-thermal atmospheric plasma (partially ionized gas at atmospheric pressure) and the adjacent liquid [5,13]. Due to the absence of chemical residue and negative environmental impact, plasma-activated water (PAW) has been observed as a candidate for use as a sanitizer on food surfaces, food preparation surfaces, and processing equipment [2,14,15]. Studies showed PAW can be used in various steps of the food production process such as pre-harvest and post-harvest processing [16,17,18]. PAW also offers diversity in modes of application, as it can be utilized as a dip, spray, droplet, or in larger volumes of standing solution [19,20,21,22]. Previous studies explained the benefits and drawbacks of PAW on foods [5,23].
Although PAW has been broadly applied to many different foods, studies examining its use on seafood are still lacking and the opportunity for more information still exists [24]. Moreover, oysters and other bivalve molluscan shellfish often undergo a process called depuration that can reduce endogenous bacteria and viruses by exploiting the organism’s filtering process in a clean seawater environment. Additionally, to maintain freshness, many aquatic organisms are kept alive in tanks of seawater before processing to delay the rigor mortis stage [25]. Thus, non-thermal plasma applied to natural and simulated seawater could be useful for the extension of good oyster quality.
Our previous study reported that plasma-activated simulated seawater (PASW) could possibly be utilized as a disinfectant for live seafood because of its ability to inactivate pathogens in simulated seawater (SS) solution in vitro [11]. However, the study lacked evidence to support the benefits of this claim as the effect of PASW on oyster mortality was not studied [11]. One study, however, described the non-fatal and non-toxic effects of orally-administered PAW in live, immunodeficient mice for safety purposes, thus providing promise for PASW use on live oysters [26]. The PAW used in their study was generated by treating water for 15 min with a dielectric barrier discharge plasma instrument [26].
To continue our investigation of the antimicrobial ability of the novel PASW, an in vivo study in live oysters was conducted. Similar to our previous study, plasma treatment of SS produced very acidic PASW solutions, so in order to prevent premature mortality, the PASW was diluted (which increased the pH). The objectives of this present study were to first determine the physicochemical properties of diluted PASW and the concentrations of key reactive nitrogen species in the solution. Second, the impact of PASW on oyster viability was observed and the microbial inactivation efficacy of diluted PASW on total coliform and E. coli in live oysters was analyzed in a laboratory bench-scale, static depuration. Finally, quality indicators such as condition index and biting force helped quantify the effects of PASW depuration treatment on the oysters.

2. Materials and Methods

2.1. Preparation of Simulated Seawater (SS)

Simulated seawater (SS) was prepared in a manner similar to our previous study [11]. SS was prepared using Crystal Sea® Marinemix, (Marine Enterprises International, LLC., Baltimore, MD, USA) a proprietary brand synthetic sea salt containing sodium chloride among other trace elements and minerals (e.g., aluminum, manganese, nickel, and molybdenum) in deionized (DI) water. All SS used in this study was 31 ppt to match the water conditions used to grow the oysters and to prevent shocking the animals. SS was kept at room temperature (~22.0 ± 2 °C) unless noted otherwise.

2.2. Plasma Generator Setting and Plasma-Activated Simulated Seawater (PASW) Generation

Plasma-activated simulated seawater (PASW) was prepared in a similar fashion to our previous study with some modifications [11] using an FG5001 plasma generator and RD1004 Openair Jet (Plasmatreat USA, Inc. Heyward, CA, USA). For instance, the plasma nozzle was 3.5 cm above the surface of the 400 mL SS sample to prevent the nozzle from coming into direct contact with the SS. Additionally, the SS was treated with plasma for 10 min and thus denoted as PASW10 (plasma-activated simulated seawater with 10 min treatment time). Due to the high velocity of the plasma jet above the solution, the solution occasionally splashed out of the 1000 mL beaker. To make PASW10 (3:1), 150 mL of the PASW10 solution was mixed with fresh, room temperature SS (450 mL) to make a total of 600 mL. This diluted PASW10 was cooled for about 10 min (final temperature 24 °C). Likewise, out of the 400 mL treated PASW10 solution, 300 mL was mixed with 300 mL fresh refrigerated SS to make 600 mL total solution. This solution was denoted as PASW10 (1:1). The volume of the total PASW10 (1:1 and 3:1) solutions was raised to 600 mL to cool the liquid immediately after plasma activation, to slightly raise the pH of the PASW10 to prevent early oyster mortality, and to ensure the solution would sufficiently submerge the live oysters.

2.3. Analysis of Physicochemical Properties of Diluted PASW10

The physicochemical properties of diluted PASW such as temperature, oxidation reduction potential, electrical conductivity, and nitrate and nitrite concentrations were measured as previously reported [11]. The temperature of the solution sample was measured using a digital thermometer probe (Fisherbrand™ Traceable™, Waltham, MA, USA) placed in the middle and center of the PASW and control solutions. Oxidation reduction potential and pH of the solution were measured using a benchtop pH probe (Thermo Scientific™ Orion Star™ A211, Waltham, MA, USA). Electrical conductivity was measured using a portable electrical conductivity probe (Thermo Scientific™ Orion Star™ A325, Waltham, MA, USA).
Nitrate and nitrite concentrations were measured according to the method developed by Miranda et al. (2001) [27]. After the SS was activated by the plasma for 10 min and diluted (1:1 and 3:1), the total nitrate and nitrite concentration (mM) of the sample was determined by transferring 100 µL aliquots of the PASW sample to a 96-well, clear plate. Next, in rapid successive order, 100 µL aliquots of vanadium (III) chloride (VCl3) (0.8 g/dL in 1 M HCl) were transferred to each well, then 50 µL sulfanilamide (SULF) (0.1% in DI water) and 50 µL N-(1-Naphthyl)ethylenediamine dihydrochloride (2% in 5% HCL). After 30 min incubation, absorbance was measured using a spectrophotometer (Thermo Scientific™ Multiskan EX, Waltham, MA, USA) set to 540 nm. Nitrite absorbance was determined in a similar fashion excluding VCl3. Concentrations of total nitrate and nitrite, in addition to nitrite alone, were determined by referring the sample absorbance to their corresponding dilution factor and standard curve data. Nitrate concentration was obtained by subtracting the nitrite concentration value from the total nitrate and nitrite concentration value.
These properties were measured in the SS before activation with the plasma (control), immediately after plasma activation, and after plasma activation and dilution. Free available chlorine in the diluted PASW10 solutions was measured according to the instructions included in a chlorine kit (CHEMets® visual test kit, CHEMetrics, Midland, VA, USA). The minimum detection limit for free available chlorine was 10 ppm.

2.4. Oyster Preparation

About 80 aquacultured Eastern oysters, Crassostrea virginica, were obtained from the Bogue Sound in Morehead City, North Carolina, in June 2022, courtesy of the North Carolina Shellfish Mariculture Demonstration Center at Carteret Community College and North Carolina State University (NCSU) Center for Marine Sciences and Technology. Oysters were stored on ice (<10 °C) during transport from the coast. Before oyster conditioning, oysters were scrubbed under room temperature tap water to remove fouling organisms. About 13 oysters each were held in six tanks in about 5 L of SS and were fed a microalgae solution mix (5 mL) containing Isochrysis, Pavlova, Tetraselmis, and Thalassiosira weissflogii and pseudonana (Shellfish diet 1800®, Reed Mariculture Inc., Campbell, CA, USA) daily until experimentation for about four days. Some oysters died after transport and after oyster conditioning. Upon retrieval for microbial and quality testing, the average mass, length, and width of oysters were recorded.

2.5. Bacterial Culture Preparation and Bioaccumulation in Oysters

Two strains of E. coli (ATCC 700728™ and ATCC 33625™) were used in this study. Stock cultures stored at −80 °C were revived after streaking on separate tryptic soy agar (TSA, BDTM, Franklin Lakes, NJ, USA) plates stored at 4 °C for less than four weeks until use. To increase the inoculum concentration, a modified method from the U.S. Environmental Protection Agency was used [28]. Upon testing, cultures were enriched in two separate 15 mL centrifuge tubes with 10 mL of tryptic soy broth (TSB, BDTM, Franklin Lakes, NJ, USA) in an incubator set to 37 ± 1 °C overnight (20–24 h). The enriched culture of O157:H7 was then streaked on 12 TSA plates and the ATCC 33625™ was streaked on another 13 TSA plates. The 25 plates were incubated overnight at 37 ± 1 °C. Sterile, buffered peptone water (BPW, 5 mL) was added to each plate, and sterile, L-shaped spreaders were used to gently resuspend the colonies in the BPW. The resuspended colonies were combined into about seven centrifuged tubes each, for O157:H7 and ATCC 33625™. The tubes were then centrifuged at 1300 rpm at approximately 4 °C for 15 min. The resulting pelleted cells were resuspended in 5.2 L of SS for oyster bioaccumulation. This volume of SS allowed for total submergence of oysters in the water.
After about 10 min, a water sample was collected and 1:10 serial dilutions were performed in sterile deionized water. Diluted water samples were plated in duplicate on E. coli/Coliform count Petrifilm (3M™, St. Paul, MN, USA). Petrifilms were held for about 20–24 h in an incubator set to 37 ± 1 °C. Colony-forming units (CFUs) were expressed as log CFU/mL. Oysters were left for 72 h to bioaccumulate suspended E. coli inoculum in a tank with two air stones. After the bioaccumulation period, another water sample was retrieved from the tank and the aforementioned dilution and plating was repeated to determine concentrations of coliform and E. coli after bioaccumulation and at the start of the depuration process. This step also served the purpose of ensuring the bacterial strains were still viable after 72 h.

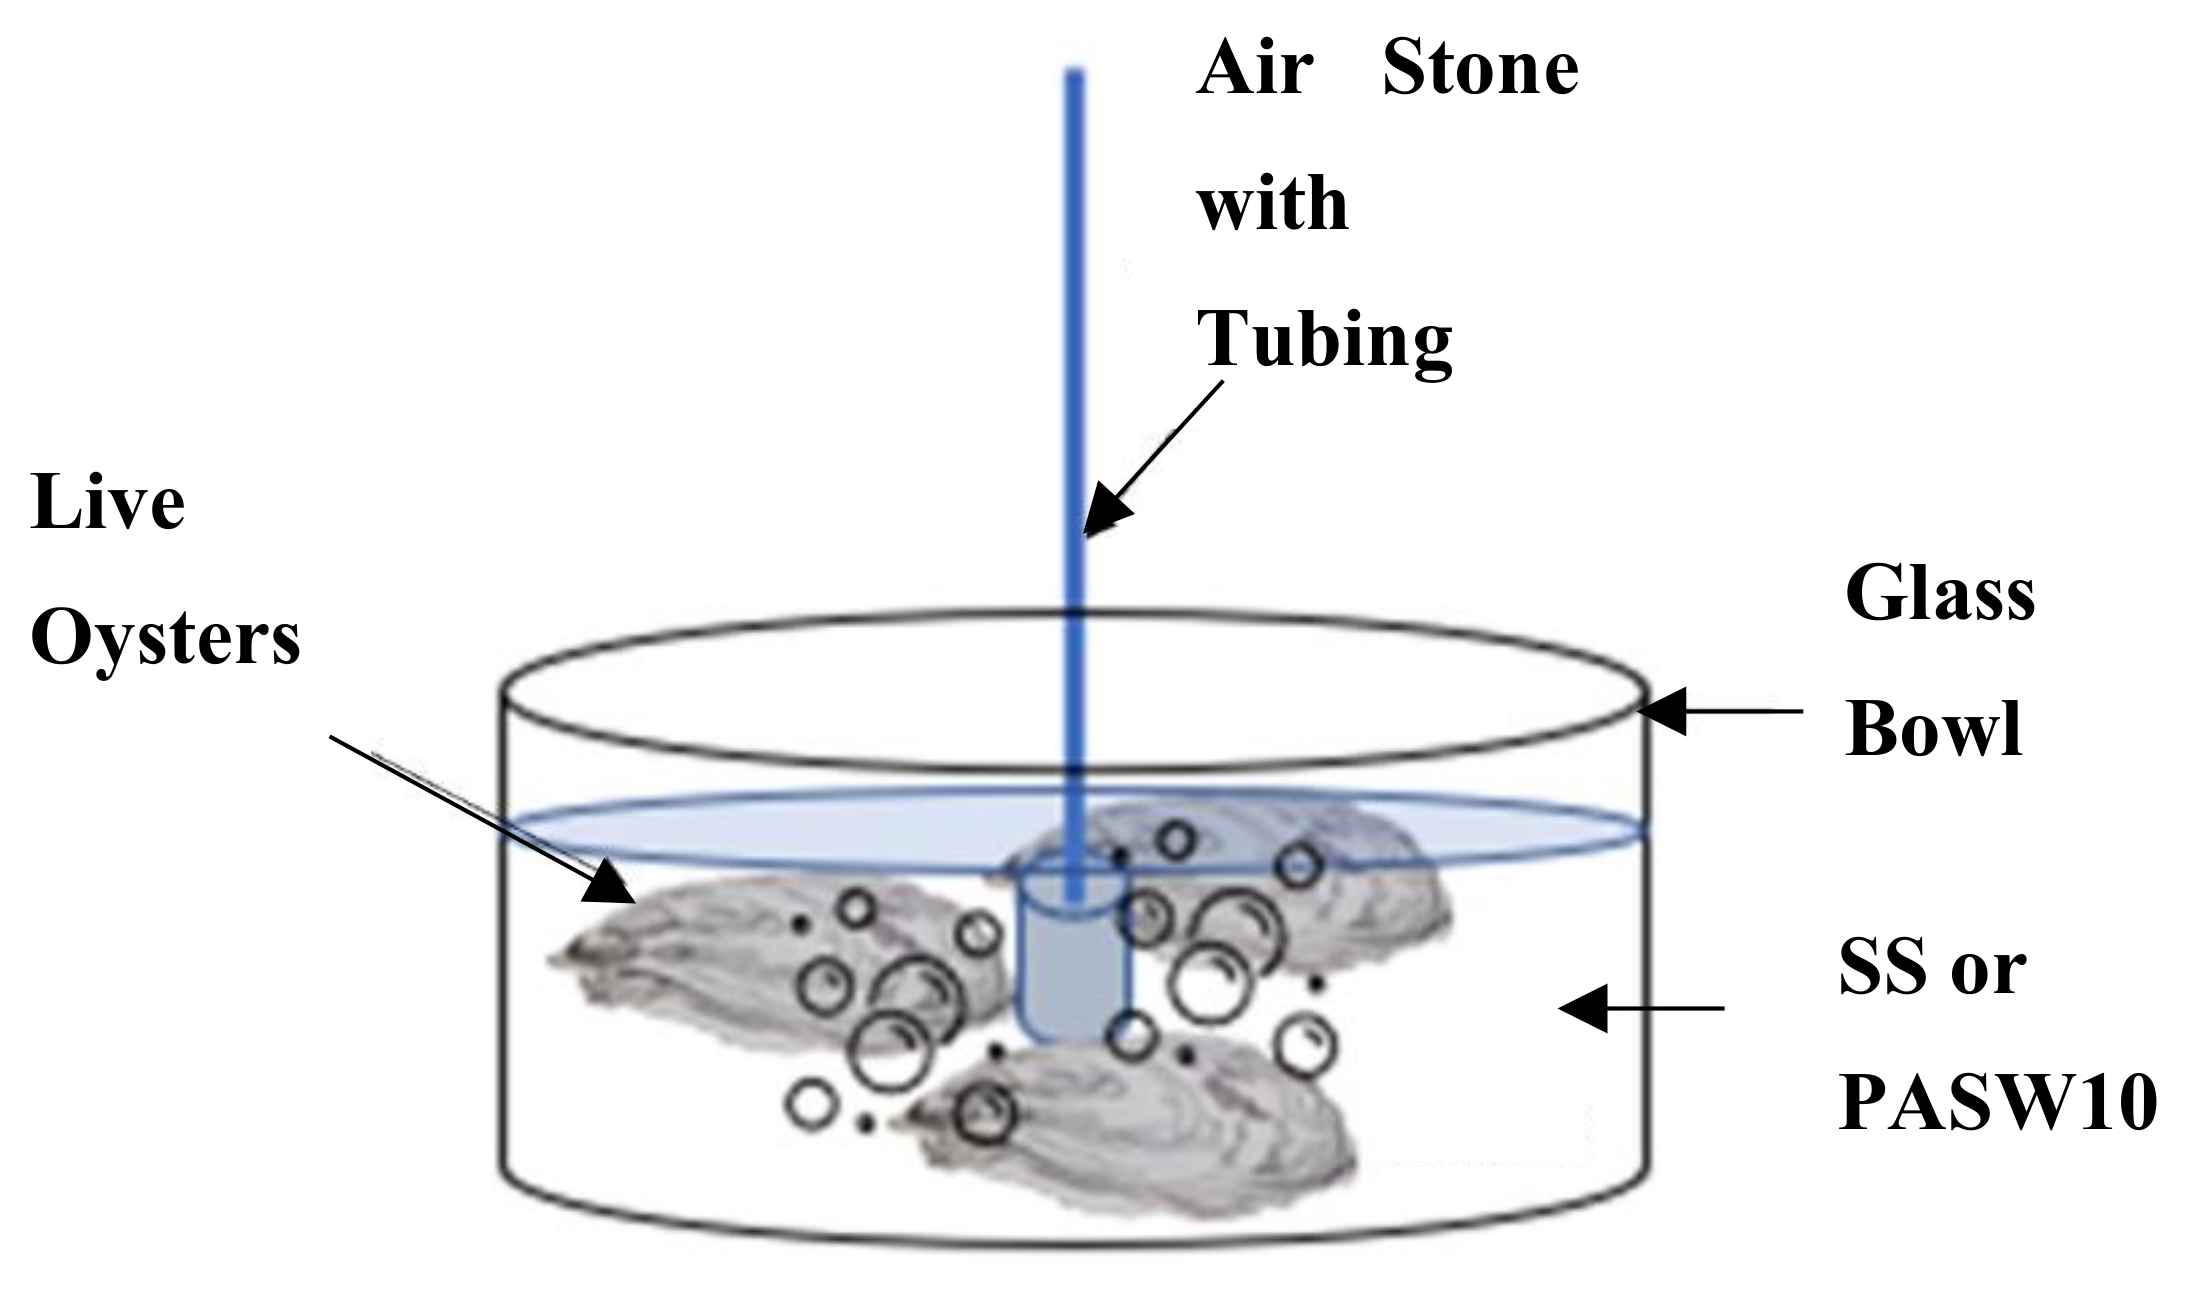
2.6. Depuration Setup and Processing

Six glass bowls were set up to function as static depuration systems (Figure 1). Each bowl held up to three oysters and 600 mL of either SS or PASW10. Each system was equipped with one air stone to provide air to the depurating oysters. After physicochemical testing it was found that PASW10 (1:1) had a slightly higher temperature, lower pH, higher oxidation reduction potential, electrical conductivity, and nitrate and nitrite concentrations compared to PASW10 (3:1). As a result of the increased antimicrobial potential of PASW10 (1:1), this particular dilution was used to conduct the depuration and quality experiments. After plasma activation in a 1000 mL beaker, 300 mL of PASW10 was added directly to the bowl of oysters and 300 mL of cooled SS was added immediately after to prevent oyster mortality. After 1 and 3 h, the used PASW10 (1:1) was discarded and newly prepared PASW10 (1:1) was added to the system as previously mentioned. Depuration took place over 24 h. Other oysters were put in an open plastic container on damp paper towels and were left undisturbed at the bottom of a refrigerator at 5 °C during the processing period. Refrigerated and SS depurated oysters served as controls.

2.7. Determination of Microbial Inactivation Efficacy of PASW10 (1:1) against Total Coliform and E. coli in Oysters

Microbial tests were conducted over the 24 h oyster processing period at intervals 0, 1, 3, and 24 h for all treated oysters. Refrigeration processing followed the same pattern of oyster sampling. At the aforementioned time intervals, treated oysters were gathered and shucked in an aseptic manner. One oyster was treated at a time and a total of three oysters were used per time interval for each treatment. Oyster meat was transferred to a sterile Whirl-Pak® homogenizer blender filter bag and weighed. A 1:10 dilution was made by adding sterile BPW to the oyster meat. The diluted oyster sample was placed in a paddle blender (Seward™ Stomacher™ Model 80 Biomaster Blender 110V, Worthington, West Sussex, UK) set to the normal setting for 120 s. After blending, 1:10 serial dilutions in sterile deionized water were performed and aliquots of sample were plated in duplicate on E. coli/Coliform count Petrifilm (3M™, St. Paul, MN, USA). Petrifilms were held overnight (20–24 h) in an incubator set to 37 ± 1 °C. Total coliform and E. coli colonies were counted and expressed as log CFU/g of oyster meat.

2.8. Oyster Quality Testing

Condition index and biting force tests were measured as indicators of overall oyster quality. To reduce variability between samples, oysters were sorted and weighed and oysters within the same weight ranges were used per treatment. Oyster quality measurements were conducted at the beginning (0 h) and end (24 h) of processing in a separate experiment from microbiological testing. One oyster was treated at a time and a total of three oysters were used for each treatment. Refrigerated, SS depurated, and PASW10 (1:1) oysters used in quality tests were not inoculated with bacteria prior to experimentation. Biting force analyses were conducted using a TA.XTPlus texture analyzer (Stable Micro Systems, Godalming, Surrey, UK). The load cell used was 5 kN. A knife blade with a 45° chisel end was used as the shear fixture. Shucked oyster meat was positioned perpendicular to the knife blade on a TA-90 heavy duty platform with an aluminum plate with the thickest part of the oyster’s ventral side directly under the blade. Exponent Stable Micro Systems software (Version 6.1 Build 10 Issue 0, Godalming, Surrey, UK) was used to plot peak force (N) over time (s). The test speed was set to 1.0 mm/s and distance was 1.0 mm, enough for the blade to touch the platform. Values for peak force were recorded per sample.
Condition index testing for the treated oysters followed the procedure described by Larsen et al. (2013) and Lawrence and Scott (1982) [29,30]. Whole wet oysters, alive in the shell, were weighed and their mass was recorded. After shucking, oyster meats were placed in a convection oven (Precision Scientific 25EM, Chicago, IL, USA) set to 80 °C for 48 h. Oyster shells were left to air dry at room temperature (~22.0 ± 2 °C) for 48 h. After drying, both oyster meat and shells were weighed. Using the study by Larsen et al. (2013), condition index was calculated using Equation (1):
O y s t e r s   d r i e d   t i s s u e   w e i g h t ( O y s t e r s   w h o l e   w e t   w e i g h t O y s t e r s   d r i e d   s h e l l   w e i g h t )   ×   100 = C o n d i t i o n   I n d e x

2.9. Data Analysis

Experiments were performed in triplicate. Statistical analysis of data was performed using Tukey’s honest significance difference test (α = 0.05) and one-way analysis of variance in R Project for Statistical Computing software version 3.6.3 [31].

3. Results

3.1. Physicochemical Properties of PASW10 (3:1 and 1:1)

Values for the physicochemical properties of PASW10 3:1 and 1:1 are shown in Table 1. For PASW10 (3:1), the temperature of SS increased immediately after activation with plasma but decreased after cooled SS was added to dilute the PASW10 solution. Similarly, values for oxidation reduction potential and conductivity followed the same trend before activation, immediately after activation, and upon the addition of SS diluent. Values for pH, however, began in the basic region at 9.06 for SS and were reduced to the acidic region at 2.93 after plasma activation. After dilution with SS, pH was 5.49.
Within treatments for PASW10 (3:1), all temperature, oxidation reduction potential, conductivity, and pH values were significantly different. Likewise, values for temperature, oxidation reduction potential, and conductivity increased and decreased after plasma activation and dilution, respectively. The value of pH decreased and increased after plasma activation and dilution, respectively. Within treatments for PASW10 (1:1), all values for temperature, oxidation reduction potential, conductivity, and pH were significantly different. When comparing PASW10 (3:1) to PASW10 (1:1), significant differences between the two treatments were observed in temperature and oxidation reduction potential values immediately after plasma activation and after dilution with SS, respectively. When comparing the pH values of PASW10 3:1 and 1:1, all values were significantly different before activation, after plasma activation, and after dilution. Conductivity values were only significantly different immediately after plasma activation for both PASW10 3:1 and 1:1.
Reactive nitrogen species such as nitrate and nitrite generated in PASW10 (3:1 and 1:1) and an SS control are given in Table 2. The values for nitrate and nitrite concentrations for PASW10 (1:1) were higher than those of PASW10 (3:1). All values for nitrite and nitrate concentrations were significantly different for all treatments and the control. No free available chlorine was detected in either PASW10 3:1 or 1:1.

3.2. Oyster Physical Properties and Mortality

A total of 43 oysters were used in the experiment owing to mortality before experimentation and after bioaccumulation (Table 3). After bioaccumulation, of the 43 oysters, the average mass was 32.9 g, length was 5.57 cm, and width was 3.30 cm. Three oysters perished after conditioning in the 31 ppt oyster tanks before experimentation, possibly due to weakness and being in an unfamiliar environment.

3.3. Bacteria Bioaccumulation in Oysters

At the start of bioaccumulation in the oysters, concentrations of total coliform and E. coli in the SS were 7.91 ± 0.0 and 7.83 ± 0.0 log CFU/mL, respectively. After 72 h of bioaccumulation in the oysters, concentrations of total coliform and E. coli in the SS were reduced to 3.85 ± 0.1 and 3.62 ± 0.0 log CFU/mL, respectively. The lower concentration of bacteria may have possibly hinted at the uptake of E. coli in the oysters.

3.4. Microbial Inactivation Efficacy of PASW10 (1:1) against Total Coliform (TC) and E. coli (EC) in Oysters

The initial total coliform (TC) count at hour 0 was 5.6 ± 0.4 for all treatments with no significant differences across treatments (Figure 2a). After hour 1, TC counts were 5.2 ± 0.4, 5.6 ± 0.4, and 4.3 ± 2.6 log CFU/g for refrigerated, SS, and PASW10 oyster samples, respectively. No significant differences were observed across treatments. TC counts were 6.2 ± 0.8, 5.0 ± 1.6, and 3.7 ± 1.9 log CFU/g for refrigerated, SS, and PASW10 oyster samples, respectively, after hour 3 with no significant differences. Lastly, after 24 h, TC counts were 5.4 ± 0.2, 4.8 ± 0.2, and 4.7 ± 0.2 log CFU/g oyster for refrigerated, SS, and PASW10 samples, respectively. After 24 h of processing, the TC in oysters were reduced by 0.2, 0.8, and 0.8 log CFU/g in refrigerated, SS, and PASW10 samples, respectively. Significant differences were observed for SS and PASW10 samples compared to the refrigerated samples. Across the 24 h period, the highest reductions in TC were observed in PASW10 treated oysters.
The initial E. coli (EC) count was 6.2 ± 0.0 log CFU/g for all treatments at hour 0 treatments with no significant differences across treatments (Figure 2b). After hour 1, EC counts were 5.3 ± 0.4, 6.4 ± 0.3, and 6.1 ± 0.7 log CFU/g for refrigerated, SS, and PASW10 oyster samples, respectively, with no significant differences across treatments. EC counts were 7.1 ± 1.6, 6.1 ± 0.5, and 4.6 ± 2.0 log CFU/g for refrigerated, SS, and PASW10 oyster samples, respectively, after hour 3 with no significant differences across treatments. Lastly, EC counts were 5.6 ± 0.2, 5.1 ± 0.3, and 4.8 ± 0.1 log CFU/g oyster for refrigerated, SS, and PASW10 samples, respectively, after 24 h of processing. Again, significant differences were observed for SS and PASW10 samples compared to the refrigerated samples. After 24 h, EC concentrations were ultimately reduced by 0.6, 1.1, and 1.4 log CFU/g oyster for refrigerated, SS, and PASW samples, respectively, when compared to hour 0 samples. Across the 24 h period, the highest reductions in EC were observed in PASW10 treated oysters. At the end of processing, there were no oyster mortalities for all treatments.

3.5. Oyster Quality

Condition indices of oysters before and after depuration and refrigeration processing are shown in Table 4. After 24 h of processing, oysters that underwent SS depuration retained the highest condition index value (a higher condition index is most desirable). Refrigeration, SS depuration, and PASW10 depuration experienced condition index reductions of 1.86, 0.36, and 2.16, respectively. Overall, however, there were no significant differences between processing treatments.
Biting force values, recorded as peak force, for oysters before and after processing treatment are presented in Table 5. After 24 h, peak force values of oyster meats were greatest as a result of refrigeration. Following refrigeration, peak force values were increased in PASW10 depuration samples, then SS depuration samples when compared to the control. No significant differences were observed among processing treatments or the control, however.

4. Discussion

4.1. Physicochemical Properties of PASW10 (3:1 and 1:1)

Increases in temperature, oxidation reduction potential, and conductivity, and nitrate and nitrite concentration of SS immediately after plasma activation and a decrease in pH after the creation of PASW were similar to the chemical mechanisms and results from our previous in vitro study [11]. These physicochemical trends were also similar to other studies that applied plasma to phosphate-buffered saline and saline solutions [32,33,34]. Unlike the study by Baek et al. (2020), which used a 0.9% w/v NaCl plasma-activated solution and generated 0.54–0.58 mg/L of free available chlorines, none were generated in our study. This could be the result of reactions between the various minerals (e.g., aluminum, nickel, etc.) in the proprietary synthetic sea salt brand used in this study. In addition, the method of detection limit may have been too high at 10 ppm, so another method of detection may need to be used in the future. The increased concentrations of nitrate and nitrite after plasma activation compared to the PASW in vitro study could be due to the increased volume of SS used to create PASW in this work [11]. While the increased nitrate and nitrite in PASW10 (1:1) offered antimicrobial benefits, careful consideration was taken when generating these reactive nitrogen species. Nitrite concentrations close to 20 mM affected oyster pumping in a previous study, but did not kill the oysters [35]. While concentrations in this study did not reach the aforementioned level, in a future scaled up system, this challenge would need to be considered for effective depuration processing. Likewise, nitrate species should not harm oysters as long as they are below 186 mM, as demonstrated in a previous study [35].

4.2. Oyster Physical Properties and Mortality

Prior studies have demonstrated low cumulative mortality of oysters held at about room temperature seawater and a moderate salinity of 15 ppt or lower, so the increased salinity in this study may have contributed to oyster mortality (about 7%) alone before processing [36,37]. Out of the total 43 oysters used in testing, no oysters perished after processing.

4.3. Bacteria Bioaccumulation in Oysters

E. coli (ATCC 11303) was used to inoculate natural seawater pumped in from the Bogue Sound, NC, USA, for uptake in Crassostrea virginica oysters sourced from the sound in a previous study [38]. Initial E. coli concentration in the seawater was about 9 log CFU/mL, slightly higher than the approximately 8 log CFU/mL concentration in our study [38]. This could possibly be due to the varying seawater conditions. In the study by Love et al. (2010) water salinity was 28 ppt compared to 31 ppt used in this study [32].

4.4. Microbial Inactivation Efficacy of PASW10 (1:1) against Total Coliform (TC) and E. coli (EC) in Oysters

The microbial reduction trend for TC in oysters demonstrated a slight decrease in the refrigerated sample and increases in the SS and PASW10 samples after 1 h. After 3 h, TC concentration in the refrigerated and SS sample increased, while the PASW10 decreased. After 24 h, all samples demonstrated decreases in TC with PASW10 yielding the greatest reduction in TC in the depurating oysters. After 1 h, the slight decrease in TC in the refrigerated samples could be due to the inhibition of TC proliferation because of the 5 °C storage condition; this effect was similar a previous study [39]. The increase in TC in SS and PASW10 samples could be due to the effects of the room temperature water in SS and slightly higher temperature of the PASW10 solution. Further, the salt in the PASW solution combined with the higher temperature could have provided an iso-osmotic barrier around the bacterial cells to insulate them from cellular destruction [40,41]. After 3 h, the increase in TC in the refrigerated and SS samples could follow this same pattern as the samples at 1 h and has been noted before in a study examining coliform after high pressure processing treatment and storage at 2–4 °C over time [42]. It should be noted that oysters in depurated treatments were observed to open their valves after being left undisturbed, which might suggest their filtering resumption. However, nitrate and nitrite are short-lived reactive species and decreases in nitrite concentration and lessened antimicrobial efficacy against E. coli and L. innocua over 60 min at 22 °C were noted in a PAW study [2]. A similar reduction trend was observed in EC bioaccumulated oyster samples over the 24 h period.
Replacing the PASW10 treatment at 1 and 3 h with fresh treatment seemed to slow TC and EC growth over time, especially by 24 h compared to refrigerated treatment. While reductions in TC and EC were greater in PASW10 treated oysters after 24 h, they were not significantly different from SS treated oysters. In a study by Ren and Su, depurated oysters treated with electrolyzed oxidizing water containing 1% NaCl every hour, significantly reduced inoculated Vibrio vulnificus and Vibrio parahaemolyticus after 4 h when compared to 0 h [41]. However, past 4 h and up to 8 h, no significant changes were demonstrated in their study. The authors hypothesized that while the salt may encourage the filtering mechanism in the oysters, it may have also decreased the antimicrobial ability of the electrolyzed oxidizing water. The authors also mentioned that the particular group of oysters may not have been immediately active when resuming their filtering process, which contributed to a longer period for the reduction of Vibrio in the oysters. This possibility could be the same in our study since the SS and PASW10 depurated oysters’ highest reductions appeared after the 24 h process and were not significantly different from each other. If the oysters in our study were not immediately pumping in and out the PASW10 water, the reactive nitrogen species, oxidation reduction potential, electrical conductivity, lowered pH, and other short-lived species may have dissipated over time as demonstrated in the PAW storage study by Wang and Salvi [2]. In order to fully inactivate any bacteria, the PASW10 treatment solution needed to be circulated through the intestines of the oyster [41]. If the oysters were initially inactive upon the introduction of the PASW10 treatment, this may have contributed to the reduced inactivation of TC and EC in the oysters over time when compared to the SS treatment.
Nevertheless, these results were comparable to a study that determined the reduction in EC in oysters during depuration after environmental contamination [43]. Their recirculating depuration system consisted of a 39 W ultra-violet sterilizer with a sand filter that fed 400 L of seawater held at a temperature ranging from 11.2–12.8 °C and salinity ranging from 32.4–33.4 ppt into a tank at 10 L/min. After 24 h of depuration, EC counts in Crassostrea gigas oysters were reduced by 1.1 log MPN/100 g [43]. In another study, Crassostrea madrasensis oysters in a static depuration system with 200 L seawater at a pH of 8.1, salinity of 32.5, and temperature of 30.3 °C were measured to quantify microbial reductions in TC and EC after a 48 h period [44]. Static depuration took place either near the surface of the water or at the tank’s bottom. For TC counts after 24 h, reductions were 1.98 and 0.57 log MPN/g oyster at the surface and bottom, respectively. For EC counts after 24 h, reductions were 2.28 and 1.32 log MPN/g oyster at the surface and bottom, respectively. Significant differences in TC and EC microbial reduction were only noticed up to 24 h and not at 36 or 48 h [44].
Considering the novelty of this study, these results and preliminary results can provide a basis for future studies of PASW-oyster depuration efforts (Supplementary Figure S1). However, a few studies have examined cold atmospheric plasma applied directly to oyster meat [45,46]. In the study by Csadek et al. (2021), their cold atmospheric plasma treatment inactivated enveloped RNA virus in blended oyster meat slurry. EC counts in untreated, shucked oyster controls were ~5–6 log CFU/g in the study by Choi et al. (2022). After treatment for 10 min with dielectric barrier discharge, non-pathogenic EC and EC O157:H7 were reduced by 0.31 and 0.18 log CFU/g, respectively. While the aforementioned studies only treated the surfaces of the oysters unlike in our study, both the antimicrobial effects of cold atmospheric plasma and PASW were attributed to radical species such as reactive nitrogen species, lowered pH, reactive oxygen species, and other short-lived reactive chemical species creating perforations in the cell membrane of the bacteria [47].
In the future, freshly generated PASW10 treatment should be introduced at more frequent time intervals to increase contact time with the oysters and hopefully allow the oysters to comfortably resume their filtering processes. This method could lead to increased reductions in endogenous bacteria. In addition, static depuration processing at colder temperatures (<20 °C) could act as an additional hurdle in reducing bacteria in oysters.

4.5. Oyster Quality

A higher condition index value is indicative of a greater amount of oyster meat in the shell and a generally healthy oyster [48]. Since the oysters used in this experiment were small in size, condition indices were smaller than larger oysters in a previous study [29]. However, these results followed a similar trend in relation to former oyster depuration studies in which condition indices were reduced but not significantly different after processing [29,49,50,51]. Even in depuration trials where oysters were fed, condition index values after processing were not significantly different from values before processing [50]. Ruano et al. (2012) noted that higher glycogen, protein, and triacylglycerols contribute to higher energy reserves in some bivalve mollusks, making them more resistant to significant reductions in condition index values. Moreover, depuration at temperatures lower than 25 °C can help reduce oyster respiration and wasteful energy expenditure [52]. Oysters in this study were held at room temperature, about 22.0 ± 2 °C, and were not significantly stressed after 24 h of depuration or refrigeration enough to reduce glycogen, protein, and triacylglycerol levels.
Although there are no studies that report the effects of depuration on an oyster’s cutting/biting force properties, previous studies’ textural analyses still provide some insight into the processing’s effects on oyster meats. In a study that examined the storage temperature’s effects on shellstock oysters over a period of 10 days, an increase in peak force on shucked oyster samples was observed after storage at 5, 10, and 20 °C for 24 h in another study [53]. Peak force values were about 340 g for samples stored at 5 °C after 24 h and were not significant for the three storage temperatures during the first three days of storage [53]. Another study examined the impact of 10, 20, 30, and 60 min dielectric barrier discharge using nitrogen gas medium on the texture profile of shucked Pacific oysters positioned 0.3 cm from the discharge jet [46]. On samples treated with dielectric barrier discharge for 10 min, mean hardness (g/cm2) was 102 ± 15.17 compared to 100.14 ± 11.38 of the untreated control (0 min). The samples were not significantly different [46]. The cutting force of oysters stored at 4 °C decreased significantly from 0 to 5 days and ultimately over a 20-day period [54]. Loss in biting/cutting force in oysters is due to loss of freshness determinants over time, such as glycogen content, water content, pH reduction, drip loss, protein content, and enzymatic activity [54,55]. While depuration for 24 h should not negatively affect this quality parameter, extended depuration periods might alter the biting force of oyster meats. Overall, it seems PASW10 provides a higher reduction of TC and EC in oysters while not significantly affecting the quality of the oyster’s meat.

5. Conclusions

PASW could be used as a disinfectant in oyster depuration systems. The effects of increased oxidation reduction potential, conductivity, reactive nitrogen species, and lowered pH all play a part in the antimicrobial efficacy of PASW. PASW proved to be a better method for the reduction in total coliform and E. coli in live oysters and did not significantly diminish oyster quality after 24 h of depuration. Therefore, PASW depuration presents an alternative processing method for oysters compared to traditional methods such as refrigeration or depuration in seawater. Future studies should consider the application of PASW depuration on other microorganisms affecting live oysters and coupling the method with shelf-life quality studies over time. Our data suggest the novel application of PASW to static oyster depuration systems could be used to help maintain the microbiological safety of live oysters for human consumers.

Supplementary Materials

The following supporting information can be downloaded at: https://www.mdpi.com/article/10.3390/fishes8080396/s1, Figure S1: The effects of plasma-activated simulated seawater (PASW) on total coliform in oysters during static depuration in a preliminary experiment; Figure S2: The effects of plasma-activated simulated seawater (PASW) on E. coli in oysters during static depuration in a preliminary experiment.

Author Contributions

Conceptualization, V.M.C. and D.S.; methodology, V.M.C.; validation, V.M.C.; formal analysis, V.M.C.; investigation, V.M.C.; resources, S.H. and D.S.; data curation, V.M.C.; writing—original draft preparation, V.M.C.; writing—review and editing, V.M.C., S.H., and D.S.; visualization, V.M.C.; supervision, S.H. and D.S.; funding acquisition, S.H. and D.S. All authors have read and agreed to the published version of the manuscript.

Funding

This work was funded with support from the USDA NIFA (HATCH NC02754) and the William White Fund of the North Carolina Agriculture Foundation.

Institutional Review Board Statement

The study was approved by the IACUC (approval code #20-424).

Data Availability Statement

The data presented in this study are available on request from the corresponding author. The data are not publicly available owing to privacy.

Acknowledgments

We gratefully acknowledge Dhruv Dineshbhai Ghevariya for his help with the plasma activation trials. We kindly thank Lynette Johnston, Sophia Kathariou, and Jonathan Allen from the Department of Food, Bioprocessing, and Nutrition Sciences at North Carolina State University for donating the bacteria used in this study and for use of the convection oven, respectively. Lastly, we appreciate all the oysters donated by Dave Cerino and the North Carolina Shellfish Mariculture Demonstration Center at Carteret Community College.

Conflicts of Interest

The authors declare no conflict of interest.

Abbreviations

AbbreviationDefinition
PASWPlasma-activated simulated seawater
SSSimulated seawater
PASW10SS activated by plasma for 10 min
PASW10 (1:1)PASW10 diluted 1:1 with SS
PASW10 (3:1)PASW10 diluted 3:1 with SS
PAWPlasma-activated water
TCTotal coliform
ECEscherichia coli

References

  1. Sato, Y.; Yamada, S.; Takeda, S.; Hattori, N.; Nakamura, K.; Tanaka, H.; Mizuno, M.; Hori, M.; Kodera, Y. Effect of Plasma-Activated Lactated Ringer’s Solution on Pancreatic Cancer Cells In Vitro and In Vivo. Ann. Surg. Oncol. 2018, 25, 299–307. [Google Scholar] [CrossRef]
  2. Wang, Q.; Salvi, D. Evaluation of Plasma-Activated Water (PAW) as a Novel Disinfectant: Effectiveness on Escherichia coli and Listeria innocua, Physicochemical Properties, and Storage Stability. LWT 2021, 149, 111847. [Google Scholar] [CrossRef]
  3. Herianto, S.; Shih, M.-K.; Lin, C.-M.; Hung, Y.-C.; Hsieh, C.-W.; Wu, J.-S.; Chen, M.-H.; Chen, H.-L.; Hou, C.-Y. The Effects of Glazing with Plasma-Activated Water Generated by a Piezoelectric Direct Discharge Plasma System on Whiteleg Shrimp (Litopenaeus Vannamei). LWT 2022, 154, 112547. [Google Scholar] [CrossRef]
  4. Zhou, X.; Cai, D.; Xiao, S.; Ning, M.; Zhou, R.; Zhang, S.; Chen, X.; Ostrikov, K.; Dai, X. InvivoPen: A Novel Plasma Source for in Vivo Cancer Treatment. J. Cancer 2020, 11, 2273. [Google Scholar] [CrossRef] [Green Version]
  5. Thirumdas, R.; Kothakota, A.; Annapure, U.; Siliveru, K.; Blundell, R.; Gatt, R.; Valdramidis, V.P. Plasma Activated Water (PAW): Chemistry, Physico-Chemical Properties, Applications in Food and Agriculture. Trends Food Sci. Technol. 2018, 77, 21–31. [Google Scholar] [CrossRef]
  6. Narasimhan, S.L.; Salvi, D.; Schaffner, D.W.; Karwe, M.V.; Tan, J. Efficacy of Cold Plasma-Activated Water as an Environmentally Friendly Sanitizer in Egg Washing. Poult. Sci. 2023, 102, 102893. [Google Scholar] [CrossRef] [PubMed]
  7. Date, M.B.; Rivero, W.C.; Tan, J.; Specca, D.; Simon, J.E.; Salvi, D.A.; Karwe, M.V. Growth of Hydroponic Sweet Basil (O. basilicum L.) Using Plasma-Activated Nutrient Solution (PANS). Agriculture 2023, 13, 443. [Google Scholar] [CrossRef]
  8. Shah, U.; Wang, Q.; Kathariou, S.; Salvi, D. Optimization of Plasma-Activated Water and Validation of a Potential Surrogate for Salmonella for Future Egg Washing Processes. J. Food Prot. 2023, 86, 100029. [Google Scholar] [CrossRef] [PubMed]
  9. Cui, H.; Wang, Q.; Rai, R.; Salvi, D.; Nitin, N. DNA-Based Surrogates for the Validation of Microbial Inactivation Using Cold Atmospheric Pressure Plasma and Plasma-Activated Water Processing. J. Food Eng. 2023, 339, 111267. [Google Scholar] [CrossRef]
  10. Rivero, W.C.; Wang, Q.; Salvi, D. Impact of Plasma-Activated Water Washing on the Microbial Inactivation, Color, and Electrolyte Leakage of Alfalfa Sprouts, Broccoli Sprouts, and Clover Sprouts. Innov. Food Sci. Emerg. Technol. 2022, 81, 103123. [Google Scholar] [CrossRef]
  11. Campbell, V.; Wang, Q.; Hall, S.G.; Salvi, D. Physicochemical Properties and Antimicrobial Impacts of Plasma-Activated Simulated Seawater (PASW) on Escherichia coli. JSFA Rep. 2022, 2, 228–235. [Google Scholar] [CrossRef]
  12. Wang, Q.; Salvi, D. Recent Progress in the Application of Plasma-Activated Water (PAW) for Food Decontamination. Curr. Opin. Food Sci. 2021, 42, 51–60. [Google Scholar] [CrossRef]
  13. Mumtaz, S.; Khan, R.; Rana, J.N.; Javed, R.; Iqbal, M.; Choi, E.H.; Han, I. Review on the Biomedical and Environmental Applications of Nonthermal Plasma. Catalysts 2023, 13, 685. [Google Scholar] [CrossRef]
  14. Patange, A.; Lu, P.; Boehm, D.; Cullen, P.J.; Bourke, P. Efficacy of Cold Plasma Functionalised Water for Improving Microbiological Safety of Fresh Produce and Wash Water Recycling. Food Microbiol. 2019, 84, 103226. [Google Scholar] [CrossRef] [PubMed]
  15. Tan, J.; Karwe, M.V. Inactivation and Removal of Enterobacter Aerogenes Biofilm in a Model Piping System Using Plasma-Activated Water (PAW). Innov. Food Sci. Emerg. Technol. 2021, 69, 102664. [Google Scholar] [CrossRef]
  16. Kostoláni, D.; Ndiffo Yemeli, G.B.; Švubová, R.; Kyzek, S.; Machala, Z. Physiological Responses of Young Pea and Barley Seedlings to Plasma-Activated Water. Plants 2021, 10, 1750. [Google Scholar] [CrossRef]
  17. Gao, Y.; Francis, K.; Zhang, X. Review on Formation of Cold Plasma Activated Water (PAW) and the Applications in Food and Agriculture. Food Res. Int. 2022, 157, 111246. [Google Scholar] [CrossRef]
  18. Hashizume, H.; Kitano, H.; Mizuno, H.; Abe, A.; Yuasa, G.; Tohno, S.; Tanaka, H.; Ishikawa, K.; Matsumoto, S.; Sakakibara, H.; et al. Improvement of Yield and Grain Quality by Periodic Cold Plasma Treatment with Rice Plants in a Paddy Field. Plasma Process. Polym. 2021, 18, 2000181. [Google Scholar] [CrossRef]
  19. Kang, C.; Xiang, Q.; Zhao, D.; Wang, W.; Niu, L.; Bai, Y. Inactivation of Pseudomonas Deceptionensis CM2 on Chicken Breasts Using Plasma-Activated Water. J. Food Sci. Technol. 2019, 56, 4938–4945. [Google Scholar] [CrossRef]
  20. Andrasch, M.; Stachowiak, J.; Schlüter, O.; Schnabel, U.; Ehlbeck, J. Scale-up to Pilot Plant Dimensions of Plasma Processed Water Generation for Fresh-Cut Lettuce Treatment. Food Packag. Shelf Life 2017, 14, 40–45. [Google Scholar] [CrossRef]
  21. Wong, K.S.; Lim, W.T.H.; Ooi, C.W.; Yeo, L.Y.; Tan, M.K. In Situ Generation of Plasma-Activated Aerosols via Surface Acoustic Wave Nebulization for Portable Spray-Based Surface Bacterial Inactivation. Lab Chip 2020, 20, 1856–1868. [Google Scholar] [CrossRef]
  22. Mai-Prochnow, A.; Zhou, R.; Zhang, T.; Ostrikov, K.; Mugunthan, S.; Rice, S.A.; Cullen, P.J. Interactions of Plasma-Activated Water with Biofilms: Inactivation, Dispersal Effects and Mechanisms of Action. NPJ Biofilms Microbiomes 2021, 7, 11. [Google Scholar] [CrossRef]
  23. Hu, X.; Zhang, Y.; Wu, R.A.; Liao, X.; Liu, D.; Cullen, P.J.; Zhou, R.-W.; Ding, T. Diagnostic Analysis of Reactive Species in Plasma-Activated Water (PAW): Current Advances and Outlooks. J. Phys. D Appl. Phys. 2021, 55, 23002. [Google Scholar] [CrossRef]
  24. Kulawik, P.; Kumar Tiwari, B. Recent Advancements in the Application of Non-Thermal Plasma Technology for the Seafood Industry. Crit. Rev. Food Sci. Nutr. 2019, 59, 3199–3210. [Google Scholar] [CrossRef]
  25. Hong, H.; Regenstein, J.M.; Luo, Y. The Importance of ATP-Related Compounds for the Freshness and Flavor of Post-Mortem Fish and Shellfish Muscle: A Review. Crit. Rev. Food Sci. Nutr. 2017, 57, 1787–1798. [Google Scholar] [CrossRef]
  26. Xu, D.; Cui, Q.; Xu, Y.; Wang, B.; Tian, M.; Li, Q.; Liu, Z.; Liu, D.; Chen, H.; Kong, M.G. Systemic Study on the Safety of Immuno-Deficient Nude Mice Treated by Atmospheric Plasma-Activated Water. Plasma Sci. Technol. 2018, 20, 44003. [Google Scholar] [CrossRef] [Green Version]
  27. Miranda, K.M.; Espey, M.G.; Wink, D.A. A Rapid, Simple Spectrophotometric Method for Simultaneous Detection of Nitrate and Nitrite. Nitric Oxide 2001, 5, 62–71. [Google Scholar] [CrossRef]
  28. SOP MB-27-03; Standard Operating Procedure for Germicidal and Detergent Sanitizing Action of Disinfectants Tests. US Environmental Protection Agency Office of Pesticide Programs: Washington, DC, USA, 2019.
  29. Larsen, A.; Scott, F.; Walton, W.; Arias, C. Effective Reduction of Vibrio vulnificus in the Eastern Oyster (Crassostrea virginica) Using High Salinity Depuration. Food Microbiol. 2013, 34, 118–122. [Google Scholar] [CrossRef]
  30. Lawrence, D.R.; Scott, G.I. The Determination and Use of Condition Index of Oysters. Estuaries 1982, 5, 23–27. [Google Scholar] [CrossRef]
  31. R Core Team R: A Language and Environment for Statistical Computing. Available online: http://www.r-project.org/ (accessed on 15 June 2022).
  32. Zhang, J.; Peng, S.; Zhang, X.; Fan, R.; Zhao, X.; Qi, M.; Liu, R.; Xu, D.; Liu, D. Investigation of Different Solutions Activated by Air Plasma Jet and Their Anticancer Effect. Appl. Phys. Lett. 2022, 120, 264102. [Google Scholar] [CrossRef]
  33. Baek, K.H.; Yong, H.I.; Yoo, J.H.; Kim, J.W.; Byeon, Y.S.; Lim, J.; Yoon, S.Y.; Ryu, S.; Jo, C. Antimicrobial Effects and Mechanism of Plasma Activated Fine Droplets Produced from Arc Discharge Plasma on Planktonic Listeria monocytogenes and Escherichia coli O157:H7. J. Phys. D Appl. Phys. 2020, 53, 124002. [Google Scholar] [CrossRef]
  34. Hadinoto, K.; Rao, N.R.H.; Astorga, J.B.; Zhou, R.; Biazik, J.; Zhang, T.; Cullen, P.J.; Prescott, S.; Henderson, R.K.; Trujillo, F.J. Hybrid Plasma-Bubble Discharges for Energy-Efficient Production of Plasma-Activated Water. SSRN 2022, 541, 4115167. [Google Scholar] [CrossRef]
  35. Epifanio, C.E.; Srna, R.F. Toxicity of Ammonia, Nitrite Ion, Nitrate Ion, and Orthophosphate to Mercenaria mercenaria and Crassostrea virginica. Mar. Biol. 1975, 33, 241–246. [Google Scholar] [CrossRef]
  36. Rybovich, M.; La Peyre, M.K.; Hall, S.G.; Peyre, J.F. Increased Temperatures Combined with Lowered Salinities Differentially Impact Oyster Size Class Growth and Mortality. J. Shellfish Res. 2016, 35, 101–113. [Google Scholar] [CrossRef]
  37. La Peyre, M.K.; Geaghan, J.; Decossas, G.; Peyre, J.F. Analysis of Environmental Factors Influencing Salinity Patterns, Oyster Growth, and Mortality in Lower Breton Sound Estuary, Louisiana, Using 20 Years of Data. J. Coast. Res. 2016, 32, 519–530. [Google Scholar] [CrossRef]
  38. Love, D.; Lovelace, G.; Sobsey, M. Removal of Escherichia coli, Enterococcus Fecalis, Coliphage MS2, Poliovirus, and Hepatitis A Virus from Oysters (Crassostrea Virginica) and Hard Shell Clams (Mercinaria mercinaria) by Depuration. Int. J. Food Microbiol. 2010, 143, 211–217. [Google Scholar] [CrossRef]
  39. Pace, J.; Wu, C.; Chai, T. Bacterial Flora in Pasteurized Oysters after Refrigerated Storage. J. Food Sci. 1988, 53, 325–327. [Google Scholar] [CrossRef]
  40. Oehmigen, K.; Winter, J.; Hähnel, M.; Wilke, C.; Brandenburg, R.; Weltmann, K.-D.; von Woedtke, T. Estimation of Possible Mechanisms of Escherichia coli Inactivation by Plasma Treated Sodium Chloride Solution. Plasma Process. Polym. 2011, 8, 904–913. [Google Scholar] [CrossRef]
  41. Ren, T.; Su, Y.-C. Effects of Electrolyzed Oxidizing Water Treatment on Reducing Vibrio parahaemolyticus and Vibrio vulnificus in Raw Oysters. J. Food Prot. 2006, 69, 1829–1834. [Google Scholar] [CrossRef] [Green Version]
  42. He, H.; Adams, R.; Farkas, D.; Morrissey, M. Use of High-pressure Processing for Oyster Shucking and Shelf-life Extension. J. Food Sci. 2002, 67, 640–645. [Google Scholar] [CrossRef]
  43. Kim, J.H.; Shim, K.B.; Shin, S.B.; Park, K.; Oh, E.G.; Son, K.T.; Yu, H.; Lee, H.J.; Mok, J.S. Comparison of Bioaccumulation and Elimination of Escherichia coli and Male-Specific Bacteriophages by Ascidians and Bivalves. Environ. Sci. Pollut. Res. 2017, 24, 28268–28276. [Google Scholar] [CrossRef] [PubMed]
  44. Chinnadurai, S.; Mohamed, K.; Venkatesan, V.; Sharma, J.; Kripa, V. Depuration of Bacterial Populations in the Indian Backwater Oyster Crassostrea madrasensis (Preston, 1916): Effects on Surface and Bottom Held Oysters. J. Shellfish Res. 2014, 33, 409–415. [Google Scholar] [CrossRef]
  45. Csadek, I.; Paulsen, P.; Weidinger, P.; Bak, K.H.; Bauer, S.; Pilz, B.; Nowotny, N.; Smulders, F.J.M. Nitrogen Accumulation in Oyster (Crassostrea gigas) Slurry Exposed to Virucidal Cold Atmospheric Plasma Treatment. Life 2021, 11, 1333. [Google Scholar] [CrossRef] [PubMed]
  46. Choi, M.-S.; Jeon, E.B.; Kim, J.Y.; Choi, E.H.; Lim, J.S.; Choi, J.; Park, S.Y. Application of Dielectric Barrier Discharge Plasma for the Reduction of Non-Pathogenic Escherichia coli and E. coli O157:H7 and the Quality Stability of Fresh Oysters (Crassostrea gigas). LWT 2022, 154, 112698. [Google Scholar] [CrossRef]
  47. Olatunde, O.O.; Benjakul, S.; Vongkamjan, K. Dielectric Barrier Discharge Cold Atmospheric Plasma: Bacterial Inactivation Mechanism. J. Food Saf. 2019, 39, e12705. [Google Scholar] [CrossRef]
  48. Campbell, V.; Chouljenko, A.; Hall, S. Depuration of Live Oysters to Reduce Vibrio parahaemolyticus and Vibrio vulnificus: A Review of Ecology and Processing Parameters. Compr. Rev. Food Sci. Food Saf. 2022, 21, 3480–3506. [Google Scholar] [CrossRef]
  49. Ruano, F.; Ramos, P.; Quaresma, M.; Bandarra, N.M.; Da Fonseca, I.P. Evolution of Fatty Acid Profile and Condition Index in Mollusc Bivalves Submitted to Different Depuration Periods. Rev. Port. Cienc. Vet. 2012, 111, 75–84. [Google Scholar]
  50. Bagenda, D.K.; Nishikawa, S.; Kita, H.; Kinai, Y.; Terai, S.; Kato, M.; Kasai, H. Impact of Feeding on Oyster Depuration Efficacy Under Conditions of High Salinity and Low Temperature. Aquaculture 2019, 500, 135–140. [Google Scholar] [CrossRef]
  51. Bio, S.; Nunes, B. Twists and Turns of an Oyster’s Life: Effects of Different Depuration Periods on Physiological Biochemical Functions of Oysters. Environ. Sci. Pollut. Res. 2021, 28, 29601–29614. [Google Scholar] [CrossRef]
  52. Percy, J.A.; Aldrich, F.A.; Marcus, T.R. Influence of Environmental Factors on Respiration of Excised Tissues of American Oysters, Crassostrea virginica (Gmelin). Can. J. Zool. 1971, 49, 353–360. [Google Scholar] [CrossRef]
  53. Mudoh, M.F.; Parveen, S.; Schwarz, J.; Rippen, T.; Chaudhuri, A. The Effects of Storage Temperature on the Growth of Vibrio parahaemolyticus and Organoleptic Properties in Oysters. Front. Public Health 2014, 2, 45. [Google Scholar] [CrossRef] [PubMed] [Green Version]
  54. Zhang, J.; Walton, W.C.; Wang, Y. Quantitative Quality Evaluation of Eastern Oyster (Crassostrea virginica) Cultured by Two Different Methods. Aquac. Res. 2017, 48, 2934–2944. [Google Scholar] [CrossRef]
  55. Jeong, H.; Park, S.-K.; Jo, D.-M.; Khan, F.; Yu, D.; Lee, J.-H.; Kang, M.-G.; Lee, D.; Sim, Y.-A.; Kim, Y.-M. Effectiveness of Depuration of Pacific Oyster (Crassostrea Gigas): Removal of Bioaccumulated Vibrio Vulnificus by UV-Treatment. Food Sci. Biotechnol. 2021, 30, 765–771. [Google Scholar] [CrossRef] [PubMed]
Figure 1. Schematic of laboratory bench-scale, static depuration setup for live oysters. Three glass bowls were filled with 600 mL of SS or PASW10 (a total of six bowls). Each bowl contained three oysters and a small air stone.
Fishes 08 00396 g001
Figure 2. Microbial reduction efficacy of refrigeration, simulated seawater (SS) depuration, and plasma-activated simulated seawater (PASW) depuration processing on (a) total coliform and (b) E. coli in live oysters over 24 h. Data shown are the mean values ± standard errors of three replications. Means lacking a common lowercase letter are significantly different (p < 0.05) at a specific time point among treatments. Means lacking a common uppercase letter are significantly different over the 24 h processing period (p < 0.05).
Fishes 08 00396 g002
Table 1. The physicochemical properties of simulated seawater (SS) before plasma activation, immediately after activation by plasma for 10 min (denoted as PASW10), and PASW10 after dilution with SS (3:1 or 1:1) to a total volume of 600 mL.
TreatmentTemperature
(°C)
pHOxidation
Reduction
Potential
(mV)
Conductivity
(µS/cm)
PASW10 (3:1)
Before activation
Immediately after activation
18.7 ± 0.6 Bc9.06 ± 0.0 Bc−116.6 ± 0.3 Bc44.0 ± 0.1 Bc
55.3 ± 1.5 Cb2.93 ± 0.0 Db249.8 ± 2.1 Cb57.5 ± 0.6 Db
After dilution with SS23.0 ± 0.0 Ea5.49 ± 0.0 Fa76.30 ± 0.6 Ea46.4 ± 1.4 ACa
PASW10 (1:1)
Before activation
Immediately after activation
19.0 ± 0.0 Bc9.00 ± 0.0 Cc−114.0 ± 0.8 Bc44.6 ± 0.0 BCc
48.3 ± 1.5 Db2.99 ± 0.0 Eb243.0 ± 0.6 Db52.2 ± 1.0 Eb
After dilution with SS27.0 ± 0.0 Aa3.43 ± 0.0 Aa201.4 ± 0.3 Aa47.2 ± 0.4 Aa
Data shown are the mean values ± standard errors of three independent experiments. Within a particular treatment, means lacking a common lowercase letter are significantly different (p < 0.05). Between both treatments and within a column, means lacking a common uppercase letter are significantly different (p < 0.05).
Table 2. Concentrations (mM) of nitrate, NO3, and nitrite, NO2, in PASW10 (3:1 and 1:1).
TreatmentNO3 (mM)NO2 (mM)
SS (control)0.00 ± 0.00 b0.00 ± 0.00 b
PASW10 (3:1)5.21 ±1.84 c6.71 ± 0.01 c
PASW10 (1:1)34.3 ±1.43 a11.3 ± 0.11 a
Data shown are the mean values ± standard errors of three independent experiments. Within a column, means lacking a common letter are significantly different (p < 0.05).
Table 3. Averages of physical properties of oysters used in this study.
# of OystersMass (g)Length (cm)Width (cm)
Processing tests3033.8 ± 6.965.84 ± 0.683.38 ± 0.44
Quality tests1330.8 ± 6.705.00 ± 0.543.15 ± 0.59
Average32.9 ± 6.945.57 ± 0.753.30 ± 0.49
Table 4. Condition index (CI) of oysters before (0 h) and after 24 h of processing.
TreatmentCI∆ CI
Control (0 h)5.51 ± 2.49
Refrigeration3.65 ± 1.11−1.86
SS depuration5.15 ± 1.49−0.36
PASW10 depuration3.35 ± 0.87−2.16
Data shown are the mean values ± standard errors of three replications and were not significantly different (p > 0.05).
Table 5. Biting force of oysters before (0 h) and after 24 h of processing.
TreatmentPeak Force (g/mm)∆ Peak Force (g/mm)
Control (0 h)177 ± 3.54
Refrigeration339 ± 147+162
SS depuration117 ± 7.72−60.0
PASW10 depuration198 ± 49.0+21.0
Data shown are the mean values ± standard errors of three replications and were not significantly different (p > 0.05).
Disclaimer/Publisher’s Note: The statements, opinions and data contained in all publications are solely those of the individual author(s) and contributor(s) and not of MDPI and/or the editor(s). MDPI and/or the editor(s) disclaim responsibility for any injury to people or property resulting from any ideas, methods, instructions or products referred to in the content.

