Article

Individual Fish Echo Detection Method Based on Peak Delay Estimation and Instantaneous Frequency Characterization

1
Fishery Machinery and Instrument Research Institute, Chinese Academy of Fishery Sciences, Shanghai 200092, China
2
College of Engineering Science and Technology, Shanghai Ocean University, Shanghai 201306, China
*
Author to whom correspondence should be addressed.
Fishes 2023, 8(12), 580; https://doi.org/10.3390/fishes8120580
Submission received: 19 October 2023 / Revised: 20 November 2023 / Accepted: 24 November 2023 / Published: 28 November 2023
(This article belongs to the Special Issue Current Research on Fish Tracking Technology)

Abstract

:
In fisheries science research and farmed fish monitoring, acquiring individual fish echoes is the basis for the growth assessment, tracking, and target strength estimation of farmed fish. However, individual fish echo detection methods based on narrowband signal features cannot be applied well to high-density aquaculture scenarios. The broadband signaling system can improve the distance resolution of the detected target and can help to improve the performance of individual fish echo detection. In this study, for the broadband signal system and the characteristics of the underwater fish acoustic echoes, an individual fish echo detection method is proposed using the matched filter output envelope peak interval and instantaneous frequency characteristics of the echo as evaluation indices, and the simulation and experiments of the method are carried out in an anechoic water tank. The results show that the broadband signal system and the corresponding detection method perform better in detecting single target echoes than the narrowband signal system. Compared with the broadband single echo detection method that only relies on the peak interval of the matched filter envelope, the joint detection method that incorporates the instantaneous frequency characteristics of the echo signal has a better rejection capability for overlapping echoes, which can reduce the probability of misjudging the overlapping echoes. The combined detection methods may provide a better detection performance for individual fish echoes.
Key Contribution: A single fish echo detection method which is applicable to broadband detection systems; this method can effectively improve the detection accuracy in low signal-to-noise ratio scenarios and reduce the false identification rate.

1. Introduction

Underwater acoustic technology is useful for fishery science research and for monitoring farmed fish. Hydroacoustic signals are the only means of transmitting information over long distances through water; so, acoustic echoes have become the best choice for obtaining information about fish that are beyond optical range. It can be very useful to discriminate the echo of a single fish from the echoes of a school of fish. The echoes from single fish have been studied for species discrimination and classification [1,2], target strength estimation [3,4,5], and growth condition assessment [6]. Such research may be useful in reducing bycatch, decreasing juvenile bycatch rates, or conducting farmed fish monitoring. Laboratory measurements of the spectral features of a single fish are not straightforward to apply when monitoring a fish farm which has a population density that is unevenly distributed. The interference or superposition of multiple target echoes may result in the loss of the scattering spectral features of the target, resulting in a high target strength valuation [7] or the failure of the target detection [8]. The primary task of the present manuscript is to obtain an algorithm that can effectively detect and identify an echo as having come from a single fish.
Narrowband signal systems have a long history in fisheries science research [9]. The research on individual fish echo detection was first carried out based on narrowband signals and derived a series of single fish target recognition methods based on the characteristics of narrowband signals, such as signal amplitude, signal pulse width, average phase deviation [7], amplitude deviation [10], and standard phase deviation [11], among others. These methods have been widely used and have contributed to marine fisheries detection development. With the release of the EK80, broadband scientific fish finders show exciting potential for marine fisheries detection, among others [12]. The LFM (linear frequency modulation) signal has a large time–bandwidth product, which can improve the distance resolution of the detected target by matched filtering [13], and spectral analysis of the target echoes can be performed to provide target recognition information [14]; it also possesses a high peak signal-to-noise ratio [15]. It provides a solution for the problem of obtaining clear information on individual fish targets, eliminating the ambiguity that comes with narrowband systems, and it provides the basis for high-resolution detection. However, the signal-processing methods based on broadband signal systems are more complex and require new criteria for single fish echo recognition.
In the study of marine life detection under a broadband signaling regime, some explorations have been carried out to detect the signals of individual fish based on matched filtering techniques. In Ito et al.’s study of the spectral correlation target strength of Japanese jack mackerel Trachurus japonicus, information about the peaks of the matched filter envelope and the angles at the peaks were utilized to obtain the individual fish echoes [8]. Lavery et al. found that matching with a modified copy of the signal in a matched filter could improve the detection and characterization of small targets close to the boundary, but it resulted in a loss of more spectral information [16]. Cotter et al. employed matched filtering and used peak detection of the echo envelope to obtain single fish spectra in a mesopelagic biomass assessment study. However, the detection performance of this method still needs to be investigated [17,18]. Detecting single target echoes based on the high distance resolution obtained by matched filtering shows great potential. However, in high-density culture scenarios, the complexity of the spatial distribution state of the individuals within the fish school brings about random variations between echo phases. Overlapping echoes may present signal characteristics similar to those of single fish after matched filtering outputs, which requires reliable evaluation criteria for separating single fish targets through signal characterization studies of single and overlapping echoes.
Aiming at the above problems, this paper proposes a joint detection method based on the time delay estimation of the peaks of the output signal envelope of a matched filter and the instantaneous frequency characteristics of the signal. Simulation and tank experiments were conducted on the single echo recognition scheme, and the detection performance was investigated. Unlike narrowband signals, cultured fish echo signals based on LFM signals are typical non-stationary signals. Time–frequency domain methods, such as wavelet transform [19], Hilbert transform [20], and WVD [21], are commonly used to analyze non-stationary signals [22]. They are widely used in areas such as underwater target identification [23] and blind target separation [24]. Ideally, when the sonar transmits an LFM signal, the individual fish echoes should have a matching time–frequency distribution. In contrast, when the overlapping echoes are received from many randomly distributed fish, the time–frequency distribution becomes a superposition of signals that can be difficult to interpret. In this paper, the matched filter method is used to obtain the time domain characteristics of the signal; the Hilbert transform is used as the time–frequency analysis method to derive the time–frequency distribution characteristics of the single and overlapping echoes, and the evaluation indexes based on the pulse peak interval time of the matched filtered echo envelope and the instantaneous frequency characteristics of the overlapping and single echoes are jointly proposed.

2. Materials and Methods

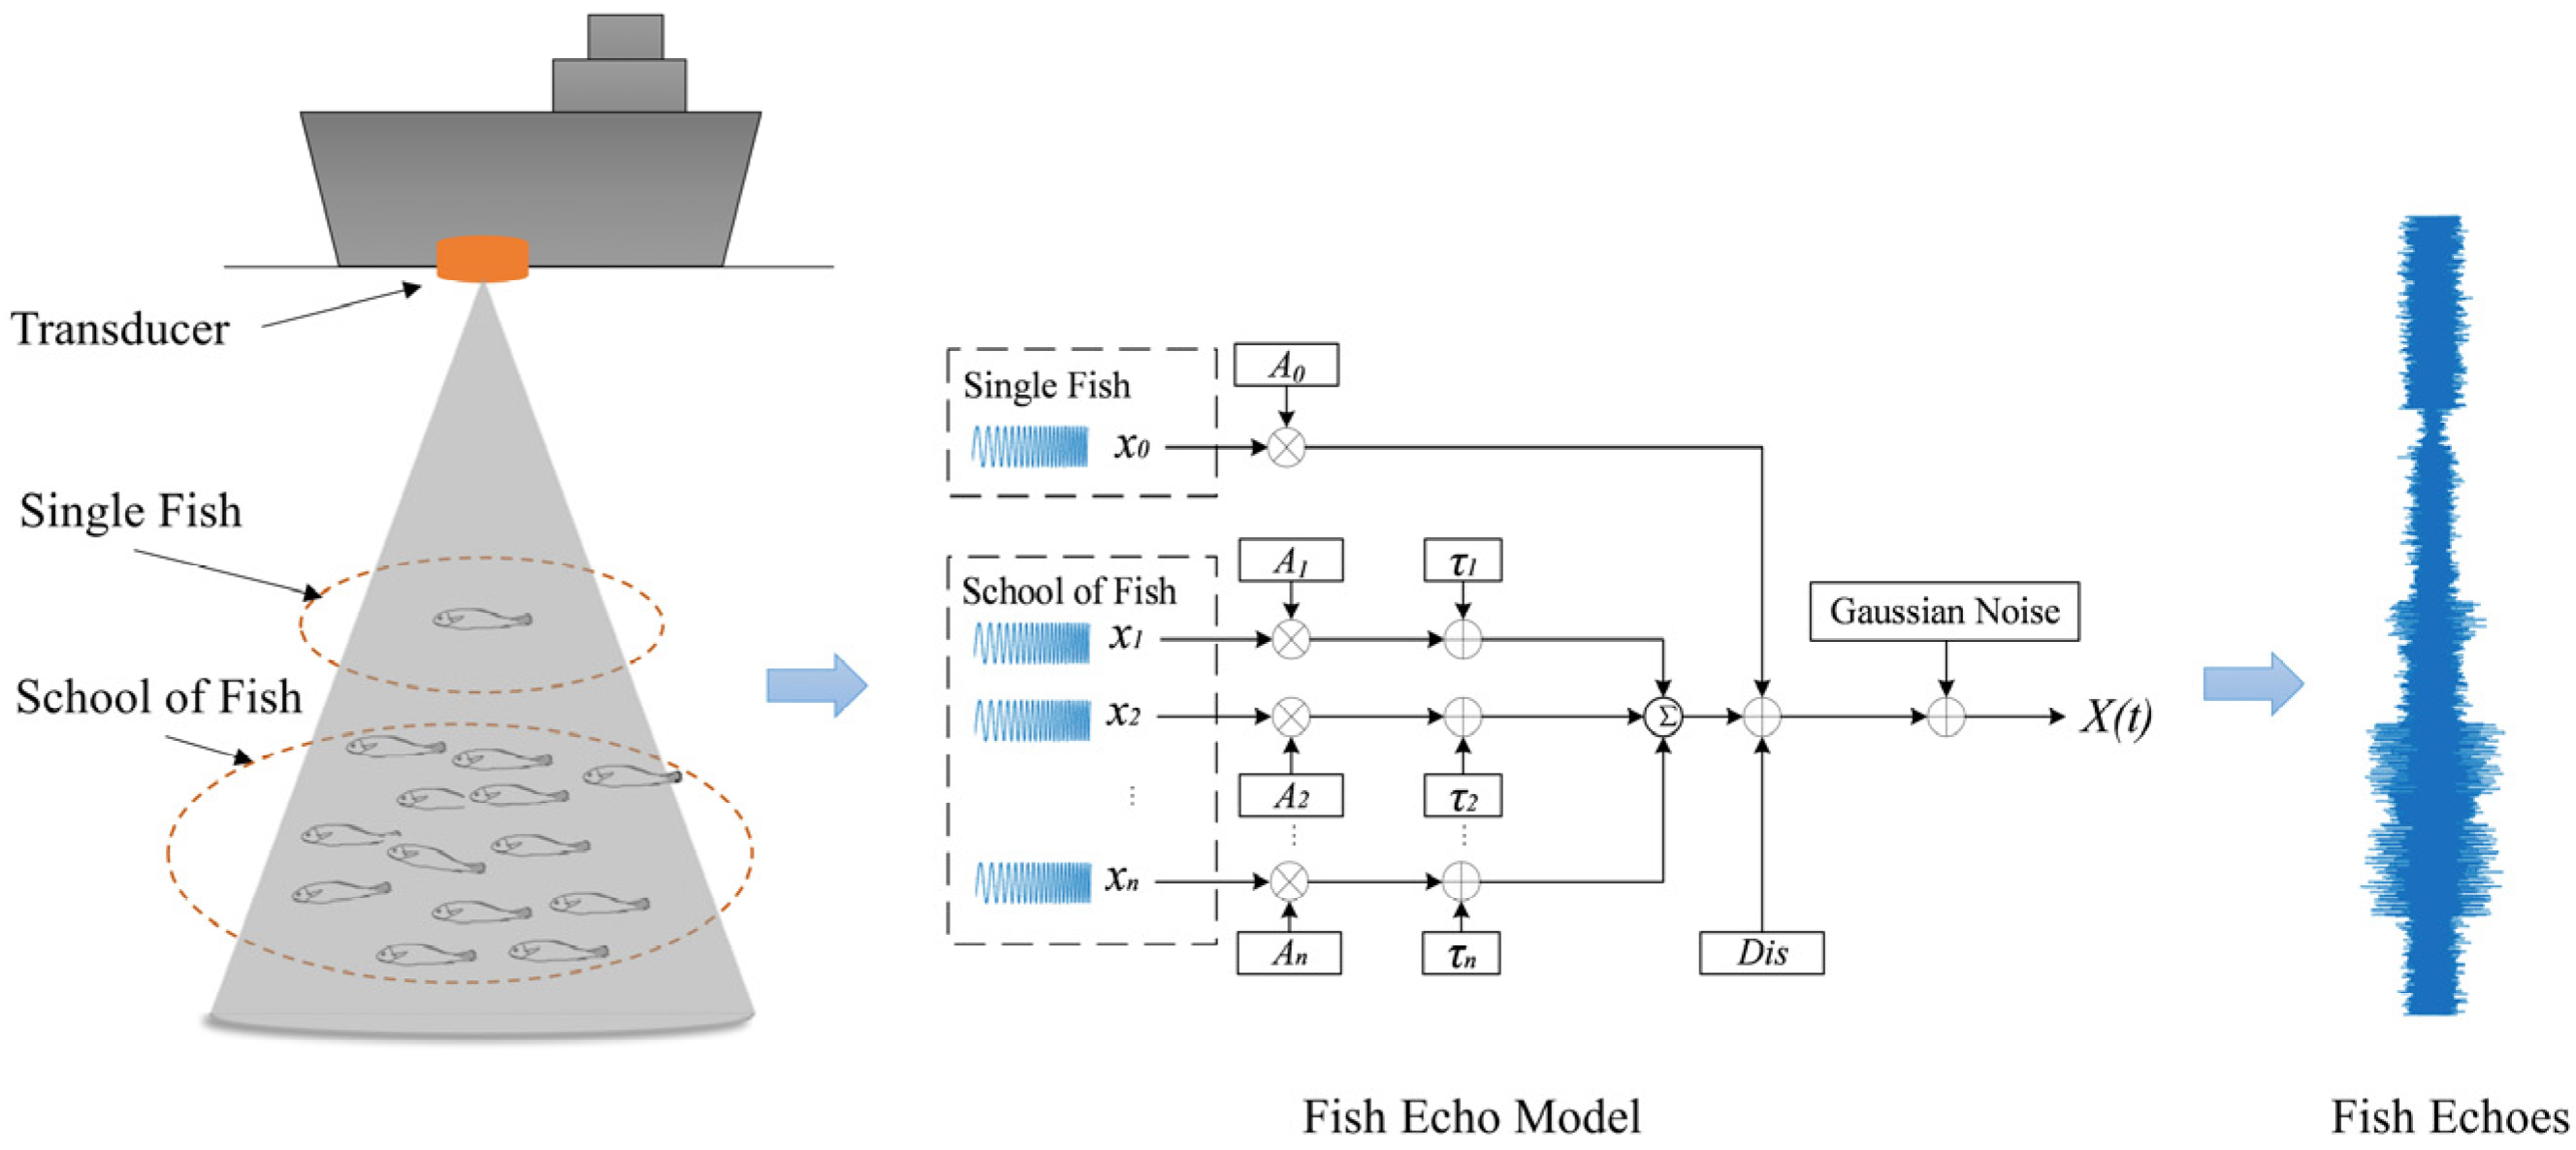
2.1. Detection Principle

The fish school and single fish echo signal model is shown in Figure 1. With the continuous change in the spatial position of the fish, the fish echo signal collected by the sonar at a random moment can be regarded as a linear superposition of a series of monomer echo signals with different time delay differences in the time domain. The random variation in fish spacing makes the interference or superposition of the single fish echoes that are close to each other into overlapping echoes with random amplitudes and echo widths. It is necessary to detect the single fish echoes and eliminate the overlapping echo interference to obtain the fish information carried by the echoes. Single fish echoes can be detected by relying on the differences between single and overlapping echoes in the signal characteristics, such as the pulse duration, amplitude, and phase of the echo signals and their changes in the time and frequency domains.
The detection method in the narrowband system utilizes the original echo signal waveform characteristics, such as envelope amplitude, envelope width and amplitude change, and other features to judge the single fish echo and overlapping echoes. However, when using the broadband signal system, pulse compression technology is used for processing, and the matched filtered signal is obtained with completely new signal characteristics. The high distance resolution brought by matched filtering can effectively improve the accuracy of the time delay estimation between the output peaks, and the time delay difference between the single echo signals combined with the transmit signal pulse width can determine whether two single echo signals overlap. In addition, the separated monolithic fish echoes and the overlapped echoes in the time–frequency domain show different instantaneous frequency characteristics. The broadband signal is time-varying. A single fish target echo has a regular time–frequency distribution, while the overlapping echo exhibits significant changes in its instantaneous frequency due to phase jump and random changes in amplitude [25,26]. Therefore, detecting single fish echoes can be based on the peak time delay estimation and instantaneous frequency characteristics of the broadband signals.

2.2. Detection Methods

The method of detecting the single fish echo signal is shown in Figure 2. In the time domain, the single target echo with high distance resolution is obtained by pulse compression of the echo signal through a matched filter. Based on the peak detection algorithm, the time delay estimate between the peaks of the single target echo is used to exclude overlapping echoes. Ideally, if two peaks are separated by a distance larger than the pulse width of the transmit signal, it can be regarded as a single fish echo. However, peak detection may fail when individual echoes with significant differences in target strength overlap. In this case, although the echo time delay meets the conditions, there is a possibility that the overlapped echoes will be misidentified as single fish echoes.
In the time–frequency domain, the joint detection of the suspected individual fish target echoes is performed based on the significant difference in the instantaneous frequency characteristics of the individual fish echoes and the overlapping echoes. The instantaneous frequency of the bandpass filtered signal is estimated based on the Hilbert transform. The instantaneous frequency variance of the suspected mono-target signal segment is obtained, and the suspected mono-fish echo signal is further determined based on the instantaneous frequency variance threshold.

2.2.1. Detection and Echo Signals

In marine life and fisheries research, broadband echolocation systems generally use LMF signals or some other form of chirp signal. The LFM signal in complex form with a center frequency of f c is expressed as:
s ( t ) = A r e c t ( t T ) e j 2 π ( f c + K t / 2 ) t
r e c t ( t T ) = { 1   ( | t | T / 2 ) 0   ( | t | > T / 2 )
where A is the signal amplitude, T is the signal pulse duration, and K is the FM slope of the signal ( K = B / T , B is the bandwidth of the LFM pulse).
The fish echo signals collected by the hydroacoustic transducer usually include four parts: single fish echoes, overlapping echoes, reverberation, and random noise, and the total target echo signals X ( t ) can be written as:
X ( t ) = A 0 s ( t τ 0 ) + i = 1 m A i s ( t τ i ) + v ( t ) + n ( t )
The first term on the right is the single fish echoes; A 0 is the amplitude of the single fish echoes, and τ 0 is the echo delay of the single fish target. The second term on the right is the overlapping echoes within the school; m is the number of overlapping echoes, A i is the amplitude of the i th single fish echoes, and τ i is the echo delay of the ith fish in the overlapping echoes. v ( t ) is the reverberation, and n ( t ) is the received ambient noise.

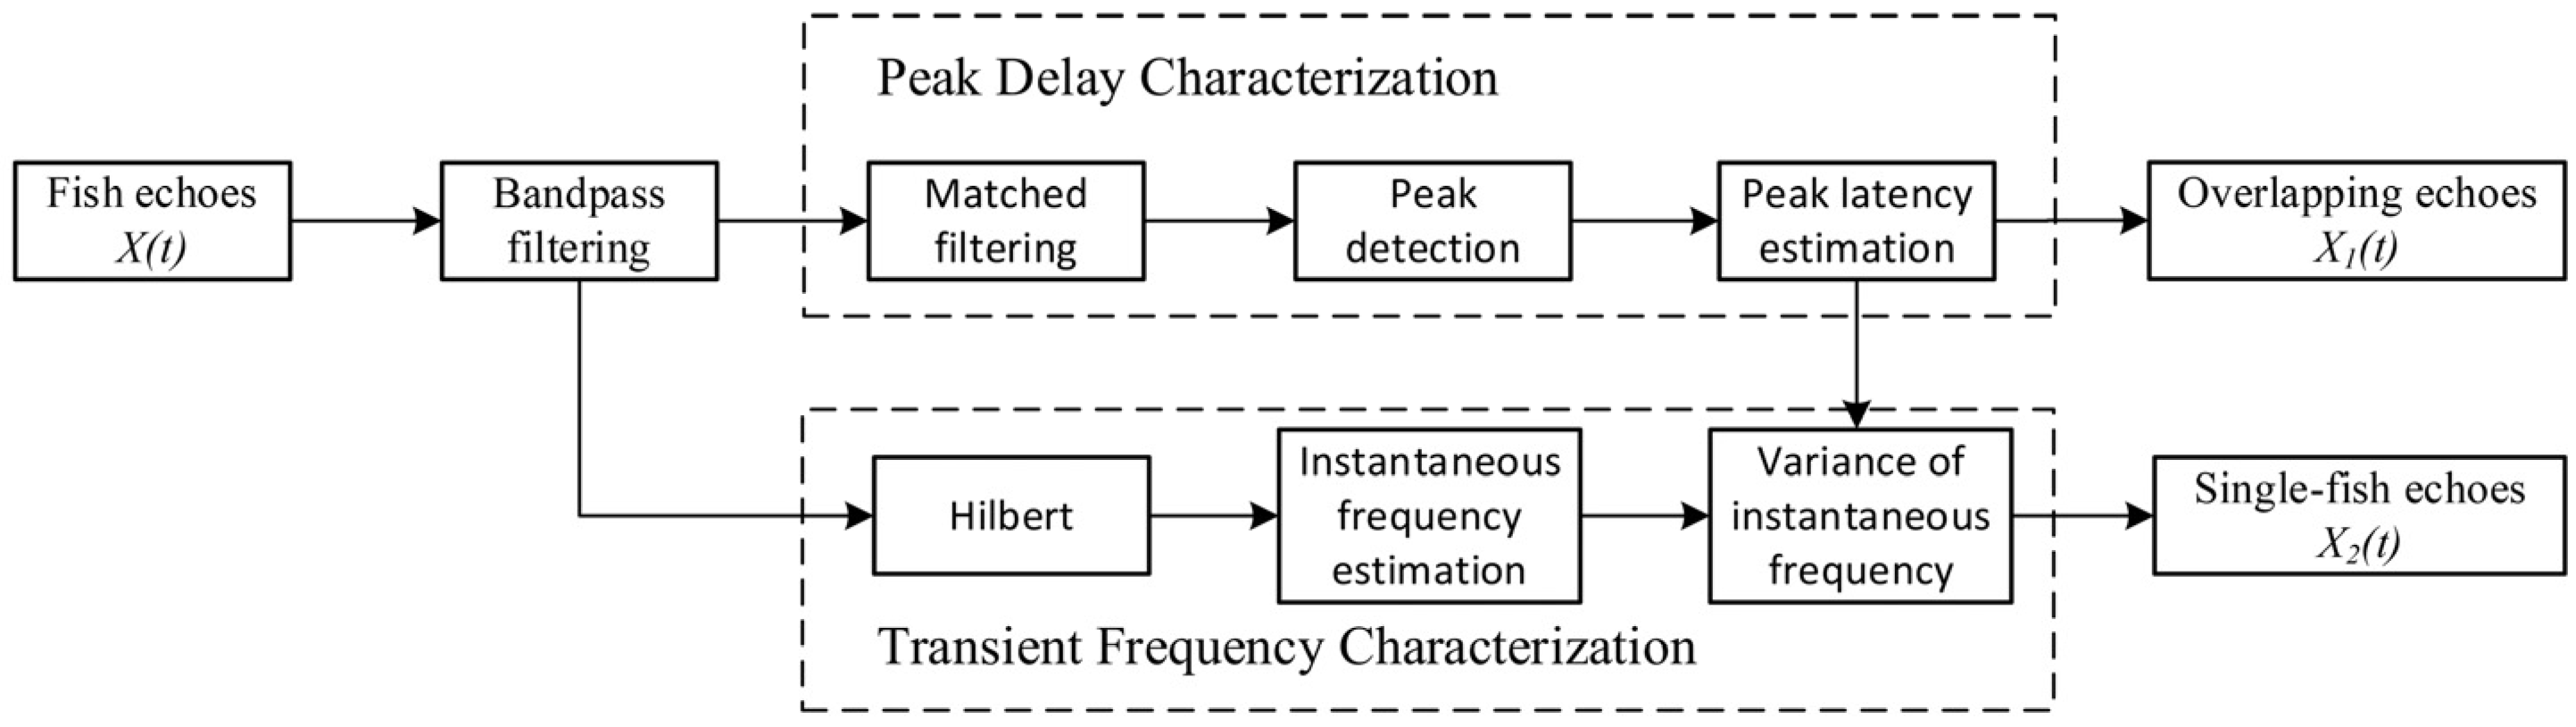
2.2.2. Detection of Single Fish Echoes Based on Peak Delay Characteristics

In order to obtain the peak moments of the single and overlapping echoes, the echo signals are first processed by matched filtering. The time domain impulse response of the matched filter for the target echo signal X ( t ) is:
h ( t ) = s ( t )
The time domain output of the matched filter for the received signal of the hydroacoustic transducer in complex form is:
X ˜ 0 ( t ) = X ˜ ( t ) h ( t ) = X ˜ ( τ ) h ( t τ ) d τ = A 0 ( 1 K B ) sin [ π B ( t τ 0 ) ] π B ( t τ 0 ) e j 2 π f c ( t τ 0 ) + i = 1 m A i ( 1 K B ) sin [ π B ( t τ i ) ] π B ( t τ i ) e j 2 π f c ( t τ i ) + V ˜ ( t ) + N ˜ ( t )
where X ˜ ( t ) is the complex form of the echo signal, V ˜ ( t ) and N ˜ ( t ) are the results of the matched filtering for reverberation and ambient noise, respectively.
Where K = B / T and D = T B , bringing them into the above equation:
X ˜ 0 ( t ) = A 0 D sin [ π B ( t τ 0 ) ] π B ( t τ 0 ) e j 2 π f c ( t τ 0 ) + i = 1 m A i D sin [ π B ( t τ i ) ] π B ( t τ i ) e j 2 π f c ( t τ i ) + V ˜ ( t ) + N ˜ ( t )
For fish echoes, based on the time delay difference τ i between the peaks of the signal envelopes after matched filtering, the echoes that are close to each other can be eliminated and judged as overlapping echoes. However, due to the existence of peak detection failure when individual echoes with significant differences in target strength overlap, there is a possibility that the overlapping echoes will be misidentified as single fish echoes after the peak time delay estimation.

2.2.3. Detection of Single Fish Echoes Based on Instantaneous Frequency Characteristics

In order to effectively detect a single fish target and reduce the probability of the misjudgment of overlapping echoes when peak detection fails, time–frequency analysis is performed on the echo signals. The Hilbert transform is used to determine the signal instantaneous frequency and the instantaneous frequency variance, and the initial screening results obtained by the time delay estimation method are further adjudicated. The instantaneous frequency is the differentiation of the phase of the signal with respect to time. For point targets, the echo received by the sonar should have time–frequency distribution characteristics that are consistent with the transmitted signal.
An analytic expression for the Hilbert transform:
Z ( t ) = X ( t ) + j H ( X ( t ) ) = A ( t ) e j ψ ( t )
where
H ( X ( t ) ) = X ( t ) 1 π t = 1 π X ( τ ) t τ d τ
A ( t ) = [ X ( t ) 2 + H ( X ( t ) ) 2 ] 1 / 2
ψ ( t ) = arctan [ H ( X ( t ) ) / X ( t ) ]
For the fish echoes, the instantaneous frequency is estimated to be:
f ( t ) = 1 2 π d [ ψ ( t ) ] d t = 1 2 π d [ arctan [ H ( X ( t ) ) / X ( t ) ] ] d t
Using a sliding window to find the signal instantaneous frequency variance β var :
β v a r = 1 N n = 1 N ( f n f n ) 2 , n = 1 , , N
where f n is the instantaneous frequency of the time-varying signals and f n is the instantaneous frequency at the center position of the sliding window. N is the length of the sliding window, which in the experiment was 200.
Ideally, for a single fish target, the instantaneous frequency of its echo signals should be a straight line with a slope of K . The instantaneous frequency variance reflects the degree of deviation of the signal’s instantaneous frequency sequence from the center, and the instantaneous frequency variance β v a r of the single target’s echo should converge to 0, which is quite different from the overlapping echoes of a single fish and the noise signals.

2.2.4. Simulation and Threshold Setting

We established a fish school echoes model, as shown in Figure 1, and simulated the individual fish echo detection process shown in Figure 2. We simulated the fish echoes under different scenarios, densities, and spatial distribution states by setting different signal-to-noise ratio conditions, the spacing between monomer and group targets, and the number of group targets, respectively.
In the process of single echo detection, the peak detection threshold PeakAmp is set through the peak detection algorithm combined with the target strength range of the target fish species, which can be filtered on the peak amplitude and can obtain the peak point moment. The target strength is a measure of the proportion of the incident and backscattered energies of a target, which are related to the individual size of the target species and the detection frequency. The target strength is defined as [27]:
T S = 20 log T L + b 20
where T L is the average body length of fish in each size segment, and b 20 is the fitted intercept at a fixed slope of 20.
The peak detection threshold can be estimated based on the individual size of the detected species; the detection frequency combined with an empirical model of the target strength and the reference thresholds for economic fish species at several detection frequencies are shown in Table 1. The echo peak delay threshold PeakT is set, and the estimated delay between the peaks of the echoes is filtered based on the pulse width of the transmitted signal to exclude overlapping echoes and to obtain the peak position of the suspected single fish echo. The threshold PeakT is only related to the transmit signal pulse duration. The instantaneous frequency variance threshold PeakVar is set to differentiate between the single and overlapped echoes. When the instantaneous frequency variance β v a r is lower than the threshold, the target signal segment will be acquired, and the threshold PeakVAR is only related to the signal-to-noise ratio.
The thresholds used in the simulations and experiments and the amplitude reference thresholds for some species of fish are shown in Table 1.

2.3. Measurement Method

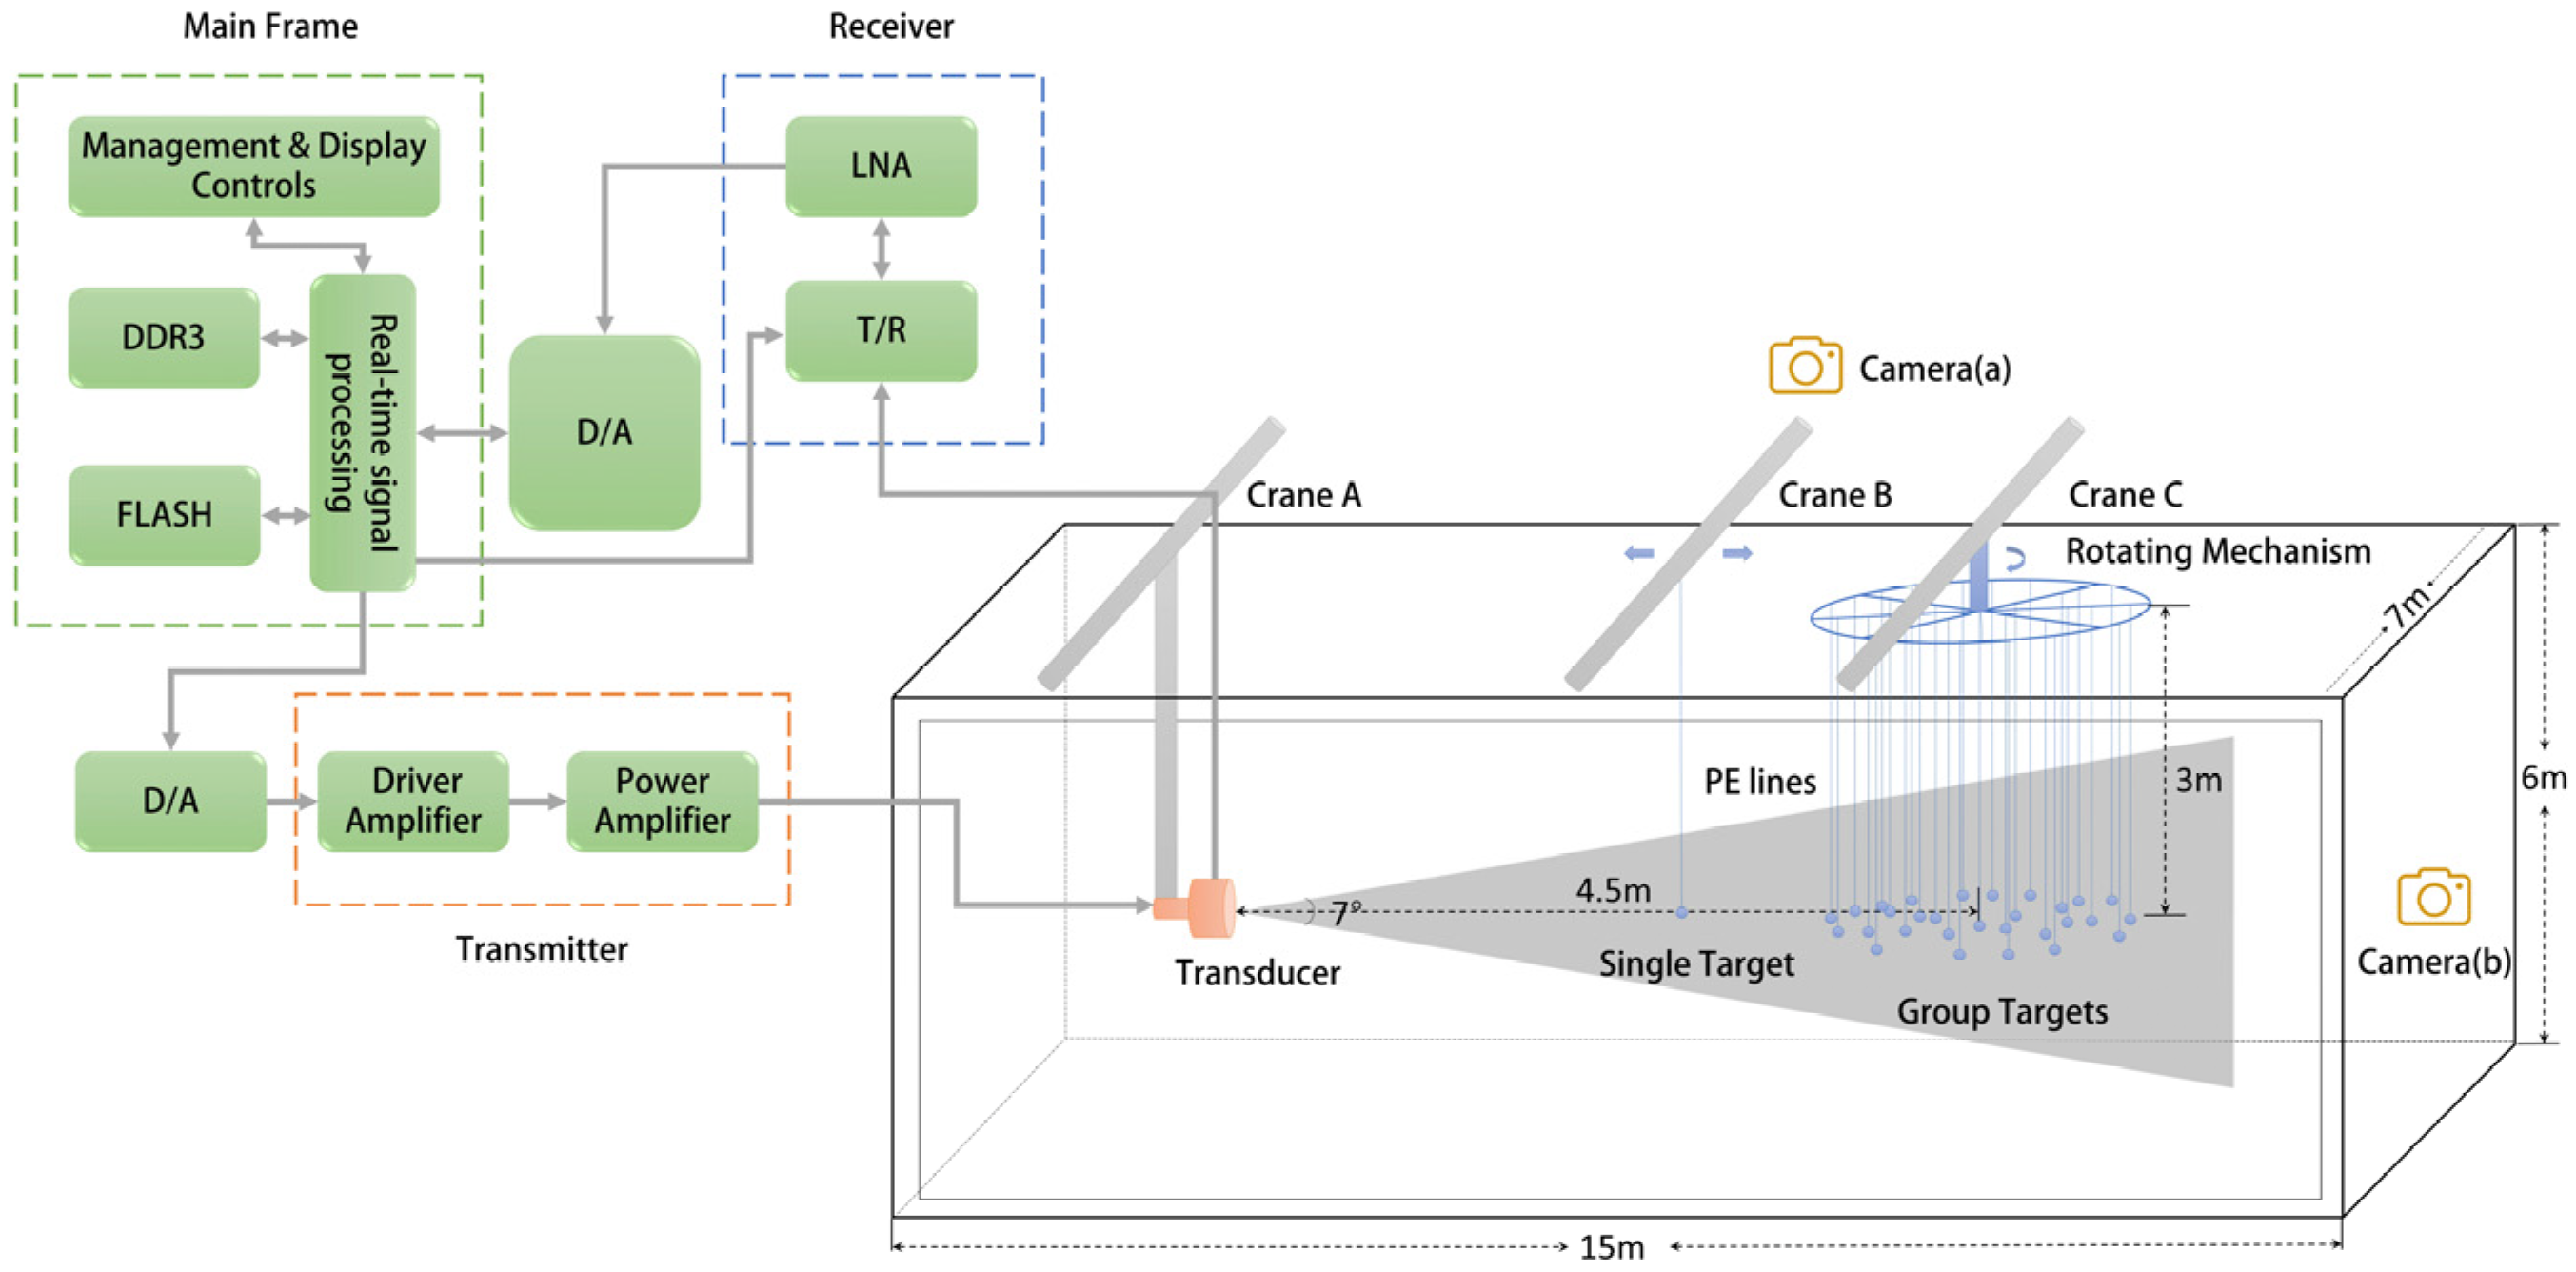
2.3.1. Apparatus Configuration

In order to verify the proposed method and performance of the single fish target echo recognition, we built an experimental platform in the anechoic tank, which is shown in Figure 3.
The experimental setup was built in an anechoic water tank, as shown in Figure 3, with dimensions of 15 m × 7 m × 6 m. At a depth of 3 m in the tank, the transducer, the single target, and the group targets were set up sequentially. Among them, the SIMRAD ES200-7C transducer was placed on Crane A. The single fish target simulated by a tungsten carbide alloy ball (diameter 20 mm), which can be moved with Crane B to simulate different target spacing for singles and schools, was suspended under Crane B. Groups of fish targets simulated by tungsten carbide alloy balls were suspended beneath the rotating mechanism (diameter = 2 m) and randomly distributed (Figure 3). The discs were fixed on the rotating mechanism of Crane C and could be rotated accordingly to simulate the state and spatial distribution of different fish groups. Cameras a and b were installed at the top of the anechoic water tank and underwater to monitor the distance and status of the single and group targets.
Hardware synchronization was used between the boards of the experimental platform, and the in-house software used the Intel math kernel library, including transceiver control, bandpass filtering, data storage, export, and other functions, which were used to collect the echo signals. The configuration information of the experimental platform is shown in Table 2.

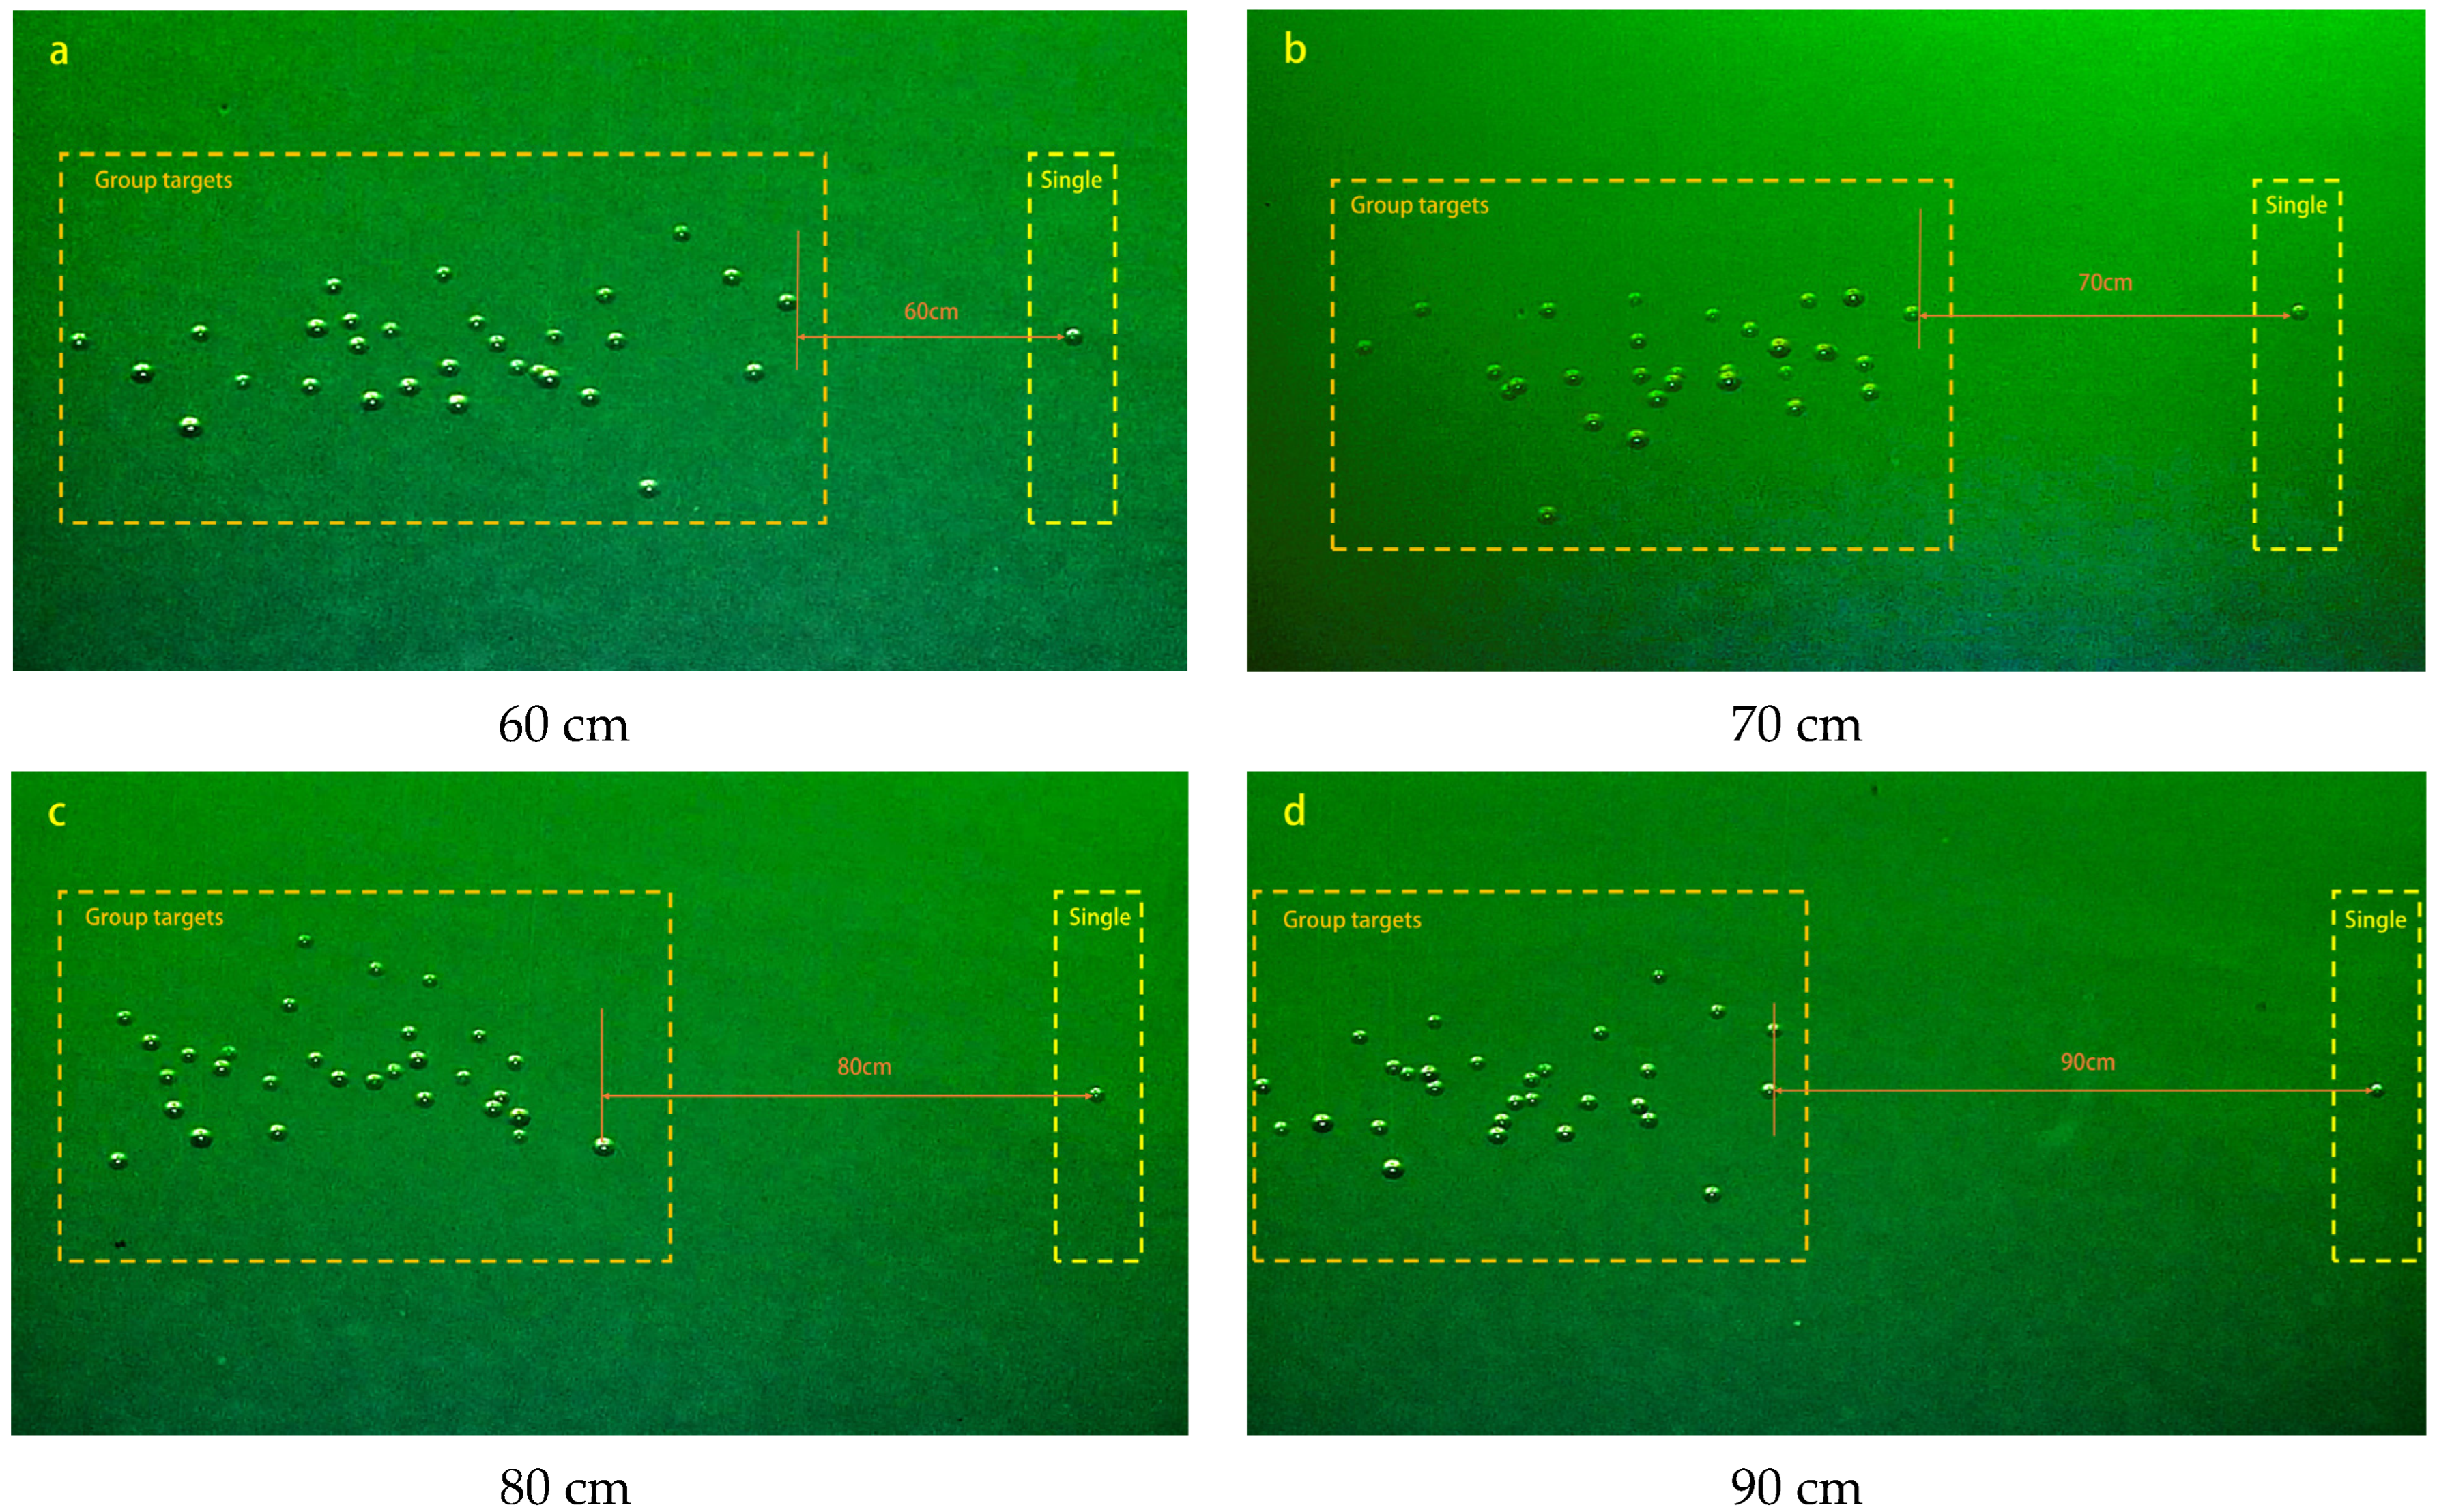
2.3.2. Echo Acquisition

From 10 to 20 June 2023, we collected group echoes under different conditions in an anechoic water tank. Parameters such as water temperature in the tank were measured before the start of the experiment. The water temperature was 20 °C, and the sound velocity was about 1460 m/s. The experimental platform was calibrated using a tungsten carbide alloy ball with a diameter of 38.1 mm and calibrated again at the end of the experiment [16,30]. We calculated the theoretical target strengths of the tungsten carbide spheres used for the experiments and compared them with the collected echoes; the calculated values were comparable to the theoretical estimates. The experiment ensured that all targets were outside the near-field range, according to the near-field range calculation formula:
R C = π D 2 / 4 λ
where λ is the wavelength, and D is the diameter of the transducer; the near-field range of the ES200-7C transducer is 1.07 m.
Signal transmitting and receiving were performed by a 4-channel split-beam hydroacoustic transducer with a center frequency of 200 kHz. The transmitted pulse had the duration T = 1 ms , and the signal bandwidths were set to 20, 40, 60, 80, and 100 kHz. The echo signals were collected at a sampling rate of 2 MHz. The spacing between the single target and the group of targets was defined as the distance from the single fish to the target which was closest to the single fish (Figure 4) and was set to the values 60, 65, 70, 75, 80, 85 and 90 cm. Randomly changing the angle of the rotating mechanism gave different simulated spatial distributions of the fish school for each of the above spacings. An ensemble of 680 groups of echo data was obtained; the groups corresponded to the various rotations for the seven spacings. Examples of the target distributions are given in Figure 4.

3. Results

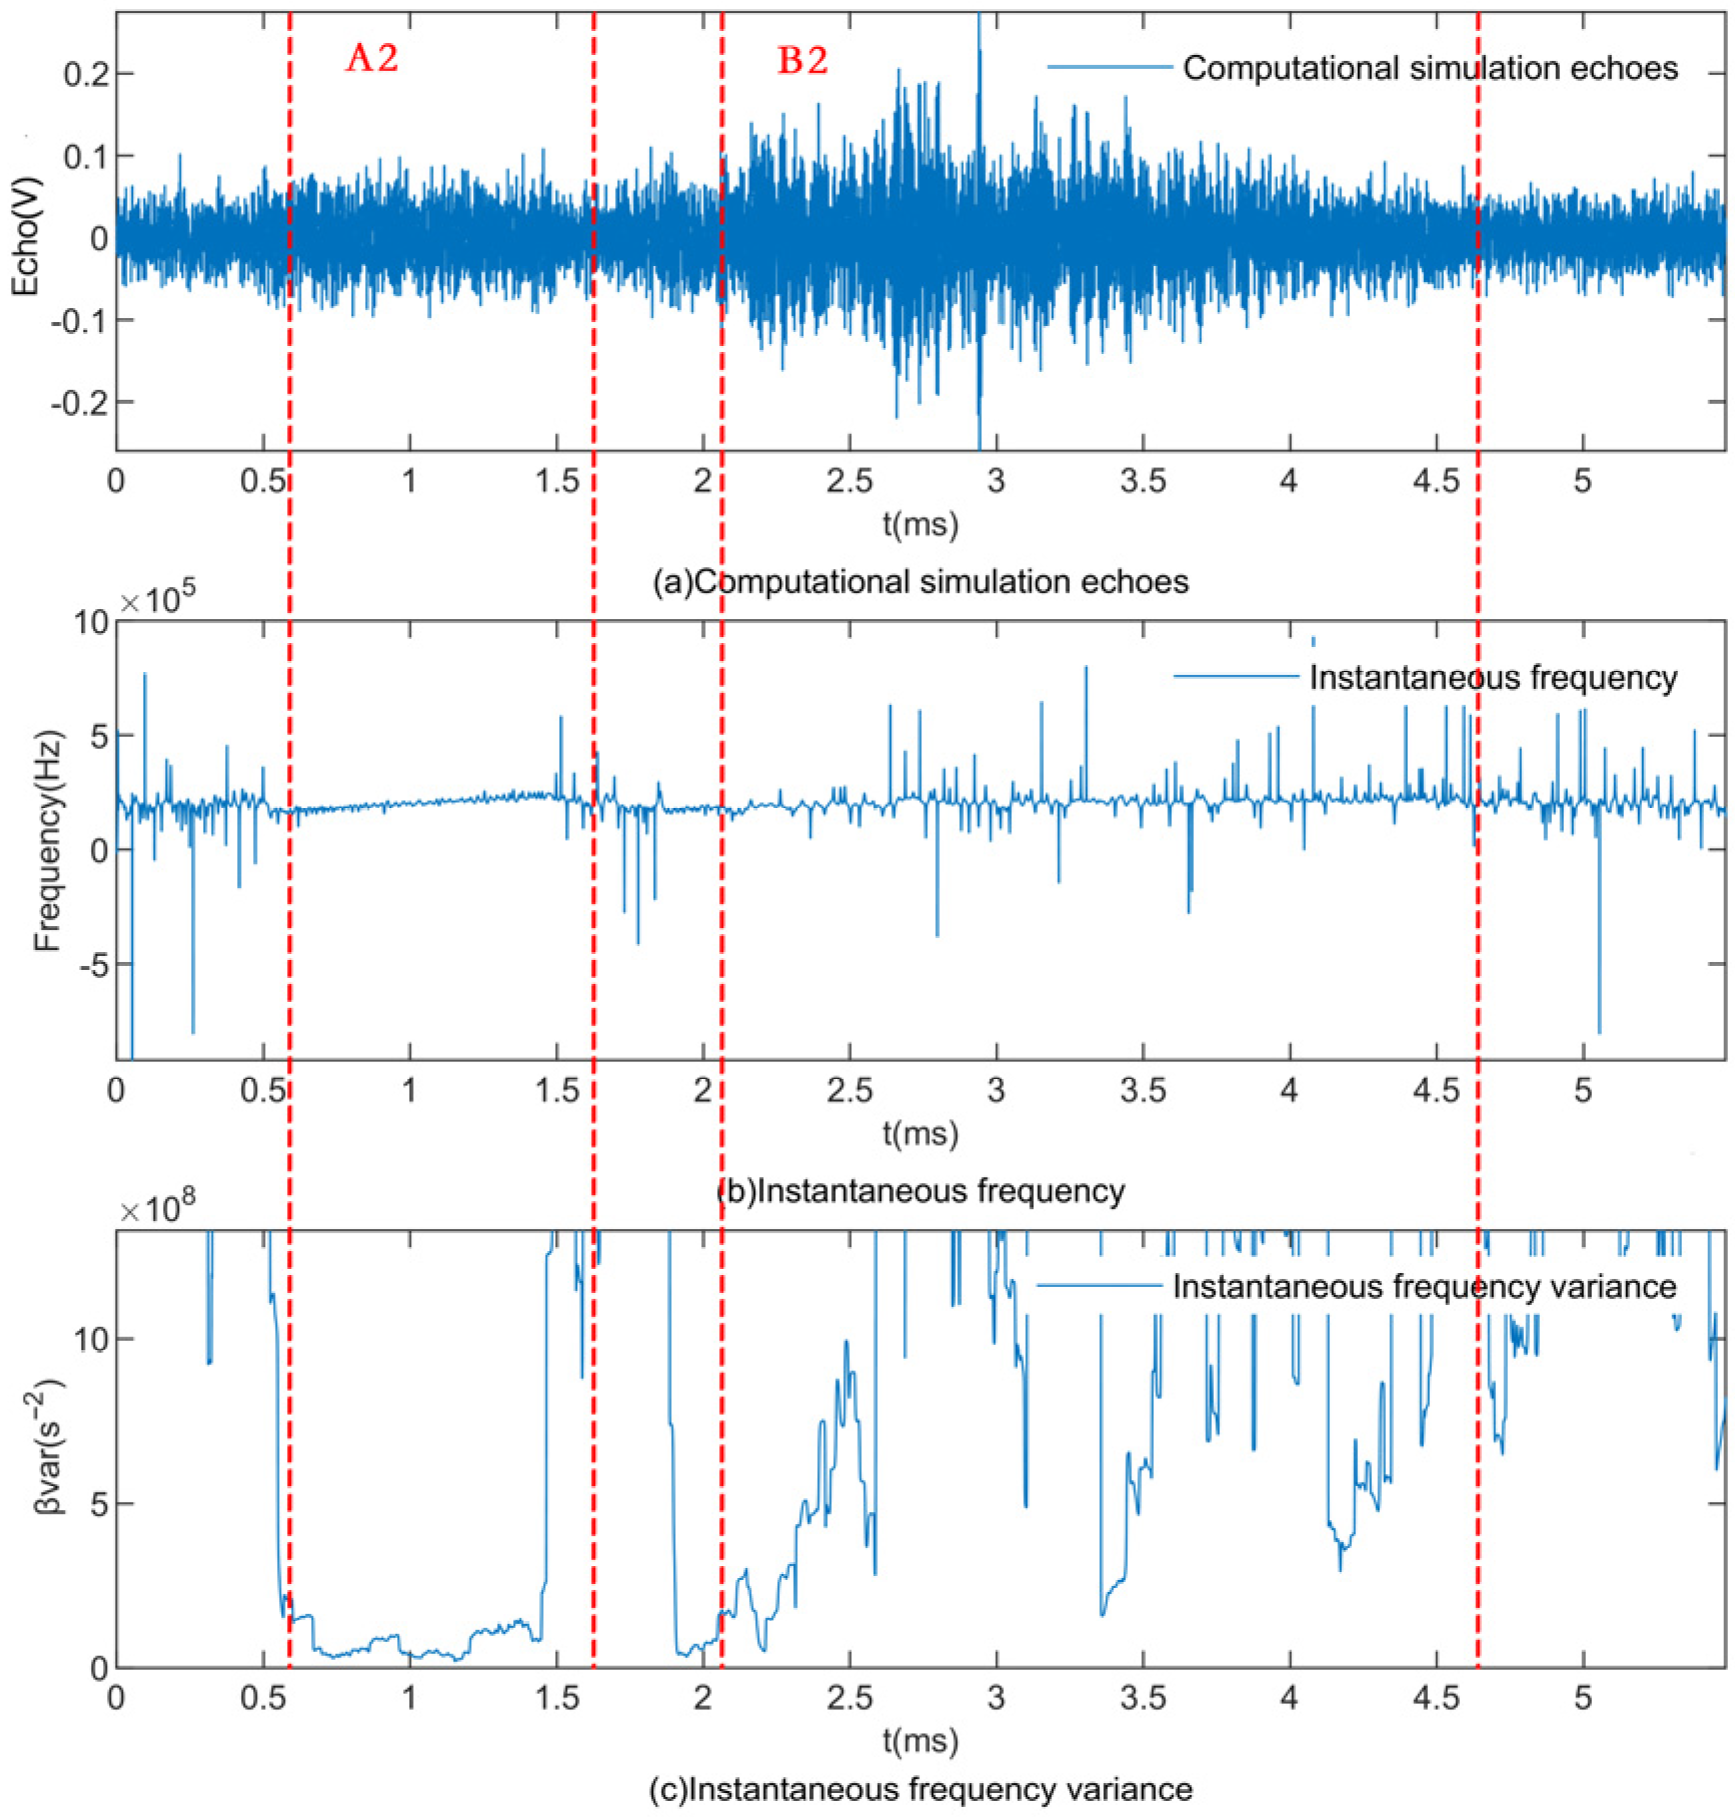
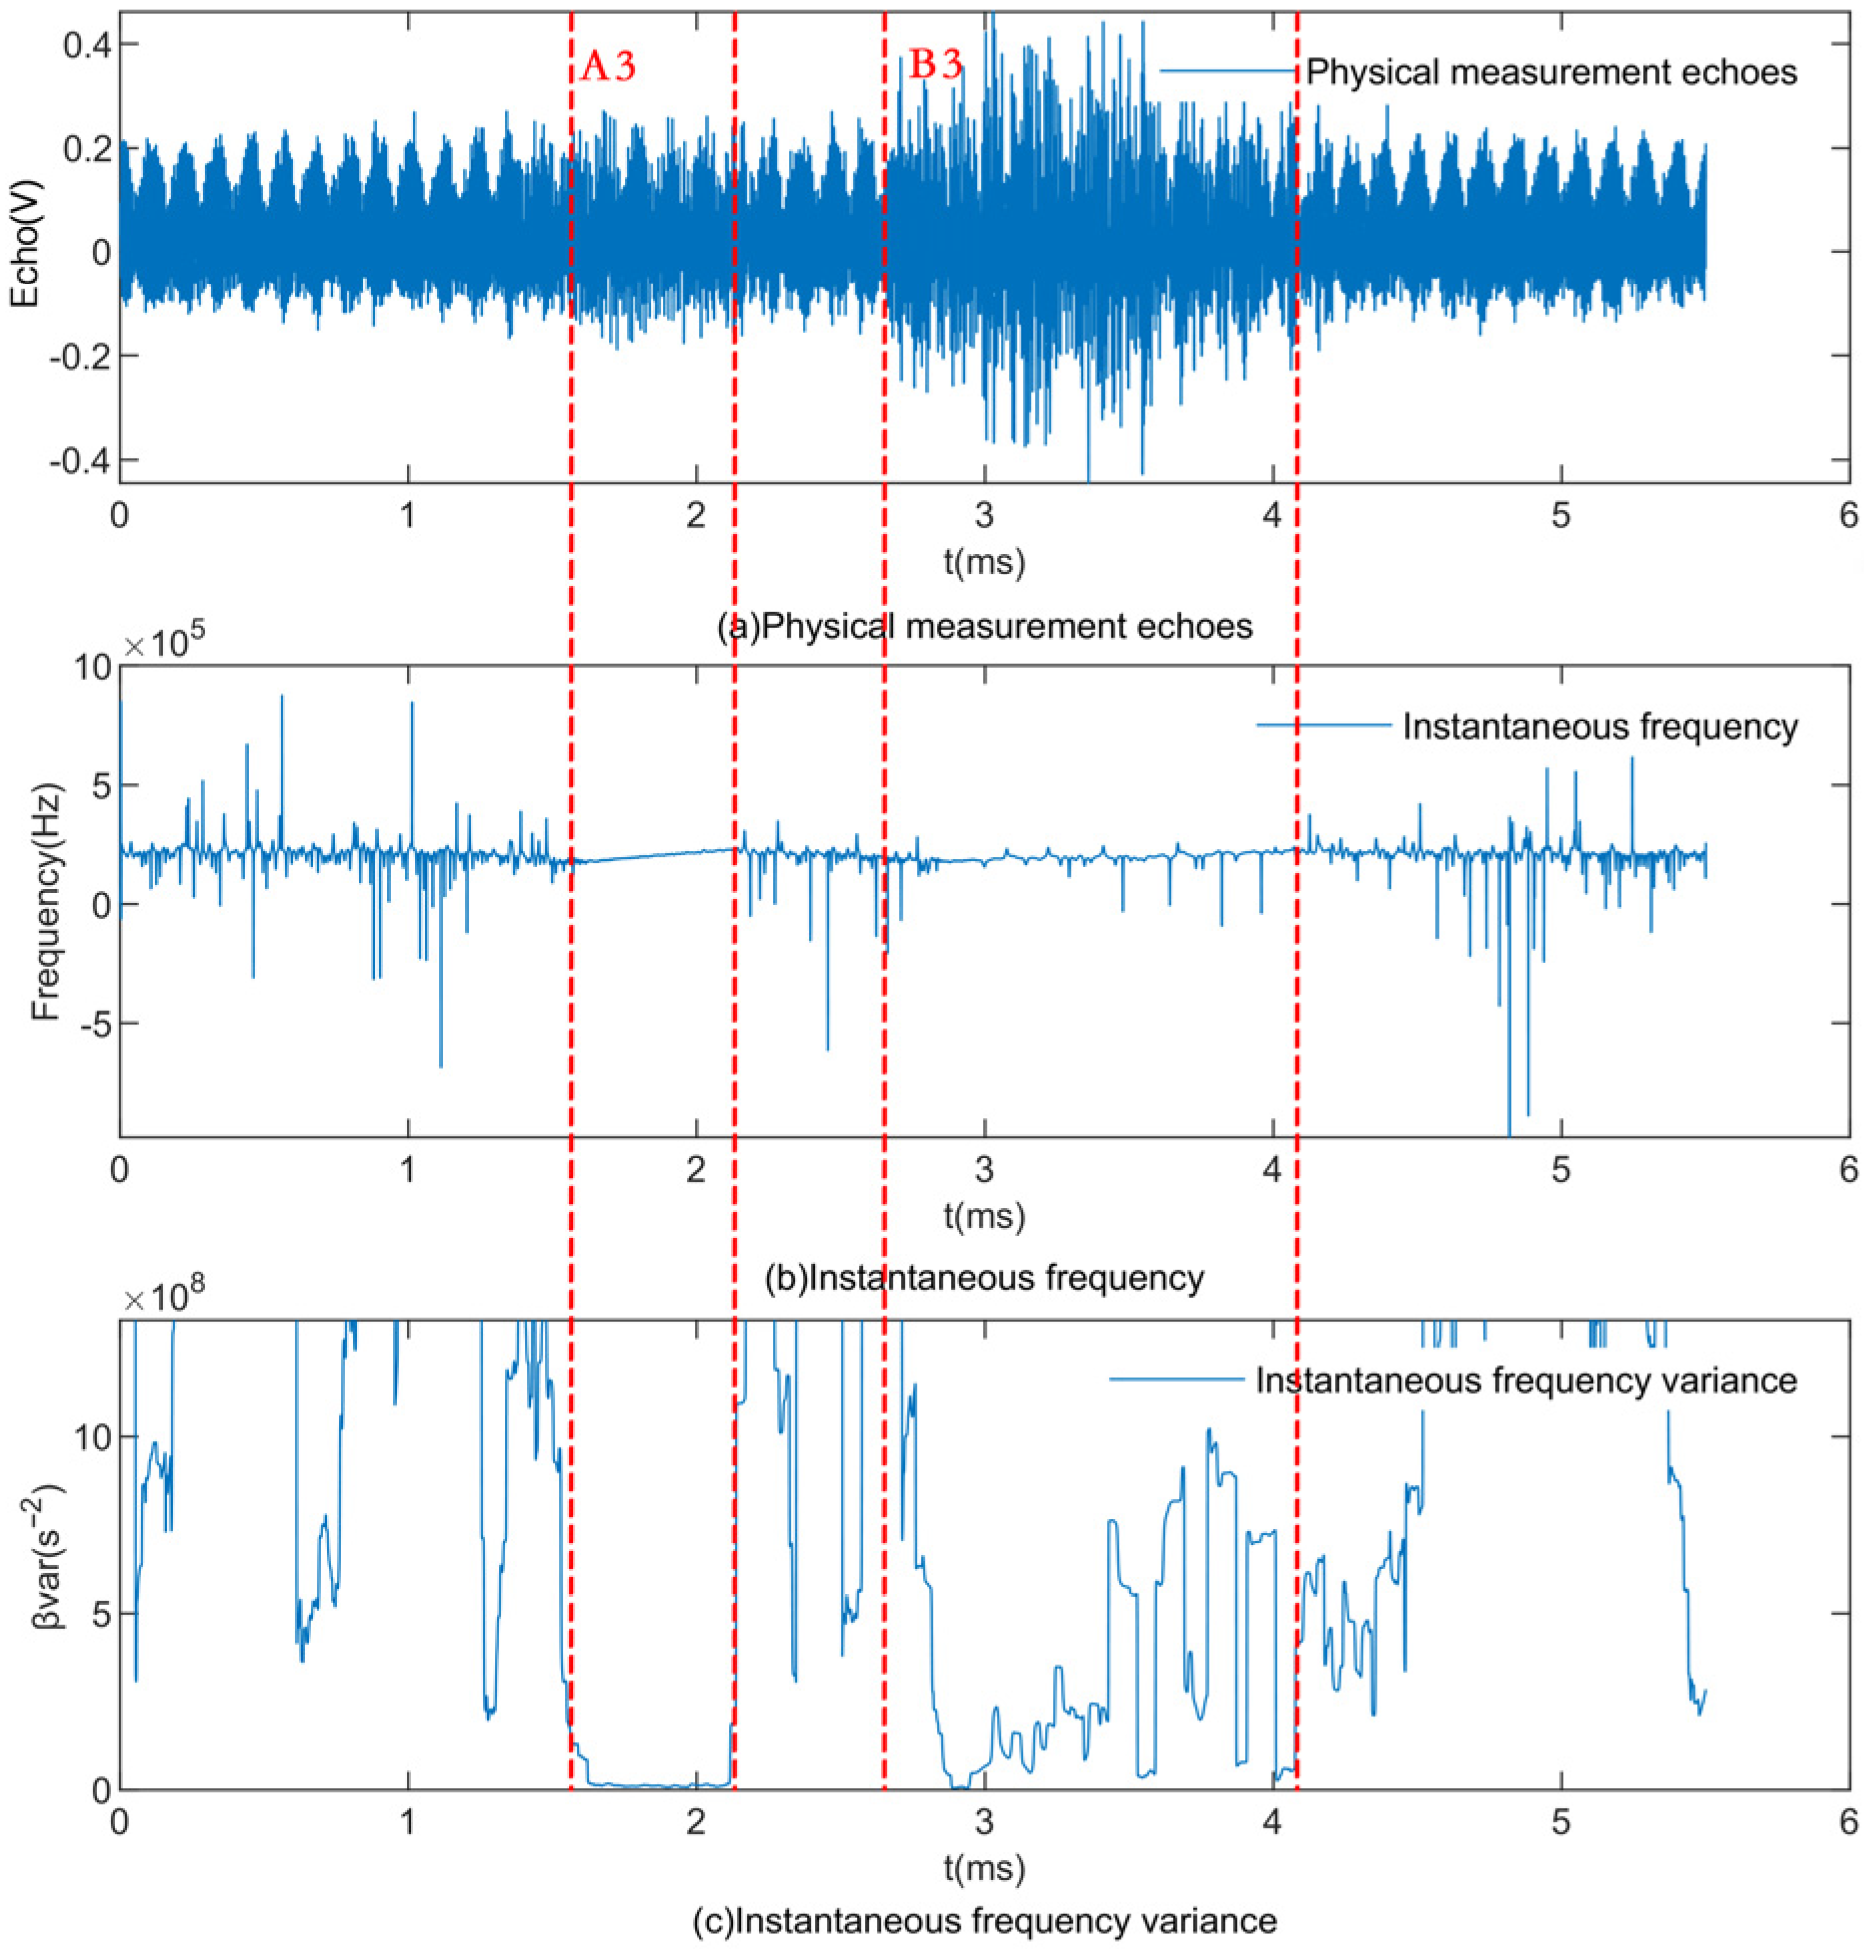
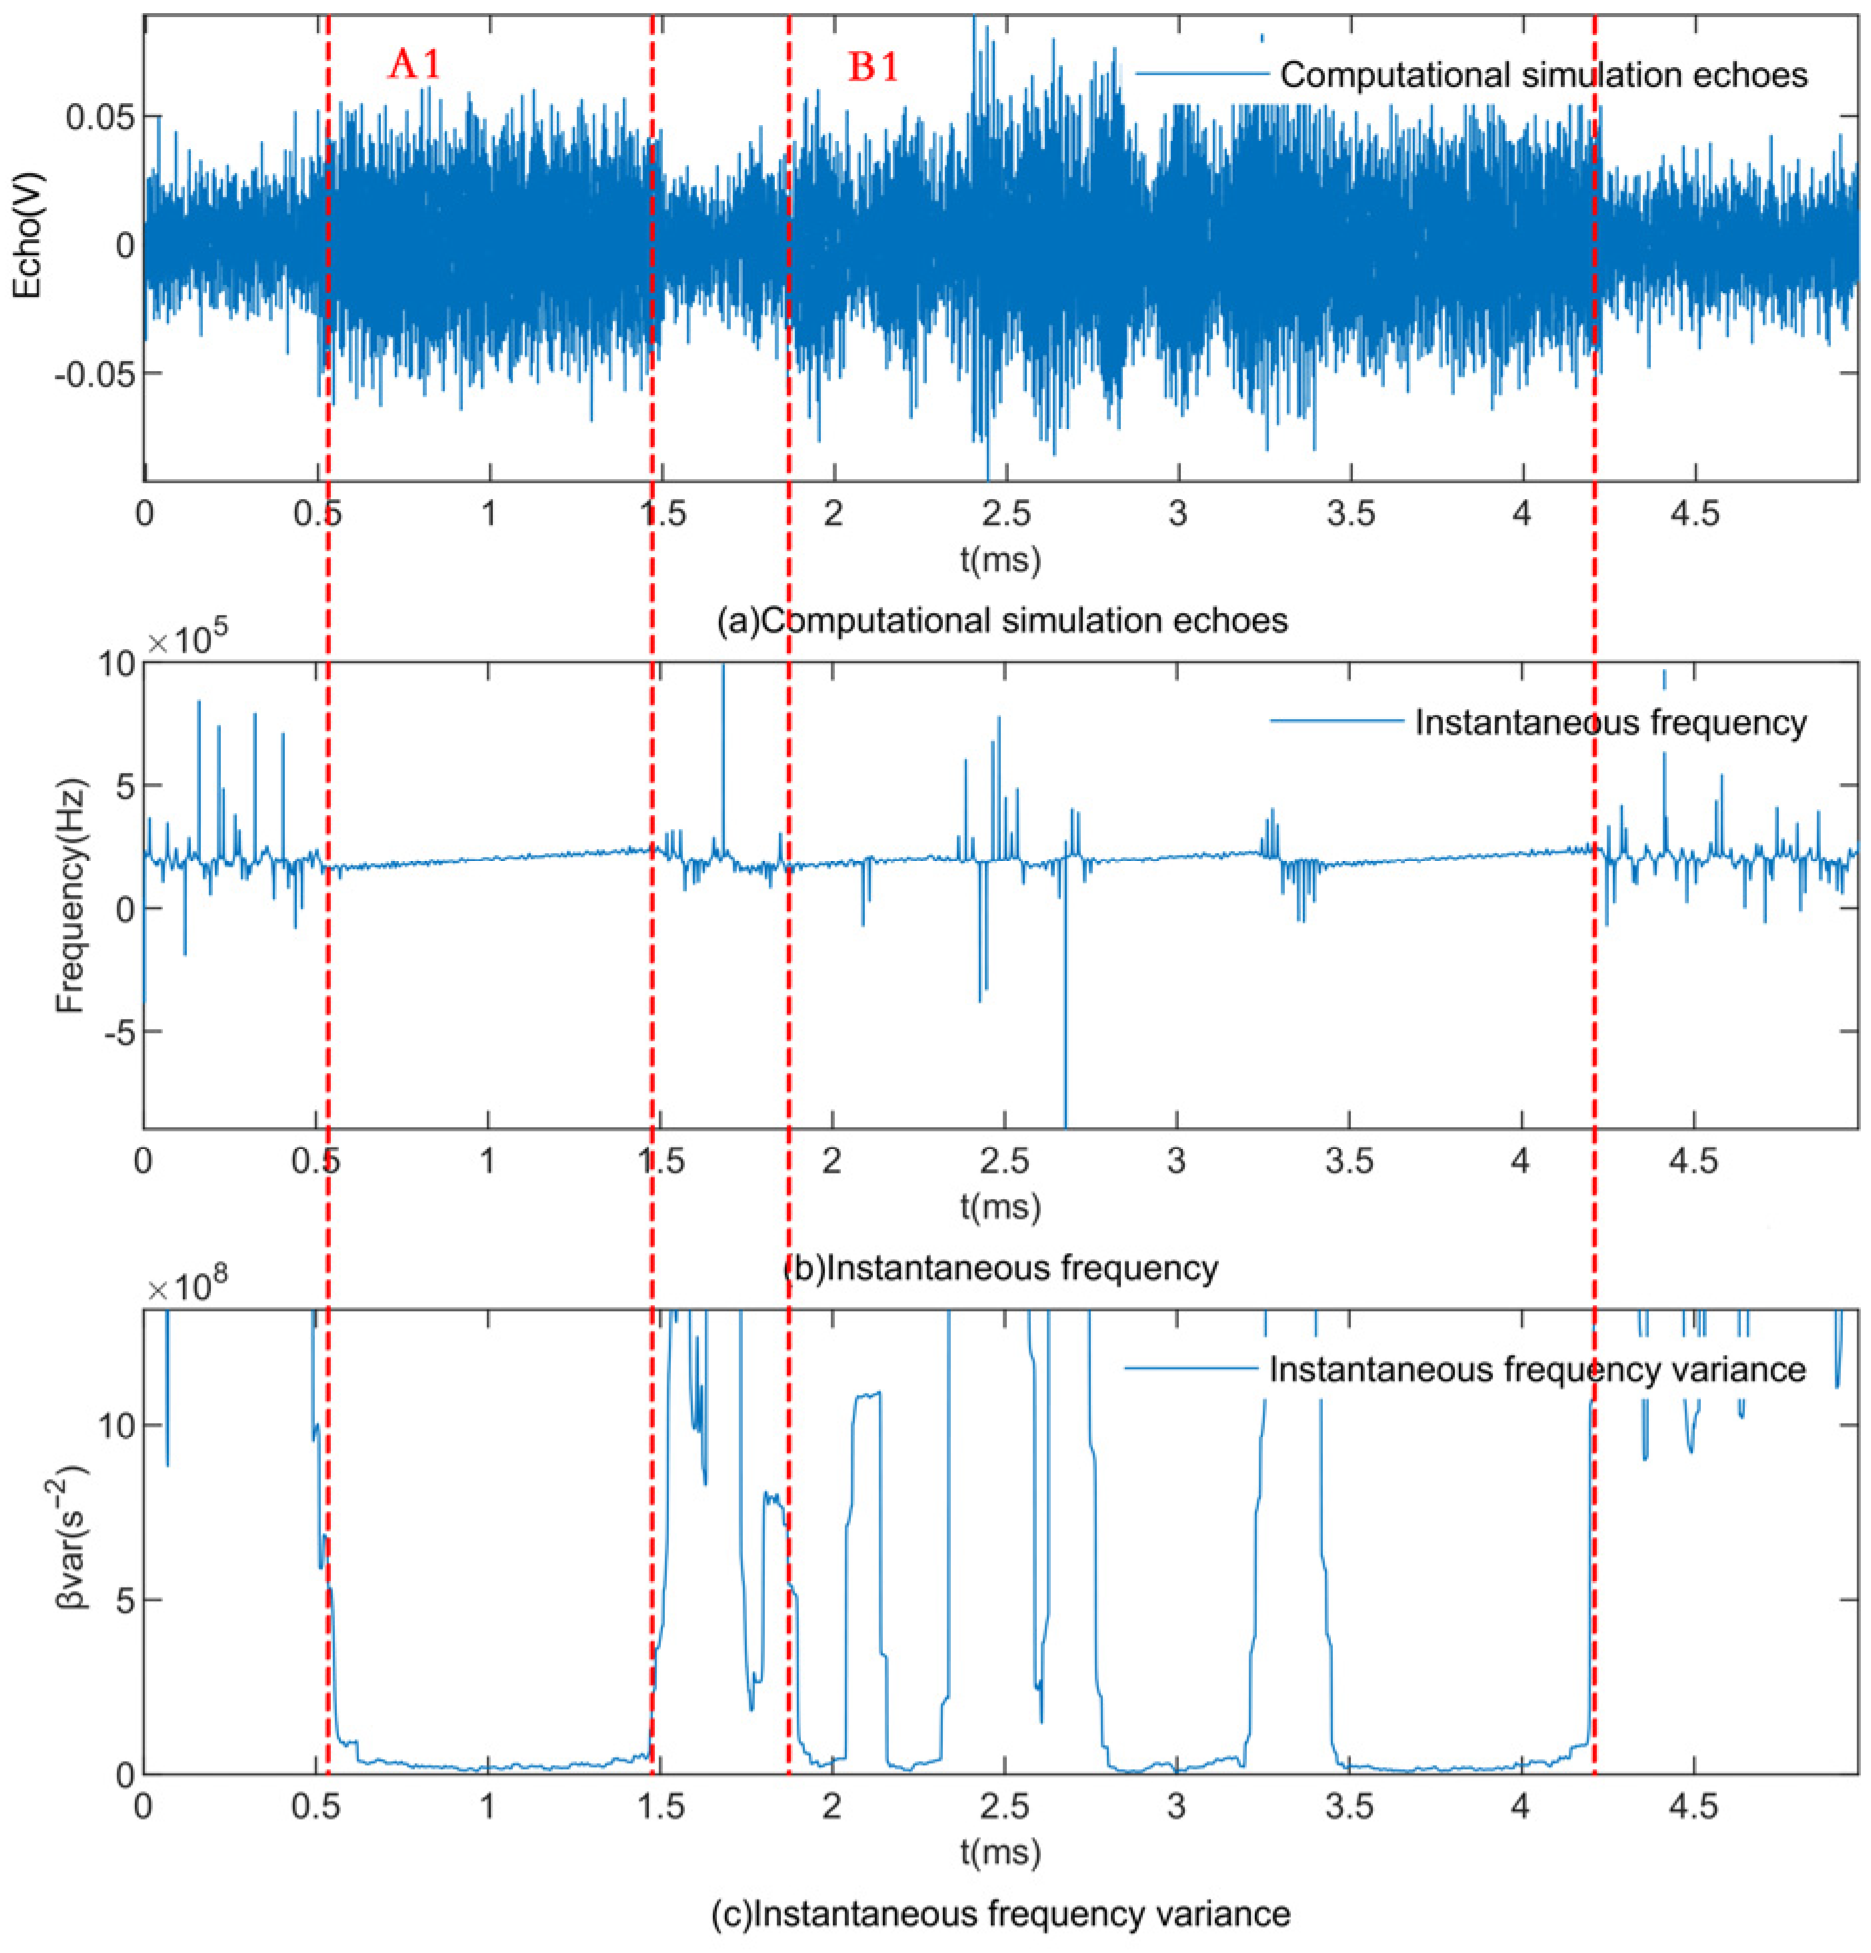
3.1. Instantaneous Frequency Estimation

Figure 5a shows a typical group target echo, including a single target echo and overlapping echoes. Among them, rectangle A1 is the single target echo, and rectangle B1 corresponds to the overlapping echoes. Based on the Hilbert transform, the instantaneous frequency of the acquired echo signal is estimated. The result is shown in Figure 5b, which shows that the instantaneous frequency of the signal corresponding to the moment of the single target echo is a tilted straight line with no frequency jump. The time width is close to the pulse width of the transmit signal, which is about 1 ms. The result of obtaining the variance of the instantaneous frequency through a sliding window is shown in Figure 5c. The instantaneous frequency variance of the signal corresponding to the single target echo tends to be close to 0, which is significantly different from that of the overlapped echoes. The single target and overlapped echoes can be distinguished by setting a reasonable instantaneous frequency variance threshold.
Under the equivalent conditions of spacing 80, bandwidth 100 kHz, duration of transmitted signal T = 1 ms, and the number of group targets set at 30, Figure 6a shows the echo signals of the fish group simulated by the computer, and Figure 7a shows the echo signals of the physical model of the fish group actually captured in the anechoic pool. After a consistent processing procedure, it can be seen that the experimentally collected single target echo has an instantaneous frequency characteristic which is consistent with the simulation. It can be discriminated by relying on the instantaneous frequency variance threshold, where A2 and A3 are single targets and B2 and B3 are group targets.

3.2. Single Target Echo Detection Performance in Computational Simulations

In order to analyze the detection performance of the single target recognition method, we conducted separate simulations for the conditions that may affect the detection performance, such as threshold setting, individual and group target spacing, and fish density. We used farmed yellow croaker as a reference fish species and obtained the simulated echo amplitude with reference to its target strength. In the simulation, we simplified the single fish as a point target and considered the target strength in the range of −56.9 to −29.3 dB, which corresponds to the empirical target strength range of the yellow croaker. The pulse width of the transmit signal was set to 1 ms, the bandwidth was set to 80 kHz, and 5000 Monte Carlo simulations were performed to obtain the single target echo detection accuracy and the overlapping echoes misclassification rate under different conditions, respectively.

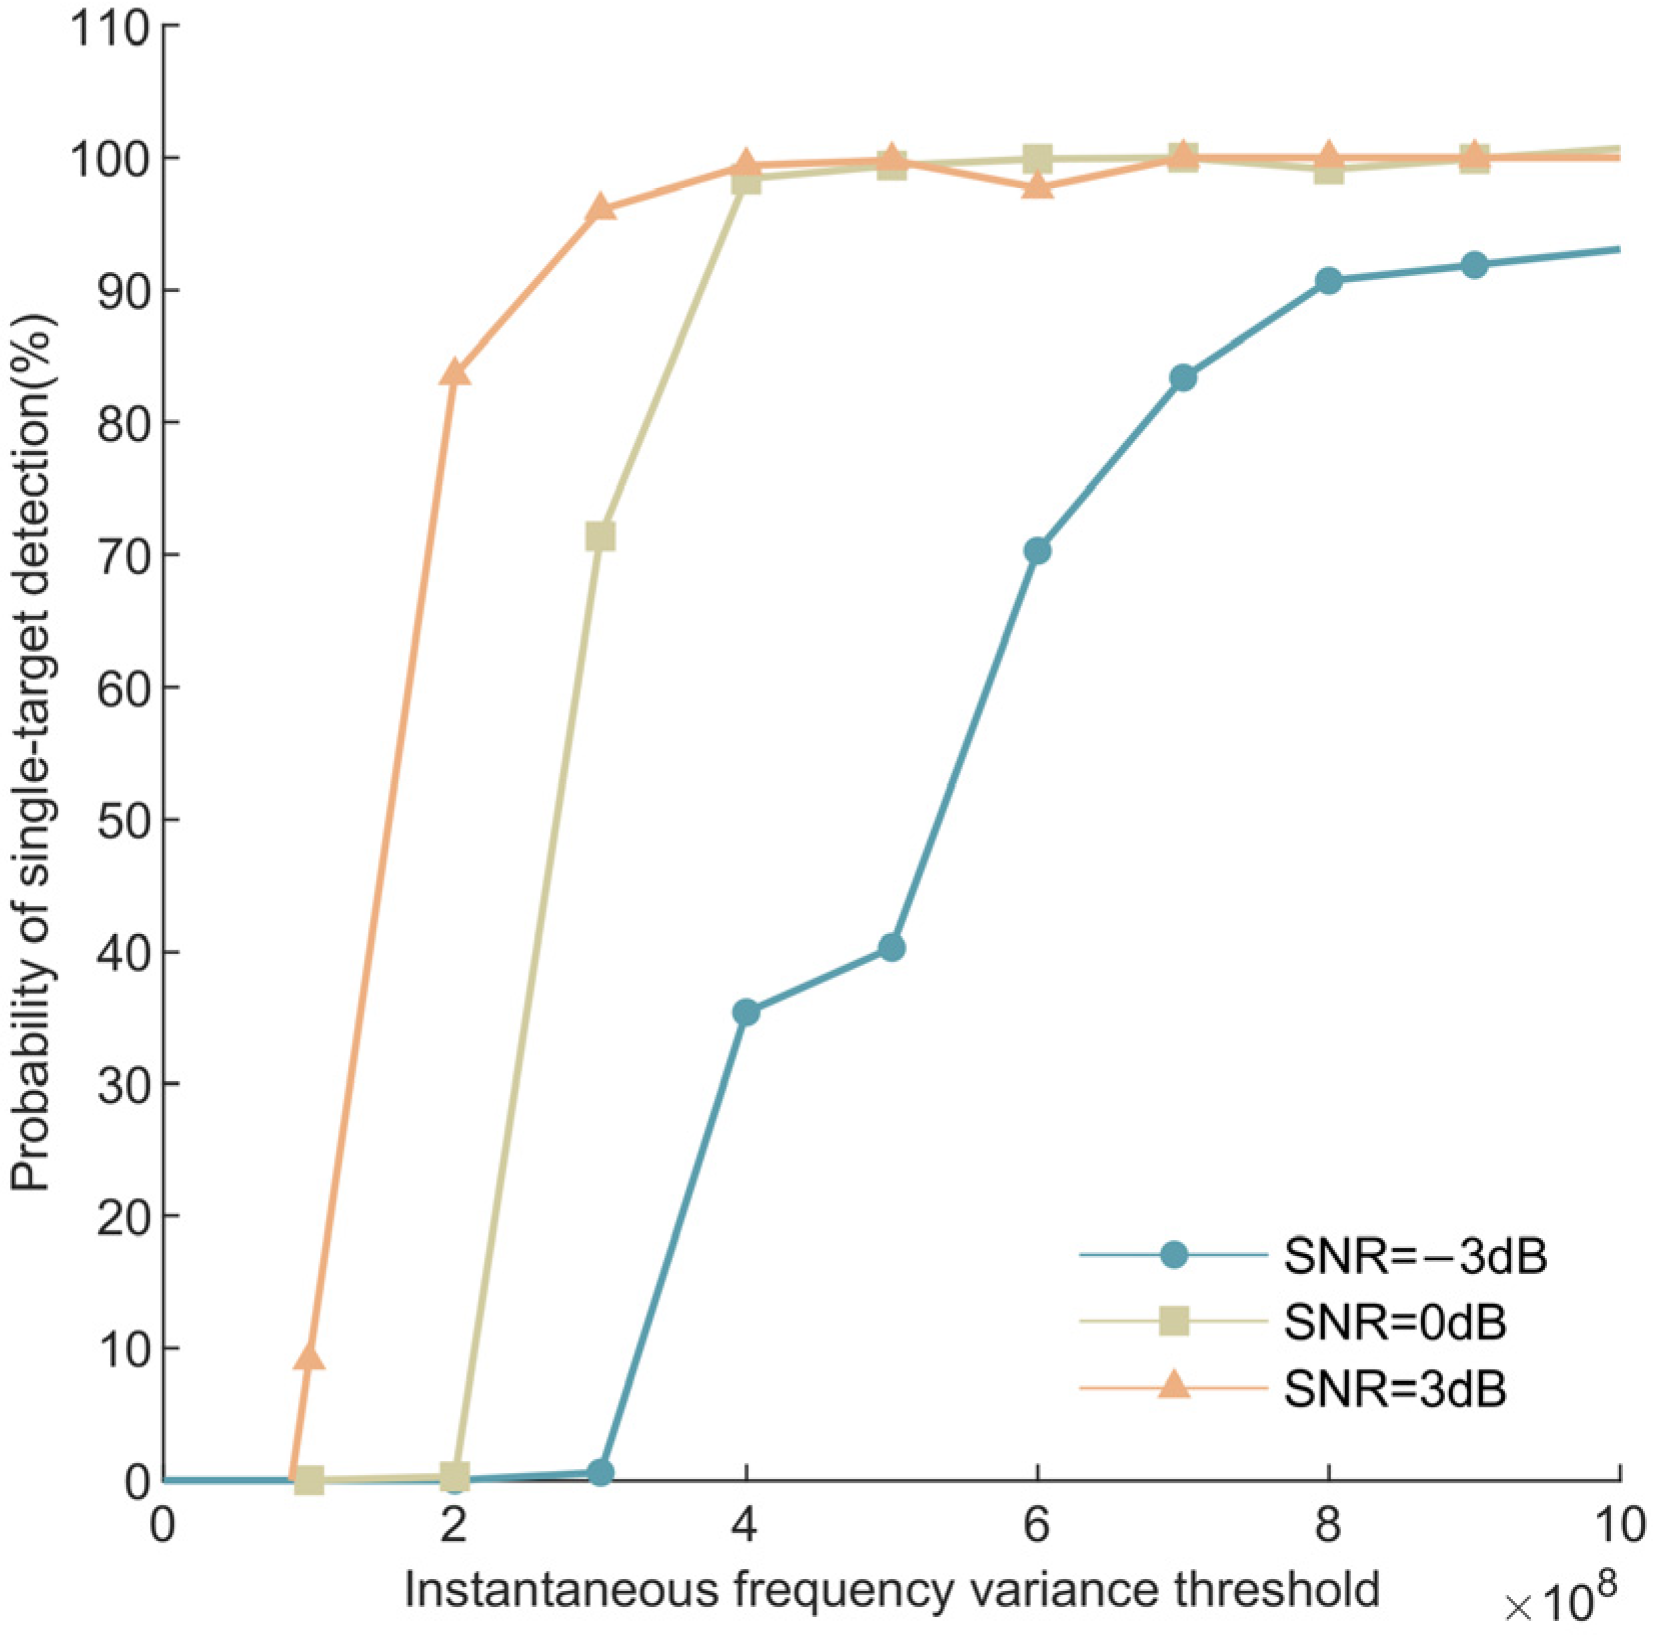
3.2.1. Effect of Instantaneous Frequency Variance Threshold on Single Target Detection Probability in Computational Simulations

Figure 8 shows the effect of the instantaneous frequency variance threshold setting on the accuracy of single target echo detection under different signal-to-noise ratio conditions. When the density of the fish group is set to 10 fish/m3, and the spacing between the single and group targets is 90 cm, the simulation results show that with the increase in the instantaneous frequency variance threshold, the probability of single target detection gradually increases. When the instantaneous frequency variance threshold is set to 8 × 10⁸ and above, the detection probability of single target echoes can reach a level of 90% under the condition of SNR = −3 dB. Theoretically, its instantaneous frequency variance for the single target echoes tends to be close to 0. However, by the noise interference, the instantaneous frequency of the small target individual echoes will appear to have a certain degree of jitter, and appropriately increasing the detection threshold can increase the detection rate of the single target echoes.

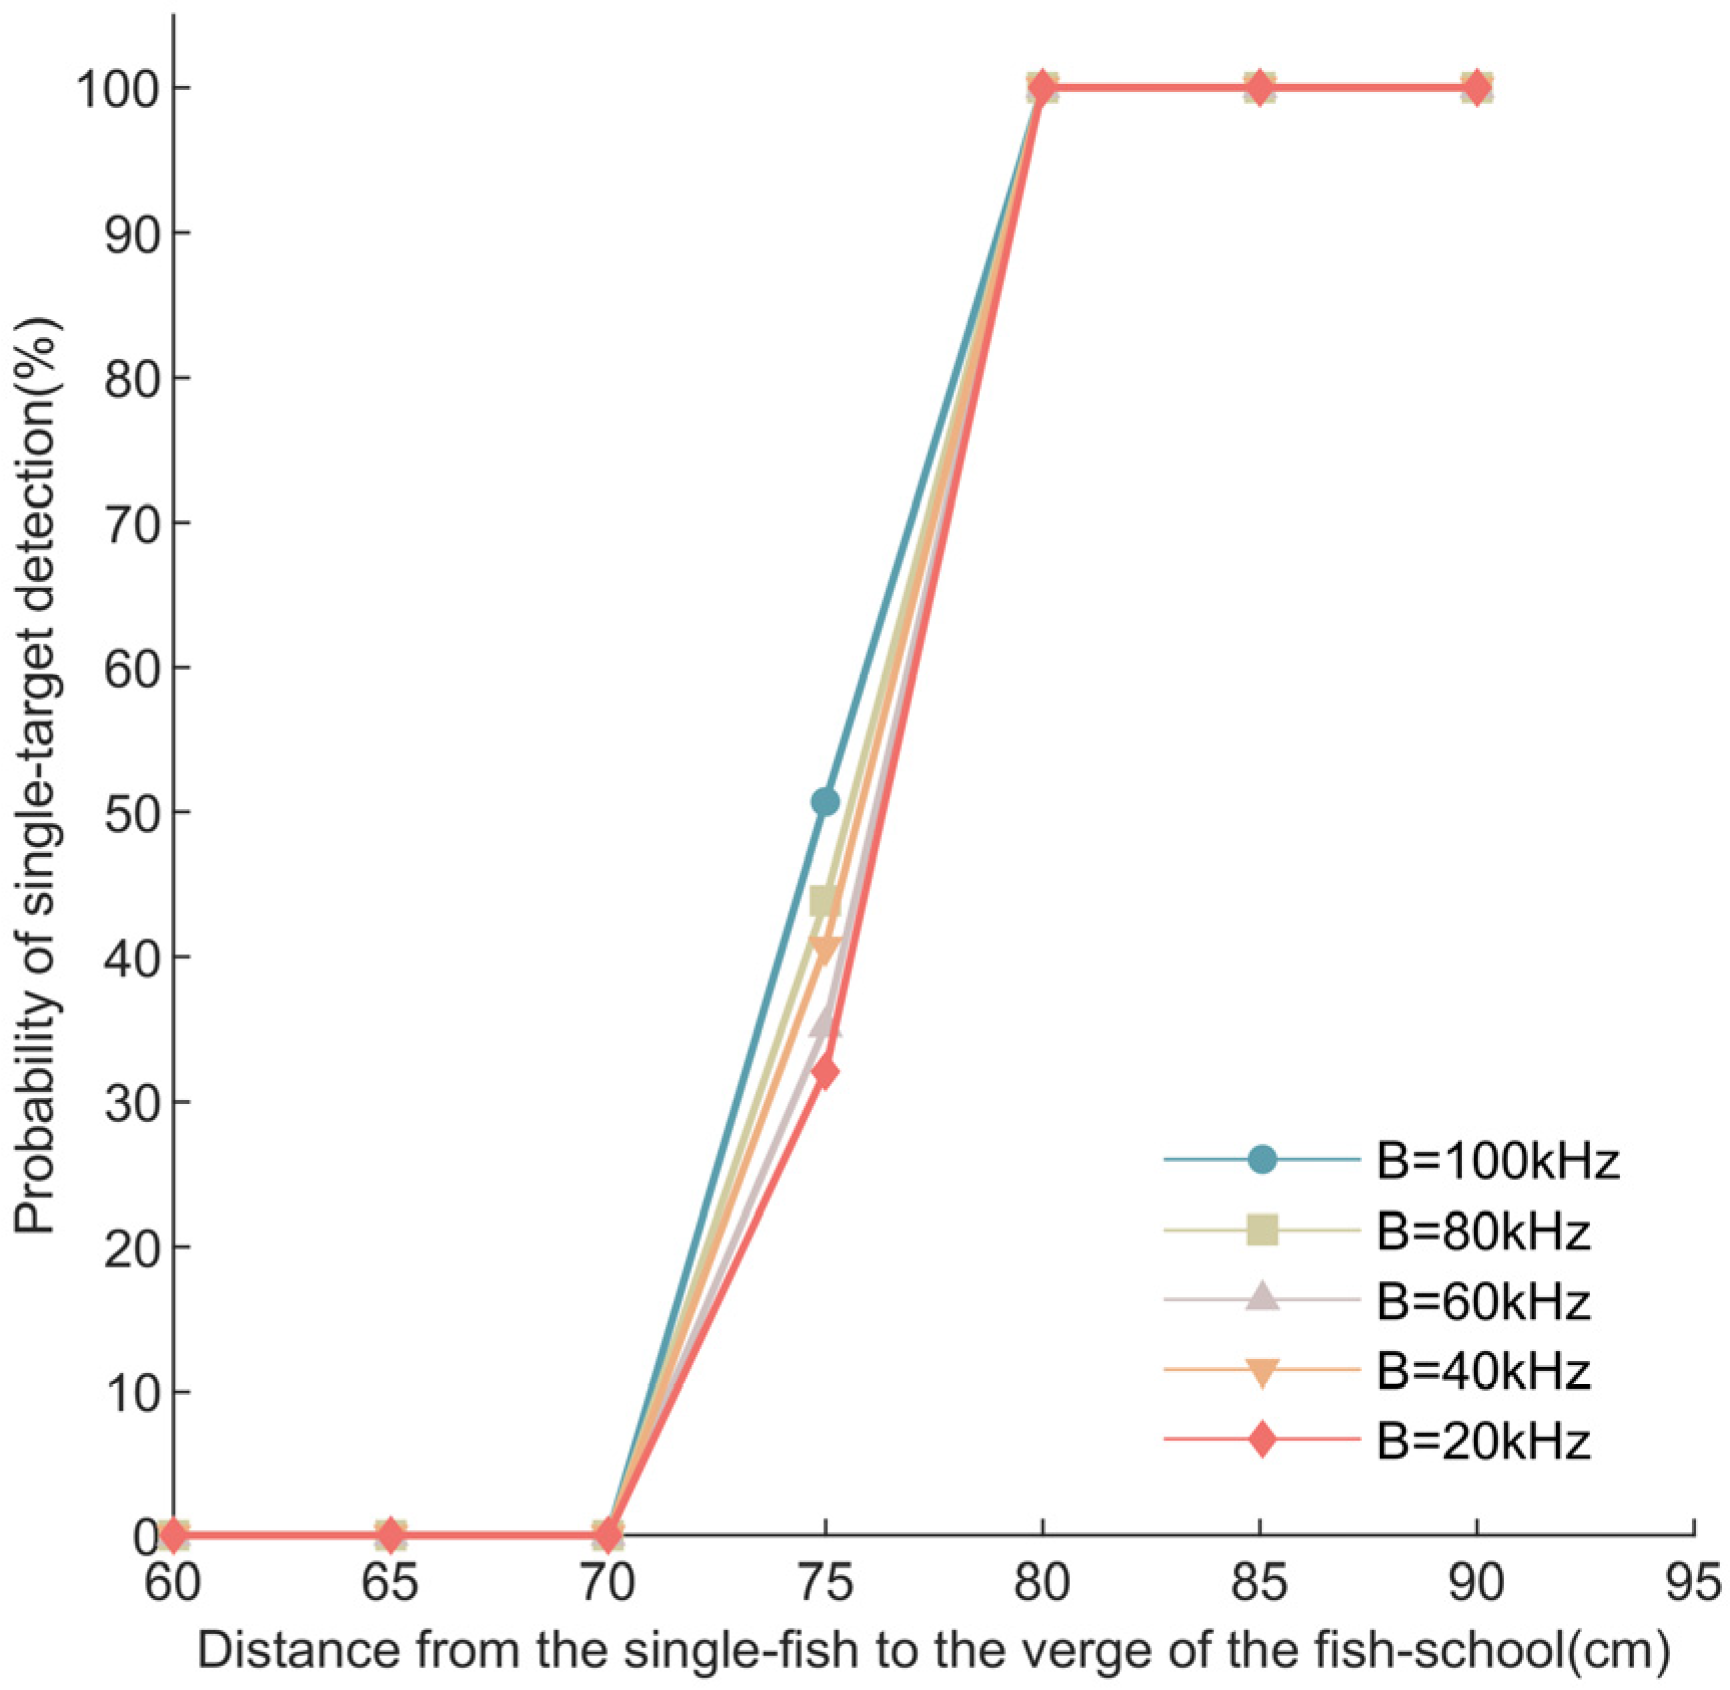
3.2.2. Effect of Monomer Group Spacing and Signal-To-Noise Ratio on Monomer Target Recognition Probability in Computational Simulations

Compared with the narrowband signal system, which can only obtain better distance resolution by narrowing the transmit signal pulse width, the better distance resolution brought by the matched filtering technique can better differentiate the individuals that are close to each other while guaranteeing the transmit signal pulse width to obtain enough effective information. Figure 9 shows the probability of single target echo detection under different signal-to-noise ratio conditions and spacing between the single and group targets. The density of the fish schools is set to be 20 fish/m3, and the spacing between the single and group targets is 90 cm. For the LFM signal with a transmit pulse width of 1 ms, the minimum non-overlapping interval between the echoes of different targets is 75 cm. The simulation results show that the probability of detecting the echoes of the single fish is gradually improved with the increase in the spacing between the single target and the group targets. Above SNR = −3 dB, an excellent recognition effect can be obtained when the spacing between the single and group targets is more than 80 cm, and the recognition probability is more than 90%. At SNR = −5 dB, with the spacing increase, there is also close to 60% of the single target detection probability.

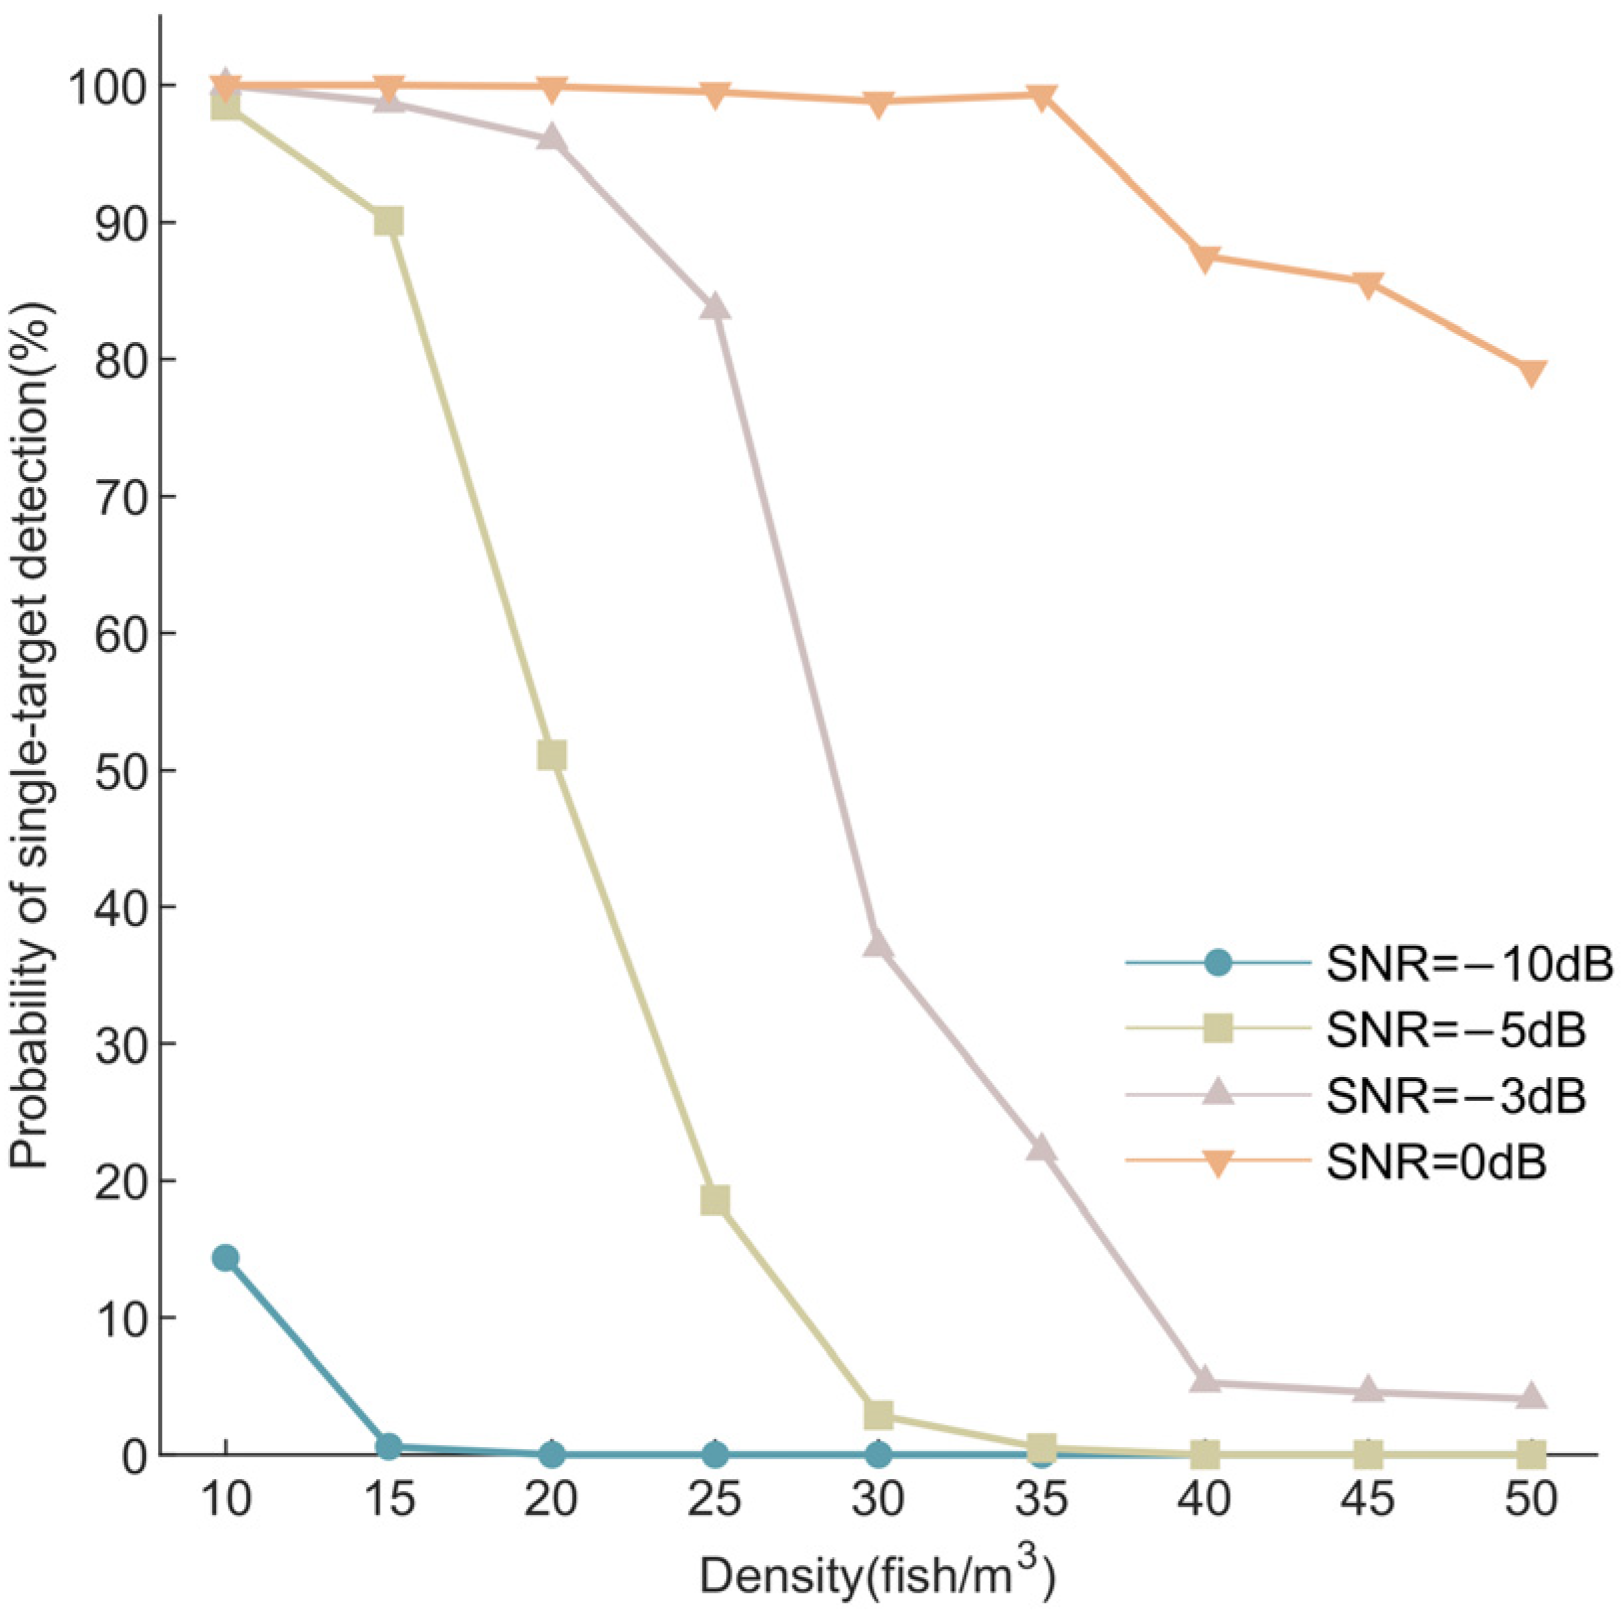
3.2.3. Effect of Fish School Density on Detection Probability in Computational Simulations

The density of the fish school is also an essential constraint on the effectiveness of single target recognition. When the density of the school is high, it dramatically reduces the probability that a single target will stray out of the school. As the spacing between single targets in the group space decreases, the separation performance of single fish echo decreases. In addition, the secondary scattering of acoustic waves between group targets increases with group density, which also brings more clutter interference. Figure 10 shows the probability of single fish echo detection for different signal-to-noise ratio conditions and fish density cases. The results show that as the density of the fish schools increases, the single fish echo detection probability decreases for all SNR conditions. At SNR = −5 dB and below, the single fish echo could not be detected effectively when the fish school density was more than 25 fish/m3. When SNR = −3 dB and above, the single fish echo could be detected effectively for a fish school density below 40 fish/m3. The high-intensity fish school’s recognition probability is higher when the signal-to-noise ratio condition is good.

3.2.4. Probability of Overlapping Echoes Misclassified as Single Echoes in Computational Simulations

In this experiment, there were three cases: recognizing the overlapping echoes as single target echoes (false positive detections); accurately recognizing the single target echoes (true positive detections); and having single target echoes but not recognizing them (false negative detections).
When the echoes are filtered using matched filter screening, only the time between the peaks and the transmit signal pulse duration of the matched filter output are used for the initial detection of individual targets, and echo peaks that are outside of the threshold are considered to be individual targets. However, this contains false positive detections. There may be smaller individual targets within the population that contribute to the overlapping echoes but are not detected by the peaking algorithm. At this point, further screening by instantaneous frequency variance thresholding can reduce the occurrence of false positive detections. When both screenings fail, it is judged as a false negative detection. In the simulation, we set the matching screening threshold to 0.9–1.1 ms and set the instantaneous frequency screening threshold to 1 × 10⁹. In the simulation data, it can be found that the false positive detection rate has an important relationship with the peak detection threshold in the matching screening process, and when the peak detection fails, it increases the false positive rate in the matching screening.
Figure 11 shows the probability of overlapping echoes being misidentified as a single target for different signal-to-noise ratio conditions and different densities of fish schools. Figure 11a shows the overlapping echo misidentification rate using the matched filter output envelope peak-to-peak delay feature for primary screening. Figure 11b shows the result of adding the instantaneous frequency variance for secondary screening. By improving the signal-to-noise ratio, the simulation showed a decrease in misidentification rates for all fish densities when the single and group spacing was set to 90 cm. For the higher density school, having a lower false identification rate under the poorer SNR condition of SNR = −10 dB may stem from the fact that the low SNR brings in a large amount of random noise and is picked up by the peak threshold, causing all the targets to be excluded by the initial screening based on the inter-peak pulse width. This conjecture is corroborated by the performance of the single target recognition accuracy of the high-density fish in the low SNR condition in Figure 11.
The high distance resolution obtained based on matched filtering significantly improves peak and inter-peak delay estimation accuracy when determining different target individuals within the fish echo signals. The results in Figure 11a show that the misidentification probability can be reduced to less than 10% even under poor signal-to-noise ratio conditions, which is more advantageous in terms of the misidentification probability of overlapping echoes in the single target identification method based on broadband signals than in the narrowband signal system [11]. After using the instantaneous frequency variance threshold for the secondary determination of the misidentified echoes with peak detection failure, the probability of overlapping echo misidentification in the simulation environment can be controlled to within 1%.

3.3. Single Target Echo Detection Performance in Physical Measurements

To determine the accuracy of single target echo detection, the echoes collected from the anechoic water tank with various individual and group target spacings were subjected to the same detection process and threshold parameters used in the simulation environment. The results are presented in Figure 12. The results show a trend of detection probability which is consistent with the computer simulation. The single target echo detection accuracy increases as the spacing between the single and group targets increases. Under the condition of a better signal-to-noise ratio in the tank, close to 100% single object echo detection accuracy can be achieved at a spacing of more than 80 cm. At 75 cm, the recognition probability is consistent with the simulation results obtained under the better signal-to-noise ratio condition in Figure 9.
When transmitting signals with different bandwidths, it can be seen from the detection results that with between 75 and 80 cm spacing between a single target and the edge of a group of targets, the detection accuracy improves slightly as the bandwidth of the transmitted signal increases. The different bandwidth signals show consistent detection performance when the spacing is large enough. Theoretically, the pulse width is inversely proportional to the bandwidth after the broadband signal passes through the matched filter. The increase in bandwidth can effectively improve the distance resolution, which helps to improve the detection performance of the single target echo, and the experimental results are consistent.

4. Discussions

In this experiment, in order to obtain the desired performance of the combined match filter screening and instantaneous frequency detection method, we simplified the target fish species to a point target and referred to the target strength range at its specific frequency as the amplitude. For simulated targets, the new method is more advantageous than the classical narrowband method in reducing the probability of the false identification of overlapping echoes [11]. But it is also important to note that fish have a complex acoustic response; the target strength is influenced by the presence or absence and morphology of a swim bladder, the swimming angle, the fish length, and the physical state [27,31]. It is challenging to accurately obtain the target strength of a fish, but in peak threshold selection, the sizes of most individuals can be included based on the frequency range at the time of detection combined with an empirical model of target strength.
In addition, the echoes of the internal structures of fish, such as the bladder, bone, and skull, interact with each other [30,32], which creates greater uncertainty in the echo signals of the fish as well as in the morphology of the output signal of the matched filtering. This may increase the rejection of single targets during match filter screening, resulting in a higher probability of false negative detection. Therefore, when applied to fish echo detection, the detection performance of this method needs to be further studied according to specific fish species.

5. Conclusions

When simplifying the fish as a point target, for broadband echo signals from the physical modeling of fish, the high distance resolution and instantaneous peak signal-to-noise ratio based on matched filtering improve the single target echo detection performance in terms of target spacing, target density, and other aspects. The probability of misidentification of overlapping echoes can be reduced based on the instantaneous frequency characteristics of single and overlapping echoes. It can also be seen that the signal-to-noise ratio is still an important factor affecting the instantaneous frequency characteristics of single target echoes and restricting recognition accuracy. Under low SNR conditions, because the peak threshold is set at the lower limit of the target fish species’ target strength range, the small target may be submerged in the noise and therefore cannot be effectively detected.
The joint detection method may help to improve the detection performance of single fish echoes, as well as the accuracy of target strength estimates and the performance of the tracking of individual fish targets. However, the fish echoes are constrained by a number of factors. In the future, further research will be conducted to investigate the performance of the single target echo detection method under the complex fish school model and wider frequency ranges.

Author Contributions

Conceptualization, G.L.; methodology, H.Y.; data curation, J.C. (Jing Cheng); validation, T.T. and H.Y.; writing—review and editing, H.Y.; supervision, G.L. and J.C. (Jun Chen); project administration, J.C. (Jun Chen). All authors have read and agreed to the published version of the manuscript.

Funding

This research was funded by the National Natural Science Foundation of China (grant number: 32073026), the Hainan Provincial Science and Technology Plan Sanya Yazhou Bay Science and Technology City Science and Technology Innovation Joint Project (grant number: 2021CXLH0004), and the Laoshan Laboratory (grant number: LSKJ202201801).

Institutional Review Board Statement

In the experiments covered in the manuscript, we used tungsten carbide target spheres instead of fish for the experiments, which did not involve live fish. Therefore, we did not apply to the Ethics Committee or Institutional Review Board for approval.

Informed Consent Statement

Not applicable.

Data Availability Statement

Data will be made available on request.

Acknowledgments

The authors would like to express their thanks to W.J.M and S.C.Y for their assistance in building the experimental systems.

Conflicts of Interest

The authors declare no conflict of interest.

References

  1. Benoit-Bird, K.J.; Waluk, C.M. Exploring the promise of broadband fisheries echo sounders for species discrimination with quantitative assessment of data processing effects. J. Acoust. Soc. Am. 2020, 147, 411–427. [Google Scholar] [CrossRef] [PubMed]
  2. Homma, H.; Ostrovsky, I. The relationship between target strength frequency response and vertical swim velocity: A new approach for fish discrimination. Aquat. Living Resour. 2021, 34, 11. [Google Scholar] [CrossRef]
  3. Damptey-Boakye, A. Extracting Single Target Information from a Simple Echo Sounder Mounted on a Drifting Fish Aggregating Device (FAD). Master’s Thesis, The University of Bergen, Bergen, Norway, 2015. [Google Scholar]
  4. Puig-Pons, V.; Muñoz-Benavent, P.; Pérez-Arjona, I.; Ladino, A.; Llorens-Escrich, S.; Andreu-García, G.; Valiente-González, J.M.; Atienza-Vanacloig, V.; Ordoñez-Cebrian, P.; Pastor-Gimeno, J.I.; et al. Estimation of Bluefin Tuna (Thunnus thynnus) mean length in sea cages by acoustical means. Appl. Acoust. 2022, 197, 108960. [Google Scholar] [CrossRef]
  5. Dunning, J.; Jansen, T.; Fenwick, A.J.; Fernandes, P.G. A new in-situ method to estimate fish target strength reveals high variability in broadband measurements. Fish. Res. 2023, 261, 106611. [Google Scholar] [CrossRef]
  6. Kubilius, R.; Macaulay, G.J.; Ona, E. Remote sizing of fish-like targets using broadband acoustics. Fish. Res. 2020, 228, 105568. [Google Scholar] [CrossRef]
  7. Soule, M.; Barange, M.; Hampton, I. Evidence of bias in estimates of target strength obtained with a split-beam echo-sounder. ICES J. Mar. Sci. 1995, 52, 139–144. [Google Scholar] [CrossRef]
  8. Ito, M.; Matsuo, I.; Imaizumi, T.; Akamatsu, T.; Wang, Y.; Nishimori, Y. Target strength spectra of tracked individual fish in schools. Fish. Sci. 2015, 81, 621–633. [Google Scholar] [CrossRef]
  9. Scoulding, B.; Gastauer, S.; MacLennan, D.N.; Fässler, S.M.; Copland, P.; Fernandes, P.G. Effects of variable mean target strength on estimates of abundance: The case of Atlantic mackerel (Scomber scombrus). ICES J. Mar. Sci. 2017, 74, 822–831. [Google Scholar] [CrossRef]
  10. Soule, M.; Hampton, I.; Barange, M. Potential improvements to current methods of recognizing single targets with a split-beam echo-sounder. ICES J. Mar. Sci. 1996, 53, 237–243. [Google Scholar] [CrossRef]
  11. Soule, M.; Barange, M.; Solli, H.; Hampton, I. Performance of a new phase algorithm for discriminating between single and overlapping echoes in a split-beam echosounder. ICES J. Mar. Sci. 1997, 54, 934–938. [Google Scholar] [CrossRef]
  12. Demer, D.; Andersen, L.; Bassett, C.; Berger, L.; Chu, D.; Condiotty, J.; Cutter, G. Evaluation of a wideband echosounder for fisheries and marine ecosystem science. ICES Coop. Res. Rep. 2017, 336, 2318. [Google Scholar]
  13. Chu, D.; Stanton, T.K. Application of pulse compression techniques to broadband acoustic scattering by live individual zooplankton. J. Acoust. Soc. Am. 1998, 104, 39–55. [Google Scholar] [CrossRef]
  14. Stanton, T.K. 30 years of advances in active bioacoustics: A personal perspective. Methods Oceanogr. 2012, 1, 49–77. [Google Scholar] [CrossRef]
  15. Ehrenberg, J.E.; Torkelson, T.C. FM slide (chirp) signals: A technique for significantly improving the signal-to-noise performance in hydroacoustic assessment systems. Fish. Res. 2000, 47, 193–199. [Google Scholar] [CrossRef]
  16. Lavery, A.C.; Bassett, C.; Lawson, G.L.; Jech, J.M. Exploiting signal processing approaches for broadband echosounders. ICES J. Mar. Sci. 2017, 74, 2262–2275. [Google Scholar] [CrossRef]
  17. Cotter, E.; Bassett, C.; Lavery, A. Comparison of mesopelagic organism abundance estimates using in situ target strength measurements and echo-counting techniques. JASA Express Lett. 2021, 1, 40801. [Google Scholar] [CrossRef]
  18. Cotter, E.; Bassett, C.; Lavery, A. Classification of broadband target spectra in the mesopelagic using physics-informed machine learning. J. Acoust. Soc. Am. 2021, 149, 3889–3901. [Google Scholar] [CrossRef]
  19. Bhattacharyya, A.; Singh, L.; Pachori, R.B. Fourier–Bessel series expansion based empirical wavelet transform for analysis of non-stationary signals. Digit. Signal Process. 2018, 78, 185–196. [Google Scholar] [CrossRef]
  20. Wang, S.; Zeng, X. Robust underwater noise targets classification using auditory inspired time–frequency analysis. Appl. Acoust. 2014, 78, 68–76. [Google Scholar] [CrossRef]
  21. Jia, H.; Li, X. Underwater reverberation suppression based on non-negative matrix factorisation. J. Sound Vib. 2021, 506, 116166. [Google Scholar] [CrossRef]
  22. Meng, X.; Jakobsson, A.; Li, X.; Lei, Y. Estimation of chirp signals with time-varying amplitudes. Signal Process. 2018, 147, 1–10. [Google Scholar] [CrossRef]
  23. Jiang, J.; Wu, Z.; Lu, J.; Huang, M.; Xiao, Z. Interpretable features for underwater acoustic target recognition. Measurement 2021, 173, 108586. [Google Scholar] [CrossRef]
  24. Wu, Y.; Li, X.; Wang, Y. Extraction and classification of acoustic scattering from underwater target based on Wigner-Ville distribution. Appl. Acoust. 2018, 138, 52–59. [Google Scholar] [CrossRef]
  25. Li, X.; Xia, Z. Research of underwater bottom object and reverberation in feature space. J. Mar. Sci. Appl. 2013, 12, 235–239. [Google Scholar] [CrossRef]
  26. Muller, M.W.; Allen, I.J.S.; Au, W.W. Time-frequency analysis and modeling of the backscatter of categorized dolphin echolocation clicks for target discrimination. J. Acoust. Soc. Am. 2008, 124, 657–666. [Google Scholar] [CrossRef] [PubMed]
  27. Yoon, E.; Lee, H.; Park, C.; Lee, Y.D.; Hwang, K.; Kim, D.N. Ex situ target strength of yellow croaker (Larimichthys polyactis) in a seawater tank. Fish. Res. 2023, 260, 106610. [Google Scholar] [CrossRef]
  28. Henderson, M.J.; Horne, J.K. Comparison of in situ, ex situ, and backscatter model estimates of Pacific hake (Merluccius productus) target strength. Can. J. Fish. Aquat. Sci. 2007, 64, 1781–1794. [Google Scholar] [CrossRef]
  29. Kang, D.; Cho, S.; Lee, C.; Myoung, J.G.; Na, J. Ex situ target-strength measurements of Japanese anchovy (Engraulis japonicus) in the coastal Northwest Pacific. ICES J. Mar. Sci. 2009, 66, 1219–1224. [Google Scholar] [CrossRef]
  30. Stanton, T.K.; Chu, D.; Jech, J.M.; Irish, J.D. New broadband methods for resonance classification and high-resolution imagery of fish with swimbladders using a modified commercial broadband echosounder. ICES J. Mar. Sci. 2010, 67, 365–378. [Google Scholar] [CrossRef]
  31. Tomiyasu, M.; Kao, W.Y.; Abe, K.; Minami, K.; Hirose, T.; Ogawa, M.; Miyashita, K. The relationship between body angle and target strength of ribbonfish (Trichiurus japonicus) displaying a vertical swimming motion. ICES J. Mar. Sci. 2016, 73, 2049–2057. [Google Scholar]
  32. Christopher, B.; Alex, D.R.; Wilson, C.D. Broadband echosounder measurements of the frequency response of fishes and euphausiids in the Gulf of Alaska. ICES J. Mar. Sci. 2018, 75, 1131–1142. [Google Scholar]
Figure 1. Fish schooling and single fish echo modeling, where A i is the echo amplitude for each fish, given randomly in the model based on the target strength range of the fish species. τ i is the time delay of an echo from the i th fish in a school of randomly distributed fish. Dis is the radial component of spacing from the single fish to the target which is closest to the single fish.
Fishes 08 00580 g001
Figure 2. Methods of single fish echo detection.
Fishes 08 00580 g002
Figure 3. Experimental platform for echo detection of single fish. The cuboid indicates the anechoic water tank, and the gray cylinder at the top indicates the crane. The pink cylinder indicates the transducer, and the gray shaded area indicates the ideal pulse bounds. The blue spheres indicate single and group targets.
Fishes 08 00580 g003
Figure 4. Group targets state and spatial distribution during echo acquisition. An underwater camera took the pictures during the experiment, in which the spacing between the single and group targets was 60 cm (a), 70 cm (b), 80 cm (c), and 90 cm (d). The tungsten carbide spheres are roughly centrosymmetrically distributed within the beam. The inconsistency in group diameters stems from subtle errors in front-to-back distances during underwater camera shots.
Fishes 08 00580 g004
Figure 5. Instantaneous frequency estimation of computer-simulated echoes in low-density fish schools (three fish). The red dotted lines indicate single target echo (A1) and overlapping echoes (B1).
Fishes 08 00580 g005
Figure 6. Instantaneous frequency estimation of computer-simulated echoes in high-density fish schools (thirty fish). The red dotted lines indicate single target echo (A2) and overlapping echoes (B2).
Fishes 08 00580 g006
Figure 7. Instantaneous frequency estimation of collected echoes from a physical model of a high-density fish school. The red dotted lines indicate single target echo (A3) and overlapping echoes (B3).
Fishes 08 00580 g007
Figure 8. Effect of instantaneous frequency threshold setting on detection probability.
Fishes 08 00580 g008
Figure 9. Effect of single and group target spacing on the recognition rate.
Fishes 08 00580 g009
Figure 10. Effect of fish school density on recognition probability.
Fishes 08 00580 g010
Figure 11. Probability of misclassifying an overlapping echo as a single fish echo.
Fishes 08 00580 g011
Figure 12. Single target echo detection performance in tank experiments.
Fishes 08 00580 g012
Table 1. Reference thresholds for some species and experimental threshold settings.
Threshold NameSpeciesThreshold RangeAssociated Parameters
PeakAmpYellow croaker [27]−60 dBTS −56.9~−29.3 dB
(120 kHz)
Thunnus thynnus [4]−20 dBTS −18.1~−11.7 dB
(200 kHz)
Merluccius
productus [28]
−60 dBTS −65.1~−23.7dB
(120 kHz)
Engraulis
japonicus [29]
−60 dBTS −53.7~−46.7 dB
(200 kHz)
PeakVar\1 × 10⁹Instantaneous
Frequency f
PeakTmin\0.9 msTransmit Signal Pulsewidth T
PeakTmax\1.0 msTransmit Signal Pulsewidth T
Table 2. The configuration information of the experimental platform.
Equipment NameModel NumberEquipment Performance
TransducerSIMRAD ES200-7CFe 160–260 kHz, B = 100 kHz
Programmable Signal SourcesHITEK HTPX1370AMaximum output frequency 43 MHz DAC, 16-bit precision
Multi-Channel AmplifiersKrohn-Hite KH7008Noise 7 nV/Hz
Linear AmplifierAR 800A3BPower 800 W
Data AcquisitionHITEK HTPX14484Maximum sampling frequency 2 MHz ADC, 12-bit precision
Signal ProcessorsNI PXIe-8133CPU Core i7-820QM
Disclaimer/Publisher’s Note: The statements, opinions and data contained in all publications are solely those of the individual author(s) and contributor(s) and not of MDPI and/or the editor(s). MDPI and/or the editor(s) disclaim responsibility for any injury to people or property resulting from any ideas, methods, instructions or products referred to in the content.

