Article

Thermal Tolerance of Spotted Sea Bass (Lateolabrax maculatus) and Pearl Gentian Grouper (Epinephelus fuscoguttatus Female × E. lanceolatus Male) in Different Environmental Temperatures

1
Third Institute of Oceanography, Ministry of Natural Resources, Xiamen 361005, China
2
Nuclear and Radiation Safety Center, Ministry of Ecology and Environment, Beijing 102488, China
*
Authors to whom correspondence should be addressed.
These authors contributed equally to this work.
Fishes 2023, 8(12), 576; https://doi.org/10.3390/fishes8120576
Submission received: 18 October 2023 / Revised: 17 November 2023 / Accepted: 23 November 2023 / Published: 25 November 2023
(This article belongs to the Section Biology and Ecology)

Abstract

:
Seawater cooling is the most common way to cool down nuclear power plants. However, the thermal drainage of nuclear power plants results in sharp rises in local seawater temperatures and, therefore, affects fisheries and ecologies. Therefore, evaluating the thermal tolerance of marine organisms not only provides further insight into their biological characteristics but also holds significant importance for the site selection and construction of nuclear power plants. This study investigated the thermal tolerance of spotted sea bass (Lateolabrax maculatus) and pearl gentian grouper (Epinephelus fuscoguttatus female × E. lanceolatus male) using the critical thermal maximum method. The environmental temperatures for spotted sea bass and grouper in spring, summer, autumn, and winter were 21.6/23 °C, 26.5/25.9 °C, 25.0/25.9 °C, and 14.5/16.6 °C, respectively. Under four seasonal conditions, different temperature rise rates of +2 °C, +4 °C, +6 °C, and +8 °C per hour were set. The maximum critical temperature, initial lethal temperature, absolute lethal temperature, and semi-lethal temperature were recorded for both fish species. The results show that the rates of temperature increase did not affect the thermal tolerance of either fish species. In all seasons, the fish experienced rapid death once they reached the initial lethal temperature. However, there was a significant correlation of season with thermal tolerance in both fish species. For spotted sea bass, the semi-lethal temperature in summer reached about 40 °C, while in winter it was about 35 °C. For pearl gentian grouper, the semi-lethal temperature in summer reached about 40 °C, while in winter, it was about 38 °C. These results remind us that these two fish species have a limited ability to adapt to rapid temperature rises, but appropriate acclimation temperatures can effectively improve their thermal tolerance. Therefore, it is necessary to further consider the potential impacts on these fish species during the site selection and construction process of nuclear power plants.
Key Contribution: The thermal tolerance of spotted sea bass and pearl gentian grouper was examined. It was found that different rates of temperature increase did not affect the thermal tolerance of the two fish species, highlighting the potential negative impacts of the thermal drainage from nuclear power plants on these fish species.

1. Introduction

Temperature is a vital environmental factor that directly affects the metabolism of fish, and a dramatic rise in water temperature can lead to the stress, escape, and even death of fish [1]. Nevertheless, in recent decades, dramatic rises in regional seawater temperatures have often occurred. This situation is due to frequent human activities, such as the construction of nuclear power plants. Nuclear power plants have various advantages, such as low power generation costs, low environmental pollution, and high energy generation efficiency. Therefore, the construction of nuclear power plants is of great significance for environmental protection, altering the pattern of energy consumption and electricity production [2]. However, thermal pollution is a significant negative issue associated with nuclear power plants [3]. Seawater cooling is the most common and cost-effective way to cool down nuclear power plants, yet it directly releases hot seawater into the ocean [4]. The thermal drainage from nuclear power plants can result in sharp rises in local seawater temperatures, causing a series of ecological effects [5]. For example, a nuclear power plant with a planned capacity of 6 to 8 million kW can have a thermal drainage flow of 400 to 600 m3/s. An appalling incident was reported in Biscayne Bay (Florida, USA), where the thermal drainage from a nuclear power plant increased the seawater temperature by 8 °C, causing the disappearance of marine organisms within 1.5 km of the sea [6]. Therefore, the problem of thermal drainage from nuclear power plants has aroused attention. At present, relevant countries have introduced laws and standards on thermal drainage. For example, the Marine Environmental Protection Law of the People’s Republic of China explicitly mentions that in discharging heat-containing waste water into the sea, effective measures must be taken to ensure that the water temperature in adjacent fishery waters meets the national marine environmental quality standards so as to avoid the harm of thermal pollution to marine biological resources.
Assessing the temperature tolerance range of aquatic organisms is of great guiding significance for the construction of nuclear power plants and other human activities [7]. Numerous studies have reported the temperature tolerance ranges of various aquatic organisms, especially animals [8,9,10]. However, in previous studies, reports on the thermal tolerance of aquatic animals have been species-specific, and thermal tolerance varies widely among similar species. For instance, Bilyk and Sformo [11] conducted a study revealing significant variation in thermal tolerance among fish in the North Slope. They found that certain anadromous species endemic to Arctic habitats exhibited notably lower heat tolerance compared to other species examined in the study. Meanwhile, the thermal tolerance of aquatic animals was also influenced by the environmental temperature. This situation was observed in previous studies [12,13], which can be interpreted as showing that under suitable acclimation temperatures, the tolerance of fish can be effectively enhanced.
The critical thermal maximum (CTM) method is the most common way to assess the temperature tolerance ranges of aquatic ectotherms [14]. In simple terms, the CTM is defined as the temperature at which fish experience a loss of righting response, and this method involves gradually increasing or decreasing the temperature of the fish at a constant rate until death occurs. As described in detail by Rajaguru [15], this method has the advantages of being rapid, convenient, and requiring little in the way of apparatus. Herein, we assess the thermal tolerance of two fish species, namely, the spotted sea bass (Lateolabrax maculatus) and pearl gentian grouper (Epinephelus fuscoguttatus female × E. lanceolatus male), via the CTM method. These two fish species have high economic value and are widely cultured in the coastal area of China. In practice, intensive aquaculture has resulted in fish becoming more sensitive to temperature. Once the temperature rises past the critical temperature for fish, widespread die-off of cultured fish occurs, and thus, causes economic loss. These two fish species were considered to be eurythermic, and some heat stress experiments on these two fish have been reported in previous studies. For instance, Long et al. [1] discussed the physiological response of spotted sea bass under acute heat stress. Nevertheless, there is limited information regarding the thermal tolerance of these two fish species, especially in different environmental conditions. The experiments were conducted during four different seasons, each with varying environmental temperatures. We hypothesized that a lower rate of temperature rise could improve the thermal tolerance of fish to some extent. Meanwhile, fish may have a higher thermal tolerance in the summer but a lower thermal tolerance in the winter. By investigating the thermal tolerance of two fish species under different seasonal conditions, we can gain a better understanding of the thermal biology basis of these two fish species, thereby provide a theoretical basis for subsequent studies deeply exploring the reaction mechanism of fish to temperature. Meanwhile, the results can also provide a theoretical direction for nuclear power site selection under similar conditions, and thus, better promote the construction of nuclear power plants.

2. Materials and Methods

2.1. Experimental Fish and Management

The spotted sea bass and pearl gentian grouper were purchased from a commercial farm in Zhangzhou, Fujian, China. The fish were temporarily reared in a circulating water system for two weeks and fed specified commercial compound feed to adapt to the experimental conditions before the experiment began. During the temporary rearing, the fish were hand-fed twice a day (8:00 and 17:30), and the water was changed after 30 min of afternoon feeding every day. Water samples were collected daily from the tanks before the morning feeding (7:30 to 8:00) to ensure the water quality was normal. The salinity of the water was measured in the sites using a portable salinity meter (AZ8371, AZ, Taichung, Taiwan, China). The dissolved oxygen and pH were measured using a portable oxygen meter (HQ40d, HACH, Loveland, CO, USA). The pH was sustained between 7.8 and 8.2, and dissolved oxygen was kept at approximately 7 mg/L. The ammonia–nitrogen concentration was measured by a portable photoelectric color comparator (DR900, HACH, Loveland, CO, USA) and remained below 0.3 mg/L.
At the start of the experiment, the fish were fasted for 24 h to ensure that the error was small when the fish were weighed and to prevent the fish from vomiting and incontinence. Then, they were anesthetized with a dosage of 150 mg/L eugenol. Eleven fish were randomly selected, bulk-weighed, and then allocated into a 200 L tank. Three tanks with circulating water were connected and deemed as a group, and they maintained the same temperature and water condition. Due to the differences in seasons, there were discrepancies in the weights of the experimental fish. The environmental water temperatures and average weights of the experimental spotted sea bass and grouper in spring, summer, autumn, and winter are shown in Table 1.

2.2. Experiment Design

This study was a CTM test, which involved gradually increasing the temperature at a constant rate until organism death occurred. This was a dynamic experiment that explored the high-temperature tolerance of the organisms under the conditions of continuous temperature increase.
In general, the extreme temperature rise in the local sea caused by thermal drainage from nuclear power plants is 4 °C. Therefore, four temperature rise rates were set in the CTM experiment (+2 °C/h, +4 °C/h, +6 °C/h, +8 °C/h).

2.3. Experiment Management

In order to prevent fish stress, the initial water temperature of the experiments was set to be the same as the ambient water temperature of the day. During the experiment, the fish were fasted, and the water temperature was gradually increased until all the fish died. The temperature at which each fish reached the critical state or died was recorded. The critical state of the fish was determined by the loss of righting response, and the death of the fish was determined as when the gill lid stopped opening and closing. The water was heated by an external circulating cooling and heating machine (CATWK-030GD, CATAQUA, Xiamen, Fujian, China). Mercury thermometers and sensor thermometers were used simultaneously to measure the real-time water temperature, ensuring accurate data.

2.4. Data Statistics and Analysis

The experimental data were analyzed using SPSS 26.0 (International Business Machines Corp., Armonk, New York, NY, USA) and expressed as the mean ± standard deviation (mean ± SD) of three repeated trials. The critical thermal maximum, incipient lethal temperature, and total lethal temperature of each species were determined based on observational temperatures. These temperatures represent the temperature at which the fish reached the critical state, the temperature at which the first fish died, and the temperature at which all fish died, respectively. The semi-lethal temperature was calculated using either the exponential model method or the Probit module method.

3. Results

3.1. CTM Experiment in Spring

The results of the CTM experiment on spotted sea bass and grouper conducted in spring are presented in Table 2. The thermal tolerance of these two species of Perciformes fish was not affected by different rates of temperature increase. No significant differences were observed among the groups in terms of critical thermal maximum, initial death temperature, absolute lethal temperature, and semi-lethal temperature for either type of fish. Meanwhile, after reaching the initial death temperature, both fish species died rapidly, resulting in a minor difference between the initial death temperature and the absolute lethal temperature. Groupers exhibited stronger thermal tolerance compared to spotted sea bass, as evidenced by their higher critical thermal maximum, initial death temperature, absolute lethal temperature, and semi-lethal temperature under different rates of temperature increase. The semi-lethal temperature curves and equations fitted by an exponential model for spotted sea bass and pearl gentian grouper can be found in the Supplementary Materials, Figure S1 and Figure S2, respectively.

3.2. CTM Experiment in Summer

The results of the CTM experiment on spotted sea bass and grouper conducted in summer are presented in Table 3. Similarly, different rates of temperature increase did not affect the thermal tolerance of these two fish species. However, there was a difference between the spotted sea bass and the groupers in terms of the critical thermal maximum, as the maximum critical temperatures of the spotted sea bass were higher than those of the groupers. Once the critical thermal maximum was reached, the spotted sea bass died rapidly, resulting in minor differences in the critical thermal maximum, initial death temperature, and absolute lethal temperature. On the other hand, the groupers exhibited significant differences in the critical thermal maximum and initial death temperature. However, once the initial death temperature was reached, the groupers also experienced rapid mortality. The semi-lethal temperature curves and equations fitted by an exponential model for the spotted sea bass and pearl gentian grouper can be found in Figure S3 and Figure S4, respectively.

3.3. CTM Experiment in Autumn

The results of the CTM experiment on spotted sea bass and grouper conducted in autumn are presented in Table 4. In autumn, the thermal tolerance of these two fish species was not influenced by different rates of temperature increase. Once the critical thermal maximum was reached, the spotted sea bass exhibited rapid mortality, while the groupers demonstrated relatively higher tolerance. The semi-lethal temperature curves and equations fitted by an exponential model for the spotted sea bass and pearl gentian grouper can be found in Figure S5 and Figure S6, respectively.

3.4. CTM Experiment in Winter

The results of the CTM experiment on spotted sea bass and grouper conducted in winter are presented in Table 5. Different rates of temperature increase did not affect the thermal tolerance of these two species of fish. In contrast to the previous results, a significant difference was observed in the critical thermal maximum compared to the initial death temperatures for the two fish species. However, similar to the previous findings, once the initial death temperature was reached, both fish species experienced rapid mortality. The semi-lethal temperature curves and equations fitted by an exponential model for the spotted sea bass and pearl gentian grouper can be found in Figure S7 and Figure S8, respectively.

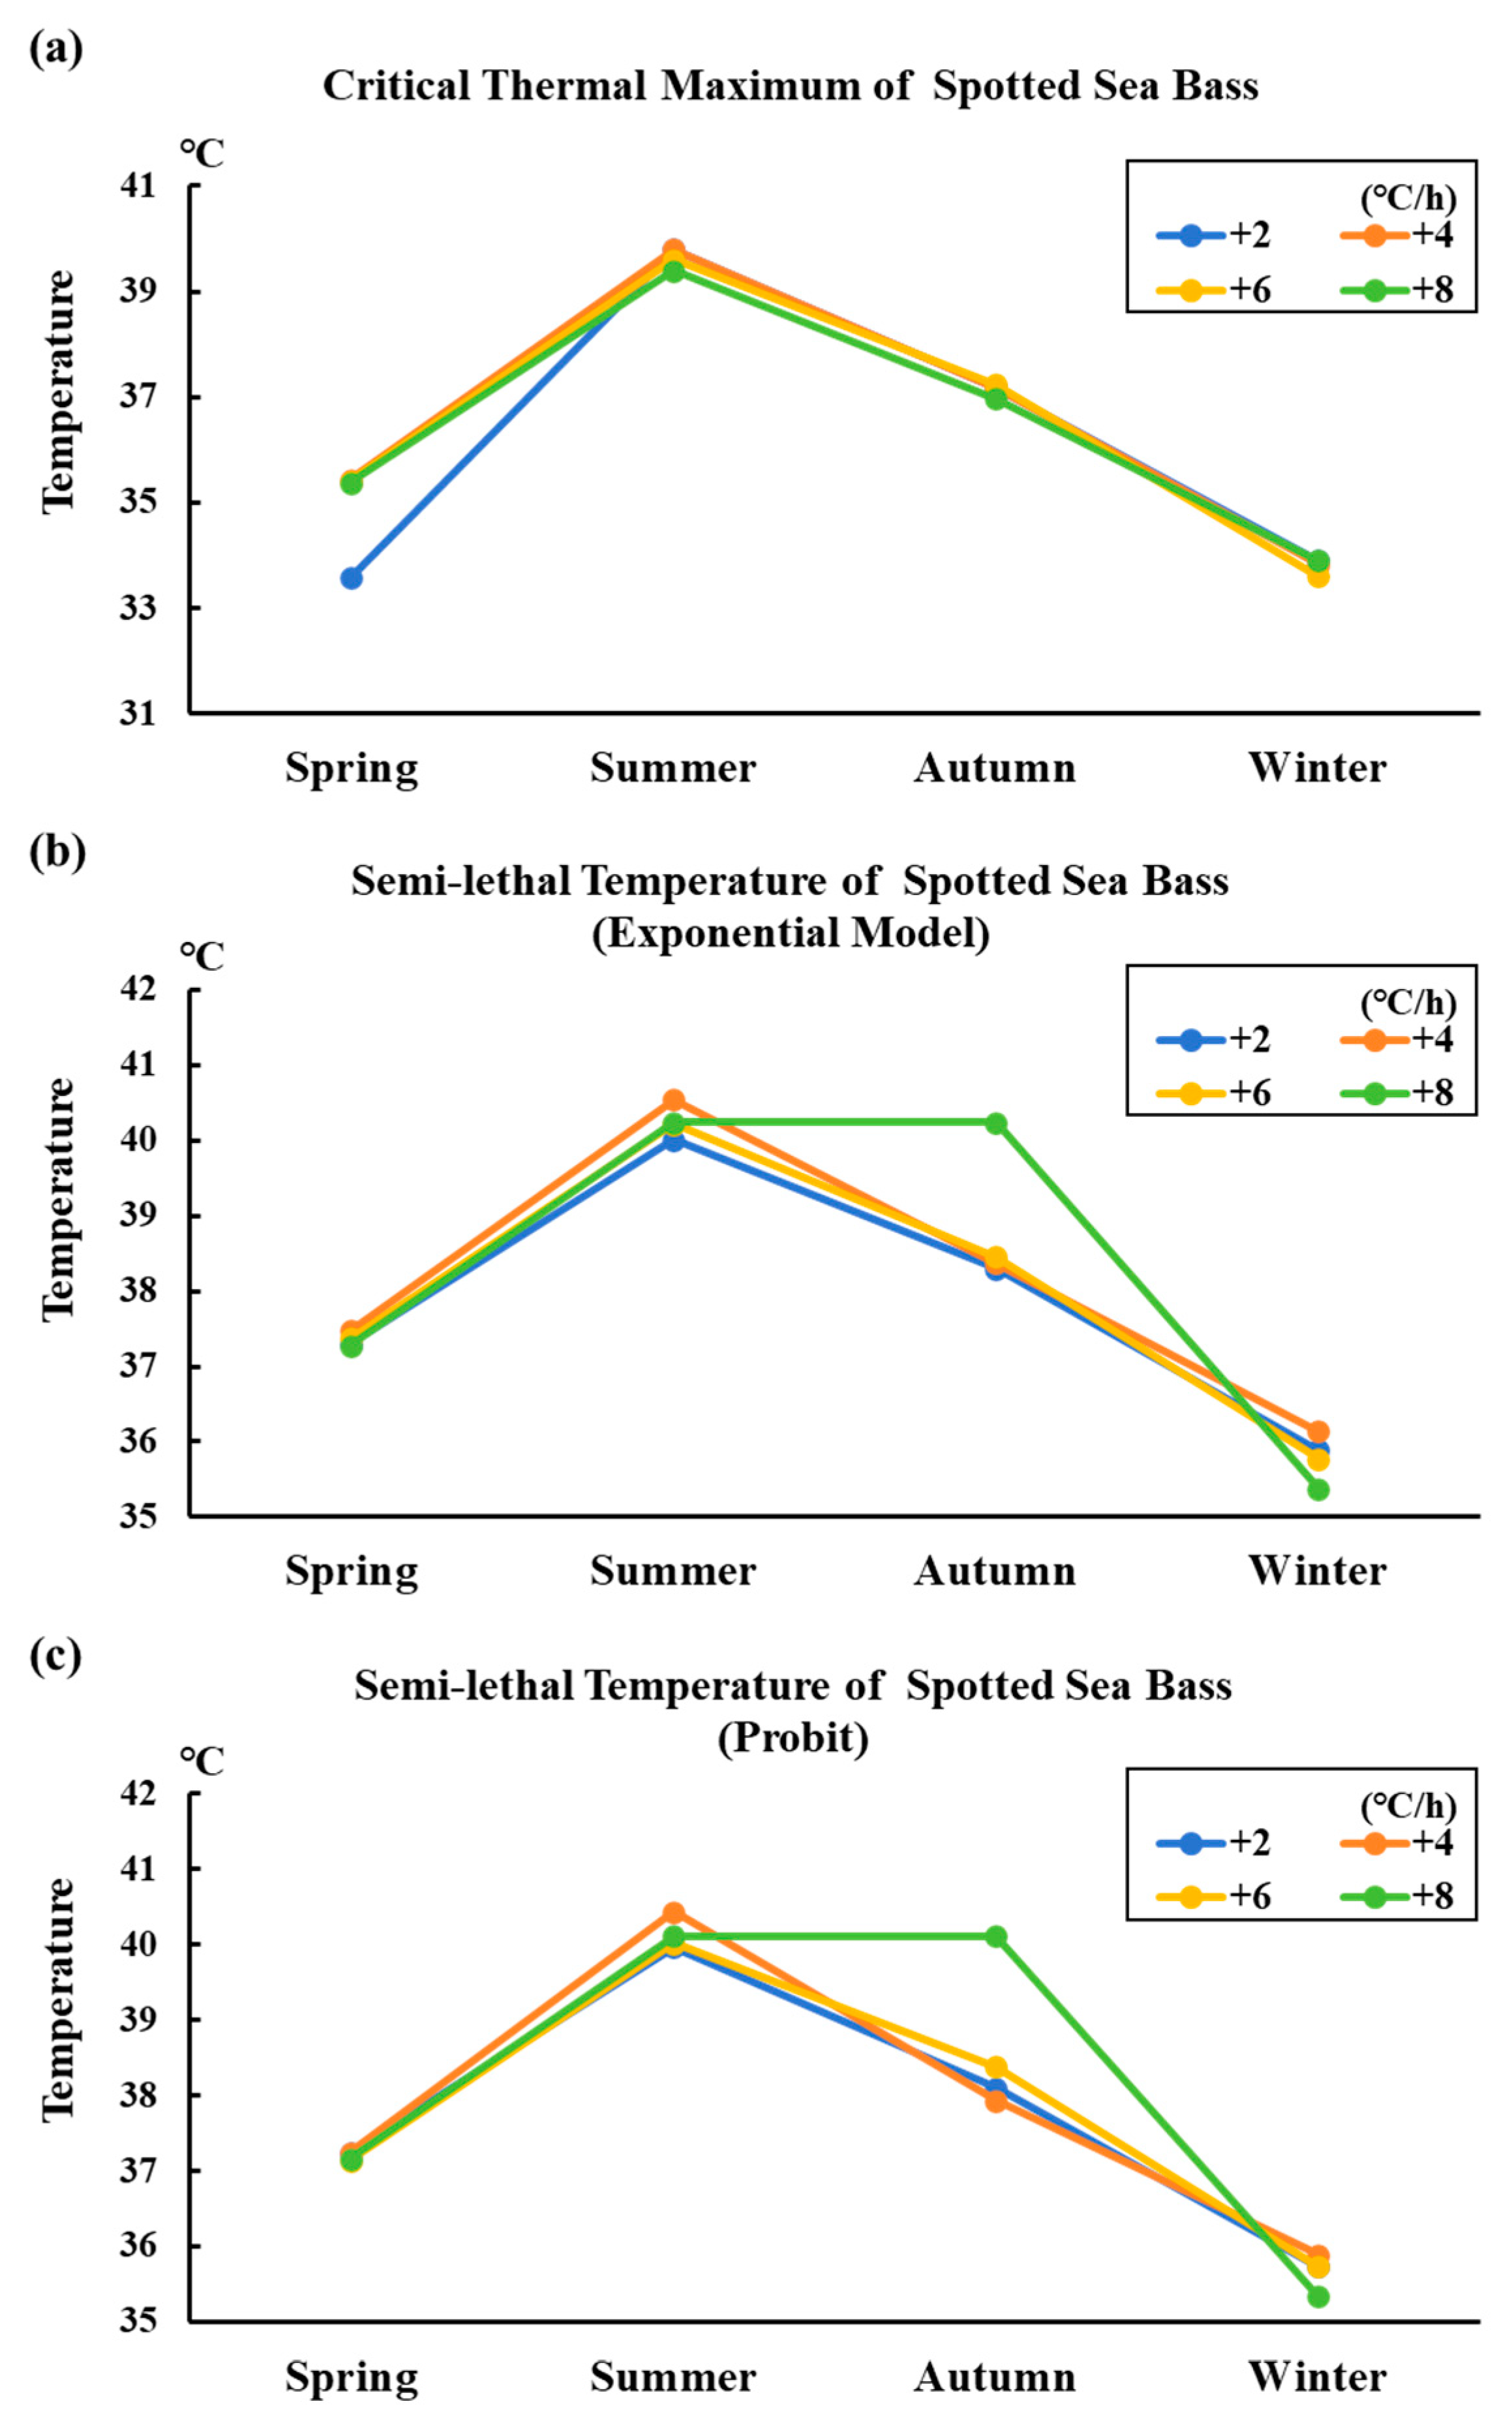
3.5. Variation Trend of Thermal Tolerance in Different Seasonal Conditions of Spotted Sea Bass

Figure 1 shows the variation trend of thermal tolerance in different seasonal conditions of spotted sea bass. The figure clearly indicates that varying temperature rise gradients did not have a significant impact on the thermal tolerance of spotted sea bass across four seasons. However, different seasons have an obvious impact on the thermal tolerance of spotted sea bass. The fish exhibited a higher thermal tolerance in summer and a lower thermal tolerance in winter. Furthermore, the fish demonstrated similar thermal tolerance in both spring and autumn, likely due to the comparable environmental temperatures during these seasons.

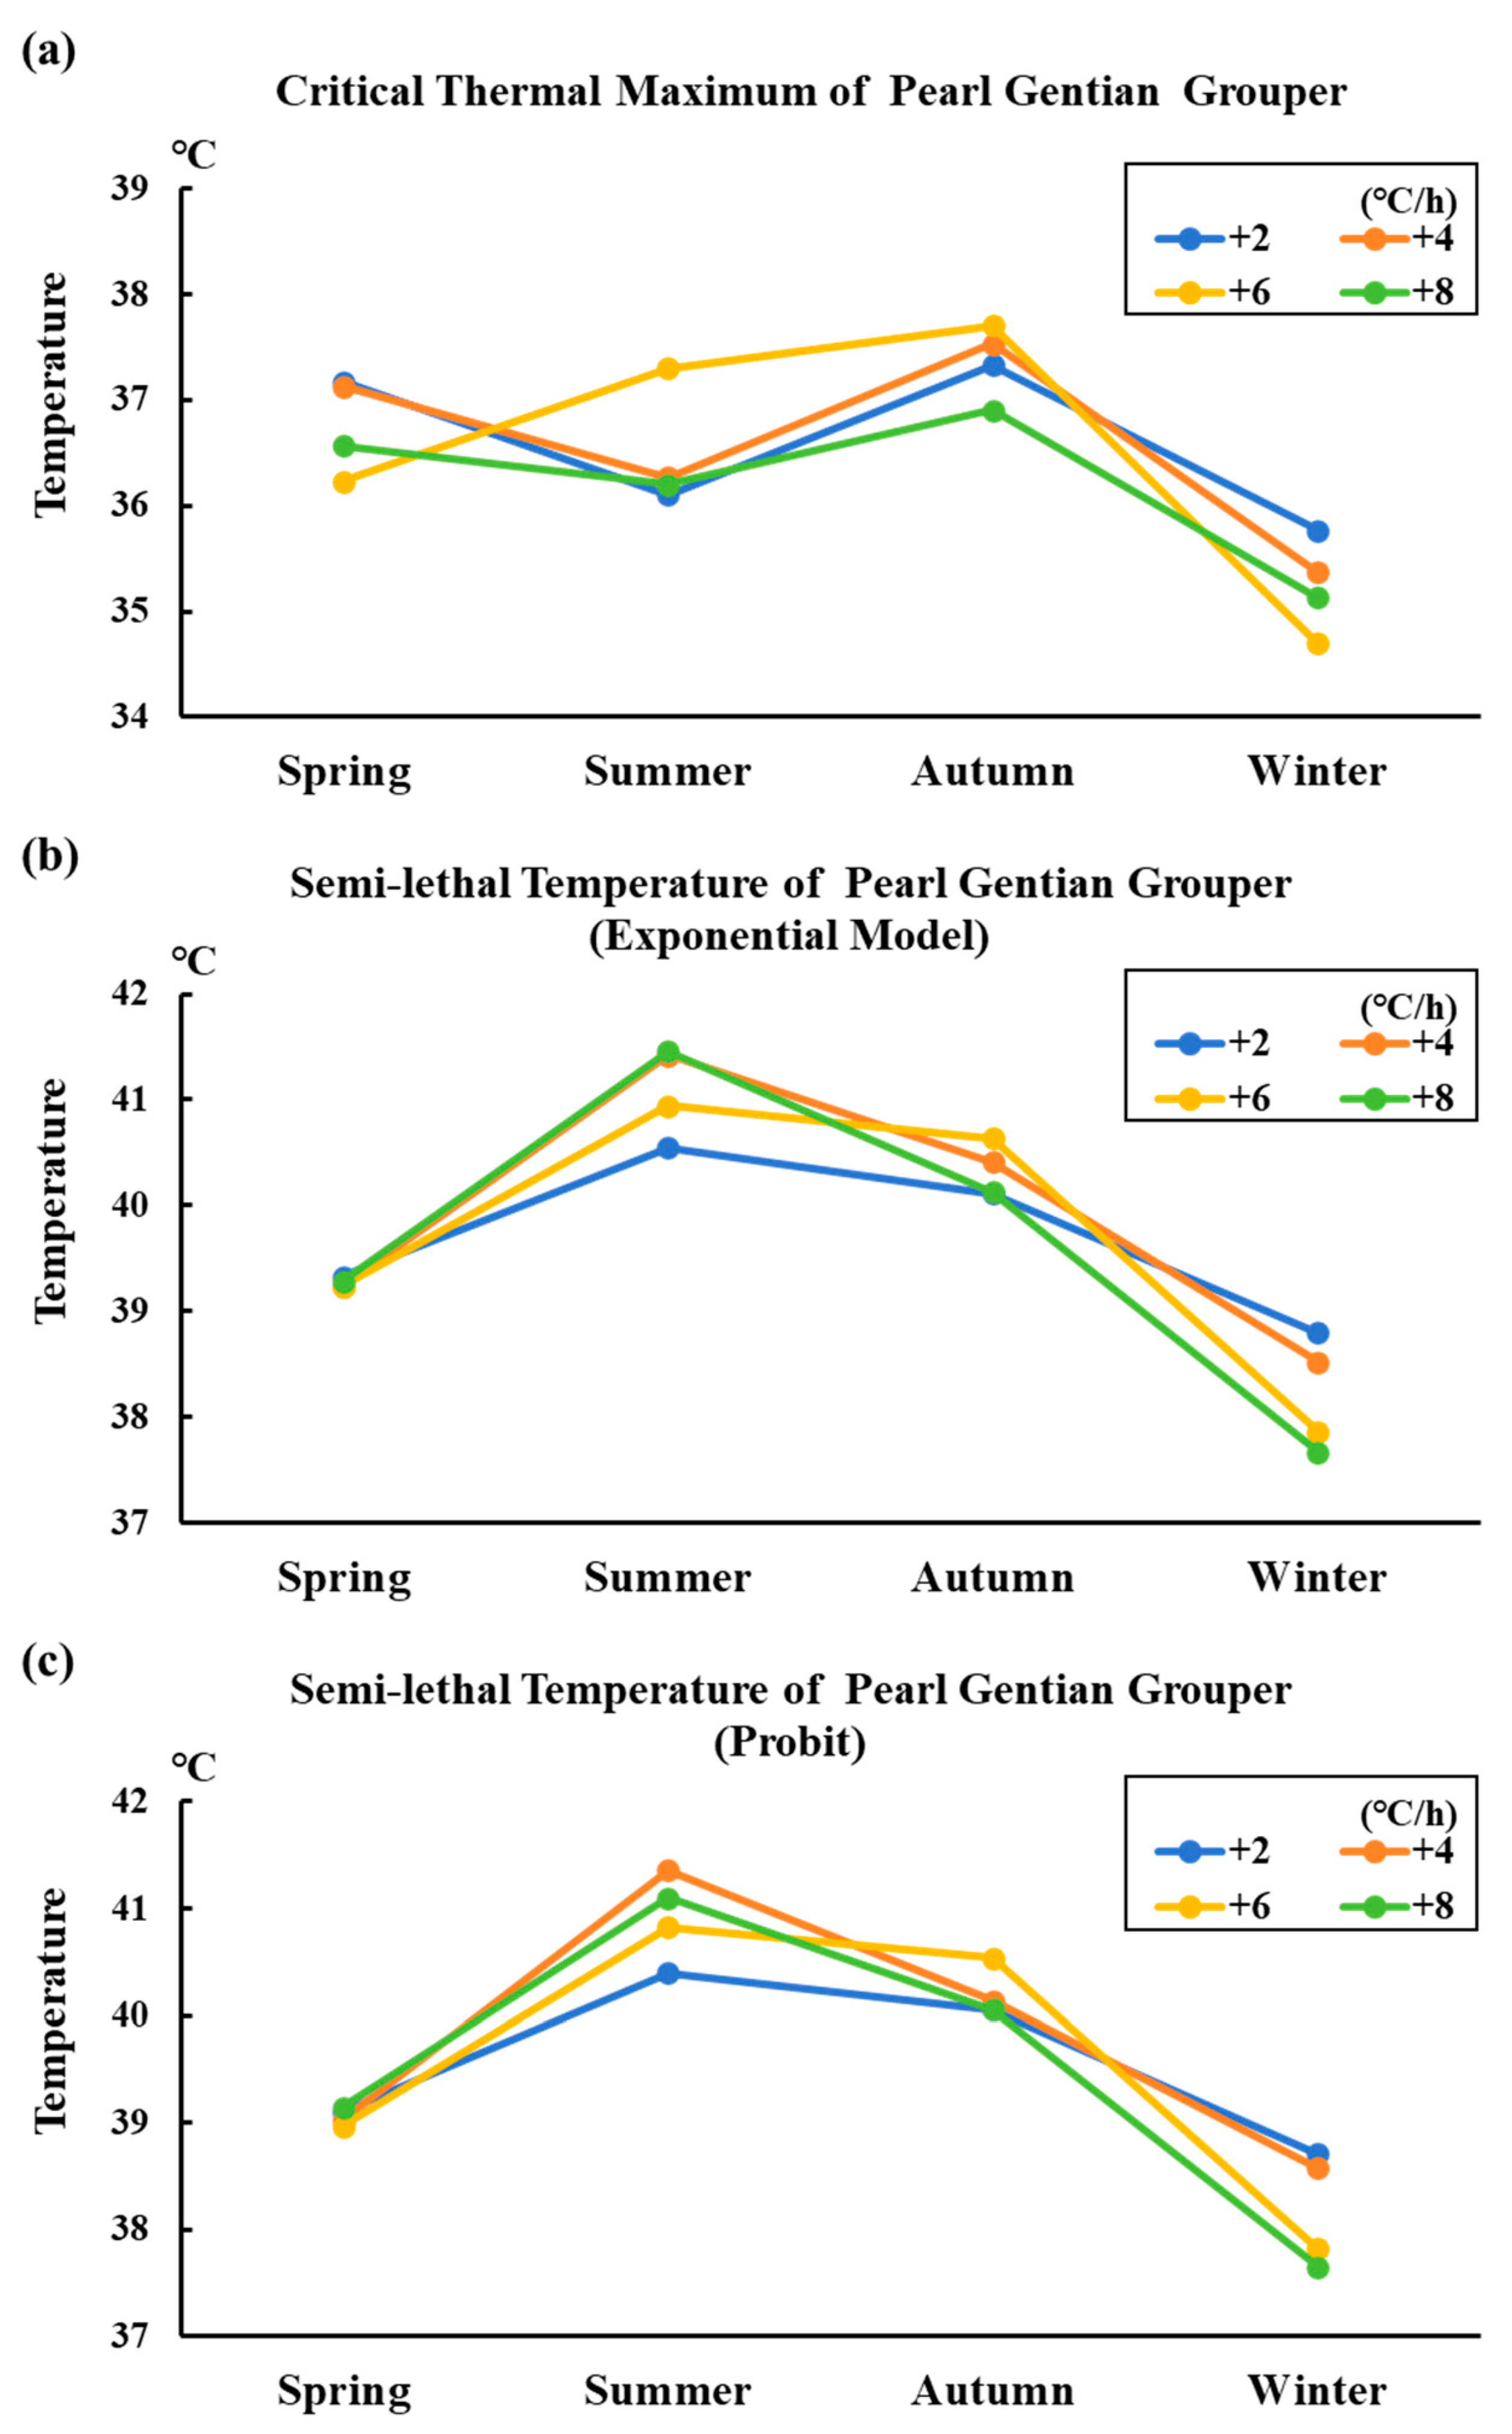
3.6. Variation Trend of Thermal Tolerance in Different Seasonal Conditions of Grouper

Figure 2 shows the variation trend of the thermal tolerance of the groupers in different seasonal conditions. Similar to the spotted sea bass, the groupers exhibited a consistent trend in semi-lethal temperature across seasons. However, the critical thermal maximum of the groupers displayed comparatively minimal correlation with the seasonal changes and was significantly lower than their semi-lethal temperature. Notably, the groupers demonstrated reduced thermal tolerance during summer.

4. Discussion

CTM tests are used as one of the most common methods to evaluate thermal tolerance in aquatic ectotherms [14]. However, this method has some limitations, such as delayed temperature observation due to the rapid death of animals caused by a fast temperature rise. This situation can lead to a higher recorded temperature, especially under rapid temperature rise conditions, which was also observed in previous studies. For example, Rajaguru [15] reported that the critical thermal maximum of green chromide (Etroplus suratensis) increased from 39.75 °C to 43.5 °C with a 15 °C/h temperature rise rate. Therefore, we typically avoid setting excessively rapid rates of temperature rise to ensure that we can observe data that closely match actual conditions. In the present study, this effect was not obvious. During the experiments, it was observed that the spotted sea bass and groupers experienced sudden and rapid mortality once the initial lethal temperature threshold was reached. As shown in the results, different rates of temperature rise had no significant effect on the thermal tolerance of these two species of fish.
On the other hand, in the present study, due to variations in the experimental duration, we were unable to control for consistent fish size. The difference in fish size is also a potential factor that may affect the results, and thus, is also considered a limitation of this study. Qin et al. [16] compared the thermal tolerance and physiological response of different-sized spotted sea bass through an acute temperature rise test. They concluded that smaller fish size may exhibit resistance to heat stress by regulating their expression level of heat shock proteins more actively. Meanwhile, Messmer et al. [17] observed that the critical thermal maximum of leopard coral grouper (Plectropomus leopardus) declined from 38.3 °C to 37.5 °C with increasing size in adult fish (0.45–2.82 kg). This indicates that larger individuals are more thermally sensitive than smaller conspecifics. A similar phenomenon was also observed in the present study. The initial water temperature of the spotted sea bass was not significantly different between summer and autumn (26.5 °C and 25.0 °C), but the thermal tolerance of the fish in summer (about 3.80 g) was found to be higher than that of the spotted sea bass in autumn (about 52.66 g). However, this phenomenon is not absolute. The initial water temperature of the CTM experiments for the groupers in summer and autumn was the same (both 25.9 °C). Nevertheless, contrary to the spotted sea bass, the critical thermal maximum of the fish in summer (about 32.21 g) was found to be lower than that of the groupers in autumn (about 59.91 g). This result illustrates that although size may have an impact on the thermal tolerance of fish, other factors, like species and acclimation temperature, also play significant roles. Considering these limitations of the current experiment, future studies should aim to focus on more specific issues to address the gaps in knowledge. For example, subsequent studies could further illustrate the effects of animal sizes or temperature rising rates on the thermal tolerance of fish based on specific species and acclimation temperature conditions.
Initially, our hypothesis posited that two fish species would exhibit greater thermal tolerance at lower rates of temperature rise. Interestingly, in the present study, varying rates of temperature increase did not impact the thermal tolerance of these two fish species. This suggests that even under a low rate of temperature rise condition, the two fish species were unable to enhance their thermal tolerance. This phenomenon is contrary to our assumptions, and we further conjecture that the limited ability to adapt to rapidly rising temperatures may be a common feature of Perciformes fish. The research up to now has explored the thermal tolerance in different Perciformes fish species. Notably, some studies have found a similar phenomenon to this study. For example, Stavrakidis-Zachou et al. [18] and Cheng et al. [19] reported the limited thermal tolerance of European sea bass (Dicentrarchus labrax) and brown-marbled grouper (E. fuscoguttatus) under acute temperature rising conditions, respectively. To some extent, these reports confirm our speculation. From this perspective, the sharp increase in the local water temperature caused by thermal drainage from nuclear power plants may have adverse effects on Perciformes fish species within the affected area. Therefore, it is necessary to further consider the potential impacts on these fish species during the site selection and construction process of nuclear power plants.
Nevertheless, Wu et al. [20] reported that the large yellow croaker (Larimichthys crocea) demonstrated an ability to adapt to higher temperatures under the conditions of a temperature rise rate of 1 °C per day. Chen et al. [21] also reported a similar result. These results remind us that under proper temperature acclimation, the thermal tolerance of Perciformes fish can also be improved. But in this particular direction, there has been limited research on these two kinds of fish, indicating the need for further exploration in these species. Indeed, different seasonal conditions can serve as indicators of fish acclimation temperatures to some extent. In this study, it was observed that the thermal tolerance of these two kinds of fish was different in different seasons. Overall, both fish species exhibited greater thermal tolerance during the summer months while displaying relatively poor tolerance in the winter, which reminds us that the thermal tolerance of spotted sea bass and pearl gentian grouper could be improved under proper temperature acclimation conditions. These results suggest that the two fish species are capable of actively coping with potential heatwave events in the future. However, the temperature adaptability of fish also exhibits species specificity. Meanwhile, the improvement in their thermal tolerance may be generationally transient or temporary. White and Wahl [22] reported that despite living in heated lakes for many decades, largemouth bass (Micropterus salmoides) did not show a change in their critical thermal maximum when raised in a controlled environment. This indicates that their heat exposure in natural habitats did not significantly alter their thermal tolerance limits compared to fish from non-heated environments. Therefore, further analysis of the temperature response mechanisms and temperature evolutionary adaptation of specific fish species would be valuable. For example, in terms of spotted sea bass, Chen et al. [23] explained its temperature adaptation mechanism under different environmental conditions based on SNP sites in its genome. On this basis, the relevant research can enhance our understanding of fish thermal adaptation, and thus, bring benefits to the construction of nuclear power and the production of related fish.

5. Conclusions

In conclusion, in the same seasonal conditions, varying rates of temperature increase (+2, +4, +6 and +8 °C/h) did not impact the thermal tolerance of spotted sea bass and pearl gentian grouper. There was a significant seasonal correlation with the thermal tolerance of these two kinds of fish. For spotted sea bass, the semi-lethal temperature in summer can reach about 40 °C (initial temperature 26.5 °C), while in winter, it is about 35 °C (initial temperature 14.5 °C). For pearl gentian grouper, the semi-lethal temperature in summer can reach about 40 °C (initial temperature 25.9 °C), while in winter, it is about 38 °C (initial temperature 16.6 °C). The limitations of this study are reflected in the lagged temperature observations during the CTM experiments and variations in fish size between seasons, which may have influenced the experimental results to some extent. Therefore, subsequent studies could further illustrate the effects of animal sizes or temperature rising rates on the thermal tolerance of fish based on specific species and acclimation temperature conditions. In addition, further analysis of the temperature response mechanisms and temperature evolutionary adaptation of specific fish species would be valuable and could enhance our understanding of fish thermal adaptation, and thus, bring benefits to the construction of nuclear power plants and the production of related fish.

Supplementary Materials

The following supporting information can be downloaded at: https://www.mdpi.com/article/10.3390/fishes8120576/s1, Figure S1: The semi-lethal temperature curves and equations fitted by an exponential model for spotted sea bass in spring; Figure S2: The semi-lethal temperature curves and equations fitted by an exponential model for grouper in spring; Figure S3: The semi-lethal temperature curves and equations fitted by an exponential model for spotted sea bass in summer; Figure S4: The semi-lethal temperature curves and equations fitted by an exponential model for grouper in summer; Figure S5: The semi-lethal temperature curves and equations fitted by an exponential model for spotted sea bass in autumn; Figure S6: The semi-lethal temperature curves and equations fitted by an exponential model for grouper in autumn; Figure S7: The semi-lethal temperature curves and equations fitted by an exponential model for spotted sea bass in winter; Figure S8: The semi-lethal temperature curves and equations fitted by an exponential model for grouper in winter.

Author Contributions

Conceptualization, methodology, software, formal analysis, H.L., Y.H. and K.Z. Investigation, resources, data curation, H.L., Y.H., J.B., R.Z., Y.Y. and K.L. Writing—original draft preparation, writing—review and editing, H.L. and Y.H. Visualization, H.L., Y.H., J.B., R.Z., Y.Y. and K.L. Supervision, H.L., Y.H. and K.Z. Project administration, H.L., Y.H. and K.Z. Funding acquisition, H.L., Y.H. and K.Z. All authors have read and agreed to the published version of the manuscript.

Funding

This research was funded by the National Natural Science Foundation of China (grant number 42006127).

Institutional Review Board Statement

All procedures of this study are subject to the Regulations on the Management of Experimental Animals (National Animal Control Regulations of China No. 11, Law and Regulation of The State Council No. 676 amended on 1 March 2017) and were approved by the Ethics Committee of Animal Experiments of Xiamen University (Xiamen, China).

Informed Consent Statement

Not applicable.

Data Availability Statement

The data presented in this study are available in the article.

Acknowledgments

We extend our appreciation to Zhongbao Li, Zhangfan Huang, Chao Fang, Fulong Gao, Fukun Huang, Shihao Yu, Xiaoqiang Geng, Jianfeng Mou, and Shuyi Zhang for their constructive help and suggestions for the paper.

Conflicts of Interest

The authors declare no conflict of interest.

References

  1. Long, Z.Y.; Qin, H.H.; Huang, Z.F.; Xu, A.L.; Ye, Y.L.; Li, Z.B. Effects of heat stress on physiological parameters, biochemical parameters and expression of heat stress protein gene in Lateolabrax maculatus. J. Therm. Biol. 2023, 115, 103606. [Google Scholar] [CrossRef] [PubMed]
  2. Wang, G.; Chao, Y.C.; Jiang, T.L.; Chen, Z.S. Facilitating developments of solar thermal power and nuclear power generations for carbon neutral: A study based on evolutionary game theoretic method. Sci. Total Environ. 2022, 814, 151927. [Google Scholar] [CrossRef] [PubMed]
  3. Dai, X.Y.; Guo, Z.Y.; Lin, Y.; Wei, C.; Ye, S.F. Application of satellite remote sensing data for monitoring thermal discharge pollution from Tianwan nuclear power plant in eastern China. In Proceedings of the 2012 5th International Congress on Image and Signal Processing (CISP), Chongqing, China, 16–18 October 2012; Chen, Q., Cheng, Q., Li, Y., Zhang, T., Wang, L., Eds.; IEEE: Piscataway, NJ, USA, 2012; pp. 1019–1023. [Google Scholar]
  4. Torres, M.; Bevia, F.R. Chlorine use reduction in nuclear or conventional power plants: A combined cooling-and-stripping tower for coastal power plants. J. Clean. Prod. 2012, 26, 1–8. [Google Scholar] [CrossRef]
  5. Zhang, J.J.; Wang, Y.B.; Ottmann, D.; Cao, P.; Yang, J.S.; Yu, J.B.; Lv, Z.B. Seasonal variability of phytoplankton community response to thermal discharge from nuclear power plant in temperate coastal area. Environ. Pollut. 2023, 318, 120898. [Google Scholar] [CrossRef] [PubMed]
  6. He, Y.Y. Discussion on utilization of surplus heat of circulating cooling water of fossil fuel nuclear power plants. J. China Inst. Water Resour. Hydropower Res. 2004, 2, 81–86. (In Chinese) [Google Scholar] [CrossRef]
  7. Dolan, T.E.; Lynch, P.D.; Karazsia, J.L.; Serafy, J.E. Statistical power to detect change in a mangrove shoreline fish community adjacent to a nuclear power plant. Environ. Monit. Assess. 2016, 188, 1–16. [Google Scholar] [CrossRef] [PubMed]
  8. Cooper, C.J.; Kristan, W.B.; Eme, J. Thermal tolerance and routine oxygen consumption of convict cichlid, Archocentrus nigrofasciatus, acclimated to constant temperatures (20 degrees C and 30 degrees C) and a daily temperature cycle (20 degrees C -> 30 degrees C). J. Comp. Physiol. B 2021, 191, 479–491. [Google Scholar] [CrossRef]
  9. Ortega, E.; Reyes, J.; Rodriguez, M.H. Growth, thermal preference and critical thermal maximum for Totoaba macdonaldi: Effect of acclimation temperature and inclusion of soybean meal in the diet. Lat. Am. J. Aquat. Res. 2021, 49, 258–271. [Google Scholar] [CrossRef]
  10. Penny, F.M.; Pavey, S.A. Increased acute thermal tolerance and little change to hematology following acclimation to warm water in juvenile striped bass, Morone saxatilis. Environ. Biol. Fish. 2021, 104, 489–500. [Google Scholar] [CrossRef]
  11. Bilyk, K.T.; Sformo, T.L. Varying heat tolerance among Arctic nearshore fishes. Polar Biol. 2021, 44, 607–612. [Google Scholar] [CrossRef]
  12. Kir, M.; Sunar, M.C.; Topuz, M.; Sariipek, M. Thermal acclimation capacity and standard metabolism of the Pacific white shrimp Litopenaeus vannamei (Boone, 1931) at different temperature and salinity combinations. J. Therm. Biol. 2023, 112, 103429. [Google Scholar] [CrossRef] [PubMed]
  13. Radtke, G.; Wolnicki, J.; Kapusta, A.; Przybylski, M.; Kaczkowski, Z. Critical thermal maxima of three small-bodied fish species (Cypriniformes) of different origin and protection status. Eur. Zool. J. 2022, 89, 1351–1361. [Google Scholar] [CrossRef]
  14. Cereja, R. Critical thermal maxima in aquatic ectotherms. Ecol. Indic. 2020, 119, 106856. [Google Scholar] [CrossRef]
  15. Rajaguru, S. Critical thermal maximum of seven estuarine fishes. J. Therm. Biol. 2002, 27, 125–128. [Google Scholar] [CrossRef]
  16. Qin, H.H.; Long, Z.Y.; Huang, Z.F.; Ma, J.R.; Kong, L.M.; Lin, Y.; Lin, H.; Zhou, S.S.; Li, Z.B. A comparison of the physiological responses to heat stress of two sizes of juvenile spotted seabass (Lateolabrax maculatus). Fishes 2023, 8, 340. [Google Scholar] [CrossRef]
  17. Messmer, V.; Pratchett, M.S.; Hoey, A.S.; Tobin, A.J.; Coker, D.J.; Cooke, S.J.; Clark, T.D. Global warming may disproportionately affect larger adults in a predatory coral reef fish. Global Change Biol. 2017, 23, 2230–2240. [Google Scholar] [CrossRef]
  18. Stavrakidis-Zachou, O.; Lika, K.; Pavlidis, M.; Asaad, M.H.; Papandroulakis, N. Metabolic scope, performance and tolerance of juvenile European sea bass Dicentrarchus labrax upon acclimation to high temperatures. PLoS ONE 2022, 17, e0272510. [Google Scholar] [CrossRef]
  19. Cheng, S.Y.; Chen, C.S.; Chen, J.C. Salinity and temperature tolerance of brown-marbled grouper Epinephelus fuscoguttatus. Fish Physiol. Biochem. 2013, 39, 277–286. [Google Scholar] [CrossRef]
  20. Wu, Y.D.; Yu, X.K.; Suo, N.; Bai, H.Q.; Ke, Q.Z.; Chen, J.; Pan, Y.; Zheng, W.Q.; Xu, P. Thermal tolerance, safety margins and acclimation capacity assessments reveal the climate vulnerability of large yellow croaker aquaculture. Aquaculture 2022, 561, 738665. [Google Scholar] [CrossRef]
  21. Chen, X.M.; Li, J.K.; Wang, Z.Y.; Cai, M.Y.; Liu, X.D. Thermal tolerance evaluation and related microsatellite marker screening and identification in the large yellow croaker Larimichthys crocea. China J. Oceanol. Limn. 2017, 35, 566–571. [Google Scholar] [CrossRef]
  22. White, D.P.; Wahl, D.H. Growth and physiological responses in largemouth bass populations to environmental warming: Effects of inhabiting chronically heated environments. J. Therm. Biol. 2020, 88, 102467. [Google Scholar] [CrossRef] [PubMed]
  23. Chen, B.H.; Zhou, Z.X.; Shi, Y.; Gong, J.; Li, C.Y.; Zhou, T.; Li, Y.; Zhang, D.C.; Xu, P. Genome-wide evolutionary signatures of climate adaptation in spotted sea bass inhabiting different latitudinal regions. Evol. Appl. 2023, 16, 1029–1043. [Google Scholar] [CrossRef] [PubMed]
Figure 1. Variation trend of thermal tolerance in different seasonal conditions of spotted sea bass. Note: In the figure, the letters (a), (b), and (c) represent the variation trend of maximum critical temperature, semi-lethal temperature (exponential model), and semi-lethal temperature (Probit method) of spotted sea bass in different seasons, respectively.
Fishes 08 00576 g001
Figure 2. Variation trend of thermal tolerance in different seasonal conditions of grouper. Note: In the figure, the letters (a), (b), and (c) represent the variation trend of the maximum critical temperature, semi-lethal temperature (exponential model), and semi-lethal temperature (Probit method) of groupers in different seasons, respectively.
Fishes 08 00576 g002
Table 1. The experimental conditions in different seasons.
SeasonEnvironmental Water Temperature (°C)Average Weight of Fish (g)
Spotted sea bass
Spring21.63.10 ± 0.22
Summer26.53.80 ± 0.80
Autumn25.052.66 ± 11.49
Winter14.5104.25 ± 19.54
Grouper
Spring23.048.05 ± 4.75
Summer25.932.21 ± 3.01
Autumn25.959.91 ± 6.99
Winter16.624.15 ± 3.40
Table 2. Related parameters in spring CTM experiment.
ParameterTemperature Rise Rate (°C/h)
+2+4+6+8
Spotted sea bass
Critical thermal maximum (°C)35.57 ± 0.2535.43 ± 0.3135.40 ± 0.1735.37 ± 0.21
Initial death temperature (°C)37.23 ± 0.3236.87 ± 0.1536.80 ± 0.1036.87 ± 0.12
Absolute lethal temperature (°C)37.67 ± 0.1237.97 ± 0.1237.80 ± 0.1037.47 ± 0.21
Semi-lethal temperature (°C) a37.3037.4837.3737.28
Fit coefficient (R2) a0.7680.7870.7620.948
Semi-lethal temperature (°C) b37.2437.2437.1437.16
Grouper
Critical thermal maximum (°C)37.17 ± 0.0637.13 ± 0.3436.23 ± 0.0636.57 ± 0.32
Initial death temperature (°C)38.70 ± 0.1038.73 ± 0.1238.67 ± 0.3138.43 ± 0.40
Absolute lethal temperature (°C)39.83 ± 0.1239.53 ± 0.2339.83 ± 0.5539.47 ± 0.31
Semi-lethal temperature (°C) a39.3339.2439.2439.28
Fit coefficient (R2) a0.7810.7450.5870.923
Semi-lethal temperature (°C) b39.1039.0338.9739.15
Note: a The calculation was carried out by fitting the exponential model. b The calculation was carried out by the Probit module method. The same applies in the following tables.
Table 3. Related parameters in summer CTM experiment.
ParameterTemperature Rise Rate (°C/h)
+2+4+6+8
Spotted sea bass
Critical thermal maximum (°C)39.80 ± 0.2039.80 ± 0.2039.60 ± 0.2039.40 ± 0.20
Initial death temperature (°C)39.83 ± 0.2139.97 ± 0.0639.83 ± 0.1539.50 ± 0.26
Absolute lethal temperature (°C)40.17 ± 0.3240.93 ± 0.3240.50 ± 0.1740.73 ± 0.12
Semi-lethal temperature (°C)40.0140.5440.2240.24
Fit coefficient (R2)0.5150.9240.6220.965
Semi-lethal temperature (°C)39.9740.4440.0240.11
Grouper
Critical thermal maximum (°C)36.10 ± 0.2036.27 ± 0.4537.30 ± 0.1736.20 ± 0.10
Initial death temperature (°C)40.13 ± 0.1540.77 ± 0.3240.63 ± 0.0640.40 ± 0.35
Absolute lethal temperature (°C)40.93 ± 0.1242.10 ± 0.1741.40 ± 0.2042.13 ± 0.38
Semi-lethal temperature (°C)40.5541.4240.9441.46
Fit coefficient (R2)0.7460.8950.6800.837
Semi-lethal temperature (°C)40.4041.3640.8341.10
Table 4. Related parameters in autumn CTM experiment.
ParameterTemperature Rise Rate (°C/h)
+2+4+6+8
Spotted sea bass
Critical thermal maximum (°C)37.17 ± 0.1537.17 ± 0.1537.23 ± 0.1236.97 ± 0.42
Initial death temperature (°C)37.53 ± 0.1537.43 ± 0.2137.67 ± 0.0637.57 ± 0.42
Absolute lethal temperature (°C)39.20 ± 0.3639.03 ± 0.1539.23 ± 0.1539.27 ± 0.06
Semi-lethal temperature (°C)38.3038.3738.4640.24
Fit coefficient (R2)0.8050.7670.9170.965
Semi-lethal temperature (°C)38.1037.9338.3840.11
Grouper
Critical thermal maximum (°C)37.33 ± 0.2537.53 ± 0.2137.70 ± 0.2636.90 ± 0.50
Initial death temperature (°C)39.40 ± 0.7239.70 ± 0.0039.53 ± 0.5539.47 ± 0.58
Absolute lethal temperature (°C)40.40 ± 0.1040.67 ± 0.0641.00 ± 0.1040.40 ± 0.26
Semi-lethal temperature (°C)40.1140.4140.6440.13
Fit coefficient (R2)0.6820.8540.9010.914
Semi-lethal temperature (°C)40.0640.1440.5440.06
Table 5. Related parameters in winter CTM experiment.
ParameterTemperature Rise Rate (°C/h)
+2+4+6+8
Spotted sea bass
Critical thermal maximum (°C)33.90 ± 0.2033.83 ± 0.0633.60 ± 0.4433.90 ± 0.10
Initial death temperature (°C)35.27 ± 0.1535.23 ± 0.0635.33 ± 0.0634.93 ± 0.12
Absolute lethal temperature (°C)36.10 ± 0.0035.90 ± 0.5236.23 ± 0.4235.63 ± 0.06
Semi-lethal temperature (°C)35.8936.1435.7835.38
Fit coefficient (R2)0.8220.9130.8380.856
Semi-lethal temperature (°C)35.7335.8935.7335.33
Grouper
Critical thermal maximum (°C)35.77 ± 0.2535.37 ± 0.4534.70 ± 0.6635.13 ± 0.45
Initial death temperature (°C)38.20 ± 0.3638.30 ± 0.5236.93 ± 0.5037.20 ± 0.10
Absolute lethal temperature (°C)39.23 ± 0.3238.87 ± 0.0638.07 ± 0.0638.03 ± 0.21
Semi-lethal temperature (°C)38.8038.5237.8637.67
Fit coefficient (R2)0.8160.6710.8530.895
Semi-lethal temperature (°C)38.7138.5837.8237.65
Disclaimer/Publisher’s Note: The statements, opinions and data contained in all publications are solely those of the individual author(s) and contributor(s) and not of MDPI and/or the editor(s). MDPI and/or the editor(s) disclaim responsibility for any injury to people or property resulting from any ideas, methods, instructions or products referred to in the content.

