Article

Climate Change May Impact Nile Tilapia, Oreochromis niloticus (Linnaeus, 1758) Distribution in the Southeastern Arabian Peninsula through Range Contraction under Various Climate Scenarios

by
Hamid Reza Esmaeili
* and
Zohreh Eslami Barzoki
Zoology Section, Department of Biology, School of Science, Shiraz University, Shiraz 7146713565, Iran
*
Author to whom correspondence should be addressed.
Fishes 2023, 8(10), 481; https://doi.org/10.3390/fishes8100481
Submission received: 24 August 2023 / Revised: 21 September 2023 / Accepted: 25 September 2023 / Published: 27 September 2023

Abstract

:
Climate change is expected to affect freshwater water bodies worldwide, especially those located in semiarid and arid regions, including the Arabian Peninsula. Species distribution modeling has been widely used to predict the effects of climate changes on aquatic species. Occurrence records of the cichlid fish Nile tilapia, Oreochromis niloticus, were geographically mapped, followed by the implementation of species distribution models to delineate its range within the sensitive inland water system of the southeastern Arabian Peninsula. The analysis encompassed the examination of species presence data in the context of environmental variables, leading to the development of an ensemble model for habitat suitability, combining four distinct species distribution models. The findings indicated that the mean diurnal range and precipitation seasonality emerged as the most influential factors in predicting the suitability of habitats for O. niloticus. The response curve analysis indicated that the presence probability of O. niloticus decreased with increasing mean diurnal range and decreasing precipitation seasonality. The suitable distribution ranges for O. niloticus in the studied area were mainly distributed in the northeast of this region, where native/endemic fish diversity is high. The ensemble model results specified a significant impact of climate change on O. niloticus distribution, so highly suitable areas for this species will be reduced, while areas with low to moderate suitability increase slightly or remain unchanged. While O. niloticus is anticipated to display resilience and prosper under the influence of climate change, it remains paradoxical that its habitats are at risk of being compromised by climate-induced alterations. Consequently, even this resilient species stands susceptible to the repercussions of climate change. Due to the worldwide severe impacts of Nile tilapia, regular monitoring of freshwater ecosystems and fish fauna—especially in the northeast of the Arabian Peninsula, which has currently been invaded by this alien species—and protecting the region from key anthropogenic stressors are recommended to successfully conserve the freshwater fishes, which include about 22 recognized fish species in 16 genera, 10 families, 7 orders, and a class including 20 natives (7 endemic) species, out of which 13 species co-occur in sympatricity with O. niloticus.
Key Contribution: Based on the occurrence data and species distribution modeling, the introduced Nile tilapia (i) has currently expanded its distribution range throughout the majority of water bodies in the southeastern Arabian Peninsula; (ii) the suitable distribution ranges for Nile tilapia are mainly distributed in the northeast of this region; and (iii) a significant loss of climatically suitable habitats is predicted in future for this alien species, which is a very important issue for conservation biologists.

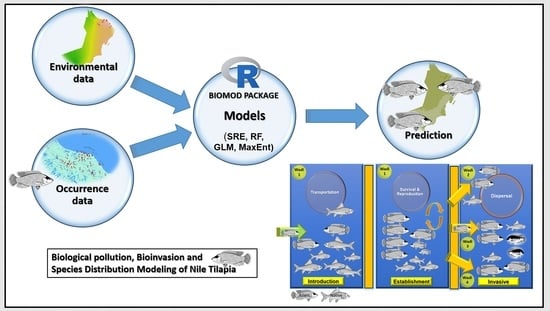
Graphical Abstract

1. Introduction

Freshwater ecosystems, such as streams, rivers, lakes, wetlands, and manmade reservoirs/dams, comprise only 2.3% of the Earth’s surface, but these water bodies harbor a disproportionately high species richness relative to other ecosystems on the Earth [1,2,3,4,5]. Freshwater environments are among the most threatened ecosystems on the planet [5]. Aquatic organisms in these freshwater environments face numerous threats, e.g., habitat degradation, hydrology alterations, pollution, over-exploitation, and invasive species [2,4,5,6,7]. Reid et al. [4] recognized several new threats to freshwater biological diversity that have either exacerbated or started since 2006. These threats include biological invasions; e-commerce (e.g., easy internet marketing of novel invasive species by individual hobbyists, collectors, and breeders); infectious diseases; harmful algal blooms; emerging contaminants such as engineered nanomaterials, nanoplastics, and microplastics; light and noise pollution; expanding hydropower; freshwater salinization; diminishing calcium levels; and climate change. These known threats are disrupting the life cycles or phenology of aquatic organisms [4,5]. The first of these is likely a global threat affecting world biodiversity.
The introduction of an exotic organism outside its native range and the problems caused by such invasive species (known as biological pollution/biopollution) can unprecedentedly change the world’s natural communities, ecological characteristics, and functions following its establishment [8,9]. Due to world globalization, an increase in biological invasions/bioinvasions has proliferated in the last few years, a pattern likely to continue in the future and can be considered a major threat to biodiversity [10]. Based on several pieces of evidence, invasive species have a main role in declining native and endemic species diversity and their displacement worldwide [10,11,12]. This has led to changes in environmental regimes [13] and has increased risks to human well-being [14]. Moreover, invasive species also are very costly to the worldwide economy [10,15].
In particular, non-indigenous/exotic tilapias, especially the Nile tilapia, Oreochromis niloticus, are among the most successful and harmful fish invaders globally. The Nile tilapia is a cichlid fish native to Africa that has been successfully introduced to at least 100 countries, including countries of the Arabian Peninsula, for aquaculture due to its high growth rate, resistance to diseases, tolerance to various environmental conditions, high meat quality, and high production [16,17,18]. At present, it is one of the most important freshwater species used in aquaculture worldwide [18]. Due to its capacity to cause a series of environmental and ecological problems, i.e., changes in water quality, habitat degradation, trophic cascades, and modifications of ecosystem function [18,19], O. niloticus is currently known as one of the most hazardous invasive fish in the tropical and subtropical areas of the world [18,20].
The increase in the number and population size of invasive species and their impacts on biological diversity and ecosystem function raise numerous management and control concerns [10,21,22]. It has been documented that prevention of the establishment of an invasive species and its further spread is a more effective and less costly conservation plan strategy than eradication, containment, and control of an invasive population. When the invasive species establish a breeding population, especially in highly stressed ecosystems such as the inland and coastal water bodies of the Arabian Peninsula, a number of stressors can threaten its ecological integrity and sustainability [17,23,24,25]. Recently, species distribution models (SDMs) have been progressively applied in bioinvasion and ecological investigations to predict and understand the geographical distribution of invaders, e.g., [5,10,19,26]. In SDMs, geo-located observations of species occurrence are linked to environmental variables [27,28].

Why the Ensemble Model?

Species distribution models (SDMs) are effectively used to predict the geographic extent of species by linking information about species georeferenced and environmental parameters [29]. Along with the development of remote sensing and geographic information technology, SDM is broadly used to assess biodiversity, predict species distribution potential, and protect rare species [30,31,32]. There are several different algorithms and approaches that can be used to build SDMs, and random forest (RF), generalized linear models (GLM), and maximum entropy (MaxEnt) are among the most commonly used methods. However, choosing the right model for analysis and obtaining an accurate and reasonable distribution of predicted species is difficult because the principles and algorithms of each model are different [33]. To resolve this type of uncertainty, an increasing number of studies employ ensemble modeling approaches that combine predictions from different modeling techniques [34].
The ensemble model (EM) is an effective method that can be used to assess the potential distribution of species at a large spatial scale and can reduce the uncertainty caused by a single model [35]. It is being used to predict the distribution range of various species with good accuracy, e.g., [34,36].
Herein, an ensemble model was implemented to predict the potential geographic distribution of O. niloticus outside its native range, with a particular reference to the inland water bodies of the southeastern Arabian Peninsula (Oman), where it has become established and is now spreading. The aim of the present work was to: (i) map the occurrence records of O. niloticus, (ii) access the predicted distribution of O. niloticus across the southeastern Arabian Peninsula River systems in the Oman territory, (iii) evaluate the model performance and the effect of the number and type of environmental parameters on the introduced ranges of O. niloticus, and (iv) provide a list of indigenous fishes that co-occurs with O. niloticus and possible threats of its introduction.

2. Material and Methods

2.1. Specimen Data Sources and Occurrence Records
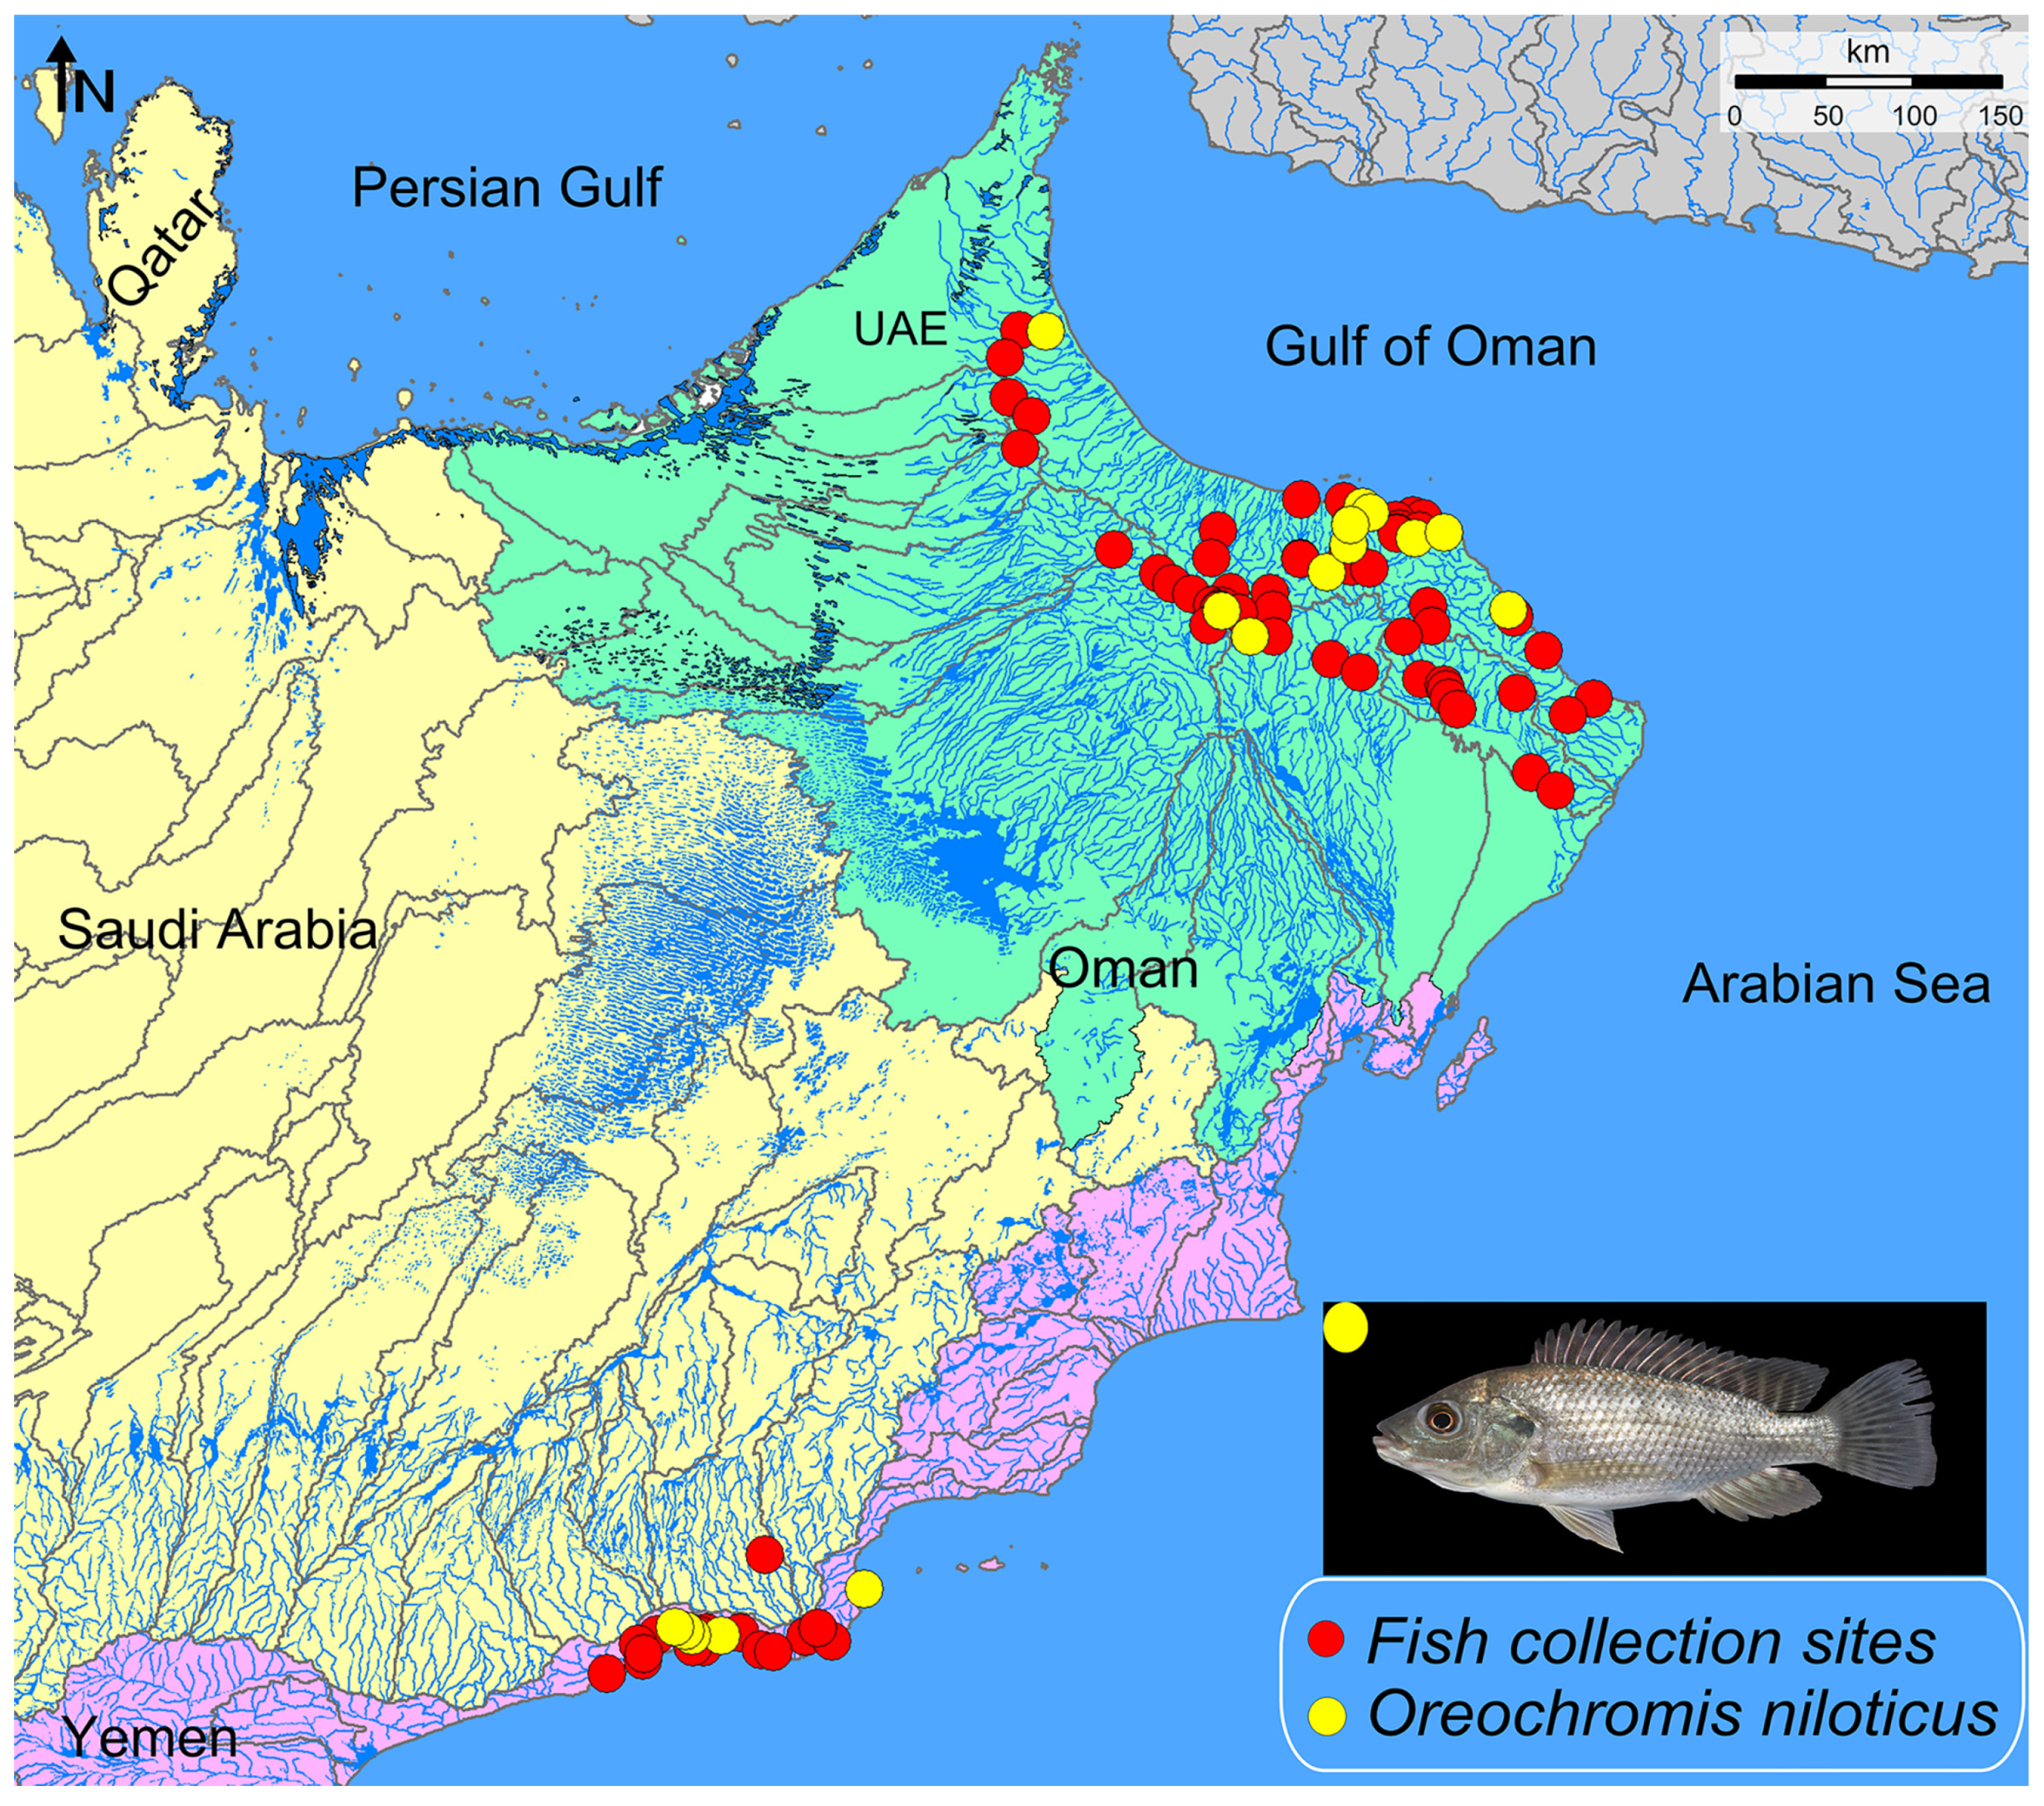
In this study, the occurrence and contemporary distribution of the invasive species Nile tilapia, O. niloticus, from entire drainage basins of the southeastern Arabian Peninsula (Figure 1) including three main ecoregions, were mapped: (i) Oman Mountains, ID 443 (located in the southeastern part of the Arabian Peninsula, lying mostly within Oman and the United Arab Emirates, and bounded by the Persian Gulf, Strait of Hormuz, Gulf of Oman, Arabian Sea, and Rub’ al Khali Desert), (ii) Southwestern Arabian Coast, ID 439 (runs along the southern and western fringes of the Arabian Peninsula, bounded by the Red Sea to the west, the Gulf of Aden to the south, and the An-Nafud and Rub’ al-Khali deserts of the Arabian interior to the east and north), and (iii) Arabian Interior, ID 440 (in general, the whole ecoregion includes the internal basins of the Arabian Peninsula. It is bounded to the east by the Oman Mountains ecoregion (443), the Persian Gulf, and Lower Tigris and Euphrates ecoregion (441); to the north by the Upper Tigris and Euphrates ecoregion (443); to the northwest by a small section of Coastal Levant (436), Orontes (447), and Jordan River (438) ecoregions; and to the west and south by the Southwest Arabian Coast ecoregion (439).
This study was based on (i) available published data [17,24,25] and (ii) extensive fieldwork in the three main ecoregions of the southeastern Arabian Peninsula (Oman Territory) during 2021–2022 that provided the geographic coordinates for O. niloticus distribution. During these field works, native and exotic fishes, including Nile tilapia, were collected using foldable shrimp and crab fishing traps and hand nets from 89 sampling sites. To collect exotic and native fishes, several main water bodies in these three ecoregions were visited/sampled: river and stream systems (Wadis), aflaj or qanats (specific artificial irrigation channel systems), subterranean water systems, sinkholes, artificial dams, and brackish salt flats. After anesthesia, fish specimens were fixed in 10% formaldehyde or absolute alcohol and transferred to the laboratory for further identification. Fixed specimens were deposited at ZM-CBSU (Zoological Museum, Collection of Biology Department, Shiraz University, Iran). For species identification and taxonomic nomenclature, the works of Freyhof et al. [17], Esmaeili et al. [24], and Esmaeili and Hamidan [25] were followed.
Figure 1. Fish collection sites and distribution map of Oreochromis niloticus, an exotic and established fish in Oman. Pink: Southwestern Arabian Coast Ecoregion, green: Oman Mountains Ecoregion, and yellow: Arabian Interior Ecoregion based on (i) available published data [17,24,25] and (ii) extensive fieldwork in the three main ecoregions of the southeastern Arabian Peninsula (Oman Territory) during 2021–2022. The map was originally designed using HydroBASINS (Lehner and Grill [37]) and Freshwater Ecoregions of the World’s data (Abell et al. [38]) in DIVA-GIS 7.5 and Surfer 11.
Fishes 08 00481 g001

2.2. Environmental Variables

The current and future bioclimatic data with a 2.5 arc-second resolution were obtained from the WorldClim database (http://www.Worldclim.org (accessed on 12 November 2022)). To predict the spread of species through the 2050s (predicted mean for 2041–2060), we selected medium-resolution Beijing Climate Center Climate System Model version 2 (BCC-CSM2-MR) from the Coupled Model Intercomparison project phase 6 (CMIP6) for our projections. CMIP6 has higher resolution and climate sensitivity compared to CMIP5 [39,40], and the BCC-CSM2-MR model has a better performance compared to other global climate models [41]. For the four shared socioeconomic pathways (SSP126, SSP245, SSP370, and SSP585), we chose low radiation intensity (SSP126) for the optimistic scenario and high radiation intensity (SSP 585) for the pessimistic scenario for model simulation under the future climate scenario.
To avoid the problem of model fitting due to the collinearity of climatic factors, correlation analysis was carried out. Climatic factors with |r| < 0.8 were selected. Finally, seven climatic factors were selected to build the model: mean diurnal range (mean of monthly/max temp—min temp) (Bio2), Isothermality (Bio2/Bio7) (* 100) (Bio3), min temperature of coldest month (Bio6), mean temperature of wettest quarter (Bio8), precipitation of wettest month (Bio13), precipitation of driest month (Bio14), and precipitation seasonality (coefficient of variation) (Bio15).

2.3. Establishment of Single-Species Distribution Model

We used 4 model algorithms in the ‘biomod2’ package [42] in R 3.6.3. These model algorithms included surface range envelope (SRE), random forest (RF), generalized linear model (GLM), and maximum entropy (MaxEnt). The sample data (including occurrence data and pseudo absence points) were randomly divided into two parts: 80% of the data as the training data set and 20% as the test data set. Each model algorithm was repeated 10 times.

2.4. Model Evaluation

We chose two evaluation metrics models embedded in the ‘biomod2’ package to evaluate the fitting accuracy: (1) the true skill statistic (TSS), a metric that is developed from Cohen’s kappa statistics (KAPPA) and contains the advantages of KAPPA while avoiding its disadvantages [43], and (2) receiver operating characteristic (ROC), which is the most widely used index to evaluate models. The area under the ROC curve (AUC) value can indicate the precision of the model prediction. Higher values make the model more predictive.

2.5. Ensemble Model (EM) Construction

To reduce the uncertainty introduced by the modeling algorithms, we implemented the two evaluation indicators of ROC and TSS to build the EM. Only single-model results with an ROC value greater than 0.9 and a TSS value greater than 0.7 were retained.
We employed the variable importance criterion to assess changes in modeling by accumulating the reduction in model statistics by adding each variable to the model. The consensus probabilistic maps, which indicate suitable habitats for O. niloticus under current and future environmental conditions, were created by averaging the projections made by the various algorithms.

3. Results

3.1. Mapping the Occurrence Records

Mapping of the occurrence and contemporary distribution of Nile tilapia from the entire drainage basins of the southeastern Arabian Peninsula, including three main ecoregions, is given in Figure 1. The distribution range of Nile tilapia was mainly located in the Oman Mountains ecoregion in the southeastern part of the Arabian Peninsula, lying mostly within Oman and the United Arab Emirates; it was recorded only from a few localities in the Southwestern Arabian Coast ecoregion (runs along the southern and western fringes of the Arabian Peninsula), and there was no presence recorded in the Arabian Interior ecoregion (the internal basins of the Arabian Peninsula).

3.2. Ensemble Modeling and Predicted Current and Future Distribution

The algorithms with a mean ROC value greater than 0.9 and a mean TSS value greater than 0.7 were selected for ensemble modeling. This way, the SRE algorithm was removed. The values of TSS and ROC of the EM were 0.88 and 0.98, respectively, signifying more accurate predictions than all of the single models.
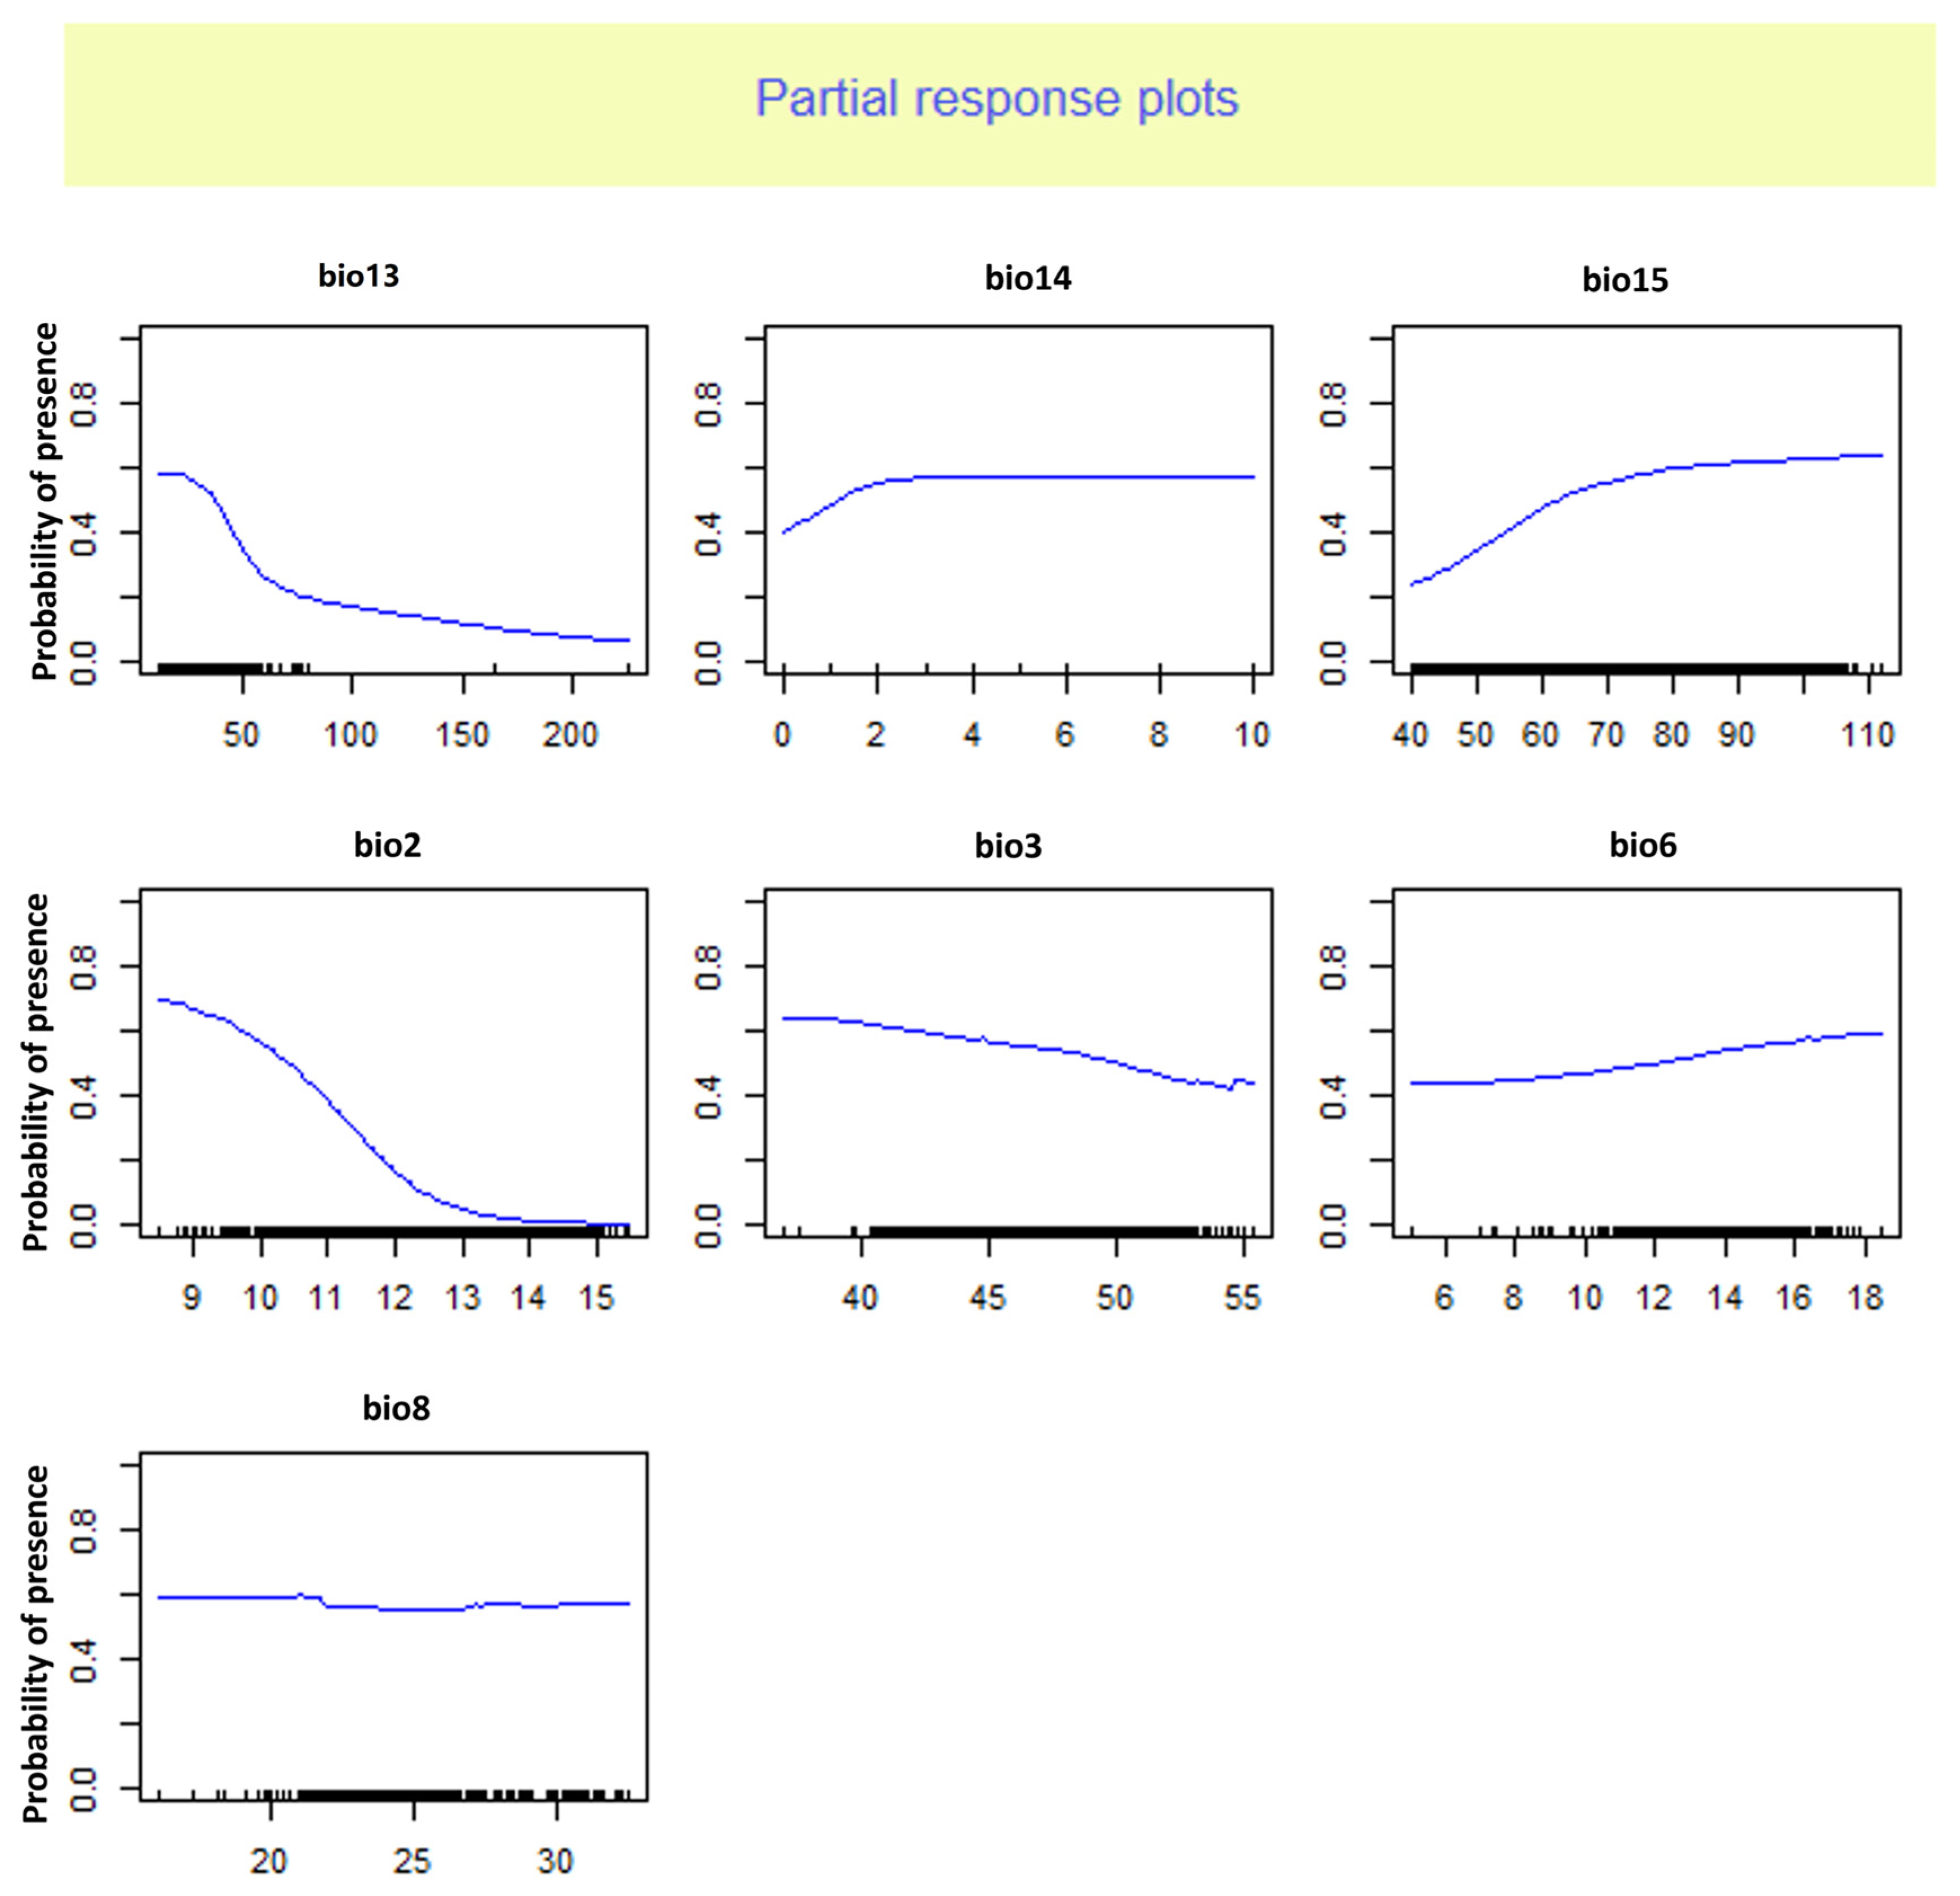
Based on our findings, the mean diurnal range (Bio2) was the most significant climatic variable affecting O. niloticus’s distribution (Table 1). The occurrence probability of O. niloticus decreased with increasing BIO2 (Figure 2 and Figure 3).
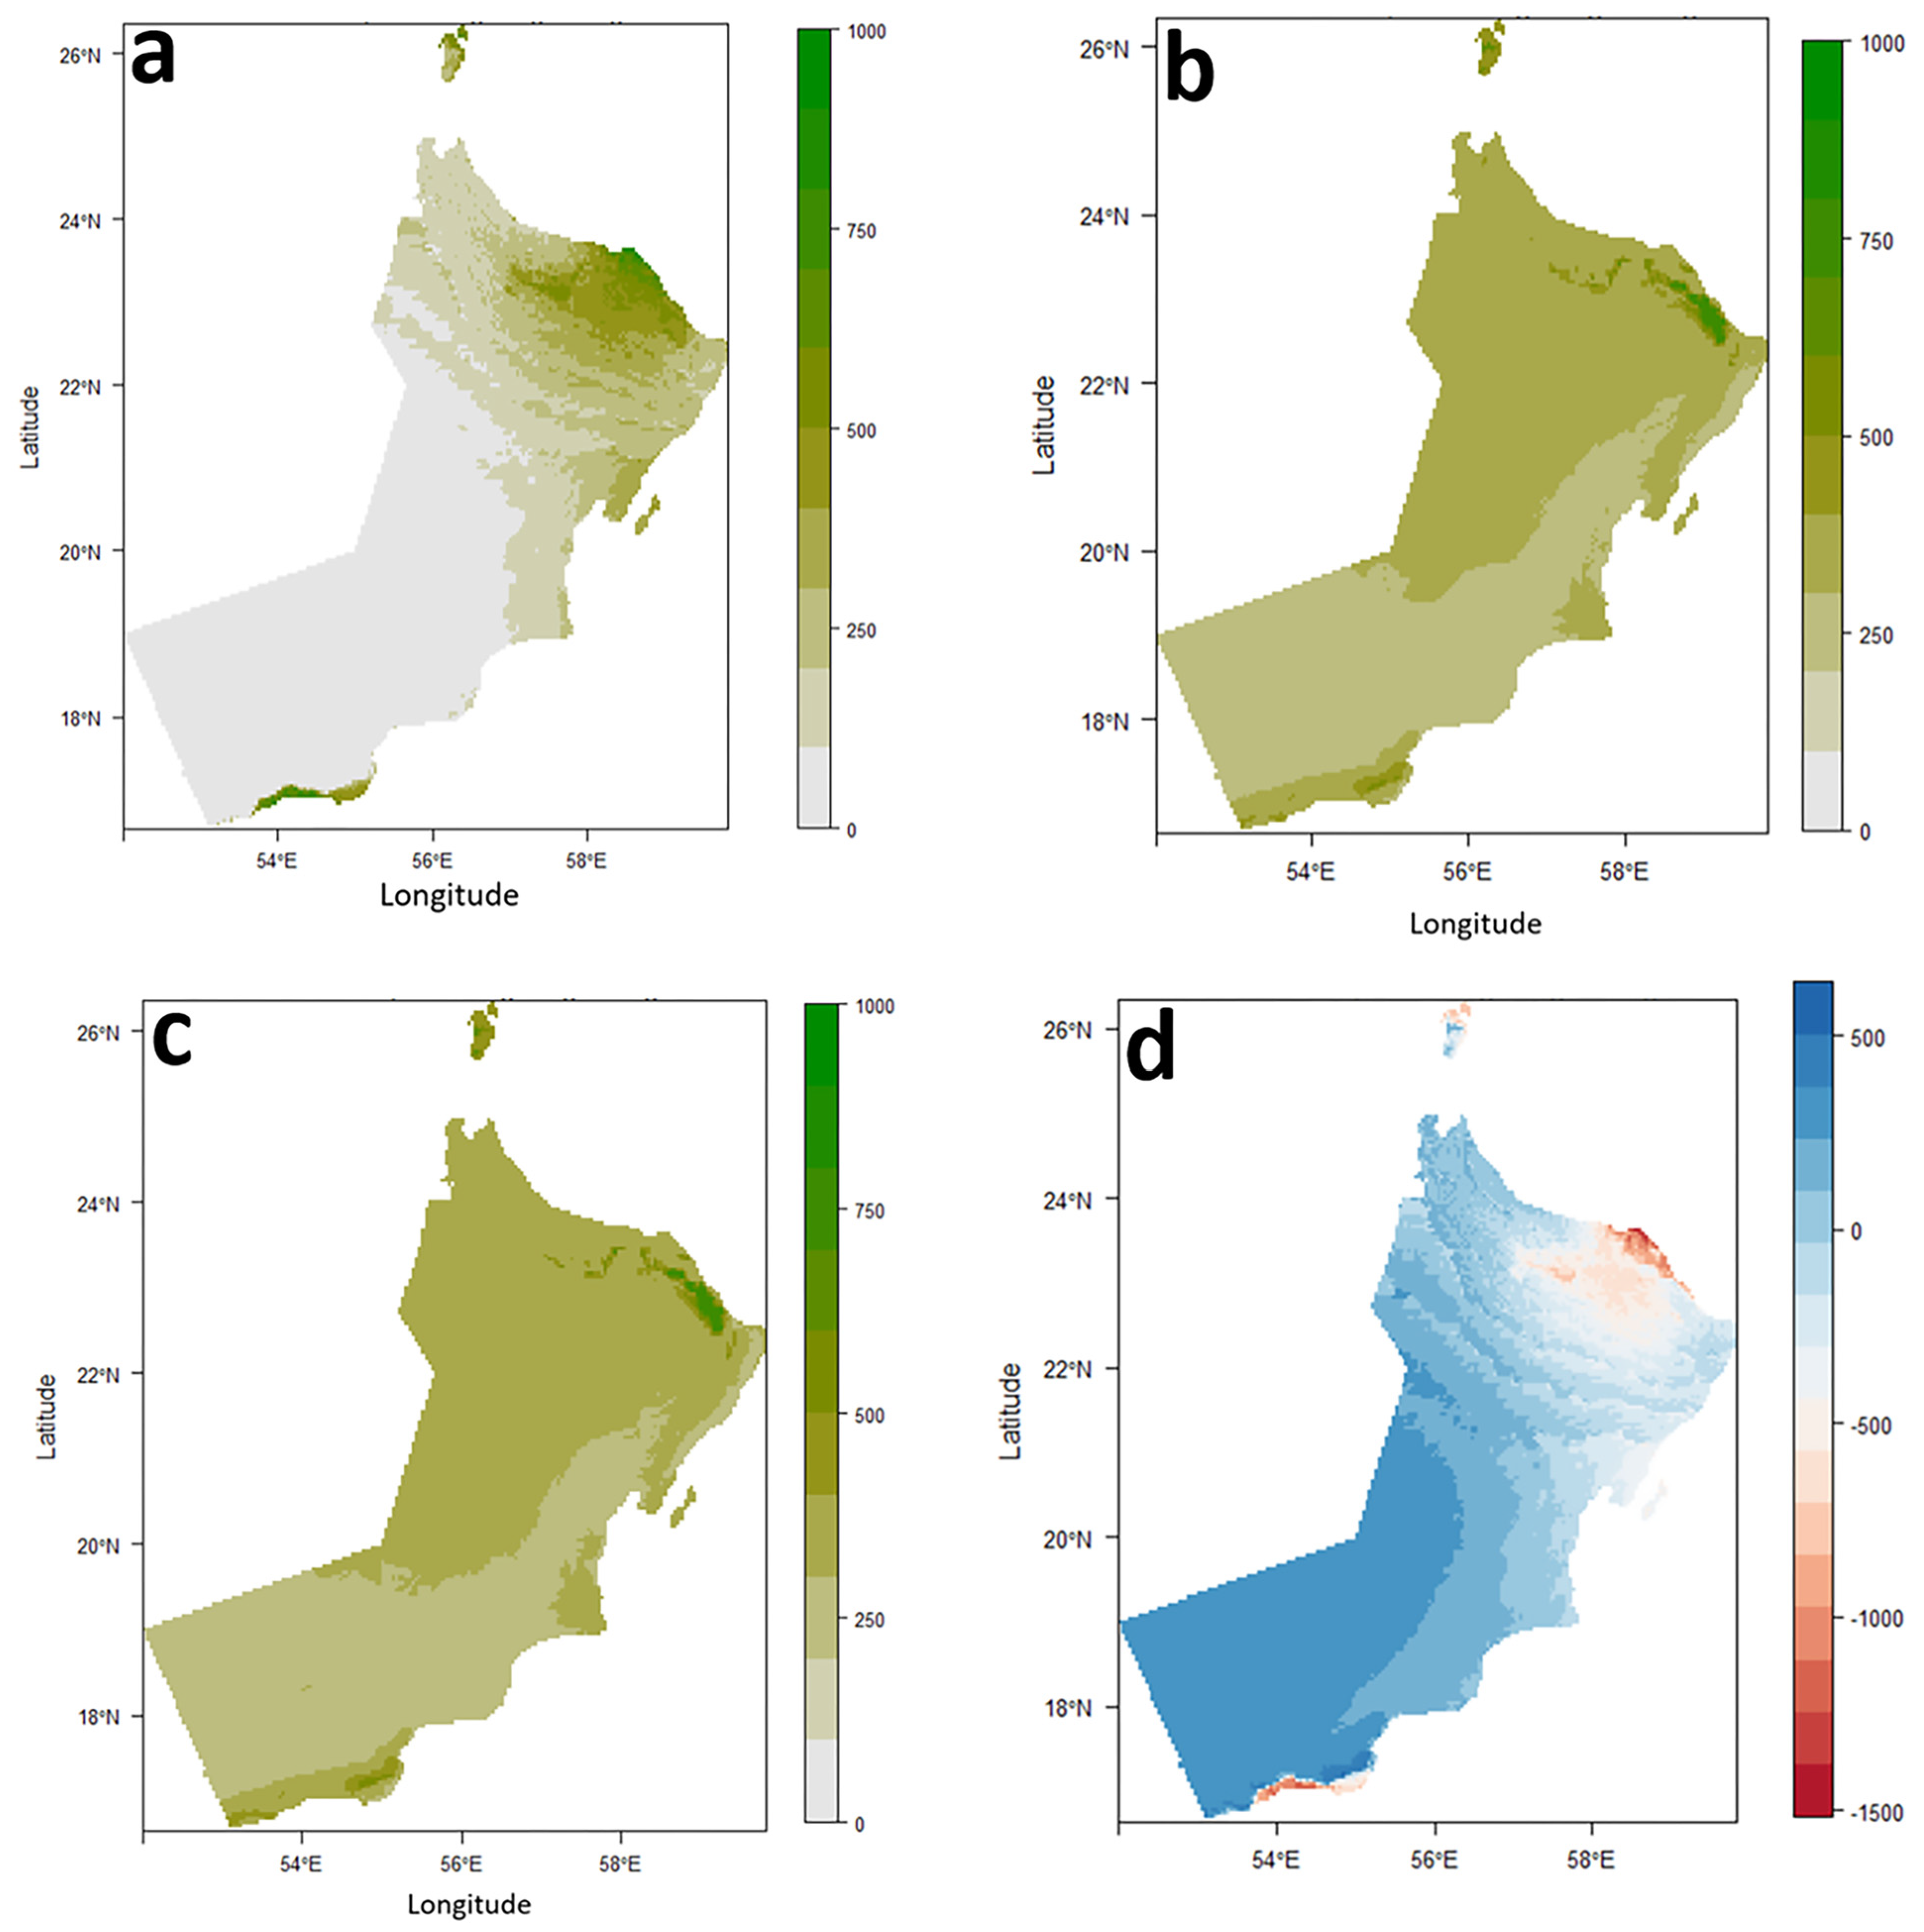
The distribution map of O. niloticus under the current and future climatic conditions was accessed based on the EM prediction results (Figure 4a–c). So, considering the importance of different environmental variables in shaping the distribution of O. niloticus and the current gradient of environmental variables, the EM model predicts that the suitable distribution areas for O. niloticus (the areas with a high probability of presence) are generally distributed in the northeast of the Arabian Peninsula.
EM results indicated that climate change would have a significant impact on O. niloticus distribution. So, highly suitable areas for this species will be reduced, while areas with low to moderate suitability (areas with low probability of presence) increase slightly or remain unchanged (Figure 4d).

3.3. Nile Tilapia and Co-Occurrence with Indigenous Fishes

As is shown in Table 2, based on extensive fieldwork carried out in the three main ecoregions of the southeastern Arabian Peninsula (Oman Territory) during 2021–2022, the southeastern Arabian Peninsula’s fish fauna (Oman Territory) consists of 22 recognized species in 16 genera, 10 families, 7 orders, and 1 class. The most diverse orders are Cypriniformes (two genera, seven species, 38.81%) and Gobiiformes (seven genera, seven species, 38.81%), followed by Cyprinodontiformes (two genera, three species, 13.64%), Cichliformes (two genera, two species, 9.01%), and Centrarchiformes, Gonorynchiformes, and Mugiliformes (one genus, one species, 4.54% each). A total of 20 native species (90.91%) in 9 families and 2 exotic species (9.09%) in 2 families are listed here. Out of 20 native species, 7 species (35%) in 2 families are endemic taxa that are only found in the southeastern Arabian Peninsula. As given in Table 2, Nile tilapia co-occurs with the majority of native/endemic species in its current distribution range, e.g., Awaous jayakari, Glossogobius tenuiformis (Gobiidae), Aphaniops kruppi, A. stoliczkanus (Aphaniidae), Cyprinion muscatense, Garra shamal, and G. dunsirei (Cyprinidae).

4. Discussion

Occurrence records were mapped, and the current climatically suitable habitats and future (2050) distribution range of Nile tilapia in the river systems of the Oman territory in the southeastern Arabian Peninsula were predicted using SDM. The analysis revealed the ongoing expansion of Nile tilapia’s distribution range, now encompassing most water bodies in the southeastern Arabian Peninsula. Notably, suitable habitats for this species were primarily concentrated in the northeast region, characterized by a rich diversity of native fish.

4.1. Distribution Pattern

Mapping of the occurrence and contemporary distribution of Nile tilapia revealed that the distribution range of this species was mainly located in the Oman Mountains ecoregion, although it was observed in a few localities in the Southwestern Arabian Coast ecoregion. It has been intentionally introduced from Egypt to the area (probably into the waterbodies near Masqat for the first time to control mosquitos), where they reproduced and colonized [24], and its extension distribution range has been intentionally or indeliberately promoted by human activities [24], producing breeding, established, and invasive populations [24].
The areas predicted by the ensemble distribution model as suitable habitats for O. niloticus are mainly distributed in the coastal area of the northeast of the southeastern Arabian Peninsula (Oman Territory), where several freshwater ecosystems, including streams, qanats (Aflaj), and permanent rivers (wadis), are located. This area mainly coincides with the known distribution of O. niloticus represented by our records. However, there are some regions of discordance between the distribution model and known O. niloticus occurrence. For example, our model predicted high habitat suitability for O. niloticus on Masirah Island on the east coast of mainland Oman, while there is still no record of this species on this island.
Based on current results, the distribution of O. niloticus is likely to be affected by climate change because the suitable distribution areas under various climate scenarios showed a contraction, and Nile tilapia will experience a significant loss of climatically suitable habitats in the future if all other stressors remain equal. Being an invasive fish that threatens native species, the prediction of a significant loss of its climatically suitable habitats in the future will be considered an important and essential signal for monitoring and conservation management programs of both non-native and native species.
Based on FishBase [46], Eschmeyer’s Catalog of Fishes [47], and Shuai et al. [48], Nile tilapia has been reported in at least 114 countries. Its natural distribution includes various fresh and brackish water bodies in North and Northeast Africa from the Nile River basin southwards through the Eastern and Western Rift Valley lakes in East Africa and westwards through the basins of Lake Chad, Niger, Benue, Volta, Gambia, and Senegal rivers [49,50]. However, it has been widely introduced for aquaculture elsewhere, e.g., Mississippi and Florida (USA), Mexico, Honduras, Costa Rica, Brazil, Ecuador, Uruguay, Argentina, Oman, Iran, Republic of Congo, Democratic Republic of Congo, Madagascar, Malaysia, Indonesia, Philippines, and Southern Japan [46,47]. Nile tilapia is by far the most prominent among the tilapia species produced by aquaculture, being the most farmed tropical fish species globally [50]. The world distribution range of Nile tilapia shows an increasing demand for this fish in aquaculture worldwide, the rapid expansion of its population following its introduction, and its establishment in many countries, including Oman, as a wild population. However, by using computational tools such as species distribution models, it is possible to predict the potential range of invasive species, including Nile tilapia, which usually predict new areas to be occupied by the invader. Moreover, modeling is an effective tool to direct management efforts to confirm establishment, direct remediation efforts, and contain further spread [19]. Based on Lake et al. [51], one key assumption in SDMs is that sample prevalence (the frequency of sampled sites in the total study area) accurately represents species prevalence (the frequency of species over the total study area). The same has been considered in the distribution modeling of Nile tilapia in Oman, as we almost covered all the inland water bodies of this area.

4.2. Ensemble Model Evaluation and Dominant Climatic Factor

Herein, using the ‘Biomod2’ package, four single-species distribution models and EM were constructed with the latest CMIP6 climate data, and the results were assessed by ROC and TSS. According to the evaluation metrics, the SRE model performed the worst. This is in agreement with the results of the other studies using multiple models to predict species distribution. Based on those studies, the predictive performance of the SRE algorithm is weaker compared to other algorithms like RF, GLM, and MAXENT [52,53]. As far as we know, the research on the suitable distribution of O. niloticus has only used the single-species distribution model, while the uncertainty of a single distribution model can be reduced to some extent by building an EM. As can be found through model evaluation, in our study, the EM performed better than the single-species distribution models.
Analysis of the relative importance of climate factors showed that the average diurnal range and precipitation seasonality are useful predictors of habitat suitability for O. niloticus. The response curve analysis indicated that the presence probability of O. niloticus decreased with increasing mean diurnal range and decreasing precipitation seasonality. While Zengeya et al. [19] found that the dominant factor affecting the distribution of O. niloticus in river systems of Africa was the minimum temperature of the coldest month, Singh et al. [54] reported the maximum temperature in January to be the main and significant variable in the probability of Nile tilapia establishment in the Ganga river system in India. These differences in the importance of environmental factors could be due to the different algorithms of different models and different ways of dealing with data, as well as the differences in regions of study. Based on Stewart et al. [5], the annual precipitation was the strongest driver of species distributions for freshwater fishes of southwestern Australia under a changing climate. They used species distribution modeling to identify ‘coldspots’ for the conservation of freshwater fishes [5].
The importance of mean diurnal range and precipitation seasonality in shaping the distribution range of several species of fish has been reported in previous studies. For example, Ruiz-Navarro et al. [30] reported the annual mean temperature and mean diurnal range of temperature as the most important climatic variables indicating the suitable habitat of Perca fluviatilis and Esox lucius in Great Britain. The study of Li et al. [55] indicated that environmental factors related to precipitation, such as precipitation of seasonality, play a significant role in the establishment success of non-native fishes across the Yarlung Zangbo River Basin in the Tibetan Plateau.
The mean diurnal range is the average of the difference between the monthly maximum and minimum temperatures of days and so defines the temperature fluctuations. The importance of this variable could show the negative effects of temperature fluctuations (rather than absolute temperature) on O. niloticus. The importance of this predictor may reflect a biological reliance of O. niloticus on relatively stable environmental temperature conditions. The key effect of temperature on the distribution of O. niloticus has also been stated in studies by Zengeya et al. [19] and Singh et al. [54].

4.3. Nile Tilapia as an Introduced Bioinvasive Species and Its Co-Occurrence with Other Fishes

An invasive fish is an alien or non-native species that has been introduced into sites beyond its natural distributional range and has produced self-reliant populations. The invasive fish spreads outside its primary site of introduction, causing damage to the environment structure, economy of the involved countries, and human well-being [56,57,58,59,60]. It involves three main processes: introduction, establishment, and invasion/biopollution [57,60]. These three main processes have already been completed for O. niloticus in the southeastern Arabian Peninsula, and thus, O. niloticus is considered an invasive species here.
Based on Boudouresque and Verlaque [61], an introduced species is defined as a species that fulfills the four following criteria: (i) colonization in a new area, (ii) direct or indirect impacts of anthropological activity on its distribution range, (iii) geographical discontinuity between its native area (Africa) and the Arabian Peninsula (remote dispersal), and (iv) its successful breeding in situ without human assistance resulting establishment of this biopollutant. Based on the above-mentioned definition, O. niloticus in southeastern Arabian Peninsula freshwater environments fulfills all four criteria. Based on our study, it has been intentionally introduced from Egypt to the area (probably into the waterbodies near Masqat for the first time to control mosquitos), where they reproduced and colonized [24]; the extension of its distribution range has been intentionally or indeliberately promoted by human activities. There is a geographical discontinuity between its native area (Africa) and the new area (southeastern Arabian Peninsula), and new generations of Nile tilapia have been produced in a different new area without human support. The absence of Nile tilapia in the list of fishes of the Arabian Peninsula [17,24], the presence of mature and ripe individuals in almost all the studied and sampling sites, and the absence of any Nile tilapia fish farm in the southeastern Arabian Peninsula confirm that Nile tilapia is a biological pollutant acting as a biological invader.
The present successful colonization of Nile tilapia (after its first introduction) in the southeastern Arabian Peninsula, like in other parts of the world, can be attributed to many of its characteristics: its larger size in comparison to native fishes (attaining a marketable size of 500–800 g within 6–8 months on a fish farm), a fast growth rate, a feeding diversity strategy (consuming very diverse food items, i.e., benthic algae, phytoplankton, macro-invertebrates, fishes, and eggs or young of other species), good adaptability to captive conditions, tolerance to relatively poor water quality and overcrowding, relative disease resistance, aggressive spawning behavior, high levels of parental care, and the ability to spawn multiple broods throughout the year [20,62,63,64,65]. As a tropical cichlid freshwater fish, the optimal water temperature and salinity of Nile tilapia for growth performance are between 28 and 32° and 0 and 8 ppt, respectively [65]. Nevertheless, it has been mentioned that Nile tilapia is also suitable for brackish water aquaculture with a salinity level of up to 15 ppt [65]. The lower and upper lethal temperatures for Nile tilapia are 11–12 °C and 42 °C, respectively [65], whereas the upper lethal salinity varies from about 20 ppt to about 40 ppt depending on the water temperature and the rate of salinity change (i.e., direct transfer vs. gradual acclimatization) [65]. The comparatively high performance in adaptability to a broad range of environmental conditions enables Nile tilapia to establish breeding populations across different geographical sites, ranging from tropical to temperate climates and from freshwater to brackish water. The suitable environmental conditions and high performance of O. niloticus are the main reasons for the establishment of this exotic fish in the southeastern Arabian Peninsula (Oman Territory). Fortunately, as the model predicted, a significant loss of climatically suitable habitats for this alien species in the future is proposed. However, regular monitoring of the Nile tilapia population and its distribution range, the study of its impacts on native fishes of the studied region, and the implementation of conservation management programs are recommended. Biological invasions have been considered one of the main causes of the loss of biodiversity [66,67,68] because invasive species can have severe effects on native species and ecosystems [69], especially if they more effectively occupy the same ecological niche [70]. Based on Esmaeili et al. [24], Zarei et al. [45], and Sayyadzadeh et al. [44], the diversity of inland fishes of the southeastern Arabian Peninsula consists of 22 recognized species 16 genera, 10 families, 7 orders, and a class including 20 native species (90.91%) in 9 families and 2 exotic species (9.09%). Out of 20 native species, 7 species (35%) in 2 families are endemic elements that are restricted to the Oman territory in the southeastern Arabian Peninsula. As O. niloticus co-occurs with the majority of native/endemic inland fish species in its current distribution range, it can affect the indigenous fishes of the region. Currently, it is sympatric with 13 native/endemic species (Table 2). Due to the recent introduction of Nile tilapia into the studied area, no comprehensive study has been conducted on different aspects of the biology, ecology, and genetics of this invasive species. However, there are a number of studies that have examined the adverse effects of Nile tilapia invasion on aquatic ecosystems, e.g., [20,71]. Based on these studies, Nile tilapia causes fishing pressure on native species, influences the growth of native fishes, reduces the income of fishermen [71], and decreases aquatic native plant diversity and its associated fauna, resulting in habitat loss; bioturbation; and nutrient recycling, of which bioturbation and nutrient recycling improve eutrophication of the waterbody [20]. A review of the literature reveals that in the areas where the Nile tilapia has become established, ecological effects include a decrease in abundance and extinction of native species resulting from habitat and trophic overlaps and competition for spawning, habitat destruction, water quality changes, and the introduction of diseases are the main threats affecting aquatic ecosystems [20]. Although the effects of O. niloticus invasion on the aquatic ecosystems of the southeastern Arabian Peninsula have not been studied in detail, due to its invasion strategy, the threats might be the same as those of other parts of the world. Co-invasion of parasites along with Nile tilapia invasion should also be considered.

5. Conclusions

The southeastern Arabian Peninsula (Oman) is expected to experience increased temperature and decreased precipitation due to climate change, which is similar to other arid and semiarid regions globally. These changes and several other anthropological activities, e.g., extensive use of land and water in the area, habitat modifications, and pollution, are likely to intensely impact the flow regimes of freshwater systems, making the freshwater fauna (both native and alien species) highly vulnerable.
Based on occurrence data and species distribution modeling, the following are concluded: (i) Nile tilapia has expanded its distribution range from a single locality near Muscat (Oman) throughout the majority of water bodies in the southeastern Arabian Peninsula, (ii) the current suitable distribution ranges for Nile tilapia are mainly distributed in the northeast of this region with a high native fish diversity, and (iii) a significant loss of climatically suitable habitats is predicted in the future. While Nile tilapia is anticipated to display resilience and prosper under the influence of climate change, it remains paradoxical that its habitats are at risk of being compromised by climate-induced alterations. Consequently, even this resilient species stands susceptible to the repercussions of climate change.
In order to reduce the current distribution range of the Nile tilapia, the strict prohibition of its introduction—including non-native fish stocking programs, using innovative bio-surveillance monitoring techniques like environmental DNA (eDNA) that help in the early detection of potential invaders, and public awareness are also recommended.

Author Contributions

The manuscript was written, reviewed/edited by Z.E.B. and H.R.E. All authors have read and agreed to the published version of the manuscript.

Funding

The project was supported/funded by Shiraz University (no. 2594473081).

Institutional Review Board Statement

Materials for this study resulted from (i) available published data (Freyhof et al. 2020; Esmaeili et al. 2022; Esmaeili and Hamidan 2023) and (ii) several extensive fieldworks that provided the geographic coordinate datasets for O. niloticus distribution during 2021–2022 (deposited in the Zoological Museum-Collection of Biology Department, Shiraz University, ZM-CBSU). Ethical approval is not applicable.

Informed Consent Statement

Not applicable.

Data Availability Statement

Data will be made available on request.

Acknowledgments

We would like to thank S. M. Al Jufaili (Sultan Qaboos University), A. H. Masoumi, and F. Pourhosseini (Shiraz University) for helping with fish collections, F. Zarei (Shiraz University) for helping with preparation of Figure 1. We offer our special thanks to respected reviewers for their constructive comments/suggestions that highly improved the quality of this manuscript.

Conflicts of Interest

The authors declare no conflict of interest.

References

  1. Saunders, D.L.; Meeuwig, J.J.; Vincent, A.C.J. Freshwater protected areas: Strategies for conservation. Conserv. Biol. 2002, 16, 30–41. [Google Scholar] [CrossRef] [PubMed]
  2. Dudgeon, D.; Arthington, A.H.; Gessner, M.O.; Kawabata, Z.; Knowler, D.J.; Leveque, C. Freshwater biodiversity: Importance, threats, status and conservation challenges. Biol. Rev. Camb. Philos. Soc. 2006, 81, 163–182. [Google Scholar] [CrossRef] [PubMed]
  3. Strayer, D.L.; Dudgeon, D. Freshwater biodiversity conservation: Recent progress and future challenges. J. N. Am. Benthol. Soc. 2010, 29, 344–358. [Google Scholar] [CrossRef]
  4. Reid, A.J.; Carlson, A.K.; Creed, I.F.; Eliason, E.J.; Gell, P.A.; Johnson, P.T.J. Emerging threats and persistent conservation challenges for freshwater biodiversity. Biol. Rev. 2019, 94, 849–873. [Google Scholar] [CrossRef] [PubMed]
  5. Stewart, B.A.; Ford, B.M.; Benson, J.A. Using species distribution modelling to identify ‘coldspots’ for conservation of freshwater fishes under a changing climate. Aquat. Conserv. Mar. Freshw. Ecosyst. 2022, 32, 576–590. [Google Scholar] [CrossRef]
  6. Davis, J.; O’Grady, A.P.; Dale, A.; Arthington, A.H.; Gell, P.A.; Driver, P.D.; Bond, N.; Casanova, M.; Finlayson, M.; Watts, R.J.; et al. When trends intersect: The challenge of protecting freshwater ecosystems under multiple land use and hydrological intensification scenarios. Sci. Total Environ. 2015, 534, 65–78. [Google Scholar] [CrossRef] [PubMed]
  7. Saemi-Komsari, M.; Esmaeili, H.R.; Keshavarzi, B.; Abbasi, K.; Birami, F.A.; Nematollahi, M.J.; Tayefeh, F.H.; Busquets, R. Characterization of ingested MPs and their relation with growth parameters of endemic and invasive fish from a coastal wetland. Sci. Total Environ. 2023, 860, 160495. [Google Scholar] [CrossRef]
  8. Elliott, M. Biological pollutants and biological pollution—An increasing cause for concern. Mar. Pollut. Bull. 2003, 46, 275–280. [Google Scholar] [CrossRef]
  9. Santamarina, S.; Alfaro-Saiz, E.; Llamas, F.; Acedo, C. Different approaches to assess the local invasion risk on a threatened species: Opportunities of using high-resolution species distribution models by selecting the optimal model complexity. Glob. Ecol. Conserv. 2019, 20, e00767. [Google Scholar] [CrossRef]
  10. Barbet-Massin, M.; Rome, Q.; Villemant, C.; Courchamp, F. Can species distribution models really predict the expansion of invasive species? PLoS ONE 2018, 13, e0193085. [Google Scholar] [CrossRef]
  11. Ricciardi, A.; Hoopes, M.F.; Marchetti, M.P.; Lockwood, J.L. Progress toward understanding the ecological impacts of nonnative species. Ecol. Monogr. 2013, 83, 263–282. [Google Scholar] [CrossRef]
  12. Renault, D.; Leclerc, C.; Colleu, M.A.; Boutet, A.; Hotte, H.; Colinet, H.; Chown, S.L.; Convey, P. The rising threat of climate change for arthropods from Earth’s cold regions: Taxonomic rather than native status drives species sensitivity. Glob. Chang. Biol. 2022, 28, 5914–5927. [Google Scholar] [CrossRef] [PubMed]
  13. Brooks, M.L.; D’antonio, C.M.; Richardson, D.M.; Grace, J.B.; Keeley, J.E.; DiTomaso, J.M.; Hobbs, R.J.; Pellant, M.; Pyke, D. Effects of invasive alien plants on fire regimes. BioScience 2004, 54, 677–688. [Google Scholar] [CrossRef]
  14. Ogden, N.H.; Wilson, J.R.; Richardson, D.M.; Hui, C.; Davies, S.J.; Kumschick, S.; Le Roux, J.J.; Measey, J.; Saul, W.C.; Pulliam, J.R. Emerging infectious diseases and biological invasions: A call for a One Health collaboration in science and management. R. Soc. Open Sci. 2019, 6, 181577. [Google Scholar] [CrossRef] [PubMed]
  15. Soto, I.; Cuthbert, R.N.; Kouba, A.; Capinha, C.; Turbelin, A.; Hudgins, E.J.; Diagne, C.; Courchamp, F.; Haubrock, P.J. Global economic costs of herpetofauna invasions. Sci. Rep. 2022, 12, 10829. [Google Scholar] [CrossRef]
  16. Grammer, G.L.; Slack, W.T.; Peterson, M.S.; Dugo, M.A. Nile tilapia Oreochromis niloticus (Linnaeus, 1758) establishment in temperate Mississippi, USA: Multi-year survival confirmed by otolith ages. Aquat. Invasions 2012, 7, 367–376. [Google Scholar] [CrossRef]
  17. Freyhof, J.Ö.R.G.; Yoğurtçuoğlu, B. A proposal for a new generic structure of the killifish family Aphaniidae, with the description of Aphaniops teimorii (Teleostei: Cyprinodontiformes). Zootaxa 2020, 4810, 421–451. [Google Scholar] [CrossRef]
  18. Shuai, F.; Li, J. Nile Tilapia (Oreochromis niloticus Linnaeus, 1758) Invasion Caused Trophic Structure Disruptions of Fish Communities in the South China River—Pearl River. Biology 2022, 11, 1665. [Google Scholar] [CrossRef]
  19. Zengeya, T.A.; Robertson, M.P.; Booth, A.J.; Chimimba, C.T. Ecological niche modeling of the invasive potential of Nile tilapia Oreochromis niloticus in African river systems: Concerns and implications for the conservation of indigenous congenerics. Biol. Invasions 2013, 15, 1507–1521. [Google Scholar] [CrossRef]
  20. Stauffer, J.R., Jr.; Chirwa, E.R.; Jere, W.; Konings, A.F.; Tweddle, D.; Weyl, O. Nile Tilapia, Oreochromis niloticus (Teleostei: Cichlidae): A threat to native fishes of Lake Malawi? Biol. Invasions 2022, 24, 1585–1597. [Google Scholar] [CrossRef]
  21. Lodge, D.M.; Williams, S.; MacIsaac, H.J.; Hayes, K.R.; Leung, B.; Reichard, S. Biological invasions: Recommendations for US policy and management. Ecol. Appl. 2006, 16, 2035–2054. [Google Scholar] [CrossRef] [PubMed]
  22. Hulme, P.E. Trade, transport and trouble: Managing invasive species pathways in an era of globalization. J. Appl. Ecol. 2009, 46, 10–18. [Google Scholar] [CrossRef]
  23. Hamza, W.; Munawar, M. Protecting and managing the Arabian Gulf: Past, present and future. Aquat. Ecosyst. Health Manag. 2009, 12, 429–439. [Google Scholar] [CrossRef]
  24. Esmaeili, H.R.; Al Jufaili, S.; Masoumi, A.H.; Zarei, F. Ichthyodiversity in southeastern Arabian Peninsula: Annotated checklist, taxonomy, short description and distribution of iInland fishes of Oman. Zootaxa 2022, 5134, 451–503. [Google Scholar] [CrossRef]
  25. Esmaeili, H.R.; Hamidan, N. Inland fishes of the Arabian Peninsula: Review and a revised checklist. Zootaxa 2023, 5330, 201–226. [Google Scholar] [CrossRef]
  26. De Oliveira da Conceição, E.; Mantovano, T.; de Campos, R.; Rangel, T.F.; Martens, K.; Bailly, D.; Higuti, J. Mapping the observed and modelled intracontinental distribution of non-marine ostracods from South America. Hydrobiologia 2020, 847, 1663–1687. [Google Scholar] [CrossRef]
  27. Franklin, J. Predictive vegetation mapping: Geographic modelling of biospatial patterns in relation to environmental gradients. Prog. Phys. Geogr. 1995, 19, 474–499. [Google Scholar] [CrossRef]
  28. Guisan, A.; Zimmermann, N.E. Predictive habitat distribution models in ecology. Ecol. Modell. 2020, 135, 147–186. [Google Scholar] [CrossRef]
  29. Guisan, A.; Graham, C.H.; Elith, J.; Huettmann, F. The NCEAS Species Distribution Modelling Group. Sensitivity of predictive species distribution models to change in grain size. Divers. Distrib. 2017, 13, 332–340. [Google Scholar] [CrossRef]
  30. Ruiz-Navarro, A.; Gillingham, P.K.; Britton, J.R. Predicting shifts in the climate space of freshwater fishes in Great Britain due to climate change. Biol. Conserv. 2016, 203, 33–42. [Google Scholar] [CrossRef]
  31. Rathore, P.; Roy, A.; Karnatak, H. Modelling the vulnerability of Taxus wallichiana to climate change scenarios in South East Asia. Ecol. Indic. 2019, 102, 199–207. [Google Scholar] [CrossRef]
  32. Zhang, C.; Chen, Y.; Xu, B.; Xue, Y.; Ren, Y. How to predict biodiversity in space? An evaluation of modeling approaches in marine ecosystems. Divers. Distrib. 2019, 25, 1697–1708. [Google Scholar] [CrossRef]
  33. Pearson, R.G.; Thuiller, W.; Araújo, M.B.; Martínez-Meyer, E.; Brotons, L.; McClean, C.; Miles, L.; Segurado, P.; Dawson, T.; Lees, D.C. Model-based uncertainty in species range prediction. J. Biogeogr. 2006, 33, 1704–1711. [Google Scholar] [CrossRef]
  34. Ardestani, E.G.; Rigi, H.; Honarbakhsh, A. Predicting optimal habitats of Haloxylon persicum for ecosystem restoration using ensemble ecological niche modeling under climate change in southeast Iran. Restor. Ecol. 2021, 29, e13492. [Google Scholar] [CrossRef]
  35. Thuiller, W. BIOMOD-Optimizing predictions of species distributions and projecting potential future shifts under global change. Glob. Chang. Biol. 2003, 9, 1353–1362. [Google Scholar] [CrossRef]
  36. Cheng, R.; Wang, X.; Zhang, J.; Zhao, J.; Ge, Z.; Zhang, Z. Predicting the Potential Suitable Distribution of Larix principis-rupprechtii Mayr under Climate Change Scenarios. Forests 2022, 13, 1428. [Google Scholar] [CrossRef]
  37. Lehner, B.; Grill, G. Global river hydrography and network routing: Baseline data and new approaches to study the world’s large river systems. Hydrol. Process. 2013, 27, 2171–2186. [Google Scholar] [CrossRef]
  38. Abell, R.; Thieme, M.L.; Revenga, C.; Bryer, M.; Kottelat, M.; Bogutskaya, N.; Coad, B.; Mandrak, N.; Balderas, S.C.; Bussing, W.; et al. Freshwater ecoregions of the world: A new map of biogeographic units for freshwater biodiversity conservation. BioScience 2008, 58, 403–414. [Google Scholar] [CrossRef]
  39. Petrie, R.; Denvil, S.; Ames, S.; Levavasseur, G.; Fiore, S.; Allen, C.; Antonio, F.; Berger, K.; Bretonnière, P.A.; Cinquini, L. Coordinating an operational data distribution network for CMIP6 data. Geosci. Model Dev. 2021, 14, 629–644. [Google Scholar] [CrossRef]
  40. Hamed, M.M.; Nashwan, M.S.; Shahid, S.; bin Ismail, T.; Wang, X.J.; Dewan, A.; Asaduzzaman, M. Inconsistency in historical simulations and future projections of temperature and rainfall: A comparison of CMIP5 and CMIP6 models over Southeast Asia. Atmos. Res. 2022, 265, 105927. [Google Scholar] [CrossRef]
  41. Wu, T.; Yu, R.; Lu, Y.; Jie, W.; Fang, Y.; Zhang, J.; Zhang, L.; Xin, X.; Li, L.; Wang, Z. BCC-CSM2-HR: A high-resolution version of the Beijing Climate Center Climate System Model. Geosci. Model Dev. 2021, 14, 2977–3006. [Google Scholar] [CrossRef]
  42. Thuiller, W.; Georges, D.; Engler, R.; Breiner, F.; Georges, M.D.; Thuiller, C.W. Package ‘biomod2’. Species Distribution Modeling within an Ensemble Forecasting Framework. Ecography 2016, 32, 369–373. [Google Scholar] [CrossRef]
  43. Chen, J.; Wang, X.; Xu, X. GC-LSTM: Graph convolution embedded LSTM for dynamic network link prediction. Appl. Intell. 2022, 52, 7513–7528. [Google Scholar] [CrossRef]
  44. Sayyadzadeh, G.; Al Jufaili, S.M.; Esmaeili, H.R. Species diversity deflation: Insight into taxonomic validity of Garra species (Teleostei: Cyprinidae) from Dhofar Region in the Arabian Peninsula using an integrated morpho-molecular approach. Zootaxa 2023, 5230, 333–350. [Google Scholar] [CrossRef] [PubMed]
  45. Zarei, F.; Jufaili, S.M.A.; Esmaeili, H.R. Oxyurichthys omanensis sp. nov., a new Eyebrow Goby (Teleostei: Gobiidae) from Oman. Zootaxa 2022, 5182, 361–376. [Google Scholar] [CrossRef]
  46. Froese, R.; Pauly, D. FishBase. World Wide Web Electronic Publication. 2023. Available online: www.fishbase.org (accessed on 21 August 2023).
  47. Fricke, R.; Eschmeyer, W.N.; Van der Laan, R. Eschmeyer’s Catalog of Fishes: Genera, Species, References. 2023. Available online: http://researcharchive.calacademy.org/research/ichthyology/catalog/fishcatmain.asp (accessed on 20 March 2023).
  48. Shuai, F.; Li, J.; Lek, S. Nile tilapia (Oreochromis niloticus) invasion impacts trophic position and resource use of commercially harvested piscivorous fishes in a large subtropical river. Ecol. Process. 2023, 12, 22. [Google Scholar] [CrossRef]
  49. Trewevas, E. Tilapiine Fishes of the Genera Sarotherodon, Oreochromis and Danakilia; British Museum Natural History: London, UK, 1983; p. 583. [Google Scholar]
  50. Lind, C.E.; Agyakwah, S.K.; Attipoe, F.Y.; Nugent, C.; Crooijmans, R.P.; Toguyeni, A. Genetic diversity of Nile tilapia (Oreochromis niloticus) throughout West Africa. Sci. Rep. 2019, 9, 16767. [Google Scholar] [CrossRef]
  51. Lake, T.A.; Briscoe Runquist, R.D.; Moeller, D.A. Predicting range expansion of invasive species: Pitfalls and best practices for obtaining biologically realistic projections. Divers. Distrib. 2020, 26, 1767–1779. [Google Scholar] [CrossRef]
  52. Zhao, Z.; Guo, Y.; Wei, H.; Ran, Q.; Liu, J.; Zhang, Q.; Gu, W. Potential distribution of Notopterygium incisum Ting ex H.T. Chang and its predicted responses to climate change based on a comprehensive habitat suitability model. Ecol. Evol. 2020, 10, 3004–3016. [Google Scholar] [CrossRef]
  53. Chege, S.; Walingo, T. Multiplexing capacity of hybrid PD-SCMA heterogeneous networks. IEEE Trans. Veh. Technol. 2022, 71, 6424–6438. [Google Scholar] [CrossRef]
  54. Singh, A.K.; Srivastava, S.C.; Verma, P. MaxEnt distribution modeling for predicting Oreochromis niloticus invasion into the Ganga river system, India and conservation concern of native fish biodiversity. Aquat. Ecosyst. Health Manag. 2021, 24, 43–51. [Google Scholar] [CrossRef]
  55. Li, K.; Wang, J.; Wang, X.; Wang, M.; He, R.; Wang, M. Distribution Pattern of Fish Richness in the Yarlung Zangbo River Basin. Diversity 2022, 14, 1142. [Google Scholar] [CrossRef]
  56. Kolar, C.S.; Lodge, D.M. Progress in invasion biology: Predicting invaders. Trends Ecol. Evol. 2001, 16, 199–204. [Google Scholar] [CrossRef] [PubMed]
  57. Lymbery, A.J.; Morine, M.; Kanani, H.G.; Beatty, S.J.; Morgan, D.L. Co-invaders: The effects of alien parasites on native hosts. Int. J. Parasitol. Parasites Wildl. 2014, 3, 171–177. [Google Scholar] [CrossRef] [PubMed]
  58. Gozlan, R.E.; Andreou, D.; Asaeda, T.; Beyer, K.; Bouhadad, R.; Burnard, D.; Caiola, N.; Cakic, P.; Djikanovic, V.; Esmaeili, H.R.; et al. Pan-continental invasion of Pseudorasbora parva: Towards a better understanding of freshwater fish invasions. Fish Fish. 2010, 11, 315–340. [Google Scholar] [CrossRef]
  59. Esmaeili, H.R.; Teimori, A.; Owfi, F.; Abbasi, K.; Brian, W.C. Alien and invasive freshwater fish species in Iran: Diversity, environmental impacts and management. Iran. J. Ichthyol. 2014, 1, 61–72. [Google Scholar]
  60. Esmaeili, H.R. Exotic, and Invasive Freshwater Fishes in the Tigris-Euphrates River System. In Tigris and Euphrates Rivers: Their Environment from Headwaters to Mouth; Springer: Cham, Switzerland, 2021; pp. 1103–1140. [Google Scholar]
  61. Boudouresque, C.F.; Verlaque, M. Biological pollution in the Mediterranean Sea: Invasive versus introduced macrophytes. Mar. Pollut. Bull. 2016, 44, 32–38. [Google Scholar] [CrossRef]
  62. Canonico, G.C.; Arthington, A.; McCrary, J.K.; Thieme, M. The effects of introduced tilapias on native biodiversity. Aquat. Conserv. Mar. Freshwat. Ecosyst. 2005, 15, 463–483. [Google Scholar] [CrossRef]
  63. El-Sayed, A.F.M. Tilapia Culture; CABI Publishing: Wallingford, UK, 2006. [Google Scholar]
  64. Suresh, V.; Bhujel, C. Tilapias. Aquaculture: Farming Aquatic Animals and Plants, 2nd ed.; Wiley-Blackwell Publishing: Chichester, UK, 2012; pp. 338–364. [Google Scholar]
  65. Rairat, T.; Liu, Y.K.; Hsu, J.C.N.; Hsieh, C.Y.; Chuchird, N.; Chou, C.C. Combined effects of temperature and salinity on the pharmacokinetics of florfenicol in Nile tilapia (Oreochromis niloticus) reared in brackish water. Front. Vet. Sci. 2022, 9, 826586. [Google Scholar] [CrossRef]
  66. Vitousek, P.M.; D’Antonio, C.M.; Loope, L.L.; Rejmanek, M.; Westbrooks, R. Introduced species: A significant component of human-caused global change. N. Z. J. Ecol. 1997, 21, 1–16. [Google Scholar]
  67. Mollot, G.; Pantel, J.H.; Romanuk, T.N. The effects of invasive species on the decline in species richness: A global meta-analysis. In Advances in Ecological Research; Academic Press: Cambridge, MA, USA, 2017; Volume 56, pp. 61–83. [Google Scholar]
  68. Mooney, H.A.; Hobbs, R.J. Invasive Species in a Changing World; Island Press: Washington, DC, USA, 2000; 384p. [Google Scholar]
  69. Catford, J.A.; Bode, M.; Tilman, D. Introduced species that overcome life history tradeoffs can cause native extinctions. Nat. Commun. 2018, 9, 2131. [Google Scholar] [CrossRef] [PubMed]
  70. Castro, J.; Zamora, R.; Hódar, J.A.; Gómez, J.M. Seedling establishment of a boreal tree species (Pinus sylvestris) at its southernmost distribution limit: Consequences of being in a marginal Mediterranean habitat. J. Ecol. 2004, 92, 266–277. [Google Scholar] [CrossRef]
  71. Gu, D.E.; Ma, G.M.; Zhu, Y.J.; Xu, M.; Luo, D.; Li, Y.Y.; Wei, H.; Mu, X.D.; Luo, J.R.; Hu, Y.C. The impacts of invasive Nile tilapia (Oreochromis niloticus) on the fisheries in the main rivers of Guangdong Province, China. Biochem. Syst. Ecol. 2015, 59, 1–7. [Google Scholar] [CrossRef]
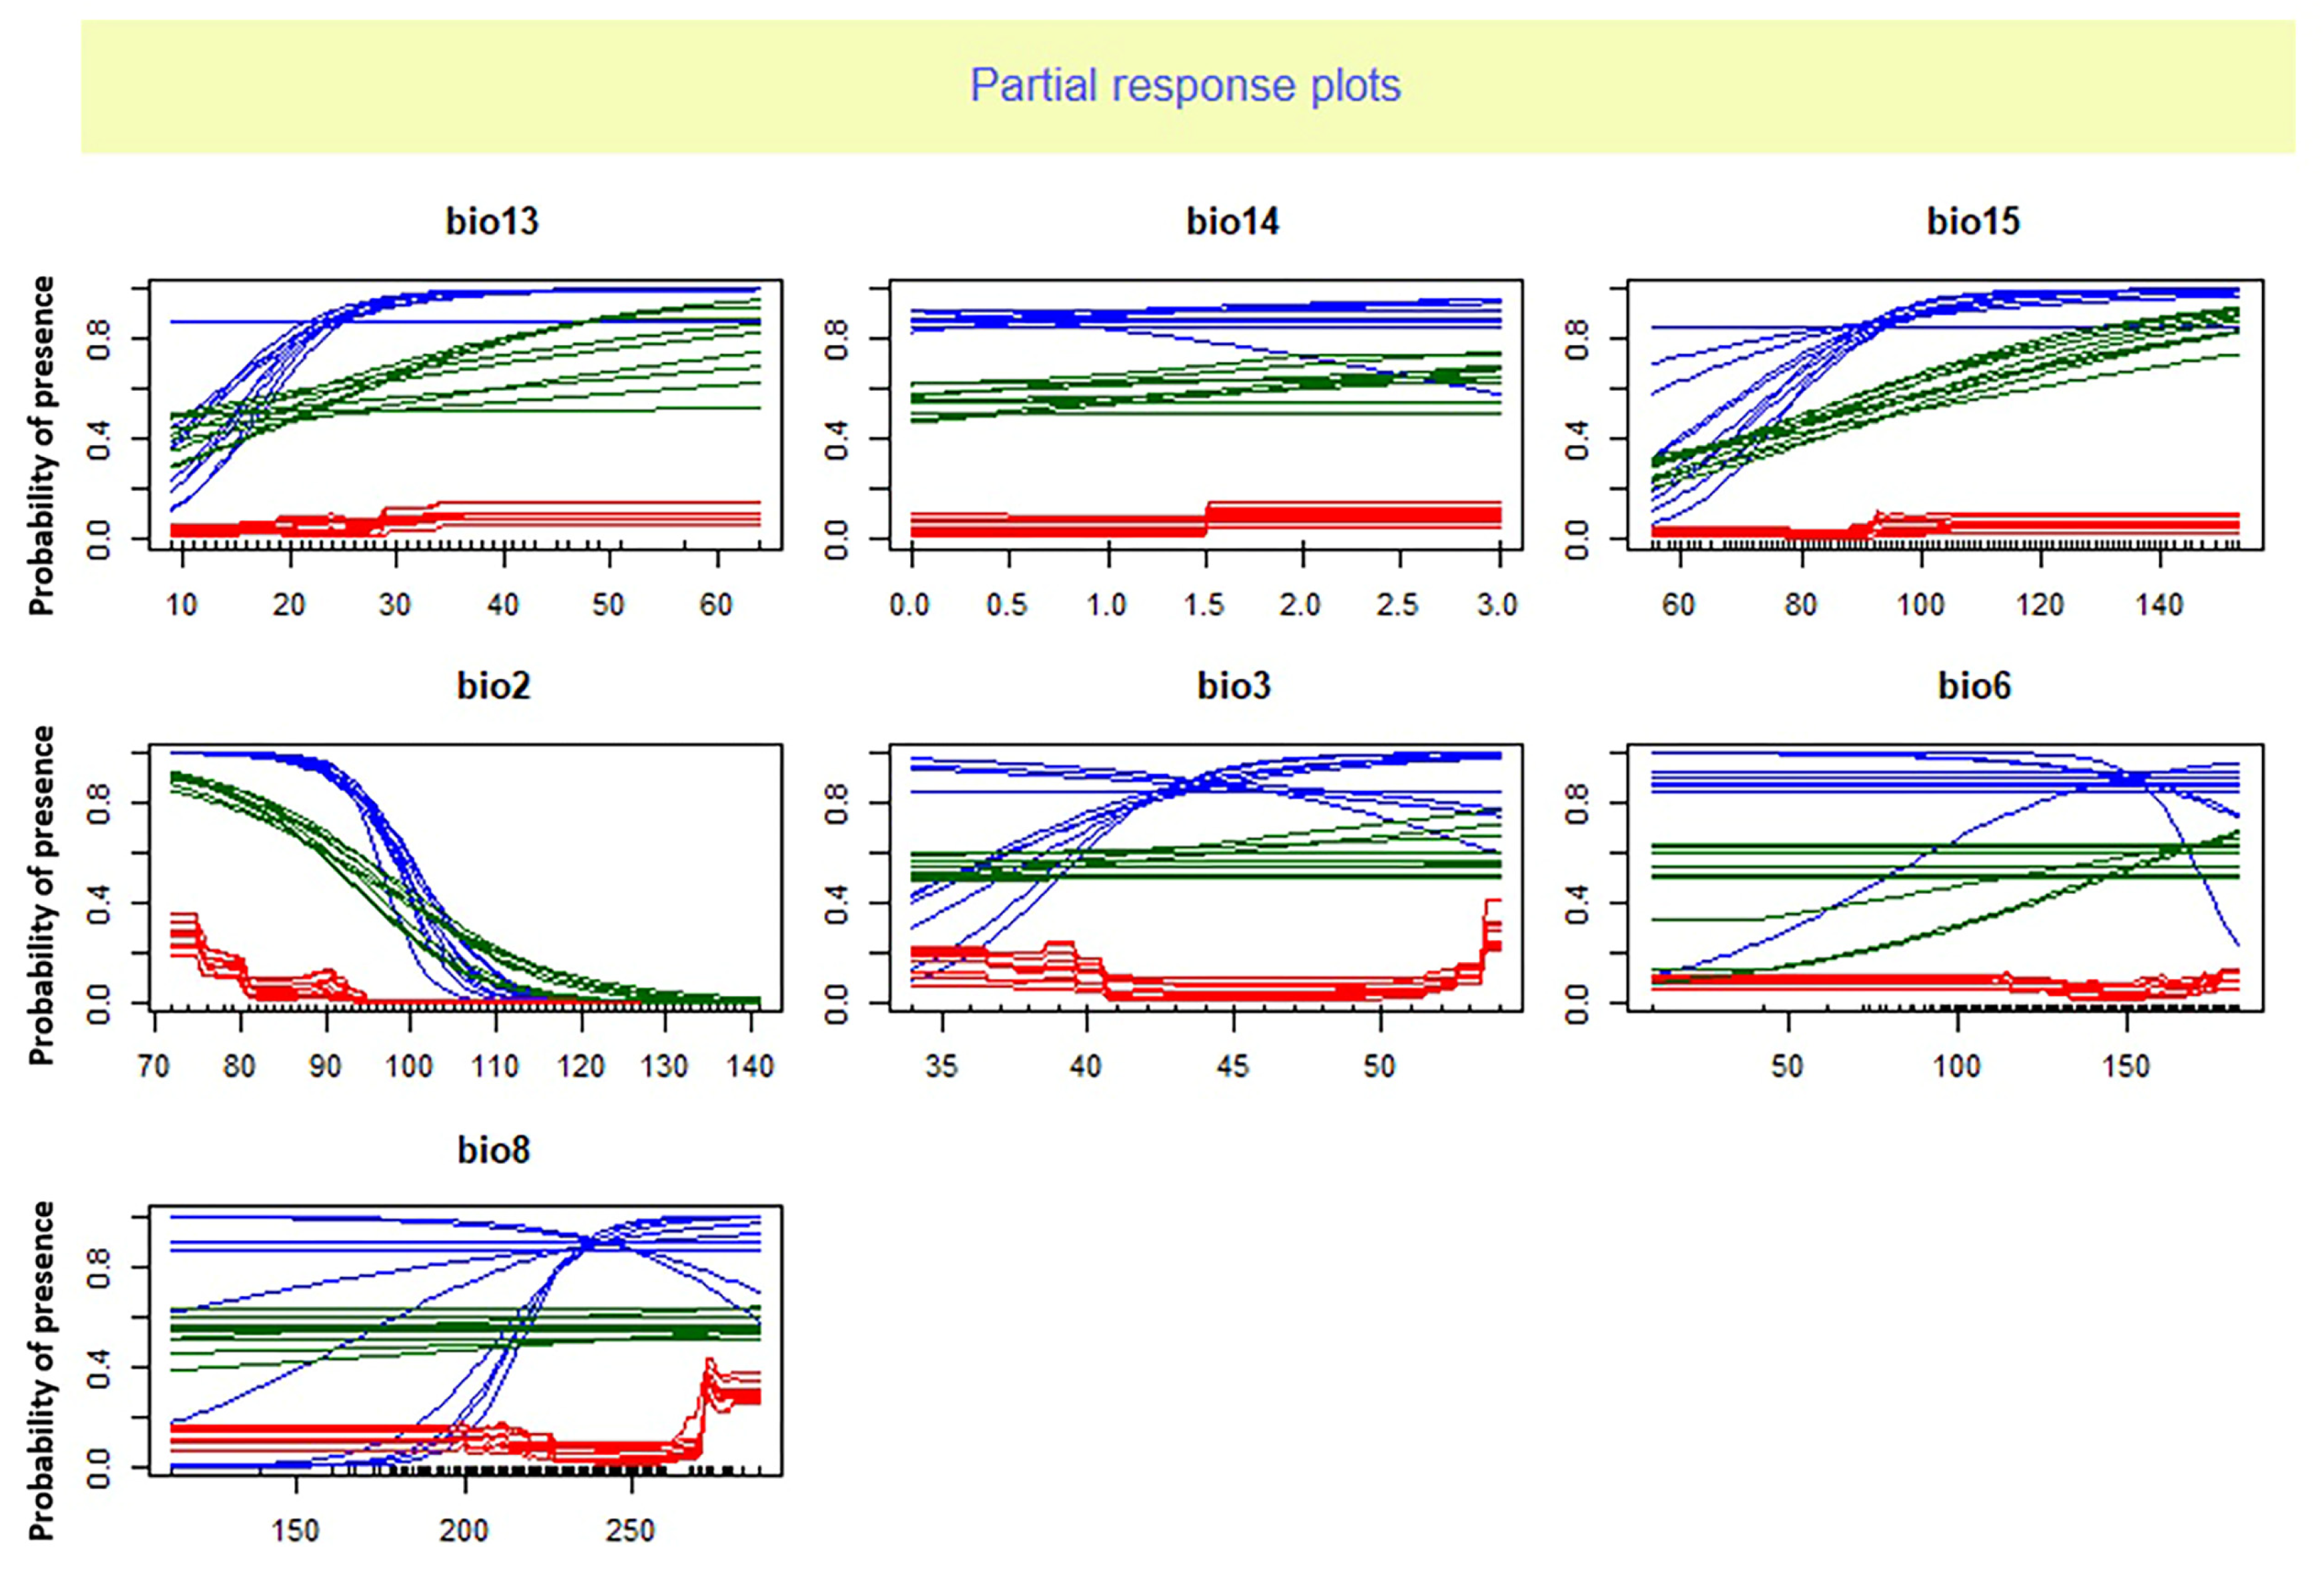
Figure 2. Response curve analysis on selected environmental variables for Oreochromis niloticus based on three models and 10 runs. GLM: blue, RF: red, Maxent: green. Bio13: Precipitation of wettest month; Bio14: Precipitation of driest month; Bio15: Precipitation seasonality (coefficient of variation); Bio2: Mean diurnal range (mean of monthly (max temp—min temp)); Bio3: Isothermality; Bio6: Min temperature of coldest month; Bio8: Mean temperature of wettest quarter.
Fishes 08 00481 g002
Figure 3. Response curve analysis on selected environmental variables for Oreochromis niloticus obtained from the ensemble model. Each curve illustrates how suitability for the species changes across each environmental variable gradient. Bio13: Precipitation of wettest month; Bio14: Precipitation of driest month; Bio15: Precipitation seasonality (coefficient of variation); Bio2: Mean diurnal range (mean of monthly (max temp—min temp)); Bio3: Isothermality; Bio6: Min temperature of coldest month; Bio8: Mean temperature of wettest quarter.
Fishes 08 00481 g003
Figure 4. (ac): Habitat suitability map of Oreochromis niloticus across the southeastern Arabian Peninsula, based on ensemble model; (a) Under current climate conditions; (b) Under future climate conditions considering low radiation intensity (SSP126); (c) under future climate conditions considering high radiation intensity (SSP 585). Dark green: most suitable area. (d): Analysis of Oreochromis niloticus range size changes across the southeastern Arabian Peninsula under future climate conditions (considering low radiation intensity (SSP126) based on Ensemble Model. Red: lost, blue: stable. Note that predicted suitability in the biomod2 package is given on a scale of 0–1000; if you want to have a 0 to 1 probability scale, divide the numbers by 1000.
Fishes 08 00481 g004
Table 1. Variable contributions in different models in distribution modeling of Oreochromis niloticus. Bio13: Precipitation of wettest month; Bio14: Precipitation of driest month; Bio15: Precipitation seasonality (coefficient of variation); Bio2: Mean diurnal range (mean of monthly (max temp—min temp)); Bio3: Isothermality; Bio6: Min temperature of coldest month; Bio8: Mean temperature of wettest quarter.
 GLMMAXENTRFSRERelative Importance
Bio130.17660.01820.04350.36930.6076
Bio140.383300.00870.21470.151675
Bio150.42430.01980.05030.37260.21675
Bio20.8920.99650.23340.78140.725825
Bio30.09540.00140.12530.02150.0609
Bio60.02950.00030.0880.20220.08
Bio80.004100.05940.13470.04955
Table 2. Native/endemic and exotic inland fishes of the southeastern Arabian Peninsula.
 OrderFamilySpeciesAuthorship/sStatus
1CypriniformesCyprinidaeCyprinion muscatense *(Boulenger, 1888)Native
2CyprinidaeGarra barreimiae(Fowler & Steinitz, 1956)Native
3CyprinidaeGarra dunsirei *(Banister, 1987)Endemic
4CyprinidaeGarra gallagheri *(Krupp, 1988)Endemic
5CyprinidaeGarra longipinnis *(Banister & Clarke, 1977)Endemic
6CyprinidaeGarra shamal *(Kirchner, Kruckenhauser, Pichler, Borkenhagen & Freyhof 2020)Endemic
7CyprinidaeGarra sharq *(Kirchner, Kruckenhauser, Pichler, Borkenhagen & Freyhof 2020)Endemic
8CyprinodontiformesAphaniidaeAphaniops kruppi *(Freyhof, Weissenbacher & Geiger, 2017)Endemic
9AphaniidaeAphaniops stoliczkanus *(Day, 1872)Native
10PoeciliidaePoecilia latipinna *(Lesueur, 1821)Exotic/Invasive
11GobiiformesGobiidaeAwaous jayakari *(Boulenger 1888)Native
12GobiidaeCryptocentroides arabicus *(Gmelin, 1789)Native
13GobiidaeFavonigobius melanobranchus(Fowler, 1934)Native
14GobiidaeGlossogobius tenuiformis *(Fowler, 1934)Native
15GobiidaeOxyurichthys omanensis(Zarei, Al Jufaili & Esmaeili, 2022) 
16EleotridaeOphiocara porocephala(Valenciennes, 1837)Native
17EleotridaeEleotris acanthompus(Bleeker, 1853)Native
18CentrarchiformesTerapontidaeTerapon jarbua *(Forsskål, 1775)Native
19CichliformesAmbassidaeAmbassis gymnocephalus *(Lacepède, 1802)Native
20CichlidaeOreochromis niloticus(Linnaeus, 1758)Exotic/Invasive
21GonorynchiformesChanidaeChanos chanos(Forsskål, 1775)Native
22MugiliformesMugilidaePlaniliza macrolepis(Smith, 1846)Native
* Co-occurrence of species with Oreochromis niloticus. Based on Sayyadzadeh et al. [44], two species, Garra sindhae and G. smartae, are now considered as synonyms of Garra dunsirei. Based on Zarei et al. [45], Oxyurichthys omanensis (Gobiidae) is a new endemic species in the southeastern Arabian Peninsula.
Disclaimer/Publisher’s Note: The statements, opinions and data contained in all publications are solely those of the individual author(s) and contributor(s) and not of MDPI and/or the editor(s). MDPI and/or the editor(s) disclaim responsibility for any injury to people or property resulting from any ideas, methods, instructions or products referred to in the content.