Next Article in Journal
A Common Anaesthetic, MS-222, Alters Measurements Made Using High-Resolution Respirometry in the Three-Spined Stickleback (Gasterosteus aculeatus)
Previous Article in Journal
Sharing Scientific Evidence of the Response of Aquatic Animals to Environmental Change
Previous Article in Special Issue
Validation of a Portable eDNA Detection Kit for Invasive Carps
 
 
Correction published on 12 May 2023, see Fishes 2023, 8(5), 258.
Article

Round Goby Detection in Lakes Huron and Michigan—An Evaluation of eDNA and Fish Catches

by
Kasia J. Przybyla-Kelly
1,*,
Ashley M. Spoljaric
2 and
Meredith B. Nevers
1,†
1
Great Lakes Science Center, U.S. Geological Survey, 1574 N 300 E, Chesterton, IN 46304, USA
2
Department of Civil and Environmental Engineering, Michigan State University, East Lansing, MI 48824, USA
*
Author to whom correspondence should be addressed.
Current address: Office of Science Quality & Integrity, U.S. Geological Survey, Chesterton, IN 46304, USA.
Fishes 2023, 8(1), 41; https://doi.org/10.3390/fishes8010041
Submission received: 15 November 2022 / Revised: 20 December 2022 / Accepted: 22 December 2022 / Published: 6 January 2023 / Corrected: 12 May 2023
(This article belongs to the Special Issue Application of Environmental DNA Technology in Fishery Resources)

Abstract

:
Aquatic surveys for fish in large water bodies (e.g., Laurentian Great Lakes of North America) often require a flexible approach using multiple methods, surveying different depths, and sampling across seasons, especially when the target species is elusive in its natural habitat. The round goby (Neogobius melanostomus) is an invasive, bottom-dwelling fish inhabiting rocky areas of all five Great Lakes. While trawl surveys are typically used for abundance assessments, angling has been demonstrated as a means of supplementing surveys with additional data. Yet, round goby abundance and distribution is still not well described. Recently, with considerable success, scientists have explored sampling environmental DNA (eDNA) to complement traditional monitoring techniques for population abundance estimates, early detection of invasive species, and spawning or migration events. Therefore, we collected eDNA from water samples alongside bottom trawls and hook and line angling in Lakes Huron and Michigan to detect round goby. eDNA samples were analyzed by both droplet digital PCR (ddPCR) and quantitative PCR (qPCR) to maximize the likelihood of detection. Overall, round goby was captured in 23% of the trawls, but the eDNA based methods detected round goby in 74% and 66% of samples by ddPCR and qPCR, respectively, mostly in samples collected at <30 m depths, and mostly in the fall. More studies comparing eDNA based methods to traditional monitoring, especially trawls in large open waters, may contribute to a better understanding of using eDNA in population assessments.

Graphical Abstract

1. Introduction

Aquatic surveys are at the core of assessing fish abundance for management or conservation purposes in the Laurentian Great Lakes of North America and aquatic ecosystems worldwide. Round goby (Neogobius melanostomus), first detected in the St. Clair River which flows from Lake Huron into Lake St. Clair over three decades ago [1], and now present in all five Great Lakes, is commonly assessed by bottom trawls [2]. While trawl surveys provide broader scale data, they are subject to numerous biases; specifically, for round goby, trawling neglects nest-guarding males in rocky habitats, favors smaller fish, and is not sensitive to seasonal migrations. Studies focusing on round goby population assessments in the Great Lakes [3,4,5] have suggested that additional methods are needed for more adequate assessments; for example, adding angling to traditional trawls improves catchability of larger individuals and accessibility of nearshore areas [3] and underwater video taken by scuba divers provides details on round goby size and distribution across a variety of substrates [4]. Multiple sampling methods for round goby, depending on depth, substrate, habitat, and gear available, may be appropriate to address research goals [6].
In recent years, multiple studies successfully applied environmental DNA (eDNA) based methodology in species assessments in aquatic environments worldwide (see review [7]). In the Great Lakes in particular, a recent study focusing on early detection of two fish species (white bass (Morone chrysops) and gizzard shad (Dorosoma cepedianum)) concluded that using complementary sampling for eDNA significantly improved results [8]. There have been earlier studies focused on round goby DNA detection in laboratory mesocosms [9,10], retail bait shops [11], mesocosm field studies [12], and forecasting the arrival of round goby in a sampling framework [13]. While the use of eDNA based methods targeting round goby led to successful outcomes in studies mentioned above, the application of eDNA has not been attempted in open waters of the Great Lakes, which are frequently referred to as vast freshwater inland seas [14]. Thus far, there have been few studies directly comparing eDNA based methods to traditional surveys by trawling in large water bodies, most of them conducted in marine environments [15,16,17,18]. Because these studies generally report success in using eDNA based methods in comparison to trawls for fish assessments, we decided to pursue a similar evaluation in the Great Lakes.
Recent developments in species-specific studies place an emphasis on choosing a molecular technique that would maximize the detection outcome: some have demonstrated that droplet digital polymerase chain reaction (ddPCR) is more sensitive in detecting eDNA from cryptic or hard to detect species [19,20] or when working with samples prone to inhibition [19]. Few studies have compared species-specific detection results using both ddPCR and quantitative PCR (qPCR) [9,21,22].
This study aimed to evaluate the use of eDNA based methods along with traditional surveys by means of bottom trawling and hook and line angling to examine round goby detection in open waters of Lakes Huron and Michigan.

2. Materials and Methods

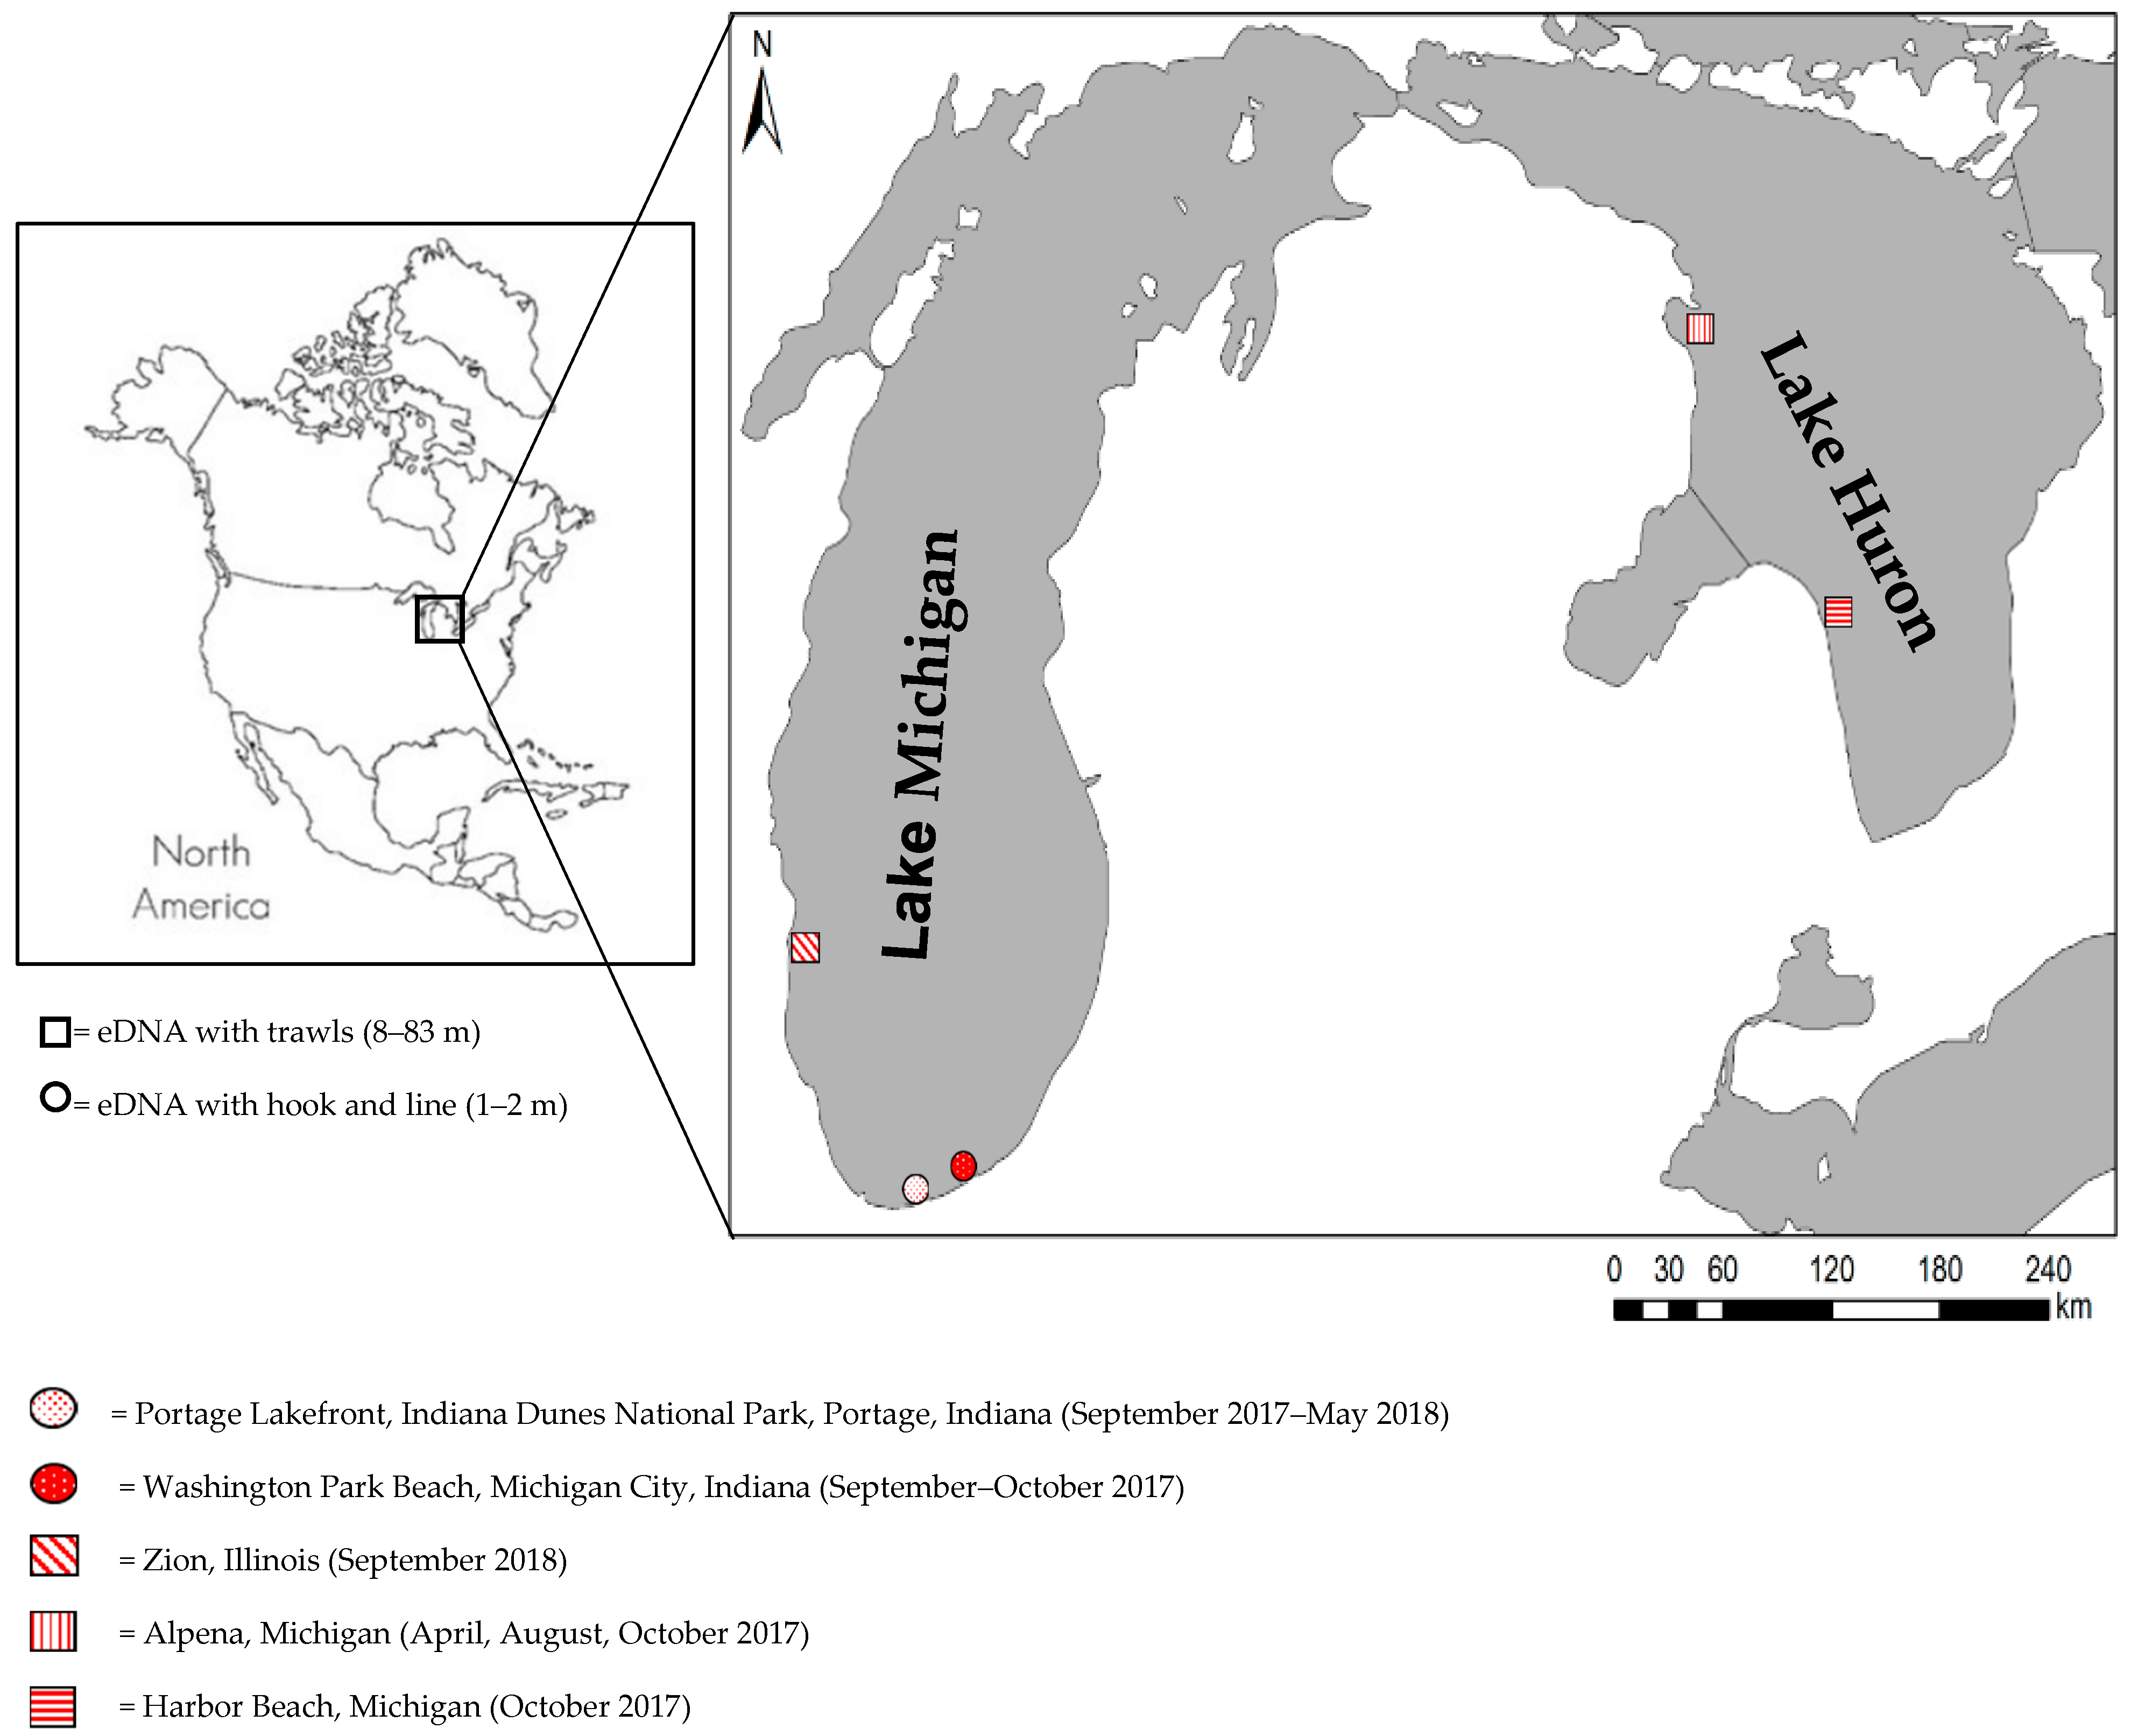
2.1. Sampling Activities

Hook and line angling surveys and sampling for eDNA were undertaken at the breakwalls in southern Lake Michigan at Portage Lakefront, Indiana Dunes National Park, Portage, IN (41.633558, −87.177771) and Washington Park Beach, Michigan City, IN (41.728425, −86.910205) between September 2017 and May 2018 (Figure 1). Prior to initiating angling activity, triplicate bottom lake water samples were collected for eDNA using a peristaltic pump (Geotech Environmental Equipment, Inc., Lansing, MI, USA) with silicone tubing fastened along a telescopic 3 meters (m) long sampling pole with a disposable filtration cup affixed to the end [10]; the pole was lowered to near the lake bottom (1–2 m depth), avoiding resuspending bottom sediment and targeting round goby habitat, and water was directly filtered onto a 1.5 micrometer (μm) glass-fiber filter (GE Healthcare Life Sciences, Pittsburgh, PA, USA); volume varied depending on water turbidity (650 to 2250 milliliters (mL)). Filters were folded twice and placed in sterile 7 mL conical tubes, kept in a cooler on ice, transported to the U.S. Geological Survey (USGS) laboratory in Chesterton, IN, and stored at −80 °C until DNA extraction. Following water sample collection, round goby were caught by one angler using a size 14 egg hook and 2.61 kilogram (kg) monofilament line for a total of 93–119 minutes (min). Captured round goby were weighed, measured, and sexed; fish were held in buckets filled with lake water to minimize mortality until fishing was complete.
Bottom trawl samples in Lake Huron were collected at ten sites (8–83 m depths) in the vicinity of Thunder Bay, MI from the USGS R/V Arcticus in April, August, and October 2017 (Table 1). A 21.3 m wing was used to collect the April and October samples, whereas a 11.9 m Yankee rock hopper was used to collect the August samples. Additional trawl samples were collected near Harbor Beach, MI, Lake Huron in October 2017 at seven sites (18–73 m depths) and near Zion, IL, Lake Michigan in September 2018 at three sites (9–27 m depths). Trawl catches were normalized as number of fish per hectare and biomass of fish per hectare. Prior to trawling activities, a Niskin bottle (4 liters (L)) was lowered to 1 m above the benthic surface to avoid disturbing the sediment. The Niskin bottle was triggered to close for water sample collection and carefully raised to the surface. Water samples were poured into sterile, 1 L size polypropylene bottles. Samples collected in Lake Huron in April were immediately filtered onto 1.5 μm glass fiber filters (2 L per filter) using a peristaltic pump; filters were folded twice, sample facing inward, and placed inside of polyethylene zip-top bags filled with silica beads [23]. Bags were kept in dry containers in the dark. Water samples collected in August and October in Lake Huron were frozen in 1 L polypropylene bottles, shipped to the USGS laboratory in Chesterton, IN, thawed, and filtered within 24 h; water samples collected in September from Lake Michigan were kept on ice and filtered the next day. Filters were stored at −80 °C until DNA extraction.
Additional water samples were collected from a small research vessel in shallower depths (2 to 7 m within Thunder Bay, Lake Huron) that were inaccessible to bottom trawls in April and August 2017; these samples were collected by lowering weighted peristaltic tubing to the lake bottom and directly filtering 2200–2250 mL of water onto 1.5 μm glass fiber filters. Filters were folded and stored in silica beads using the method employed for other Lake Huron samples.

2.2. Sample Processing and DNA Extraction

eDNA from water samples from Lake Huron and nearshore Lake Michigan were extracted with the DNeasy PowerWater kit (Qiagen, Carlsbad, CA, USA). Dried filters from silica bead bags or frozen filters were first transferred into PowerWater DNA bead tubes (Qiagen, Carlsbad, CA, USA). Manufacturer’s instructions were followed with one exception: the final DNA elution step included two sequential rinses of the column with 50 microliter (μL) each of Elution Buffer for a final volume of 100 μL. Samples collected from Zion, IL, Lake Michigan were extracted using DNeasy Blood and Tissue kit (Qiagen, Carlsbad, CA, USA) according to the manufacturer’s protocol with the following modifications: triple amount of Buffer ATL, Proteinase K, and Buffer AL with 10 min of vortexing were used to improve the lysis process, and the final DNA elution step included two sequential rinses of the spin column with 100 μL each of Buffer AE, for a final volume of 200 μL. DNA concentration for all samples was measured by fluorometric quantification (Qubit High Sensitivity dsDNA HS Assay, Thermo Fisher Scientific, Waltham, MA, USA), and DNA quality was measured using a Nanophotometer 260/280 ratio (Nanophotometer Pearl, Implen Inc, Westlake Village, CA, USA).

2.3. qPCR

Samples were analyzed in triplicate (technical replicates) for round goby using the following primer and probe set: GobyCOI-F2d: 5′-CTTCTGGCCTCCTCTGGTGTTG-3′, GobyCOI-R2d: 5′-CCCTAGAATTGAGGAAATGCCGG-3′, and GobyCOI-Pr: 5′-6-FAM-CAGGCAACTTGGCACATGCAG-BHQ-3′ as described in Nevers et al. [10]. For each qPCR assay, amplification efficiency and R2 was determined; standard curves for all runs had an R2 ≥ 0.99, and amplification efficiency ranged between 90 and 98%. Quantification of samples was determined from standard curves using six, ten-fold serial dilutions (105 to 100 DNA copy numbers (CN)) of a gBlock Gene Fragment (Integrated DNA Technologies, Coralville, IA, USA). The 149 bp gBlock Gene Fragment concentration was determined using a Nanophotometer Pearl. Other protocols including thermal conditions, reaction setup, and controls are described elsewhere [10].
Definitions and calculations for the limit of quantification (LOQ) and the limit of detection (LOD) were determined using the discrete threshold approach described elsewhere [12,25]. Eight standard curves (totaling 24 replicates per concentration) were selected from all qPCR runs, which resulted in LOD and LOQ values of 7.46 CN/reaction. Consequently, all starting quantity (SQ) values > 7.46 were considered within the range of quantification (ROQ); all SQ values < 7.46 were considered as positive, but not quantifiable (DNQ) and were replaced with ½ value of LOQ for statistical purpose (i.e., 3.73); and all SQ with no exponential curve crossing the threshold value before cycle 40 were considered non-detects (ND) and were replaced with ¼ value of LOQ for statistical purpose (i.e., 1.865) [12,26].
If the triplicate reactions resulted in an incomplete outcome (ROQ value for 1 or 2 replicates and non-detect for 1 or 2 replicates), the original samples were reanalyzed in triplicate per Goldberg et al. [27] and the average quantities of the second round of amplification were used. Quantification of SQ values obtained from Bio-Rad’s CFX Manager Version 3.1 software were per 2 µL and subsequently divided in half, in order to accurately compare CN/µL between both molecular platforms.

2.4. ddPCR

ddPCR assays were completed using the QX200 AutoDG Droplet Digital PCR System (Bio-Rad, Hercules, CA, USA). DNA extracts were analyzed in single or double well reactions for round goby using the same primers used in the qPCR assay. As part of successfully optimizing the Taqman qPCR assay to the ddPCR platform, a 21-bp Affinity Plus Probe (Integrated DNA Technologies, Coralville, IA, USA) was used: 5′-6-FAM-CAGG+CAACTT+GGC+ACAT+GCAG-3’ BHQ-1. Each 25 μL reaction contained: 12.5 μL of ddPCR Supermix for Probes (no dUTP), 4–7.9 μL template DNA, PCR-grade water, and a final concentration of 900 nanomolar (nM) of each primer and 250 nM of probe. Next, 22 μL of each reaction was pipetted into DG32 cartridges, which were inserted into the Automated Droplet Generator (AutoDG). The instrument mixes the DNA with oil and partitions each sample into ~20,000, one nanoliter-sized droplets. Every plate was sealed by heat bonding for 5 seconds (s) at 180 °C (PX1 PCR Plate Sealer, Bio-Rad, Hercules, CA, USA) and contained one well each of no template control (NTC; PCR-grade water) and a positive control, diluted synthesized gBlock Gene Fragment (Integrated DNA Technologies, Coralville, IA, USA), to assess for contamination during reaction set up and successful target amplification, respectively. Droplets were cycled in a Bio-Rad C1000 Connect thermal cycler with a 96-deep well reaction module (Bio-Rad, Hercules, CA, USA). Thermal conditions for cycling droplets were as follows: 95 °C for 10 min, 45 cycles of 95 °C for 30 s and 60 °C for 1 min, and 1 cycle of 98 °C for 10 min with a final 30 min hold at 12 °C. After cycling, droplets were streamed on the QX200 Droplet Reader (Bio-Rad, Hercules, CA, USA) in which the number of fluorescent droplets determine round goby concentration after manually setting the threshold in Bio-Rad’s QX Manager 1.2 Standard Edition software. The software provided the copies/µL (CN/µL) for each reaction, but in order to compare CN/µL between both qPCR and ddPCR accurately, final concentrations were determined using the amount of DNA template and PCR reaction.
To assess the detection limits of the assay, similarly to qPCR, a standard curve of five dilutions (321 to 0.5 CN/µL; 12 replicates each) of a 406 bp gBlock Gene Fragment were tested using reaction conditions detailed above. With the direct quantification of ddPCR, determining an LOQ may not be considered necessary, but due to our direct comparison of qPCR and ddPCR results, we chose to keep a similar approach to positive scoring and detection designations. Following Hunter et al. [28], our LOQ would be based on any positive, non-zero values obtained from method blanks, field blanks, extraction blanks, and NTC wells. None of the controls (n = 18) produced a positive concentration of round goby DNA, and thus we chose to use a conservative approach and elected to use the machine detection limit of 0.25 copies/µL (ddPCR Applications Guide, Bulletin 6407 Ver B, Bio-Rad, p. 51), which produces a calculated value of LOQ = 0.8 CN/µL. Consequently, all CN values > 0.8 were considered within the range of quantification (ROQ); all non-zero CN values < 0.8 were considered as positive, detected but not quantifiable (DNQ) and were replaced with ½ value of LOQ for statistical purpose (i.e., 0.4); and samples with no droplets above the threshold (0 CN) were considered non-detects (ND) and were replaced with ¼ value of LOQ for statistical purpose (i.e., 0.2) [12,25,26].

2.5. Quality Assurance

Sterile, single-use, disposable items (e.g., filtrations cups) were used for sample collection and laboratory sample processing; reusable items (e.g., collection bottles, filtration funnels, tweezers, peristaltic pump tubing) were cleaned and surface-sterilized between uses by soaking in 25% bleach solution for at least 10 min and rinsing multiple times with autoclaved RO water; items were then autoclaved, once dry. Although the Niskin sampler was not disinfected with the same protocol, as this was logistically difficult to perform on the research vessel, it was deployed in an open position and rinsed with lake water as it descended through the water column before it collected the benthic water sample. Therefore, we expected minimal round goby DNA carryover between samples. Molecular controls included filtered pipette tips, UV and ethanol sterilization of biological hoods, field and method blanks, and negative and positive control wells.

2.6. Statistical Analysis

Statistical analyses and graphical representations were performed using IBM SPSS Statistics (Version 27). For comparing eDNA results obtained by two methods, qPCR and ddPCR, all CN/µL were averaged across technical replicates (i.e., 3 technical replicates for qPCR and 1–2 technical replicates for ddPCR). CN/µL were log10 transformed. Paired samples t-test was used to compare qPCR and ddPCR values. For comparing eDNA results by qPCR and ddPCR to traditional surveys (bottom trawling and hook and line angling), only a subset of matching eDNA data was used (35 and 6 matching trawls and angling, respectively); eDNA data were normalized as CN/L of water and were averaged across technical and field replicates. Spearman correlation was used to evaluate these relations.

3. Results

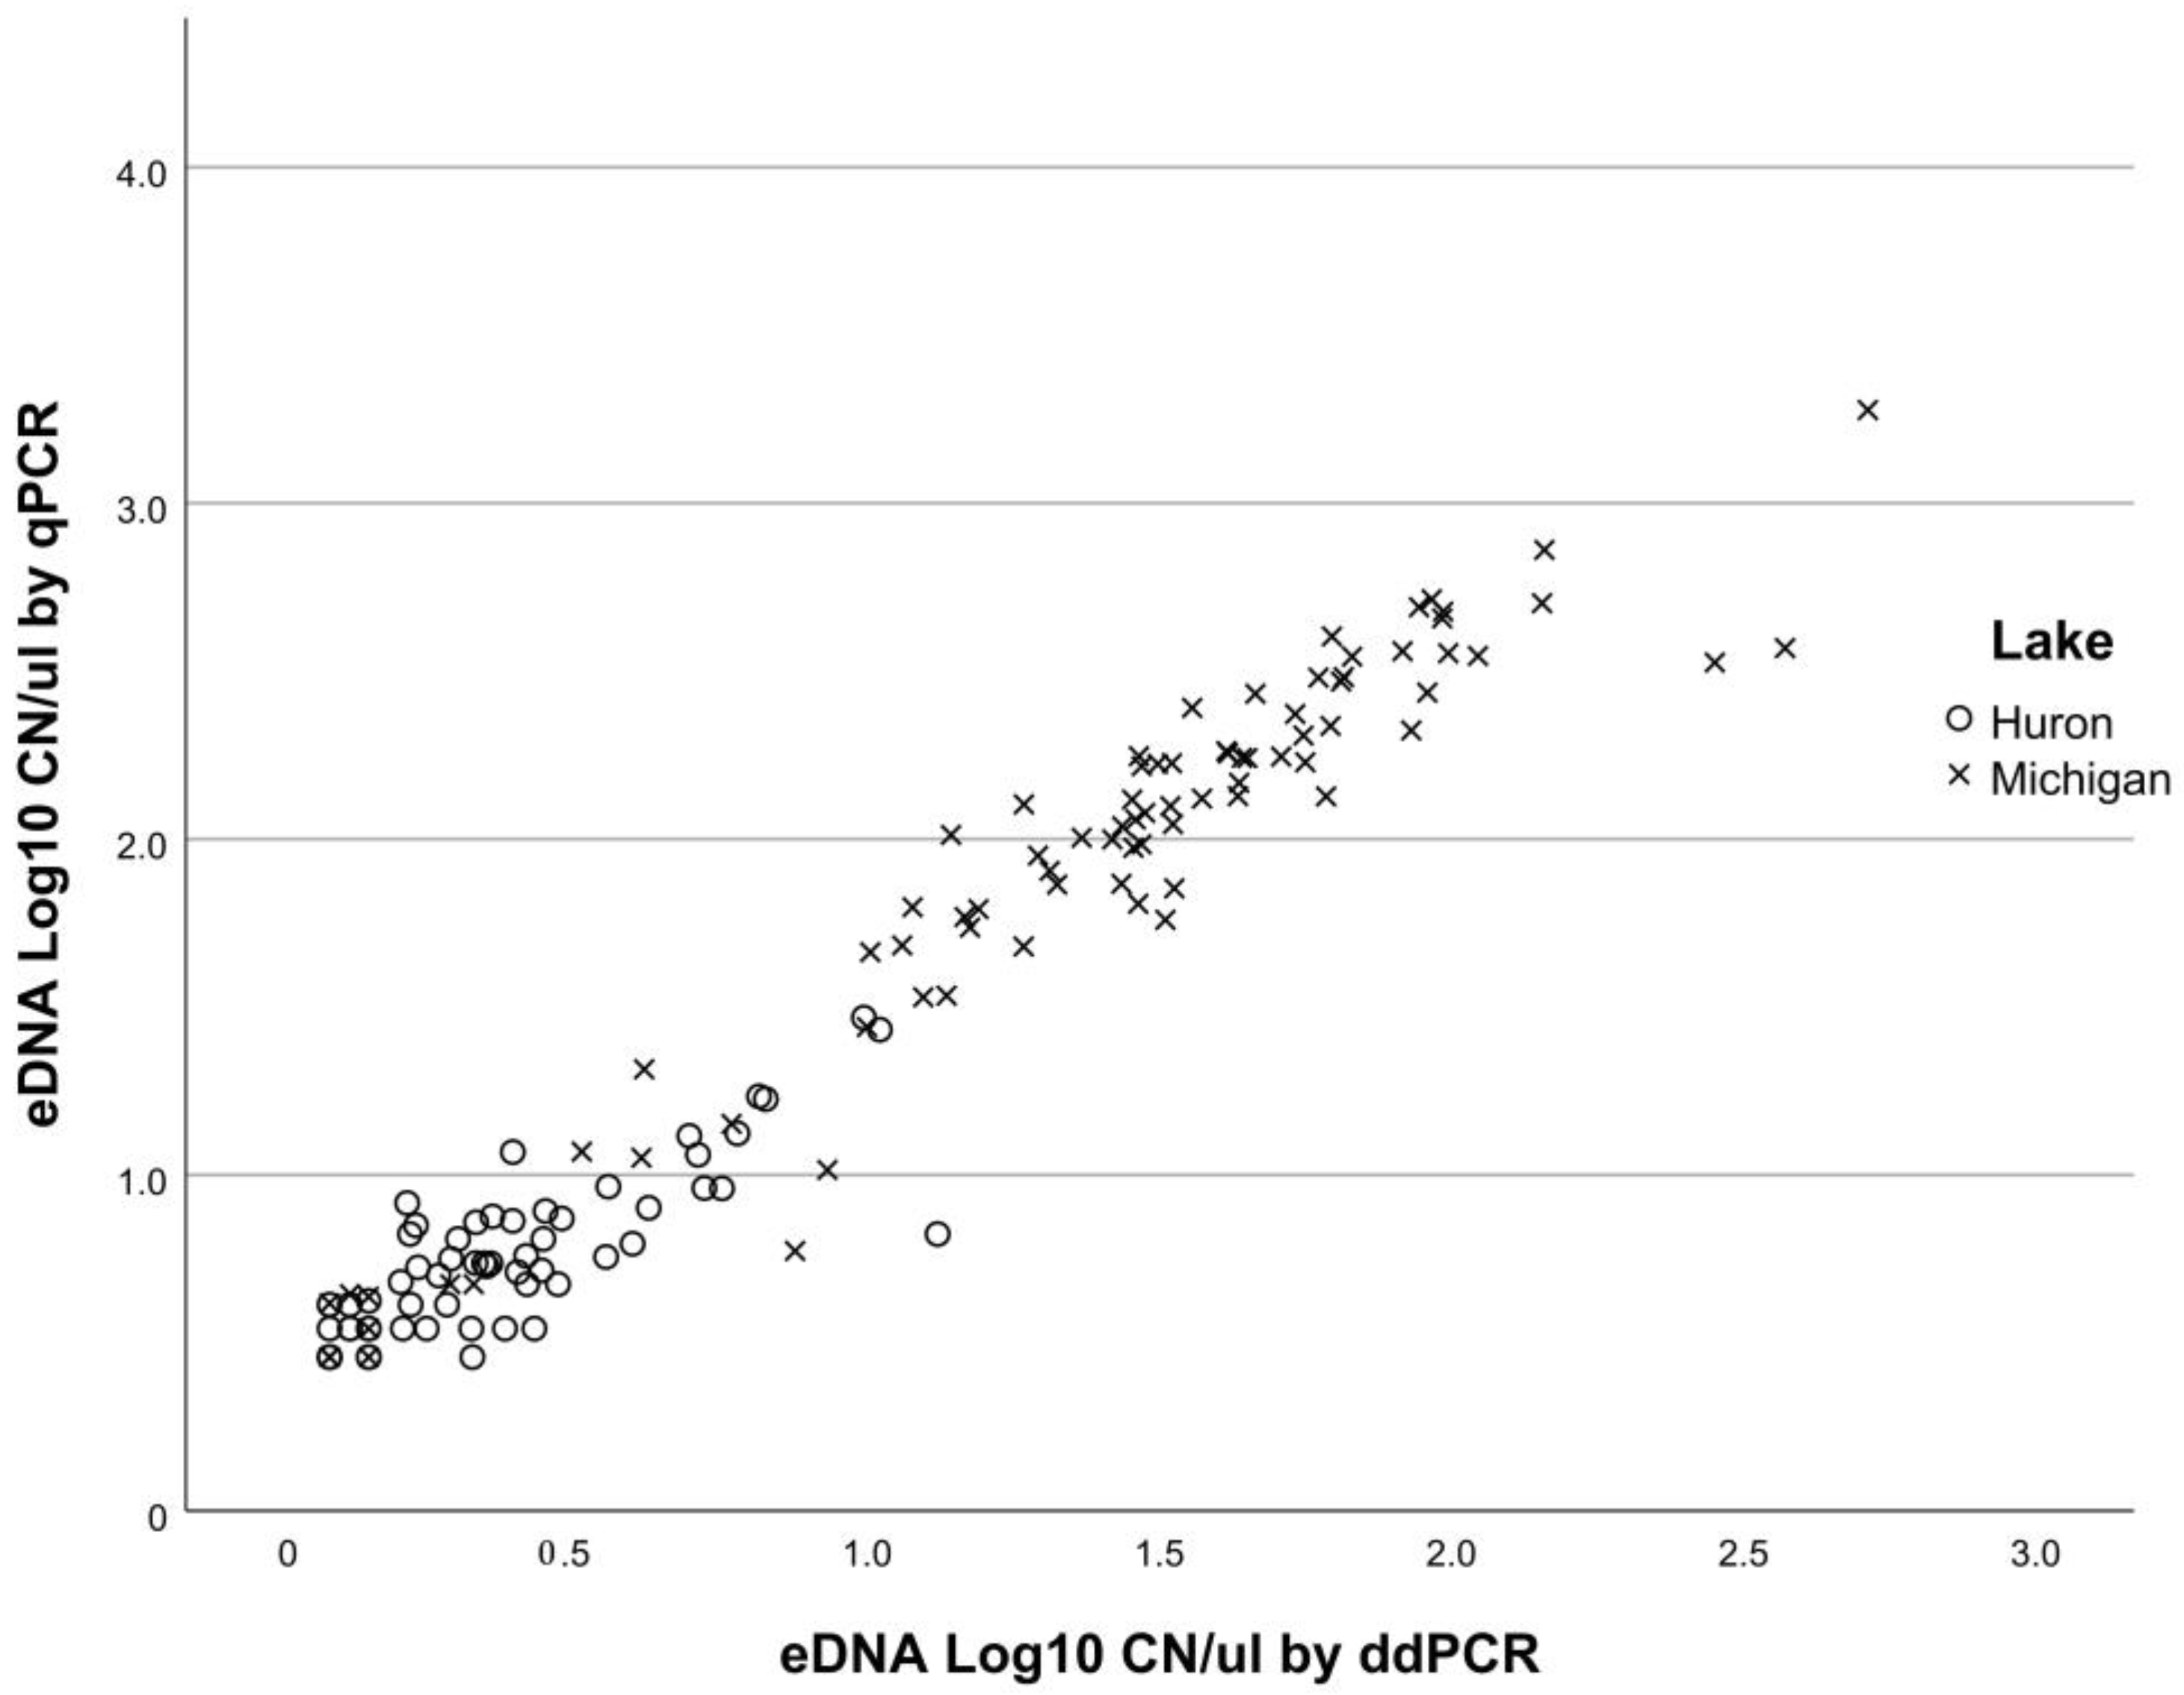
3.1. Comparisons of qPCR and ddPCR

Both qPCR and ddPCR platforms dependably detected round goby DNA in samples from Lakes Huron and Michigan; data used to perform analyses for this study are available in a USGS data release [24]. By qPCR, eDNA concentrations were categorized as ND, DNQ, and ROQ in 35%, 12%, and 54% of wells, respectively (n = 565) before data were averaged per technical replicates. All eDNA extracts run on the ddPCR platform had an average of 14,907 ± 1627 (mean ± standard deviation (SD)) droplets per well (n = 240), with a maximum droplet reading of 19,040 droplets in a single well; eDNA concentrations in 22%, 18%, and 61% of the wells were categorized as ND, DNQ, and ROQ, respectively.
The positive correlation between log-transformed CN values of qPCR and ddPCR (Figure 2) was statistically significant (Spearman’s rho = 0.962, p < 0.001, n = 189). Correlations were also significant when divided by lakes (Spearman’s rho = 0.858, p < 0.001, n = 95 for Lake Huron and Spearman’s rho = 0.970, p < 0.001, n = 94 for Lake Michigan). Per paired samples t-test, eDNA concentrations by qPCR were significantly higher than by ddPCR (t = −36.171, p < 0.001, n = 189); mean for qPCR was 1.193 ± 0.058 (log10 CN/µL ± standard error (SE)) and for ddPCR was 0.746 ± 0.051.
Overall, round goby DNA concentrations were significantly higher in Lake Michigan than in Huron using both qPCR and ddPCR (F = 170.04, p < 0.001; F = 152.1, p < 0.001, respectively) with mean concentrations of 1.22 ± 0.07 (log10 CN/µL ± SE) and 0.28 ± 0.03 (ddPCR) and 1.74 ± 0.08 and 0.65 ± 0.02 (qPCR) for Lakes Michigan and Huron, respectively. Highest eDNA concentrations were generally detected in the shallow depths near the Portage Lakefront breakwall in Lake Michigan, with a maximum value of 2.71 (ddPCR) or 3.28 (qPCR) in late May. Of all 189 samples, positive round goby detections were in agreement for the vast majority of samples (n = 172) tested between qPCR and ddPCR platforms. ddPCR had increased sensitivity at the lowest concentrations of round goby DNA and identified an additional 13 positive samples that were ND with qPCR; these included four, one, and six eDNA water samples collected in Lake Huron during trawling in April, August and October, respectively, and in two samples collected in Lake Michigan in late November. However, qPCR did detect four samples that were negative by ddPCR: these included two and one eDNA water samples collected during trawling in April and October, respectively, in Lake Huron, and one sample collected in late November, in Lake Michigan.

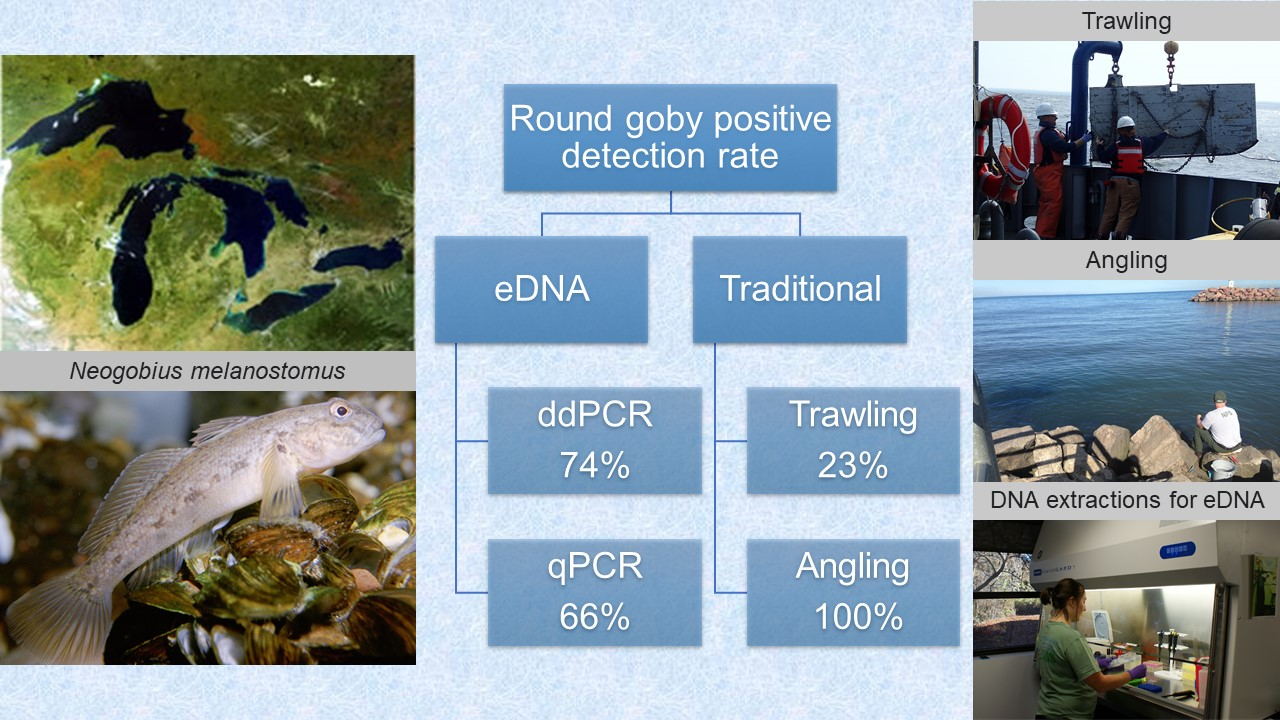
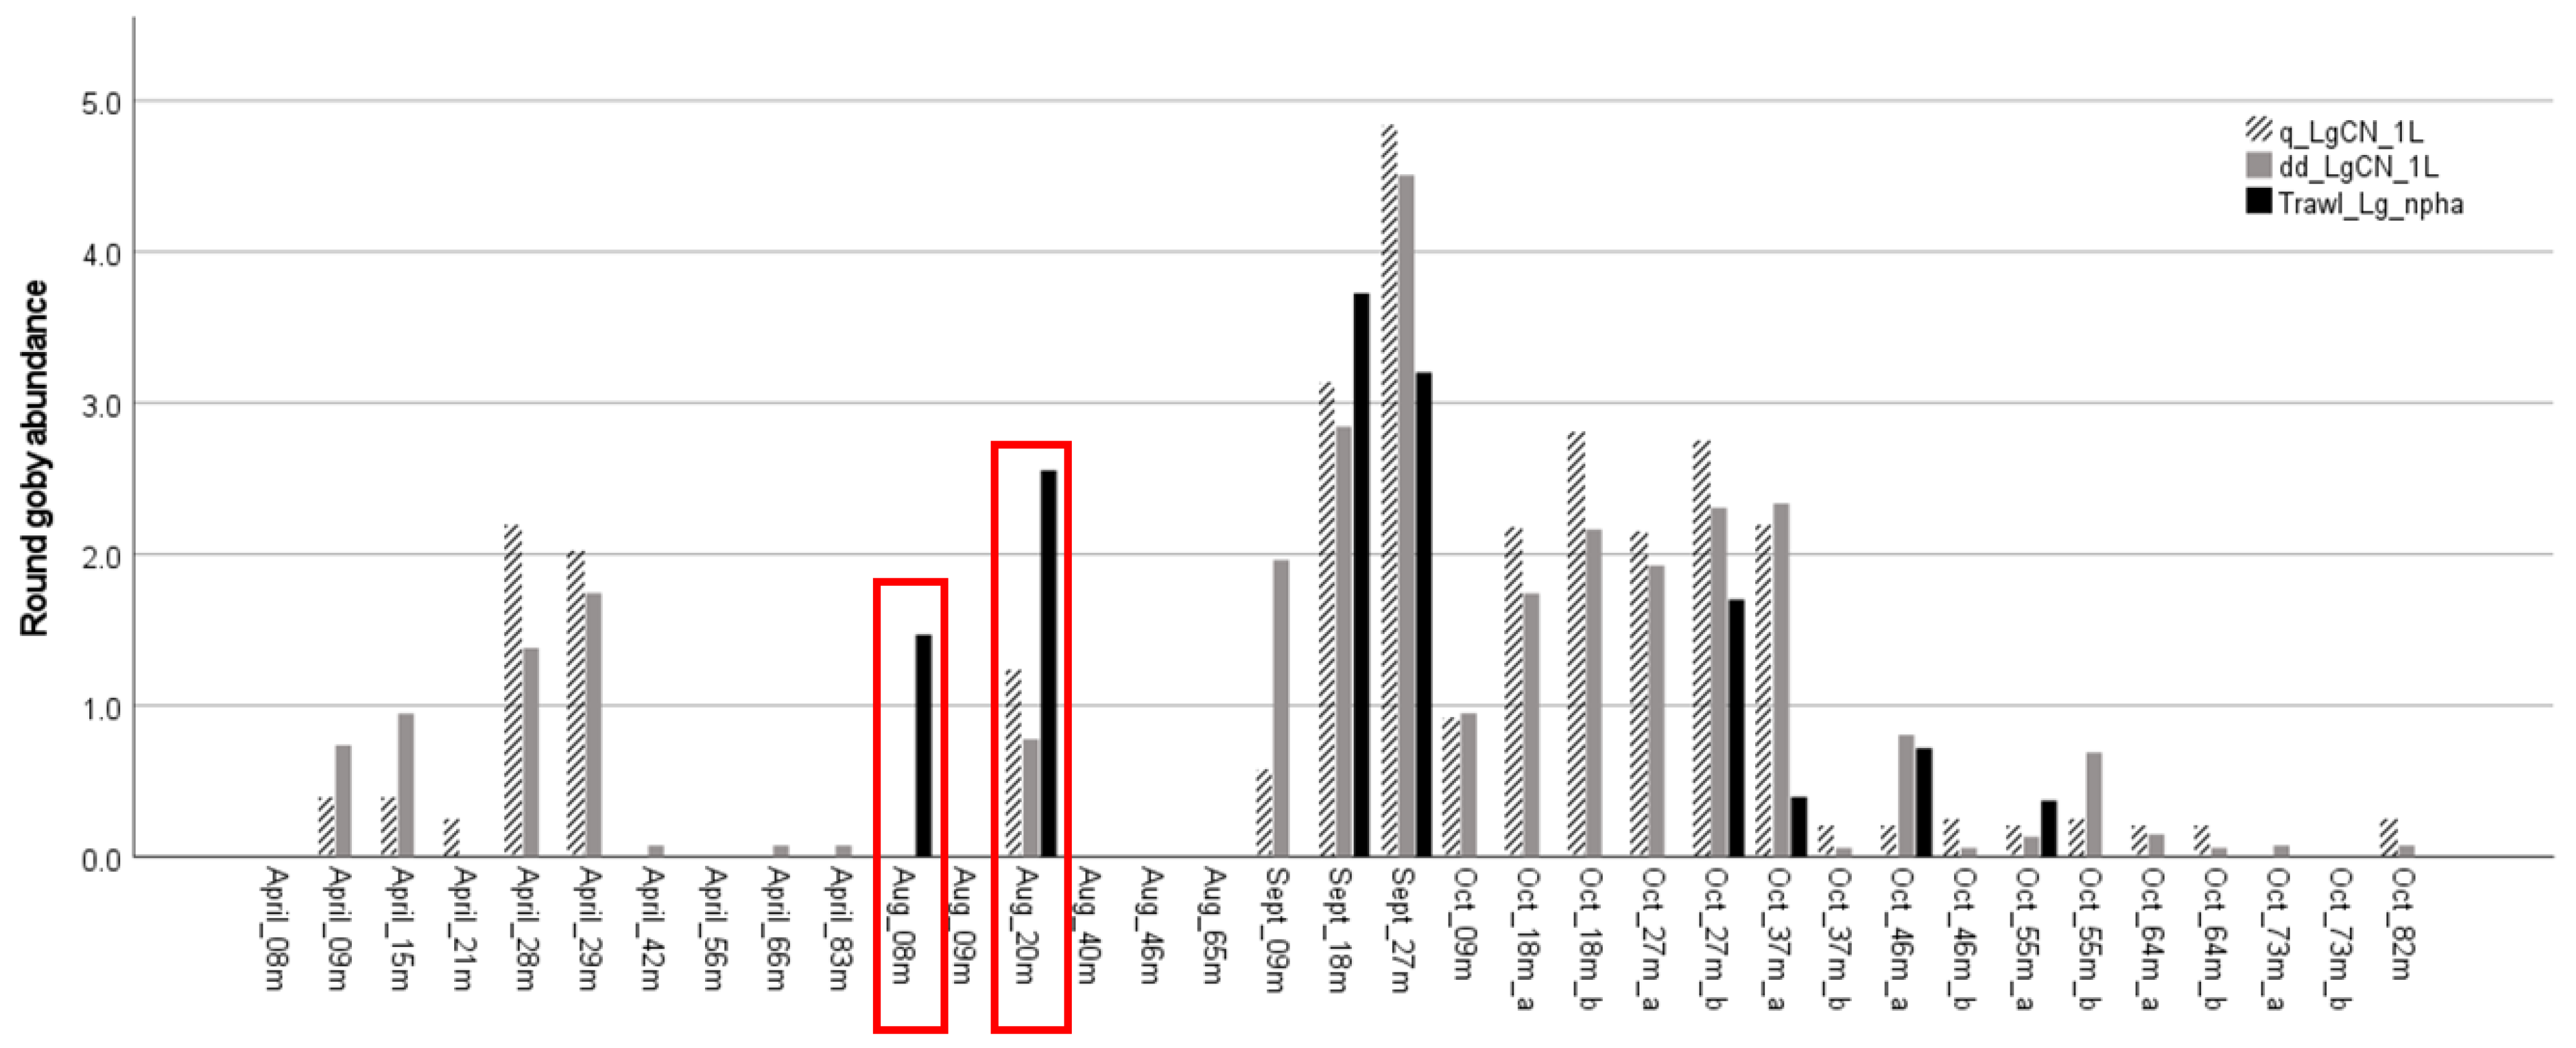
3.2. Detection Sensitivity: Comparison of eDNA vs. Traditional Surveys

Hook and line angling regularly resulted in capturing round goby in September and October in high numbers; the catch-per-unit-effort (CPUE) ranged from 41 to 90 per 100 min or 349.68 to 1201.33 g/100 min. Mean length of the fish ranged from 83.95 to 94.22 mm and mean weight ranged from 8.56 to 13.42 g. During these hook and line angling efforts, round goby were detected by qPCR and ddPCR on all six occasions, with mean eDNA concentrations of 3.56 ± 0.23 (log10 CN/L ± SE) and 3.01 ± 0.19, for qPCR and ddPCR, respectively. Although both hook and line angling and eDNA sampling detected abundant numbers of round goby near the breakwalls in Lake Michigan, the results were not significantly correlated, as the sample size was low (Spearman’s rho = −0.86, p = 0.872, n = 6). Late fall and winter weather and lake conditions prevented continuing the hook and line angling; however, sampling for eDNA continued in November, December, February and May. Throughout 13 sampling occasions, eDNA concentrations remained consistently high but dropped to 1.31 ± 0.66 and 0.04 ± 0.04 (qPCR and ddPCR, respectively) in late November and to all ND values in December by both methods (Figure 3) when water temperatures decreased. eDNA concentrations were positively correlated with lake water temperature (Pearson R = 0.644, p = 0.024), which ranged from 8.9 to 22.4 °C.
Bottom trawls captured round goby in August and October (Lake Huron) and in September (Lake Michigan), but not in April. The number of round goby caught in trawls ranged from 28 to 5,328 fish/per hectare; and the weight ranged from 123.7 to 41,018.2 g/ha. Overall, round goby were caught in only 23% of the trawls which had matching eDNA samples. DNA of round goby was detected in 74% and 66% of samples by ddPCR and qPCR, respectively (n = 35) (Figure 4). However, only about half of these positive detections were above the LOQ, with ddPCR analysis resulting in more ROQ detections (for qPCR: 11/23 positive detections, or 48%; for ddPCR: 16/26 or 62%). Looking at the seasonal detection, only two and four of the ROQ positive detections were recorded in April by qPCR and ddPCR, respectively, indicating low eDNA concentrations in the spring. Overall, results of eDNA analysis paired with trawl catches showed highest sensitivity of the ddPCR method followed by qPCR and then trawling.
For bottom trawls paired with eDNA sampling, target quantification was correlated across the three methods. The qPCR and ddPCR results (CN/L) were highly correlated in a pairwise comparison (Spearman’s rho = 0.880, p < 0.001, n = 35). Correlations of eDNA concentration with trawling (number of round goby/hectare) were lower but also significant for qPCR vs. trawling (Spearman’s rho = 0.380, p = 0.025, n = 35) and ddPCR vs. trawling (Spearman’s rho = 0.419, p = 0.012, n = 35). Much of the relationship was driven by the low detection of round goby using trawling; even with 23% detection, round goby abundance was quite low, with a mean of 210 fish/hectare and a majority of trawls containing zero fish. Correlations of eDNA concentration with trawl biomass (weight of round goby in grams/hectare) were also significant: Spearman’s rho = 0.374, p = 0.027 and Spearman’s rho = 0.413, p = 0.014 for qPCR and ddPCR, respectively.

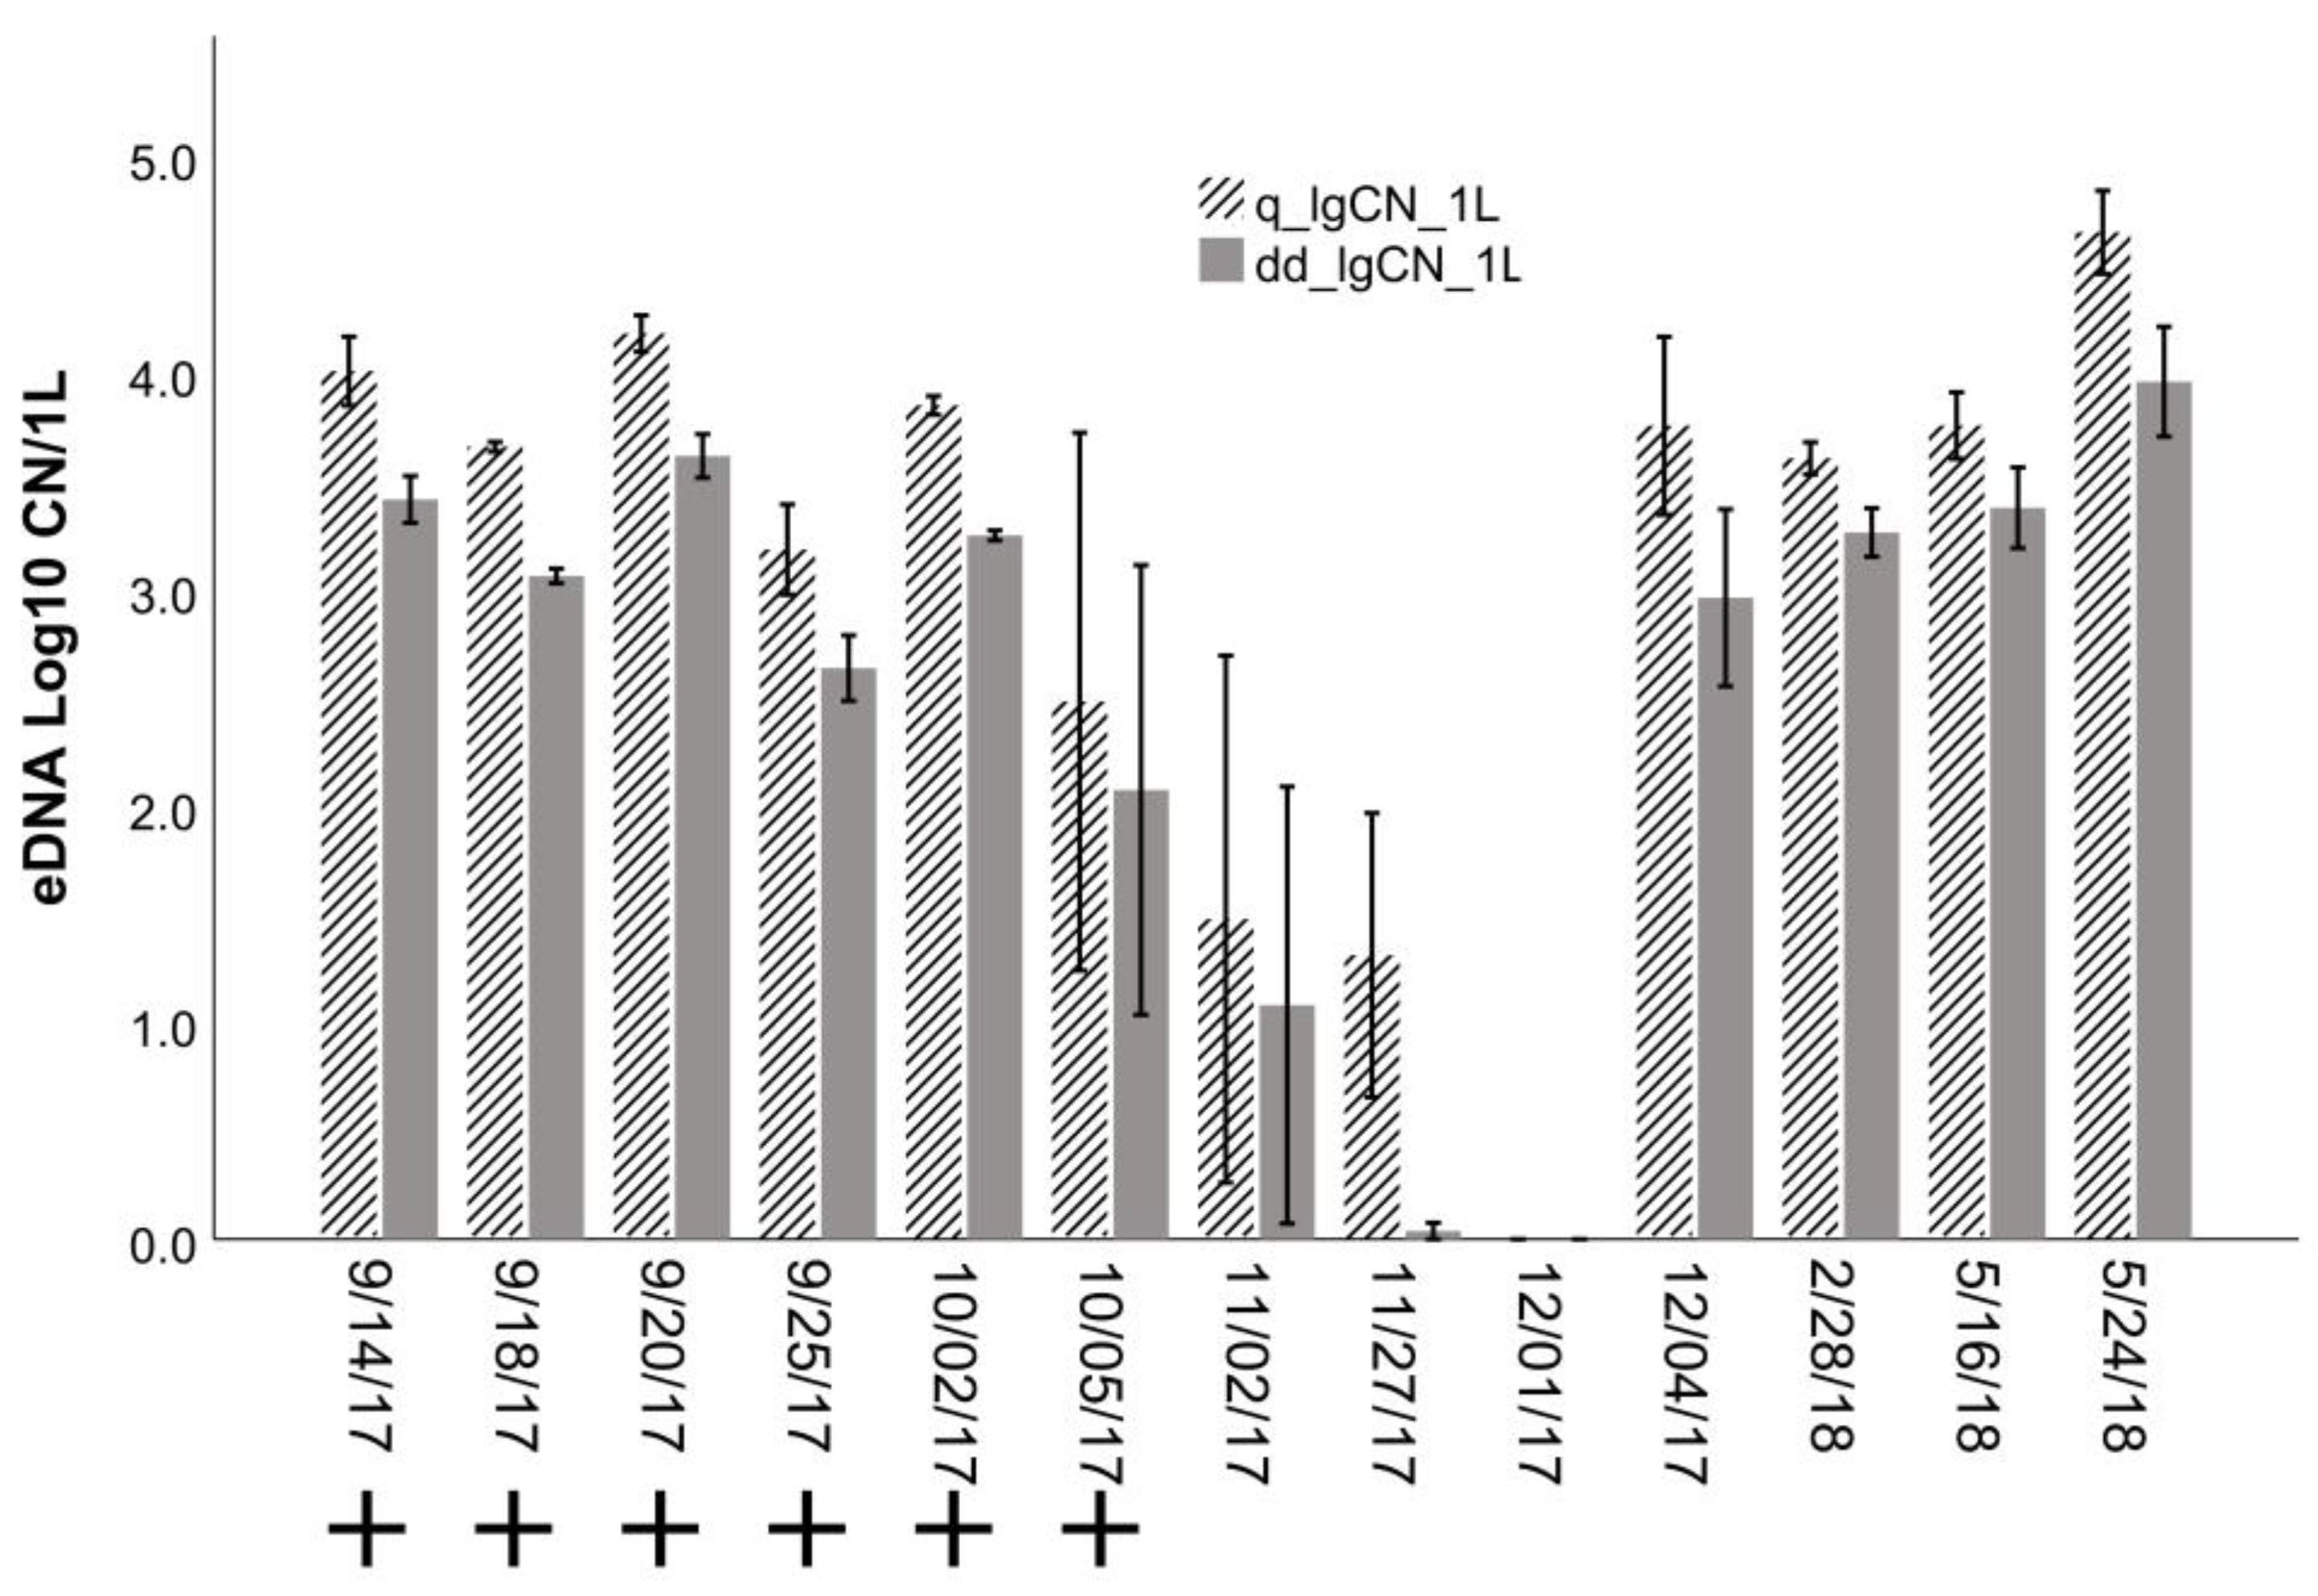
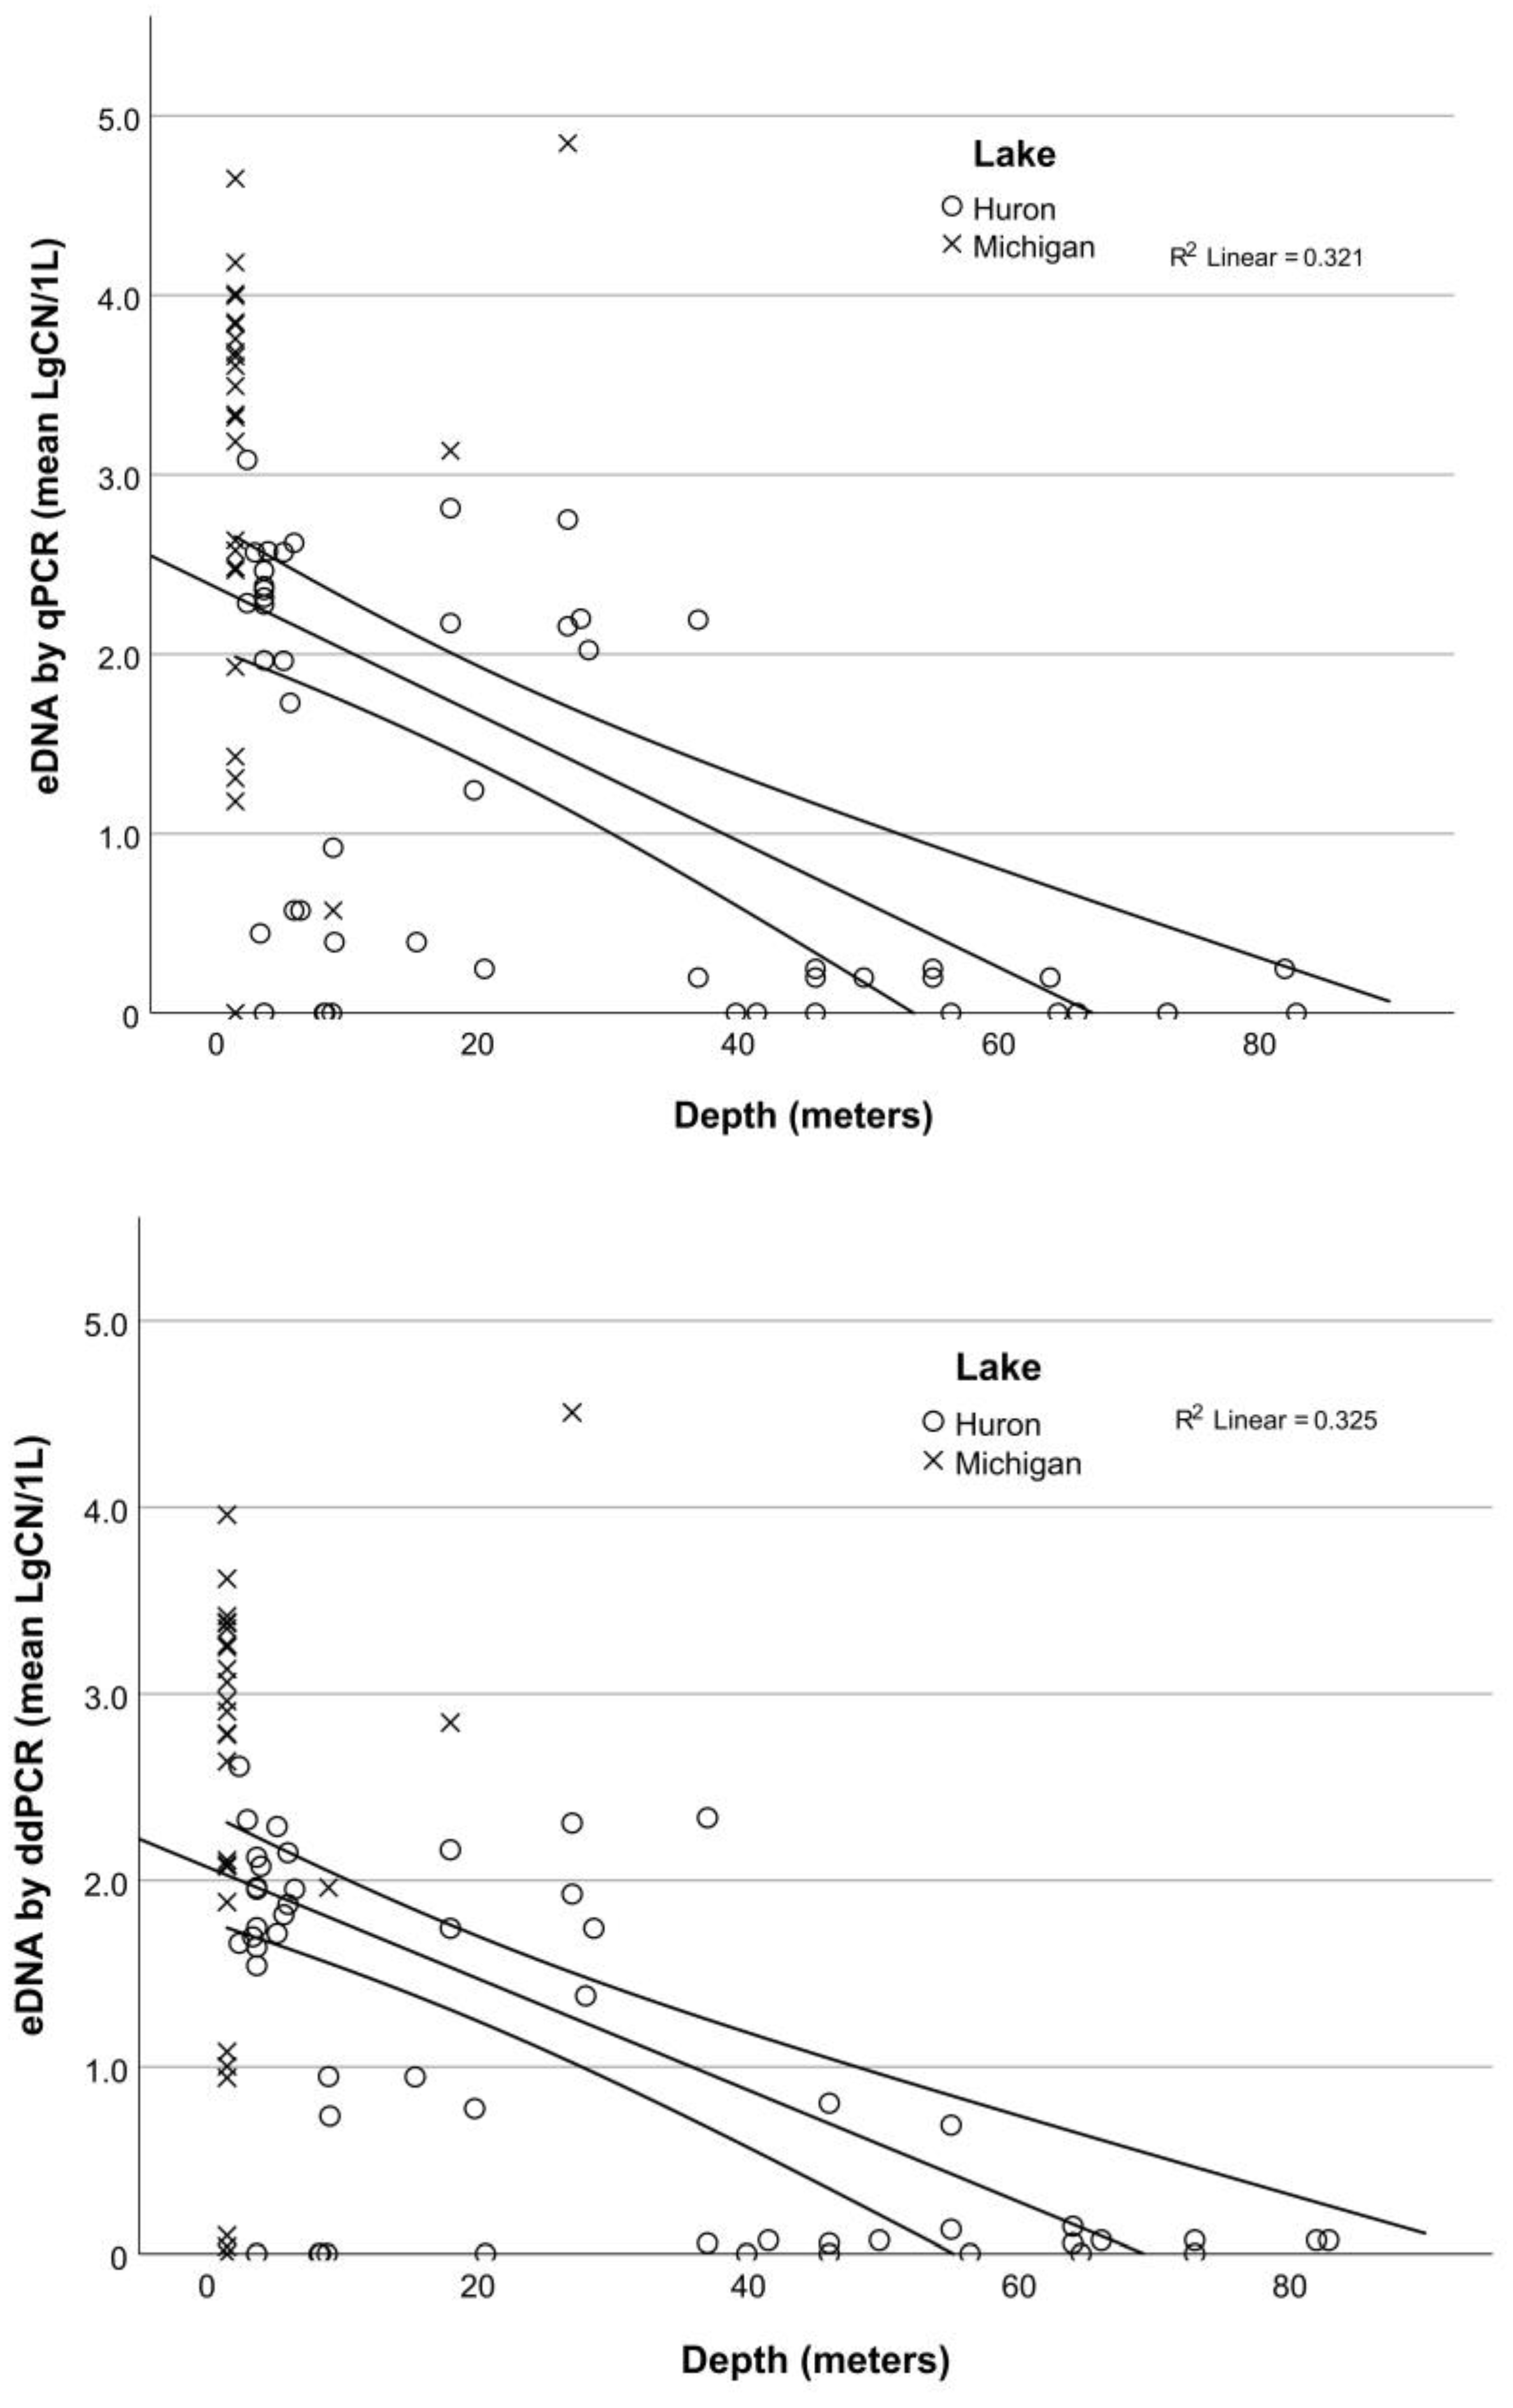
3.3. Application: Evaluating Seasonal and Depth Distribution of Round Goby

There were 46 samples where ddPCR and qPCR concentrations were both above the LOQ; 98% of these eDNA ROQ detections were detected at shallower depths sampled (<30 m) (Figure 5), such that depth and eDNA concentration were significantly negatively correlated (Spearman’s rho = −0.638, p < 0.001, n = 80 and Spearman’s rho = −0.578, p < 0.001, n = 80 for qPCR and ddPCR, respectively). At sites of >30 m depth, eDNA was detected in small quantities, if at all. Round goby DNA was detected to a depth of 83 m while trawls captured goby up to a depth of 55 m.
Similar to eDNA results, round goby were captured by trawling primarily at depths <30 m (63% of all positive trawls); any round goby captured >30 m deep were associated with the Harbor Beach location in Lake Huron. Highest trawl catch was near Zion, IL in Lake Michigan: 5328 goby/hectare at 18 m depth.
Detection of eDNA was uneven when compared across the three seasons sampled; eDNA was detected during the spring sampling events at depths <30 m even though no round goby were captured during trawling; eDNA was detected in 50% and 70% of comparable samples by qPCR and ddPCR, respectively. In summer, the pattern was sporadic: eDNA (ddPCR and qPCR) was detected and round goby were captured by trawling at 20 m, but no eDNA was detected at any other depths sampled, despite a calculated trawl capture of 28 goby/hectare at 8 m depth. For 8 and 20 m depths, eDNA samples were not synchronized in time with trawling, which may have affected the outcome. Overall, during summer surveys, round goby were captured in 33% of trawls (2/6) but were detected in only 17% of eDNA samples (1/6) for both qPCR and ddPCR. The vast majority of positive eDNA detections and trawl captures were collected in fall, including samples in both Lake Huron and Michigan. During the fall survey in Lake Huron, round goby capture and eDNA detection were correlated across depths (although data are skewed); overall detection comparison was 25% (4/16) by trawl vs. 88% by qPCR vs. 94% by ddPCR.

4. Discussion

Abundance estimates of some aquatic species are challenging from a methodological standpoint and thus require multiple approaches. Benthic round goby is believed not only to occupy a variety of habitats across different depths in the Great Lakes, but also to migrate seasonally from shallow to deep water [29]. Additionally, their single pelvic fin acts as a suction cup to hold them in place in gravelly habitats, so they are more difficult to gather by trawl, which are commonly restricted to sandy areas [3,30]. Here, we compare round goby detections by traditional and eDNA based methods to gain an understanding of their abundance in the Great Lakes.

4.1. Comparison of Molecular Analyses: ddPCR and qPCR

In large, oligotrophic water bodies, the eDNA signal may be diluted and scarce, so we chose to analyze the samples using two different platforms to improve detection: qPCR and ddPCR. Although we have had success using qPCR to target round goby in past studies [10,12], ddPCR generally outcompetes qPCR in detecting critically low DNA concentrations [21,31]; thus, we found it suitable for our purpose.
We found that eDNA concentrations by qPCR and ddPCR were highly correlated in water samples from Lakes Huron and Michigan, which has been previously documented [9,21,32]. We obtained a higher detection rate for ddPCR, 13 additional positive detections compared to qPCR, all but one were below the LOQ. We obtained four additional positive detections by qPCR which were not detected by ddPCR, all below the LOQ. While higher detection was achieved by ddPCR, it was inconsistent among samples with low eDNA concentrations, which may have been caused by a lower number of technical replicates used for ddPCR or the variable volume of DNA template used between platforms. Perhaps in studies where the most sensitive detections are critically important (e.g., newly invading species, threatened species, newly restored species), these details would be best unified.
The overall copy numbers were significantly higher (p < 0.001) for samples analyzed by qPCR than by ddPCR. There have been reports of differences in copy numbers by ddPCR and qPCR; some report findings are similar to ours [9,21], but conversely, Wood et al. [32] recorded qPCR copy numbers on average 125-fold lower than those measured by ddPCR. These inconsistencies may be associated with the principle of copy numbers quantification, which is different between the platforms: direct count of positive droplets (ddPCR) versus calculation using the standard curve of the amplified DNA fragment (qPCR).

4.2. Detection by eDNA and Traditional Surveys

In our dataset, 35 eDNA samples were paired with bottom trawls and 6 eDNA samples were paired with hook and line angling in the nearshore. Generally, use of hook and line angling in high population areas of lake breakwalls had greater detection rates than trawling at various depths in Lakes Huron and Michigan. Trawling had lower overall detection but included broader spatial sampling across various depths. Our eDNA results (both, qPCR and ddPCR) were correlated with trawl captures, but not with hook and line angling. While eDNA sampling paired with trawls consisted of both positive and negative detections, the hook and line angling paired with eDNA sampling consisted of only positive round goby detections at high abundance: CPUE of 41–90 fish per 100 min. The low number of hook and line angling events, hampered by inclement weather, limited the proper comparison with eDNA sampling. Comparisons of eDNA concentrations with abundance estimates by traditional fish monitoring have yielded variable outcomes in recent studies: eDNA was correlated with fish biomass in New Jersey Ocean Trawl Survey [18], fyke catches during the spring migration from the North Sea into the Dutch Wadden Sea in Europe [33], and with Atlantic cod (Gadus morhua) biomass by trawling [17], but there was no significant correlation between eDNA and the fish biomass captured via trawling in the Baltic Sea in Europe [16].
It has been stated that various types of catch-per-unit-effort estimates of fish abundance come with considerable variation and uncertainty [13,19]. In our study, the water sample was collected at depth prior to the trawls, to avoid potential contamination by sediment-bound eDNA kicked up during trawling activity, but comprised a different spatial coverage (point sample versus distance towed for 10 min); for hook and line angling comparison, samples were collected prior to angling, and the attempt was made to collect from a similar spatial area as was covered by angling efforts. While hook and line angling may be a more precise match to surveys of eDNA, this method is limited to fishing-suitable locations, and it is impractical for assessment of large water bodies, such as the Great Lakes. Despite all of the imprecision in sampling efforts, all but one instance returned corroborating detection of round goby, meaning, in all catches detected by trawling or hook and line angling, eDNA returned a positive signal. In a recent study assessing round goby expansion in North America, eDNA was detected in all instances where round goby were captured with traditional sampling gear at 12 sites in the canal system between Oneida Lake and the Hudson River in the northeastern United States [13]. This supports that eDNA based methods are adequate for round goby detection across various water bodies.
A single inconsistent outcome between a trawl catch and eDNA result at 8 m depth in Lake Huron in August may highlight the need for insight on persistence of the eDNA signal. Specifically, eDNA detections by qPCR and ddPCR were negative for round goby although a capture estimate by trawl was 28 goby/hectare. A reason for this mismatch may be a temporal effect, as the eDNA sampling was performed four days after bottom trawl (see red boxes in Figure 4). However, at 20 m, where eDNA and trawl samplings were also four days apart, the outcomes agreed: 359 goby/hectare were captured by trawls and both eDNA based methods resulted in a positive signal. This result raises interesting questions about eDNA transport and persistence, which are beyond the scope of this study. The results certainly do not undermine the consistency of detection, given the minimal mismatch. Similarly, a recent study of a coastal North Sea fish community found a few mismatches between eDNA based methods and traditional capture techniques but placed confidence in overall detection [33].
One question when comparing results from traditional surveys with eDNA sampling is the potential for false positives; specifically, are the very low eDNA detections in April, with no round goby captured by trawls, really representative of round goby present at these sites? While these low concentration positive signals may be derived from dead individuals or resuspended from sediments, where the eDNA signal may be long-lasting [12,34], we intentionally avoided contamination from sediment, by collecting water samples 1 m above the lake bottom. In a more quantitative analysis, George et al. [13] stated that only water samples with eDNA concentrations > 100 CN/L by qPCR, corresponded to round goby presence at the study sites in the canal system in the northeastern United States. In our dataset, only two positive detections in April were >100 CN/L (Figure 4) at two sites (28 and 29 m depth), but without direct evidence, we do not have certainty of fish presence.

4.3. Application

Incorporating the natural history and seasonality of an organism’s behavior into a monitoring program has been a practice for many conventional sampling approaches, and it has been noted that it should be a valid consideration in eDNA sampling programs as well [35,36,37]. In eDNA surveys for two highly imperiled species in the southeastern United States, the detection probability for black warrior waterdog (Necturus alabamensis) was highest in the cool season, while for the flattened musk turtle (Sternotherus depressus) in the warm season, consistent with the known natural history of both species, spiking in months when reproductive activity occurred [35]. Similarly, peaks in eDNA of great crested newt (Triturus cristatus) in the United Kingdom were observed at the end of breeding season and also during a peak in their larval abundance [38]. Notable increases in eDNA concentrations were observed during the breeding season of eastern hellbenders (Cryptobranchus alleganiensis) in northeastern United States and American bullfrogs (Lithobates catesbeianus) in Western Europe [20,36], in adult summer migration for Chinook salmon (Oncorhynchus tshawytscha) in the Upper Columbia River, on the border of the United States and Canada [39], and seasonal movement of bigheaded carps [40]. It has recently been proposed that fish spawning events may be identified by the spikes in eDNA concentrations, as shown by testing with two medaka species in Japan (Oryzias latipes and Oryzias sakaizumii) [41].
In our study, highest trawl catches were recorded in late September in Lake Michigan and in October in Lake Huron; consistently high CPUE catches at the Lake Michigan breakwalls were recorded between September and October using hook and line angling. Highest eDNA concentrations matched round goby catch in Lake Michigan at 18 and 27 m depths (5328 goby/ha, 41,018 g/ha and 1595 goby/ha, 12,797 g/ha). By hook and line angling, we consistently caught many fish (41–90 per 100 min of angling time), and corresponding eDNA concentrations were high.
Trawling provides abundance estimates at multiple depths; no round goby were recorded in April trawls, but were caught at shallow depths, 8 and 20 m in August, and at 18, 27, 37, 46, and 55 m in September and October. Round goby are theorized to migrate to greater depths during the winter months [29]; we did not find enough evidence through our study to confirm this. Trawls and hook and line angling caught round goby most frequently in the fall at multiple depths; round goby DNA remained in high concentrations at the Lake Michigan breakwalls (ranged from 417 to 2781 CN/L by ddPCR and 3086 to 11,581 by qPCR) with decreases noted in late November/early December when lake water temperature dropped. Decreasing lake water temperatures may have been a reason for round goby retreat from the breakwall area, as eDNA concentrations were positively correlated with lake water temperature.

5. Conclusions

Traditional surveys for aquatic organisms have known inefficiencies, biases, and limitations, and incorporating surveys of eDNA can improve outcomes. The choice of PCR method to use for single species detection may depend on level of detection desired: better sensitivity to low numbers (threatened or invasive species) or more accurate population estimates (monitoring populations). We were able to (1) achieve higher detection rates for round goby with both ddPCR and qPCR in comparison with bottom trawling; (2) expand our eDNA sampling surveys to the areas where trawls were not possible due to shallow depths or lakes’ substratum; and (3) expand surveys across seasons using eDNA sampling in the areas where hook and line angling were not possible due to inclement weather or lake conditions. However, only a few positive round goby catches by trawling and no negative results from the hook and line angling, limited the interpretation of our results. Future, more extensive spatial and temporal matching of traditional and eDNA sampling efforts will allow for more comprehensive analyses of round goby distribution in Lakes Huron and Michigan. Additional questions remain about eDNA signal persistence and three-dimensional movement in the water column, which are imperative for interpretation of eDNA results.

Author Contributions

Conceptualization, M.B.N., K.J.P.-K. and A.M.S.; Methodology, M.B.N., K.J.P.-K. and A.M.S.; Formal Analysis, A.M.S. and K.J.P.-K.; Resources, M.B.N.; Data Curation, K.J.P.-K. and A.M.S.; Writing—Original Draft Preparation, K.J.P.-K. and A.M.S.; Writing—Review and Editing, A.M.S. and M.B.N.; Visualization, K.J.P.-K. and A.M.S.; Supervision, M.B.N.; Project Administration, M.B.N.; Funding Acquisition, M.B.N. All authors have read and agreed to the published version of the manuscript.

Funding

Funding was provided by the U.S. Geological Survey Ecosystems Mission Area and the Great Lakes Restoration Initiative.

Institutional Review Board Statement

Sampling and handling of fish during trawls were carried out in accordance with guidelines provided in the “Guidelines for the use of fishes in research” published by the American Fisheries Society, Bethesda, MD, USA (http://fisheries.org/docs/wp/Guidelines-for-Use-of-Fishes.pdf, accessed on 20 December 2022). Sampling and handling of fish during angling activities were carried out under a plan approved by the Institutional Animal Care and Use Committee (IACUC) of the National Park Service, Project MWR_INDU_Morris_RoundGoby_2018.A3.

Data Availability Statement

The data presented in the study are publicly available in the USGS ScienceBase: doi:10.5066/P92V61KL.

Acknowledgments

U.S. Fish and Wildlife Service, Alpena, Michigan; Ed Roseman and Peter Esselman (U.S. Geological Survey (USGS)) facilitated Lake Huron eDNA collection; Charles Madenjian and David “Bo” Bunnell (USGS) facilitated Lake Michigan eDNA collection; Darryl Hondorp (USGS) provided trawl data; Charles Morris and Joshua Dickey (National Park Service) led hook and line angling and handled fish at Portage Lakefront and Washington Park sampling efforts; Samantha Jurecki (formerly USGS) provided field and laboratory assistance in processing eDNA samples. Any use of trade, firm, or product names is for descriptive purposes only and does not imply endorsement by the U.S. Government.

Conflicts of Interest

The authors declare no conflict of interest.

References

  1. Jude, D.J.; Reider, R.H.; Smith, G.R. Establishment of Gobiidae in the Great Lakes Basin. Can. J. Fish. Aquat. Sci. 1992, 49, 416–421. [Google Scholar] [CrossRef]
  2. Gorman, O.T. Prey fish communities of the Laurentian Great Lakes: A cross-basin overview of status and trends based on bottom trawl surveys, 1978–2016. Aquat. Ecosyst. Health Manag. 2019, 22, 263–279. [Google Scholar] [CrossRef]
  3. Clapp, D.F.; Schneeberger, P.J.; Jude, D.J.; Madison, G.; Pistis, C. Monitoring round goby (Neogobius melanostomus) population expansion in eastern and northern Lake Michigan. J. Great Lakes Res. 2001, 27, 335–341. [Google Scholar] [CrossRef]
  4. Johnson, T.B.; Allen, M.; Corkum, L.D.; Lee, V.A. Comparison of methods needed to estimate population size of round gobies (Neogobius melanostomus) in western Lake Erie. J. Great Lakes Res. 2005, 31, 78–86. [Google Scholar] [CrossRef]
  5. Bergstrom, M.A.; Evrard, L.M.; Mensinger, A.F. Distribution, abundance, and range of the round goby, Apollina melanostoma, in the Duluth-Superior Harbor and St. Louis River Estuary, 1998–2004. J. Great Lakes Res. 2008, 34, 535–543. [Google Scholar] [CrossRef]
  6. Kornis, M.S.; Mercado-Silva, N.; Vander Zanden, M.J. Twenty years of invasion: A review of round goby Neogobius melanostomus biology, spread and ecological implications. J. Fish Biol. 2012, 80, 235–285. [Google Scholar] [CrossRef]
  7. Rourke, M.L.; Fowler, A.M.; Hughes, J.M.; Broadhurst, M.K.; DiBattista, J.D.; Fielder, S.; Wilkes Walburn, J.; Furlan, E.M. Environmental DNA (eDNA) as a tool for assessing fish biomass: A review of approaches and future considerations for resource surveys. Environ. DNA 2022, 4, 9–33. [Google Scholar] [CrossRef]
  8. Peterson, G.S.; Hoffman, J.C.; Trebitz, A.S.; Hatzenbuhler, C.I.; Myers, J.T.; Ross, J.E.; Okum, S.L.; Pilgrim, E.M. Early detection monitoring for non-indigenous fishes; comparison of survey approaches during two species introductions in a Great Lakes port. Biol. Invasions 2022, 24, 463–478. [Google Scholar] [CrossRef]
  9. Nathan, L.M.; Simmons, M.; Wegleitner, B.J.; Jerde, C.L.; Mahon, A.R. Quantifying environmental DNA signals for aquatic invasive species across multiple detection platforms. Environ. Sci. Technol. 2014, 48, 12800–12806. [Google Scholar] [CrossRef]
  10. Nevers, M.B.; Byappanahalli, M.N.; Morris, C.C.; Shively, D.; Przybyla-Kelly, K.; Spoljaric, A.M.; Dickey, J.; Roseman, E.F. Environmental DNA (eDNA): A tool for quantifying the abundant but elusive round goby (Neogobius melanostomus). PLoS ONE 2018, 13, e0191720. [Google Scholar] [CrossRef]
  11. Nathan, L.R.; Jerde, C.L.; Budny, M.L.; Mahon, A.R. The use of environmental DNA in invasive species surveillance of the Great Lakes commercial bait trade. Conserv. Biol. 2015, 29, 430–439. [Google Scholar] [CrossRef]
  12. Nevers, M.B.; Przybyla-Kelly, K.; Shively, D.; Morris, C.C.; Dickey, J.; Byappanahalli, M.N. Influence of sediment and stream transport on detecting a source of environmental DNA. PLoS ONE 2020, 15, e0244086. [Google Scholar] [CrossRef] [PubMed]
  13. George, S.D.; Baldigo, B.P.; Rees, C.B.; Bartron, M.L.; Winterhalter, D. Eastward expansion of round goby in New York: Assessment of detection methods and current range. Trans. Am. Fish. Soc. 2021, 150, 258–273. [Google Scholar] [CrossRef]
  14. Sterner, R.W.; Ostrom, P.; Ostrom, N.E.; Klump, J.V.; Steinman, A.D.; Dreelin, E.A.; Vander Zanden, M.J.; Fisk, A.T. Grand challenges for research in the Laurentian Great Lakes. Limnol. Oceanogr. 2017, 62, 2510–2523. [Google Scholar] [CrossRef]
  15. Thomsen, P.F.; Møller, P.R.; Sigsgaard, E.E.; Knudsen, S.W.; Jørgensen, O.A.; Willerslev, E. Environmental DNA from seawater samples correlate with trawl catches of subarctic, deepwater fishes. PLoS ONE 2016, 11, e0165252. [Google Scholar] [CrossRef]
  16. Knudsen, S.W.; Ebert, R.B.; Hesselsøe, M.; Kuntke, F.; Hassingboe, J.; Mortensen, P.B.; Thomsen, P.F.; Sigsgaard, E.E.; Hansen, B.K.; Nielsen, E.E. Species-specific detection and quantification of environmental DNA from marine fishes in the Baltic Sea. J. Exp. Mar. Biol. Ecol. 2019, 510, 31–45. [Google Scholar] [CrossRef]
  17. Salter, I.; Joensen, M.; Kristiansen, R.; Steingrund, P.; Vestergaard, P. Environmental DNA concentrations are correlated with regional biomass of Atlantic cod in oceanic waters. Commun. Biol. 2019, 2, 461. [Google Scholar]
  18. Stoeckle, M.Y.; Adolf, J.; Charlop-Powers, Z.; Dunton, K.J.; Hinks, G.; VanMorter, S.M. Trawl and eDNA assessment of marine fish diversity, seasonality, and relative abundance in coastal New Jersey, USA. ICES J. Mar. Sci. 2021, 78, 293–304. [Google Scholar] [CrossRef]
  19. Capo, E.; Spong, G.; Koizumi, S.; Puts, I.; Olajos, F.; Königsson, H.; Karlsson, J.; Byström, P. Droplet digital PCR applied to environmental DNA, a promising method to estimate fish population abundance from humic-rich aquatic ecosystems. Environ. DNA 2021, 3, 343–352. [Google Scholar] [CrossRef]
  20. Everts, T.; Halfmaerten, D.; Neyrinck, S.; De Regge, N.; Jacquemyn, H.; Brys, R. Accurate detection and quantification of seasonal abundance of American bullfrog (Lithobates catesbeianus) using ddPCR eDNA assays. Sci. Rep. 2021, 11, 11282. [Google Scholar] [CrossRef]
  21. Doi, H.; Uchii, K.; Takahara, T.; Matsuhashi, S.; Yamanaka, H.; Minamoto, T. Use of droplet digital PCR for estimation of fish abundance and biomass in environmental DNA surveys. PLoS ONE 2015, 10, e0122763. [Google Scholar] [CrossRef] [PubMed]
  22. Hunter, M.E.; Meigs-Friend, G.; Ferrante, J.A.; Kamla, A.T.; Dorazio, R.M.; Diagne, L.K.; Luna, F.; Lanyon, J.M.; Reid, J.P. Surveys of environmental DNA (eDNA): A new approach to estimate occurrence in vulnerable manatee populations. Endanger. Species Res. 2018, 35, 101–111. [Google Scholar] [CrossRef]
  23. Majaneva, M.; Diserud, O.H.; Eagle, S.H.C.; Boström, E.; Hajibabaei, M.; Ekrem, T. Environmental DNA filtration techniques affect recovered biodiversity. Sci. Rep. 2018, 8, 4682. [Google Scholar] [CrossRef]
  24. Przybyla-Kelly, K.J.; Spoljaric, A.M. Round Goby Detection by Environmental DNA, Trawl, and Angling in Lakes Huron and Michigan: U.S. Geological Survey Data Release; USGS Bureau: Reston, VA, USA, 2022. [CrossRef]
  25. Klymus, K.E.; Merkes, C.M.; Allison, M.J.; Goldberg, C.S.; Helbing, C.C.; Hunter, M.E.; Jackson, C.A.; Lance, R.F.; Mangan, A.M.; Monroe, E.M. Reporting the limits of detection and quantification for environmental DNA assays. Environ. DNA 2020, 2, 271–282. [Google Scholar] [CrossRef]
  26. Klymus, K.E.; Richter, C.A.; Chapman, D.C.; Paukert, C. Quantification of eDNA shedding rates from invasive bighead carp Hypophthalmichthys nobilis and silver carp Hypophthalmichthys molitrix. Biol. Conserv. 2015, 183, 77–84. [Google Scholar] [CrossRef]
  27. Goldberg, C.S.; Sepulveda, A.; Ray, A.; Baumgardt, J.; Waits, L.P. Environmental DNA as a new method for early detection of New Zealand mudsnails (Potamopyrgus antipodarum). Freshw. Sci. 2013, 32, 792–800. [Google Scholar] [CrossRef]
  28. Hunter, M.E.; Meigs-Friend, G.; Ferrante, J.A.; Smith, B.J.; Hart, K.M. Efficacy of eDNA as an early detection indicator for Burmese pythons in the ARM Loxahatchee National Wildlife Refuge in the greater Everglades ecosystem. Ecol. Indic. 2019, 102, 617–622. [Google Scholar] [CrossRef]
  29. Carlson, E.; Paddock, R.W.; Janssen, J. Seasonal offshore/inshore migration of round gobies. J. Great Lakes Res. 2021, 47, 892–899. [Google Scholar] [CrossRef]
  30. Charlebois, P.M.; Marsden, J.E.; Goettel, R.G.; Wolfe, R.K.; Jude, D.J.; Rudnika, S. The Round Goby, Neogobius Melanostomus (Pallas): A Review of European and North American Literature; Illinois-Indiana Sea Grant Program: Urbana, IL, USA, 1997. [Google Scholar]
  31. Brys, R.; Halfmaerten, D.; Neyrinck, S.; Mauvisseau, Q.; Auwerx, J.; Sweet, M.; Mergeay, J. Reliable eDNA detection and quantification of the European weather loach (Misgurnus fossilis). J. Fish Biol. 2021, 98, 399–414. [Google Scholar] [CrossRef]
  32. Wood, S.A.; Pochon, X.; Laroche, O.; von Ammon, U.; Adamson, J.; Zaiko, A. A comparison of droplet digital polymerase chain reaction (PCR), quantitative PCR and metabarcoding for species-specific detection in environmental DNA. Mol. Ecol. Resour. 2019, 19, 1407–1419. [Google Scholar] [CrossRef]
  33. van Bleijswijk, J.D.L.; Engelmann, J.C.; Klunder, L.; Witte, H.J.; Witte, J.I.J.; van der Veer, H.W. Analysis of a coastal North Sea fish community: Comparison of aquatic environmental DNA concentrations to fish catches. Environ. DNA 2020, 2, 429–445. [Google Scholar] [CrossRef]
  34. Penaluna, B.E.; Allen, J.M.; Arismendi, I.; Levi, T.; Garcia, T.S.; Walter, J.K. Better boundaries: Identifying the upper extent of fish distributions in forested streams using eDNA and electrofishing. Ecosphere 2021, 12, e03332. [Google Scholar] [CrossRef]
  35. De Souza, L.S.; Godwin, J.C.; Renshaw, M.A.; Larson, E. Environmental DNA (eDNA) detection probability is influenced by seasonal activity of organisms. PLoS ONE 2016, 11, e0165273. [Google Scholar] [CrossRef] [PubMed]
  36. Takahashi, M.K.; Meyer, M.J.; McPhee, C.; Gaston, J.R.; Venesky, M.D.; Case, B.F. Seasonal and diel signature of eastern hellbender environmental DNA. J. Wildl. Manag. 2018, 82, 217–225. [Google Scholar] [CrossRef]
  37. Bedwell, M.E.; Goldberg, C.S. Spatial and temporal patterns of environmental DNA detection to inform sampling protocols in lentic and lotic systems. Ecol. Evol. 2020, 10, 1602–1612. [Google Scholar] [CrossRef] [PubMed]
  38. Buxton, A.S.; Groombridge, J.J.; Zakaria, N.B.; Griffiths, R.A. Seasonal variation in environmental DNA in relation to population size and environmental factors. Sci. Rep. 2017, 7, 46294. [Google Scholar] [CrossRef]
  39. Laramie, M.B.; Pilliod, D.S.; Goldberg, C.S. Characterizing the distribution of an endangered salmonid using environmental DNA analysis. Biol. Conserv. 2015, 183, 29–37. [Google Scholar] [CrossRef]
  40. Erickson, R.A.; Merkes, C.M.; Jackson, C.A.; Goforth, R.R.; Amberg, J.J. Seasonal trends in eDNA detection and occupancy of bigheaded carps. J. Great Lakes Res. 2017, 43, 762–770. [Google Scholar] [CrossRef]
  41. Tsuji, S.; Shibata, N. Identifying spawning events in fish by observing a spike in environmental DNA concentration after spawning. Environ. DNA 2021, 3, 190–199. [Google Scholar] [CrossRef]
Figure 1. Locations surveyed in 2017 and 2018 for round goby (Neogobius melanostomus) using environmental DNA (eDNA) sampling, bottom trawling, and hook and line angling.
Fishes 08 00041 g001
Figure 2. Round goby (Neogobius melanostomus) environmental DNA (eDNA) concentrations (log10 copy number per microliter (CN/µL)) by droplet digital PCR (ddPCR) and quantitative PCR (qPCR) for Lake Huron and Lake Michigan water samples (n = 189).
Fishes 08 00041 g002
Figure 3. Seasonal mean round goby (Neogobius melanostomus) environmental DNA (eDNA) concentrations (log10 copy number per liter (CN/L)) ± standard error (SE) in water samples collected at the Lake Michigan breakwalls and analyzed using quantitative PCR (qPCR) and droplet digital PCR (ddPCR). Black plus signs indicate corresponding hook and line angling.
Fishes 08 00041 g003
Figure 4. Round goby (Neogobius melanostomus) abundance estimates by trawl (number of fish per hectare), quantitative PCR (qPCR) and droplet digital PCR (ddPCR) (mean copy numbers per liter (CN/L)). Values are log10 transformed. Bars for “Sept” represent sampling in Lake Michigan and all other bars represent samples in Lake Huron. On the x-axis, there are months: Aug = August, Sept = September, Oct = October; depths: 8–83 m, “a” and “b” represent different sites at the same depth. Two records, outlined in red, represent instances where eDNA water samples were collected four days after trawls.
Fishes 08 00041 g004
Figure 5. Round goby (Neogobius melanostomus) eDNA concentrations (log10 copy numbers per liter (CN/L)) detected by quantitative PCR (qPCR, top) and droplet digital PCR (ddPCR, bottom) at different depths in Lake Huron and Michigan. Lines represent linear fit with 95% confidence intervals.
Fishes 08 00041 g005
Table 1. Summary of the number of samples (N) by traditional monitoring, trawl and angling, and environmental DNA (eDNA) sampling in Lakes Huron and Michigan in 2017–2018. * Exact coordinates for all sampling sites are included in a U.S. Geological Survey data release [24].
LakePort/Site *Month, YearTraditional Monitoring and eDNA Sampling
Depth
(Meters)
Trawl/Angling
N
eDNA
N
Trawling
HuronAlpena, MIApril, 20178, 9, 15, 21, 28, 29, 42, 56, 66, 831020
Alpena, MIApril, 20172, 3, 4, 5, 6, 7, 50015
Alpena, MIAugust, 20178, 9, 20, 40, 46, 65612
Alpena, MIAugust, 20172, 3, 4, 5, 6016
Good Harbor, MIOctober, 201718, 27, 37, 46, 55, 64, 73714
MichiganZion, ILSeptember, 20189, 18, 2736
Angling
MichiganPortage Lakefront, INSeptember, 20171.5–226
October, 20171.5–226
September–December (2017), February, May (2018)1.5–2060
Washington Park, INSeptember, 20171.5–226
September, 20171.5–2010
Disclaimer/Publisher’s Note: The statements, opinions and data contained in all publications are solely those of the individual author(s) and contributor(s) and not of MDPI and/or the editor(s). MDPI and/or the editor(s) disclaim responsibility for any injury to people or property resulting from any ideas, methods, instructions or products referred to in the content.

