Abstract
To reveal the changes in the gut microbiota of yellow catfish after being infected by Edwardsiella ictaluri, 16S rRNA gene high-throughput sequencing technology was used to analyze the microbial composition and diversity of the healthy and diseased yellow catfish. The gut microbial richness and diversity of the diseased fish were significantly lower than those of healthy fish. The composition and predicted function of yellow catfish gut microbiota were drastically altered after infection by E. ictaluri. Fusobacteriota, Proteobacteria, and Firmicutes were the predominant bacterial phyla in the gut of the healthy fish, while Proteobacteria was the dominant phylum in the gut of the diseased fish. At the genus level, the gut of healthy fish was dominated by Cetobacterium, Plesiomonas, and Romboutsia, while the gut of diseased fish was overwhelmed by the pathogenic E. ictaluri (99.22 ± 0.85%), and Cetobacterium, Plesiomonas, and Romboutsia disappeared. This is the most characteristic feature of the intestinal microbiota composition of yellow catfish edwardsiellosis. The same sequence of E. ictaluri was detected in the intestine of the healthy fish and the liver and intestine of the diseased fish. The anaerobic and Gram-positive bacteria were significantly decreased, and the digestive system, immune system, and metabolic functions of the gut microbiota were significantly reduced in the diseased fish gut. This may be part of the pathogenesis of fish edwardsiellosis.
1. Introduction
The animal gut is a complex ecosystem in which a large number of microorganisms live, such as eukaryotic microorganisms, bacteria, archaea, and viruses [,]. After millions of years of coevolution, the symbiotic microbiota has become an integral component of the host and plays an important role in nutrient absorption, immune response, metabolism, development, and physiology, and they are even regarded as additional organs in fish [,]. Symbiotic microbiota, which is closely related to the gut, works together to maintain the balance of the gut ecosystem by interacting with the host. However, the composition and proportion of symbiotic microbiota are affected by various factors, which include diet, different growth stages, growth environment, and health status [,,]. In addition, the gut can harbor opportunistic pathogens, and their overgrowth may cause intestinal dysbiosis, and the intestine is considered to be the primary entry route for pathogens [,]. With the wide application of high-throughput sequencing, the relationship between fish gut microbiota with the host has attracted more and more attention, becoming a popular field. Research on the relationship between fish gut microbiota and disease has quickly increased [,,].
Edwardsiella ictaluri (E. ictaluri), a Gram-negative rod-shaped bacterium belonging to the family Enterobacteriaceae, is the opportunistic pathogen of many aquatic animals []. It can cause enteric septicemia in channel catfish (ESC) and can also infect fish such as yellow catfish, zebrafish, tilapia, and others [,,]. The bacteria can cause acute sepsis or chronic encephalitis in infected fish [], with outbreaks usually in spring and autumn. The fish infectious diseases caused by E. ictaluri have the characteristics of a wide epidemic area, high morbidity, and mortality []. The mortality rate can reach 50–90%, causing great economic losses to the aquaculture industry [].
Yellow catfish (Tachysurus fulvidraco) is a species of order Siluriformes, family Bagridae, genus Pelteobagrus []. Yellow catfish is a commercially important freshwater fish that is generally distributed and cultured in Southeast Asian countries and especially in China []. Yellow catfish has the advantages of a short growth cycle, delicious taste, and high economic benefits; thus, it is favored by farmers [,]. In 2021, the production of yellow catfish in China reached 565,000 tons. However, with the increase in the scale of yellow catfish farming, the increase in stocking density, and the continuous deterioration of the farming environment, the outbreak of yellow catfish diseases has become more and more frequent. Among these diseases, the enteric septicemia of catfish (ESC) caused by E. ictaluri was particularly common and serious, which brought huge economic losses to farmers. Therefore, understanding the characteristics of the gut microbiota of yellow catfish infected with E. ictaluri is necessary to understand the pathogenesis of this disease.
Therefore, in this study, the high-throughput sequencing technique was used to compare the intestinal microbiota of healthy and Edwardsiella ictaluri infected yellow catfish to obtain the changes and characteristics of the intestinal microbiota of the infected fish, to identify the possible pathogenesis of the disease, and to provide measures from the intestinal microbiological perspective for the prevention and treatment of the disease.
2. Materials and Methods
2.1. Sample Collection and Processing
In June 2021, a serious disease occurred in yellowtail fish farmed on a farm in Jingzhou city, Hubei province, and based on the symptoms, it was initially determined to be edwardsiellosis. In this yellow catfish farm, the two adjacent ponds had the same fish fry source, water source, feed, and management mode. During this epidemic, all diseased yellow catfish showed similar symptoms, the specific manifestations were reduced appetite, lethargy in response, lack of energy, listless swimming on the surface with a “head up, tail down” posture, sometimes spiraling or occasional rapid swimming, ulcerative bleeding from multiple sites throughout the body, numerous petechial hemorrhages were found on the liver and intestine, and accumulation of ascites in the abdomen. Six yellow catfish with the above symptoms were randomly captured from the diseased pond, and three yellow catfish were randomly captured from the healthy pond. All collected yellow catfish were at the same growth stage with similar sizes with an average weight of 65.1 ± 2.1 g. The water samples were taken from the diseased pond and the healthy pond (marked as W1, W2), and all samples were brought back to the laboratory as soon as possible in an ice incubator.
Before dissection for bacterial isolation and intestine sample collection, all fish were euthanized with an overdose of MS 222 (Sigma, Darmstadt, Germany). All procedures for handling and euthanasia of fish were performed according to the procedure described by Roeselers, et al. []. First, the conventional techniques were used for further examination, the diseased fish all had the above typical symptoms, while healthy fish had no visible symptoms on the surface and their intestines were full of food. Bacterial isolation from the liver of fish was first performed using conventional techniques. Then, the intestine was taken out and placed in a sterile petri dish. The intestine was longitudinally cut with flame sterilized scissors and then gently rinsed three times with sterile PBS to ensure that the adhered chyme was removed. The intestines were cut into pieces and placed in a 2 mL sterile centrifuge tube, one sample tube for one fish, and stored at −80 °C for later use. The three healthy fish intestine samples were marked as H1-H3, and six diseased fish intestine samples were marked as D1-D6. Water samples from two ponds were filtered through 0.22 μm hydrophilic polyethersulfone membrane filters (47 mm diameter, Pall, Lane Cove, Australia). The filtered membrane was placed in the sample bag and stored at −80 °C for later use. There were 11 samples in total, including 3 healthy fish intestine samples, 6 diseased fish intestine samples, 1 healthy fishpond water sample, and 1 diseased fish pond water sample.
2.2. Isolation, Identification, and MIC Determination of Bacteria
The liver tissue samples were inoculated in Brain Heart Infusing Agar (BHI, Merck, Darmstadt, Germany) and inverted in an incubator at 28 °C for 48 h. Three single colonies were selected from each plate to prepare a bacterial suspension that would serve as the template of PCR amplification; universal primer pair 27F (5′-AGAGTTTGATCCTGGCTCAG-3′2032) and 1492R (5′-GGTTACCTTGTTACGACTT-3′) were used for PCR amplification of 16S rRNA gene. The PCR amplification conditions were as follows: 94 °C for 5 min at pretreatment and 30 cycles of 94 °C for 30 s, 55 °C for 30 s, and 72 °C for 90 s, with a final extension at 72 °C for 10 min. Purification and sequencing of the PCR products were commercially conducted by Wuhan Aikangjian Biotechnology Co., Ltd. (Wuhan, China). Sequence homology analysis was performed using the sequence match in Nucleotide BLAST (https://blast.ncbi.nlm.nih.gov/, 27 April 2022) and RDP (http://rdp.cme.msu.edu/, 27 April 2022).
Minimum inhibitory concentration (MIC) measurement was performed using a commercial 96-well MIC assay plate (Tianjin Jinzhang Science and Technology Development Co., Ltd., Tianjin, China). The assay plate was loaded with lyophilized drug powders, and the drug concentration gradient was prepared by the double dilution method. The assay plates were manufactured in full compliance with the relevant CLSI protocols [,]. Eight test drugs were tested in each assay plate, and their names, category, and concentration ranges were as follows: trimethoprim-sulfamethoxazole (TMP/SMZ) (sulfonamides) (0.062/1.187–64/1216 μg/mL), erythromycin (macrolides) (0.125–256 μg/mL), doxycycline (tetracyclines) (0.062–128 μg/mL), neomycin (aminoglycosides) (0.062–256 μg/mL), colistin (polypeptides) (0.062–256 μg/mL), florfenicol (chloramphenicol) (0.062–256 μg/mL), enrofloxacin (fluoroquinolones) (0.008–64 μg/mL), and ceftazidime (cephalosporins) (0.016–128 μg/mL). These drugs contain the most commonly used species in Chinese aquaculture. Three replicates were performed for each strain, and negative control and positive control were set. The quality control strain used was Escherichia coli ATCC 25922, incubated at 28 °C for 24–28 h. The specific experimental approach was referenced by Lin et al. [].
2.3. DNA Extraction and Purification
First, 50 mg of chopped intestine samples was taken from the stored sample tubes, and the intestinal mucosal microbiota DNA was extracted according to the instructions of the QIAamp® DNA Blood & Tissue Kit (Qiagen, Hilden, NRW, Germany), and stored in a −20 °C refrigerator for later use.
2.4. 16S rRNA Gene High-Throughput Sequencing
The V3-V4 hypervariable regions of the bacterial 16S rRNA gene were amplified using primers 338F (5′-ACTCCTACGGGAGGCAGCAG-3′) and 806R (5′-GGACTACHVGGGTWTCTAAT-3′). PCR was performed in a triplicate 20μL mixture containing 4 μL of 5× FastPfu Buffer, 2 μL of 2.5 mM dNTPs, 0.8 μL of each primer (5 μM), 0.2 μL of FastPfu Polymerase, 0.2 μL of BSA,10 ng of template DNA, and sterile water added up to 20 μL. The PCR amplification conditions were as follows: 95 °C for 3 min at pretreatment and 30 cycles of 95 °C for 30 s, 55 °C for 30 s, and 72 °C for 45 s, with a final extension at 72 °C for 10 min []. The PCR products were re-extracted from 1% agarose gel and purified by using the AxyPrep DNA Gel Extraction Kit (Axygen Biosciences, Union City, CA, USA), and quantified using the QuantiFluorTM-ST (Promega, WI, USA) following the manufacturer’s protocol. All the samples were sequenced on the Illumina MiSeq PE300 platform (Illumina, San Diego, CA, USA) at Majorbio BioPharm Technology Co., Ltd. (Shanghai, China).
2.5. Sequencing Data Processing
The paired-end reads from the raw DNA fragments were merged by FLASH software, quality-filtered by trimmomatic, and merged by FLASH with the following criteria: (1) The 300 bp reads were truncated at any site receiving an average quality score of <20 over a 50 bp sliding window, and then, the truncated reads that were shorter than 50 bp were discarded; reads containing N-bases were also removed. (2) The minimum overlap length was 10 bp, and the pair-end reads were combined into a sequence according to their relationship of overlap. (3) Samples were separated according to the barcode and primers, the sequence direction was adjusted and the exact barcode matched, with two nucleotide mismatches in the primer matching.
Operational taxonomic units (OTUs) with 97% similarity [] cutoff [] were clustered using UPARSE (http://drive5.com/uparse/, 27 April 2022) version 7.0 [], and chimeric sequences were identified and removed. The taxonomy of each OTU representative sequence was analyzed by RDP Classifier (http://rdp.cme.msu.edu/, 27 April 2022) version 2.2 [] against the Bacterial Silva 16S rRNA database (SILVA SSU 138).
2.6. Bioinformatics and Statistical Analysis
The sequence data were randomly resampled to 31,458 reads based on the minimum number of sequences. The alpha diversities, including Chao1 and Ace richness indices, Simpson and Shannon diversity indices, and Good’s coverage, were calculated based on OTUs, and beta diversity was analyzed using ANOSIM and PCoA based on the Bray–Curtis metric []. The linear discriminant analysis (LDA) effect size (LEfSe) is an algorithm for high-dimensional biomarker discovery and explanation that identifies genomic features that describe differences between two or more biological conditions (or groups) []. In this study, we used LEfSe analysis to identify differences in intestinal microbiota function and microbial biomarkers with the alpha parameter of 0.05. The difference between the two independent groups was tested by Student’s t test, and the p value was corrected by the Bonferroni method. The phylogenetic investigation of communities by reconstruction of unobserved states (PICRUSt) is extensively used to predict microbial functions and metabolic pathways []. PICRUSt2 predictions are based on several gene family databases, including the Kyoto Encyclopedia of Genes and Genomes (KEGG) homology and Enzyme Committee numbers, and PICRUSt2 provides greater accuracy and flexibility for metagenomic extrapolation of marker genes than PICRUSt1 []. In this study, we used PICRUSt2 in the KEGG pathway to predict the functional spectrum of the bacterial community. The accuracy of functional predictions was assessed by calculating the nearest sequenced taxon index (NSTI), which decreased with increasing NSTI value []. The microbial function was statistically analyzed using the metagenomics profiles statistical analysis method []. Data were performed as mean and standard deviation (mean ± SD, n = 4), and the significance level of the difference was set at 0.05. Bacterial phenotype prediction was performed using the Bugbase database, and differences between groups were analyzed []. In each significance test, the significance level of the difference was set at 0.05 or 0.001.
3. Results
3.1. Pathogenic Bacteria Identification and Mic Determination Results
No bacteria were isolated from the liver tissues of three healthy yellow catfish, while colonies with consistent morphology and size were formed after streaking the liver tissues of six diseased yellow catfish on BHI media. Three strains were randomly selected from the medium of each diseased fish, and a total of eighteen strains were selected and used to be amplified for the 16S rRNA gene by PCR technology. The fragments with the expected size of about 1500 bp were obtained and sequenced. The 18 strains isolated from the liver were all confirmed to be E. ictaluri by sequence blast of the 16S rRNA gene and Nucleotide BLAST sequence matching, and the sequence similarity of these strains was 100% with E. ictaluri ATCC33202. In addition, the 16S rRNA gene sequence of the liver isolate was 100% matched with the 16S rRNA gene sequence of E. ictaluri from the intestine samples detected in high-throughput sequencing.
The antimicrobial susceptibility test (AST) was performed on six strains of E. ictaluri isolated from the liver. The results showed that these strains were sensitive to TMP/ trimethoprim-sulfamethoxazole, doxycycline, neomycin, florfenicol, enrofloxacin, and ceftazidime in the eight antimicrobial agents tested, the MIC ranges were: ≤0.0625/1.1875, 0.25–0.5, 0.25–0.5, ≤0.125, 0.015625 and 0.015625–0.03125 μg/mL; however, it was resistant to erythromycin and polymyxin, and its MIC ranges were: 4–16 and 16–32 μg/mL.
3.2. Diversity and Structure of Microbial Communities
After quality filtration, a total of 461,153 effective sequences were obtained from 11 samples. Good’s coverage showed that more than 99% of the bacterial species in the samples were detected (Table S1), and the rarefaction curves tended to approach the saturation plateau, indicating that most of the diversity had already been discovered (Figure S1A,B). Each sample contained 41 to 477 OTUs (Table S1). The microbial complexity of the gut and water samples was estimated using alpha-diversity indices of the taxonomic profiles at the 97% similarity threshold (Table S1). The bacterial community diversity was measured by the Shannon and Simpson indices (Figure 1B,C), and the results showed that the intestinal microbiota diversity in the healthy group was significantly higher than that in the diseased group (Student’s t test, p < 0.001). The total number of OTUs and the richness in the two groups were estimated with Chao1 and Ace (Figure 1A,D), which were significantly higher in the healthy group than in the diseased group (Student’s t test, p < 0.001).
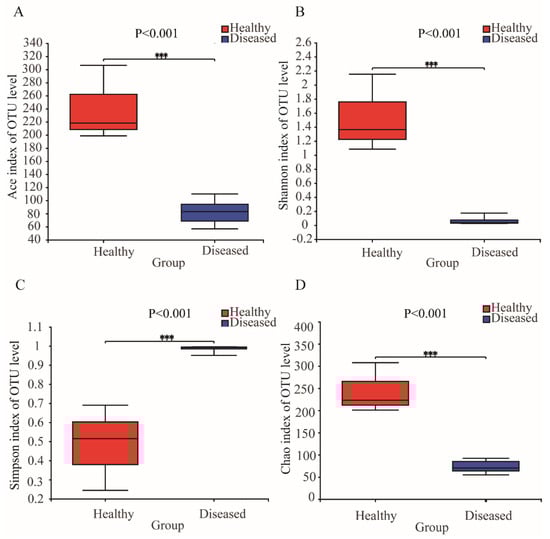
Figure 1.
(A) Comparison of the Ace index of the bacterial communities in the healthy and diseased fish; (B) comparison of the Shannon index of the bacterial communities in the healthy and diseased fish; (C)comparison of the Simpson index of the bacterial communities in the healthy and diseased fish; (D)comparison of the Chao index of the bacterial communities in the healthy and diseased fish. Statistical significances between the two groups were considered at *** p < 0.001 by Student’s t test.
Multivariate statistical analyses were conducted to compare the structure of bacterial communities in the gut and water. The ANOSIM revealed a significant difference (R = 0.86, p = 0.001) in the structure of bacterial communities among the three groups (healthy fish, diseased fish, and water samples) (Table 1). Further ANOSIM revealed significant differences (p < 0.05) in bacterial community structures between the diseased group and the healthy group, as well as the water sample group, but there was no significant difference (p > 0.05) between the healthy group and the water sample (Table 1). The principal coordinate analysis (PCoA) based on the Bray–Curtis distance algorithm was used to compare the bacterial community structures of healthy fish, diseased fish, and water samples. The PCoA plot showed that the bacterial communities among the samples from diseased fish were tightly clustered but were distinct from the clusters corresponding to the healthy fish and the water sample along PC1 (58.22% variation explained, Figure 2A). PCoA explained 86.50% variation in bacterial communities of all samples at two principal coordinates (Figure 2A). The hierarchical clustering tree on the OTU level disclosed that the bacterial communities in the healthy intestines clustered into one branch first and then clustered with the water samples, whereas the bacterial communities in the diseased intestines clustered together into another branch (Figure 2B). These results suggested that E. ictaluri infection caused significant changes in the gut microbiota structure of yellow catfish.

Table 1.
Analysis of similarity (ANOSIM) of the structure and function of the bacterial communities among three groups. R is assessed by permuting the grouping vector to obtain the empirical distribution of R under the null model; a p value less than 0.05 means significant.
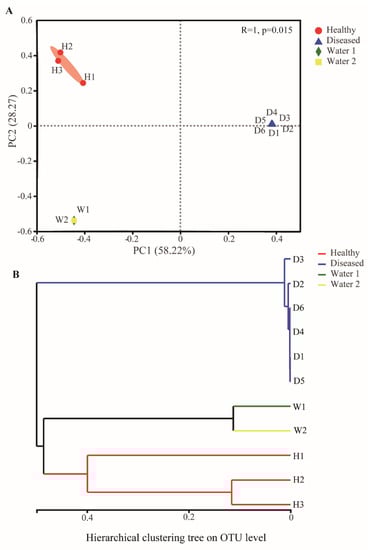
Figure 2.
Analysis of the bacterial community structure in different groups. (A) Principal coordinate analysis based on the Bray–Curtis metric of the bacterial communities in the intestine and water. (B) The hierarchical clustering tree based on Bray–Curtis metric of the bacterial communities in the intestine and water.
3.3. Taxonomic Composition of Gut Microbiota
The distribution of OTUs at the phylum level in healthy and diseased fish is shown in Table 2. The phylogenetic classification of the sequences from all samples resulted in the identification of 27 phyla, of which 25 were in the healthy group and 14 were in the diseased group. Relative abundances lower than 1% were assigned as “Other phyla”. The bacterial composition of the two fish groups was significantly different at the phylum level, and the dominant phyla in the healthy group were Fusobacteriota (54.81 ± 38.44%), Proteobacteria (24.18 ± 33.73%), Firmicutes (17.38 ± 7.83%) and cyanobacteria (1.32 ± 0.58%). The remaining phyla (average relative abundance < 1%) included Bacteroidota (0.71 ± 0.47%), Actinobacteria (0.63 ± 0.5%), and Spirochaetota (0.4 ± 0.6%). Proteobacteria (99.6 ± 0.18%) was dominant in the diseased group, Bacteroidota (0.09% ± 0.04) and other phyla (0.03 ± 0.03%) occupied only a small proportion. This indicated that the composition of the intestinal microbiota of yellow catfish was significantly changed after E. ictaluri infection, and most commensal bacteria disappeared.
Table 2.
Relative abundance of the bacterial phyla in the intestinal microbiota of the two fish groups.
At the genus level, a total of 358 genera were identified. All 332 genera appeared in the healthy group, and only 87 genera were identified in the diseased group. Relative abundances lower than 1% were assigned as “Other genera” (Figure 3A). Cetobacterium (54.81 ± 38.44%) was the dominant phylotype in the healthy group, followed by Plesiomonas (16.80 ± 24.01%), Aeromonas (4.96 ± 8.57%), Romboutsia (3.93 ± 6.05%), Clostridium (3.71 ± 4.2%), Mycoplasma (3.36 ± 1.69%), Candidatus (1.92 ± 3.25%), Streptococcus (1.43 ± 0.81%), unclassified_Clostridiaceae (1.26 ± 2.03%) and other genera (6.94 ± 1.68%). The remaining genera included Edwardsiella (0.03 ± 0.03%), Cyanobium_PCC-6307 (0.49 ± 0.83%), and genera in unclassified_Spirochaetaceae (0.36 ± 0.63%). It can be seen that Edwardsiella only occupies a small proportion of the healthy fish intestine microbiota. The relative abundance of Edwardsiella reached up to 99.22 ± 0.85% in the diseased group. In addition, Streptococcus (0.03 ± 0.07%) and other genera (0.72 ± 0.86%) were also found but only occupied a relatively small proportion. The results of abundance analysis of intestinal microbiota at the genus level showed that the composition of the intestinal microbiota of yellow catfish changed significantly after infection and was almost completely occupied by Edwardsiella ictaluri.
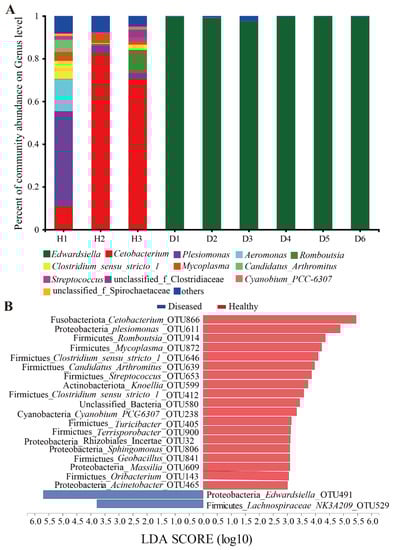
Figure 3.
(A) Composition of the bacterial communities at the genus level in the intestinal microbiota of the sampled yellow catfish. (B) LEfSe identified the most differentially abundant OTUs in the intestinal microbiota of the healthy and the diseased yellow catfish. H1~H3: healthy fish; D1~-D6: diseased fish.
3.4. Differential Analysis of Gut Microbiota between Healthy and Diseased Fish
The Venn diagram (Figure S2) showed that there were a total of 519 OTUs in the gut of the healthy yellow catfish, and 149 OTUs were detected in the gut of the diseased group, which was 370 OTUs less than that in the healthy group. There were 61 unique OTUs, and 431 OTUs disappeared in the diseased group when compared with that in the healthy group. In total, 88 OTUs were shared by the two groups of yellow catfish. Further analysis found that the five OTUs with higher abundance in the healthy group were Cetobacterium_OTU866, Plesiomonas_OTU611, Aeromonas_OTU570, Romboutsia_OTU914, and Mycoplasma_OTU872. Edwardsiella_OTU491 was overrepresented in the gut of diseased fish, while the abundances of Streptococcus_OTU653 (0.03 ± 0.059%), Clostridiaceae_OTU930 (0.016 ± 0.015%), Mycoplasma_OTU872 (0.0081 ± 0.017%) and Aeromonas_OTU570 (0.0027 ± 0.0056%) were extremely reduced, especially the genus of Cetobacterium_OTU866, which was the most abundant in the healthy group and almost disappeared in the diseased fish.
LEfSe analysis showed that a total of 19 OTUs were significantly higher in healthy fish, with Cetobacterium_OTU866, Plesiomonas_OTU611, Romboutsia_OTU914, and Mycoplasma_OTU872 being the most prominent. Conversely, only Edwardsiella_OTU491 and Lachnospiraceae_NK3A20_group_OTU529 were abundant in the diseased fish (LDA > 3, p < 0.05, Figure 3B).
Compared to the healthy fish, microbial communities in the diseased fish had a less complex network with fewer edges (Figure 4A,B). The network has 2204 edges in the gut of healthy fish, and the keystone taxa Cetobacterium_OTU866 has 45 edges; among them, the positive correlation was 35.56% and the negative correlation was 64.44%. The network has 1436 edges in the gut of diseased fish, and the keystone taxa Edwardsiella_OTU491 has 24 edges; among them, the positive correlation was 29.17%, and the negative correlation was 70.83%.
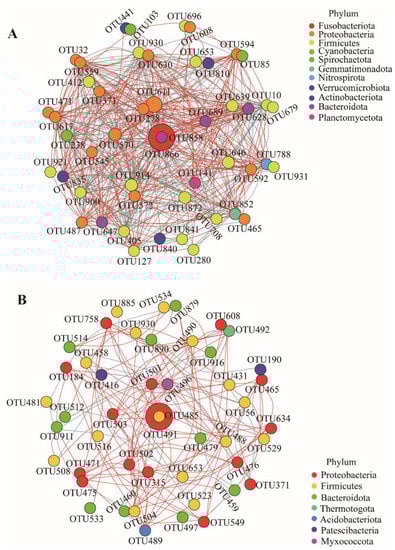
Figure 4.
Networks of co-occurring bacterial OTUs of the healthy and diseased groups (Top 50% relative abundance). Only Spearman’s correlation coefficient (r > 0.4 or r < −0.4) is shown. The nodes are colored according to phyla. Red edges represent positive correlations, and blue edges represent negative correlations. Node size is the relative abundance of each OTU, and edge thickness is proportional to the weight of each correlation. (A) healthy group, (B) diseased group.
3.5. Functional and Phenotypic Prediction of Gut Microbiota
The presumptive function of gut microbiota was examined using PICRUSt2, and prediction accuracy was measured by NSTI values, with lower NSTI values indicating higher prediction accuracy. For reference, the NSTI value corresponding to the Human Microbiome Project with the highest functional prediction accuracy was 0.03 ± 0.02, and the NSTI value corresponding to the hypersaline mat microbiome with the lowest prediction accuracy was 0.23 ± 0.07 []. The NSTI value of all yellow catfish intestine samples obtained in this study was 0.01 ± 0.01, indicating that PICRUSt2 has high accuracy in predicting the microbial function of the yellow catfish intestinal microbiota, and the function prediction results of this study were reliable. In addition, the results of the ANOSIM analysis showed (Table 1) that there were significant differences in the microbial functions of the intestinal microbiota between the healthy and diseased groups (R = 1, p = 0.017). The results of functional prediction showed that at KEEG level 1, the function of gut microbiota involved in metabolism was significantly reduced in the diseased group compared with the healthy group (Figure 5A). As shown in Figure 5B, the microbial function involved in metabolism at KEGG level 3 in the diseased group was significantly enriched in some metabolic pathways such as galactose metabolism, pentose and glucuronate interconversions, glycine, serine, tyrosine, and threonine metabolism, and sulfur metabolism, compared to the healthy group (LDA > 3, p < 0.05). The functions in the metabolism of terpenoids and polyketides, starch and sucrose metabolism, carbon metabolism, nucleotide metabolism, fatty acid metabolism, polyketide sugar unit biosynthesis, cysteine, and methionine metabolism, lysine biosynthesis, and streptomycin biosynthesis were significantly reduced in the diseased fish. In addition, compared with the healthy group, the diseased group had significantly reduced microbial functions related to the immune system, digestive system, cell growth, death, and other genetic information processing, while in environmental information processing, signal transduction, membrane transport, human diseases, and bacterial infectious diseases were significantly enriched (Figure 5C, LDA > 2, p < 0.05).
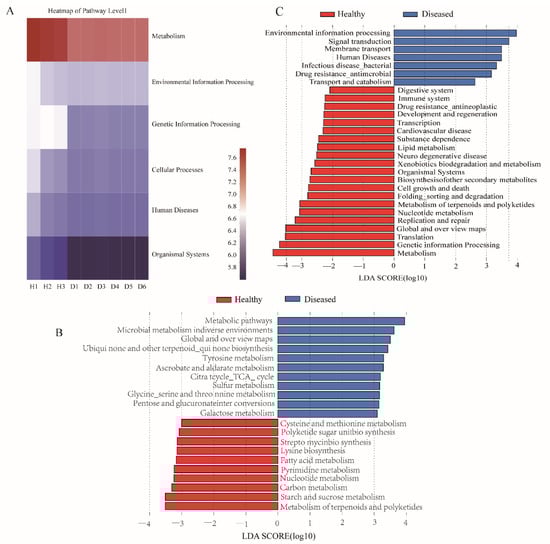
Figure 5.
Differences in the predicted functions of the intestinal microbiota between the healthy and diseased groups. (A) Heatmap showing the main of pathway level 1. (B) LEfSe determined differences in metabolism of the intestinal microbiota between the healthy and diseased groups. (C) LEfSe determined differences in pathway level 2 of the intestinal microbiota between the healthy and diseased groups.
To further explore the differential changes in the intestinal microbial microbiota of yellow catfish in the two fish groups, we predicted the bacterial phenotype using the Bugbase algorithm (Figure 6) and explored whether the disease would affect the phenotype of the intestinal microbial. The results showed that there was a higher abundance of anaerobic and Gram-positive bacteria in the healthy fish intestine, while the abundance of these two groups of bacteria was significantly lower in the intestine of the diseased fish; the abundance of bacteria with strong pathogenicity, strong biofilm-forming ability, and rich mobile elements increased in the intestinal microbiota of the diseased fish.
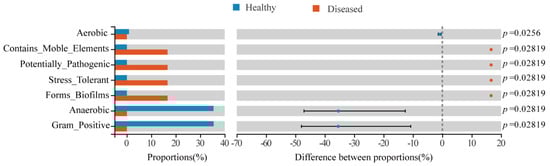
Figure 6.
Differences in the predicted phenotypes of the intestinal microbiota between the healthy and diseased fish groups.
4. Discussion
ESC is known as E. ictaluri infection, hole-in-the-head disease []. Although it is uncertain whether the intestine is the initial site of infection for this disease, it is agreed that the intestinal tract is the primary site of infection for acute septicemia, which is why it is named enteric septicemia of catfish [,]. The disease is thought to be transmitted horizontally through the fecal–oral route, ingestion of diseased fish, and contact with water contaminated with the pathogen, with feces being the main source of pathogen excretion and transmission []. Therefore, understanding the gut microbiota characteristics of ESC catfish is necessary to understand the pathogenesis of this disease. Studying the relationship between intestinal microbiota and disease is beneficial for understanding the pathogenic process of this pathogenic bacteria, understanding how intestinal microbiota affects host health, and providing the theoretical basis for developing effective measures to prevent or treat the disease. Therefore, this study was the first to investigate the correlation between the occurrence of enteric sepsis and the characteristics of the intestinal microbiota in catfish.
Given that the relative abundance of Edwardsiella in the intestine of the diseased yellow catfish accounted for up to 99.22%, coupled with the obvious symptoms of enteritis and other symptoms typical of ESC [], as well as what we learned during the follow-up visit such that the condition of yellow catfish improved significantly after treatment with antibiotics such as florfenicol and that antibiotic treatment was also a common method of treating this disease locally, whether a fish is infected with parasites is the first and easiest thing to determine. All of these have fully demonstrated that the epidemic was caused solely by E. ictaluri infection rather than by viruses or parasites.
Through sequence matching, the sequence of Edwardsiella from the intestine was 100% the same as that of E. ictaluri obtained from the liver. It indicated that E. ictaluri in the intestine and liver belonged to the same clone and came from the same source. In addition, a proportion of Edwardsiella_OTU491 bacteria was detected in the intestines of healthy and diseased fish, such that these so-called healthy fish are relatively healthy and may be in the initial stages of infection. This is indirect evidence that ESC starts with intestinal infections. This situation is similar to MAS (motile aeromonad septicemia) in carp caused by Aeromonas hydrophila []. This result may provide some cues to understanding the route of E. ictaluri infection in catfish.
The data from this study showed that the intestinal microbiota structure of the ESC fish was severely disrupted, and the alpha diversity was significantly reduced (Figure 1), with E. ictaluri occupying an absolute dominance of 99.22 ± 0.85%, which was the most typical feature of the intestinal microbiota structure of ESC catfish. The enrichment of Edwardsiella in the intestine was much higher than pathogenic bacteria found in other diseases. For example, the relative abundance of Aeromonassalmonicida in the intestine of largemouth bronze gudgeon with furunculosis was only 81% []; the relative abundance of Aeromonas in the gut of grass carp after artificial infection with Aeromonas veronii was about 42% []; the relative abundances of Streptococcus agalactiae and Aeromonas hydrophila in the zebrafish gut artificially infected with Streptococcus agalactiae and Aeromonas hydrophila were only 6.90% and 3.13% [,]. PCoA and ANOSIM analysis showed that there existed significant differences in intestinal microbiota between the diseased fish and the healthy fish (Figure 2A and Table 1). The Bray–Curtis distances among the samples from diseased individuals were significantly shorter, compared to those of individual fish from the healthy group. This also indicates that after infection, the catfish intestinal microbiota was almost fully occupied by the pathogenic bacteria, losing the diversity of the intestinal microbiota in a healthy state. In other words, the bacterial community associated with the intestine of healthy individuals was more diverse than that seen in the diseased fish. The PCoA and hierarchical clustering tree plot (Figure 2A,B) show that water samples from the diseased and healthy ponds clustered together, while the distance between the water samples and the healthy or diseased fish intestine samples was large, suggesting that the difference between the healthy and the diseased fish was not due to the water environment they were in, but was due to Edwardsiella infection. In addition, network analysis found that the correlations between the gut microbes after infection weakened and the network became simpler (Figure 4A,B). The invasion of pathogenic bacteria may start by weakening the original interaction relationship [], thereby breaking the intestinal balance.
The intestinal microbiota of the healthy fish was dominated by Cetobacterium, Plesiomonas, Aeromonas, Romboutsia, and Clostridium at the genus level [,]. The intestinal microbiota of healthy catfish was dominated by Cetobacterium, Plesiomonas, Aeromonas, Romboutsia, and Clostridium at the genus level, with Cetobacterium dominating (54.81%), which was almost absent in the diseased fish. Given that it has been shown that Cetobacterium can ferment peptides and carbohydrates [] and plays an important role in fish digestion and nutrition [] and that vitamin B12 produced by this bacterium is an intestinal microecological regulator that contributes to the stability of the intestinal microbiota [], it is suggested that the presence of this bacterium is extremely important for intestinal health and microbiota stability in yellow catfish, making Cetobacterium a potential probiotic for the fish.
The results of intestinal microbial function prediction (Figure 5B) showed that compared with the healthy group, the functions of carbon metabolism, amino acid metabolism, polyketide sugar unit biosynthesis, and metabolism of terpenoids and polyketides in the diseased group were significantly reduced or disappeared because the intestinal microbiota was overwhelmed by E. ictaluri, which did not have the above functions. In other words, these characteristics are completely consistent with the physicochemical characteristics of E. ictaluri reported in the literature [,]. The functional abundance of the digestion system in the diseased fish decreased significantly (Figure 5C), indicating that the disease affected the nutrition, digestion, and absorption functions of the intestinal microbiota; thus, the diseased fish lost their appetite in the early stage. The immune function of the intestinal microbiota of diseased fish was also significantly reduced because the normal symbiotic microbiota in the intestine could have acted as an immune barrier to prevent the invasion, growth, and colonization of pathogenic bacteria by secreting substances with antibacterial activity [,,], while the normal intestinal microbiota structure was severely disrupted after E. ictaluri infection, resulting in the disappearance of these barrier functions of symbiotic bacteria and thus the outbreak of the disease. In addition, PICRUSt2 analysis found that gut microbes in the diseased group had increased resistance to antimicrobial drugs (Figure 5C), which was also consistent with the AST assay results that E. ictaluri tested in this study was resistant to erythromycin and polymyxin, with MIC of 4–16 and 16–32 μg/mL, respectively. These results demonstrate that PICRUSt2 analysis based on 16S rRNA gene sequencing was very accurate in predicting gut microbiota function, and they corroborate with the view of Langille [] and Jovel []: PICRUSt gene pathway prediction of the gut microbiota based on 16S rRNA gene sequencing had very high similarity to pathway prediction by metagenomics sequencing. These functional predictions can provide a new perspective for elucidating the pathogenic mechanism of E. ictaluri.
The functional prediction analysis of the phenotypic characteristics of the microbiota using Bugbase found that there were higher abundances of anaerobic bacteria in the gut of healthy fish, which proved that anaerobic bacteria were important in intestinal health [,,]. On the contrary, because the intestinal tract of the diseased fish was overwhelmed by E. ictaluri, the pathogenicity, the ability to form biofilms, and the mobile genetic elements of the gut microbiota were significantly enhanced (Figure 6), which were also the phenotypic features of E. ictaluri. In turn, this suggests that yellow catfish have a weaker gut microbiota in terms of pathogenicity and biofilm formation in healthy states and that mobile genetic elements are not abundant in the genome.
5. Conclusions
In conclusion, this study describes for the first time the structural characteristics of the intestinal microbiota of yellow catfish with ESC and compares them with that of healthy yellow catfish. The main features of the disordered intestinal microbiota of ESC catfish are the high enrichment of Edwardsiella ictaluri and a significant decrease in the abundance of commensal bacteria, such as Cetobacteria. The relative abundance of Cetobacterium bacteria could be used as a potential health indicator for yellow catfish, while Cetobacterium or its metabolites such as vitamin B12 may also be used as probiotics or prebiotics for the prevention of E. ictaluri infection.
Supplementary Materials
The following supporting information can be downloaded at: https://www.mdpi.com/article/10.3390/fishes8010030/s1. Figure S1. Rarefaction analyses of OTUs clustered at 97% sequence identity of all samples: (A) Shannon curves on OTU level of the intestinal and water sample; (B) Rarefaction curves on OTU level of the intestinal and water sample. Figure S2. The Venn diagram shows the numbers of OTUs that were shared and unique in the gut communities (97% sequence identity); healthy and diseased represent the intestine samples of healthy and diseased fish. Table S1. Number of sequences analyzed, observed diversity richness (OTUs), estimated OTU richness (Chao1), the diversity index (Shannon and Simpson), and estimated sample coverage for 16S rRNA libraries of the different samples. H1~H3 stand for the intestine samples of the healthy fish, D1~D6 stand for the intestine samples of the diseased fish, and W1 and W2 for the water samples of diseased and healthy ponds, respectively.
Author Contributions
J.Y. performed the experiments, interpreted the data, and drafted the article; A.L. conceived and designed the experiments, and provided funding support for this research; Y.L. and Z.W. (Zhenbing Wu) provided help with bioinformatics analysis; Z.W. (Zhaohui Wei) and Q.Z. provided experimental convenience; J.H. and S.W. provided sampling and experimental assistance. All authors gave final approval for publication. All authors have read and agreed to the published version of the manuscript.
Funding
This study was financially supported by the National Natural Science Foundation of China (no. 32073023), the National Key Research and Development Program of China (no. 2020YFD0900300), and the Wuhan Science and Technology Project (no. 2019020701011480).
Institutional Review Board Statement
This project and protocol were approved by the Animal Ethical and Welfare Committee of the Institute of Hydrobiology, Chinese Academy of Sciences, China (approval number: IHBCAS-20210601). The animal use protocol also followed the National Institutes of Health guide for the care and use of laboratory animals.
Data Availability Statement
The raw sequencing data were deposited in the NCBI Sequence Read, archived under accession number PRJNA847360 (http://www.ncbi.nlm.nih.gov/sra).
Acknowledgments
We would like to acknowledge Shanghai Majorbio Bio-pharm Technology Co., Ltd., for providing the free online platform of Majorbio I-Sanger Cloud Platform (www.i-sanger.com) to analyze the raw data.
Conflicts of Interest
The authors declare no conflict of interest in this study.
References
- Bjorksten, B. The gut microbiota: A complex ecosystem. Clin. Exp. Allergy 2006, 36, 1215–1217. [Google Scholar] [CrossRef] [PubMed]
- Wang, A.R.; Ran, C.; Ringo, E.; Zhou, Z.G. Progress in fish gastrointestinal microbiota research. Rev. Aquac. 2018, 10, 626–640. [Google Scholar] [CrossRef]
- Wu, Z.; Wang, S.; Zhang, Q.; Hao, J.; Lin, Y.; Zhang, J.; Li, A. Assessing the intestinal bacterial community of farmed Nile tilapia (Oreochromis niloticus) by high-throughput absolute abundance quantification. Aquaculture 2020, 529, 735688. [Google Scholar] [CrossRef]
- Verner-Jeffreys, D.W.; Shields, R.J.; Bricknell, I.R.; Birkbeck, T.H. Changes in the gut-associated microflora during the development of Atlantic halibut (Hippoglossus hippoglossus L.) larvae in three British hatcheries. Aquaculture 2003, 219, 21–42. [Google Scholar] [CrossRef]
- Bikel, S.; Valdez-Lara, A.; Cornejo-Granados, F.; Rico, K.; Canizales-Quinteros, S.; Soberon, X.; Del Pozo-Yauner, L.; Ochoa-Leyva, A. Combining metagenomics, metatranscriptomics and viromics to explore novel microbial interactions: Towards a systems-level understanding of human microbiome. Comput. Struct. Biotechnol. J. 2015, 13, 390–401. [Google Scholar] [CrossRef]
- Ley, R.E.; Lozupone, C.A.; Hamady, M.; Knight, R.; Gordon, J.I. Worlds within worlds: Evolution of the vertebrate gut microbiota. Nat. Rev. Microbiol. 2008, 6, 776–788. [Google Scholar] [CrossRef]
- Schwab, C.; Cristescu, B.; Northrup, J.M.; Stenhouse, G.B.; Gaenzle, M. Diet and Environment Shape Fecal Bacterial Microbiota Composition and Enteric Pathogen Load of Grizzly Bears. PLoS ONE 2011, 6, e27905. [Google Scholar] [CrossRef]
- Ling, S.H.M.; Wang, X.H.; Lim, T.M.; Leung, K.Y. Green fluorescent protein-tagged Edwardsiella tarda reveals portal of entry in fish. Fems Microbiol. Lett. 2001, 194, 239–243. [Google Scholar] [CrossRef]
- Zhang, X.J.; Yang, W.M.; Zhang, D.F.; Li, T.T.; Gong, X.N.; Li, A.H. Does the gastrointestinal tract serve as the infectious route of Aeromonas hydrophila in crucian carp (Carassius carassius)? Aquac. Res. 2015, 46, 141–154. [Google Scholar] [CrossRef]
- Ringo, E.; Mikkelsen, H.; Kaino, T.; Olsen, R.E.; Mayhew, T.M.; Myklebust, R. Endocytosis of indigenous bacteria and cell damage caused by Vibrio anguillarum in the foregut and hindgut of spotted wolffish (Anarhichas minor Olafsen) fry: An electron microscopical study. Aquac. Res. 2006, 37, 647–651. [Google Scholar] [CrossRef]
- Li, T.T.; Long, M.; Ji, C.; Shen, Z.X.; Gatesoupe, F.J.; Zhang, X.J.; Zhang, Q.Q.; Zhang, L.L.; Zhao, Y.L.; Liu, X.H.; et al. Alterations of the gut microbiome of largemouth bronze gudgeon (Coreius guichenoti) suffering from furunculosis. Sci. Rep. 2016, 6, 30606. [Google Scholar] [CrossRef] [PubMed]
- Ringo, E.; Jutfelt, F.; Kanapathippillai, P.; Bakken, Y.; Sundell, K.; Glette, J.; Mayhew, T.M.; Myklebust, R.; Olsen, R.E. Damaging effect of the fish pathogen Aeromonas salmonicida ssp. Salmonicida on intestinal enterocytes of Atlantic salmon (Salmo salar L.). Cell Tissue Res. 2004, 318, 305–312. [Google Scholar] [CrossRef] [PubMed]
- Hawke, J.P.; McWhorter, A.C.; Steigerwalt, A.G.; Brenner, D.J. Edwardsiella ictaluri Sp-Nov, the Causative Agent of Enteric Septicemia of Catfish. Int. J. Syst. Bacteriol. 1981, 31, 396–400. [Google Scholar] [CrossRef]
- Liu, J.Y.; Li, A.H.; Zhou, D.R.; Wen, Z.R.; Ye, X.P. Isolation and characterization of Edwardsiella ictaluri strains as pathogens from diseased yellow catfish Pelteobagrus fulvidraco (Richardson) cultured in China. Aquac. Res. 2010, 41, 1835–1844. [Google Scholar] [CrossRef]
- Hawke, J.P.; Kent, M.; Rogge, M.; Baumgartner, W.; Wiles, J.; Shelley, J.; Savolainen, L.C.; Wagner, R.; Murray, K.; Peterson, T.S. Edwardsiellosis caused by Edwardsiella ictaluri in Laboratory Populations of Zebrafish Danio rerio. J. Aquat. Anim. Health 2013, 25, 171–183. [Google Scholar] [CrossRef]
- Soto, E.; Griffin, M.; Arauz, M.; Riofrio, A.; Martinez, A.; Eugenia Cabrejos, M. Edwardsiella ictaluri as the Causative Agent of Mortality in Cultured Nile Tilapia. J. Aquat. Anim. Health 2012, 24, 81–90. [Google Scholar] [CrossRef]
- Tekedar, H.C.; Blom, J.; Kalindamar, S.; Nho, S.; Karsi, A.; Lawrence, M.L. Comparative genomics of the fish pathogens Edwardsiella ictaluri 93-146 and Edwardsiella piscicida C07-087. Microb. Genom. 2020, 6, e000322. [Google Scholar] [CrossRef] [PubMed]
- Nhinh, D.T.; Giang, N.T.H.; Van, K.V.; Dang, L.T.; Dong, H.; Hoai, T.D. The arrival, establishment and spread of a highly virulent Edwardsiella ictaluri strain in farmed tilapia, Oreochr omis spp. Authorea, 2021; Epub ahead of print. [Google Scholar] [CrossRef]
- Ferguson, H.W.; Turnbull, J.F.; Shinn, A.; Thompson, K.; Dung, T.T.; Crumlish, M. Bacillary necrosis in farmed Pangasius hypophthalmus (Sauvage) from the Mekong Delta, Vietnam. J. Fish Dis. 2001, 24, 509–513. [Google Scholar] [CrossRef]
- Chu, Z.Z.; Guo, W.; Hu, W.H.; Mei, J. Delayed elimination of paternal mtDNA in the interspecific hybrid of Pelteobagrus fulvidraco and Pelteobagrus vachelli during early embryogenesis. Gene 2019, 704, 1–7. [Google Scholar] [CrossRef]
- Lim, S.G.; Han, H.K.; Gil, H.W.; Park, I.-S. Temperature-dependent Index of Mitotic Interval (tau0) for Chromosome Manipulation in Korean Bullhead, Pseudobagrus fulvidraco. Dev. Reprod. 2012, 16, 321–327. [Google Scholar] [CrossRef] [PubMed][Green Version]
- Hu, W.; Dan, C.; Guo, W.; Fan, Q.; Mei, J. The morphology and gonad development of Pelteobagrus fulvidraco and its interspecific hybrid huangyou no. 1 with Pelteobaggrus vachelli. Acta Hydrobiol. Sin. 2019, 43, 1231–1238. [Google Scholar]
- Mei, J.; Gui, J.F. Genetic basis and biotechnological manipulation of sexual dimorphism and sex determination in fish. Sci. China-Life Sci. 2015, 58, 124–136. [Google Scholar] [CrossRef]
- Roeselers, G.; Mittge, E.K.; Stephens, W.Z.; Parichy, D.M.; Cavanaugh, C.M.; Guillemin, K.; Rawls, J.F. Evidence for a core gut microbiota in the zebrafish. ISME J. 2011, 5, 1595–1608. [Google Scholar] [CrossRef]
- Clinical and Laboratory Standards Institute. Methods for Antimicrobial Broth Dilution and Disk Diffusion Susceptibility Testing of Bacteria Isolated from Aquatic Animals, VET03, 2nd ed.; Clinical and Laboratory Standards Institute: Wayne, PA, USA, 2020. [Google Scholar]
- Clinical and Laboratory Standards Institute. Performance Standards for Antimicrobial Susceptibility Testing, M100, 30th ed.; Clinical and Laboratory Standards Institute: Wayne, PA, USA, 2020. [Google Scholar]
- Lin, Y.; Yang, J.; Wu, Z.; Zhang, Q.; Wang, S.; Hao, J.; Ouyang, L.; Li, A. Establishment of Epidemiological Resistance Cut-Off Values of Aquatic Aeromonas to Eight Antimicrobial Agents. Microorganisms 2022, 10, 776. [Google Scholar] [CrossRef]
- Wu, Z.B.; Zhang, Q.Q.; Zhang, T.L.; Chen, J.W.; Wang, S.Y.; Hao, J.W.; Lin, Y.Y.; Li, A.H. Association of the microbiota dysbiosis in the hepatopancreas of farmed crayfish (Procambarus clarkii) with disease outbreaks. Aquaculture 2021, 536, 736492. [Google Scholar] [CrossRef]
- Stackebrandt, E.; Goebel, B.M. A place for DNA-DNA reassociation and 16s ribosomal-RNA sequence-analysis in the present species definition in bacteriology. Int. J. Syst. Bacteriol. 1994, 44, 846–849. [Google Scholar] [CrossRef]
- Edgar, R.C. UPARSE: Highly accurate OTU sequences from microbial amplicon reads. Nat. Methods 2013, 10, 996. [Google Scholar] [CrossRef]
- Wang, Q.; Garrity, G.M.; Tiedje, J.M.; Cole, J.R. Naive Bayesian classifier for rapid assignment of rRNA sequences into the new bacterial taxonomy. Appl. Environ. Microbiol. 2007, 73, 5261–5267. [Google Scholar] [CrossRef]
- Wu, Z.B.; Zhang, Q.Q.; Lin, Y.Y.; Hao, J.W.; Wang, S.Y.; Zhang, J.Y.; Li, A.H. Taxonomic and Functional Characteristics of the Gill and Gastrointestinal Microbiota and Its Correlation with Intestinal Metabolites in NEW GIFT Strain of Farmed Adult Nile Tilapia (Oreochromis niloticus). Microorganisms 2021, 9, 617. [Google Scholar] [CrossRef]
- Segata, N.; Izard, J.; Waldron, L.; Gevers, D.; Miropolsky, L.; Garrett, W.S.; Huttenhower, C. Metagenomic biomarker discovery and explanation. Genome Biol. 2011, 12, R60. [Google Scholar] [CrossRef] [PubMed]
- Langille, M.G.I.; Zaneveld, J.; Caporaso, J.G.; McDonald, D.; Knights, D.; Reyes, J.A.; Clemente, J.C.; Burkepile, D.E.; Thurber, R.L.V.; Knight, R.; et al. Predictive functional profiling of microbial communities using 16S rRNA marker gene sequences. Nat. Biotechnol. 2013, 31, 814. [Google Scholar] [CrossRef] [PubMed]
- Douglas, G.M.; Maffei, V.J.; Zaneveld, J.R.; Yurgel, S.N.; Brown, J.R.; Taylor, C.M.; Huttenhower, C.; Langille, M.G.I. PICRUSt2 for prediction of metagenome functions. Nat. Biotechnol. 2020, 38, 685–688. [Google Scholar] [CrossRef] [PubMed]
- Parks, D.H.; Tyson, G.W.; Hugenholtz, P.; Beiko, R.G. STAMP: Statistical analysis of taxonomic and functional profiles. Bioinformatics 2014, 30, 3123–3124. [Google Scholar] [CrossRef]
- Ward, T.; Larson, J.; Meulemans, J.; Hillmann, B.; Lynch, J.; Sidiropoulos, D.; Spear, J.; Caporaso, G.; Blekhman, R.; Knight, R.; et al. BugBase predicts organism-level microbiome phenotypes. bioRxiv 2017, 133462. [Google Scholar] [CrossRef]
- Hawke, J.P. Bacterium associated with disease of pond cultured channel catfish, Ictalurus-punctatus. J. Fish. Res. Board Can. 1979, 36, 1508–1512. [Google Scholar] [CrossRef]
- Wang, R.; Tekedar, H.C.; Lawrence, M.L.; Chouljenko, V.N.; Kim, J.; Kim, N.; Kousoulas, K.G.; Hawke, J.P. Draft Genome Sequences of Edwardsiella ictaluri Strains LADL11-100 and LADL11-194 Isolated from Zebrafish Danio rerio. Genome Announc. 2015, 3, e01449-15. [Google Scholar] [CrossRef] [PubMed]
- Dubytska, L.P.; Koirala, R.; Sanchez, A.; Thune, R. Edwardsiella ictaluri T3SS Effector EseN Modulates Expression of Host Genes Involved in the Immune Response. Microorganisms 2022, 10, 1334. [Google Scholar] [CrossRef]
- Huang, H.Y.; Zhou, P.J.; Chen, P.; Xia, L.Q.; Hu, S.B.; Yi, G.F.; Lu, J.Y.; Yang, S.Q.; Xie, J.Y.; Peng, J.L.; et al. Alteration of the gut microbiome and immune factors of grass carp infected with Aeromonas veronii and screening of an antagonistic bacterial strain (Streptomyces flavotricini). Microb. Pathog. 2020, 143, 104092. [Google Scholar] [CrossRef]
- Zhang, Q.L.; Li, H.W.; Wu, W.; Zhang, M.; Guo, J.; Deng, X.Y.; Wang, F.; Lin, L.B. The Response of Microbiota Community to Streptococcus agalactiae Infection in Zebrafish Intestine. Front. Microbiol. 2019, 10, 2848. [Google Scholar] [CrossRef]
- Yang, H.T.; Zou, S.S.; Zhai, L.J.; Wang, Y.; Zhang, F.M.; An, L.G.; Yang, G.W. Pathogen invasion changes the intestinal microbiota composition and induces innate immune responses in the zebrafish intestine. Fish Shellfish Immunol. 2017, 71, 35–42. [Google Scholar] [CrossRef] [PubMed]
- Hu, Q.; Tan, L.; Gu, S.; Xiao, Y.; Xiong, X.; Zeng, W.-a.; Feng, K.; Wei, Z.; Deng, Y. Network analysis infers the wilt pathogen invasion associated with non-detrimental bacteria. npj Biofilms Microbiomes 2020, 6, 8. [Google Scholar] [CrossRef] [PubMed]
- Wang, S.; Li, X.; Zhang, M.; Jiang, H.; Wang, R.; Qian, Y.; Li, M. Ammonia stress disrupts intestinal microbial community and amino acid metabolism of juvenile yellow catfish (Pelteobagrus fulvidraco). Ecotoxicol. Environ. Saf. 2021, 227, 112932. [Google Scholar] [CrossRef] [PubMed]
- Wu, S.; Gao, T.; Zheng, Y.; Wang, W.; Cheng, Y.; Wang, G. Microbial diversity of intestinal contents and mucus in yellow catfish (Pelteobagrus fulvidraco). Aquaculture 2010, 303, 1–7. [Google Scholar] [CrossRef]
- Borsodi, A.K.; Szabó, A.; Krett, G.; Felföldi, T.; Specziár, A.; Boros, G. Gut content microbiota of introduced bigheaded carps (Hypophthalmichthys spp.) inhabiting the largest shallow lake in Central Europe. Microbiol Res 2017, 195, 40–50. [Google Scholar] [CrossRef] [PubMed]
- Tsuchiya, C.; Sakata, T.; Sugita, H. Novel ecological niche of Cetobacterium somerae, an anaerobic bacterium in the intestinal tracts of freshwater fish. Lett. Appl. Microbiol. 2008, 46, 43–48. [Google Scholar] [CrossRef] [PubMed]
- Sugita, H.; Miyajima, C.; Deguchi, Y. The vitamin-B12-producing ability of the intestinal microflora of fresh-water fish. Aquaculture 1991, 92, 267–276. [Google Scholar] [CrossRef]
- Waltman, W.D.; Shotts, E.B.; Hsu, T.C. Biochemical Characteristics of Edwardsiella ictaluri. Appl. Environ. Microbiol. 1986, 51, 101–104. [Google Scholar] [CrossRef]
- Gallo, R.L.; Nakatsuji, T. Microbial Symbiosis with the Innate Immune Defense System of the Skin. J. Investig. Dermatol. 2011, 131, 1974–1980. [Google Scholar] [CrossRef]
- Bergh, O. Bacteria associated with early-life stages of halibut, Hippoglossus-hippoglossus L., inhibit growth of a pathogenic vibrio sp. J. Fish Dis. 1995, 18, 31–40. [Google Scholar] [CrossRef]
- Gomez, D.; Sunyer, J.O.; Salinas, I. The mucosal immune system of fish: The evolution of tolerating commensals while fighting pathogens. Fish Shellfish Immunol. 2013, 35, 1729–1739. [Google Scholar] [CrossRef] [PubMed]
- Jovel, J.; Patterson, J.; Wang, W.; Hotte, N.; O’Keefe, S.; Mitchel, T.; Perry, T.; Kao, D.; Mason, A.L.; Madsen, K.L.; et al. Characterization of the Gut Microbiome Using 16S or Shotgun Metagenomics. Front. Microbiol. 2016, 7, 459. [Google Scholar] [CrossRef] [PubMed]
- Stellwag, E.J.; Smith, T.D.; Luczkovich, J.J. Characterization and Ecology of Carboxymethylcellulase-Producing Anaerobic Bacterial Communities Associated with the Intestinal Tract of the Pinfish, Lagodon rhomboides. Appl. Environ. Microbiol. 1995, 61, 813–816. [Google Scholar] [CrossRef] [PubMed]
- Fujimoto, T.; Imaeda, H.; Takahashi, K.; Kasumi, E.; Bamba, S.; Fujiyama, Y.; Andoh, A. Decreased abundance of Faecalibacterium prausnitzii in the gut microbiota of Crohn’s disease. J. Gastroenterol. Hepatol. 2013, 28, 613–619. [Google Scholar] [CrossRef] [PubMed]
- De Palma, G.; Nadal, I.; Medina, M.; Donat, E.; Ribes-Koninckx, C.; Calabuig, M.; Sanz, Y. Intestinal dysbiosis and reduced immunoglobulin-coated bacteria associated with coeliac disease in children. BMC Microbiol. 2010, 10, 63. [Google Scholar] [CrossRef]
Disclaimer/Publisher’s Note: The statements, opinions and data contained in all publications are solely those of the individual author(s) and contributor(s) and not of MDPI and/or the editor(s). MDPI and/or the editor(s) disclaim responsibility for any injury to people or property resulting from any ideas, methods, instructions or products referred to in the content. |
© 2023 by the authors. Licensee MDPI, Basel, Switzerland. This article is an open access article distributed under the terms and conditions of the Creative Commons Attribution (CC BY) license (https://creativecommons.org/licenses/by/4.0/).