Abstract
Different fisheries, even the same fishery, use different ways of quantifying fishing efforts such as the number of vessels, days, voyages, and hooks. In squid-jigging fisheries, fishing hours, fishing days, and the number of vessels are valid units for calculating the catch per unit effort (CPUE). A vessel monitoring system (VMS) provides vessel position data with high spatial and temporal resolution and offers the possibility to quantify the CPUE at a finer scale. Using the squid fishery in the equatorial waters of the eastern Pacific as a case study, the CPUE was evaluated and standardized based on VMS data. The drifting operating points of the squid fishing vessels were filtered by the speed threshold, solar radiation, and operating time setting methods, leading to the number of fishing hours per day, and the nominal CPUE was calculated by combining the catch data obtained from logbooks. Then, the generalized linear model (GLM) and generalized additive model (GAM) were applied to conduct CPUE standardization considering spatiotemporal factors and environmental variables including sea surface temperature (SST), sea surface salinity (SSS), sea surface height (SSH), and chlorophyll-a (Chl_a). The results showed that month, latitude, SST, SSH, and Chl-a all have a high significant effect on CPUE as demonstrated through the significance test conducted by GLM. The GAM including the significant factors was judged to be the best model according to the AIC guidelines. The latitude range for high CPUE in the fishery was 3°S~0°S, SST range 24~25 °C, SSH range 4~8 m, and Chl_a range 0.15~0.20 mg/m3. In addition, the nominal and standardized CPUEs were compared based on fishing hours and fishing days. The results indicated that the two types of CPUEs were highly related hence there was no significant difference.
1. Introduction
The jumbo flying squid Dosidicus gigas, widely distributed in the eastern Pacific Ocean from northern California (37°–40° N) to southern Chile (45–47° S) [1], is one of the largest and most abundant cephalopod species [2] and supports the biggest squid fishery in the world. In the southeast Pacific, D. gigas is mainly targeted by artisanal jigger fleets in the coastal waters and the international industrial squid-jigging fleets in the high seas. The squid-jigging vessels use lights to attract D. gigas aggregating around the vessels and catch them by handline or jig machine at night. Furthermore, the sea anchor and triangle fan are also employed to reduce the drifting speed and stabilize the vessel. International distant water fleets generally operate in the high seas off Peru, however, since 2017, D. gigas fishing grounds have expanded into equatorial waters, becoming a new and important fishing ground [3], and more vessels have moved from traditional fishing grounds in the high seas off Peru to equatorial waters [4,5,6].
Catch per fishing effort unit (CPUE) has typically been assumed to be proportional to the abundance of the fishery resource and has been used as a primary index of relative abundance of resources to reflect the magnitude of resource abundance [7]. However, there are many factors other than abundance that can influence CPUE, such as environmental factors (e.g., temperature), fishing methods (e.g., trawl versus longline), fishing gear (e.g., the use of sonar), fishing behavior (e.g., experience), management (e.g., the introduction of a quota management system), and economic factors (e.g., the price of fuel) [8]. Like many other pelagic cephalopods, D. gigas is a short-lived squid that is extremely sensitive to environmental changes throughout its life cycle [9]. The distribution of D. gigas has been shown to be closely linked to marine environmental factors such as sea surface temperature (SST), sea surface salinity (SSS), sea surface height (SSH), and chlorophyll-a (Chl_a) [9,10]. Catch and effort data should be standardized to remove the effects of all known factors and the standardized CPUE can be used to reflect the abundance of the fishery resource [8,11,12].
The generalized linear model (GLM) and generalized additive model (GAM) have been extensively used to standardize CPUE. GLM is designed for linear relationships [12], but the relationship between the variables affecting CPUE was found to be complex and may be non-linear in some studies [8], so it does not apply well in many situations [12]. However, GAM is a non-parametric extension of GLM and is characterized by its ability to handle highly non-linear and non-monotonic correlations between response variables and predictions [13]. Therefore, the complementarity of GLM and GAM allows a better solution to linear and non-linear problems, thus improving the accuracy of the study. It has also been found that the standardized CPUE approach based on GLM and GAM can better explain the relationship between cephalopod stocks and the marine environment [14,15]. Lu et al. applied GLM and GAM to standardize the CPUE of Illex argentinus for the Chinese squid-jigging fishery in the southwest Atlantic Ocean and showed that GAM tended to be more suitable than GLM in the analysis of CPUE [14]. Wei et al. [15] used GAM to standardize the CPUE of fishing data, collected from Chinese squid-jigging vessels in the north Pacific and better analyzed the effects of different environmental modalities and different spatial scales on CPUE standardization.
Modern fisheries science uses various sources of data to assess the status of exploited resources at the best level possible, with respect to the economic and technical constraints of data collection [16]. Fishing logbook data is an important source of fisheries data and wildly used in CPUE standardization [17,18,19]. However, the logbook data is argued as low accuracy and low resolution [20], especially when the area covered by the fishing logbook is small, and the reported data tend to be concentrated in the fishing area. This kind of incomplete fishing effort data distribution is considered to produce bias in the estimation of resources [21]. A vessel monitoring system (VMS), a satellite surveillance system, is used by regional fisheries management organizations and relevant authorities to monitor fishing activities with reporting fishing vessel’s name, location, date, time, speed, bearing, and other information. Thus, the VMS data, combined with fishery data and other data, show great potential and value in the field of fisheries sciences research. For instance, VMS data have been used to identify the status of fishing vessels [22,23] and analyze fishing effort distribution and catch patterns [24,25], as well as CPUE [25,26,27,28,29]. However, there are few studies of VMS data for catch rate analysis for squid-jigging fisheries.
With respect to the squid fishery in the high seas of the southeast Pacific, CPUE estimation is mainly based on fishing days and voyages [30,31], while it also can be analyzed with the higher spatial and temporal resolution based on fishing hours for international fleets equipped with automatic location communicators. The objective of the present study is to identify the fishing activities of squid-jigging vessels and estimate the CPUE for squid fishery at a finer scale by combining the VMS and logbook data. Taking the squid fishery in the equatorial waters of the eastern Pacific as a case study, the VMS data was used to estimate the total number of fishing hours; that is, the fishing effort per fishing day for a given squid-jigging vessel by identifying the status of the vessel. Then, the nominal CPUE was calculated and GLM and GAM were applied to conduct CPUE standardization.
2. Materials and Methods
2.1. Data Sources
VMS data was obtained from the Distant-water Fishery Service Platform of the China Overseas Fisheries Association. This data included vessel name, time, latitude and longitude, speed and heading. Fishery data for Chinese squid, including vessel name, date, location, catch, and other useful information was obtained from the National Data Centre of Distant-water Fisheries of China. The monthly distribution of catch was shown in the Figure 1. In order to reduce the amount of mismatched data between VMS data and catch data, a total of 41 squid-jigging vessels that operated year-round in the equatorial waters of the eastern Pacific were selected from the 2020 Chinese squid-jigging vessels with a total of 330,964 VMS data and 12,097 fishing logbook data around the equatorial waters of the southeast Pacific Ocean (123° W to 81° W and 3° N to 9° S).
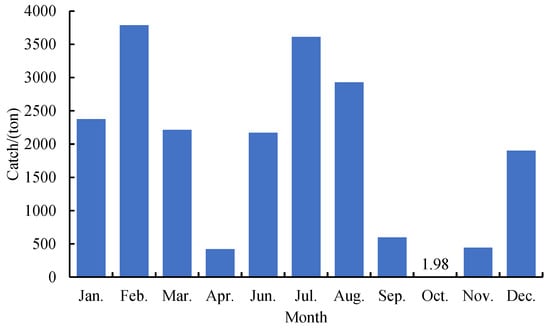
Figure 1.
Monthly catch of squid-jigging vessels in the equatorial waters of Eastern Pacific.
Marine environmental data including SST, SSS, SSH, PAR, and Chl_a were also collected for use in this paper. SSS was obtained from the Hawaii Asia-Pacific Data Centre with a temporal resolution of one month (0.5° resolution) accessed on 9 July 2022 (http://apdrc.soest.hawaii.edu/). SST, SSH, and Chl_a were obtained from the Copernicus Ocean Service network with a temporal resolution of one month (0.25° resolution) on 9 July 2022 (https://resources.marine.copernicus.eu/products). PAR was obtained from the US NOAA Pacific Observation Network with a temporal resolution of one month (0.25° resolution) on 10 July 2022 (https://oceanwatch.pifsc.noaa.gov/doc.html). In addition, the spatial resolution of all environmental data was transformed to 0.25° × 0.25° and then matched in time and space to the CPUE data in this study.
2.2. Methods
2.2.1. Fishing Vessel Status Identification and Fishing Effort Calculation
In this study, the status of the squid-jigging vessels was divided into drifting operational status and other status (drifting non-operational status and navigational status). As a light fishery, a squid-jigging vessel has the production characteristics of a night-time, continuous, drifting operation. In this paper, the squid-jigging vessel state identification method adopted by Yang et al. [32] was referred and the operating state of the drifting vessel was checked by setting the solar irradiance, the operating, and the speed threshold. The solar radiation was calculated by applying the pysolar package in Python. Yang et al. [32] concluded that the duration of fishing operations by squid-jigging vessels was not less than 4 h, hence all points where the duration of fishing was less than 4 h were excluded in this paper. Speed thresholds were derived by plotting the frequency distribution of speed. Of these, fishing vessels did not operate in May.
The time difference between the previous and the next vessel position point was used as the fishing effort at the latter vessel position point in the chronological order in which the vessel data were submitted. The equation is as follows:
where Ek was the fishing effort at the position of an operating vessel (h); Tk was the time corresponding to the position of an operating vessel.
Ek = Tk − Tk−1
It was assumed that the fishing efficiency is the same for all vessel points during the fishing period, and the catch for a given day was allocated based on the proportion of the vessel’s operating time at a given vessel point to the total operating time of the vessel during that day. The equation is as follows:
where Ed was the cumulative fishing effort of a fishing vessel on a given day (h); Cd was the catch of a fishing vessel on a given day (kg); and d was the day.
Ck = (Ek/Ed) × Cd
2.2.2. Calculation of Nominal CPUE
Fishing cells were divided by latitude and longitude (0.25° × 0.25°), spatiotemporal integration statistics were performed on a monthly basis, and CPUE within each fishing area was calculated using the following equation:
where Cfmij and Efmij was the catch and fishing effort of fishing vessel f in cellij in month m, respectively. Nominal CPUE is calculated based on fishing hours and fishing days, respectively. CPUEh indicates the nominal CPUE based on fishing hours and CPUEd indicates the nominal CPUE based on fishing days.
CPUEfmij = ∑Cfmij/∑Efmij
2.2.3. Construction of the GLM and GAM
The GLM assumed that the expected value of the response variable was linearly related to the explanatory variable hence, the CPUE followed a normal distribution [33]. The general expression for the GLM is:
where CPUE is the daily catch of all squid-jigging vessels in each of the allocated fishing areas in kilogram per hour; α1~α8 are the model parameters; ε indicates the error terms, which are assumed to follow a normal distribution; month indicates month; lon indicated longitude; lat indicates latitude; SST indicates sea surface temperature (°C); SSS indicates sea surface salinity; SSH indicates sea surface height (m); PAR indicates photosynthetically active radiation; Chl_a indicates chlorophyll a concentration (mg/m3); CPUE+1 was log-transformed and used as the response variable to avoid the occurrence of a zero CPUE value. In GAM, time (month), space (longitude, latitude), and environment (SST, SSS, SSH, Chl_a, PAR) were used as explanatory variables, where month, longitude and latitude are discrete variables, and the other variables are continuous.
ln(CPUE+1)~k + α1monthi + α2lonj + α3latk + α4SST + α5SSS + α6SSH + α7Chl_a + α8PAR + εijk
GAM is a non-parametric multiple linear regression model that provides more information than traditional regression models in analyzing the spatial relationship between resource abundance and the environment and can better describe the non-linear relationship between CPUE and other variables [7]. The functional relationship is as follows:
where g() was the link function; μi = E(Yi), Yi is the ith corresponding variable; xi was the explanatory variable for the ith corresponding variable; α was the intercept in the fit function; fi was the smoothing function; ε was the model estimation parameter.
g(μi) = α+Σi=1fi (xi)+ε
The general expression for CPUE normalization in the GAM used in this study is:
where s(x) was the spline smoother function of the covariate x.
ln(CPUE+1)~s(month) + s(lon) + s(lat) + s(SST) + s(SSH) + S(PAR) + S(Chl_a)+ε
The selection of factors and the fit of the model were assessed by the significance level (P) of the factors and the Akaike information criterion (AIC), respectively [7,34]. The model with the lowest AIC value was considered the optimal model and AIC value is calculated using the formula:
where m was the number of parameters in the model.
AIC = −2lnl(p1,p2,…pm, σ2) + 2m
3. Results
3.1. Fishing Vessel Status Classification and Identification
The speed of the squid-jigging vessels showed a bimodal distribution (Figure 2), with peaks at 0–1 kn and 7.5–8.5 kn, respectively, and troughs at 2.5–3.5 kn. Therefore, the study used speed frequency distribution data to determine that squid-jigging vessels have both drifting and sailing vessel states. Since the speed of the drifting state is lower than that of the sailing state, the speed interval for screening the drifting state is set to 0~2.5 kn and about 2.29 × 10⁵ drifting state vessel position points are screened out, accounting for 69.45% of the total. The operating and non-operating states of the drift were screened by solar irradiance and continuous operating time, i.e., the points with solar irradiance of 0 and operating time of more than 4 h were retained. Finally, 6.29 × 10⁴ operating vessel points were screened, representing 19% of the total. For the CPUE standardization study, positions were selected within the latitude and longitude range 123° W~81° W and 3° N~9° S. In May, squid-jigging vessels moved further south in the area off Peru to operate, and no data were available for the study area.
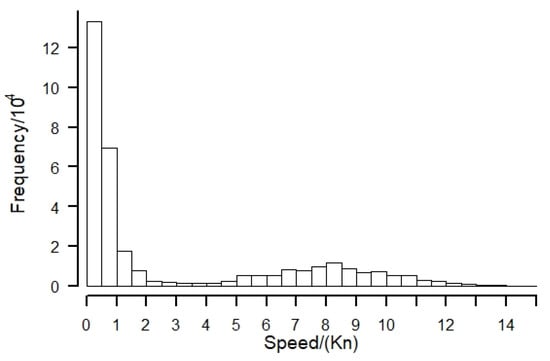
Figure 2.
Histogram of speed frequency distribution.
3.2. Statistical Distribution Tests of ln(CPUEh+1)
According to the K-S test, ln(CPUEh+1) tends to follow a normal distribution (Figure 3a), and the data points of ln(CPUEh+1) tend to form a straight line in the normal Q-Q plot (Figure 3b). Therefore, the assumption that ln(CPUE+1) follows a normal distribution in this study is reasonable and can be statistically analyzed using GLM and GAM.
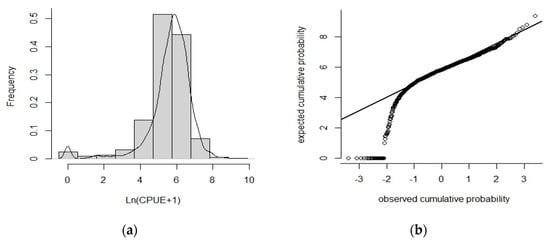
Figure 3.
Statistical distribution tests for ln(CPUEh+1): (a) frequency distribution of ln(CPUEh+1); (b) nominal Q−Q plot of ln(CPUEh+1).
3.3. GLM Analysis
Significance tests were performed for each factor according to GLM (Table 1), with month, latitude, SST, SSH, and Chl_a as significant variables. The effects of month and SSH on CPUE were highly significant (p < 0.01). Similarly, the effects of longitude, SST, and Chl_a on CPUE were significant (p < 0.05). The other variables such as latitude, SSS, and PAR were less significant and had no significant effect on the CPUE (p > 0.05).

Table 1.
The significance test of explained variables in generalized linear models (GLM).
3.4. GAM Analysis
Based on the results of the GLM significance test, the five significant variables (month, latitude, SST, SSH, and Chl_a) were added to GAM one by one, and the AIC minimum and R2 maximum were used as the basis for model diagnosis (Table 2). The optimal model was obtained as:
ln(CPUEh+1) = s(month) + s(lat) + s(SST) + s(SSH) + s(Chl_a)

Table 2.
Summary analysis of deviance for generalized additive models (GAM).
The results of GAM showed that variables month, latitude, SST, SSH, and Chl_a had a highly significant effect on the CPUE (p < 0.01). The total explained deviation of the model on CPUE was 24.3%, with the variable month having the greatest effect on CPUE, explaining 12.9% of the total deviation, followed by SST (4.7%), SSH (2.8%), latitude (2.5%), and Chl_a (1.4%).
3.5. Nominal CPUE and GAM Standardized CPUE
The CPUE trend after GAM normalization was almost the same as the nominal CPUE from January–December 2020 (Figure 4). During the period from January–February, CPUE showed an upward trend reaching a highest value in February; during the period from February–April, CPUE showed a sharp downward trend; from April–July, a sharp increase of CPUE was observed, reaching a peak in July, and later decreased from July through to October. From October–December, a sharp increasing trend of the CPUE was observed.
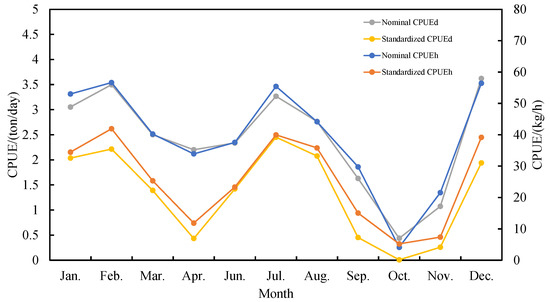
Figure 4.
Relationship between monthly nominal CPUE and GAM standardized CPUE of the Chinese squid-jigging fishery in the equatorial waters of Eastern Pacific.
Following the same methodology as above, CPUE in ton/day was normalized and the average monthly distribution of the nominal and normalized CPUE showed the same trend.
No significant difference in trends of nominal CPUE and standardized CPUE when different effort units were used (p = 0.981 and 0.976) was found, and they were in linear correlation (Figure 5).
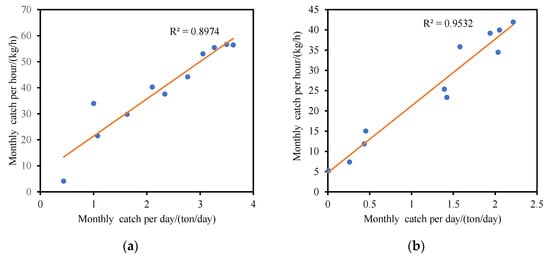
Figure 5.
The relationship of mean monthly CPUE between two units: (a) nominal CPUE; (b) GAM standardized CPUE.
3.6. Effects of Impact Factors
The effects of monthly factors on CPUEh in GAM are shown in Figure 6a. The first peak was observed in February and declined in a parabolic shape on both sides to January and April, respectively, reaching the lowest value in April and then followed by an upward trend until June. From June to August, the trend was relatively flat and unchanged, later following a downward trend until October after August, and then an upward trend until December.
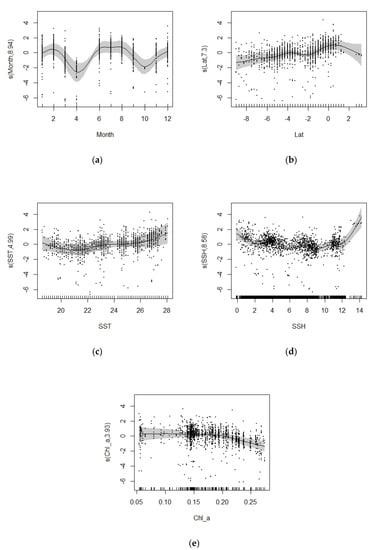
Figure 6.
Effects of impact factors on the jumbo flying squid Dosidicus gigas CPUE derived from the GAM analysis in the equatorial waters of the eastern Pacific Ocean: (a) month; (b) latitude; (c) SST; (d) Chl_a; (e) SSH.
The effects of latitude on CPUEh in GAM are shown in Figure 6b. In 9° S~0°, CPUE generally showed a slowly increasing trend, but peaked at 4° S and reached its highest value at 0°, and then showed a decreasing trend with increasing longitude.
The effects of SST on CPUEh in GAM are shown in Figure 6c. At 19~21 °C, CPUE showed a slow decreasing trend with increasing SST, with a minimum at around 21 °C. Between 21–28 °C, CPUE showed an upward trend with increasing SST. In the 24~28 °C range, SST was positively related to CPUE, but since the 95% confidence interval for SST was greater than 25 °C, this suggests that the optimal SST range for the fishery is 24~25 °C.
The effects of SSH on CPUEh in GAM are shown in Figure 6d. From 0~2 m, CPUE showed a decreasing trend with increasing SSH. From 2–4 m, CPUE showed a slowly increasing trend with increasing SSH, from 4–6 m, CPUE showed a decreasing trend with increasing SSH, and from 6–12 m, CPUE showed a slowly increasing trend with increasing SSH; thereafter, it showed an increasing trend with increasing SSH with a steeper slope. Overall, the trend of CPUE variation shows first a wavy downward trend and then a sharp upward trend.
The effects of Chl_a on CPUEh in GAM are shown in Figure 6e. At 0.05~0.20 mg/m3, the trend of CPUE was relatively flat and almost constant, and then showed a decreasing trend with increasing Chl_a. Chl_a had a positive correlation with CPUE in the range of 0.05-0.20 mg/m3, but since the 95% confidence interval was larger in the range of 0.05~0.15 mg/m3, the optimal Chl_a range for the fishery was 0.15~0.20 mg/m3.
4. Discussion
D. gigas is a short-lived cephalopod whose resources are extremely sensitive to changes in climate and the marine environment [8]. Previous studies [35,36] on CPUE standardization demonstrated that SST, SSH, and Chl_a are significant environmental factors that affect the catch rates of D. gigas.
SST is the most important abiotic factor influencing the biomass and distribution of D. gigas, and a suitable SST is an important condition for the formation of central fishing grounds [8]. The optimal SST range for D. gigas in the equatorial waters of the eastern Pacific is estimated to be 24~25 °C. The optimum SST range from January to July in equatorial seas was shown to be 23~27 °C [37]. Xuan et al. [38] showed that the optimal SST range for D. gigas in equatorial waters was 24.5–25.5 °C. The aforementioned studies are generally consistent with the results of this paper. The optimal SST range for D. gigas was found to be significantly higher in equatorial waters than in Peruvian waters (18~23 °C [39]) and fisheries off Chilean waters (14~19 °C [40]), which were associated with high latitude and therefore high light intensity in equatorial waters [41].
SSH characterizes eddies, with low SSH values corresponding to cold eddies where nutrient levels, phytoplankton, and animal populations are higher in cold eddies than in the surrounding waters, and the opposite is true for warm eddies [42]. Fang et al. analyzed the spatial distribution of D. gigas abundance off Peru based on a comprehensive environmental factor and found that D. gigas is mainly distributed at the confluence of cold and warm eddies [43]. Furthermore, Gong et al. showed a strong correlation between the CPUE of D. gigas fishery and SSH [44]. In this study, SSH was also found to have a highly significant effect on CPUE and a positive relationship with CPUE at lower values (0~4 m) and higher values (12~14 m) (Figure 5d). In addition, changes in SSH cause nutrient fluxes that provide a source of growth for D. gigas [1,44].
Chlorophyll is a proxy for primary productivity in marine ecosystems and is essential for the formation of fishing grounds [9]. The equatorial waters of the eastern Pacific Ocean, due to the abundant upwelling system, form a nutrient-rich and low dissolved oxygen environment, but low levels of Chl_a [45]. The optimal range of Chl_a for stem-and-soft fishing in the equatorial waters of the eastern Pacific Ocean was estimated to be 0.10~0.20 mg/m3 based on the positive effect interval and 95% confidence interval. Chen et al. found that the range of suitable Chl_a in the equatorial D.gigas fishery from January to July was 0.10~0.25 mg/m3 [40]. Fang et al. found that the optimum Chl_a for stem bending in equatorial waters in March–April was 0.14~0.16 mg/m3 [43]. The above studies are generally consistent with the findings of this study.
The GAM analysis used in the present study shows that the variable month is the most important influencing factor, accounting for the largest percentage of explained deviation. A positive effect was seen on the CPUE from January to March, June to August, and December (Figure 5a), with CPUE peaking in February, July, and December, respectively (Figure 3). Two of these periods coincide with the fishing seasons in the equatorial fishing ground (January–March) and the northern fishing ground off Peru (June–August) [46]. Negative impacts from September to November are related to China’s seasonal moratorium system on the high seas squid fishery in the central eastern Pacific equatorial region. In 2020, China piloted an autonomous fishing moratorium system for the high seas D. gigas fishery in the equatorial 5° N~5° S and 110° W~95° W range of the eastern Pacific Ocean, with the moratorium lasting from September 1st to November 30th each year, and all fishing vessels operating in the equatorial fishery ground must adhere to this moratorium period. At the end of the fishing moratorium, some of the fishing vessels returned from the Peruvian offshore fishing grounds (northern Peruvian fishing grounds and southern Peruvian fishing grounds) to operate in the equatorial fishing grounds, resulting in a significant increase in the CPUE in December, and the month effect on the CPUE again showed a positive correlation effect. In addition, D. gigas are highly migratory pelagic cephalopods with high swimming ability, influenced by the complex ocean current system of the southeastern Pacific, with a wide migratory range and migration path in the southeastern Pacific [47].
The equatorial waters of the eastern Pacific Ocean are influenced by major ocean currents such as the California Cold Current, the North Equatorial Warm Current, the South Equatorial Warm Current, the Equatorial Countercurrent, and the Peruvian Cold Current, creating a marine environment suitable for activity, reproduction, and growth of D. gigas [48]. GAM results showed that latitude was the key variable, whereas longitude did not significantly affect the CPUE. The effect of latitude north of 4° S on CPUE shows a positive effect (Figure 4b), while the range north of 0° have larger 95% confidence intervals, indicating a poorer model fit, so in this paper, the distribution range of high CPUE in latitude is considered to be 4° S~0°. Fang et al. investigated the spatial distribution of the D. gigas fishery in the equatorial waters of the eastern Pacific Ocean from January 2017 to July 2017, and concluded that the main distribution of CPUE lies between latitudes 1° N–3° S [49]. Xuan et al. [39] concluded that the fishing grounds in the equatorial waters of the eastern Pacific Ocean are latitudinally concentrated at 0°–3° S. These conclusions are generally consistent with the findings of this paper. The changes in the fishing grounds of the squid-jigging vessels from January to March and from June to August are related to the east–west migration of D. gigas from deeper to shallower waters off the coast (Figure 7). In winter (May–July), the northern regions of the Peruvian coast serve as spawning grounds for D. gigas, after which a large proportion of eggs and juveniles flow northwards with the Humboldt Current, which shifts westwards and juveniles grow in the circulating eddies. Hence, D. gigas are transported westwards to the South Equatorial Current, where some adults remain in equatorial waters, while others migrate southwards to reach the Peruvian Sea [50].
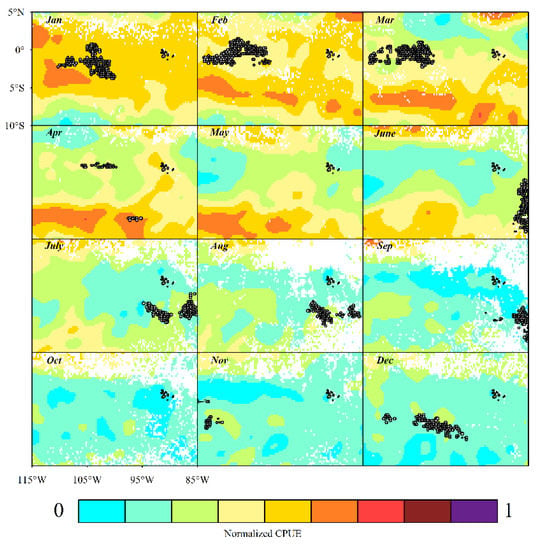
Figure 7.
Monthly distribution of GAM standardized CPUE and predicted CPUE for squid-jigging fishery in the equatorial waters of Eastern Pacific.
Developing reliable time series of abundance indices from fisheries data is critically important for squid-jigging fisheries [51]. In the present study on the standardization of CPUE in squid fisheries, fishing effort was mainly quantified using fishing days [51,52], light trap hours [53], and voyages [54] etc. As longer time series of VMS and logbook data become available, fisheries dependent CPUE data are likely to be used much more regularly to assess the status of populations, as it was a cost-effective method of providing year-round data across most fishing fleets [29]. However, we found that although the spatial and temporal resolution of VMS data was higher than that of fishing logbook data, there was no significant difference between the two types of standardized results. This may be due to a misjudgment of the status of squid-jigging vessels, which may also operate at other time periods other than nighttime. Moreover, discrepancies may occur when matching VMS data and fishing logbook data. If these discrepancies occur randomly, they do not affect the distribution patterns, but in some cases can affect fishing effort estimates [26]. Therefore, we believe that CPUE estimates based on fishing days are more advantageous if the above issues are not addressed.
In summary, this study is based on VMS data from squid-jigging vessels in the southeast Pacific Ocean. The drifting operation status of a squid-jigging vessel can be grasped more accurately by appropriately setting the solar irradiance, the operation duration, and the speed thresholds. However, in addition to drifting and sailing statuses, the status of distant-water squid-jigging vessels also includes the reprinting and trial fishing statuses, so subsequent studies will need to subdivide fishing vessel statuses more accurately. Furthermore, the vertical stratification of water temperature also influences the spatial distribution of CPUE in D. gigas due to their diurnal vertical movement characteristics [36]. Therefore, more environmental factors need to be included to improve the explanatory rate of GAM.
Author Contributions
Conceptualization, G.L. and X.C.; methodology, G.L.; software, Z.L.; validation, G.L., Z.L. and Y.C.; formal analysis, G.L.; investigation, Z.L.; resources, G.L.; data curation, Z.L.; writing—original draft preparation, Z.L.; visualization, Z.L. and Y.C.; supervision, G.L. and L.Z.; project administration, G.L.; funding acquisition, G.L. All authors have read and agreed to the published version of the manuscript.
Funding
This research was funded by the National Key R&D Program of China (2019YFD0901404).
Institutional Review Board Statement
The study was conducted according to the guidelines of the code of Ethics of the University Department of Marine Studies.
Informed Consent Statement
Not applicable.
Data Availability Statement
Not applicable.
Acknowledgments
We would like to express our thanks to Kindong Richard of Shanghai Ocean University for polish this article. Thanks for the financially support of the National Key R&D Program of China (2019YFD0901404). Finally, we thank the editor and the anonymous reviewers whose comments greatly improved the manuscript.
Conflicts of Interest
The authors declare no conflict of interest.
References
- Nigmatullin, C.M.; Nesis, K.N.; Arkhipkin, A.I. A review of the biology of the jumbo squid Dosidicus gigas (Cephalopoda: Ommastrephidae). Fish. Res. 2001, 56, 221. [Google Scholar] [CrossRef]
- Csirke, J.; Arguelles, J.; Alegre, A.; Ayon, P.; Bouchon, M.; Castillo, R.; Cisneros, R.; Carrasco, R.G.; Lau, L.; Mariategui, L.; et al. Biology, population structure and fishery of jumbo flying squid (Dosidicus gigas) in Peru. Bol. Inst. Mar. Pure. 2018, 33, 301–364. [Google Scholar]
- Jiang, M.F.; Chen, X.J. Preliminary evaluation of the seasonal moratorium of squid fishery on the high seas in the equatorial waters of Central Eastern Pacific. J. Shanghai Ocean Univ. 2022, 31, 670–676. [Google Scholar]
- SPRFMO. China Annual Report-Squid. In Proceedings of the Ninth Scientific Committee Meeting of SPRFMO, held remotely, 27 September–2 October 2021. [Google Scholar]
- SPRFMO. Chinese Taipei Annual Report. In Proceedings of the Ninth Scientific Committee Meeting of SPRFMO, held remotely, 27 September–2 October 2021. [Google Scholar]
- SPRFMO. Republic of Korea Annual. In Proceedings of the Ninth Scientific Committee Meeting of SPRFMO, held remotely, 27 September–2 October 2021. [Google Scholar]
- Tian, S.Q.; Chen, X.J. Impacts of different calculating methods for nominal CPUE on CPUE standardization. J. Shanghai Ocean Univ. 2010, 19, 240–245. [Google Scholar]
- Maunder, M.N.; Langley, A.D. Integrating the standardization of catch-per-unit-of-effort into stock assessment models: Testing a population dynamics model and using multiple data types. Fish. Res. 2004, 70, 389–395. [Google Scholar] [CrossRef]
- Yu, W.; Chen, X.J.; Zhang, Y. Seasonal habitat patterns of jumbo flying squid Dosidicus gigas off Peruvian waters. J. Mar. Syst. 2019, 194, 41–51. [Google Scholar] [CrossRef]
- Yu, W.; Yi, Q.; Chen, X.J.; Chen, Y. Climate-driven latitudinal shift in fishing ground of jumbo flying squid (Dosidicus gigas) in the Southeast Pacific Ocean off Peru. Int. J. Remote. Sens. 2017, 38, 3531–3550. [Google Scholar] [CrossRef]
- Maunder, M.N.; Punt, A.E. Standardizing catch and effort data: A review of recent approaches. Fish. Res. 2004, 70, 141–159. [Google Scholar] [CrossRef]
- Mccullagh, P. Generalized linear model. Eur. J. Oper. Res. 2019, 16, 285–292. [Google Scholar] [CrossRef]
- Hastie, J.; Tibshirani, J. Generalized additive models. Stat. Sci. 1986, 3, 297–318. [Google Scholar] [CrossRef]
- Lu, H.J.; Chen, X.J.; Cao, J.; Li, G.; Tian, S.Q.; Liu, B.L.; Fang, Z. CPUE standardization of Illex argentinus for Chinese Mainland squid-jigging fishery in the southwest Atlantic Ocean. J. Fish. China. 2013, 37, 951–960. [Google Scholar] [CrossRef]
- Wei, G.E.; Chen, X.J. Impacts of spatial resolution under different environment modes on CPUE standardization in the North Pacific Ocean. Mar. Sci. 2021, 45, 147–158. [Google Scholar]
- Russo, T.; Carpentieri, P.; Fiorentino, F.; Arneri, E.; Scardi, M.; Cioffi, A.; Cataudella, S. Modeling landings profiles of fishing vessels: An application of Self-Organizing Maps to VMS and logbook data. Fish. Res. 2016, 181, 34–47. [Google Scholar] [CrossRef]
- Fonseca, T.; Campos, A.; Afonso-Dias, M.; Fonseca, P.; Pereira, J. Trawling for cephalopods off the Portuguese caost-Fleet dynamics and landing composition. Fish. Res. 2008, 92, 180–188. [Google Scholar] [CrossRef]
- Okamura, H.; Morita, S.H.; Funamoto, T.; Ichinokawa, M.; Eguchi, S. Target-based catch-per-unit-effort standardization in multispecies fisheries. Can. J. Fish. Aquat. Sci. 2018, 75, 452–463. [Google Scholar] [CrossRef]
- Yadav, V.K.; Jahageerdar, S.; Adinarayana, J. Use of different modeling approach for sensitivity analysis in predicting the Catch per Unit Effort (CPUE) of fish. Indian J. Geo-Mar. Sci. 2020, 49, 1729–1741. [Google Scholar]
- Mullowney, D.R.; Dawe, E.G. Development of performance indices for the Newfoundland and Labrador snow crab (Chionoecetes opilio) fishery using data from a vessel monitoring system. Fish. Res. 2009, 100, 248–254. [Google Scholar] [CrossRef]
- Walters, C. Folly and fantasy in the analysis of spatial catch rate data. Can. J. Fish. Aquat. Sci. 2003, 60, 1433–1436. [Google Scholar] [CrossRef]
- Janette, L.; South, A.B.; Simon, J. Developing reliable, repeatable, and accessible methods to provide high-resolution estimates of fishing-effort distributions from vessel monitoring system (VMS) data. ICES J. Mar. Sci. 2010, 67, 1260–1271. [Google Scholar]
- Bertrand, S.; Burgos, J.M.; Gerlotto, F.; Atiquipa, J. Lévy trajectories of Peruvian purse-seiners as an indicator of the spatial distribution of anchovy (Engraulis ringens). ICES J. Mar. Sci. 2005, 62, 477–482. [Google Scholar] [CrossRef]
- Natale, F.; Gibin, M.; Alessandrini, A.; Vespe, M.; Paulrud, A. Mapping Fishing Effort through AIS Data. PLoS ONE 2015, 10, e0130746. [Google Scholar] [CrossRef] [PubMed]
- Murawski, S.A.; Wigley, S.E.; Fogarty, M.J.; Rago, P.J.; Mountain, D.G. Effort distribution and catch patterns adjacent to temperate MPAs. ICES J. Mar. Sci. 2005, 62, 1150–1167. [Google Scholar] [CrossRef]
- Gerritsen, H.; Lordan, C. Integrating vessel monitoring systems (VMS) data with daily catch data from logbooks to explore the spatial distribution of catch and effort at high resolution. ICES J. Mar. Sci. 2011, 68, 245–252. [Google Scholar] [CrossRef]
- Bez, N.; Walker, E.; Gaertner, D.; Rivoirard, J.; Gaspar, P. Fishing activity of tuna purse seiners estimated from vessel monitoring system (VMS) data. Can. J. Fish. Aquat. Sci. 2011, 68, 1998–2010. [Google Scholar] [CrossRef]
- Walker, E.; Gaertner, D.; Gaspar, P.; Bez, N. Fishing activity of tuna purse estimated from VMS data and validated by observers’ data. Collect. Vol. Sci. Pap. 2010, 65, 2376–2391. [Google Scholar]
- Murray, L.G.; Hinz, H.; Hold, N.; Kaiser, M.J. The effectiveness of using CPUE data derived from Vessel Monitoring Systems and fisheries logbooks to estimate scallop biomass. ICES J. Mar. Sci. 2013, 70, 1330–1340. [Google Scholar] [CrossRef]
- SPRFMO. CPUE estimation based on different effort units for the squid jigging fisheries. In Proceedings of the Tenth Scientific Committee Meeting of SPRFMO, held remotely, 26–30 September 2022. [Google Scholar]
- Juan, V.M.; Jose, I.; Marco, E.S.; Luis, M. Estimation of the catch per unit effort (CPUE) and medium size of giant squid (Dosidicus gigas) using different types of jigs in Peru. Biologist 2013, 11, 131–149. [Google Scholar]
- Yang, S.L.; Shi, H.M.; Fan, W.; Zhang, H.; Fei, Y.J.; Zhang, H. Spatial distribution of squid fishing vessel operations in the southwest Atlantic Ocean and its relationship with environmental factors. J. Fish. Sci. China 2022, 29, 365–376. [Google Scholar]
- Guisan, A.; Edwards, T.C.; Hastie, T. Generalized linear and generalized additive models in studies of species distributions: Setting the scene. Ecol. Modell. 2002, 157, 89–100. [Google Scholar] [CrossRef]
- Howell, E.A.; Kobayashi, D.R. El Niño effects in the Palmyra Atoll region: Oceanographic changes and bigeye tuna (Thunnus obesus) catch rate variability. Fish. Oceanogr. 2010, 15, 477–489. [Google Scholar] [CrossRef]
- Wang, J.T.; Chen, X.J.; Gao, F.; Lei, L. Fish recruitment forecasting for Dosidicus gigas based on multi-environmental factors in the southeastern Pacific. Oceanol. Limnol. Sin. 2014, 45, 1185–1191. [Google Scholar]
- Lin, H.Y.; Wang, J.T.; Chen, X.J. The CPUE standardization of Dosidicus gigas in the southeastern Pacific Ocean using BP neural network. Oceanol. Limnol. Sin. 2022, 53, 1279–1287. [Google Scholar]
- Chen, X.J.; Qian, W.G.; Liu, B.L.; Lu, H.J.; Fang, Z.; Li, G. Productive survey and fishery for major pelagic economic squid in the world. J. Shanghai Ocean Univ. 2019, 28, 344–356. [Google Scholar]
- Xuan, W.D.; Cui, G.C.; Li, Z.; Wei, Q.Y.; Tao, Y.X.; Liu, L.W.; Chen, F.; Chen, X.J.; Zhu, W.B. Distribution and environmental dependency of small schools of squid Dosidicus gigas and in the equator of eastern Pacific Ocean. Oceanol. Limnol. Sin. 2022, 53, 1234–1241. [Google Scholar]
- Hu, Z.M.; Chen, X.J. Distribution of fishing ground of jumbo flying squid (Dosidicus gigas) and its relationship between SST and SSTA in the waters off Peru. Trans. Oceanol. Limnol. 2008, 4, 56–62. [Google Scholar]
- Chen, X.J.; Zhao, X.H. Catch distribution of jumbo flying squid and its relationship with SST in the offshore waters of Chile. Mar. Fish. 2005, 2, 173–176. [Google Scholar]
- Yu, W.; Fang, X.N.; Liu, H.W.; Feng, Z.P.; Chen, X.J. The first closed fishing area and season for oceanic squids in the high seas. Aquat. Conserv. 2021, 31, 3342–3343. [Google Scholar] [CrossRef]
- Mason, E.; Pascual, A.; McWilliams, J. A New Sea Surface Height–Based Code for Oceanic Mesoscale Eddy Tracking. J. Atmos. Ocean. Technol. 2014, 31, 1181–1188. [Google Scholar] [CrossRef]
- Fang, X.Y.; Chen, X.J.; Feng, Y.J.; Cheng, P. Study of spatial distribution for Dosidicus gigas abundance off Peru based on a comprehensive environmental factor. Haiyang Xuebao. 2017, 39, 62–71. [Google Scholar]
- Gong, J.W.; Qian, M.T.; Yu, W.; Chen, X.J. Interannual Variability in Stock Dynamics of Jumbo Flying Squid Dosidicus gigas outside Exclusive Economic Zones off Peru Coast Based on Habitat Suitability Index Model. Fish. Sci. 2022, 41, 226–235. [Google Scholar]
- Fiedler, P.C.; Talley, L.D. Hydrography of the eastern tropical Pacific: A review. Prog. Oceanogr. 2006, 69, 143–180. [Google Scholar] [CrossRef]
- Zhang, H.L.; Li, Z.; Li, D.L.; Liu, L.W.; Chen, F. Zhu, W.B. Analysis on the Fishery Status of Squid Fishing in the High Seas of Southeast Pacific Ocean. J. Zhejiang Ocean Univ. 2022, 41, 294–298. [Google Scholar]
- Liu, B.L.; Chen, X.J.; Fang, Z.; Hu, S.; Song, Q. A Preliminary Analysis of Trace-Elemental Signatures in Statoliths of Different Spawning Cohorts for Dosidicus gigas off EEZ Waters of Chile. J. Ocean Univ. China 2015, 14, 1059–1067. [Google Scholar] [CrossRef]
- Zhang, H. Study on the Fishing of Dosidicus gigas in the Equatorial Waters of the Eastern Pacific: Based on the Analysis of Fishery Biology, Spatial-Temporal Variation on Fishing Ground and Fishing Techniques; Zhejiang Ocean University: Ningbo, China, 2019. [Google Scholar]
- Fang, X.N.; Yu, W.; Chen, X.J. Spatial Distribution of Fishing Ground of Jumbo Flying Squid Dosidicus gigas in the Equator in Eastern Pacific Ocean. Fish. Sci. 2022, 41, 475–483. [Google Scholar]
- Hu, G.Y.; Fang, Z.; Chen, X.J. Review on the life history of jumbo squid (Dosidicus gigas) in the Eastern Pacific Ocean. J. Fish. China 2018, 42, 1315–1328. [Google Scholar]
- Cao, J.; Chen, X.J.; Chen, Y.; Liu, B.L.; Ma, J.; Li, S.L. Generalized linear Bayesian models for standardizing CPUE: An application to a squid-jigging fishery in the northwest Pacific Ocean. Sci. Mar. 2011, 75, 679–689. [Google Scholar]
- Tian, S.Q.; Chen, X.J.; Chen, Y.; Xu, L.X.; Dai, X.J. Standardizing CPUE of Ommastrephes bartramii for Chinese squid-jigging fishery in Northwest Pacific Ocean. J. Oceanol. Limnol. 2009, 27, 729–739. [Google Scholar] [CrossRef]
- Yan, L.; Zhang, P.; Yang, B.Z.; Wang, T. Effects of spatio-temporal and environmental factors on the fishing ground of Sthenoteuthis oualaniensis in the south China sea based on the Generalized Additive Model. Mar. Sci. Bu. 2021, 40, 217–223. [Google Scholar]
- Yang, I.A.G.; Pierce, G.J.; Murphy, J.; Daly, H.I.; Bailey., N. Application of the Gómez-Muñoz model to estimate catch and effort in squid fisheries in Scotland. Fish. Res. 2006, 78, 26–38. [Google Scholar] [CrossRef]
Disclaimer/Publisher’s Note: The statements, opinions and data contained in all publications are solely those of the individual author(s) and contributor(s) and not of MDPI and/or the editor(s). MDPI and/or the editor(s) disclaim responsibility for any injury to people or property resulting from any ideas, methods, instructions or products referred to in the content. |
© 2022 by the authors. Licensee MDPI, Basel, Switzerland. This article is an open access article distributed under the terms and conditions of the Creative Commons Attribution (CC BY) license (https://creativecommons.org/licenses/by/4.0/).