Article

Which Fish Benefit from the Combined Influence of Eutrophication and Warming in the Dnipro River (Ukraine)?

by
Anastasiia Zymaroieva
1,2,3,*,
Dmytro Bondarev
4,
Olga Kunakh
5,
Jens-Christian Svenning
3 and
Oleksandr Zhukov
6,*
1
Aarhus Institute of Advanced Studies, Høegh-Guldbergs Gade 6B, DK-8000 Aarhus, Denmark
2
Department of Ecology, Polissia National University, Stary Boulevard 7, 10008 Zhytomyr, Ukraine
3
Center for Biodiversity Dynamics in a Changing World, Department of Biology, Aarhus University, DK-8000 Aarhus, Denmark
4
“Dnipro-Orylskiy” Nature Reserve, Dniprovsk District, Dnipropetrovsk Region, 52030 Obukhovka, Ukraine
5
Department of Zoology and Ecology, Oles Gonchar Dnipro National University, Gagarin Av., 72, 49000 Dnipro, Ukraine
6
Department of Botany and Horticulture, Bogdan Khmelnytskyi Melitopol State Pedagogical University, Hetmanska St., 20, 72318 Melitopol, Ukraine
*
Authors to whom correspondence should be addressed.
Fishes 2023, 8(1), 14; https://doi.org/10.3390/fishes8010014
Submission received: 18 November 2022 / Revised: 18 December 2022 / Accepted: 22 December 2022 / Published: 26 December 2022
(This article belongs to the Section Environment and Climate Change)

Abstract

:
The effects of climate warming and eutrophication on aquatic organisms are well established, but we lack a deep understanding of the selective mechanisms of fish communities towards eutrophication and warming in tandem. The aim of the study was to identify fish traits that were positively related to eutrophication and ongoing warming. The research was conducted for 19 years in the Dnipro River channel and floodplain water system of the “Dnipro-Orylskiy” Nature Reserve. Both categorical and continuous fish traits were considered. The study area is characterized by a more intense warming trend than the average for Europe, which reflects an increase in the maximum summer air temperature. At the same time, the concentration of chlorophyll-a had a monotonic tendency to decrease during the study period. Phytophilic, limnophilic, and freshwater fish species are increasing in abundance, while rheophilic and lithophilic fish are decreasing due to global warming. Fish species with greater vulnerability and resilience have selective advantages in terms of global warming. Pelagic fish species are the most resistant to eutrophication, while benthopelagic and phytolithophilic fish species are the most sensitive. Brackish-water demersal self-settled species of marine origin have a competitive advantage over other native freshwater species in the face of increasing symptoms of eutrophication and a warming climate.

1. Introduction

Eutrophication has affected most of the world’s freshwater ecosystems to varying degrees [1,2,3,4] and is usually caused by an increasing amount of nutrients entering aquatic ecosystems from urban and industrial wastewater, erosion runoff, and leaching from agricultural areas [5]. Since eutrophication increases primary production and alters the distribution, taxonomic diversity, and relative abundance of primary producers in the aquatic environment, it influences the composition and location of resources, the flow of energy, and biomass throughout the food webs [6,7]. Such ecological changes influence populations of freshwater biota, and particularly fish. Eutrophication can lead to undesirable shifts in the composition of fish communities [8].
Severe environmental stresses such as climate change are also altering key ecological mechanisms that determine the abundance and distribution of freshwater fish communities around the world [9,10,11]. The warming climate is causing complex changes in the structure of fish communities through direct and indirect effects on fish metabolism, biotic interactions, and geographic distribution [12]. Global warming causes the spread of several species, including invasive species that may compete with local or native species for space and food in newly colonized ecosystems. Thus, with the warming of water in lakes, the number of strictly herbivorous fish in fish communities decreases, but the number of omnivorous fish increases [13]. Another consequence of climate change is the increased frequency and severity of extreme heat waves in the last decade, which have caused massive fish kills [2,12,14,15]. Often, heat waves are accompanied by violent algae blooms, which increase the negative effect on aquatic organisms [2,16].
The effects of climate change or eutrophication on freshwater biota are difficult to separate because of the simultaneous effects and their interdependence. Thus, eutrophication symptoms in freshwaters are becoming more severe due to climate change, which in turn creates conditions that increase the nutrient load in aquatic ecosystems and enable fast algal blooms [2,17,18,19,20]. On the other hand, recent research implies that eutrophication itself may facilitate climate change by decreasing seagrass beds’ capacity to store carbon [2,21] and releasing methane and nitrous oxide into the atmosphere [3,22]. The negative effects of climate change and eutrophication on fish communities and the positive feedback loop between these threats are compelling, but how fish respond to the combined effects of these threats remains less clear.
The Dnipro is the third largest river in Europe and covers 48% of the territory of Ukraine. Accelerated eutrophication from municipal and agricultural discharges, industrial pollution, and radionuclide contamination of reservoir bottom sediments are the most important causes of the Dnipro River biota transformation. The Dnipro-Zaporizhzhya-Kryvyi Rih triangle was recognized as a territory heavily affected by pollutants generated by many activities, including heavy industry, oil refining, metallurgy, petrochemistry, mining, and energy [23]. Nutrient input into the Dnipro River increased by approximately ten times from the 1960s until the 1990s as fertilizer usage was drastically extended in the agricultural sector [24,25]. In the 1970s, the Dnipro suffered from particularly severe eutrophication compared to other freshwater bodies of the USSR due to the strong cyanophyte blooms that occurred in the Dnipro reservoirs [26]. The main reasons for the ecosystem transformation of the Dnipro River are the construction of a dam system and regulation of water flow, eutrophication, recreation, and overfishing. These processes began to develop in different periods, but at present, their impacts are interrelated. The creation of the Dnipro-Orylskiy Reserve made it possible to minimize the negative impact of recreation and fishing. Therefore, the evaluation of the temporary dynamics of fish communities within the Dnipro-Orylskiy Reserve provides an opportunity to find out the nature of the impacts of flow regulation, climate change, and eutrophication.
Functional traits of organisms are used for developing models to predict the response of ecological communities to abiotic and biotic perturbations [27,28]. The understanding and prediction of ecological processes based on species traits are believed to be the “Holy Grail” in ecology [29]. Fish traits related to growth, maturation, and longevity respond most strongly to the environment. The traits vary with temperature at large spatial scales and with depth and seasonality at more local scales [30]. The relationship between eutrophication and fish traits has only been studied in a few studies, mostly in lakes, with contrasting results [31]. There have been no studies of the combined effect of climate and eutrophication on fish trait variations in the highly anthropogenically transformed Dnipro River.
The study material was juvenile fish caught from 1998 to 2015 in the Dnipro River channel and floodplain water system within the territory of the “Dnipro-Orylskiy” Nature Reserve. The research with juveniles is reasonable because the response of young fish communities to environmental changes is relatively fast, both in the case of negative and positive impacts [32,33,34]. Larval and juvenile phases of fish development are more sensitive to abiotic conditions and are indicators of spawning success and efficiency [35]. The species composition of adult fish communities is similar to that of juveniles [36]. The ecological monitoring of young fish can be especially useful in large and medium-sized rivers, where the representative sampling of adult fish is almost impossible [37]. Many fish species aged over one year migrate to deeper parts of rivers, but their young fish concentrate in shallow waters [38,39,40], where they can easily be collected, regardless of the size of the river. In large rivers, young fish are easier to sample than adults, so the actual structure of fish communities in certain places is assumed to be better estimated by sampling young fish [41]. The unified method of accounting and the strategy of monitoring young fish populations can be applied to the whole river with the same catch efficiency, but this is impossible for older fish [42].
So, in this study, we aim to find out which fish traits are positively related to eutrophication and ongoing climate change. We hypothesize that in heavily regulated aquatic ecosystems of the Dnipro River, climate change and eutrophication have affected fish community structure, life history, feeding habits, reproduction, migration, and other attributes, resulting in significant changes in ecosystem functioning.

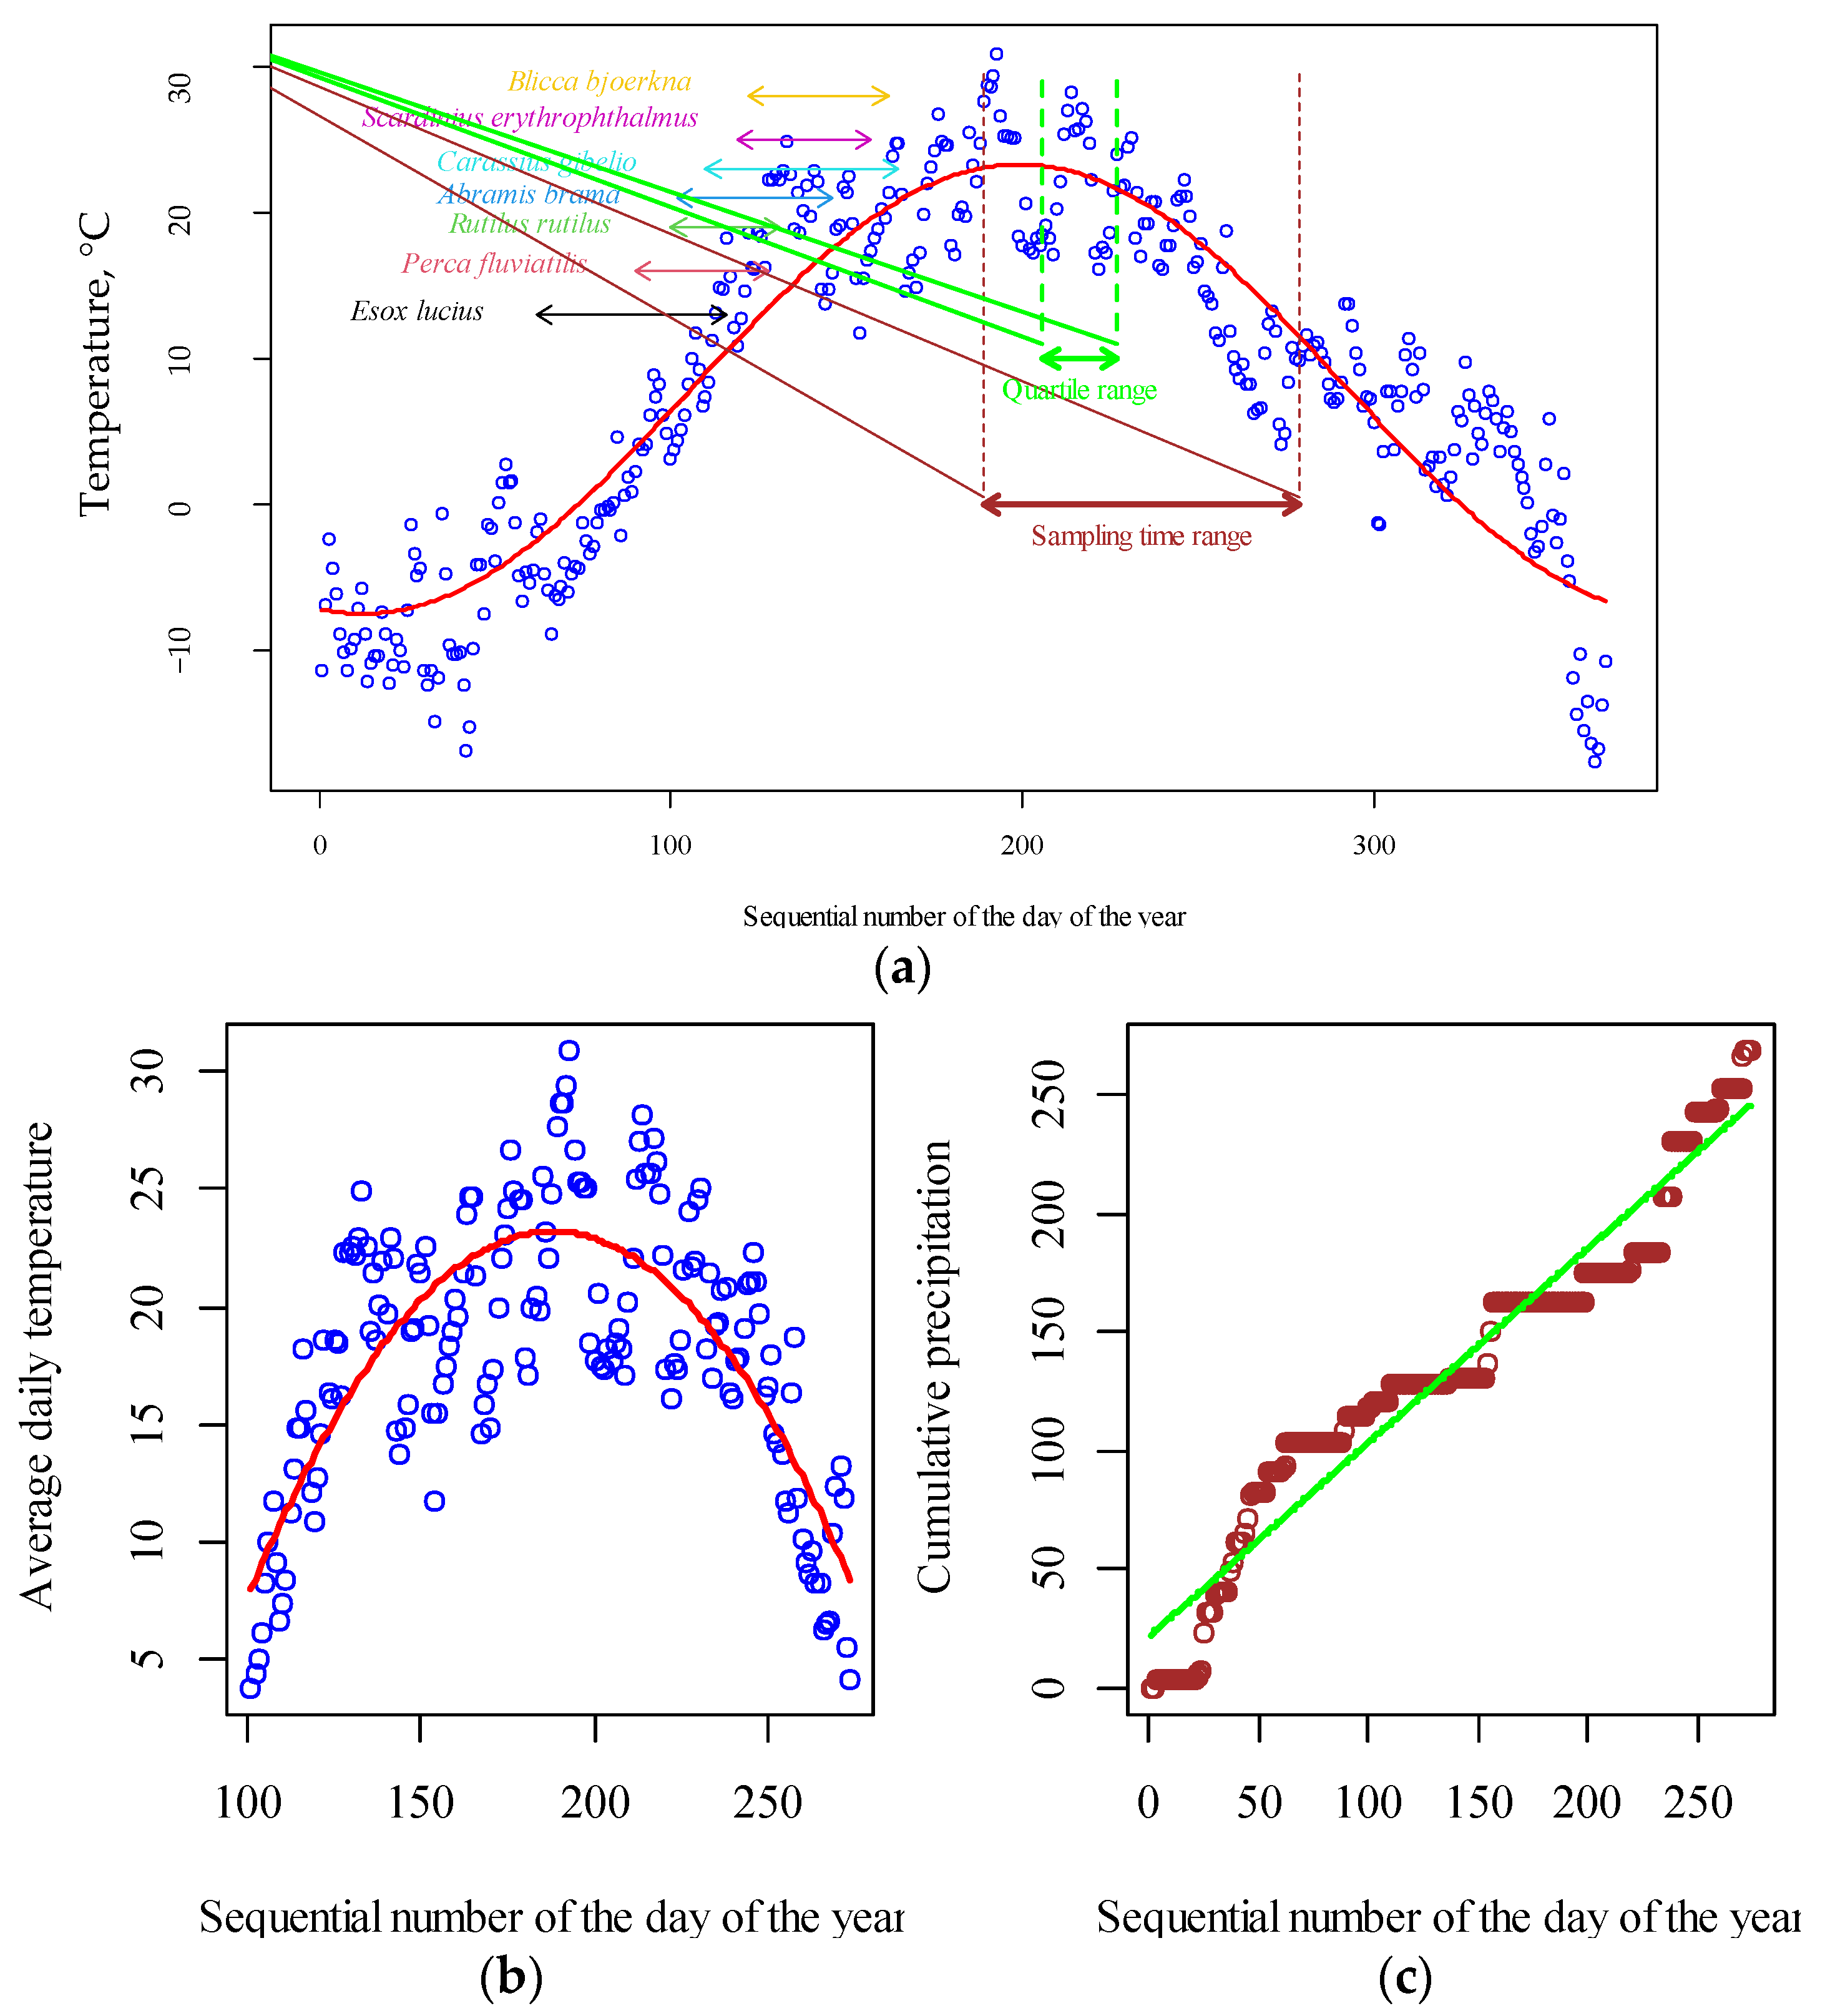
2. Materials and Methods

2.1. Study Sites

The research was conducted in the waters of the “Dnipro-Orylskiy” Nature Reserve (Figure 1). The Reserve was created in 1990. The area is 3766 hectares, of which the water bodies are 203 hectares [43]. Intensive changes in the relief on the territory of the “Dnipro-Orylskiy” Nature Reserve occurred after the construction of the Dnipro Hydroelectric Station dam in 1932. This led to an increase in the water level of the study territory by 1.5–2 m, which corresponds to an average level of 49.7 m above sea level. During the Second World War, the dam was destroyed (1941), which returned the water level to its previous state. After the dam was rebuilt in 1950, the water level rose again. After the start of the second Dnipro Hydroelectric Station block in the 1960s and the construction of the Dniprodzerzhinsk (Kamianske) Hydroelectric Power Plant, the water level was raised even more—to 51.4 m above sea level. Thus, after the construction of the Dnipro reservoir cascade, the total Dnipro level rise in the “Dnipro-Orylskiy” Nature Reserve area, compared to its natural level, was 3.0–3.5 m, which led to the inundation of part of the floodplain, changes in the configuration of banks and the area of water bodies. The studied water bodies are the Dnipro riverbed and floodplain water system.
The biotopes studied can be grouped into five groups.
Water reservoirs of the Mykolaevka ledge system. The system of floodplain ponds is located in the narrowest part of the floodplain terrace. The ponds extend a narrow strip along the channel of the Dnipro. The maximum distance of water bodies from the Dnipro riverbed within the Reserve is about 300–1000 m. Water bodies are characterized by significant levels of flow and water level differences during the day, which depends on the conditions of the reservoir operation. Part of the water bodies that are connected to the specified area by separate streams is outside the Reserve. The area of shallow water areas (littoral zone) is minimal due to steep banks, which are typical for the reservoirs in this area. Maximum depths are 5–6 m. In recent years, the reservoirs in the central part of this section have begun to be actively silted and overlapped by sandy sediments due to the accumulation of excessive bottom deposits caused by disturbance of the reservoir water regime. Samples were taken from five sites. The macrophyte community is represented by 30 species, dominated by Myriophyllum spicatum L., Nuphar lutea (L.) Smith, Phragmites australis (Cav.) Trin.ex Steud., Trapa borysthenica V. Vassil., Typha angustifolia L., and Ceratophyllum demersum L. Such plant species as Veronica anagallis-aquatica L., Alisma plantago-aquatica L., and Bolboschoenus maritimus (L.) Palla were found exclusively in this group of water bodies.
Water area of the Dnipro River channel part. The group of biotopes includes part of the upper section of the Dnipro Reservoir, where the river flow regime is partially retained. The water regime is characterized by a significant level of flow and movement of sand masses, which is associated with active channel processes in this part of the reservoir. Depths fluctuate within 2–7 m. Samples were collected from nine sites. The macrophyte community is represented by 32 species, dominated by Myriophyllum spicatum L., Phragmites australis (Cav.) Trin.ex Steud., Potamogeton crispus L., Typha angustifolia L., and Nuphar lutea (L.) Smith. No unique macrophyte species were found for this group of water bodies.
Water bodies of the Taromske ledge system. The system of floodplain ponds is located in the low part of the floodplain terrace. All lakes are separated from the Dnipro riverbed by a sand wall. The lakes are connected to each other and to the channel of the Dnipro by numerous waterways. Most lakes have a significant littoral zone that is actively overgrown with aquatic macrophytes. Depths fluctuate between 1–10 m. Water is exchanged through the operation of the reservoir and spring floods. The maximum distance of individual ponds from the Dnipro riverbed is about two kilometers. Currently, due to the unbalanced functioning of the reservoir, the water bodies in this area are actively swamped and silted. In some areas, the thickness of silt sediments reaches 0.3–0.7 m. Samples were collected from nine sites. The macrophyte community is represented by 56 species, dominated by Phragmites australis (Cav.) Trin.ex Steud., Typha angustifolia L., Ceratophyllum demersum L., Stratiotes aloides L., Lemna trisulca L., Trapa borysthenica V. Vassil. Plants like Cyperus flavescens Reichenb and Sparganium erectum L. were only found in this group of water bodies.
Water bodies of the Obukhiv floodplain system. Most of them are weakly flowing, shallow water bodies, being the remnants of the lower part of the channel of the Dnipro River, which connected the Dnipro with the floodplain system of the Oril River. They were flooded as a result of the reservoir’s formation. They function under the significant influence of the reservoir water regime. They are characterized by significant sedimentation (in some areas, silt thickness reaches 0.6–1.0 m) and an overgrowth of aquatic macrophytes. They are connected to the Dnipro River and the mouth of the Oril River by narrow channels. The largest distance to the Dnipro River within this section is about 2 km. Samples were collected at three sites. The macrophyte community is represented by 56 species, dominated by Phragmites australis (Cav.) Trin.ex Steud., Ceratophyllum demersum L., Typha angustifolia L., Lemna trisulca L., Ceratophyllum submersum L., and Sium latifolium L. Such plant species as Caltha palustris L., Galium palustre L., and Solanum dulcamara L. were found exclusively in this group of water bodies.
The mouth of the Oril River. The estuary section of the Orel River was artificially created in the early 1960s of the 20th century by diverting the natural channel of the Orel River into the Dnipro (Zaporozhye) reservoir. This need arose during the large-scale hydro construction and creation of a cascade of reservoirs on the Dnipro River. The main purpose of this activity was to preserve the ways of natural spawning migration and sustainable fish reproduction in the water area of the upper section of the Dnipro (Zaporozhye) reservoir. For the most part, this artificial canal was laid along the remnants of the Prototch River system, which had a narrow strip of water flowing in the opposite direction along the Dnipro River from Obukhovka village. The functioning of the hydrological regime of the reservoir largely depends on the daily regulation of the water level in the reservoir. This is especially true during the summer when the almost daily reverse flow is observed as the reservoir’s water level drops. In the spring period, the natural flow of the Oril is expressed to a much greater extent, and the impact of the reservoir is reduced. The site is characterized by a limited area of coastal biotopes, which is explained by its artificial origin. The water reservoir is in close contact with the water area of the Obukhovskaya floodplain. The longest distance from the Dnipro riverbed is about 2 km. The total length of the site within the Reserve does not exceed 5 km. Obukhovka village and a significant number of recreation centers are located on the left bank of the Oril, which considerably increases the anthropogenic load on the water area of this area. Maximum depths reach 8-10 m (exactly near the inflow point). In higher water areas, the depth does not exceed 4 m. Samples were collected from four sites. The macrophyte community is represented by 25 species, dominated by Myriophyllum spicatum L., Vallisneria spiralis L., Potamogeton perfoliatus L., Phragmites australis (Cav.) Trin.ex Steud., Potamogeton crispus L., and Elodea canadensis Michx. No unique macrophyte species were found for this group of water bodies.

2.2. Fish Sampling

Ichthyological sampling was conducted using the protocol for studying the quantitative and qualitative composition of fish communities [44]. Fish sampling was carried out in various biotopes of coastal zones. Flat bottoms allowed the use of seine nets [45]. The main advantages of using seines are low selectivity and simplicity of manipulation during the catch [46,47,48]. Catching was done in the coastal zone with a 15-m-long and 2-m-high beach seine with a bag (mesh size 3 mm). One end of the beach seine was held on the shore. The other was fully stretched perpendicular to the shore. The closing of the seine was carried out on the shore. Each haul covered an area of about 50–300 m2. The depth at the catch locations did not exceed 1.7 m. Five hundred seventy samples were collected in the analyzed reservoir area over the course of the study. Samples contained both adult and juvenile fish. Only juvenile fish are reported in the study. The fish was considered a juvenile until the moment when it became scaly, morphologically resembled an adult, and reached sexual maturity [49]. The age of the fish was determined based on the work of N. I. Chugunova [50]. Fish were sampled between 189 and 274 days from the start of the year, with the second and third quartiles ranging from 217 to 227 days from the start of the year (Figure 2a). The results of fish catches are presented as the number of fish individuals per 100 m2.

2.3. Fish Traits

Categorical and continuous traits of species were considered in this study. Migration, preferred habitats, preference for water flow rate, the zone of water bodies for feeding and spawning, and preference for water salinity were considered as the categorical fish traits (Appendix A: Table A1). Trophic level, resilience, and vulnerability were considered to be the continuous traits of the fish.
Migration (M) is a parameter providing information about the type of migration of fish species [51]. Migration is the movement of a large number of individuals from one place to another to meet feeding or breeding needs [52] and is classified into the following categories: potamodromous (pot) are migratory fish species that spend the entire life cycle in freshwater bodies [53]; diadromous (dia) migratory fish species spend a part of the life cycle in fresh water, and a part in salt water [54,55]; and no migration (nom) is a species with no migratory movements [56]. Diadromous fishes are considered sensitive because of their highly specialized lifestyle involving migration between marine and freshwater habitats [57,58]. Potamodromous fish primarily migrate in freshwater and are therefore considered less sensitive [59].
Fish are divided into pelagic, benthopelagic, and demersal according to their preferred habitat (H) [60]. The pelagic (pel) species live and feed in the pelagic (free water) zone [61]. The benthopelagic (ben) species live and feed near the bottom as well as midwaters or near the water surface [51,62]. Demersal (dem) species live and feed near the bottom [63,64]. The benthopelagic fish are regarded as a part of the demersal fish, which also include strictly benthic fish.
Fish are divided into rheophilic, limnophilic, and eurytopic according to a preference for water velocity (R) [65]. The rheophilic (rhe) fish prefer to live in a habitat with high- flow conditions and clear water [66]. The limnophilic (lim) fish prefer to live in a habitat with slow flowing to stagnant conditions [67,68]. The eurytopic (eur) fish exhibit a wide tolerance of flow conditions, although they are generally not considered to be rheophilic [56,69].
Fish are classified as water column or benthic based on their preferred feeding habitat (FH) [70]. The water column fish (wc) feed in the water column and usually do not go to the bottom to search for food. Benthic fish (ben) prefer to live near the bottom, from where they take food. They usually do not go to the surface for feeding purposes [71,72].
Habitat-related parameters describe the preferred habitat for the reproduction of a fish species (RH) [73]. The fish species preferring to spawn on rock and gravel substrates are referred to as lithophilic (lit) [73]. Phytophilic fish (phy) spawn on plants submerged in water [74,75,76]. Phyto-lithophilic species (pli) spawn on submerged plants or on rock-gravel substrates [77]. Psammophilic species (psa) are sandy spawners. Other species (oth) can spawn in a variety of different substrates, including mollusk shells [78].
Fish can be divided by their preference for water salinity (S) into freshwater (fre), freshwater-brackish (fbr), and freshwater-brackish-marine (fbm) [79,80]. The categorical traits of fish data were obtained from the freshwaterecology.info database [56].
The trophic level (TrL) indicates the position of fish in the respective food chains [81]. The trophic level in the food chain is denoted by a whole number (primary producers and detritus are denoted by 1), but a particular species usually have a complex diet, so its trophic level is denoted by a fractional number, and the variable that represents the trophic level of that species is a continuous variable [82].
Resilience describes the ability of a species population to recover after a perturbance [83] and can be rated as low, medium, or high [84]. The population doubling time is a good indicator of resilience [85]. Intrinsic vulnerability (V) to fishing can be assessed from knowledge of the life history and ecological traits of the fish [86]. Large fish with slow growth, a long life span, and late reproduction are most vulnerable [87]. FishBase provides continuous vulnerability values ranging from extremely low to extremely high (0-100). Continuous trait data from the FishBase database was loaded using the rfishbase library [88].

2.4. Landsat 5/TM, 7/ETM, and 8 OLI Data

Remote sensing data can be used to effectively monitor temperature and chlorophyll-a concentrations in water bodies [89]. Landsat 5/TM, Landsat 7/ETM, and Landsat 8 OLI satellites were launched on 1 March 1984, 15 April 1999, 11 February 2013, respectively. The USGS has reprocessed the Landsat archive and released Collection 2 in December 2020. Improved surface control and elevation datasets were implemented, some improvements were made to the geometric and radiometric calibration, and the atmospheric correction algorithm was upgraded. Landsat 5/TM, Landsat 7/ETM, and Landsat 8 OLI Collection 2 Level 2 products were obtained from the USGS website through the EarthExplorer tool [90]. Satellite images were geometrically corrected, radiometrically calibrated, and atmospherically corrected and can be used directly after processing according to the following formula:
bλ = 0.0000275 × Pixlel Value − 0.2,
The surface temperature (°C) was estimated using the spectral bands b6 (Landsat 5/TM, Landsat 7/ETM) and b10 (Landsat 8 OLI) using the formula:
T = b6 (or b10) 0.00341802 − 124,
Table A2 presents the dates of the Landsat 5/TM, Landsat 7/ETM, and Landsat 8 OLI images used in the study.

2.5. Remote Sensing Estimation of Chlorophyll-a Concentration

Chlorophyll-a (Chl-a) is a photosynthetic pigment present in all algal groups of inland water bodies. The broad bands of Landsat satellite data cannot spectrally distinguish the spectral features associated with Chl-a absorption. The Chl-a absorption in the red range of 670 nm is only half contained in the red band of Landsat data. The absorption peak near 700 nm is completely absent in the Landsat red band. This means that the Chl-a cannot be estimated from the Landsat bands similar to the application of the field spectral regression analysis. Therefore, different methods were used to estimate Chl-a levels from Landsat data [91]. The studies showed that combinations of bands, including ratios, multiplication, and/or mean, can provide useful relationships for estimating Chl-a concentrations [92,93]. The most successful regression was found at the band ratios b4/b3 (for Landsat 5/TM and Landsat 7/ETM) or b5/b4 (for Landsat 8 OLI) to retrieve Chl-a concentrations for the lake as follows:
Ch_a = k · b0.76–0.90/b0.63–0.69 + c,
where b0.76–0.90/b0.63–0.69 is the spectral ratio, k and c are regression coefficients. The regression coefficients varied slightly from paper to paper, which may also be due to the different range of spectral ratios used to derive the coefficients of the regression model. The spectral ratio ranged from 0.1–0.25 [94], 0.3–0.68 [91], and 0.78–1.0 [95]. The spectral ratio in our study was in the range 0.88–1.51. On this basis, the following model was chosen [95]:
Ch_a = 98.87 · b0.76–0.90/b0.63–0.69 − 59.40.
This model’s estimates of chlorophyll concentration range from 40–136 µg/g (mean ± st.error was 81.5 ± 0.99 µg/g). These estimates are consistent with those obtained in laboratory studies of water in the Dnipro River [96,97]

2.6. Climatic Data

During the study period, the sampling was carried out in the range of 189–274 days from the beginning of the year, i.e., during the summer and early autumn. Obviously, the climatic characteristics at the moment of sampling or at any given date are not identical between years. Therefore, to describe the fish community dynamics, it is necessary to rely on characteristics of climatic regimes, which reflect annual or seasonal patterns but are independent of specific dates. Therefore, to describe the ecological properties of the environment, we applied indicators derived from the analytical descriptions of trends in the variability of air and water temperature, precipitation, and chlorophyll-a concentrations.
The annual course of the temperature follows a sinusoidal pattern (Figure 2a). In the period of the year from 100 to 275 days, the temperature trend could be described with the use of a parabola (Figure 2b).
The quadratic equation is a model of a parabola and has the form:
T = kt · Order2 + a · Order + b,
where T is the average daily temperature (°C), Order is the sequence number of days since the beginning of the year, kt, a, b are regression coefficients. Based on regression coefficients, we can estimate the quantitative properties of the parabola, which have a physical meaning and can be used as quantitative variables to describe the temperature regime of the year. The first derivative of the quadratic function over time (t) has the form:
d T d t = 2 k t   Order + a ,
The coefficient 2kt is the slope of the line, which represents the rate of temperature change during the time range under study: the greater the coefficient modulo, the faster is the heating of atmospheric air before the temperature trend reaches the maximum, and the faster is the cooling after the temperature trend reaches the maximum. The time of maximum onset corresponds to the moment when the derivative is equal to zero (Extr):
d T d t = 2 k t   Order + a = 0 ,
  Order = a 2 k t
At this point, the temperature trend reaches its maximum:
Max = a 2 a 2 k t + b
The quadratic model can be parameterized by R2, which characterizes the degree of deviation of temperature indicators from the trend. Thus, we used four indicators as predictors of fish community structure dynamics: temperature trend rate (2kt), time of summer temperature maximum (Extr), temperature value when the trend reaches its maximum (Max), and degree of temperature regime variability (R2).
Cumulative precipitation (the sum of precipitation since the beginning of the year on a given date) showed a linear trend (Figure 2c), which can be described by a linear dependence:
Pc = kp · Order,
where Pc is the cumulative precipitation (mm), Order is the sequence number of days since the beginning of the year, kp, is regression coefficient. The explanatory power of the regression model can be characterized by R2. Precipitation evened out in time gives a high value of R2, and periods of heavy precipitation and droughts give a decrease in this indicator.
Data on average daily atmospheric air temperature and daily precipitation in the city of Dnipro were obtained from NOAA Weather Data [98].

2.7. Chlorophyll-a Concentration and Water Temperature Correction

The estimates of chlorophyll-a concentration and water temperature were made on different dates during a particular year. Obviously, a scaled indicator that can be compared between years should be used as an explanatory variable for the fish community. Estimates of maximum chlorophyll-a concentrations throughout the year and water temperature at the peak of the seasonal trend can be used as explanatory variables. Daily air temperature measurements are available over the study period, so the date of the local maximum air temperature can be used to determine when local maximum chlorophyll-a concentrations and water temperatures occur. The chlorophyll-a concentration and water temperature of the water bodies exhibit a seasonal pattern that can be described by a quadratic equation (Figure 3). The coefficients of the quadratic equation allow us to find that the maximum chlorophyll-a concentration during the study period was observed at 3.59/(2 ∗ 0.0089) = 201.7 days.
The air temperature maximum was on average observed on day 197 of the year during the study period. Thus, if other factors are omitted, we can assume that the maximum chlorophyll-a concentration was observed 4.7 days later than the seasonal maximum air temperature. Thus, based on the information about the seasonal course of air temperatures, which are constantly fixed, it is possible to estimate the onset of the seasonal maximum of chlorophyll-a concentration in water. Similarly, based on the quadratic dependence coefficients, we can find that the maximum water temperature was observed at 1.75/(2 × 0.0043) = 203.5 days. Thus, if we neglect other factors, we can assume that the maximum water temperature was observed 6.5 days later than the seasonal maximum air temperature.
The date of the satellite image, on the basis of which the chlorophyll-a concentration and water temperature were estimated, and the date of the maximum of these indicators form the shift (Δx, days) that distances the observed indicator from the annual maximum. Knowing the shape of the time dependence of a given indicator and assuming it is constant between years, a correction factor (Δy, mg/m3 for chlorophyll-a concentration, or °C for water temperature) can be found to calculate the annual maximum of the indicator based on information about the time of the maximum indicator and the time of the space survey (see the Appendix B for details):
Δy = −k Δx2,
where Δy is the correction factor to estimate the annual maximum of the index from the observed value, k is the coefficient of the quadratic term of the parabolic dependence, Δx is the time shift between the date of the space survey and the date of the annual maximum of the index.

2.8. Data Analysis

The gamma diversity of the fish metacommunity and its partitioning into alpha- and beta-components was performed using the Divest function from the entropart library [99] for the order of diversity was 1, which corresponds to the number of species as a measure of the diversity.
Multivariate data analysis techniques enabled the discovery of relationships between species abundance, environmental factors, and species traits [100]. RLQ and fourth corner analysis are effective for estimating the covariance between environmental variables and traits [101] are the most integrated methods for analyzing trait-environment relationships [102]. RLQ analysis is an extension of coinertia analysis that provides an examination of multivariate associations by finding a combination of traits (Q-matrix) and environmental variables (R-matrix) with maximum covariance that is weighted by the abundance of species at sites (L-matrix) [103]. R-, L-, and Q-matrix analysis was performed separately before performing the RLQ analysis [104]. Correspondence analysis was applied to the species matrix [105]. The trait data matrix and environmental factor matrix contained both quantitative and categorical variables. Hill and Smith’s analysis [106] considers a combination of different types of variables, so it was used to analyze R- and Q-matrices. The RLQ analysis combined three separate ordinations and revealed the principal associations between the R- and Q-matrices weighted by the L-matrix [107]. In the RLQ analysis, the site scores in the R-matrix constrain the site scores in the L-matrix, and the species scores in the Q-matrix constrain the species scores in the L-matrix. The axis maximizing the covariance in the L-matrix is then selected, providing a compromise between the best joint combination of site scores on their ecological characteristics, the best combination of species scores on their traits, and the simultaneous ordination of sites and scores. The total significance of the relationship between ecological variables (R-matrix) and species traits (Q-matrix) was evaluated using a Monte Carlo test with 999 permutations on the total inertia of RLQ analyses [103]. The fourth-angle method was used to test the significance of all possible pairwise associations between individual traits and environmental variables. The Pearson product-moment correlation coefficient (r) was used to compare the two variables [108]. The significance of the relationship measure was assessed by permuting the R and Q table rows simultaneously (999 runs) [103]. RLQ and fourth-angle analyses were performed in the R ade4 package [109].

3. Results

3.1. Temporal Variability of Climatic Regime and Eutrophication Level of Water Bodies

The principal component analysis of the environmental variables identified two principal components with eigenvalues exceeding unity (Table 1).
Principal component 1 explained 62.5% of the variation in traits and reflected the opposite trend in the atmospheric temperature and precipitation. The increase in the maximum seasonal temperature trend was associated with an increase in air temperature variation and the rate of the seasonal change in temperature and precipitation, as well as the acceleration of the date of the seasonal temperature maximum. The principal component 1 described a tendency for the water temperature to increase following an increase in atmospheric temperature and an increase in the level of eutrophication of water bodies. The time factor (year) explained 69.8% of the variation in the principal component 1 (F = 210.6, p < 0.001), and the reservoir type explained only 19.9% of the variation (F = 203.8, p < 0.001). The principal component 1 exhibited a temporal trend (Figure 4a), which could be described by the equation:
PC1 = 0.12 Year − 246.6 (R2 = 0.45, p < 0.001),
where PC1 is the scores of the principal component, Year is time as a continuous variable.
The water bodies of the mouth of the Oril River and the water area of the Dnipro River channel part differ significantly from all other water bodies by the values of principal component 1 (planned comparison F = 363.5, p < 0.001 and F = 315.5, p < 0.001, respectively) (Figure 4c). This difference indicated the lower water temperatures and chlorophyll-a concentrations in these reservoirs under equal climatic conditions.
The principal component 2 reflected a trend in the variability of water temperature and chlorophyll-a concentration. The concentration of chlorophyll-a increased with an increase in water temperature and an increase in the rate of seasonal change and variation in precipitation, as well as a lag in the timing of the seasonal maximum temperature. In the variation of principal component 2, the time (year) factor explained only 15.4% of the variation (F = 29.4, p < 0.001), and the reservoir type factor described 68.3% (F = 458.1, p < 0.001). The principal component 2 exhibited a temporal trend (Figure 4b), which could be described by the equation:
PC2 = −0.06 Year − 120.5 (R2 = 0.11, p < 0.001),
where PC2 is the scores of the principal component, Year is time as a continuous variable.
The water bodies of the Dnipro River channel and mouth of the Oril River differ from all other water bodies by the decreased values of principal component 2 (Figure 4d), which indicate a regularly lower concentration of chlorophyll-a and lower water temperature in these water bodies.

3.2. Fish Community Diversity

A total of 33,622 individuals representing 38 fish species were recorded over the period of the study (Appendix C: Table A3). The most abundant species in the reservoirs of the mouth of the Oril River were Alburnus alburnus, Esox lucius, Rutilus rutilus, Syngnathus abaster, and Proterorhinus marmoratus, in the reservoirs of the Mykolaevka ledge system were Rutilus rutilus, Proterorhinus marmoratus, Scardinius erythrophthalmus, and Petroleuciscus borysthenicus, in the reservoirs of the Obukhiv floodplain system were Rhodeus sericeus, Alburnus alburnus, Rutilus rutilus, Pungitius platygaster, and Scardinius erythrophthalmus, in the reservoirs of the Dnipro River channel part were Rutilus rutilus, Proterorhinus marmoratus, Alburnus alburnus, Rhodeus sericeus, and Neogobius fluviatilis, in the reservoirs of the Taromske ledge system were Rutilus rutilus, Petroleuciscus borysthenicus, Rhodeus sericeus, Esox lucius, Scardinius erythrophthalmus.
Alpha diversity of the fish metacommunity was 22.1 species and ranged from 22.0–22.2 species in 95% of cases (Appendix C: Figure A2). Gamma diversity was 38.2 species and ranged from 37.1–38.3 species in 95% of cases. Beta diversity was 1.73 and ranged from 1.67–1.74 in 95% of cases. Twenty-nine species occurred at least 12 times. These species were used for further analysis.

3.3. Fish Community Ordination

An eigenvalues decomposition table gives the eigenvalues and their square root (Covar) (Table A4). The eigenvalues showed that the first two axes extracted from the RLQ analysis described 98.7% inertia, indicating the major relationships between fish traits and environmental variables can be explained using the first two RLQ axes. The covariance is equal to the product of the correlation between the environmental scores of sites and the species trait scores and the standard deviations of the environmental score and the species trait score. The maximum possible values of inertia (Table A5) were obtained by a simple analysis of the original tables of environmental properties and species traits, which define the basic structures of the corresponding dataset. A comparison of the amount of variance covered by the RLQ analysis (inertia) with the maximum possible value of inertia provided by the simple analysis showed that an important part of the information contained in each original structure is preserved in the co-structure.
A multivariate test based on Model 6 showed the statistical significance of the global importance of the relationships between the traits of species and the properties of the environment (Figure 5, I and II). A four-corner analysis allowed us to assess the statistical significance of the pairwise correlation between species traits and environmental factors (Figure 5, III), species traits and RLQ-axes (Figure 5, IV), and environmental factors and RLQ-axes (Figure 5, V). Water temperature and chlorophyll-a concentration were negatively correlated with the abundance of rheophilic and lithophilic species. The temperature constant kt was positively correlated with the abundance of no migration, limnophilic species and inversely correlated with the rheophilic species abundance. The timing of summer temperature extremes (Extr) was positively correlated with the abundance of rheophilic and lithophilic fish species. The value of the summer maximum temperature (Max) and temperature variation (Rt2) correlated positively with the abundance of no migration and limnophilic species. The rate of the increase of precipitation intensity (kp) and the precipitation variation (Rp2) were negatively correlated with the abundance of no migration species. The constant kp was positively correlated with the brackish-marine species.
The RLQ-axes 1 was positively correlated with rheophilic and lithophilic species and negatively correlated with limnophilic, phytophilic, freshwater no migration species, and resilience and vulnerability (Figure 5 IV, V). The RLQ-axes 2 was correlated positively with phyto-lithophilic and benthopelagic fishes and was correlated negatively with pelagic, eurytopic, and brackish-marine species. The RLQ-axes 1 was positively correlated with the Extr, Rp2, kt, and kp and was negatively correlated with the Max and Rt2. The RLQ-axes 2 was positively correlated with time and was negatively correlated with the water temperature and chlorophyll-a concentration.

3.4. Interpretation of Clusters in Terms of Species Traits

Clustering by agglomerative nesting was performed based on RLQ-axis scores. The Kelley-Gardner-Sutcliffe penalty function showed that the five-cluster solution was the best for a hierarchical cluster tree (Figure 6).
The cluster partitioning was interpreted in terms of species traits (Figure 7). Cluster A included 6 species: Abramis brama, Alburnus alburnus, Leuciscus aspius, Neogobius fluviatilis, Rutilus rutilus, and Squalius cephalus. The peculiarity of this cluster was that all species included in it were benthopelagic and rheophilic, which preferred brackish-water conditions. Cluster B included 4 species: Atherina boyeri, Cobitis taenia, Mesogobius batrachocephalus, and Perca fluviatilis. The peculiarity of this cluster was that the proportion of phyto-lithophilic species for it was the highest, as well as the relatively high trophic level of the species composing it. Cluster C included 8 species: Babka gymnotrachelus, Carassius gibelio, Lepomis gibbosus, Petroleuciscus borysthenicus, Ponticola kessleri, Pseudorasbora parva, Rhodeus sericeus, and Scardinius erythrophthalmus. Nonmigratory, benthopelagic, limnophilic, freshwater species predominate among this cluster. Cluster D included 5 species: Blicca bjoerkna, Esox lucius, Leucaspius delineatus, Sander lucioperca, and Tinca tinca, which were potadromus, demersal and bentopelagic, phytophilic species. These species had the highest trophic, resilience, and vulnerability level. Cluster E included 6 species: Clupeonella cultriventris, Gasterosteus aculeatus, Neogobius melanostomus, Proterorhinus marmoratus, Pungitius platygaster, and Syngnathus abaster. The species of this cluster were diadromous, predominantly demersal, and brackish-marine species, half of which are invasive to the Dnipro.

4. Discussion

4.1. The Role of Climatic Factors in the Dynamics of Eutrophication

Two trends in the variability of ecological properties over time were identified through the study. The main factor contributing to the variability of ecological properties is the trend, which can be explained by global climate change. This trend reflects an increase in the maximum summer air temperature and a shift in the time when this maximum is reached to an earlier period. This trend, importantly, shows a monotonous increasing trend throughout the time of the study. This result is in full agreement with the results found for Europe [110]. On average, in Europe, the increase in the maximum summer temperature is 0.4 °C per decade [111,112]. Our result reveals a much more intense warming, which is 1.3 °C per decade. The increase in the summer maximum temperature is accompanied by a decrease in the intensity of precipitation and the degree of its variation. The general trend of increasing atmospheric air temperature leads to an increase in water temperature and chlorophyll-a concentration. Temperature is the leading factor that stimulates an increase in chlorophyll-a concentration, but at temperatures above 30 °C, the dependence plateaus [113]. The global warming trend leads to rapid warming of water in spring and summer, which should be reflected in phenological shifts in the life cycles of fish and their trophic objects [114,115]. The disruption of the phenological coherence of fish and their trophic objects is also stimulated by the increased variability of the temperature regime, which is increasing due to global warming [116]. Additionally, a decrease in the intensity of precipitation and its variability over time is a trend associated with global warming. The principal component 1 reflects the phenomenon of eutrophication, which is caused by climatic conditions. Other things being equal, climate warming stimulates the intensity of blue-green algae growth [117] and oxygen consumption [118].
The variation in chlorophyll-a concentration is a marker of the second important trend in environmental conditions. This trend reflects a monotonic decrease in chlorophyll-a concentration over the study period. The maximum concentration of inorganic nitrogen compounds in the Dnipro River waters was observed in the 1970s. The maximum concentration of inorganic nitrogen compounds in the Dnipro River waters was observed in the 1970s. The concentration of inorganic phosphorus increased in the 1970s and 1980s owing to the widespread use of phosphorus-containing detergents. At a later time, the nutrient content decreased by 2.0–4.5 times and approached the values recorded before the regulation of the Dnipro River or even decreased slightly [119]. This phenomenon was probably caused by a decrease in the intensity of industrial production [120], as well as an increase in the area occupied by higher aquatic plants capable of assimilating nutrients from water [121,122].
The variation in chlorophyll-a concentration correlates positively with precipitation intensity. This dependence indicates that an important source of excess nutrient input that stimulates water blooms is the erosional flushing of soils during intense precipitation. Agricultural production is an important source of nutrients in freshwater reservoirs, causing eutrophication [123,124]. Intensification of agriculture in the catchment area affects the trophic structure of the fish community [125].The legacy stocks of nitrogen and phosphorus in watersheds may be sufficient to sustain algal blooms and turbid water for decades [126]. Loss of nutrients from the soil due to surface runoff accelerates the eutrophication of surface waters [127,128]. Thus, we observe two formally independent complexes of reasons that affect the temporal dynamics of the level of eutrophication in the Dnipro River and floodplain reservoirs. The climatic factors contribute to the acceleration of the occurrence of eutrophication symptoms at the given level of nutrients in water because of global climate warming. It is natural that this trend tends to increase over the study period. Another trend reflects the variation in the level of eutrophication due to changes in the concentration of nutrients in the water. This trend tends to decrease over time, but this pattern becomes more complex due to the effect of precipitation on the erosion of nutrients that accumulate in the watershed.

4.2. Effects of Global Warming on Fish Communities

Climate warming causes changes in temperature and precipitation regimes, which are the drivers of directional changes in fish community structure. The response of the fish community to global warming was an increase in the abundance of phytophilic, limnophilic and freshwater fish species and a decrease in the abundance of reophilic and lithophilic fish species. The trend of increasing abundance of limnophilic fish species may also be associated with changes in the hydrological regime of the river due to the regulation of its flow [129]. The system of dams that exists on the Dnipro River has turned the river into a sequence of lake-type reservoirs. The building of dams modifies the regime of water flow and nutrient cycling through river networks [130,131]. Significant restructuring of the fish community occurred immediately after the construction of the dams [132,133,134], but the successional dynamics of the community from predominance of rheophilic species towards the predominance of limnophilic fish species continues to the present day [135]. The difficulty in differentiating between the effects of river flow regulation and global climate change is that these factors have a similar effect on the aquatic ecosystem and change in the same direction over time. Increasing temperatures as a result of global climate change are accelerating the growth of aquatic plants [136]. The accumulation of aquatic plant biomass also occurs as a consequence of the absence of floods after the regulation of the river flow [137,138]. The increase in the phytomass of aquatic macrophytes explains the increase in the abundance of phytophilic fish species. The overgrowth of aquatic plants creates favorable conditions for the spawning of phytophilous fish species [139], while the area suitable for the spawning of lithophilous species decreases [140]. Aquatic macrophytes increase surface area and provide shelter, food, and a variety of ecological niches for juvenile fish [141]. Lithophilic species spawn earlier than phytophilic species [142]. Climate warming in general and earlier warming in spring during and after the spawning period can significantly shift the phenological rhythms of fish and their food objects [143,144], to which previously spawning lithophilic species are more sensitive.
As the temperature rises, the amount of dissolved oxygen in the water decreases, increasing the risk of fish hypoxia [145]. Rheophilic fish species are particularly sensitive to oxygen deficiency [59], so the global warming trend is accompanied by a decrease in their abundance. The lake type of water regime leads to a decrease in water mixing [146], which creates conditions for the overheating of the upper layer of water and the deterioration of oxygen supply in deeper layers of water bodies. Global warming influences the selection of fish species, favoring those with greater vulnerability and resilience.

4.3. Effect of Eutrophication on the Fish Community

Low levels of eutrophication are favorable for benthopelagic, and phyto-lithophilic fish species, which are combined in cluster A. Increased eutrophication causes oxygen deficiency, especially in benthic layers, which deteriorates living conditions for benthopelagic fish species.
The zone of the ordination diagram, which corresponds to the greatest influence of eutrophication, is vacant, indicating the extinction of fish at the extreme levels of eutrophication of water bodies. Additionally, this configuration indicates that eutrophication causes an ambiguous response in the fish community. Pelagic fish species are the most resistant to the effects of eutrophication. Pelagic fish show satisfactory population viability with a constant supply of nutrients to their habitat, as they are not directly affected by the oxygen deficiency occurring in benthic habitats [147]. The upper water layers are best supplied with oxygen, which allows pelagic species to survive when living conditions due to eutrophication in the bottom layers of water bodies are severely degraded. Additionally, resistant to the effects of eutrophication are the brackish-water demersal species, which make up the majority in Cluster E. All these species became part of the fish faunistic complex of the Dnipro River as a result of self-dispersal from marine refugia. Such species as Clupeonella cultriventris, Gasterosteus aculeatus, Neogobius melanostomus are invasive to the Dnipro [135]. Invasive fishes can cause local populations to decline and species extinction [148], lead to changes in food webs, and even a general biotic homogenization of fish communities [149]. At the same time, non-native species have a number of adaptations that allow them to inhabit a wide range of environmental conditions [150]. Thus, the demersal species can be assumed to have physiological adaptations to oxygen deficiency, which occurs even in conditions without anthropogenically induced eutrophication. The demersal Neogobius melanostomus can tolerate exposure to low-oxygen water for several days [151]. Members of this cluster are diadromous, euryreophilic species. Many of them prefer substrates other than plants or rocks for spawning. For example, Clupeonella cultriventris is a pelagophilic species spawning in the water column, and the eggs have floatability due to the oil drop attached to the yolk [152]. Gasterosteus aculeatus lays eggs in the nests built by males [153]. Pungitius platygaster males also construct nests of filamentous algae and submerged plants where females lay eggs [154]. Neogobius melanostomus males dig holes, which are used as nests for females to lay eggs [155]. Proterorhinus marmoratus makes spawning nests under rocks, clam shells, or other hard objects [156]. The Syngnathus abaster males incubate large eggs for 20–25 days in a special pouch, which is formed by two folds on the skin on the underside of the tail [157].
Another group of eutrophication-tolerant fish species consists of freshwater species (cluster D), most of which are phytophilous species. This group is represented exclusively by native species, which are either pelagic or demersal species. Thus, eutrophication-tolerant species are distinguished by the criterion of origin and, accordingly, by the degree of preference for water salinity levels: they are self-settled species from marine reservoirs and native freshwater species. Except for differences in the sources of their origin, the eutrophication-tolerant species possess a spectrum of similar traits. These species are pelagic or demersal. Pelagic species inhabit an environment with a better oxygen supply, which is a critical condition in a water bloom situation. The demersal species have adaptations for living in oxygen-deficient conditions that occur in the benthic layers during a mass bloom of blue-green algae. The eutrophication tolerant species are either limnophilic or eurythropic. Such species, unlike rheophilic species, are preadapted to conditions of oxygen deficiency in water.

5. Conclusions

Our study revealed a more intense warming trend than average for Europe, reflecting an increase in the maximum summer air temperature and a shift in the time of reaching this maximum to an earlier period. An increase in the summer maximum temperature is accompanied by a decrease in the intensity of precipitation and the degree of its variation. We also revealed a tendency for a monotonic decrease in chlorophyll-a concentration during the study period. The fish community of the Dnipro River responds to global warming by increasing the abundance of phytophilic, limnophilic, and freshwater fish species and decreasing the abundance of reophilic and lithophilic fish species. Global warming is causing fish species selection that favors species with less vulnerability and greater resilience. Eutrophication causes an ambiguous response in the fish community. The most eutrophication-resistant fish are pelagic species because they are not directly affected by the oxygen deficiency that appears in benthic habitats. The brackish-water demersal species are also resistant to eutrophication’s impacts due to their physiological adaptations to oxygen deficiency. So, self-settled species of marine origin are less sensitive to the level of eutrophication. The increased eutrophication due to more nutrients supplied to the water bodies increases the competitive advantage of this group over other species. Native freshwater species are more sensitive to increased symptoms of eutrophication as the climate warms.

Author Contributions

Conceptualization, O.Z. and A.Z.; methodology, O.Z. and O.K; software, O.Z.; validation, J.-C.S., A.Z. and O.K.; formal analysis, A.Z.; investigation, D.B.; resources, D.B.; data curation, D.B. and A.Z.; writing—original draft preparation, A.Z.; writing—review and editing, O.Z., J.-C.S.; visualization, O.K.; supervision, O.Z.; project administration, A.Z.; funding acquisition, J.-C.S. All authors have read and agreed to the published version of the manuscript.

Funding

We thank the VILLUM FONDEN for economic support via JCS’ VILLUM Investigator project “Biodiversity Dynamics in a Changing World” (grant 16549). We further consider this study a contribution to JCS’ Center for Ecological Dynamics in a Novel Biosphere (ECONOVO), funded by Danish National Research Foundation (grant DNRF173).

Institutional Review Board Statement

Not applicable.

Informed Consent Statement

Not applicable.

Data Availability Statement

Not applicable.

Conflicts of Interest

The authors declare no conflict of interest.

Appendix A

Table A1. Ecological traits of fish.
SpeciesMigration (M)Habitat Preference (H)Water Velocity Preferences (R)Feeding Habitat (FH)Reproduction Habitat (RH)Salinity (S)Trophic Level (TrL)Resilience (Res)Vulnerability (Vuln)
Abramis brama (Linnaeus, 1758)potbplrhebenplifbr3.16.062
Acipenser ruthenus Linnaeus, 1758 *potdemrhebenlitfbr3.69.564
Alburnus alburnus (Linnaeus, 1758)potbplrhewatlitfbr2.72.031
Alosa immaculata Bennett, 1835 *diapellimwatlitfbm3.91.535
Anguilla anguilla (Linnaeus, 1758)diademeurbenothfbm3.67.964
Atherina boyeri Risso, 1810diademlimwatplifbm3.21.320
Babka gymnotrachelus (Kessler, 1857)nomdemlimbenphyfre3.52.929
Ballerus ballerus (Linnaeus, 1758)potbpllimwatphyfbr3.23.949
Benthophiloides brauneri Beling & Iljin, 1927 *diademlimbenothfbr3.42.428
Benthophilus stellatus (Sauvage, 1874)potdemlimbenlitfbr3.73.434
Blicca bjoerkna (Linnaeus, 1758)potdemlimbenphyfre3.25.565
Carassius carassius (Linnaeus, 1758)potdemlimbenphyfre3.13.238
Carassius gibelio (Bloch, 1782)nombpllimbenplifre2.53.951
Chondrostoma nasus (Linnaeus, 1758) *potbplrhebenlitfre2.04.048
Clupeonella cultriventris (Nordmann, 1840)diapeleurwatothfbm3.04.735
Cobitis taenia Linnaeus, 1758potdemlimbenplifre3.31.536
Ctenopharyngodon idella (Valenciennes, 1844) *potdemrhewatothfre2.06.065
Cyprinus carpio Linnaeus, 1758potbpleurbenphyfbr3.14.446
Esox lucius Linnaeus, 1758potpeleurwatphyfre4.18.085
Gasterosteus aculeatus Linnaeus, 1758diademlimwatothfbm3.32.110
Gobio gobio (Linnaeus, 1758) *potbplrhebenpsafbr3.12.931
Gymnocephalus cernua (Linnaeus, 1758)potdemeurbenplifbr3.33.220
Hypophthalmichthys molitrix (Valenciennes, 1844) *potbpleurwatothfbr2.04.755
Hypophthalmichthys nobilis (Richardson, 1845) *potbpleurwatothfre2.85.366
Lepomis gibbosus (Linnaeus, 1758)potbpllimwatplifre3.33.032
Leucaspius delineatus (Heckel, 1843)potpellimwatphyfre3.25.258
Leuciscus aspius (Linnaeus, 1758) *potbplrhewatlitfbr4.56.570
Leuciscus idus (Linnaeus, 1758) *potbplrhewatplifbr3.87.063
Leuciscus leuciscus (Linnaeus, 1758)potbplrhewatlitfbr2.93.248
Lota lota (Linnaeus, 1758)*potdemeurbenlitfbr4.16.066
Mesogobius batrachocephalus (Pallas, 1814)diabpllimbenothfbr4.22.933
Misgurnus fossilis (Linnaeus, 1758)potdemlimbenphyfre3.43.431
Neogobius fluviatilis (Pallas, 1814)diabplrhebenlitfbr3.42.421
Neogobius melanostomus (Pallas, 1814)diademlimbenothfbm3.32.931
Pelecus cultratus (Linnaeus, 1758)diapellimwatothfbr3.64.850
Perca fluviatilis Linnaeus, 1758diademeurwatplifre3.45.350
Petroleuciscus borysthenicus (Kessler, 1859)nombpllimbenphyfre3.12.932
Ponticola kessleri (Günther, 1861)nombplrhewatplifbr3.52.930
Proterorhinus marmoratus (Pallas, 1814)diademeurbenlitfbm3.51.915
Pseudorasbora parva (Temminck & Schlegel, 1846)nombpllimwatphyfre3.22.029
Pungitius platygaster (Kessler, 1859)diademlimbenothfbm3.52.314
Rhodeus sericeus (Pallas, 1776)potbpllimbenothfre2.12.019
Rutilus rutilus (Linnaeus, 1758)potbplrhewatlitfbr3.04.553
Sander lucioperca (Linnaeus, 1758)nompeleurwatphyfbr4.07.073
Sander volgensis (Gmelin, 1789) *nomdemlimwatplifbr4.17.352
Scardinius erythrophthalmus (Linnaeus, 1758)nombpllimwatphyfbr3.65.567
Silurus glanis Linnaeus, 1758nomdemeurbenphyfbr4.47.384
Squalius cephalus (Linnaeus, 1758)potbplrhewatlitfbr3.06.580
Syngnathus abaster Risso, 1827diademeurwatothfbm3.22.117
Tinca tinca (Linnaeus, 1758)potdemlimbenphyfre3.75.365
*—information on the occurrence of species is given from literary sources (Bondarev, 2015); Migration—pot are potamodromous, dia are diadromous, and nom are no migration fish species; habitat preference—pel are pelagic, bpl are benthopelagic, and dem are demersal fish species; water velocity preferences—rhe are rheophilic, lim are limnophilic, and eur are eurytopic fish species; preferred feeding habitat—wc are water column, ben are benthic fish species, reproduction habitat —lit are lithophilic, phy are phytophilic, pli are phyto-lithophilic, spa are psammophilic, and oth are other fish species; salinity—fre are freshwater species, fbr are freshwater-brackish species, fbm are brackish-marine species.
Table A2. Landsat 5/TM, Landsat 7/ETM, and Landsat 8 OLI images used in the study.
DataSequential Number of the Day of the YearSampling Time RangeImageSatellite
21.08.1997233219253LT05_L2SP_178026_19970821_20200910_02_T1Landsat 5/TM
23.07.1998204213226LT05_L2SP_178026_19980723_20200908_02_T1Landsat 5/TM
11.08.1999223221274LT05_L2SP_178026_19990811_20211205_02_T1Landsat 5/TM
13.08.2000226214217LT05_L2SP_178026_20000813_20200906_02_T1Landsat 5/TM
01.09.2001244212221LT05_L2SP_178026_20010901_20200905_02_T1Landsat 5/TM
16.06.2002167204214LT05_L2SP_178026_20020616_20211209_02_T1Landsat 5/TM
06.08.2003218212220LT05_L2SP_178026_20030806_20200904_02_T1Landsat 5/TM
21.06.2004173231246LT05_L2SP_178026_20040621_20200903_02_T1Landsat 5/TM
27.08.2005239217217LT05_L2SP_178026_20050827_20200902_02_T1Landsat 5/TM
14.08.2006226189214LT05_L2SP_178026_20060814_20200831_02_T1Landsat 5/TM
17.08.2007229208241LT05_L2SP_178026_20070817_20200830_02_T1Landsat 5/TM
19.08.2008232205225LT05_L2SP_178026_20080819_20200829_02_T1Landsat 5/TM
21.07.2009202199219LT05_L2SP_178026_20090721_20200827_02_T1Landsat 5/TM
09.08.2010221209210LT05_L2SP_178026_20100809_20200823_02_T1Landsat 5/TM
27.07.2011208214222LT05_L2SP_178026_20110727_20200822_02_T1Landsat 5/TM
22.08.2012235207223LE07_L2SP_178026_20120822_20200908_02_T1Landsat 7/ETM
17.08.2013229206218LC08_L2SP_178026_20130817_20200913_02_T1Landsat 8 OLI
20.08.2014232220227LC08_L2SP_178026_20140820_20200911_02_T1Landsat 8 OLI
23.08.2015235211219LC08_L2SP_178026_20150823_20200908_02_T1Landsat 8 OLI

Appendix B

The response of the environmental index (chlorophyll-a concentration or surface temperature) is described by the quadratic function kx2 + bx + c (Figure A1), which reaches its maximum Max at –b/2k.
Figure A1. Model of the quadratic dependence of environmental indicators on time kx2 + bx + c, where x is time. At time –b/2k the function reaches maximum Max, which is a key characteristic of the dynamics of the indicator in that year. The different years may be compared in terms of this indicator. The time of space imaging x may be different from time –b/2k in different years by Δx and a correction factor Δy must be found to find Max based on the information about the observed value of the indicator and the shift Δx.
Fishes 08 00014 g0a1
At time x, the function takes the value kx2 + bx + c, which differs from the maximum value by Δy:
Max − (kx2 + bx + c) = Δy,
from where:
k b 2 4 k 2 b 2 2 k + c k x 2 b x c = Δ y .
After simplification it, we get:
b 2 4 k 2 b 2 4 k k x 2 b x = Δ y ,
from where:
b 2 4 k k x 2 b x = Δ y .
It should be taken into account that:
x = b 2 k Δ x .
As a result of the substitution, we get:
b 2 4 k k b 2 4 k 2 + b Δ x k + Δ x 2 b b 2 k Δ x = Δ y .
After opening the parentheses, we get:
b 2 4 k b 2 4 k b Δ x k Δ x 2 + b 2 2 k + b Δ x = Δ y .
After simplification we get:
b 2 4 k b 2 4 k b Δ x k Δ x 2 + b 2 2 k + b Δ x = Δ y .
from where:
k Δ x 2 = Δ y .

Appendix C

Table A3. Fish species abundance in groups of water bodies in the period 1998–2015 (mean ± st. error).
SpeciesIndividualsBiotope Groups *Total (n = 570)
I (n = 76)II (n = 95)III (n = 57)IV (n = 171)V (n = 171)
Abramis brama13571.96 ± 0.082.12 ± 0.082.75 ± 0.092.47 ± 0.052.50 ± 0.062.38 ± 0.03
Alburnus alburnus19242.93 ± 0.143.78 ± 0.165.82 ± 0.162.92 ± 0.112.99 ± 0.093.38 ± 0.07
Atherina boyeri6821.34 ± 0.061.07 ± 0.051.18 ± 0.051.29 ± 0.041.11 ± 0.041.20 ± 0.02
Babka gymnotrachelus12461.91 ± 0.082.25 ± 0.072.86 ± 0.091.58 ± 0.052.65 ± 0.052.19 ± 0.03
Ballerus ballerus140.03 ± 0.030.05 ± 0.030.02 ± 0.01
Benthophilus stellatus20.01 ± 0.01
Blicca bjoerkna17912.61 ± 0.072.98 ± 0.105.12 ± 0.122.61 ± 0.053.35 ± 0.053.14 ± 0.04
Carassius carassius470.11 ± 0.110.18 ± 0.180.16 ± 0.080.08 ± 0.03
Carassius gibelio16392.03 ± 0.133.88 ± 0.154.46 ± 0.192.33 ± 0.092.71 ± 0.082.88 ± 0.06
Clupeonella cultriventris1040.05 ± 0.050.05 ± 0.050.53 ± 0.080.03 ± 0.020.18 ± 0.03
Cobitis taenia9221.59 ± 0.101.53 ± 0.093.30 ± 0.191.20 ± 0.051.53 ± 0.071.62 ± 0.04
Cyprinus carpio130.05 ± 0.040.05 ± 0.030.02 ± 0.01
Esox lucius19002.86 ± 0.102.55 ± 0.213.77 ± 0.152.43 ± 0.084.74 ± 0.133.33 ± 0.07
Gasterosteus aculeatus1400.12 ± 0.070.59 ± 0.200.30 ± 0.210.34 ± 0.080.25 ± 0.05
Gymnocephalus cernua330.03 ± 0.020.02 ± 0.010.33 ± 0.210.03 ± 0.030.03 ± 0.030.06 ± 0.03
Lepomis gibbosus5190.99 ± 0.111.08 ± 0.091.14 ± 0.140.43 ± 0.071.19 ± 0.070.91 ± 0.04
Leucaspius delineatus12151.66 ± 0.111.93 ± 0.123.19 ± 0.141.34 ± 0.072.89 ± 0.092.13 ± 0.05
Leuciscus aspius5120.86 ± 0.090.85 ± 0.080.75 ± 0.081.28 ± 0.060.61 ± 0.050.90 ± 0.03
Leuciscus leuciscus60.04 ± 0.020.01 ± 0.01
Mesogobius batrachocephalus710.17 ± 0.100.11 ± 0.110.25 ± 0.170.20 ± 0.060.12 ± 0.03
Misgurnus fossilis140.09 ± 0.090.05 ± 0.030.02 ± 0.01
Neogobius fluviatilis10121.70 ± 0.101.13 ± 0.061.56 ± 0.142.75 ± 0.081.27 ± 0.051.78 ± 0.05
Neogobius melanostomus6032.38 ± 0.161.05 ± 0.100.63 ± 0.081.07 ± 0.060.60 ± 0.041.06 ± 0.04
Pelecus cultratus30.02 ± 0.010.01 ± 0.00
Perca fluviatilis16881.96 ± 0.122.43 ± 0.102.96 ± 0.182.23 ± 0.084.43 ± 0.112.96 ± 0.06
Petroleuciscus borysthenicus19081.70 ± 0.093.91 ± 0.083.67 ± 0.102.08 ± 0.064.93 ± 0.063.35 ± 0.06
Ponticola kessleri4481.09 ± 0.070.61 ± 0.060.42 ± 0.071.22 ± 0.050.44 ± 0.040.79 ± 0.03
Proterorhinus marmoratus20672.66 ± 0.094.26 ± 0.194.37 ± 0.232.96 ± 0.094.12 ± 0.113.63 ± 0.06
Pseudorasbora parva9191.29 ± 0.092.16 ± 0.121.63 ± 0.141.79 ± 0.081.27 ± 0.061.61 ± 0.04
Pungitius platygaster8712.51 ± 0.110.96 ± 0.065.44 ± 0.270.69 ± 0.050.94 ± 0.071.53 ± 0.07
Rhodeus sericeus21872.50 ± 0.123.72 ± 0.155.84 ± 0.252.91 ± 0.094.75 ± 0.123.84 ± 0.07
Rutilus rutilus23782.75 ± 0.114.78 ± 0.285.79 ± 0.333.04 ± 0.105.06 ± 0.174.17 ± 0.10
Sander lucioperca260.03 ± 0.030.12 ± 0.040.02 ± 0.020.05 ± 0.01
Scardinius erythrophthalmus20682.26 ± 0.154.22 ± 0.345.18 ± 0.402.31 ± 0.154.71 ± 0.233.63 ± 0.12
Silurus glanis410.03 ± 0.030.09 ± 0.090.01 ± 0.010.19 ± 0.090.07 ± 0.03
Squalius cephalus6841.03 ± 0.170.79 ± 0.181.32 ± 0.372.37 ± 0.170.29 ± 0.091.20 ± 0.09
Syngnathus abaster12422.66 ± 0.121.89 ± 0.352.98 ± 0.441.35 ± 0.142.68 ± 0.262.18 ± 0.12
Tinca tinca13261.92 ± 0.141.76 ± 0.113.70 ± 0.160.87 ± 0.073.82 ± 0.152.33 ± 0.08
* I is the mouth of the Oril River, II is the Mykolaevka ledge system, III is the Obukhiv floodplain system, IV is the Dnipro River channel part, V is the Taromske ledge system.
Figure A2. Estimates of alpha, beta, and gamma diversity of the fish metacommunity.
Fishes 08 00014 g0a2
Table A4. Decomposition of the eigenvalues (Covar = sdR × sdQ × Corr). Total inertia: 0.05609.
Eigenvalue OrderEigenvalue and Projected InertiaCovarsdRsdQCorr
10.0524 (93.5%)0.232.341.640.06
20.0029 (5.15%)0.051.271.720.02
30.00039 (0.70%)0.020.541.500.02
40.00023 (0.42%)0.020.641.000.02
Table A5. Comparison of RLQ analysis results with ordinal multivariate data matrix analysis procedures.
Environmental Characteristics (Matrix R)InertiaMax InertiaRatio
First RLQ axis5.495.500.99
First and second RLQ axes7.107.370.96
1, 2, and 3 RLQ axes7.407.790.95
1, 2, 3 and 4 RLQ axes7.818.150.96
Species traits (Matrix Q)InertiaMax inertiaRatio
First RLQ axis2.714.040.67
First and second RLQ axes5.656.960.81
1, 2, and 3 RLQ axes7.919.290.85
1, 2, 3 and 4 RLQ axes8.9110.540.85
Species matrix (Matrix L)CorrMax correlationRatio
RLQ axis 10.0590.190.32
RLQ axis 20.0250.180.14
RLQ axis 30.0240.160.15
RLQ axis 40.0240.150.16

References

  1. Smith, V.H.; Tilman, G.D.; Nekola, J.C. Eutrophication: Impacts of Excess Nutrient Inputs on Freshwater, Marine, and Terrestrial Ecosystems. Environ. Pollut. 1999, 100, 179–196. [Google Scholar] [CrossRef] [PubMed]
  2. Rodgers, E.M. Adding Climate Change to the Mix: Responses of Aquatic Ectotherms to the Combined Effects of Eutrophication and Warming. Biol. Lett. 2021, 17, 20210442. [Google Scholar] [CrossRef] [PubMed]
  3. Moss, B.; Kosten, S.; Meerhoff, M.; Battarbee, R.W.; Jeppesen, E.; Mazzeo, N.; Havens, K.; Lacerot, G.; Liu, Z.; De Meester, L.; et al. Allied Attack: Climate Change and Eutrophication. Inland Waters 2011, 1, 101–105. [Google Scholar] [CrossRef] [Green Version]
  4. Beaulieu, J.J.; DelSontro, T.; Downing, J.A. Eutrophication Will Increase Methane Emissions from Lakes and Impoundments during the 21st Century. Nat. Commun. 2019, 10, 1375. [Google Scholar] [CrossRef] [PubMed] [Green Version]
  5. Smith, V.H. Eutrophication of Freshwater and Coastal Marine Ecosystems a Global Problem. Environ. Sci. Pollut. Res. 2003, 10, 126–139. [Google Scholar] [CrossRef] [PubMed]
  6. Alexander, T.J.; Vonlanthen, P.; Seehausen, O. Does Eutrophication-Driven Evolution Change Aquatic Ecosystems? Philos. Trans. R. Soc. B Biol. Sci. 2017, 372, 20160041. [Google Scholar] [CrossRef] [Green Version]
  7. Pinkina, T.; Zymaroieva, A.; Matkovska, S.; Svitelskyi, M.; Ishchuk, O.; Fediuchka, M. Trophic Characteristics of Lymnaea stagnalis (Mollusca: Gastropoda: Lymnaeidae) in Toxic Environment. Ekológia 2019, 38, 292–300. [Google Scholar] [CrossRef] [Green Version]
  8. Egertson, C.J.; Downing, J.A. Relationship of Fish Catch and Composition to Water Quality in a Suite of Agriculturally Eutrophic Lakes. Can. J. Fish. Aquat. Sci. 2004, 61, 1784–1796. [Google Scholar] [CrossRef]
  9. Shimoda, Y.; Azim, M.E.; Perhar, G.; Ramin, M.; Kenney, M.A.; Sadraddini, S.; Gudimov, A.; Arhonditsis, G.B. Our Current Understanding of Lake Ecosystem Response to Climate Change: What Have We Really Learned from the North Temperate Deep Lakes? J. Great Lakes Res. 2011, 37, 173–193. [Google Scholar] [CrossRef]
  10. Jacobson, P.C.; Hansen, G.J.A.; Bethke, B.J.; Cross, T.K. Disentangling the Effects of a Century of Eutrophication and Climate Warming on Freshwater Lake Fish Assemblages. PLoS ONE 2017, 12, e0182667. [Google Scholar] [CrossRef]
  11. Schindler, D.W. The Cumulative Effects of Climate Warming and Other Human Stresses on Canadian Freshwaters in the New Millennium. Can. J. Fish. Aquat. Sci. 2001, 58, 18–29. [Google Scholar] [CrossRef]
  12. Jeppesen, E.; Meerhoff, M.; Holmgren, K.; González-Bergonzoni, I.; Teixeira-de Mello, F.; Declerck, S.A.J.; De Meester, L.; Søndergaard, M.; Lauridsen, T.L.; Bjerring, R.; et al. Impacts of Climate Warming on Lake Fish Community Structure and Potential Effects on Ecosystem Function. Hydrobiologia 2010, 646, 73–90. [Google Scholar] [CrossRef]
  13. Meerhoff, M.; Clemente, J.M.; de Mello, F.T.; Iglesias, C.; Pedersen, A.R.; Jeppesen, E. Can Warm Climate-Related Structure of Littoral Predator Assemblies Weaken the Clear Water State in Shallow Lakes? Glob. Change Biol. 2007, 13, 1888–1897. [Google Scholar] [CrossRef]
  14. Godinho, F.N.; Segurado, P.; Franco, A.; Pinheiro, P.; Pádua, J.; Rivaes, R.; Ramos, P. Factors Related to Fish Kill Events in Mediterranean Reservoirs. Water Res. 2019, 158, 280–290. [Google Scholar] [CrossRef]
  15. Stillman, J.H. Heat Waves, the New Normal: Summertime Temperature Extremes Will Impact Animals, Ecosystems, and Human Communities. Physiology 2019, 34, 86–100. [Google Scholar] [CrossRef]
  16. Diaz, R.J.; Rosenberg, R. Spreading Dead Zones and Consequences for Marine Ecosystems. Science 2008, 321, 926–929. [Google Scholar] [CrossRef]
  17. Bennion, H.; Moss, B.; Jeppesen, E.; Carvalho, L.; Demeester, L.; Feuchtmayr, H.; Friberg, N.; Gessner, M.O.; Hefting, M.; Lauridsen, T.L.; et al. Interaction of Climate Change and Eutrophication. Clim. Change Impacts Freshw. Ecosyst. 2010, 17, 119–151. [Google Scholar] [CrossRef] [Green Version]
  18. Glibert, P.M. Harmful Algae at the Complex Nexus of Eutrophication and Climate Change. Harmful Algae 2020, 91, 101583. [Google Scholar] [CrossRef]
  19. Paerl, H.W.; Huisman, J. Climate: Blooms like It Hot. Science 2008, 320, 57–58. [Google Scholar] [CrossRef] [Green Version]
  20. Orlov, I.-I.O.; Fedoniuk, O.O.; Iakushenko, T.P.; Danylyk, D.M.; Kish, I.M.; Ya, R.; Zimaroieva, A.; Khant, A.A. Distribu-Tion and Ecological Growth Conditions of Utricularia Australis R. Br. in Ukraine. J. Water Land Dev. 2021, 48, 32–47. [Google Scholar] [CrossRef]
  21. Jiang, Z.; Liu, S.; Zhang, J.; Wu, Y.; Zhao, C.; Lian, Z.; Huang, X. Eutrophication Indirectly Reduced Carbon Sequestration in a Tropical Seagrass Bed. Plant Soil 2018, 426, 135–152. [Google Scholar] [CrossRef]
  22. Jameson, B.D.; Berg, P.; Grundle, D.S.; Stevens, C.J.; Juniper, S.K. Continental Margin Sediments Underlying the NE Pacific Oxygen Minimum Zone Are a Source of Nitrous Oxide to the Water Column. Limnol. Oceanogr. Lett. 2021, 6, 68–76. [Google Scholar] [CrossRef]
  23. Vasenko, O.G. Environmental Situation in the Lower Dnipro River Basin. Water Qual. Res. J. 1998, 33, 457–488. [Google Scholar] [CrossRef]
  24. Borysova, O.; Kondakov, A.; Paleari, S.; Rautalahti-Miettinen, E.; Stolberg, F.; Daler, D. Eutrophication in the Black Sea Region; Impact Assessment and Causal Chain Analysis. In Global International Waters Assessment; University of Kalmar: Kalmar, Sweden, 2005. [Google Scholar]
  25. Strokal, M.; Kroeze, C. Nitrogen and Phosphorus Inputs to the Black Sea in 1970–2050. Reg. Environ. Change 2013, 13, 179–192. [Google Scholar] [CrossRef] [Green Version]
  26. Ghilarov, A.M. Report on Eutrophication Studies in the U.S.S.R. Water Res. 1983, 17, 607–611. [Google Scholar] [CrossRef]
  27. Violle, C.; Reich, P.B.; Pacala, S.W.; Enquist, B.J.; Kattge, J. The Emergence and Promise of Functional Biogeography. Proc. Natl. Acad. Sci. USA 2014, 111, 13690–13696. [Google Scholar] [CrossRef] [PubMed] [Green Version]
  28. McGill, B.J.; Enquist, B.J.; Weiher, E.; Westoby, M. Rebuilding Community Ecology from Functional Traits. Trends Ecol. Evol. 2006, 21, 178–185. [Google Scholar] [CrossRef]
  29. Funk, J.L.; Larson, J.E.; Ames, G.M.; Butterfield, B.J.; Cavender-Bares, J.; Firn, J.; Laughlin, D.C.; Sutton-Grier, A.E.; Williams, L.; Wright, J. Revisiting the Holy Grail: Using Plant Functional Traits to Understand Ecological Processes. Biol. Rev. 2017, 92, 1156–1173. [Google Scholar] [CrossRef]
  30. Beukhof, E.; Frelat, R.; Pecuchet, L.; Maureaud, A.; Dencker, T.S.; Sólmundsson, J.; Punzón, A.; Primicerio, R.; Hidalgo, M.; Möllmann, C.; et al. Marine Fish Traits Follow Fast-Slow Continuum across Oceans. Sci. Rep. 2019, 9, 17878. [Google Scholar] [CrossRef] [Green Version]
  31. Côte, J.; Morisseau, O.; Pilisi, C.; Veyssière, C.; Perrault, A.; Jezequel, C.; Loot, G.; Blanchet, S.; Jean, S.; Jacquin, L. Urbanisation and Eutrophication as Drivers of Morphological and Physiological Divergence among Riverine Fish Populations. Freshw. Biol. 2021, 66, 669–682. [Google Scholar] [CrossRef]
  32. Hohausová, E. Exchange Rate and Small-Scale Movements of Fish between a River and Its Backwater. Arch. Hydrobiol. 2000, 147, 485–504. [Google Scholar] [CrossRef] [Green Version]
  33. Schmutz, S.; Kaufmann, M.; Vogel, B.; Jungwirth, M.; Muhar, S. A Multi-Level Concept for Fish-Based, River-Type-Specific Assessment of Ecological Integrity. Hydrobiologia 2000, 422, 279–289. [Google Scholar] [CrossRef]
  34. Grift, R.E.; Buijse, A.D.; Van Densen, W.L.T.; Machiels, M.A.M.; Kranenbarg, J.; Klein Breteler, J.G.P.; Backx, J.J.G.M. Suitable Habitats for 0-Group Fish in Rehabilitated Floodplains along the Lower River Rhine. River Res. Appl. 2003, 19, 353–374. [Google Scholar] [CrossRef]
  35. Tucker, T.R.; Roseman, E.F.; DeBruyne, R.L.; Pritt, J.J.; Bennion, D.H.; Hondorp, D.W.; Boase, J.C. Long-Term Assessment of Ichthyoplankton in a Large North American River System Reveals Changes in Fish Community Dynamics. Can. J. Fish. Aquat. Sci. 2018, 75, 2255–2270. [Google Scholar] [CrossRef]
  36. Sandström, A.; Karås, P. Effects of Eutrophication on Young-of-the-Year Freshwater Fish Communities in Coastal Areas of the Baltic. Environ. Biol. Fishes 2002, 63, 89–101. [Google Scholar] [CrossRef]
  37. Casselman, J.M.; Penczak, T.; Carl, L.; Mann, R.H.K.; Holcik, J.; Woitowich, W.A. An Evaluation of Fish Sampling Methodologies for Large River Systems. Pol. Arch. Hydrobiol. 1990, 37, 521–551. [Google Scholar]
  38. Schlosser, I.J. The Role of Predation in Age- and Size-Related Habitat Use by Stream Fishes. Ecology 1987, 68, 651–659. [Google Scholar] [CrossRef]
  39. Schiemer, F.; Spindler, T.; Wintersberger, H.; Schneider, A.; Chovanec, A. Fish Fry: Important Indicators for the Ecological Status of Large Rivers. Int. Organ. Theor. Appl. Limnol. 1991, 24, 2497–2500. [Google Scholar] [CrossRef]
  40. Jurajda, P.; Reichard, M.; Hohausová, E.; Černý, J. Comparsion of 0+ Fish Communities between Regulated–Channelized and Floodplain Stretches of the River Morava. Arch. Hydrobiol. 2001, 135, 187–202. [Google Scholar]
  41. Cattanéo, F. Does Hydrology Constrain the Structure of Fish Assemblages in French Streams? Local Scale Analysis. Arch. Hydrobiol. 2005, 164, 345–365. [Google Scholar] [CrossRef]
  42. Jurajda, P.; Slavík, O.; White, S.; Adámek, Z. Young-of-the-Year Fish Assemblages as an Alternative to Adult Fish Monitoring for Ecological Quality Evaluation of Running Waters. Hydrobiologia 2010, 644, 89–101. [Google Scholar] [CrossRef]
  43. Zhukov, O.; Kunakh, O.; Bondarev, D.; Chubchenko, Y. Extraction of Macrophyte Community Spatial Variation Allows to Adapt the Macrophyte Biological Index for Rivers to the Conditions of the Middle Dnipro River. Limnologica 2022, 97, 126036. [Google Scholar] [CrossRef]
  44. Arsan, O.M.; Davydov, O.Y.; Dyachenko, T.M. Methods of Hydroecological Research of Surface Waters; Romanenko, V.D., Ed.; Logos: Kyiv, Ukraine, 2006. [Google Scholar]
  45. Žiliukas, V.; Žiliukienė, V.; Repečka, R. Temporal Variation in Juvenile Fish Communities of Kaunas Reservoir Littoral Zone, Lithuania. Cent. Eur. J. Biol. 2012, 7, 858–866. [Google Scholar] [CrossRef] [Green Version]
  46. Pierce, C.L.; Rasmussen, J.B.; Leggett, W.C. Sampling Littoral Fish with a Seine: Corrections for Variable Capture Efficiency. Can. J. Fish. Aquat. Sci. 1990, 47, 1004–1010. [Google Scholar] [CrossRef]
  47. Paradis, Y.; Mingelbier, M.; Brodeur, P.; Magnan, P. Comparisons of Catch and Precision of Pop Nets, Push Nets, and Seines for Sampling Larval and Juvenile Yellow Perch. N. Am. J. Fish. Manag. 2008, 28, 1554–1562. [Google Scholar] [CrossRef]
  48. Kratochvíl, M.; Čech, M.; Vašek, M.; Kubečka, J.; Hejzlar, J.; Matěna, J.; Peterka, J.; Macháček, J.; Seďa, J. Diel Vertical Migrations of Age 0+ Percids in a Shallow, Well-Mixed Reservoir. J. Limnol. 2010, 69, 305. [Google Scholar] [CrossRef]
  49. Treasurer, J.W. Sampling Larval and Juvenile Fish Populations in Freshwater. Aquac. Res. 1978, 9, 6–17. [Google Scholar] [CrossRef]
  50. Chugunova, N.I. Guidelines for the Study of the Age and Growth of Fish (Methodological Guide to Ichthyology); Pavlovsky, E.N., Moiseyev, P.A., Eds.; Publishing House of the Academy of Sciences of the USSR: Moscow, Russia, 1959. [Google Scholar]
  51. Pfauserová, N.; Brabec, M.; Slavík, O.; Horký, P.; Žlábek, V.; Hladík, M. Effects of Physical Parameters on Fish Migration between a Reservoir and Its Tributaries. Sci. Rep. 2022, 12, 8612. [Google Scholar] [CrossRef]
  52. Binder, T.R.; Cooke, S.J.; Hinch, S.G. The Biology of Fish Migration. In Encyclopedia of Fish Physiology; Farrell, A.P., Ed.; Elsevier: London, UK, 2011; pp. 1921–1927. [Google Scholar]
  53. Thurow, R. Life Histories of Potamodromous Fishes. In An Introduction to Fish Migration; Morais, P., Daverat, F., Eds.; CRC Press: Boca Raton, FL, USA, 2016; pp. 29–54. [Google Scholar]
  54. Lin, H.-Y.; Brown, C.J.; Dwyer, R.G.; Harding, D.J.; Roberts, D.T.; Fuller, R.A.; Linke, S.; Possingham, H.P. Impacts of Fishing, River Flow and Connectivity Loss on the Conservation of a Migratory Fish Population. Aquat. Conserv. Mar. Freshw. Ecosyst. 2018, 28, 45–54. [Google Scholar] [CrossRef]
  55. Verhelst, P.; Reubens, J.; Buysse, D.; Goethals, P.; Van Wichelen, J.; Moens, T. Toward a Roadmap for Diadromous Fish Conservation: The Big Five Considerations. Front. Ecol. Environ. 2021, 19, 396–403. [Google Scholar] [CrossRef]
  56. Schmidt-Kloiber, A.; Hering, D. Www.Freshwaterecology.Info—An Online Tool That Unifies, Standardises and Codifies More than 20,000 European Freshwater Organisms and Their Ecological Preferences. Ecol. Indic. 2015, 53, 271–282. [Google Scholar] [CrossRef]
  57. McDowall, R. Different Kinds of Diadromy: Different Kinds of Conservation Problems. ICES J. Mar. Sci. 1999, 56, 410–413. [Google Scholar] [CrossRef]
  58. Britton, J.R.; Pegg, J. Ecology of European Barbel Barbus Barbus: Implications for River, Fishery, and Conservation Management. Rev. Fish. Sci. 2011, 19, 321–330. [Google Scholar] [CrossRef]
  59. van Treeck, R.; Van Wichelen, J.; Wolter, C. Fish Species Sensitivity Classification for Environmental Impact Assessment, Conservation and Restoration Planning. Sci. Total Environ. 2020, 708, 135173. [Google Scholar] [CrossRef]
  60. Hondorp, D.W.; Breitburg, D.L.; Davias, L.A. Eutrophication and Fisheries: Separating the Effects of Nitrogen Loads and Hypoxia on the Pelagic-to-Demersal Ratio and Other Measures of Landings Composition. Mar. Coast. Fish. 2010, 2, 339–361. [Google Scholar] [CrossRef]
  61. Perivolioti, T.-M.; Tušer, M.; Frouzova, J.; Znachor, P.; Rychtecký, P.; Mouratidis, A.; Terzopoulos, D.; Bobori, D. Estimating Environmental Preferences of Freshwater Pelagic Fish Using Hydroacoustics and Satellite Remote Sensing. Water 2019, 11, 2226. [Google Scholar] [CrossRef] [Green Version]
  62. Cheng, L.; Lek, S.; Lek-Ang, S.; Li, Z. Predicting Fish Assemblages and Diversity in Shallow Lakes in the Yangtze River Basin. Limnologica 2012, 42, 127–136. [Google Scholar] [CrossRef]
  63. Hekstra, G.P. The Biodiversity Convention and Coastal Regions. Limnologica 1999, 29, 339–345. [Google Scholar] [CrossRef] [Green Version]
  64. Okun, N.; Mendonca, R.; Mehner, T. Diel Shifts in Community Composition and Feeding of Juvenile Fishes in the Pelagic Area of a Large Shallow Lake. Limnologica 2005, 35, 70–77. [Google Scholar] [CrossRef] [Green Version]
  65. Wegscheider, B.; Linnansaari, T.; Monk, W.A.; Ndong, M.; Haralampides, K.; St-Hilaire, A.; Schneider, M.; Curry, R.A. Quantitative Modelling of Fish Habitat in a Large Regulated River in a Changing Climate. Ecohydrology 2022, 15, e2318. [Google Scholar] [CrossRef]
  66. Stoffers, T.; Buijse, A.D.; Verreth, J.A.J.; Nagelkerke, L.A.J. Environmental Requirements and Heterogeneity of Rheophilic Fish Nursery Habitats in European Lowland Rivers: Current Insights and Future Challenges. Fish Fish. 2022, 23, 162–182. [Google Scholar] [CrossRef]
  67. Logez, M.; Bady, P.; Melcher, A.; Pont, D. A Continental-Scale Analysis of Fish Assemblage Functional Structure in European Rivers. Ecography 2013, 36, 80–91. [Google Scholar] [CrossRef]
  68. Meyer, A.; Alric, B.; Dézerald, O.; Billoir, E.; Coulaud, R.; Larras, F.; Mondy, C.P.; Usseglio-Polatera, P. Linking Micropollutants to Trait Syndromes across Freshwater Diatom, Macroinvertebrate, and Fish Assemblages. Water 2022, 14, 1184. [Google Scholar] [CrossRef]
  69. Schinegger, R.; Trautwein, C.; Schmutz, S. Pressure-Specific and Multiple Pressure Response of Fish Assemblages in European Running Waters. Limnologica 2013, 43, 348–361. [Google Scholar] [CrossRef] [PubMed] [Green Version]
  70. Magoulick, D.D. Effects of Predation Risk on Habitat Selection by Water Column Fish, Benthic Fish and Crayfish in Stream Pools. Hydrobiologia 2004, 527, 209–221. [Google Scholar] [CrossRef]
  71. Smith, B.; Collie, J.; Lengyel, N. Effects of Chronic Bottom Fishing on the Benthic Epifauna and Diets of Demersal Fishes on Northern Georges Bank. Mar. Ecol. Prog. Ser. 2013, 472, 199–217. [Google Scholar] [CrossRef] [Green Version]
  72. Choat, J.H. Fish Feeding and the Structure of Benthic Communities in Temperate Waters. Annu. Rev. Ecol. Syst. 1982, 13, 423–449. [Google Scholar] [CrossRef]
  73. Negro, G.; Fenoglio, S.; Quaranta, E.; Comoglio, C.; Garzia, I.; Vezza, P. Habitat Preferences of Italian Freshwater Fish: A Systematic Review of Data Availability for Applications of the MesoHABSIM Model. Front. Environ. Sci. 2021, 9, 305. [Google Scholar] [CrossRef]
  74. Li, Q.; Dai, X.; Liu, Y.; Devlin, A.T.; Lai, G.; Wang, W. Potential Spawning Grounds of Phytophilic Fish under a Shifting Hydrological Regime in Poyang Lake, China. Fish. Manag. Ecol. 2022, 29, 597–607. [Google Scholar] [CrossRef]
  75. Huang, X.; Zhao, F.; Song, C.; Gao, Y.; Chai, Y.; Zhong, L.; Zhuang, P. Hatchery Technology Restores the Spawning Ground of Phytophilic Fish in the Urban River of Yangtze Estuary, China. Urban Ecosyst. 2020, 23, 1087–1098. [Google Scholar] [CrossRef]
  76. Looby, A.; Reynolds, L.K.; Adams, C.R.; Martin, C.W. Submerged Aquatic Vegetation Patch Size Affects Fish Communities in a Turbid-Algal Lake. Front. Conserv. Sci. 2021, 2, 657691. [Google Scholar] [CrossRef]
  77. Fieseler, C.; Wolter, C. A Fish-Based Typology of Small Temperate Rivers in the Northeastern Lowlands of Germany. Limnologica 2006, 36, 2–16. [Google Scholar] [CrossRef]
  78. Froese, R.; Pauly, D. FishBase; Version (12/2019); World Wide Web Electronic Publication: Washington, DC, USA, 2019. [Google Scholar]
  79. Oto, Y. Preference for Saline Water of an Amphidromous Goby Maintained during Migration to Upstream Freshwater Areas. J. Fish Biol. 2020, 97, 202–211. [Google Scholar] [CrossRef]
  80. Arai, T.; Ueno, D.; Kitamura, T.; Goto, A. Habitat Preference and Diverse Migration in Threespine sticklebacks, Gasterosteus aculeatus and G. nipponicus. Sci. Rep. 2020, 10, 14311. [Google Scholar] [CrossRef] [PubMed]
  81. Pauly, D.; Christensen, V. Primary Production Required to Sustain Global Fisheries. Nature 1995, 374, 255–257. [Google Scholar] [CrossRef]
  82. Jia, Y.; Jiang, Y.; Liu, Y.; Sui, X.; Feng, X.; Zhu, R.; Chen, Y. Understanding Trophic Structure Variation in Fish Assemblages of Subtropical Shallow Lakes: Combined Effects of Ecosystem Size, Productivity, and Disturbance. Ecol. Indic. 2021, 129, 107924. [Google Scholar] [CrossRef]
  83. Mason, J.G.; Eurich, J.G.; Lau, J.D.; Battista, W.; Free, C.M.; Mills, K.E.; Tokunaga, K.; Zhao, L.Z.; Dickey-Collas, M.; Valle, M.; et al. Attributes of Climate Resilience in Fisheries: From Theory to Practice. Fish Fish. 2022, 23, 522–544. [Google Scholar] [CrossRef]
  84. Mohamed, K.S.; Sathianandan, T.V.; Vivekanandan, E.; Kuriakose, S.; Ganga, U.; Pillai, S.L.; Nair, R.J. Application of Biological and Fisheries Attributes to Assess the Vulnerability and Resilience of Tropical Marine Fish Species. PLoS ONE 2021, 16, e0255879. [Google Scholar] [CrossRef]
  85. Pinnegar, J.K.; Engelhard, G.H.; Norris, N.J.; Theophille, D.; Sebastien, R.D. Assessing Vulnerability and Adaptive Capacity of the Fisheries Sector in Dominica: Long-Term Climate Change and Catastrophic Hurricanes. ICES J. Mar. Sci. 2019, 76, 1353–1367. [Google Scholar] [CrossRef] [Green Version]
  86. Cheung, W.W.L.; Pitcher, T.J.; Pauly, D. A Fuzzy Logic Expert System to Estimate Intrinsic Extinction Vulnerabilities of Marine Fishes to Fishing. Biol. Conserv. 2005, 124, 97–111. [Google Scholar] [CrossRef]
  87. Strona, G. Assessing Fish Vulnerability: IUCN vs. FishBase. Aquat. Conserv. Mar. Freshw. Ecosyst. 2014, 24, 153–154. [Google Scholar] [CrossRef]
  88. Boettiger, C.; Lang, D.T.; Wainwright, P.C. Rfishbase: Exploring, Manipulating and Visualizing FishBase Data from R. J. Fish Biol. 2012, 81, 2030–2039. [Google Scholar] [CrossRef] [PubMed]
  89. Free, G.; Bresciani, M.; Pinardi, M.; Ghirardi, N.; Luciani, G.; Caroni, R.; Giardino, C. Detecting Climate Driven Changes in Chlorophyll-a in Deep Subalpine Lakes Using Long Term Satellite Data. Water 2021, 13, 866. [Google Scholar] [CrossRef]
  90. Geological Survey (U.S.). EROS Data Center Earth Explorer. Available online: https://earthexplorer.usgs.gov/ (accessed on 10 June 2022).
  91. Duan, H.; Zhang, Y.; Zhang, B.; Song, K.; Wang, Z. Assessment of Chlorophyll-a Concentration and Trophic State for Lake Chagan Using Landsat TM and Field Spectral Data. Environ. Monit. Assess. 2007, 129, 295–308. [Google Scholar] [CrossRef] [PubMed]
  92. Kloiber, S.M.; Brezonik, P.L.; Olmanson, L.G.; Bauer, M.E. A Procedure for Regional Lake Water Clarity Assessment Using Landsat Multispectral Data. Remote Sens. Environ. 2002, 82, 38–47. [Google Scholar] [CrossRef]
  93. Lavery, P.; Pattiaratchi, C.; Wyllie, A.; Hick, P. Water Quality Monitoring in Estuarine Waters Using the Landsat Thematic Mapper. Remote Sens. Environ. 1993, 46, 268–280. [Google Scholar] [CrossRef]
  94. Zhang, F.; Li, J.; Yan, B.; Yu, J.; Wang, C.; Wang, S.; Shen, Q.; Wu, Y.; Zhang, B. Tracking Historical Chlorophyll- a Change in the Guanting Reservoir, Northern China, Based on Landsat Series Inter-Sensor Normalization. Int. J. Remote Sens. 2021, 42, 3918–3937. [Google Scholar] [CrossRef]
  95. Patra, P.P.; Dubey, S.K.; Trivedi, R.K.; Sahu, S.K.; Rout, S.K. Estimation of Chlorophyll-a Concentration and Trophic States in Nalban Lake of East Kolkata Wetland, India from Landsat 8 OLI Data. Spat. Inf. Res. 2017, 25, 75–87. [Google Scholar] [CrossRef]
  96. Lapyga, I.V. Evaluation of Eutrophication the Dnieper River in the City of Kyiv with Use Means Arcgis 10.4.1 and Landsat 8. Ecol. Sci. 2019, 1, 92–97. [Google Scholar] [CrossRef]
  97. Moses, W.J.; Gitelson, A.A.; Berdnikov, S.; Povazhnyy, V. Estimation of Chlorophyll- a Concentration in Case II Waters Using MODIS and MERIS Data—Successes and Challenges. Environ. Res. Lett. 2009, 4, 045005. [Google Scholar] [CrossRef] [Green Version]
  98. Chamberlain, S. Rnoaa: “NOAA” Weather Data from R. R Package, Version 1.2.0. 2020. [Google Scholar]
  99. Marcon, E.; Hérault, B. Entropart: An R Package to Measure and Partition Diversity. J. Stat. Softw. 2015, 67, 1–26. [Google Scholar] [CrossRef] [Green Version]
  100. Baattrup-Pedersen, A.; Göthe, E.; Riis, T.; O’Hare, M.T. Functional Trait Composition of Aquatic Plants Can Serve to Disentangle Multiple Interacting Stressors in Lowland Streams. Sci. Total Environ. 2016, 543, 230–238. [Google Scholar] [CrossRef] [PubMed]
  101. Dray, S.; Choler, P.; Dolédec, S.; Peres-Neto, P.R.; Thuiller, W.; Pavoine, S.; Ter Braak, C.J.F. Combining the Fourth-Corner and the RLQ Methods for Assessing Trait Responses to Environmental Variation. Ecology 2014, 95, 14–21. [Google Scholar] [CrossRef] [PubMed] [Green Version]
  102. Kleyer, M.; Dray, S.; Bello, F.; Lepš, J.; Pakeman, R.J.; Strauss, B.; Thuiller, W.; Lavorel, S. Assessing Species and Community Functional Responses to Environmental Gradients: Which Multivariate Methods? J. Veg. Sci. 2012, 23, 805–821. [Google Scholar] [CrossRef]
  103. Dolédec, S.; Chessel, D.; Ter Braak, C.J.F.; Champely, S. Matching Species Traits to Environmental Variables: A New Three-Table Ordination Method. Environ. Ecol. Stat. 1996, 3, 143–166. [Google Scholar] [CrossRef]
  104. Thioulouse, J.; Dray, S.; Dufour, A.-B.; Siberchicot, A.; Jombart, T.; Pavoine, S. Multivariate Analysis of Ecological Data with Ade4; Springer: New York, NY, USA, 2018; ISBN 978-1-4939-8848-8. [Google Scholar]
  105. ter Braak, C.J.F. Correspondence Analysis of Incidence and Abundance Data: Properties in Terms of a Unimodal Response Model. Biometrics 1985, 41, 859. [Google Scholar] [CrossRef]
  106. Hill, M.O.; Smith, A.J.E. Principal Component Analysis of Taxonomic Data with Multistate Discrete Characters. Taxon 1976, 25, 249–255. [Google Scholar] [CrossRef]
  107. Dray, S.; Legendre, P. Testing the Species Traits Environment Relationships: The Fourth-Corner Problem Revisited. Ecology 2008, 89, 3400–3412. [Google Scholar] [CrossRef]
  108. Legendre, P.; Galzin, R.; Harmelin-Vivien, M.L. Relating Behavior to Habitat: Solutions to the Fourth-Corner Problem. Ecology 1997, 78, 547. [Google Scholar] [CrossRef]
  109. Dray, S.; Dufour, A.B. The Ade4 Package: Implementing the Duality Diagram for Ecologists. J. Stat. Softw. 2007, 22, 1–20. [Google Scholar] [CrossRef] [Green Version]
  110. Wypych, A.; Sulikowska, A.; Ustrnul, Z.; Czekierda, D. Temporal Variability of Summer Temperature Extremes in Poland. Atmosphere 2017, 8, 51. [Google Scholar] [CrossRef] [Green Version]
  111. Tomczyk, A.M.; Bednorz, E. Heat Waves in Central Europe and Their Circulation Conditions. Int. J. Climatol. 2016, 36, 770–782. [Google Scholar] [CrossRef]
  112. Lhotka, O.; Kyselý, J. Characterizing Joint Effects of Spatial Extent, Temperature Magnitude and Duration of Heat Waves and Cold Spells over Central Europe. Int. J. Climatol. 2015, 35, 1232–1244. [Google Scholar] [CrossRef]
  113. Das Sarkar, S.; Sarkar, U.K.; Naskar, M.; Roy, K.; Bose, A.K.; Nag, S.K.; Karnatak, G.; Das, B.K. Effect of Climato-Environmental Parameters on Chlorophyll a Concentration in the Lower Ganga Basin, India. Rev. Biol. Trop. 2020, 69, 60–76. [Google Scholar] [CrossRef]
  114. Asch, R.G. Climate Change and Decadal Shifts in the Phenology of Larval Fishes in the California Current Ecosystem. Proc. Natl. Acad. Sci. USA 2015, 112, E4065–E4074. [Google Scholar] [CrossRef] [PubMed] [Green Version]
  115. Petitgas, P.; Rijnsdorp, A.D.; Dickey-Collas, M.; Engelhard, G.H.; Peck, M.A.; Pinnegar, J.K.; Drinkwater, K.; Huret, M.; Nash, R.D.M. Impacts of Climate Change on the Complex Life Cycles of Fish. Fish. Oceanogr. 2013, 22, 121–139. [Google Scholar] [CrossRef]
  116. Kuczynski, L.; Chevalier, M.; Laffaille, P.; Legrand, M.; Grenouillet, G. Indirect Effect of Temperature on Fish Population Abundances through Phenological Changes. PLoS ONE 2017, 12, e0175735. [Google Scholar] [CrossRef] [PubMed]
  117. Lürling, M.; Mendes e Mello, M.; van Oosterhout, F.; de Senerpont Domis, L.; Marinho, M.M. Response of Natural Cyanobacteria and Algae Assemblages to a Nutrient Pulse and Elevated Temperature. Front. Microbiol. 2018, 9, 1851. [Google Scholar] [CrossRef] [Green Version]
  118. Yan, X.; Xu, X.; Wang, M.; Wang, G.; Wu, S.; Li, Z.; Sun, H.; Shi, A.; Yang, Y. Climate Warming and Cyanobacteria Blooms: Looks at Their Relationships from a New Perspective. Water Res. 2017, 125, 449–457. [Google Scholar] [CrossRef]
  119. Zhezherya, V.A.; Zhezherya, T.P.; Linnik, P.M. Nutrients in the Water of the Reservoirs of the Dnieper Cascade after the Dnieper River Regulation. Hydrobiol. J. 2022, 58, 79–97. [Google Scholar] [CrossRef]
  120. Poikane, S.; Kelly, M.G.; Salas Herrero, F.; Pitt, J.-A.; Jarvie, H.P.; Claussen, U.; Leujak, W.; Lyche Solheim, A.; Teixeira, H.; Phillips, G. Nutrient Criteria for Surface Waters under the European Water Framework Directive: Current State-of-the-Art, Challenges and Future Outlook. Sci. Total Environ. 2019, 695, 133888. [Google Scholar] [CrossRef] [PubMed]
  121. Demars, B.O.L.; Edwards, A.C. Tissue Nutrient Concentrations in Freshwater Aquatic Macrophytes: High Inter-Taxon Differences and Low Phenotypic Response to Nutrient Supply. Freshw. Biol. 2007, 52, 2073–2086. [Google Scholar] [CrossRef]
  122. Zhang, P.; Kuramae, A.; van Leeuwen, C.H.A.; Velthuis, M.; van Donk, E.; Xu, J.; Bakker, E.S. Interactive Effects of Rising Temperature and Nutrient Enrichment on Aquatic Plant Growth, Stoichiometry, and Palatability. Front. Plant Sci. 2020, 11, 58. [Google Scholar] [CrossRef] [PubMed] [Green Version]
  123. Tilman, D. Global Environmental Impacts of Agricultural Expansion: The Need for Sustainable and Efficient Practices. Proc. Natl. Acad. Sci. USA 1999, 96, 5995–6000. [Google Scholar] [CrossRef] [PubMed] [Green Version]
  124. Zymaroieva, A.; Zhukov, O.; Fedoniuk, T.; Pinkina, T.; Vlasiuk, V. Edaphoclimatic Factors Determining Sunflower Yields Spatiotemporal Dynamics in Northern Ukraine. OCL 2021, 28, 26. [Google Scholar] [CrossRef]
  125. Rashleigh, B. Relation of Environmental Characteristics to Fish Assemblages in the Upper French Broad River Basin, North Carolina. Environ. Monit. Assess. 2004, 93, 139–156. [Google Scholar] [CrossRef] [PubMed] [Green Version]
  126. Withers, P.; Neal, C.; Jarvie, H.; Doody, D. Agriculture and Eutrophication: Where Do We Go from Here? Sustainability 2014, 6, 5853–5875. [Google Scholar] [CrossRef] [Green Version]
  127. Kleinman, P.J.A.; Srinivasan, M.S.; Dell, C.J.; Schmidt, J.P.; Sharpley, A.N.; Bryant, R.B. Role of Rainfall Intensity and Hydrology in Nutrient Transport via Surface Runoff. J. Environ. Qual. 2006, 35, 1248–1259. [Google Scholar] [CrossRef] [PubMed] [Green Version]
  128. Yao, Y.; Dai, Q.; Gao, R.; Gan, Y.; Yi, X. Effects of Rainfall Intensity on Runoff and Nutrient Loss of Gently Sloping Farmland in a Karst Area of SW China. PLoS ONE 2021, 16, e0246505. [Google Scholar] [CrossRef]
  129. Maurer, V.M.; Zibtsev, S.V.; Savushchyk, M.P.; Borsuk, O.A. Scientific and Practical Recommendations on Environmentally Safe Approaches and Methods of Forest Restoration in the Exclusion Zone; National University of Life and Environmental Sciences of Ukraine: Kyiv, Ukraine, 2015. [Google Scholar]
  130. Ingole, N.P.; An, K.G. Modifications of Nutrient Regime, Chlorophyll-a, and Trophic State Relations in Daechung Reservoir after the Construction of an Upper Dam. J. Ecol. Environ. 2016, 40, 5. [Google Scholar] [CrossRef] [Green Version]
  131. Maavara, T.; Chen, Q.; Van Meter, K.; Brown, L.E.; Zhang, J.; Ni, J.; Zarfl, C. River Dam Impacts on Biogeochemical Cycling. Nat. Rev. Earth Environ. 2020, 1, 103–116. [Google Scholar] [CrossRef] [Green Version]
  132. Akimov, M.P.; Berestov, A.I. Comparative Biocenotic Analysis of the Animal Population of the Dnieper Rapids and the Dnieper Reservoir in the First Years of Its Formation. Proc. Biol. Dep. Dnepropetr. State Univ. 1947, XXXII, 161–176. [Google Scholar]
  133. Feitosa, F.S.; Rezende, C.F. Trophic Ecology of the Fish Leporinus piau (Characiformes: Anostomidae) in an Area Influenced by a Dam in the Parnaíba River. Rev. Biol. Trop. 2020, 68, 426–439. [Google Scholar] [CrossRef]
  134. Franchi, E.; Carosi, A.; Ghetti, L.; Giannetto, D.; Pedicillo, G.; Pompei, L.; Lorenzoni, M. Changes in the Fish Community of the Upper Tiber River after Construction of a Hydro-Dam. J. Limnol. 2014, 73, 203–210. [Google Scholar] [CrossRef] [Green Version]
  135. Novitskiy, R.A. Scale, Direction and Consequences of Alien Fish Species Invasions in the Dnieper Reservoirs. Manuscript. Thesis for the Degree of Doctor of Biological Science by Specialty 03.00.10—Ichthyology; Institute of Hydrobiology, National Academy of Sciences of Ukraine: Kyiv, Ukraine, 2019. [Google Scholar]
  136. Zhang, P.; Grutters, B.M.C.; van Leeuwen, C.H.A.; Xu, J.; Petruzzella, A.; van den Berg, R.F.; Bakker, E.S. Effects of Rising Temperature on the Growth, Stoichiometry, and Palatability of Aquatic Plants. Front. Plant Sci. 2019, 9, 1947. [Google Scholar] [CrossRef]
  137. Dai, X.; Yu, Z.; Yang, G.; Wan, R. Role of Flooding Patterns in the Biomass Production of Vegetation in a Typical Herbaceous Wetland, Poyang Lake Wetland, China. Front. Plant Sci. 2020, 11, 521358. [Google Scholar] [CrossRef]
  138. Talbot, C.J.; Bennett, E.M.; Cassell, K.; Hanes, D.M.; Minor, E.C.; Paerl, H.; Raymond, P.A.; Vargas, R.; Vidon, P.G.; Wollheim, W.; et al. The Impact of Flooding on Aquatic Ecosystem Services. Biogeochemistry 2018, 141, 439–461. [Google Scholar] [CrossRef] [Green Version]
  139. Randall, R.G.; Brousseau, C.M.; Hoyle, J.A. Effect of Aquatic Macrophyte Cover and Fetch on Spatial Variability in the Biomass and Growth of Littoral Fishes in Bays of Prince Edward County, Lake Ontario. Aquat. Ecosyst. Health Manag. 2012, 15, 385–396. [Google Scholar] [CrossRef]
  140. Olson, M.H.; Carpenter, S.R.; Cunningham, P.; Gafny, S.; Herwig, B.R.; Nibbelink, N.P.; Pellett, T.; Storlie, C.; Trebitz, A.S.; Wilson, K.A. Managing Macrophytes to Improve Fish Growth: A Multi-Lake Experiment. Fisheries 1998, 23, 6–12. [Google Scholar] [CrossRef]
  141. Velle, G.; Skoglund, H.; Barlaup, B.T. Effects of Nuisance Submerged Vegetation on the Fauna in Norwegian Rivers. Hydrobiologia 2022, 849, 539–556. [Google Scholar] [CrossRef]
  142. Koblitskaya, A.F. Study of Freshwater Fish Spawning; Food Industry: Moscow, Russia, 1966. [Google Scholar]
  143. Ahas, R.; Aasa, A. The Effects of Climate Change on the Phenology of Selected Estonian Plant, Bird and Fish Populations. Int. J. Biometeorol. 2006, 51, 17–26. [Google Scholar] [CrossRef] [PubMed]
  144. Brulé, T.; Renán, X.; Colás-Marrufo, T. Potential Impact of Climate Change on Fish Reproductive Phenology: A Case Study in Gonochoric and Hermaphrodite Commercially Important Species from the Southern Gulf of Mexico. Fishes 2022, 7, 156. [Google Scholar] [CrossRef]
  145. Nilsson, G.E.; Östlund-Nilsson, S. Does Size Matter for Hypoxia Tolerance in Fish? Biol. Rev. 2008, 83, 173–189. [Google Scholar] [CrossRef]
  146. Holgerson, M.A.; Richardson, D.C.; Roith, J.; Bortolotti, L.E.; Finlay, K.; Hornbach, D.J.; Gurung, K.; Ness, A.; Andersen, M.R.; Bansal, S.; et al. Classifying Mixing Regimes in Ponds and Shallow Lakes. Water Resour. Res. 2022, 58, e2022WR032522. [Google Scholar] [CrossRef]
  147. Griffiths, J.R.; Kadin, M.; Nascimento, F.J.A.; Tamelander, T.; Törnroos, A.; Bonaglia, S.; Bonsdorff, E.; Brüchert, V.; Gårdmark, A.; Järnström, M.; et al. The Importance of Benthic–Pelagic Coupling for Marine Ecosystem Functioning in a Changing World. Glob. Chang. Biol. 2017, 23, 2179–2196. [Google Scholar] [CrossRef] [Green Version]
  148. Carpio, A.J.; De Miguel, R.J.; Oteros, J.; Hillström, L.; Tortosa, F.S. Angling as a Source of Non-Native Freshwater Fish: A European Review. Biol. Invasions 2019, 21, 3233–3248. [Google Scholar] [CrossRef]
  149. Bernery, C.; Bellard, C.; Courchamp, F.; Brosse, S.; Gozlan, R.E.; Jari’c, I.J.; Teletchea, F.; Leroy, B. Freshwater Fish Invasions: A Comprehensive Review. Annu. Rev. Ecol. Evol. Syst. 2022, 53, 427–456. [Google Scholar] [CrossRef]
  150. Marcon, E.; Zhang, Z.; Hérault, B. The Decomposition of Similarity-Based Diversity and Its Bias Correction. 2022. Available online: https://hal-agroparistech.archives-ouvertes.fr/hal-00989454v2 (accessed on 15 October 2022).
  151. Skora, K.; Olenin, S.; Gollasch, S. Neogobius Melanostomus (Pallas, 1811). In Case Histories on Introduced Species: Their General Biology, Distribution, Range Expansion and Impact; Gollasch, S., Michin, D., Rosenthal, H., Voight, M., Eds.; Logos Verlag: Berlin, Germany, 1999; pp. 69–73. [Google Scholar]
  152. Osipov, V.V.; Kiyashko, V.I. Specific Features of the Reproduction of Clupeonella cultrivensis (Clupeiformes, Clupeoidei) at the Introduction into Freshwater Water Bodies. J. Ichthyol. 2006, 46, 552–554. [Google Scholar] [CrossRef]
  153. Ridley, M.; Rechten, C. Female Sticklebacks Prefer to Spawn with Males Whose Nests Contain Eggs. Behaviour 1981, 76, 152–161. [Google Scholar] [CrossRef]
  154. Kottelat, M.; Freyhof, J. Handbook of European Freshwater Fishes; Maurice Kottelat: Cornol, Switzerland, 2007; ISBN 9782839902984. [Google Scholar]
  155. Gammon, D.B.; Li, W.; Scott, A.P.; Zielinski, B.S.; Corkum, L.D. Behavioural Responses of Female Neogobius melanostomus to Odours of Conspecifics. J. Fish Biol. 2005, 67, 615–626. [Google Scholar] [CrossRef]
  156. Shevchenko, P.G.; Shcherbukha, A.Y.; Pilipenko, Y.V.; Martsenyuk, N.O.; Khalturin, M.B.; Cherednichenko, I.S. Identification Key of Fish of Continental Water Bodies and Streams of Ukraine; Oldi Plus: Kherson, Ukraine, 2020. [Google Scholar]
  157. Silva, K.; Monteiro, N.M.; Vieira, M.N.; Almada, V.C. Reproductive Behaviour of the Black-Striped Pipefish Syngnathus sbaster (Pisces; Syngnathidae). J. Fish Biol. 2006, 69, 1860–1869. [Google Scholar] [CrossRef]
Figure 1. Main groups of water bodies and the location of fish sampling points. I is the Mykolaevka ledge system: 5—Upper duct, 6—Lower duct, 7—Lake Ostupus, 8—Rybachiy Bay, left spur, 9—Rybachiy Bay; II is the Dnipro River channel part: 13—Near the Korchevatka flow path, 14—Near the Oak Grove, 15—Near the guard station, 16—Near the flow into Lake Solone, 17—Kamyanisty Island from the side of the main channel, 18—Kamyanisty Island from the side of the secondary channel, 19—Korchuvaty Island, 20—Kryachny Island, 21—Near the mouth of the Konoplyanka river; III is the Taromske ledge system: 22—Lake Humutzi, 23—Lake Lytvynove, 24—Lake Lopata, 25—Mala Hatka Lake, 26—Gorbove Lake, 27—Lake Solone, 28—Lake Somivka, 29—Lake Richische, 30—Lake Sokylki; IV is the Obukhiv floodplain system: 10—Lake Kovbasyane, 11—Near Yalowske Island, 12—Yalowske Lake; V is the mouth of the Oril River: 1—Obukhivsky Island, 2—Left bank of the Orill River, 3—Right bank of the Orill River, 4—Near the entrance to Lake Kovbasiane.
Fishes 08 00014 g001
Figure 2. Seasonal course of temperatures and cumulative precipitation: (a) is the annual temperature pattern, the spawning time range of the dominant fish species, and the sampling time range (the quartile range indicates the range that corresponds to quartile 2 and 3, in other words, in this time range 50% of the fish collections were made); (b) is the average daily temperature variations (°C) from day 100 to day 275 of the year (blue circles) and the parabola that approximates the temperature trend (red line); (c) is the cumulative precipitation (mm) from day 1 to day 275 of the year (brown circles) and the straight line approximating the cumulative precipitation trend (green line).
Fishes 08 00014 g002
Figure 3. Seasonal course of chlorophyll-a concentration and water temperatures (°C) from day 167 to day 244 of the year: (a) is the chlorophyll-a (mg/m3) (brown circles) and the parabola that approximates the trend (blue line): Chl_a = −0.0089 Order2 + 3.59 Order −185.2, Radj2 = 0.40; (b) is the water temperature (°C) (black circles) and the parabola approximating the trend (red line): Chl_a = −0.0043 Order2 + 1.75 Oder −143.9, Radj2 = 0.44.
Fishes 08 00014 g003
Figure 4. The dynamics of PC1 and PC2 (scores mean ± 95% confidence intervals). (a,b): the abscissa axis is years (1997–2015, the blue line shows a linear time trend); (c,d): 1 is the mouth of the Oril River, 2 are the water reservoirs of the Mykolaevka ledge system, 3 are the water bodies of the Obukhiv floodplain system, 4 is the water area of the Dnipro River channel part, and 5 are the water bodies of the Taromske ledge system.
Fishes 08 00014 g004
Figure 5. Results of RLQ-analysis: (I) is a global test of the significance of the relationship between species traits and environmental properties based on model (II) (the histogram shows the distribution of simulated values of total inertia (sim) for the permuted values of sites compared to the observed value of total inertia), (II) is a test of the global significance of the relationship between species traits and environmental properties based on model (IV), (III) is fourth-corner analysis with 999 permutations, which demonstrates the pairwise correlations between species traits and environmental variables. The p-values were adjusted for multiple comparisons using the false discovery rate. The gray cells indicate no statistically significant correlation, the red cells indicate positive correlations, and the blue cells indicate negative correlations significant for p < 0.05, (IV) is the correlation of species traits and RLQ axes 1 and 2, (V) is the correlation of environmental properties and habitat types and RLQ axes 1 and 2. The green color indicates no correlation, the blue color indicates a statistically significant correlation with axis 1, the orange color indicates a significant correlation with axis 2, and the dark red color indicates a significant correlation with both axes. Migration—pot are potamodromous, dia are diadromous, and nom are no migration fish species; habitat preference—pel are pelagic, bpl are benthopelagic, and dem are demersal fish species; water velocity preferences—rhe are rheophilic, lim are limnophilic, and eur are eurytopic fish species; preferred feeding habitat—wc are water column, ben are benthic fish species, reproduction habitat—lit are lithophilic, phy are phytophilic, pli are phyto-lithophilic, spa are psammophilic, and oth are other fish species; salinity—fre are freshwater species, fbr are freshwater-brackish species, fbm are brackish-marine species.
Fishes 08 00014 g005
Figure 6. (I): Location of species in the RLQ space of axes 1 and 2 ((II): box is a hierarchical cluster analysis). (III): The species are grouped into clusters A, B, C, D and E: AbrabramAbramis brama; AlbualbuAlburnus alburnus; AtheboyeAtherina boyeri; BabkgymnBabka gymnotrachelus; Blicbjoe—Blicca bjoerkna; CaragibeCarassius gibelio; ClupcultClupeonella cultriventris; CobitaenCobitis taenia; EsoxluciEsox lucius; GastaculGasterosteus aculeatus; LepogibbLepomis gibbosus; LeucdeliLeucaspius delineatus; LeucaspiLeuciscus aspius; MesobatrMesogobius batrachocephalus; NeogfluvNeogobius fluviatilis; NeogmelaNeogobius melanostomus; PercfluvPerca fluviatilis; PetrboryPetroleuciscus borysthenicus; PontkessPonticola kessleri; ProtmarmProterorhinus marmoratus; PseuparvPseudorasbora parva; PungplatPungitius platygaster; RhodseriRhodeus sericeus; RutirutiRutilus rutilus; SandluciSander lucioperca; ScarerytScardinius erythrophthalmus; SquacephSqualius cephalus; SyngabasSyngnathus abaster; TinctincTinca tinca.
Fishes 08 00014 g006
Figure 7. Distribution and variation of species traits in clusters: M—pot are potamodromous, dia are diadromous, and nom are no migration fish species; H—pel are pelagic, bpl are benthopelagic, and dem are demersal fish species; R—rhe are rheophilic, lim are imnophilic, and eur are eurytopic fish species; FH—wc are water column, ben are benthic fish species, RH—lit are lithophilic, phy are phytophilic, pli are phyto-lithophilic, spa are psammophilic, and oth are other fish species; S—fre are freshwater species, fbr are freshwater-brackish species, fbm are brackish-marine species; TrL is the trophic level; Res is the resilience, Vuln is the vulnerability.
Fishes 08 00014 g007
Table 1. Descriptive statistics of the environmental explanatory variables (n = 570) and results of the principal component analysis (only statistically significant correlation coefficients of the principal components and variables are presented for p < 0.05).
VariableMean ± st. ErrorMinimumMaximumPC1, λ = 5.0, 62.5%PC2, λ = 1.7, 21.8%
Chlorophyll-a *, µg/L81.47 ± 0.9939.94136.250.500.81
Water temperature*, °C30.43 ± 0.0925.2835.260.590.74
kt × 10−3 **−1.57 ± 0.011−1.96−1.03−0.84
Date of maximum air temperature197.1 ± 0.13190204−0.79−0.29
Maximum of the air temperature trend22.47 ± 0.04219.7324.030.90−0.30
R2 of the air temperature trend0.58 ± 0.0040.430.700.91−0.22
Precipitation intensity (kp)1.12 ± 0.0140.431.99−0.830.42
R2 of the precipitation trend0.92 ± 0.0010.850.98−0.830.39
* estimation of the maximum value for the annual trend extremum; ** rate of temperature change during the study time range.
Disclaimer/Publisher’s Note: The statements, opinions and data contained in all publications are solely those of the individual author(s) and contributor(s) and not of MDPI and/or the editor(s). MDPI and/or the editor(s) disclaim responsibility for any injury to people or property resulting from any ideas, methods, instructions or products referred to in the content.

