Article

Predicting Sex-Related Transcripts in the Chinese Giant Salamander (Andrias davidianus): A Transcriptomics Study, Selection Gender for Preservation, Breeding and Reintroduction

1
Shaanxi Key Laboratory for Animal Conservation, Shaanxi Institute of Zoology, Xi’an 710032, China
2
Key Lab of Agricultural Animal Genetics, Breeding and Reproduction of Ministry of Education, College of Fisheries, Huazhong Agricultural University, Wuhan 430070, China
*
Author to whom correspondence should be addressed.
Fishes 2022, 7(6), 399; https://doi.org/10.3390/fishes7060399
Submission received: 30 October 2022 / Revised: 16 December 2022 / Accepted: 16 December 2022 / Published: 19 December 2022
(This article belongs to the Section Biology and Ecology)

Abstract

:
The Chinese giant salamander (Andrias davidianus) is the biggest extant and endangered amphibian, which has an incongruous sex ratio during the artificial breeding process and is sex indistinguishable in appearance. The sex development mechanism of this rare species thus needs to be explored. We therefore conducted this study to explore the molecular mechanisms of sex hallmarks or gonad maintenance genes for CGS. In this study, we sequenced and analyzed the sexually mature male and female gonads of Chinese giant salamanders (CGSs) using RNA-seq technology and found a total of 15,063 differentially expressed genes (DEGs) in the testicular and ovarian tissues, of which 7973 (52.93%) were expressed in testicular and 7090 (47.07%) in ovarian tissues. Thirteen gonad DEGs were selected based on gene expression abundance and quantified in the muscle and skin tissues of both male and female CGSs. The results showed that these 13 DEGS, out of the 20 analyzed DEGs, were expressed in both the muscle and skin tissues and only two of them (Bmp15 and ZP3) were consistent in the muscle and skin compared to the gonads of CGSs of the two sexes. Overall, our study should provide an important reference for the sex-characteristics-related genes in this type of species, shedding new light on future research on this topic.

1. Introduction

Releasing endangered species is an important way to protect the ecological environment, restore species resources, protect biodiversity and promote sustainable development. In recent years, captive breeding, domestication and the release of endangered wildlife have been successful for birds [1] and fishes [2,3] and have also provided new insights into the conservation of other endangered species. Hence, a consensus has been reached on the restoration of endangered wildlife resources by captive breeding and subsequent release or reintroduction into the wild.
However, this is not always easy as some problems need to be solved due to the diversity of life. One such case is the giant salamander (Andrias davidianus), which belongs to the class Amphibia and is the largest of the three extant amphibians in the family Cryptobranchidae, also known as “living fossils” as their earliest found record was more than 350 million years ago [4,5]. Salamanders represent a transitional form between aquatic and terrestrial life and are considered a valuable model for the study of vertebrate evolution and biodiversity [6]. Due to over-exploitation, illegal hunting and habitat loss, the occurrence and population of Chinese giant salamanders (CGSs) in the wild have declined significantly [7]. They now belong to the China National Class II of key protected aquatic wildlife. During artificial culture, the male giant salamander population is much higher than the female population, which makes it difficult to reintroduce this kind of species into the wild, especially as the sex ratio must be 1:1. Moreover, the secondary sexual characteristics of CGSs are difficult to distinguish visually. Thus, the sex development mechanism and sex-specific hallmarks remain to be explored. Sex development mainly includes sex determination and differentiation [8,9] and sex determination induces sex differentiation and sex maintance. During these processes, huge amounts of genes respond to the changes in the phenotype of the sexes [10,11]. With advances in technology, obtaining transcriptomes without reference genomes opens up the possibility of further studies of species without genomic information [12]. Comparative transcriptomic analysis can be used to screen for genes associated with growth, sex determination and differentiation and sex maintenance in a toad specifying genes and pathways involved in sex characteristics [13], sex hormone biosynthesis and other sex-specific gene expressions [14]. In addition, in mammals, sex can lead to differential expression of some genes in the skin or muscle [15,16,17]. Previous research has explored the transcripts of different sexes of Andrias davidianus, using 1-year-old specimens [18]. However, the Andrias davidianus undergoes metamorphosis and sexual differentiation at approximately 8 months of age and reaches sexual maturity at 6 years of age [19,20]. Thus, more detailed information should be provided for the sex-biased genes in sexually mature individuals to fully understand the mechanisms of sex development/characteristics in these curious and precious animals.
In this study, three six-year-old male and three female sexually matured CGSs were selected for gonad transcriptome analysis and the uni-genes obtained were screened for differentially expressed genes (DEGs) to obtain definite sex-specific genes, providing reference to the sex determination, captive breeding and reintroduction of CGSs.

2. Materials and Methods

2.1. Experimental Sample Collection

All of the CGSs used in the experiments were six-year-old healthy individuals purchased from a salamander farm in Chenggu County, Hanzhong City, Shaanxi Province and were temporarily housed in two temporary ponds separated by sex, under routine growth conditions. Six sexually mature and well-developed CGSs (three ♂ and three ♀) were selected from the temporary ponds and numbered M-1, M-2 and M-3 for the males and F-1, F-2 and F-3 for the females. After anesthesia with M222, the salamanders were dissected and three pea-sized samples of the gonads (testes/ovaries), muscles and skin were collected from each individual, quickly loaded into cryotubes and transferred to a liquid nitrogen tank for flash freezing. They were then transferred to a –80 °C refrigerator for storage. The experimental animals were dissected according to the protocols and methods of the Ethical Committee of Shaanxi Institute of Zoology for Care and Use of Laboratory Animals.

2.2. RNA Extraction, Transcriptome Library Preparation and Illumina Sequencing

The testes of three males and the ovaries of three females were used for RNA extraction according to the manufacturer’s instructions for TRIzol Reagent (Invitrogen, Carlsbad, CA, USA). The RNA was examined for degradation by 1% agarose gel electrophoresis and the purity of the RNA was examined by Nanodrop (OD260/280 ratio ≥ 1.8 and ≤2.0) to ensure that the qualified samples were used for transcriptome sequencing.
Gonad transcriptome sequencing was outsourced to Biomarker Technologies. First, the total mRNA was enriched and extracted using magnetic beads with Oligo (dT). Subsequently, the mRNA was randomly fragmented by adding a fragmentation buffer. First-strand cDNA was synthesized with random hexamer primers. Second-strand cDNA was synthesized by adding buffer, dNTPs, RNase H and DNA polymerase I and the cDNA was purified using AMPure XP beads. Purified double-stranded cDNA underwent terminal repair and ligation of an A tail followed by a sequencing adapter. Fragment size selection was performed using AMPure XP beads and cDNA libraries were obtained by PCR enrichment. After library construction, the library concentration and insert size were examined using a Qubit2.0 Fluorometer and Agilent 2100 Bioanalyzer, respectively and qPCR was used to accurately cross-check the effective library concentration to ensure the libraries’ quality. Qualified cDNA libraries were sequenced using the Illumina HiSeq X ten high-throughput sequencing platform (BioMarker Technologies, Beijing, China).

2.3. Transcriptome Assembly and Quality Evaluation

Raw data from sequencing cDNA libraries using Illumina HiSeq X Ten were filtered to obtain high-quality clean data. Sequencing reads were first processed into shorter fragments (K-mer) using Trinity software and then these small fragments were extended into Contigs and Components based on the overlapping sequences among these fragments. Finally, the transcript sequences were identified separately using a De Bruijn graph. Clean data underwent sequence assembly to obtain a UniGene library for the CGS.
To ensure the quality of the sequencing libraries, quality assessment of transcriptome sequencing libraries was performed from three aspects: (1) evaluating the randomness of the mRNA fragmentation and mRNA degradation by examining the distribution of the inserted fragments on the uni-genes; (2) evaluating the dispersion of the inserted fragment length by plotting the length distribution; (3) assessing the library capacity and the adequacy of the mapped reads compared to the UniGene library by saturation plotting.

2.4. Identification and Annotation of Differentially Expressed Genes (DEGs)

The reads obtained from sequencing were compared to the UniGene library using Bowtie and the expression level was estimated based on the alignment results in combination with RSEM. The fragments per kilobase of transcript per million mapped reads (FPKM) values were used to denote the expression abundance of the corresponding UniGene. The Benjamini–Hochberg-corrected p-value, i.e., the false-discovery rate (FDR), was used as a key indicator for DEG screening. In the screening process, an FDR ˂ 0.01 and an FC (fold change) ≥ 2 were used as the screening criteria, where FC denotes the ratio of expression between two samples (groups).
The obtained DEGs were annotated against the Gene Ontology (GO) and Kyoto Encyclopedia of Genes and Genomes (KEGG) networks using BLAST with a cut-off e-value of 0.00001. GO and KEGG enrichment analysis of DEGs was performed using the cluster Profiler R package.

2.5. qPCR Analysis

Muscle and skin tissue from three female and three male CGSs were sampled for qPCR analysis. Total RNA extraction was performed based on the method described above and used for reverse transcription according to the manufacturer’s instructions for the SYBR® Prime-Script TM RT-PCR Reverse Transcription Kit (TaKaRa, Dalian, China). Primers were designed with Primer Premier 6.0 software and synthesized by Tsingke Biotechnology Co., Ltd. (Beijing, China). Specific primers for PCR and 1% agarose gel electrophoresis were used to validate the expected band size. Refer to Table 1 for the primer sequences. β-actin was used as the internal reference gene and qPCR was carried out according to the instructions of the kit. The reaction system was as follows: 10 μL of 2 × SYBR® Green Realtime PCR Master Mix, 0.5 μL of the forward primer (2.5 µM), 0.5 μL or the reverse primer (2.5 µM), 8 μL of ddH2O and 1 μL of the diluted first-strand cDNA product (0.1 µg/µL). The reaction procedure was: 95 °C, 5 min and 40 cycles (95 °C, 30 s; 60 °C, 30 s; fluorescence signal acquisition). Melting curve analysis was performed to ensure primer specificity and single-size amplicons. Triplicates were set up for each sample, while a no-template control was used for amplification as the negative control. At the end of amplification, the collected fluorescence data were converted into Ct values. The relative expression of the selected genes was calculated from the Ct values of qPCR using the 2−ΔΔCt method. All quantitative data are presented as the mean ± standard error (mean ± SEM) for data analysis. Statistical analysis was performed using a t-test (p < 0.05).

3. Results

3.1. Quality of Sequencing, Transcriptome Assembly and Matching

In this study, cDNA libraries were generated and sequenced for three male and three female mature CGS gonad tissues (numbered M-1, M-2 and M-3 for the males and F-1, F-2 and F-3 for the females, respectively) and a total of six individual transcriptomes were obtained. After sequencing quality control, the Q30 of each sample was greater than 90.76% and a total of 47.26 Gb of clean data was obtained for the six samples. The quantitative and qualitative statistics of the transcriptome sequencing are shown in Table S1.
The sequences of the above samples were assembled using Trinity assembly and a total of 81,671 uni-genes were obtained. The lengths of the uni-genes were mainly concentrated in the range of 200–2000 nt, with an average length of 1178.22 nt, of which 22,110 (27.07%) were 200–300 nt. In addition, 14,362 (17.59%) identified uni-genes were longer than 2000 nt with high assembly integrity. The details are shown in Figure 1 and Table S2. The clean data of each sample were compared to the assembled UniGene library and the results are shown in Table S3. The minimum and maximum alignment ratios to the UniGene library were 74.12% and 84.03%, respectively, both of which satisfied the requirements of subsequent analyses.

3.2. Identification of DEGs

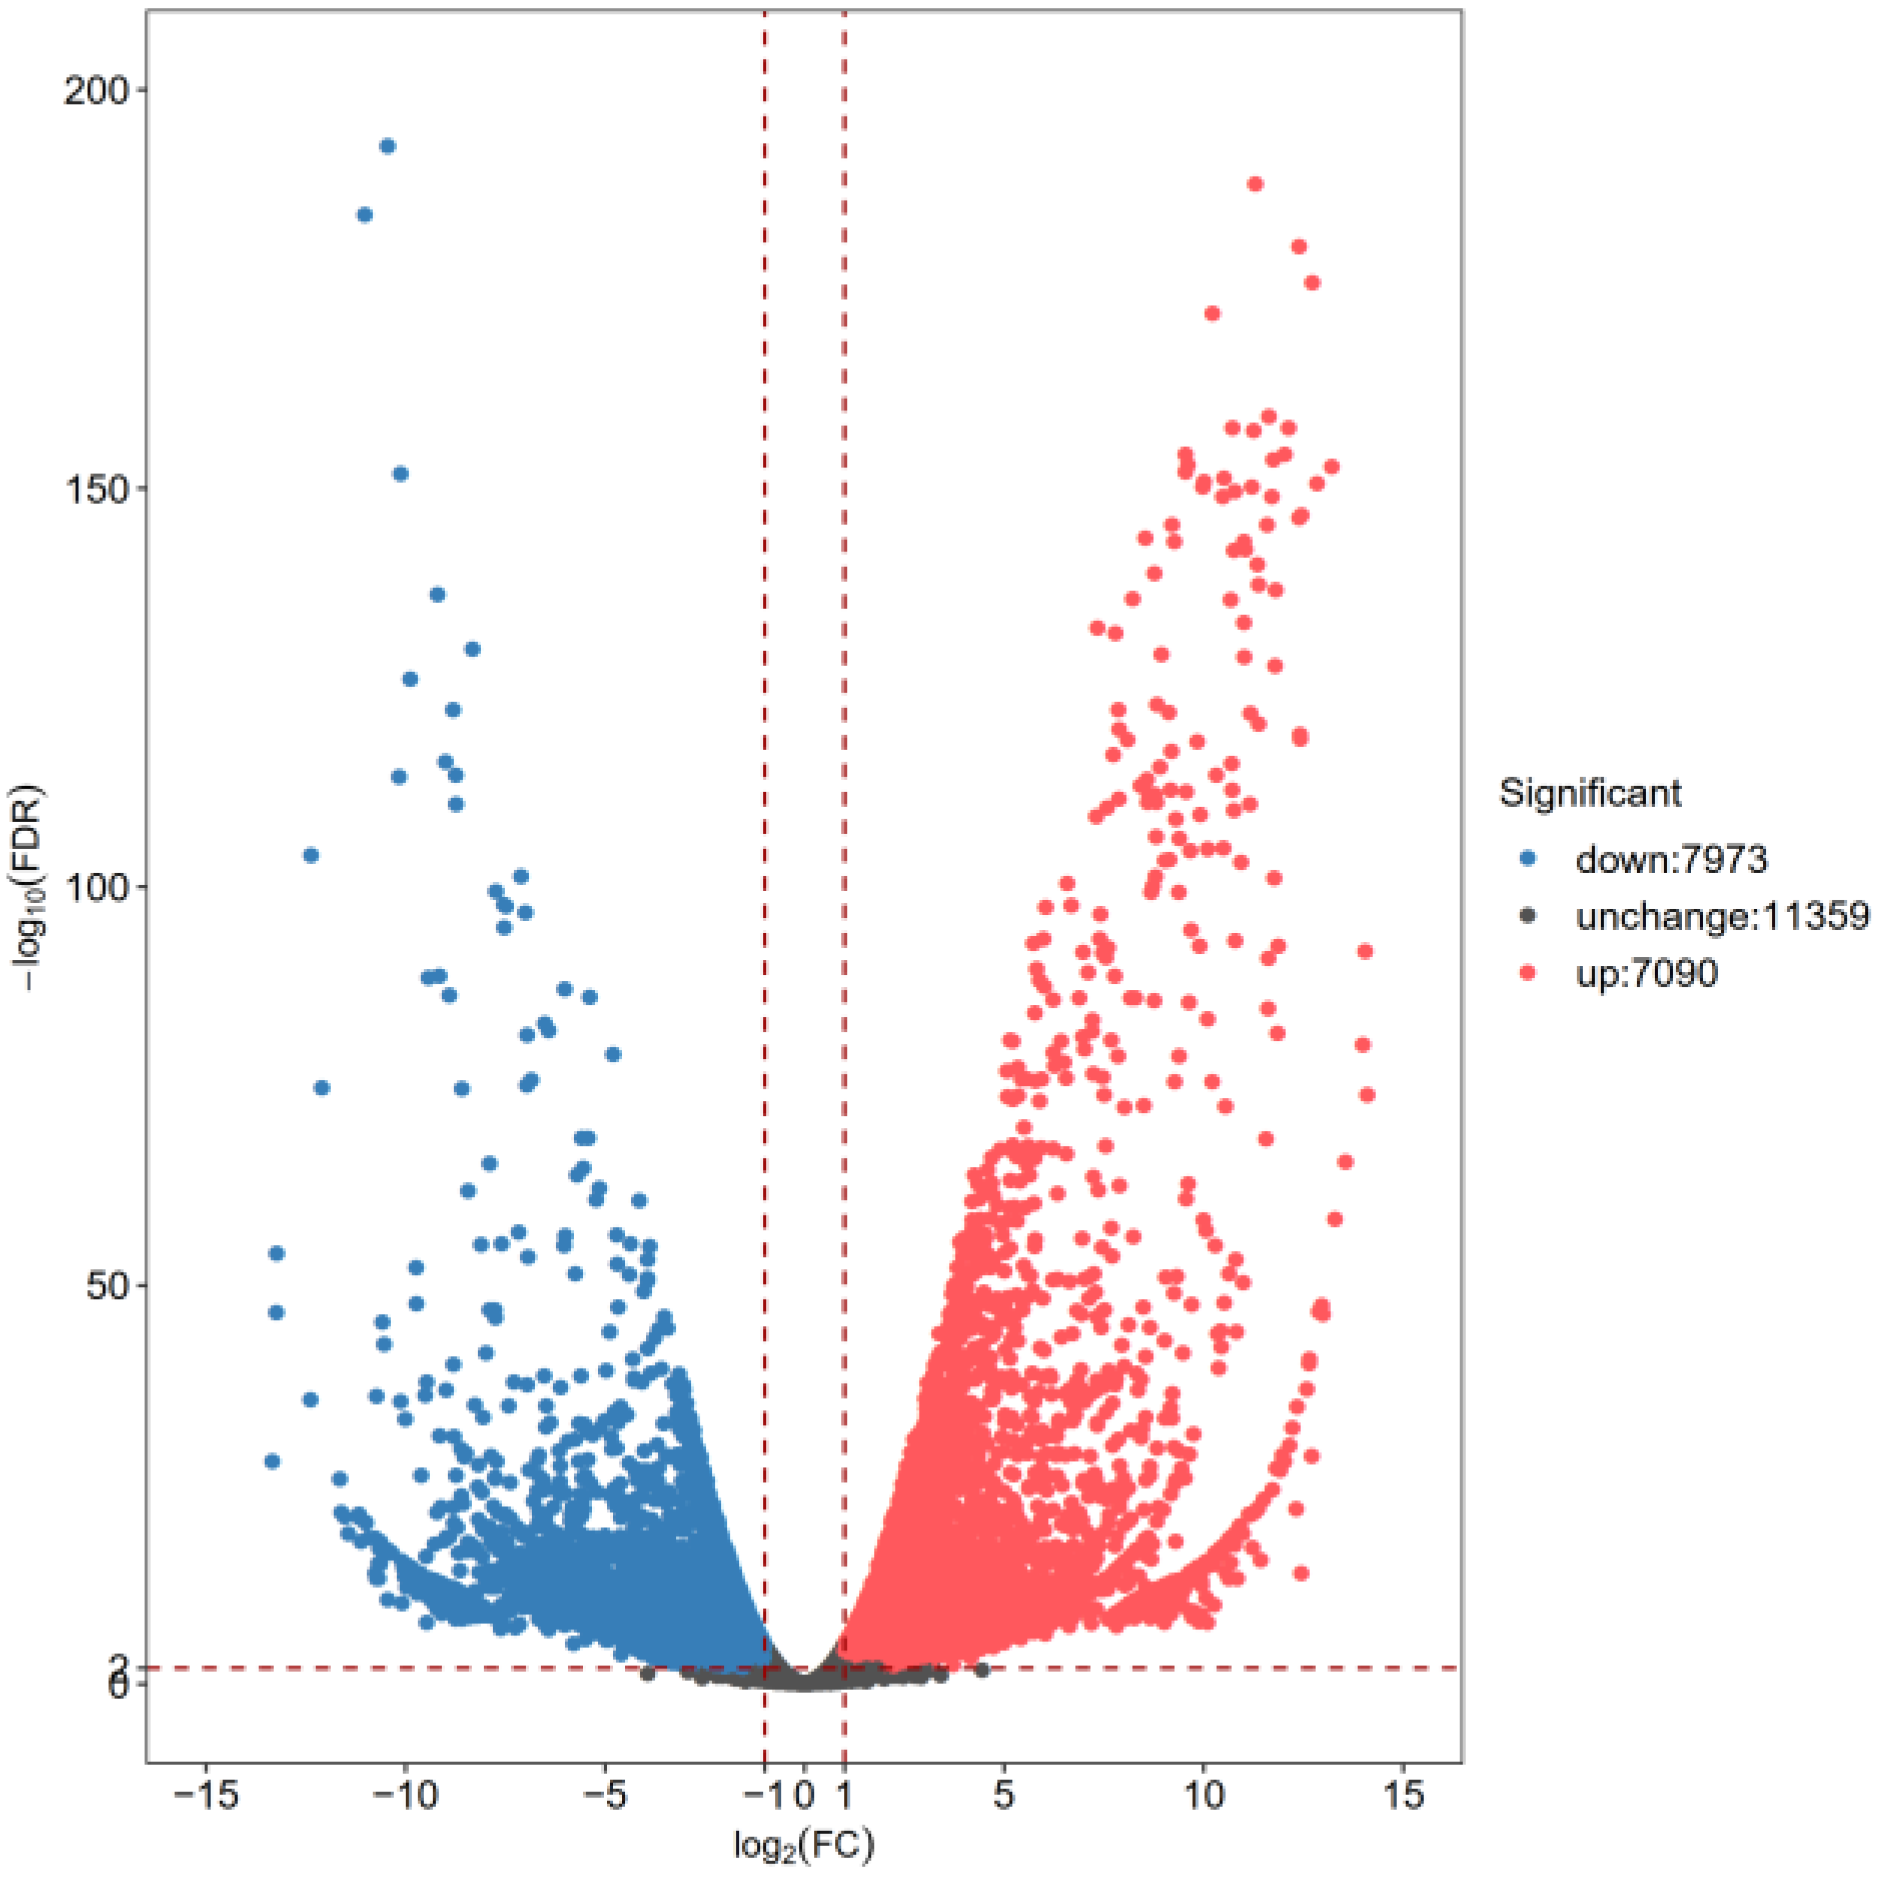
Based on the gene FKPM values, the uni-genes in the testes and ovaries of the CGSs were analyzed and a total of 15,063 DEGs were found in the testicular and ovarian tissues, of which 7090 (47.07%) DEGs were upregulated in the ovaries and 7973 (52.93%) genes were upregulated in the testes (Figure 2). The relatively high DEGs in the ovaries had higher significance and were more dispersed (red dots), indicating that these genes are extremely specific to the ovary. The relatively high expression of DEGs is relatively more concentrated in the testes (blue dots). However, the total number of relatively highly expressed DEGs in the ovaries did not differ significantly from the number of relatively highly expressed DEGs in the testes (Figure 2).

3.3. GO Annotation of DEGs

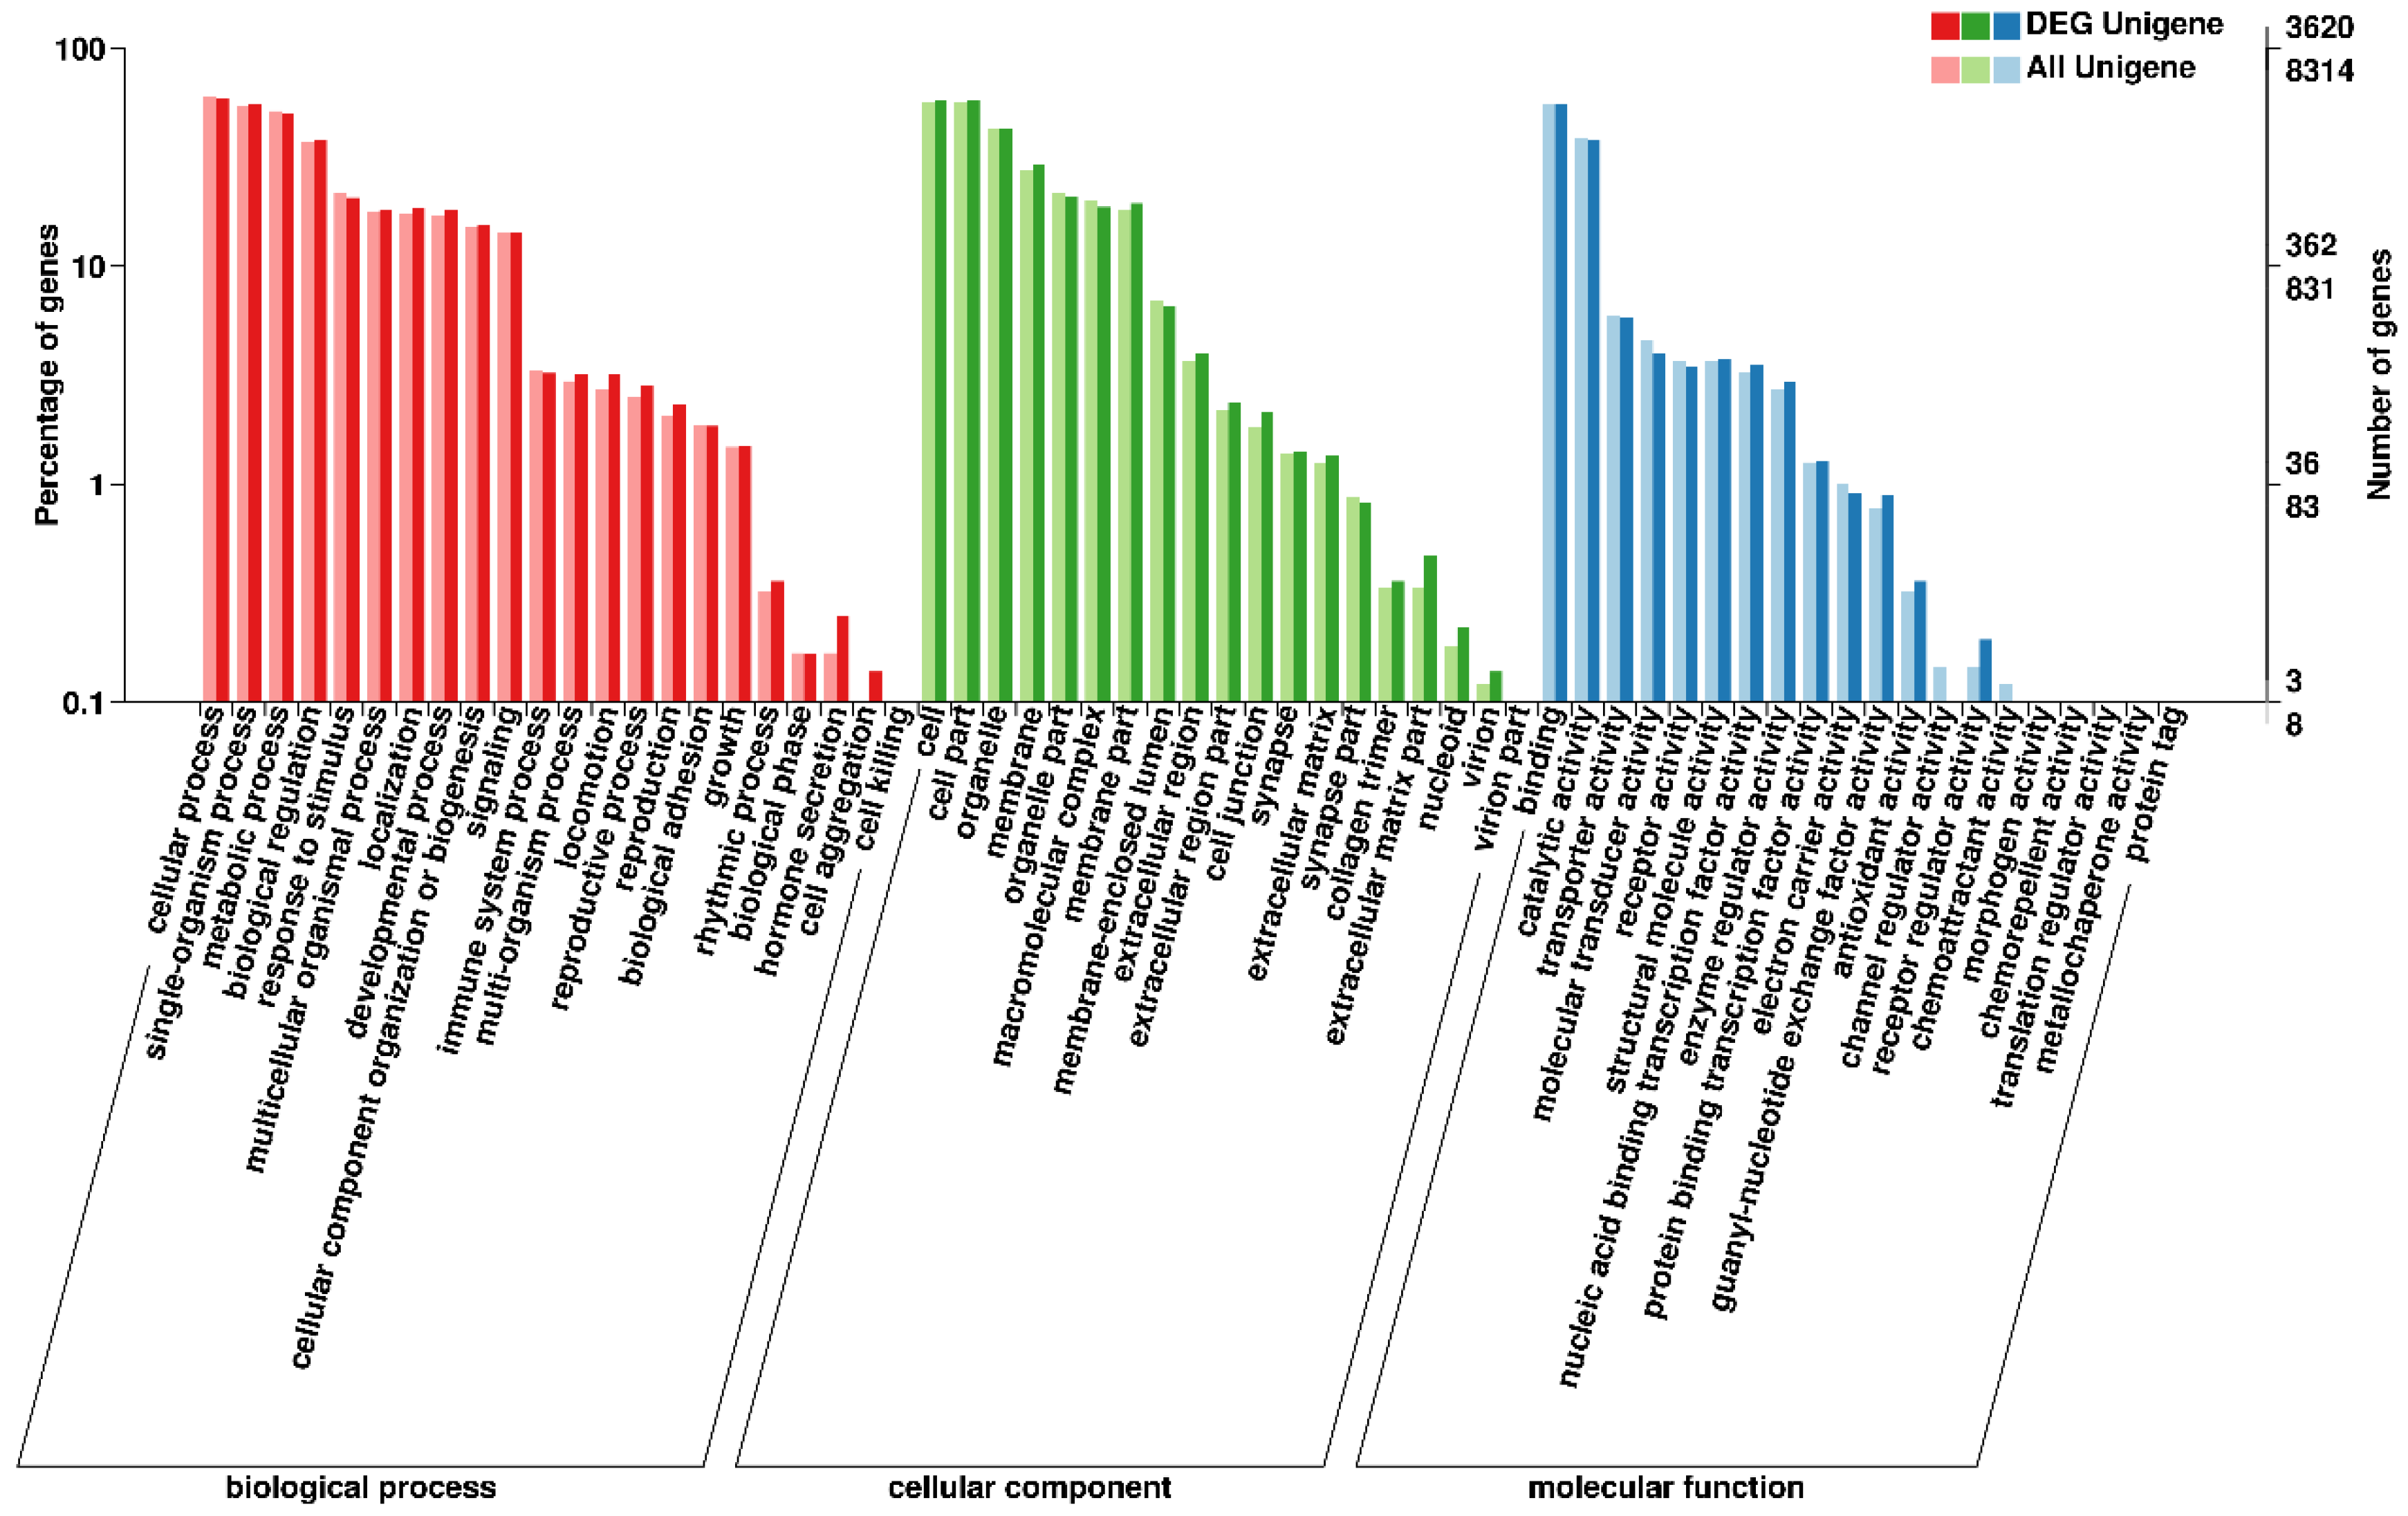
To explore the functions of the DEGs, GO functional enrichment analysis was performed on these DEGs. The annotation results of the DEGs at GO secondary nodes between sample groups are shown in Figure 3. The results showed that the DEGs were enriched to a total of 376 GO entries covering three major categories, i.e., biological processes, cellular components and molecular functions. A total of 263 entries were enriched for biological processes, involving GO secondary nodes such as developmental processes, biological regulation, response to stimuli and localization (Figure 3). Twenty-five entries were enriched for cellular components and include GO secondary nodes such as cells, membranes and organelles (Figure 3). Eighty-eight entries were enriched for molecular functions, including binding, structural molecule activity, protein tag, catalytic activity, transporter activity and other GO secondary nodes (Figure 3).
The DEGs of the female and male CGSs were analyzed for the biological process GO functional significance enrichment and the results of the biological process entries in the GO annotation are shown in Table S4 (only those with p < 0.01 are shown). This mainly involves translation, embryonic viscero-cranium morphogenesis, the BMP signaling pathway, the triglyceride biosynthetic process and spindle assembly. The DEGs from the female and male CGSs were analyzed for significant enrichment of GO functions in cellular components. The results of the GO cellular component entries are shown in Table S5 (only those with p < 0.01 are shown). The DEGs of the female and male CGSs were subjected to GO functional enrichment analysis in molecular functions. Significant enrichment analysis was performed and the results of GO molecular function entries are shown in Table S6 (only those with p < 0.01 are shown). This includes phospholipid binding, transforming growth factor beta receptor binding, DNA binding and phosphoprotein phosphatase activity.

3.4. KEGG Annotation of DEGs

To further explore the sex-related pathways involving DEGs, a KEGG enrichment analysis was performed. As shown in Table 2, the DEGs between the males and females were significantly enriched in 18 signaling pathways, including inositol phosphate metabolism, the MAPK signaling pathway, endocytosis, glycosaminoglycan degradation, the phosphatidylinositol signaling system, osteoclast differentiation and the starch and sucrose metabolism pathway (p ≤ 0.05).

3.5. Validation of DEGs with qPCR

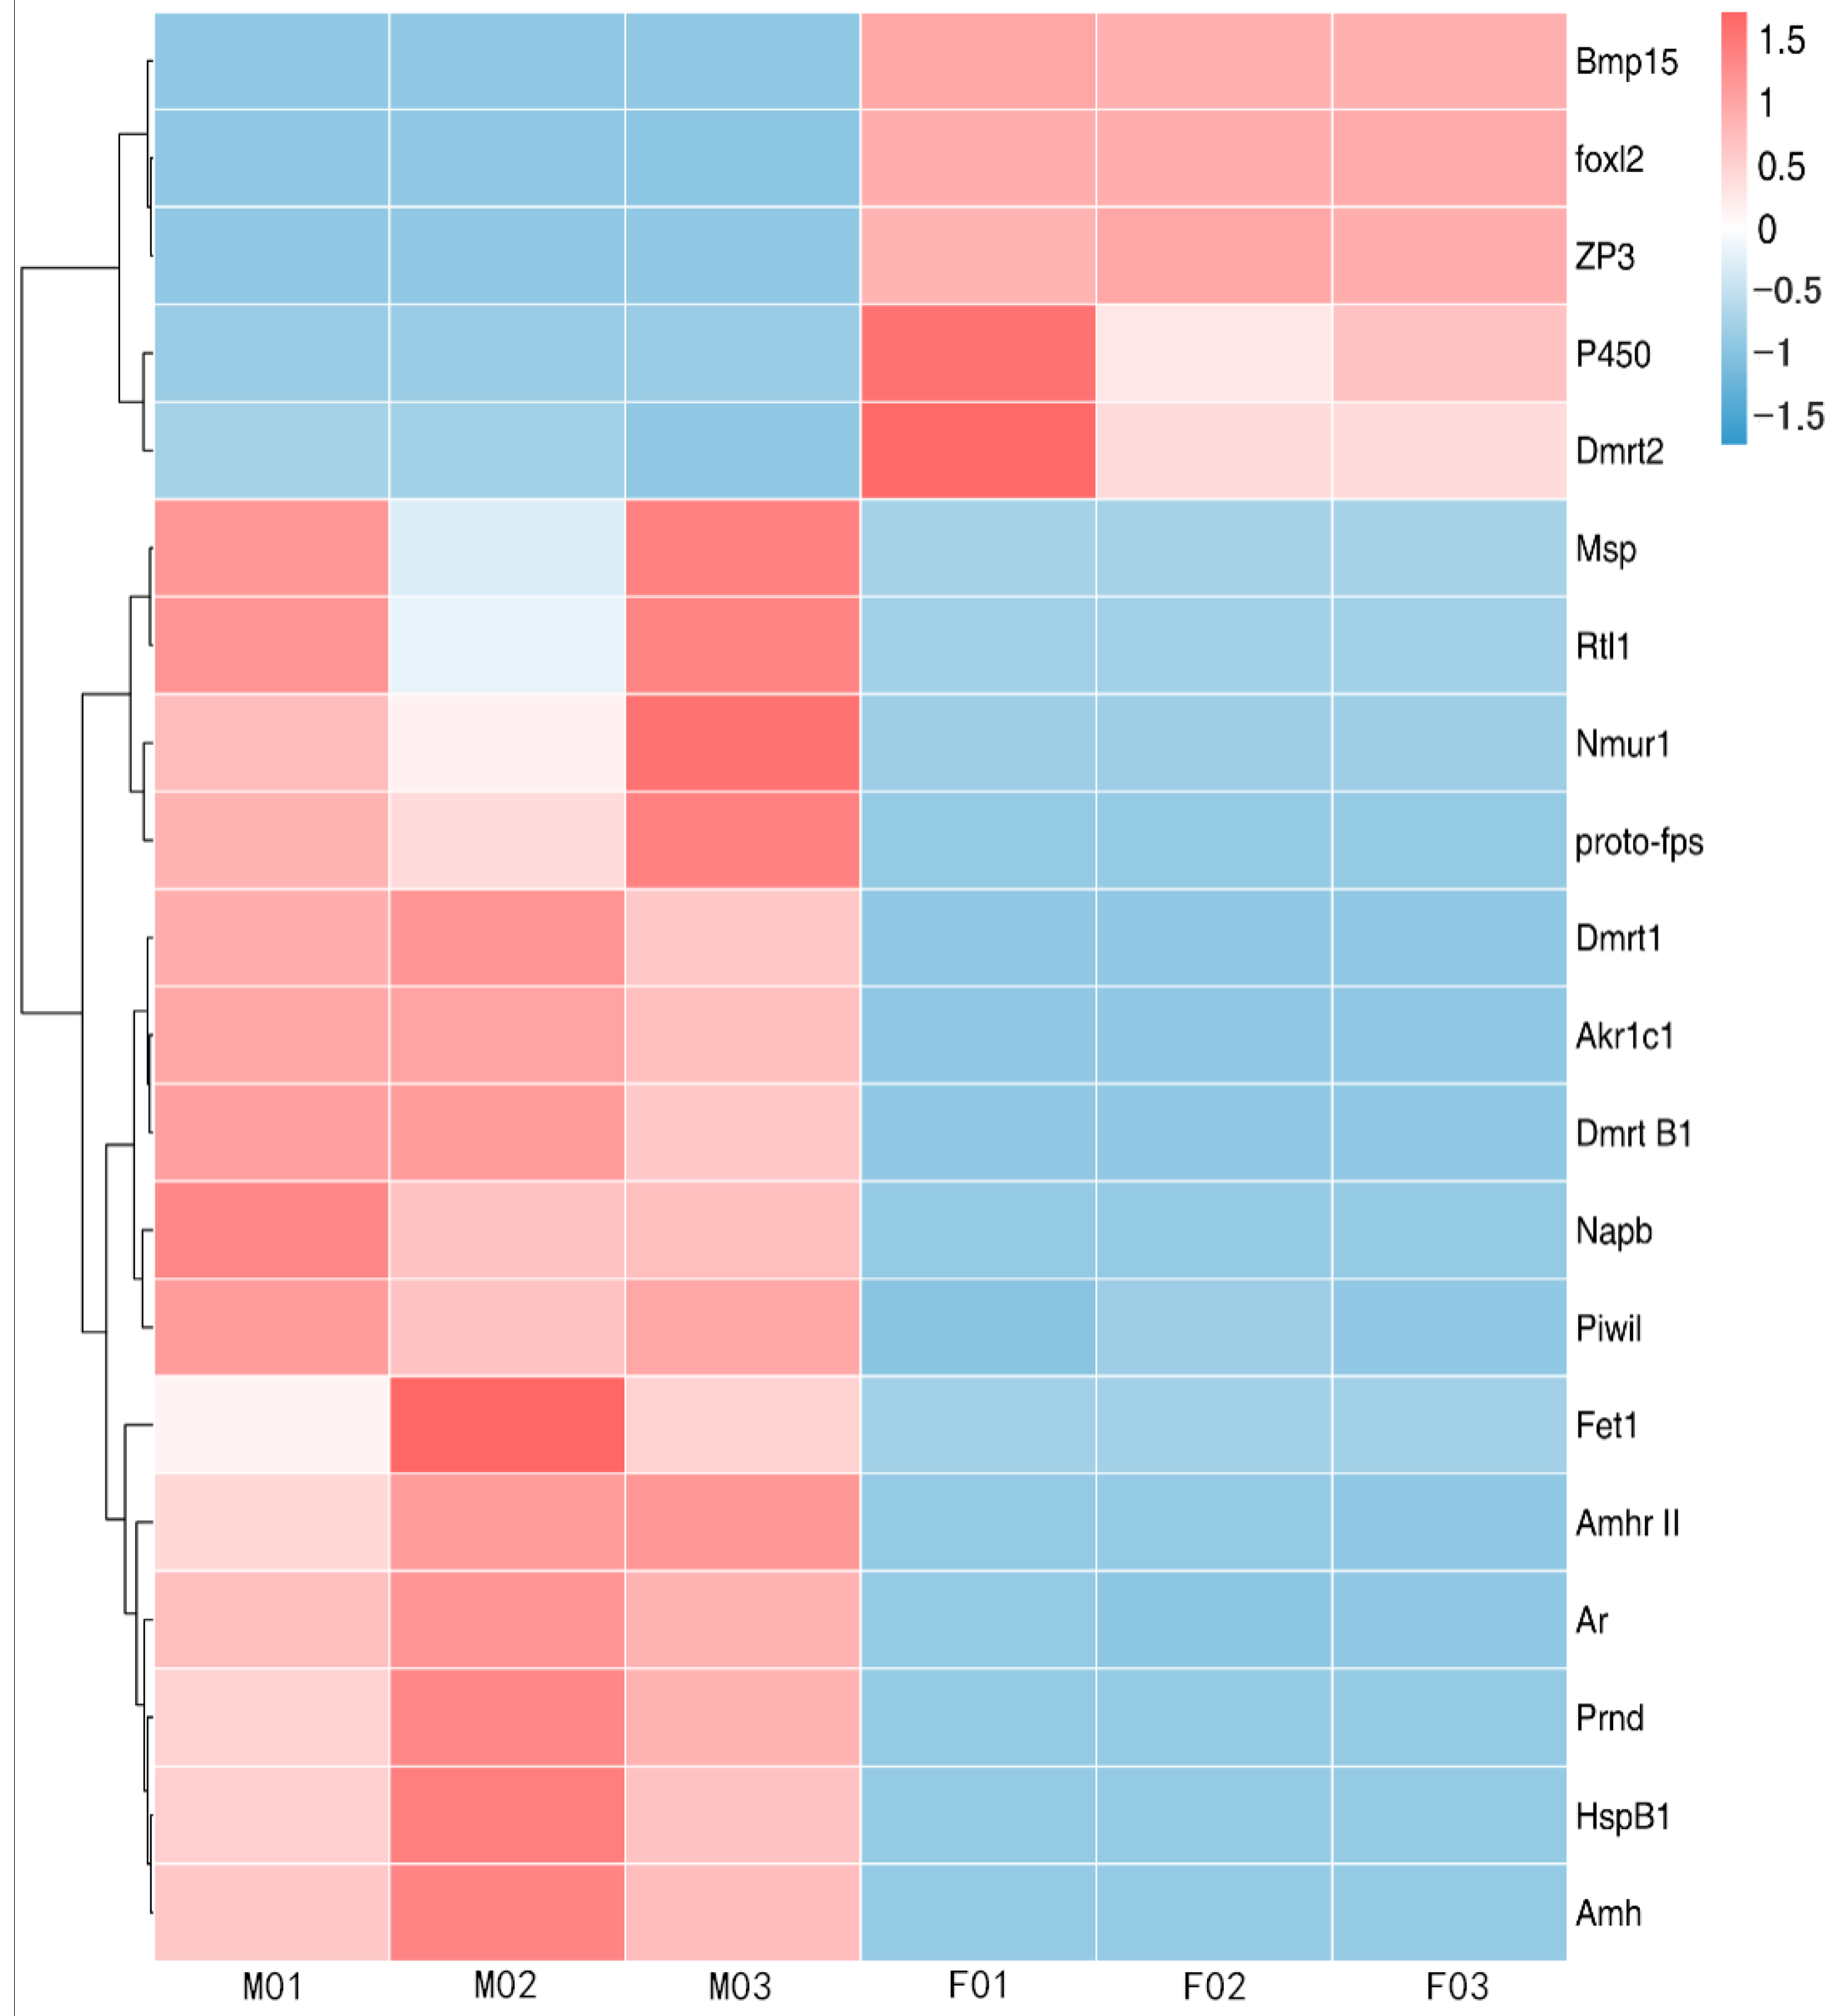
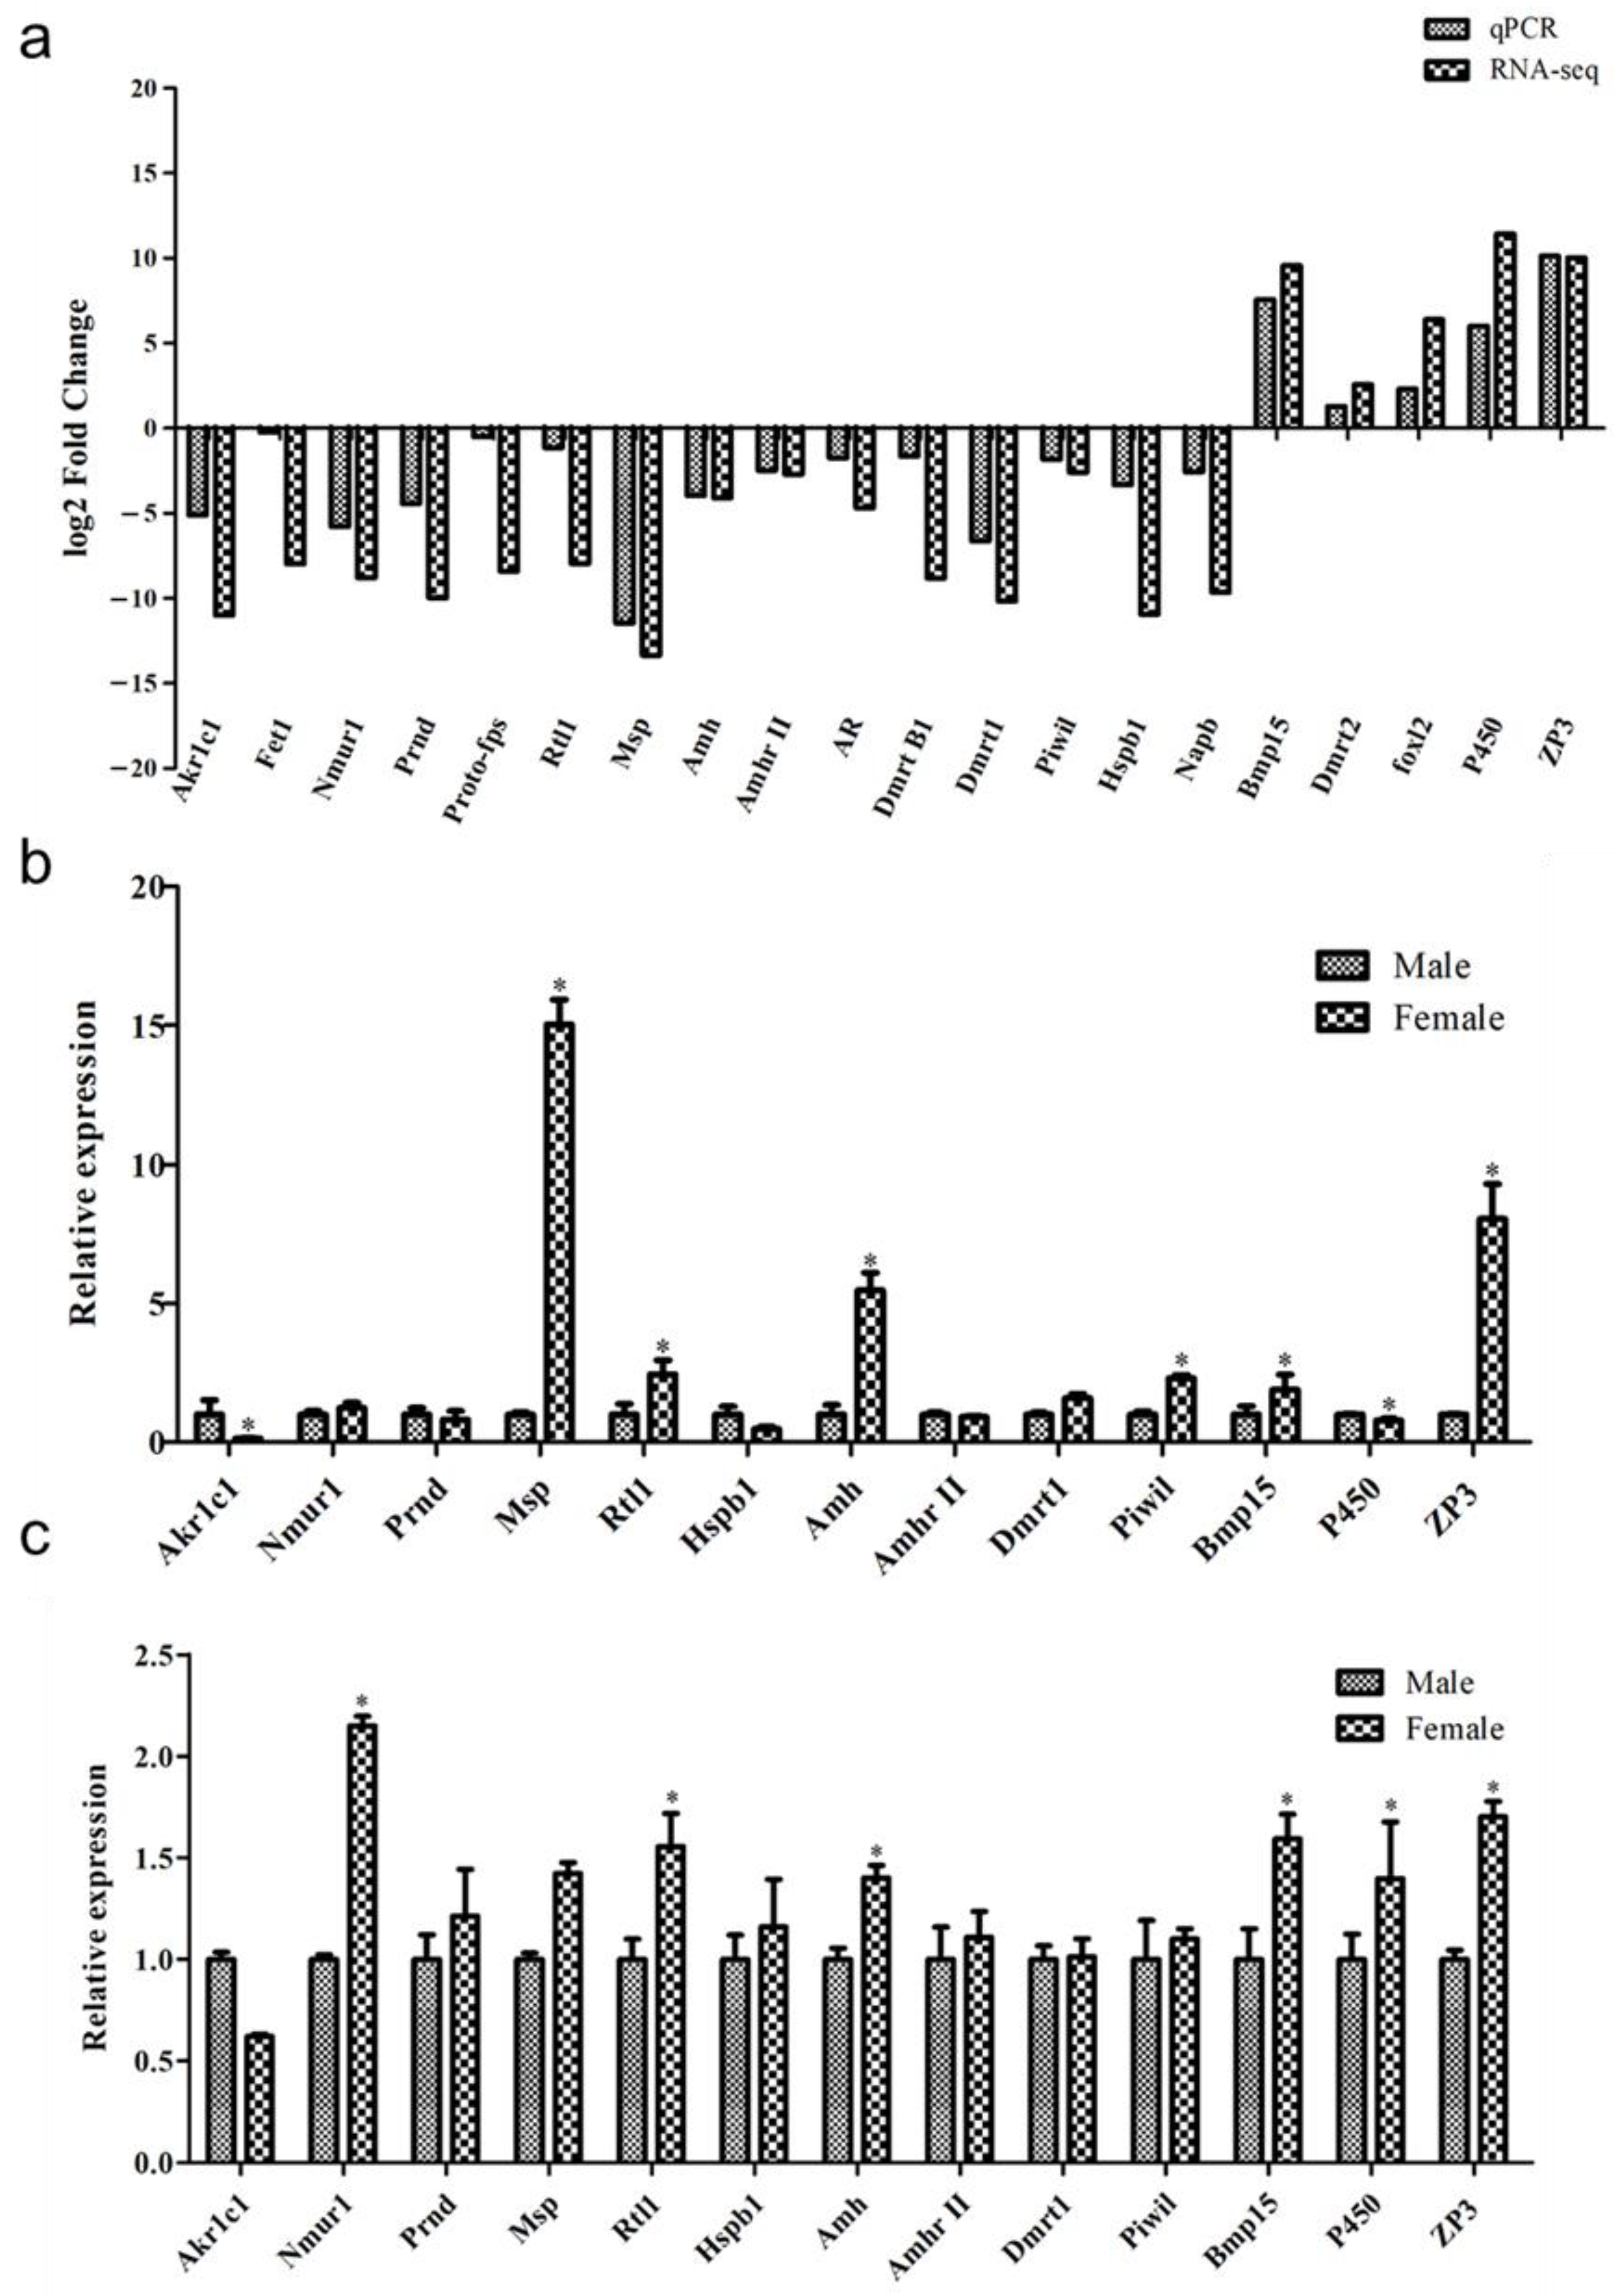
Twenty typical gonad-specific DEGs were selected for quantitative validation based on the principle of |FPKM value in male—FPKM value in female| ≥ 3, the transcript length was nearly the CDS and all of the genes’ Ct values were ≤35 (Figure 4). This included five female highly expressed genes, i.e., Foxl2, Bmp15, P450, Dmrt2 and ZP3 and 15 male highly expressed genes, i.e., HspB1, Dmrt1, Amhr II, Msp, Prnd, Nmur1, Proto-fps, Akr1c1, Rtl1, Fet1, Napb, AR, Piwil, DmrtB1 and Amh. Furthermore, qPCR was performed to validate 20 gonadal DEGs. As shown in Figure 5a, the relative expression of the Akr1c1, Msp, Prnd, Proto-fps, Nmur1, Rtl1, Fet1, Napb, AR, Piwil, HspB1, DmrtB1, AmhrII, Dmrt1 and Amh genes was significantly higher in the testes than in the ovaries of the CGSs (p < 0.05). The Foxl2, Bmp15, P450, Dmrt2 and ZP3 genes were significantly more abundantly expressed in the ovaries than in the testes (p < 0.05). Our study shows that the qPCR expression levels of the genes were consistent with the trend of the RNA sequencing results, validating the accuracy of the RNA sequencing.

3.6. Relative Expression of the mRNA Expression of the Identified DGEs in the Skin and Muscle

To verify whether these gonadal DEGs were also differentially expressed in the muscles and skin of the CGSs, 13 genes from the 20 DEGs in the gonads were selected for detection by qPCR in the muscle and skin tissues. As shown in Figure 5a,b, all genes tested were expressed in both the muscles and skin: Akr1c1 and P450 had significantly lower expression in the muscles of the females than in those of the males (p < 0.05; Figure 5b), while Msp, Rtl1, Amh, Piwil, Bmp15 and ZP3 had significantly higher expression in the muscles of the females than in those of the males (p < 0.05; Figure 5b). The relative expression of Nmur1, Rtl1, Amh, Bmp15, P450 and ZP3 was significantly higher in the skin of the females than in that of the males (p < 0.05; Figure 5c). In the muscles, Msp, Amh and ZP3 had higher expression ratios in both sexes, ranging from 2.5 to 15. However, in the skin, 13 genes had lower differential expression ratios between the males and females, ranging from 1.6 to 2.2. Therefore, the muscles were selected rather than the skin for sex identification assays by DEGs. Msp was expressed in the male CGS muscles with a Ct of approximately 35, a low relative expression and significantly different expression from the female CGS muscles with a ratio of 15 (to calculate the ratio with females, the male Msp was set at the actual Ct value), indicating that Msp could be a potential marker gene for sex identification in CGSs.

4. Discussion

In this study, RNA-seq was used to analyze the gonadal transcriptomes of sexually mature male and female CGSs. A total of 47.26 Gb of clean data was obtained from the transcriptome library, which passed quality assessment for subsequent analyses. The number of clean reads was nearly twice that of a previous study in the one-year-old CGSs [18]. Subsequent differential analysis of testicular and ovarian genes resulted in a total of 15,063 DEGs that met the condition of |log2(FC)| > 2 and p < 0.01, including 7090 female-biased DEGs and 7973 male-biased DEGs. The number of DEGs was less than that in previously published papers, which may be due to the one-year-old samples in a previous study (undergoing gonadal development) and the six-year-old samples in this study (mature gonads) [18]. Functional enrichment analysis was performed to better understand the potential role of DEGs. A total of 20 sexual DEGs involved in different signaling pathways, such as the male-biased genes Dmrt1, Amh, HspB1 and Akr1c1 highly expressed in the testes, were selected by alignment with information in the database and other species. Among them, the genes Dmrt1, Amh, Bmp15, ZP3, AR and Piwil were identified in a previous study [18] and the genes Foxl2, P450, Dmrt2, HspB1, AmhrII, Msp, Prnd, Nmur1, Proto-fps, Akr1c1, Rtl1, Fet1, Napb and DmrtB1 were newly explored. Interestingly, we first showed that most genes that were differentially expressed in the gonads were not reflected on the muscles and skin. Only the expressions of Bmp15 and ZP3 were consistent in the muscles and skin compared to the gonads of A. davidianus.
Genes associated with sex development can be better screened by the transcriptomic method. For example, in a comparative transcriptomic analysis of the testes and ovaries in the yellow pond turtle (Mauremys mutica) to screen for genes that differ between males and females, DEGs were found to be mainly enriched in the signaling pathways related to sex differentiation and gonadal development [21]. In this study, we analyzed the functions of DEGs by GO annotation and found a large number of functional genes related to sex, including sex differentiation, sexual reproduction, gamete formation, gonadal development, steroid hormone receptor activity, Sertoli cell differentiation and the retinoic acid catabolic process (retinoic acid in mouse embryos can induce germ cell maturation and division and its expression in the ovaries is higher than that in the testes) [22]. It is not clear whether these DEGs play important roles in sex determination, differentiation or maintenance, gamete formation, spermatoogenesis and embryonic development in CGSs, but this should provide a basic reference for the sex hallmarks. Analysis of the KEGG pathway showed that, compared to the male gonads, the female gonads were mainly enriched in the GnRH signaling pathway, the TGF-β signaling pathway, the MAPK signaling pathway, the insulin signaling pathway, oocyte meiosis, the GnRH signaling pathway, the TGF-β signaling pathway and the other signaling pathways related to female gonadal development. Among them, MAPK has an important role in oocyte meiosis and its phosphorylation induces germinal vesicle rupture and promotes oocyte development and maturation [23,24].
Previous studies have confirmed that Dmrt1 is a key gene in male sex determination in most animals, including amphibians [25]. This gene and its homologs have been shown to play a role in sexual differentiation in various species [26,27]. Dmrt1 has been suggested to play different roles in sex determination and gonad differentiation, because different expression patterns have been reported among different vertebrates [28]. In this study, Dmrt1 gene expression was found to be significantly higher in the gonads of male rather than female salamanders based on transcriptomic data and qPCR results, consistent with previous studies [18,25,26,27], suggesting that the sex determination gene continues to sexual maturity. Moreover, another two DEGs, Amh and AmhrII, were also shown to be sex-determining genes [29,30]. Amh is involved in the differentiation of cells during gonadal development by suppressing Müllerian ducts and regulating steroid production while regulating germ cell proliferation [31]. It has been found that mutations in the Amh gene in male vertebrates result in testicular hypertrophy and increase the proportion of female individuals [32]. The AmhrII mutation also causes sex reversal and germ cell hyper-proliferation in half of the vertebrates males [33,34]. Some studies have shown that the Amh plays a role in male sex development and sperm maintenance [35] and it is also expressed in the ovary, suggesting the Amh works in the ovary [36]. By annotating Amh and AmhrII as TGF-β family members and receptors [37], we confirmed that Amh and Amhr II are more highly expressed in male than female CGSs. Amh was also confirmed in a previous study [18], suggesting that these two genes may be representative markers to distinguish males and females. The Piwil gene is important for cell maturation and differentiation and has been proven to have functional duality in different stages of reproduction [38].
In the present study, typical female highly expressed genes, such as Foxl2, Bmp15 and ZP3, were detected in the ovaries of the CGSs. The Foxl2 gene, which is highly expressed in the ovaries, is mainly involved in the TGF-β, MAPK and insulin/IGF signaling pathways [37] and has an important conserved function in ovarian development [38]. Mechaincally, Foxl2 is involved in the transcriptional regulation of P450 arom, a key enzyme for estradiol biosynthesis in vertebrates [39]. Bmp15 is an essential transcription factor in normal follicle formation and has been shown to be essential for the maintenance of the female sex [40,41]. Overall, we found that Foxl2, Bmp15 and ZP3 were expressed at significantly higher levels in the ovaries than in the testes, which is consistent with their expression in the gonads, indicating a significant role for these genes in maintaining sex characteristics in CGSs.
Sex DEGs were amplified from the muscle and skin tissues of CGSs, following which 13 sex-specific genes were found to be expressed in said muscle and skin tissues. However, there were differences in the expression ratios between males and females. In particular, Akr1c1 was expressed significantly more in the males than females, whereas Msp, Amh and Rtl1 were expressed significantly more in the females than males in the muscle tissue, showing different expression patterns than the gonads. Of these three genes, Msp is a non-glycosylated small molecule hydrophilic protein. Originally found in human semen, it is a secreted protein that has emerged as a potential marker for prostate cancer [42,43]. A previous study has confirmed that it is also expressed in the skin tissues of female and male stream salamanders [44]. Consistent with previous studies, we found that Msp was expressed in the muscles of CGSs. Overall, it is not clear whether the differently expressed pattern of these sex-biased genes are related to the indistinguishable secondary sex characteristic of CGSs. The mechanism of this phenomenon should be further confirmed.

5. Conclusions

In this study, we deployed RNA-seq for gonad tissue transcriptome analysis to identify 15,063 DEGs specific to the testes and ovaries of CGSs in sexually mature individuals. We also identified 13 DEGs in the muscles and skin and surprisingly found that most genes showed different expression patterns in the muscles and skin in comparison to the gonads. Our study should provide a reference for the mechanism analysis of sex development/hallmarks in CGSs.

Supplementary Materials

The following supporting information can be downloaded at: https://www.mdpi.com/article/10.3390/fishes7060399/s1, Table S1: Sequencing data statistics of Andrias davidianus with three males and three females; Table S2: De novo Assembly of Andrias davidianus transcript and unigenes; Table S3: Statistics table of sequencing data of Andrias davidianus; Table S4: GO terms of biological process of differentially expressed genes (DEGs) in the gonadal tissue of Andrias davidianus with two sexes; Table S5: GO terms of cellular component of differentially expressed genes (DEGs) in the gonadal tissue of Andrias davidianus with two sexes. Table S6: GO terms of molecular function of differentially expressed genes (DEGs) in the gonadal tissue of Andrias davidianus with two sexes.

Author Contributions

Conceptualization, H.Z. (Hu Zhao) and Q.W.; methodology, J.H. and H.L.; formal analysis, H.M., J.D. and J.H.; writing—original draft preparation, H.Z. (Hu Zhao); writing—review and editing, F.K. and Q.W.; supervision, C.F., H.Z. (Han Zhang) and W.J.; funding acquisition, H.Z. (Hongxing Zhang) and Q.W. All authors have read and agreed to the published version of the manuscript.

Funding

This research was jointly supported by the Shaanxi Academy of Science of China (grant No. 2015K-03; grant No. 2021K-19) and Shaanxi Science and Technology Department (2022NY-045).

Institutional Review Board Statement

The animal study protocol was approved by the Animal Ethics Committee of the Shaanxi Institute of Zoology (protocol code: L22D002A51, date of approval: 19 May 2022) for studies involving animals.
Institutional Review Board Statement

Data Availability Statement

The data presented in this study are available upon request from the corresponding author.

Acknowledgments

Our sincere thanks go to Yongjin Liang at Chenggu County, for providing the experimental CGS to us during the entire project period. We also thank Xiaoyan Cheng, for her help during the differential gene screening period and Lei Cui, Zhujin Ding and Fan Wu, for their assistance with sample pretreatment and tissue expression analysis.

Conflicts of Interest

The authors declare no conflict of interest.

References

  1. Huo, Z.; Guo, J.; Li, X.; Yu, X. Post-fledging dispersal and habitat use of a reintroduced population of the Crested Ibis (Nipponia nippon). Avian Res. 2014, 5, 7. [Google Scholar] [CrossRef] [Green Version]
  2. Riaz, M.; Kuemmerlen, M.; Wittwer, C.; Cocchiararo, B.; Khaliq, I.; Pfenninger, M.; Nowak, C. Combining environmental DNA and species distribution modeling to evaluate reintroduction success of a freshwater fish. Ecol. Appl. 2020, 30, e02034. [Google Scholar] [CrossRef] [PubMed] [Green Version]
  3. Lutz, M.L.; Tonkin, Z.; Yen, J.D.L.; Johnson, G.; Ingram, B.A.; Sharley, J.; Lyon, J.; Chapple, D.G.; Sunnucks, P.; Pavlova, A. Using multiple sources during reintroduction of a locally extinct population benefits survival and reproduction of an endangered freshwater fish. Evol. Appl. 2021, 14, 950–964. [Google Scholar] [CrossRef] [PubMed]
  4. Geng, X.; Wei, H.; Shang, H.; Zhou, M.; Chen, B.; Zhang, F.; Zang, X.; Li, P.; Sun, J.; Che, J.; et al. Data from proteomic analysis of the skin of Chinese giant salamander (Andrias davidianus). Data Br. 2015, 3, 99–102. [Google Scholar] [CrossRef] [PubMed] [Green Version]
  5. Chen, X.; Jin, W.; Chen, D.; Dong, M.; Xin, X.; Li, C.; Xu, Z. Collagens made from giant salamander (Andrias davidianus) skin and their odorants. Food Chem. 2021, 361, 130061. [Google Scholar] [CrossRef] [PubMed]
  6. Gao, K.Q.; Shubin, N.H. Earliest known crown-group salamanders. Nature 2003, 422, 424–428. [Google Scholar] [CrossRef]
  7. Turvey, S.T.; Chen, S.; Tapley, B.; Wei, G.; Xie, F.; Yan, F.; Yang, J.; Liang, Z.; Tian, H.; Wu, M.; et al. Imminent extinction in the wild of the world’s largest amphibian. Curr. Biol. 2018, 28, R592–R594. [Google Scholar] [CrossRef] [Green Version]
  8. Mittwoch, U. Sex determination and sex reversal: Genotype, phenotype, dogma and semantics. Hum. Genet. 1992, 89, 467–479. [Google Scholar] [CrossRef]
  9. Sandra, G.E.; Norma, M.M. Sexual determination and differentiation in teleost fish. Rev. Fish Biol. Fisher. 2010, 20, 101–121. [Google Scholar] [CrossRef]
  10. Hayes, T.B. Sex determination and primary sex differentiation in amphibians: Genetic and developmental mechanisms. J. Exp. Zool. 1998, 281, 373–399. [Google Scholar] [CrossRef]
  11. Devlin, R.H.; Nagahama, Y. Sex determination and sex differentiation in fish: An overview of genetic, physiological, and environmental influences. Aquaculture 2002, 208, 191–364. [Google Scholar] [CrossRef]
  12. Wang, Z.; Gerstein, M.; Snyder, M. RNA-Seq: A revolutionary tool for transcriptomics. Nat. Rev. Genet. 2009, 10, 57–63. [Google Scholar] [CrossRef] [PubMed]
  13. Li, J.; Yu, H.; Wang, W.; Fu, C.; Zhang, W.; Han, F.; Wu, H. Genomic and transcriptomic insights into the molecular basis of sexually dimorphic nuptial spines in Leptobrachium leishanense. Nat. Commun. 2019, 10, 5551. [Google Scholar] [CrossRef] [Green Version]
  14. Huang, L.; Li, J.; Anboukaria, H.; Luo, Z.; Zhao, M.; Wu, H. Comparative transcriptome analyses of seven anurans reveal functions and adaptations of amphibian skin. Sci. Rep. 2016, 6, 24069. [Google Scholar] [CrossRef] [Green Version]
  15. Huang, X.; Shen, W.; Veizades, S.; Liang, G.; Sayed, N.; Nguyen, P.K. Single-cell transcriptional profiling reveals sex and age diversity of gene expression in mouse endothelial cells. Front. Genet. 2021, 12, 22. [Google Scholar] [CrossRef] [PubMed]
  16. Li, T.J.; Zheng, L.P.; Duan, X.P. Application of PCR for sex determination from bovine muscle tissue. J. Tianjin Agric. Coll. 2001, 8, 22–23. (In Chinese) [Google Scholar]
  17. Wang, J.; Yang, G.; Zhou, K.; Wei, F.; Yan, J. PCR amplification of the Sry gene for cetacean sex identification. J. Vet. Sci. 2005, 25, 20. (In Chinese) [Google Scholar]
  18. Hu, Q.; Tian, H.; Li, W.; Meng, Y.; Wang, Q.; Xiao, H. Identification of critical sex-biased genes in Andrias davidianus by de novo transcriptome. Mol. Genet. Genom. 2019, 294, 287–299. [Google Scholar] [CrossRef]
  19. Gao, Y.; Yang, C.; Gao, H.; Wang, L.; Yang, C.; Ji, H.; Dong, W. Molecular characterisation of oestrogen receptor ERα and the effects of bisphenol A on its expression during sexual development in the Chinese giant salamander (Andrias davidianus). Reprod. Fert. Develop. 2019, 31, 261–271. [Google Scholar] [CrossRef]
  20. Hu, Q.; Xiao, H.; Wang, Q.; Tian, H.; Meng, Y. Identification and expression of forkhead box genes in the Chinese giant salamander Andrias davidianus. Reprod. Fert. Develop. 2018, 30, 634–642. [Google Scholar] [CrossRef] [Green Version]
  21. Zhu, Y.; Liu, X.; Wang, Y.; Li, W.; Hong, X.; Zhu, X.; Xu, H. Identification and analysis of lncRNAs and mRNAs involved in sex regulation in Asian yellow pond turtle (Mauremys mutica). J. Fish. China 2020, 44, 1960–1975. (In Chinese) [Google Scholar]
  22. Bowles, J.; Knight, D.; Smith, C.; Wilhelm, D.; Richman, J.; Mamiya, S.; Yashiro, K.; Chawengsaksophak, K.; Wilson, M.J.; Rossant, J. Retinoid signaling determines germ cell fate in mice. Science 2006, 312, 596–600. [Google Scholar] [CrossRef] [PubMed] [Green Version]
  23. Sun, Q.Y.; Miao, Y.L.; Schatten, H. Towards a new understanding on the regulation of mammalian oocyte meiosis resumption. Cell Cycle 2009, 8, 2741–2747. [Google Scholar] [CrossRef]
  24. Liang, C.G.; Su, Y.Q.; Fan, H.Y.; Schatten, H.; Sun, Q.Y. Mechanisms regulating oocyte meiotic resumption: Roles of mitogen-activated protein kinase. Mol. Endocrinol. 2007, 21, 2037–2055. [Google Scholar] [CrossRef] [PubMed]
  25. Herpin, A.; Schartl, M. Dmrt1 genes at the crossroads: A widespread and central class of sexual development factors in fish. FEBS J. 2011, 278, 1010–1019. [Google Scholar] [CrossRef] [PubMed]
  26. Chandler, J.C.; Fitzgibbon, Q.P.; Smith, G.; Elizur, A.; Ventura, T. Y-linked iDmrt1 paralogue (iDMY) in the Eastern spiny lobster, Sagmariasus verreauxi: The first invertebrate sex-linked Dmrt. Dev. Biol. 2017, 430, 337–345. [Google Scholar] [CrossRef]
  27. Hirst, C.E.; Major, A.T.; Ayers, K.L.; Brown, R.J.; Mariette, M.; Sackton, T.B.; Smith, C.A. Sex reversal and comparative data undermine the W chromosome and support Z-linked DMRT1 as the regulator of gonadal sex differentiation in birds. Endocrinology 2017, 158, 2970–2987. [Google Scholar] [CrossRef]
  28. Xia, W.; Zhou, L.; Yao, B.; Li, C.J.; Gui, J.F. Differential and spermatogenic cell-specific expression of DMRT1 during sex reversal in protogynous hermaphroditic groupers. Mol. Cell. Endocrinol. 2007, 263, 156–172. [Google Scholar] [CrossRef]
  29. Goodfellow, P.N.; Lovell-Badge, R. SRY and sex determination in mammals. Annu. Rev. Genet. 1993, 27, 71–92. [Google Scholar] [CrossRef]
  30. Tilmann, C.; Capel, B. Cellular and molecular pathways regulating mammalian sex determination. Recent Prog. Horm. Res. 2002, 57, 1–18. [Google Scholar] [CrossRef] [Green Version]
  31. Rajpert-De Meyts, E.; Jørgensen, N.; Græm, N.; Müller, J.; Cate, R.L.; Skakkebæk, N.E. Expression of anti-Mullerian hormone during normal and pathological gonadal development: Association with differentiation of Sertoli and granulosa cells. J. Clin. Endocr. Metab. 1999, 84, 3836–3844. [Google Scholar] [CrossRef] [PubMed]
  32. Lin, Q.; Mei, J.; Li, Z.; Zhang, X.; Zhou, L.; Gui, J.F. Distinct and cooperative roles of amh and dmrt1 in self-renewal and differentiation of male germ cells in zebrafish. Genetics 2017, 207, 1007–1022. [Google Scholar] [CrossRef] [PubMed] [Green Version]
  33. Nakamura, M. Sex determination in amphibians. Semin. Cell Dev. Biol. 2009, 20, 271–282. [Google Scholar] [CrossRef] [PubMed]
  34. Nakamura, S.; Watakabe, I.; Nishimura, T.; Picard, J.-Y.; Toyoda, A.; Taniguchi, Y.; di Clemente, N.; Tanaka, M. Hyperproliferation of mitotically active germ cells due to defective anti-Müllerian hormone signaling mediates sex reversal in medaka. Development 2012, 139, 2283–2287. [Google Scholar] [CrossRef] [PubMed] [Green Version]
  35. Hu, Q.; Guo, W.; Gao, Y.; Tang, R.; Li, D.P. Molecular cloning and characterization of amh and dax1 genes and their expression during sex inversion in rice-field eel Monopterus albus. Sci. Rep. 2015, 5, 16667. [Google Scholar] [CrossRef] [Green Version]
  36. Yan, Y.; Zhu, H.J.; Tao, Y.F.; Xu, P.; Qiang, J. Research progress on the effect of AMH gene on sex determination in fish. Heilongjiang Anim. Hus. Vet. Med. 2022, 2, 26–31. (In Chinese) [Google Scholar]
  37. Zhang, X.; Li, M.; Ma, H.; Liu, X.; Shi, H.; Li, M.; Wang, D. Mutation of foxl2 or cyp19a1a results in female to male sex reversal in XX Nile tilapia. Endocrinology 2017, 158, 2634–2647. [Google Scholar] [CrossRef] [Green Version]
  38. Liu, H.; Mu, X.; Gui, L.; Su, M.; Li, H.; Zhang, G.; Liu, Z.; Zhang, J. Characterization and gonadal expression of FOXL2 relative to Cyp19a genes in spotted scat Scatophagus argus. Gene 2015, 561, 6–14. [Google Scholar] [CrossRef]
  39. Sun, P.; You, F.; Liu, M.; Wu, Z.; Wen, A.; Li, J.; Xu, Y.; Zhang, P. Steroid sex hormone dynamics during estradiol-17β induced gonadal differentiation in Paralichthys olivaceus (Teleostei). Chin. J. Oceanol. Limnol. 2010, 28, 254–259. (In Chinese) [Google Scholar] [CrossRef]
  40. Silva, B.D.M.; Castro, E.A.; Souza, C.J.H.; Paiva, S.R.; Sartori, R.; Franco, M.M.; Azevedo, H.C.; Silva, T.A.S.N.; Vieira, A.M.C.; Neves, J.P.; et al. A new polymorphism in the growth and differentiation factor 9 (GDF9) gene is associated with increased ovulation rate and prolificacy in homozygous. Anim. Genet. 2011, 42, 89–92. [Google Scholar] [CrossRef] [Green Version]
  41. Dranow, D.B.; Hu, K.; Bird, A.M.; Lawry, S.T.; Adams, M.T.; Sanchez, A.; Amatruda, J.F.; Draper, B.W. Bmp15 is an oocyte-produced signal required for maintenance of the adult female sexual phenotype in zebrafish. PLoS Genet. 2016, 12, e1006323. [Google Scholar] [CrossRef] [PubMed] [Green Version]
  42. Thakur, N.K. On the food of the air-breathing catfish, Clarias batrachus (Linn.) occurring in wild waters. Int. Rev. Hydrobiol. Hydrogr. 1978, 63, 421–431. [Google Scholar] [CrossRef]
  43. Ulvsbäck, M.; Lindström, C.; Weiber, H.; Abrahamsson, P.A.; Lilja, H.; Lundwall, Å. Molecular cloning of a small prostate protein, known as β-microsemenoprotein, PSP94 or β-inhibin, and demonstration of transcripts in non-genital tissues. Biochem. Biophys. Res. Commun. 1989, 164, 1310–1315. [Google Scholar] [CrossRef]
  44. Han, Y.P.; Su, Y.J.; Rao, D.Q.; Zhang, Z.W.; Xia, D.Q.; Wu, T.T. Isolation and purification of β-microseminoprotein-like proteins from the skin of the mountain salamander, Salmo salamander, and their cDNA cloning. J. Nanjing Agricult. Univ. 2007, 30, 94–99. (In Chinese) [Google Scholar]
Figure 1. UniGene length distribution of Andrias davidianus.
Fishes 07 00399 g001
Figure 2. Volcano plot of the DEGs in the gonadal tissues of male and female Andrias davidianus. DEGs in females compared to males. Blue dots indicate upregulated DEGs in males compared to females. Red dots indicate upregulated DEGs in females compared to males. The cut-off of the ordinate indicates a fold change (FC) of 2 and the cut-off of the abscissa indicates an FDR of 0.01.
Fishes 07 00399 g002
Figure 3. GO classification of the DEGs in the gonadal tissues of male and female Andrias davidianus.
Fishes 07 00399 g003
Figure 4. Heatmap of 20 typical DEGs in the gonadal tissues of male (M01–03) and female (F01–03) Andrias davidianus.
Fishes 07 00399 g004
Figure 5. qPCR analysis of the DEGs in various tissues. (a) qPCR verification of the DEGs in the gonadal tissues of male and female Andrias davidianus. The y-axis is the log2 (relative expression of ovarian genes/relative expression of testicular genes). (b) The expression of the selected DEGs in the muscles of male and female CGSs (n = 3; * p < 0.05). (c) The expression of the selected DEGs in the skin of male and female CGSs (n = 3; * p < 0.05).
Fishes 07 00399 g005
Table 1. Primers used in real-time quantitative PCR.
GenePrimer Sequences (5′-3′) ForwardPrimer Sequences (5′-3′) Reverse
Akr1c1CAATACCAACGAGTACCCAGAAGGAGAGCAGTCATCATAAATAAGG
Fet1GGCTGAATCTCAACCGACTCCCTGCTTGGAAACTATATGTATGC
Nmur1ACCATCGTTACTGTCCTCTACCGTCTCCTTCTTCCTGTCTCCAA
PrndCTGGCGGTTCTCCTTCTCATAGTTGCTTGCGTAGTAGATGTC
Proto-fpsTGGTGGACAGTGGTGAAGTTGCTCTCAATTACGGCAGATATACA
Rtl1GAATGAGAGGAAGAGGATAACGATTTGGACATACATAGACGACAACCT
MspTCAGTGTTGGTCTAAGCGGGAGGCGTGTGTGGACATTTTC
AmhTCCGCTCAACAGTCTCTTCCGGCAACAACTCGCACCAAT
Amhr IICAGGCAGTGAACAAGAGATAGAGAGTTCTCCTTCTGGTGTCAGG
ARGTAACTATACCTCCTTCCAACACTCATGCTGCCACATAAGACTGATG
Bmp15GCGAGTGACTTCAGATGAGATGCAGCACCAAGACCAGCATTC
Dmrt B1ACAGCCAGTCACCTTCTCAGTTGGTTGCCTTGTGGATTGC
Dmrt1CTGCTGCTGCCTCCTACATATCTTGACTACTCGGTGGTGAA
Dmrt2AGGCTGGAAGACATCATACACTGCAAGGCACTGAGGTCATATC
Foxl2GGTCCACGGTCCAGTAGTTGCCAGTACATCATCGGCAAGTTC
P450GGATGCTGTGCGATGAGTATCTGACTGAGGAGAATGTGAACCA
PiwilTGCGGTATGTGCGGTTGTCTGATGGCGGTCTCTTCCTAT
HspB1GGCAAACACGAGGAGAAGGGGCAGTGTGTATTTCCT
ZP3CCACGTCCCTTAATGCTATCTGGTGTCACCTGTAAG
NapbCCACTGATCCAAACGAGATACTTCTTCAAAGCAGCCCTATG
β-actinTGAACCCAAAAGCCAACCGAGAAAAGATTACGACCAGAGGCATACAGGGACAGGAC
Table 2. KEGG pathway enrichment analysis of the DEGs in the gonadal tissues of male and female Andrias davidianus.
Pathwayko_idSignificant GenesAnnotated Genesp-Value
Inositol phosphate metabolismko0056240700.003642
MAPK signaling pathwayko040101252560.003936
Mucin-type O-glycan biosynthesisko0051219290.005815
Endocytosisko041441192450.006011
Glycosaminoglycan degradationko0053114200.007509
Phosphatidylinositol signaling systemko0407045830.008032
Adipocytokine signaling pathwayko0492041770.01627
Insulin signaling pathwayko04910751520.016859
Osteoclast differentiationko0438010140.019613
Starch and sucrose metabolismko0050024420.022051
Neurotrophin signaling pathwayko0472214220.024577
Oocyte meiosisko04114571150.030965
Prolactin signaling pathwayko049179130.035474
Regulation of actin cytoskeletonko048101022190.039699
Histidine metabolismko0034013210.039838
GnRH signaling pathwayko0491242830.040708
Type II diabetes mellitusko04930560.04383
TGF-beta signaling pathwayko0435040790.044602
Publisher’s Note: MDPI stays neutral with regard to jurisdictional claims in published maps and institutional affiliations.