Abstract
Olive flounder (Paralichthys olivaceus) is a vital aquaculture species in East Asia. However, few studies that estimate the genetic parameters of this species have been conducted. We estimated the genetic parameters of growth traits and designed an optimum breeding programme for this species. Heritability, genetic and phenotypic correlations, and breeding values were estimated for growth traits: body weight (BW), total length (TL), and condition factor (CF). A linear mixed animal model using the restricted maximum likelihood (REML) algorithm was applied to the statistical analysis of 9 traits (BW, TL, and CF at 11, 18, and 22 months of age) for a total of 54,159 animals from 7 generations. Increases of 13%, 8%, and 6.5% in BW, TL, and CF at the harvest stage were observed, respectively, after 7 generations of selection. The heritabilities of all growth traits were moderate, ranging from 0.35 to 0.46. The phenotypic and genetic correlations between BW and TL were high and positive in all three stages (0.91 and 0.92, 0.91 and 0.93, and 0.88 and 0.91). The estimated breeding values of BW and TL increased over the generations; however, the estimated breeding value of CF fluctuated. The optimum progeny number within full-sib families for an accuracy of 0.632 is suggested to be between 10 and 25. Findings indicated that a considerable response to selection and single-trait selection based on BW would be effective in olive flounder.
1. Introduction
Olive flounder (Paralichthys olivaceus) is one of the most highly valued species of finfish in the world. It is predominantly cultivated in East Asian countries including Korea [1]. In recent decades, olive flounder breeding practices have been rapidly developed in this part of the world. It accounts for the largest share among cultured fishes in Korea, and a more than 2000% increase in aquaculture production occurred from 2003 to 2013 [2]. Conventionally, breeding programmes for olive flounder are based on methods such as hybridization, also known as cross-breeding, and genetic improvement methods such as gynogenesis, androgenesis, and polyploidy [3]. However, recent studies on olive flounder were based on more modern approaches such as linkage mapping and QTL mapping utilizing quantitative genetic applications [4]. To fulfil the demand concerns while ensuring the sustainability of the species, carefully designed breeding practices were undertaken using candidate selection and family selection approaches relying on important traits such as high growth rate, feed efficiency, tolerance to water temperature changes, and disease tolerance [4,5]. Growth rate is one of the key traits in selection and breeding applications since it has direct implications on fish productivity. Fish body weight, body length and width, and condition factors are often used in selection and breeding programmes related to olive flounder and other fish species [6,7]. Selected fish demonstrate comparatively higher growth rates than unselected fish; therefore, selective breeding is beneficial for the commercial production of olive flounder [8]. Li et al. [1] observed low maternal and sire-dam interaction effects (0.00–0.05) compared to phenotypic variance and moderate heritability estimates (0.39) for growth traits, and the findings suggest that selective breeding would result in significant genetic gains for the growth traits of the species. Moreover, BW, TL, and average daily body weight gain (ADG) exhibited positive and high genetic and phenotypic correlations; thus, selection based on one trait will result in the improvement of other traits [1]. The results from the study by Kim et al. [9] indicated moderate to high heritability estimates for all the growth traits (0.369–0.754) and high genetic correlations between the body weight and total length, the body weight and body height, and the total length and body height (0.96) of 11-month-old olive flounder. Thus, the authors recommend this species for selective breeding programmes. Furthermore, there has been a number of studies on the estimation of the genetic parameters of other aquaculture species such as common carp, Cyprinus carpio [10], smooth tongue sole, Cynoglossus semilaevis [11], Nile tilapia, Oreochromis niloticus [12], and rainbow trout, Oncorhynchus mykiss [13].
The history of olive flounder farming in Korea dates back to the early 1980s with the onset of artificial seed production technology which was introduced by the National Institute of Fisheries Science [14]. This boosted olive flounder farming over decades; however, poor performance for productivity traits was an issue during the early ages. Selective breeding is the most effective method for the genetic improvement of fish. Many studies on productivity improvement have been conducted using this approach [1]. The amount of genetic improvement by selective breeding accumulates over generations, and productivity can be continuously improved. High phenotypic variations and the ability to generate a large number of eggs are a few advantages that can be seen in aquatic animals compared to land dwellers. In addition, the genetic diversity of the population must be maintained to secure prospects for future selective breeding.
For selection and breeding applications, heritability and genetic correlation are two of the important parameters that measure the magnitude of the additive effect. These estimates and comprehensive pedigree information are the key requirements for successful selective breeding programmes [15]. Furthermore, estimations of genetic parameters for fish species such as olive flounder have been conducted at various growth stages that have specific benefits for breeding programmes. For example, the selection of breeding candidates or families at early ages may be economical due to low maintenance costs and accelerated breeding progress [4]. However, there is an increased accuracy of estimates of breeding value in fish at mature stages; therefore, selection and breeding programmes can be highly contextual based on the breeding goal and culture system.
In this study, we estimated heritabilities, genetic and phenotypic correlations, and breeding values (EBVs) for olive flounder for the following traits: body weight (BW), total length (TL), and condition factor (CF) [16]. Although there is a considerable amount of research carried out on olive flounder, less research focuses on estimating genetic parameters. Therefore, this study will make a valuable contribution to olive flounder research and help design more effective selective breeding programmes for the species.
2. Materials and Methods
2.1. Fish Stocks and Family Production
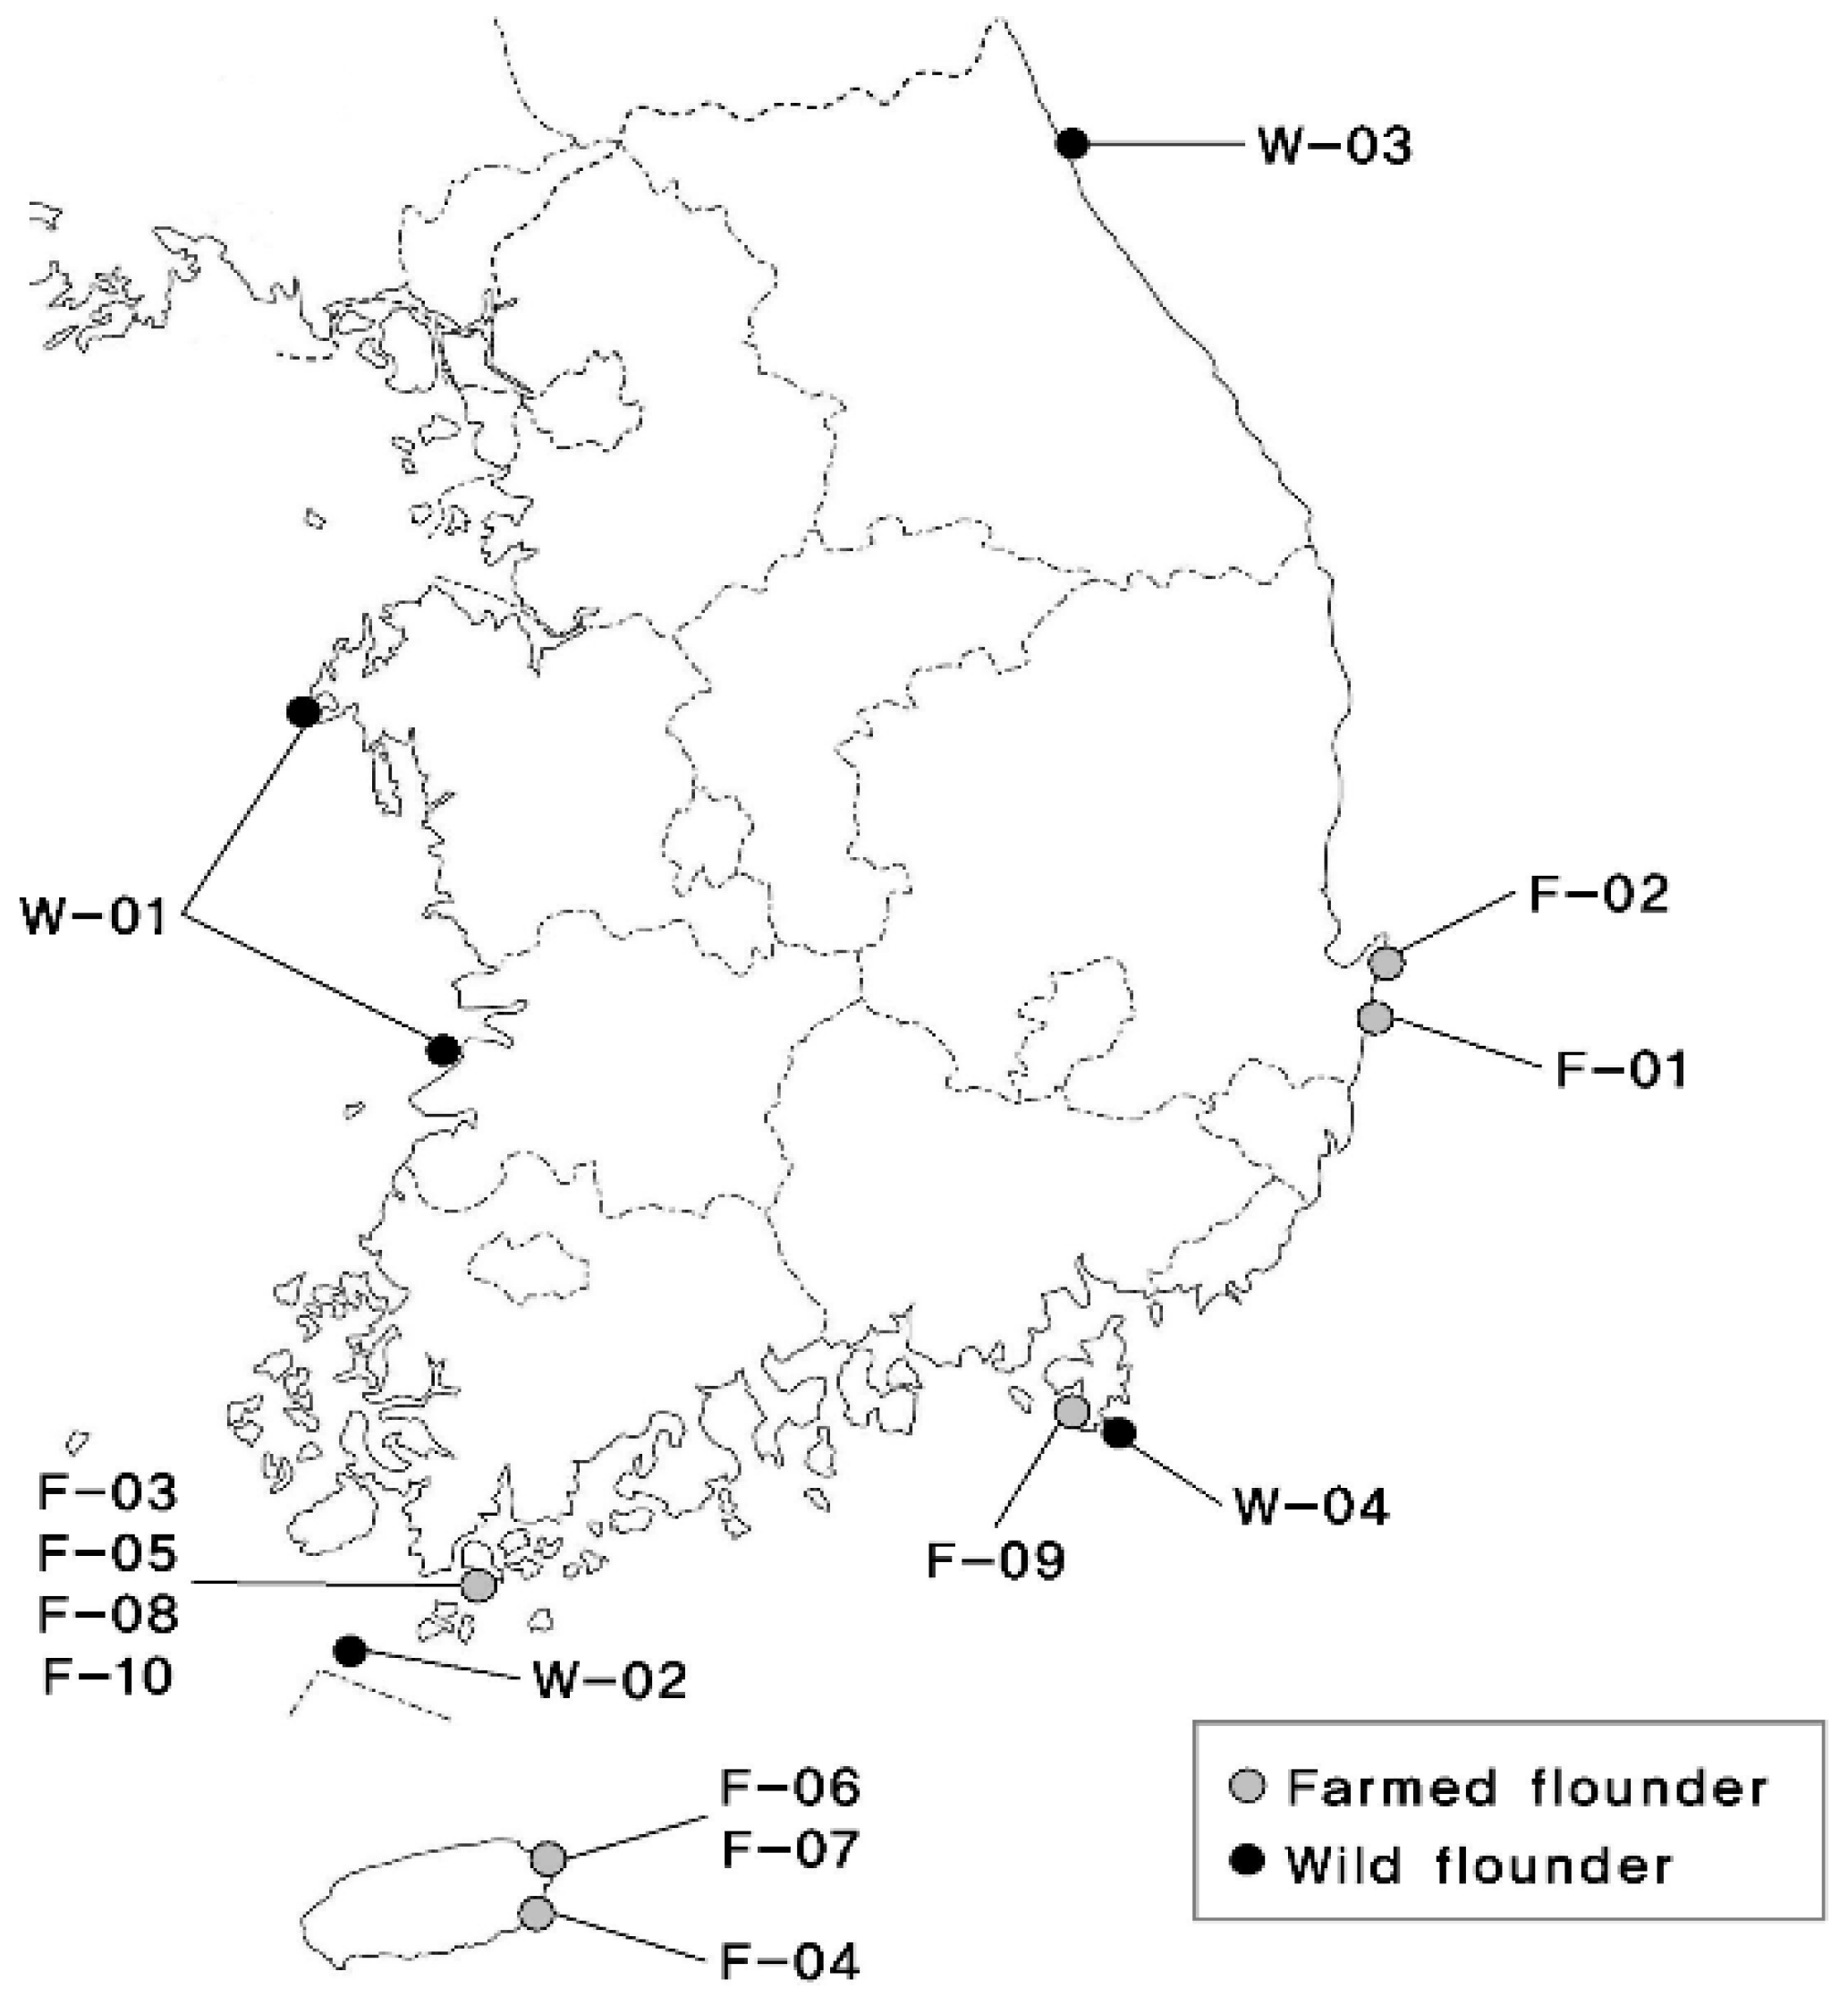
A total of 1876 olive flounder were selected as initial population for breeding in 2003–2004 from 4 wild populations and 5 farms. Geographic locations and nomenclature are shown in Figure 1. Rotifers were used to feed fish from 3 to 20 days of age after hatching, Artemia was used until 31 days of age after hatching, and extruded pellets were used until harvest. During production, the water temperature ranged from 13.7 to 27.3 °C, salinity ranged from 30.7 to 34.8 psu, and dissolved oxygen (DO) ranged from 7.0 to 11.5 mg/L.
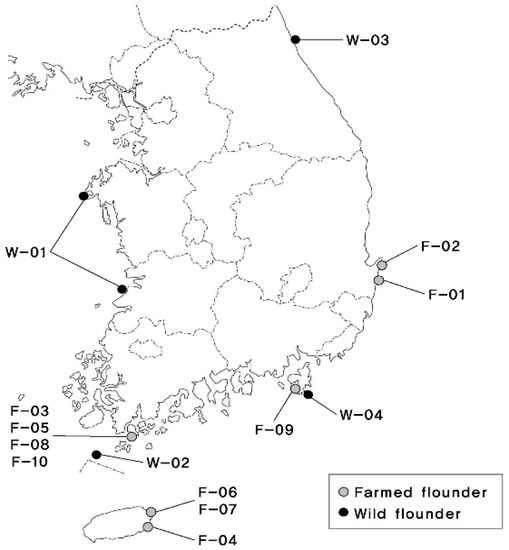
Figure 1.
South Korea map showing the collecting locations of wild and farmed populations of olive flounder (Paralichthys olivaceus).
For artificial fertilization, the genetic relationship was calculated using eight microsatellite loci. Based on this, a breeding guideline was prepared to secure genetic diversity, and more than 200 families were produced in each generation. During family production, 20,000 fertilized eggs were mixed and accommodated per 5-tonne tank (fibre-reinforced plastic). On the 35th day after hatching, they were divided into 10,000 individuals (total length around 2 cm) per 5-tonne tank. On the 100th day after hatching, they were divided into 1000 individuals (total length around 12 cm) per 20-tonne tank (concrete). On the 200th day after hatching, they were divided into 400 individuals (total length around 28 cm) per 20-tonne tank. From the 11th month after hatching to the end of production, 200 individuals (total length around 45 cm) per 20-tonne tank were divided, reared, and managed. A total of 54,159 fish belonging to 7 generations were used in this study whose pedigree information is shown in Figure S1.
2.2. Data Collection
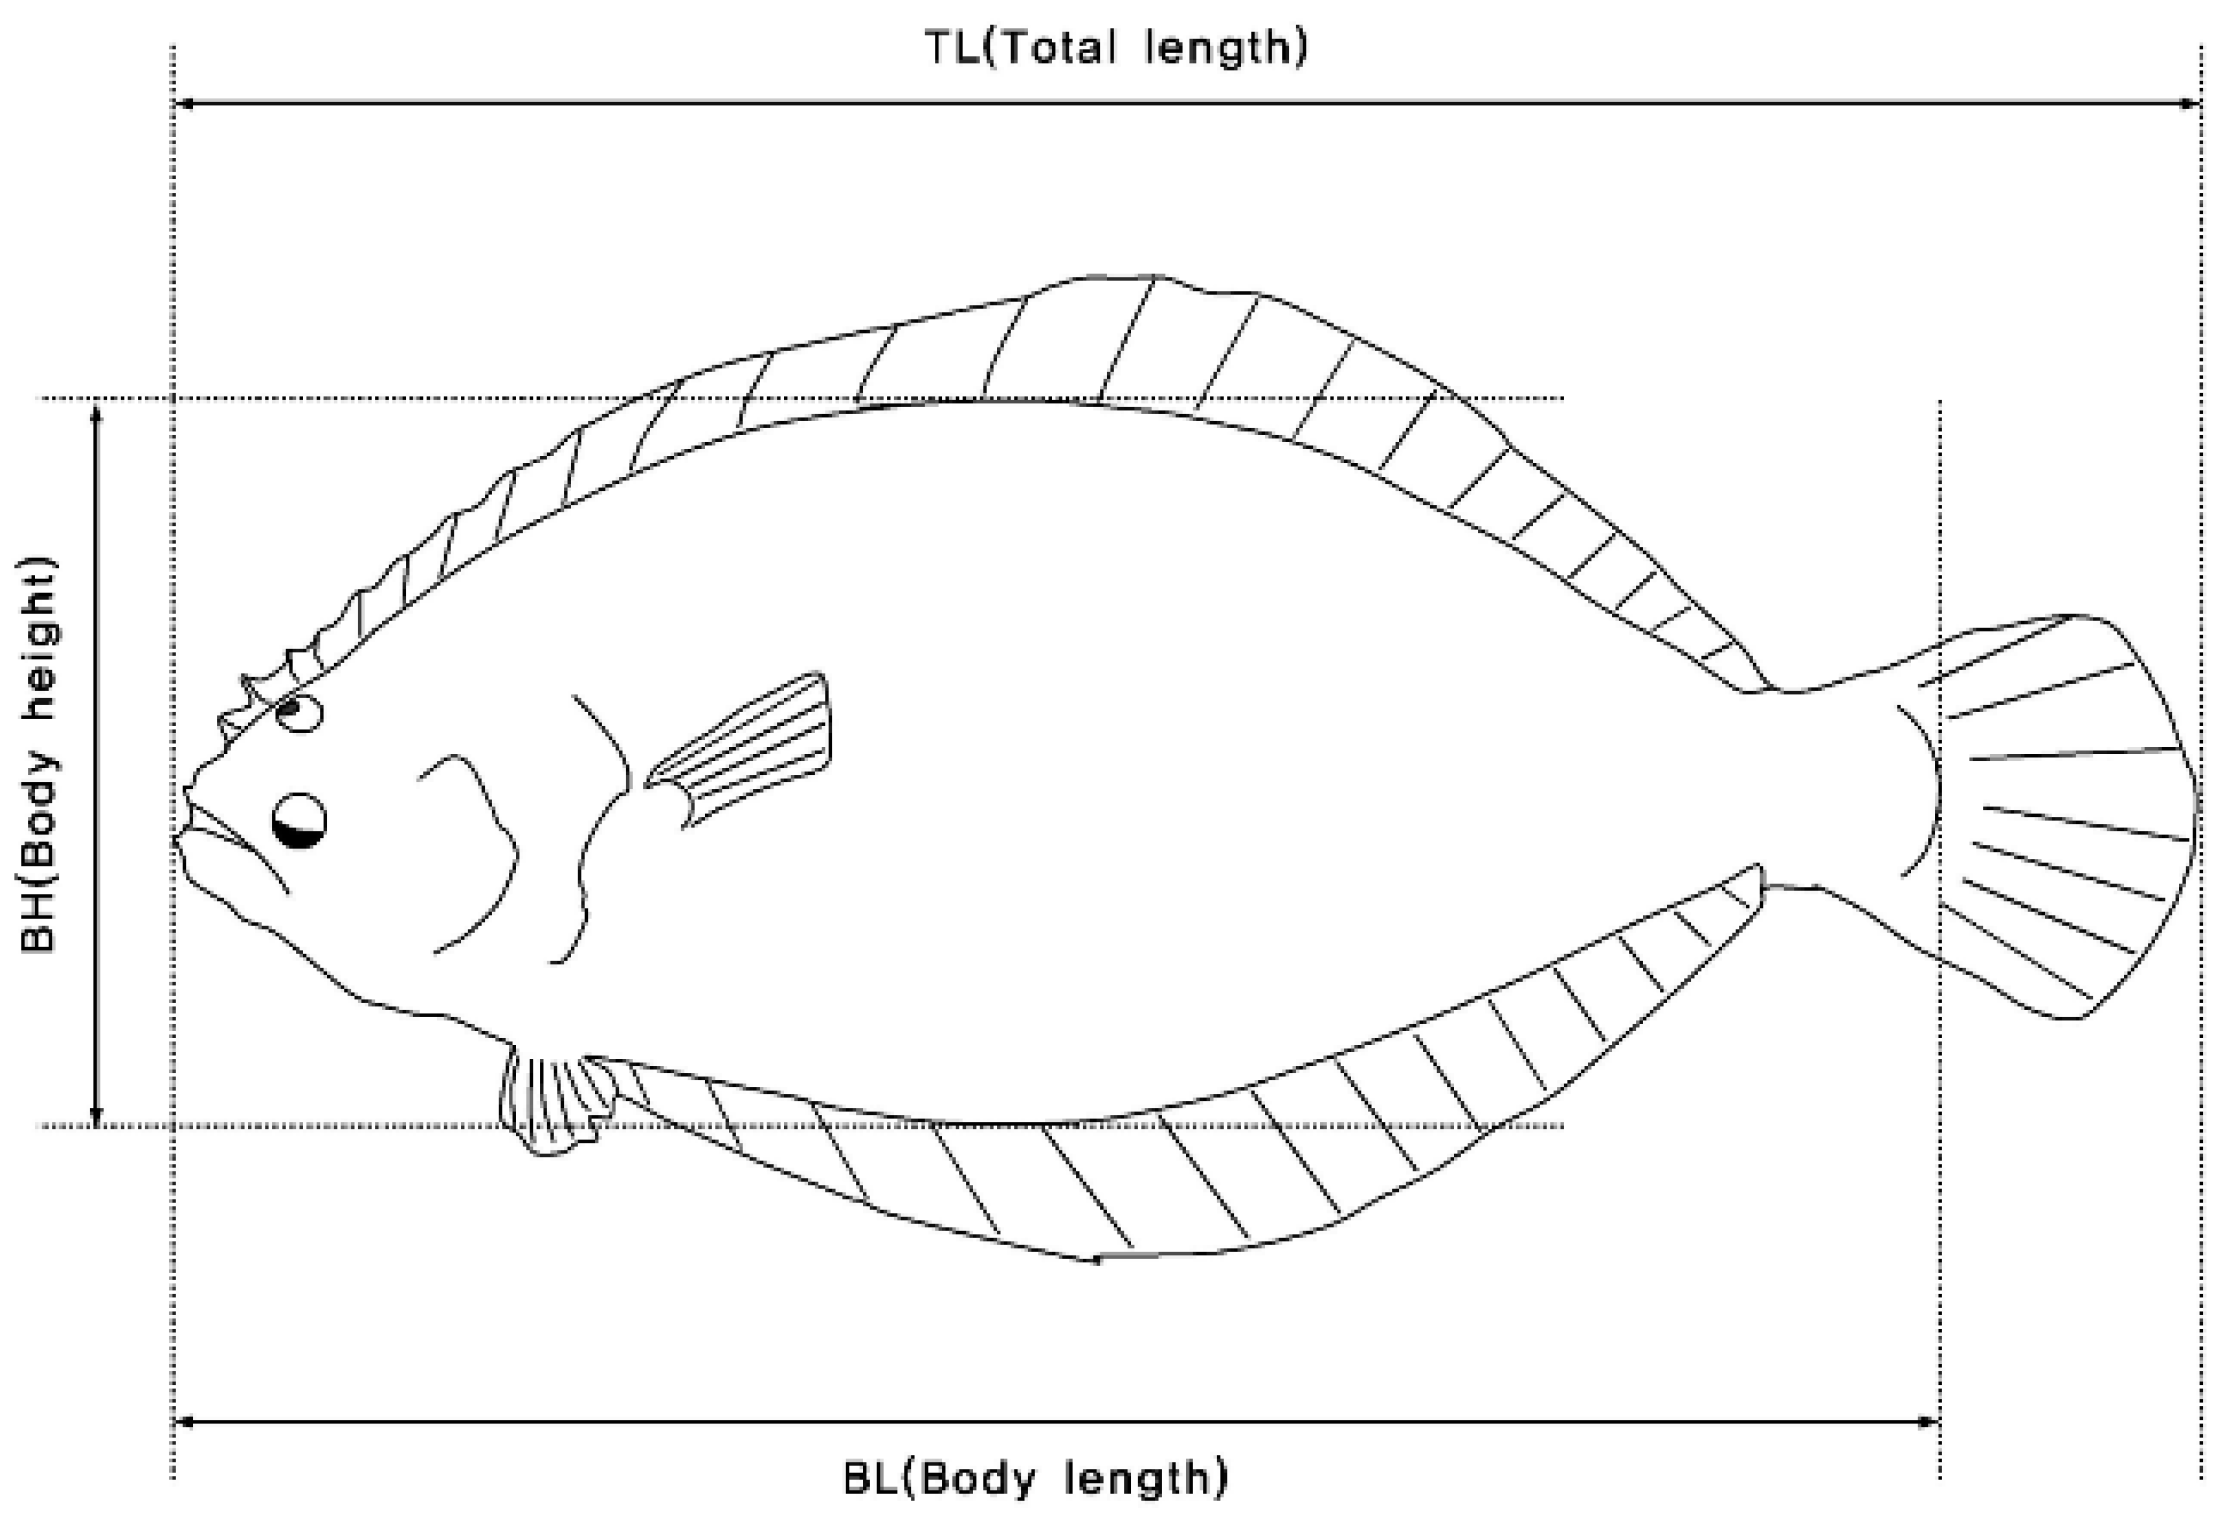
Phenotypic data were recorded on two quantitative traits of wild and farmed populations of olive flounder (Figure 2). The investigated traits consisted of body weight (BW in g) and total length (TL in cm). Measurements and fixed effects are shown in Table S1 and Figure S2. In addition, the condition coefficient (CF) was calculated using the following equation:
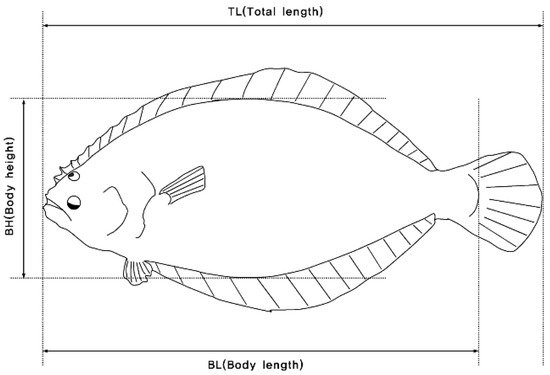
Figure 2.
Method of measuring the body parts of farmed olive flounder (Paralichthys olivaceus).
For the sample for paternity confirmation, 100 μg of pectoral fin tissue was placed in a microwell plate pre-dispensed with 5% Chelex 100 solution, and proteinase K treatment was performed at 55 °C for 30 min. After heat treatment at 100 °C for 10 min, centrifugation was performed, and the supernatant was used for multiplex PCR reaction. Eight loci were simultaneously amplified with primer combinations according to the size of the microsatellite DNA marker and fluorescent labelling. Microsatellite markers were genotyped using a DNA sequencer. Paternity confirmation was performed by excluding parental fish with markers that violated Mendel’s genetic law (exclusion method), analysing the genotype of the parental fish and offspring, and comparing the combination with the parent fish estimated with the breeding guidelines.
2.3. Statistical Model
ANOVA was performed to evaluate the significance of the fixed effects, including batch and sex effects, for all the models. The significant effects were detected under the threshold of p-value 0.001. ANOVA results are summarized in Table S2. Since both effects are regarded as significant, they are included in the animal model. A linear mixed animal model using restricted maximum likelihood (REML) algorithm was applied to statistical analysis of 9 traits (BW, TL, and CF at 11, 18, and 22 months of age) in this study using BLUPF90 programme [17]. The model is written as follows:
where is the vector of phenotype with = 54,159, is the vector of fixed effects (including batch and sex effects), is the vector of additive animal random effect captured by the relationship matrix built by pedigree information (assuming ), and is the vector of residuals, which is the unexplainable part of this model (assuming ). and are incidence matrices for fixed and random effects, respectively.
2.4. Estimation of Variance Components, Phenotypic and Genetic Correlation
From the animal model above, the following variance components were estimated:
where and are the vectors of phenotypic records for each trait, and are the incidence matrices of fixed effects, and are the unknown fixed quantities for each trait, and are the incidence matrices relating records and random effects, and and are the vectors of random errors.
The distribution characteristics of the elements in the model with E and V representing the expected and variance operators are as follows:
and
where is the numerator relationship matrix using pedigree information, , , , and are the additive genetic covariance components of the traits, and , , , and are the residual covariance components of the traits. It was assumed that all other covariances with random effects were zero. In addition, each pair of traits was assumed to follow multivariate normal distribution. Based on the components, heritability was estimated as where = is the phenotypic variance using BLUPF90 [17].
With as the additive phenotypic/genetic covariance between traits x and y and with and as the phenotypic/genetic variance of trait x and trait y, respectively, the phenotypic and genetic correlations among traits () were calculated as follows:
2.5. Estimation of Breeding Values
Best linear unbiased prediction (BLUP) was performed for the estimation of breeding values (EBVs) using the linear mixed animal model as described above using the BLUPF90 programme [17]. Five full-sib families from groups of sizes 1–10, 11–25, 25–50, and 50–100 from the 7th generation were randomly selected so that the parents are not duplicated, in which progeny have their own performance. The information of the rest of the family members was used to predict the EBV for the family’s respective sire and dam, and then the accuracy of that prediction was calculated as the correlation between estimated breeding value (EBV) and true breeding value (TBV) from validation. The equation of accuracy can be written as follows:
where PEV is prediction error variance and additive genetic variance is .
3. Results
3.1. Descriptive Statistics
The descriptive statistics of 9 traits (BW, TL, and CF in 3 different time periods) are shown in Table 1. For all traits, the ranges of phenotype measurements are relatively large, though the gaps of the averages among periods are reasonable. The largest range was from body weight at 22 months old, where the highest was 3711 g and the lowest was 470 g (790%) (SD = 608.45). After 7 generations of selection, there was an increase in average BW at the harvest stage (18 months old) from 990 g in generation 1 (G1) to 1299 g (by 31%) in G7. Moreover, the average of TL and CF also grew by 8% and 6.5%, respectively. The raw data showed that this fluctuation may be partly affected by the differences between batches in each generation. Moreover, the sex effect may also have caused variation. Therefore, we performed additional ANOVA to assess the significance of these effects and considered them as covariates in the animal model.

Table 1.
Descriptive statistics for olive flounder (Paralichthys olivaceus): BW, TL, and CF traits in 3 periods of time.
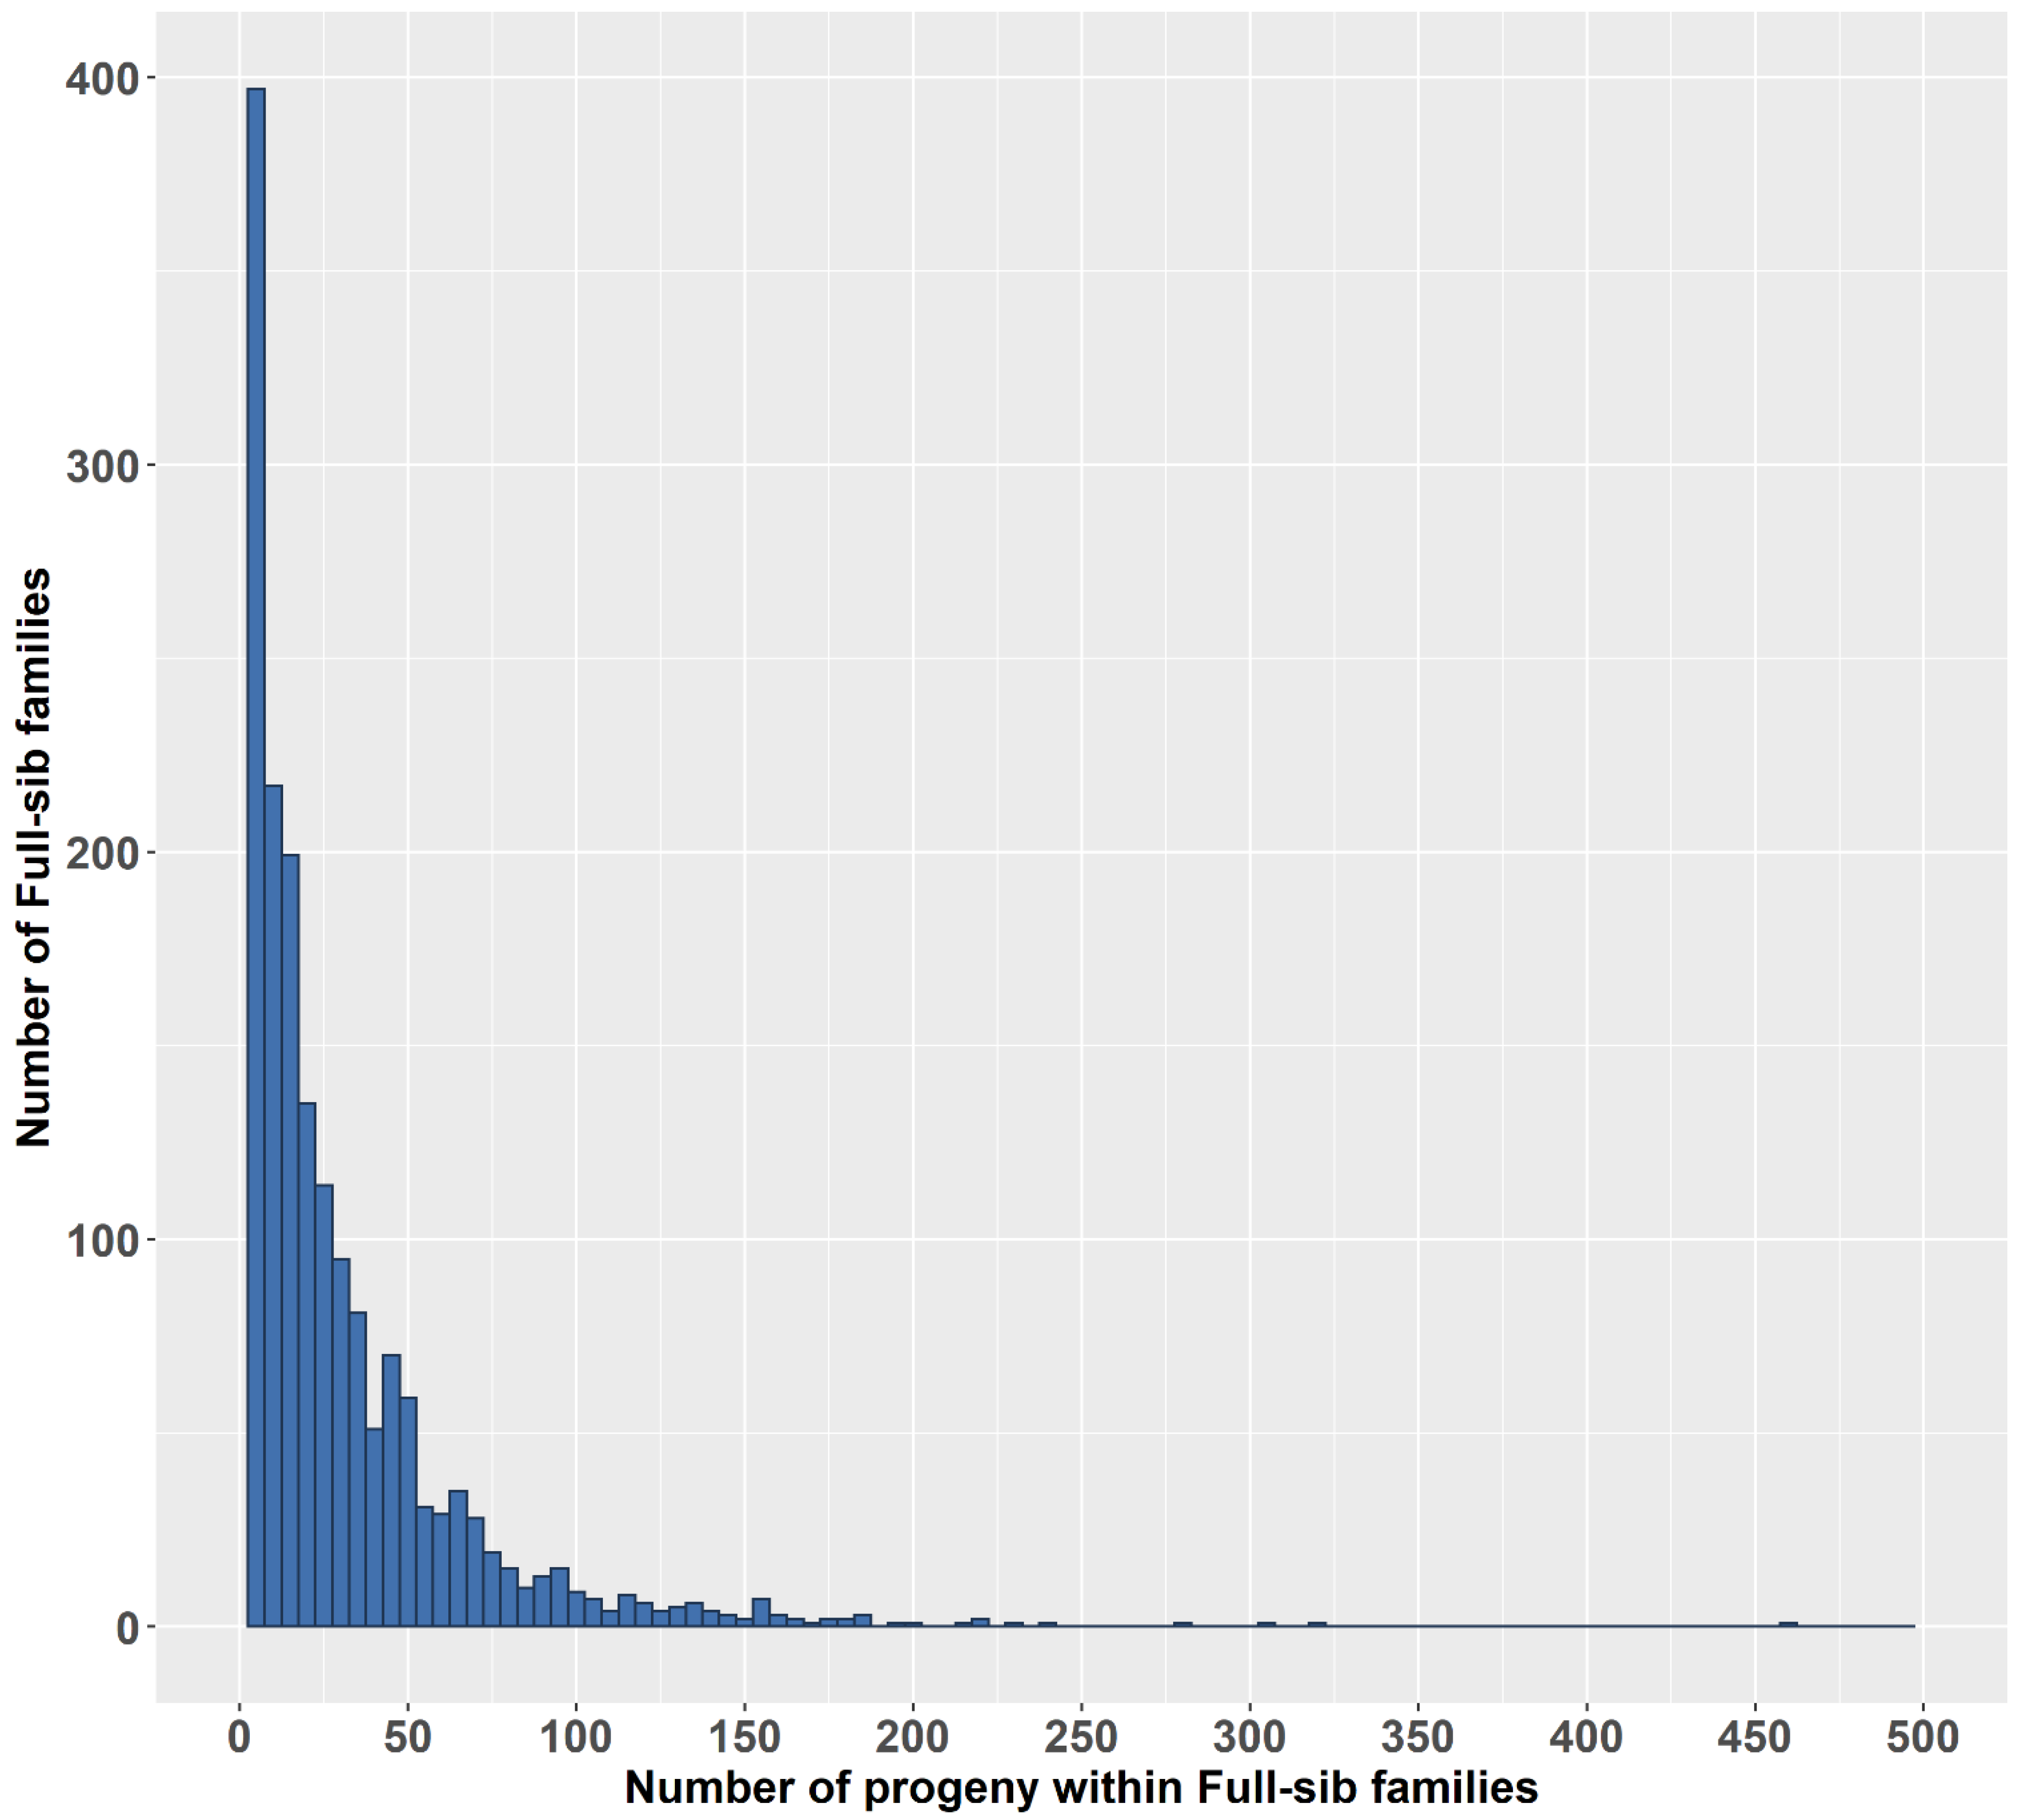
Most of the animals in this study are from full-sib families (1813/1827), whose numbers of progeny are shown in Figure 3. A total of 1492 full-sib families had 1–49 progeny (accounting for 82.29%), 237 full-sib families had a progeny number between 50 and 99 (accounting for 13.1%), and the remaining families had at least 100 progeny.

Figure 3.
Numbers of full-sib families and their numbers of progeny.
3.2. Variance Component
The variance component estimated by the REML algorithm is described in Table 2. Overall, heritabilities of all traits were moderate. TL at 11 months old had the highest heritability ( = 0.465 0.019), which decreased to 0.406 0.019 at 18 months old and increased slightly to 0.433 0.021 at 22 months old. Similarly, the trait BW witnessed a fluctuation of heritability over time, decreasing from 0.449 0.019 in the 11th month to 0.358 0.019 in the 18th month, followed by a slight increase to 0.365 0.020 in the 22nd month. Lastly, the heritability of CF declined from 0.438 0.020 to 0.368 0.020 in the first 2 periods and stayed constant until the last one.

Table 2.
Variance component and estimated heritabilities for olive flounder (Paralichthys olivaceus): BW, TL, and CF traits in 3 periods of time ().
3.3. Parameters Estimation
Table 3 shows the genetic correlations between traits above the diagonal and the phenotypic correlations below the diagonal. The average standard error of all the traits’ phenotypic correlations is 0.026, and the genetic correlations are 0.39. As expected, both the phenotypic and genetic correlations between body weight and total length are relatively high, observed at 0.918 0.028 and 0.928 0.040, 0.919 0.030 and 0.932 0.048, 0.881 0.032 and 0.918 0.048 at 11, 18, and 22 months old, respectively. While BW and CF were moderately correlated, averaging at approximately 0.403 0.024 for phenotype and 0.338 0.038 for genotype, the correlation between TL and CF is particularly low when most of them are smaller than 0.1 in all 3 periods of time.

Table 3.
Genetic correlations (above diagonal) and phenotypic correlations (below diagonal) among olive flounder (Paralichthys olivaceus): BW, TL, and CF traits in 3 periods of time ().
3.4. Genetic Trends
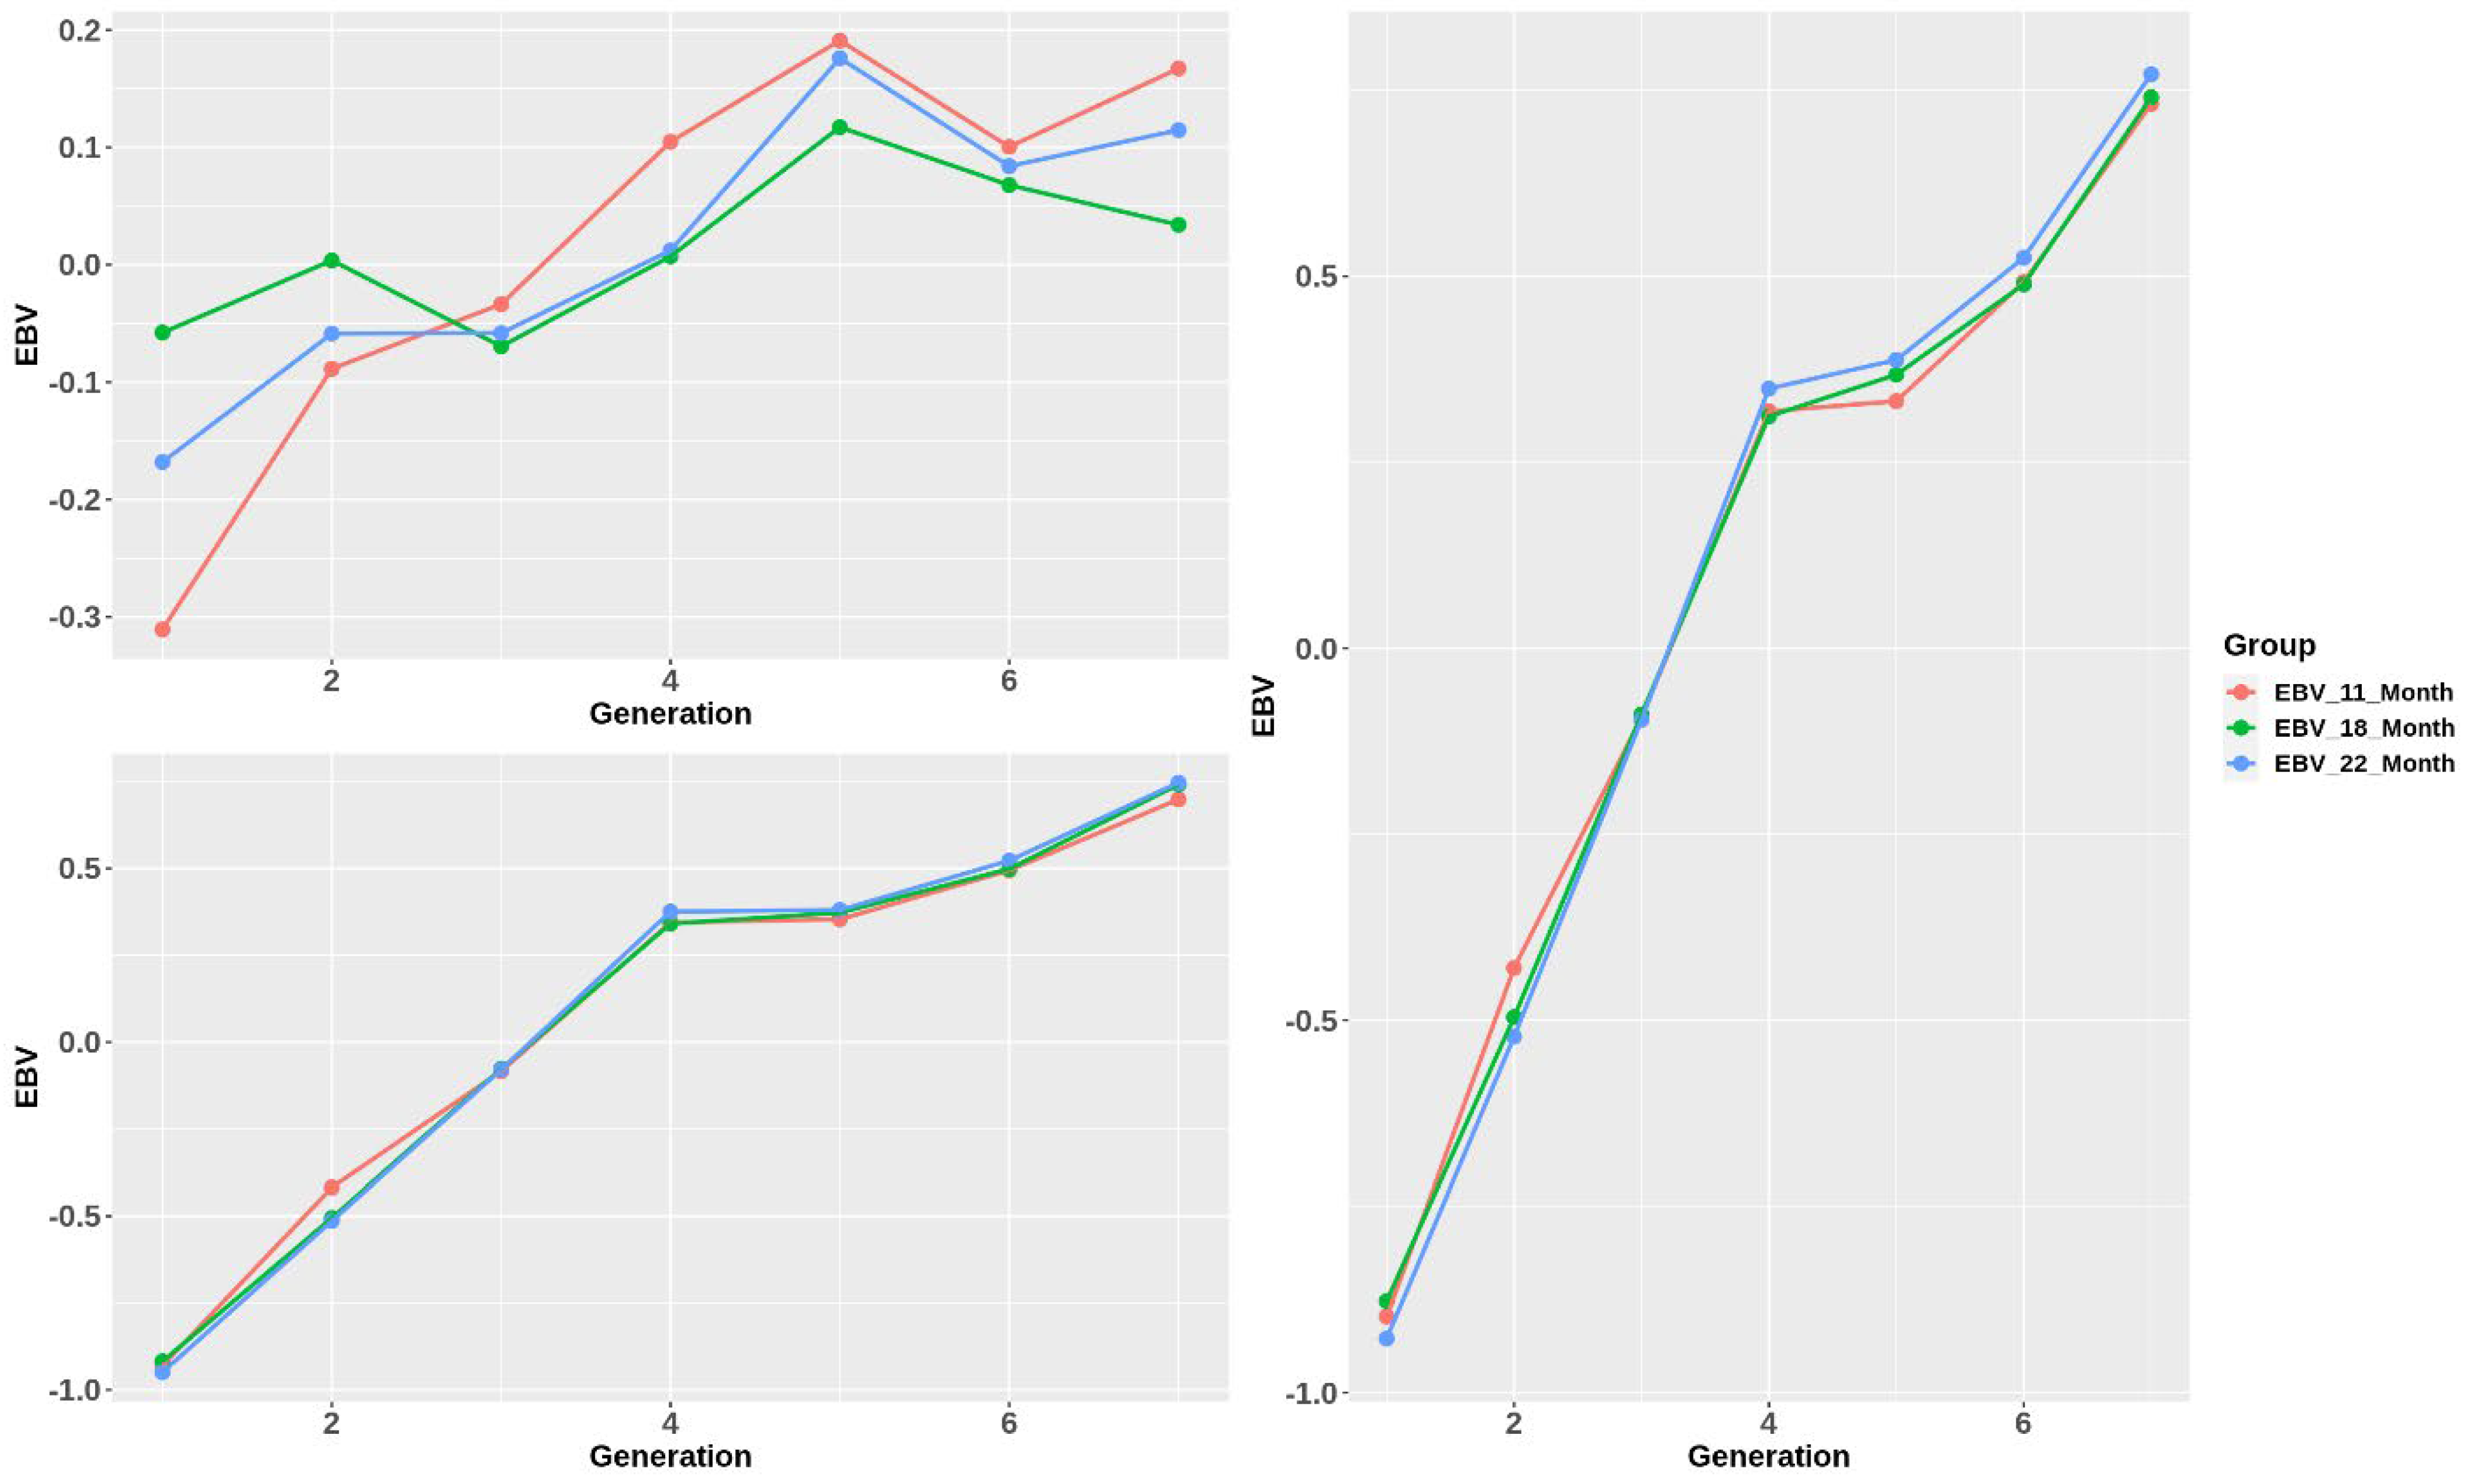
Generally, the standardized genetic merit of all the traits increased significantly over generations (Figure 4). EBVs of body weight and total length rose to G4 at 0.3, rose slightly to G5, and continued growing more slowly to G7 at approximately 0.75. Moreover, the changing trend of CF EBVs varied inconsistently, especially at 18 months old. They had a similar trend, having 2 declining points at G3 and G5 in their growth direction. However, overall, the growth of CF EBVs was still considerably smaller than the other traits. Additionally, while BW and TL showed the same estimation of EBVs among stages, those of the CF trait were slightly different.
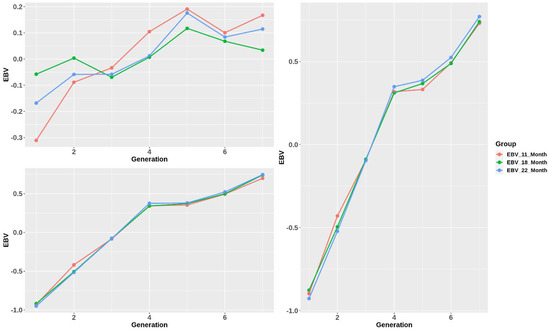
Figure 4.
Standardized estimated breeding value trend over generations.
3.5. Estimation Accuracy According to the Number of Progeny
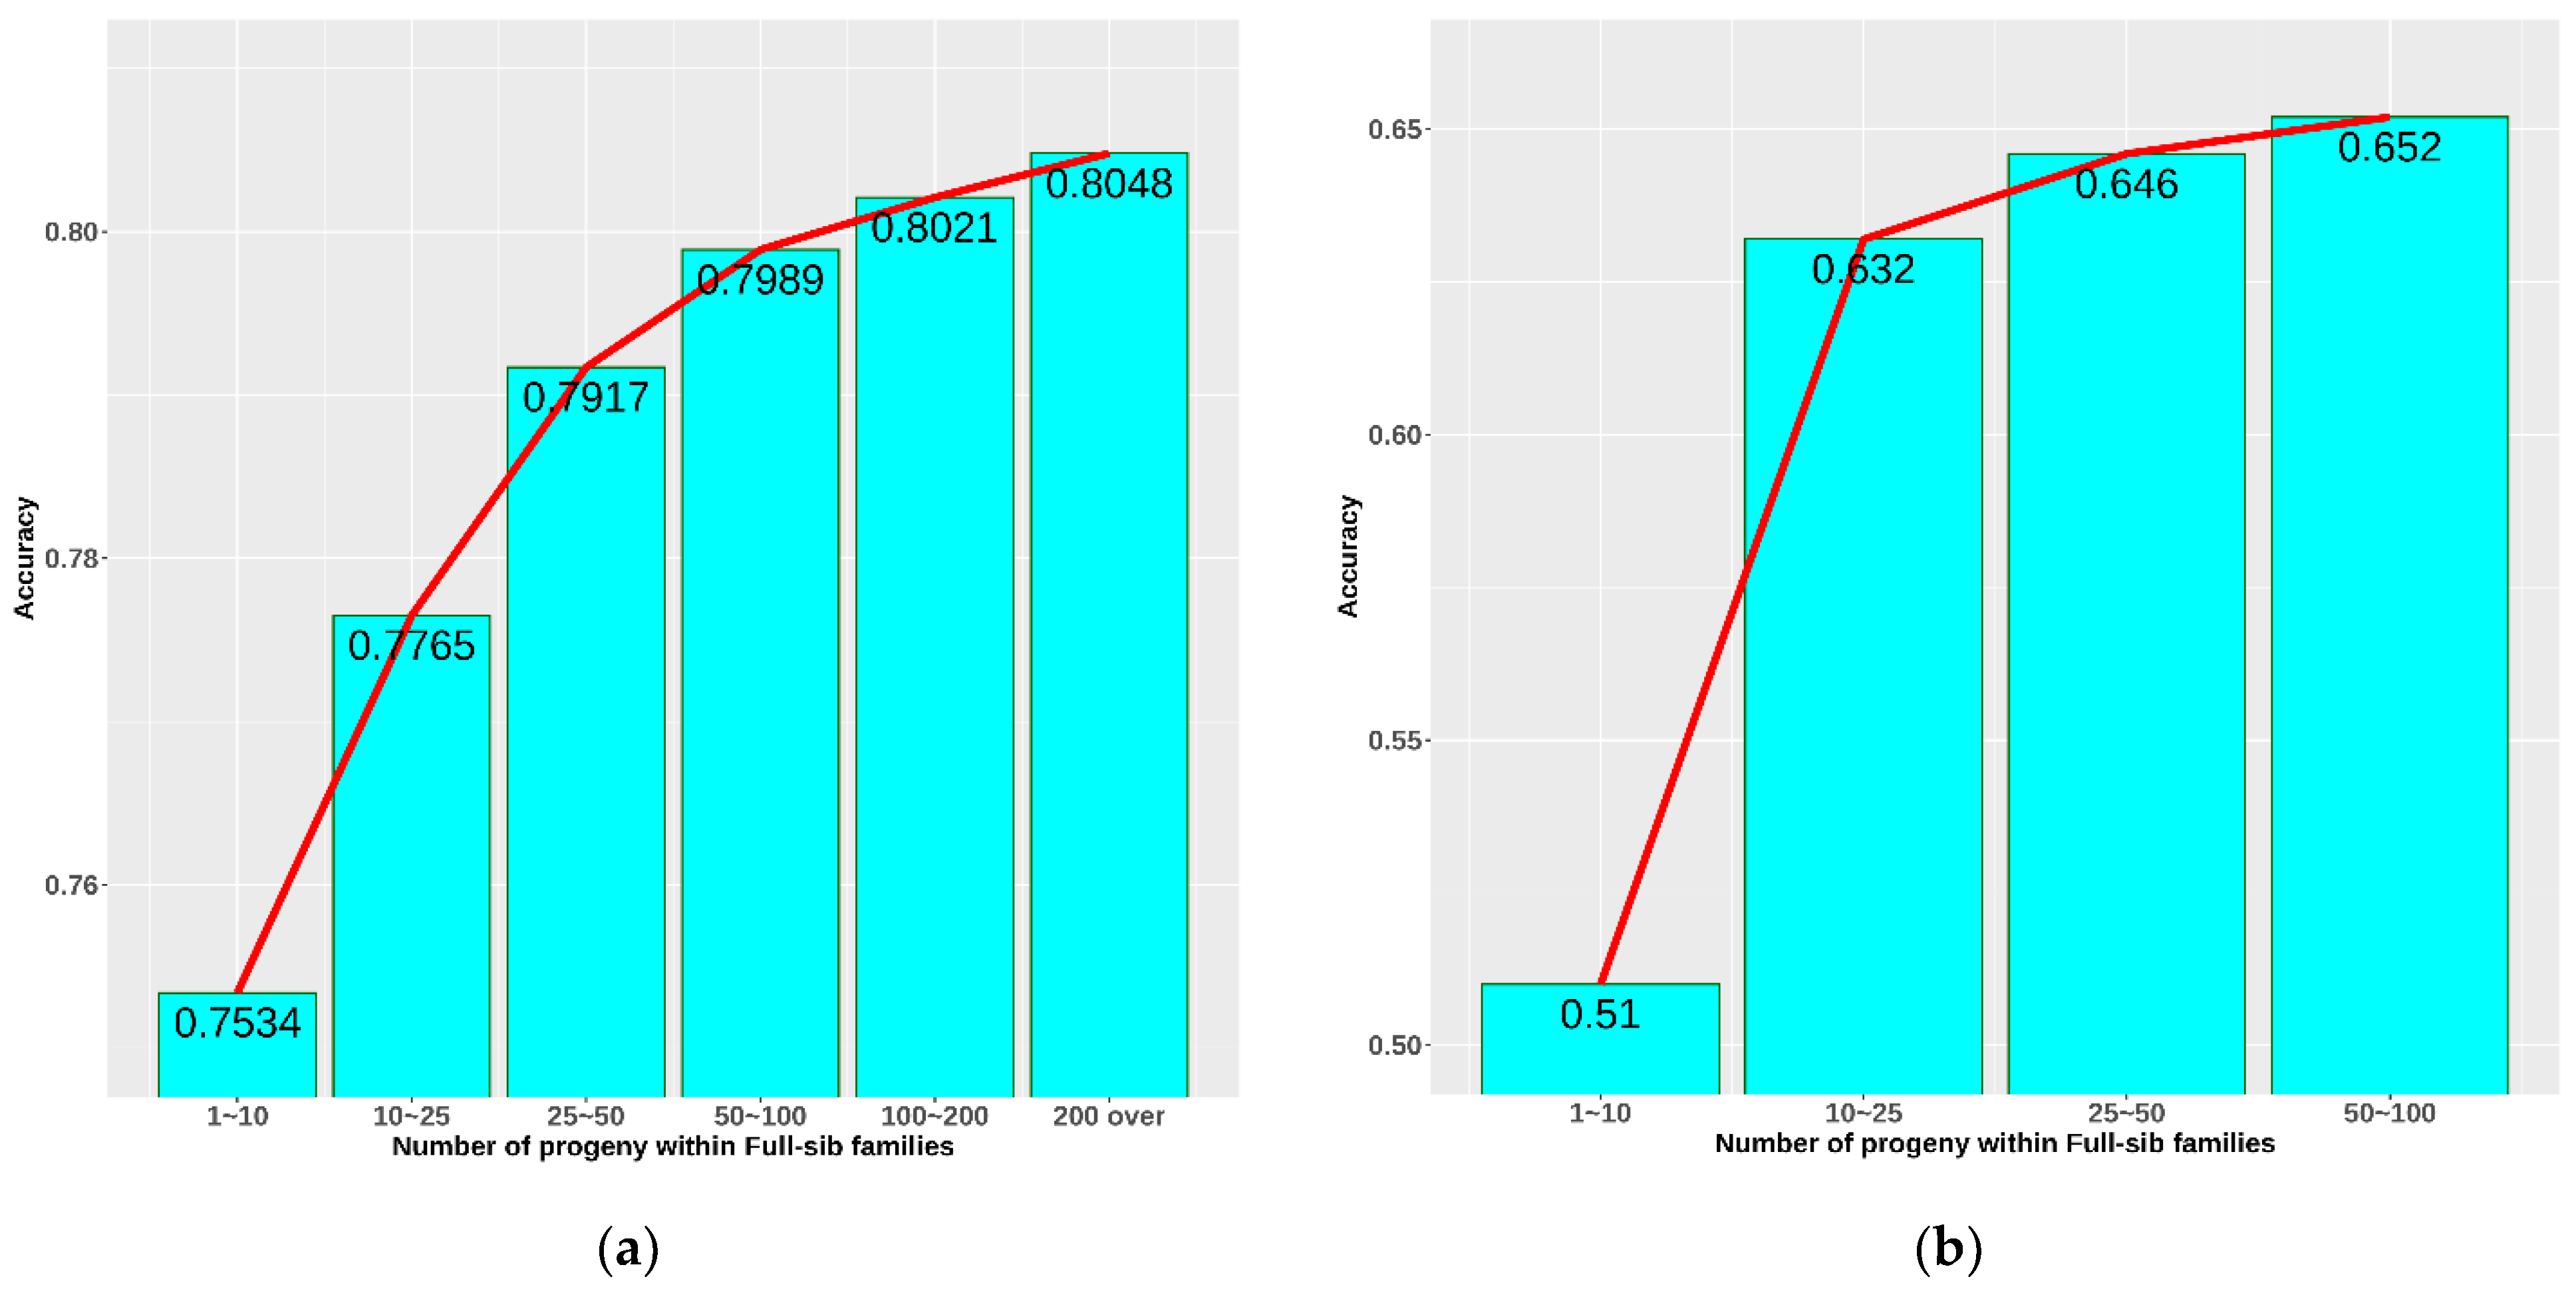
The accuracy of breeding value prediction is affected by several factors. In this study, the effect of the number of progeny in a full-sib family was studied to determine the optimal number for the breeding strategy. Figure 5a shows general accuracy calculated from all the information on 7 generations. A clear improvement in accuracy was observed when increasing the number of progeny within a full-sib family. The higher the number of progeny, the higher the accuracy. The accuracy increased rapidly from 0.753 to 0.800 when the number of progeny grew from 1–10 to 50–100. The growth became slower in a larger family. Figure 5b demonstrates the accuracy of parent EBV prediction based on the information concerning each family. In general, accuracy in case B was significantly lower than in case A. The biggest difference was in family size 1–10 progeny, which reduced accuracy from 0.75 to 0.51. This difference decreased sharply (by 0.14) after increasing the family size to 10–25 progeny and changed negligibly until reaching a family size of 50–100 progeny.
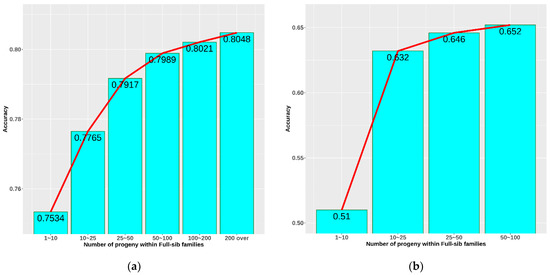
Figure 5.
Accuracy as a function of the number of progeny within full-sib families: (a) accuracy of breeding value prediction from all information on 7 generations; (b) accuracy of parents’ breeding value prediction from 5 selected full-sib families in the 7th generation.
4. Discussion
For years, the objective of selection in olive flounder, besides selection against disease outbreaks, was for economic traits [18,19], which was mostly for BW in Korea. Table 1 shows that the average olive flounder BW in Korea was 1110 g (1.11 kg) at the harvest stage (18-month), with a mean TL of 45.18 cm and CF of 11.63. In Japan, the size of the market ranged from 0.8 to 1.2 kg, harvested at 12–18 months old [20]. Moreover, the harvest time of olive flounder in the US was at 12–14 months of age, averaging 0.8–1.5 kg [18]. Although having a similar demand for product size in the market—starting at 0.8 kg—the raising time of olive flounder in the US was slightly shorter than in Asian countries.
After 7 generations of selection, the EBV of BW increased (Figure 4), and, as expected, BW at the harvest stage increased by approximately 13%, showing the success of selection. Response to selection was highly dependent on heritability. In our study, the heritability of the BW trait at the early stage (11 months), which was 0.449 0.019, was found to be higher than at later stages, which were 0.358 0.019 and 0.365 0.020. Li et al. [4] showed that the closer to the harvest stage, the lower the heritability of BW. Many other studies in China also agreed with this trend. Liu et al.’s study [21] using the same animal model showed that the heritability of BW dropped from 0.72 at 180 days of age to 0.47 at 360 days of age, which was slightly higher than our result in the same period. From our point of view, this decrease in heritability was due to the larger influence of environmental effects on growth performance over time than genetic ones. Interestingly, although heritability declined over the lifetime, in our study, estimated breeding values of BW in three stages were not significantly different in all generations. This could be because the environmental factors were stable, aiding the efficiency and accuracy of selection, which can be observed in the rapid increase of EBV of BW through 7 generations.
Having a strong positive genetic correlation with BW (>0.9 at all stages), TL showed the same heritability changes and EBV increasing trend with those of BW when performing selection for BW. In fact, growth traits such as body weight and length have a strong association. Many previous studies on aquacultural species gave similar results. Liu et al. [21] calculated the correlation between the same traits of olive flounder, resulting in a range of 0.8–0.96 for 3 stages from 180 days to 360 days of age. In Atlantic salmon and rainbow trout, the correlation among gutted BW, ungutted BW, and body length was from 0.84 to 0.99 [22]. Therefore, single-trait selection for BW performed in this study could be sufficient for growth traits.
The accuracy of selection and expected genetic gain are largely affected by heritability, which was medium–low for the heritability of aquacultural species in our study [15]. A lower accuracy means that to achieve a higher selection efficiency, more emphasis on family information is needed. We analysed the effect of full-sib family size on accuracy in an attempt to find the compensation. Figure 5a showed a growing trend of accuracy from 0.753 to 0.805 when increasing the number of progeny within a full-sib family from 1–10 to over 200 progeny. The lowest accuracy observed in this case was 0.753, which is considered very high compared to selection based on average heritability. One of the reasons is that they were the mean accuracy and were calculated as the mean accuracy of parents’ EBV prediction using progeny information and progeny EBV prediction using their own performance. Inherently, EBV prediction based on performance always has a very high accuracy. In addition, because the generations are closely related to each other, the accuracy of prediction would also become overestimated due to relationship bias. Therefore, we performed an additional analysis by randomly selecting five full-sib families at each family size to minimize information coming from other sources and reduce information used for only full-sib effects. Accuracy this time was noticeably reduced and more realistically reflected selections based on pure full-sib (Figure 5b). Similarly, the trend of increase in accuracy was also observed. The accuracy of EBV prediction grew fast from 0.51 to 0.632 when raising the full-sib family size from 1–10 progeny to 10–25 progeny. Although this trend continued until the size > 100, it was considered to be insignificant or unnecessary. Therefore, the optimal number of progeny at 10–25 with an accuracy 0.632 could be suggested to avoid wasting resources during selection. However, breeding objectives are diverse with different levels of budget; thus, this number in our opinion is approximate, and many factors could be managed simultaneously to reach the balance.
5. Conclusions
The estimated breeding values increased over the generations, with considerable growth observed in BW and TL in all three stages indicating that there was a considerable response to selection. Moreover, high genetic and phenotypic correlations between BW and TL suggest that single-trait selection based on BW will be effective in olive flounder breeding programmes. The accuracy of the parents’ breeding value increased with the number of progeny within full-sib families; however, the ideal number of progeny within a family for optimal accuracy would be 10–25. The findings of this paper will make a valuable contribution to the existing knowledge of the genetic parameters of olive flounder and will lead to new research on the species.
Supplementary Materials
The following supporting information can be downloaded at https://www.mdpi.com/article/10.3390/fishes7060357/s1. Table S1: average measurements and fixed effects of BW, TL, and CF in 3 periods of time (Female above and Male below). Table S2: ANOVA summary of fixed effects. Figure S1: population structure of 54,159 olive flounders. Figure S2: distribution of 9 trait measurements.
Author Contributions
Conceptualization, J.-H.L. and S.H.L.; Data curation, Y.K., H.S.J., J.K. and H.-R.Y.; Formal analysis, D.L. (Dain Lee), H.L., S.Y., W.E. and P.T.N.D.; Methodology, H.L., S.Y., P.T.N.D., W.E., Y.K. and J.K.; Project administration, J.-H.L. and S.H.L.; Roles/Writing original draft, P.T.N.D., W.E., Y.K. and J.-W.P.; Writing, review, and editing, P.T.N.D., J.-W.P., W.E., D.L. (Dooho Lee), J.-H.L. and S.H.L. All authors have read and agreed to the published version of the manuscript.
Funding
This research was funded by the National Institute of Fisheries Science, Ministry of Oceans and Fisheries, Korea (R2022023).
Institutional Review Board Statement
The animal study protocol was approved by the Institutional Animal Care and Use Committee (IACUC) at the National Institute of Fisheries Science (Approval number: 2022-NIFS-IACUC-23, date of approval: 23 March 2022).
Acknowledgments
Heegun Lee and Sangwon Yoon belong to the Artificial Intelligence Convergence Research Centre as master’s students at Chungnam National University. Their research support was supported by the Institute of Information & communications Technology Planning & evaluation (IITP) grant funded by the Korean government (MSIT) (No.2020-0-01441, Artificial Intelligence Convergence Research Centre (Chungnam National University)).
Conflicts of Interest
The authors declare no conflict of interest.
References
- Li, Y.; Zhang, B.; Lu, S.; Tian, Y.; Yang, Y.; Chen, S. Genetic Parameters Estimates for Growth Performance Traits at Harvest in Japanese Flounder (Paralichthys olivaceus). Aquaculture 2018, 489, 56–61. [Google Scholar] [CrossRef]
- Kim, S.-M.; Jun, L.-J.; Lee, D.-W.; Park, H.-K.; Kim, J.-S.; Jeong, J.-B. Hematological Analysis and Non-Specific Immune Responses of Emaciated Olive Flounder, Paralichthys olivaceus in Korea. J. Fishries Mar. Sci. Educ. 2017, 29, 1758–1767. [Google Scholar] [CrossRef]
- You, F.; Liu, J.; Wang, X.; Xu, Y.; Huang, R.; Zhang, P. Study on Embryonic Development and Early Growth of Triploid and Gynogenetic Diploid Left-Eyed Flounder, Paralichthys olivaceus (T. et S.). Chin. J. Oceanol. Limnol. 2001, 19, 147–151. [Google Scholar] [CrossRef]
- Li, Y.; Zhang, B.; Yang, Y.; Chen, S. Estimationof Genetic Parameters for Juvenile Growth Performance Traits in Olive flounder (Paralichthys olivaceus). Aquac. Fish. 2019, 4, 48–52. [Google Scholar] [CrossRef]
- Lu, S.; Liu, Y.; Yu, X.; Li, Y.; Yang, Y.; Wei, M.; Zhou, Q.; Wang, J.; Zhang, Y.; Zheng, W.; et al. Prediction of Genomic Breeding Values Based on Pre-Selected SNPs Using SsGBLUP, WssGBLUP and BayesB for Edwardsiellosis Resistance in Japanese Flounder. Genet. Sel. Evol. 2020, 18, 49. [Google Scholar] [CrossRef] [PubMed]
- Gjedrem, T. Genetic Improvement for the Development of Efficient Global Aquaculture: A Personal Opinion Review. Aquaculture 2012, 344, 12–22. [Google Scholar] [CrossRef]
- Ye, B.; Wan, Z.; Wang, L.; Pang, H.; Wen, Y.; Liu, H.; Liang, B.; Lim, H.S.; Jiang, J.; Yue, G. Heritability of Growth Traits in the Asian Seabass (Lates calcarifer). Aquac. Fish. 2017, 2, 112–118. [Google Scholar] [CrossRef]
- Min, B.-H.; Kim, H.-C.; Lee, J.-H.; Noh, J.-K.; An, H.-S.; Park, C.-J.; Choi, S.-J.; Myeong, J.-I. Comparison of Growth Parameters in Selected and Unselected Strains of Olive Flounder Paralichthys olivaceus. Korean J. Fish. Aquat. Sci. 2010, 43, 457–461. [Google Scholar] [CrossRef][Green Version]
- Kim, H.-C.; Noh, J.-K.; Lee, J.-H.; Park, C.-J.; Min, B.-H.; Kim, K.-K.; Kim, J.-H.; Lee, J.-G.; Myeong, J.-I. Estimation of Genetic Parameters of Growth-Related Traits from 11-Month-Old Olive Flounder (Paralichthys olivaceus) Base Population in Which Wild Flounder Broodstocks Were Introduced. J. Anim. Sci. Technol. 2011, 53, 99–106. [Google Scholar] [CrossRef]
- Wang, C.H.; Li, S.F.; Xiang, S.P.; Wang, J.; Liu, Z.G.; Pang, Z.Y.; Duan, J.P.; Xu, Z.B. Genetic Parameter Estimates for Growth-Related Traits in Oujiang Color Common Carp (Cyprinus carpio Var. Color). Aquaculture 2006, 259, 103–107. [Google Scholar] [CrossRef]
- Liu, F.; Li, Y.; Du, M.; Shao, C.; Chen, S. Analysis of Phenotypic and Genetic Parameters for Growthrelated Traits in the Half Smooth Tongue Sole, Cynoglossus semilaevis. Chin. J. Oceanol. Limnol. 2016, 34, 163–169. [Google Scholar] [CrossRef]
- Bentsen, H.B.; Gjerde, B.; Nguyen, N.H.; Rye, M.; Ponzoni, R.W.; Palada de Vera, M.S.; Bolivar, H.L.; Velasco, R.R.; Danting, J.C.; Dionisio, E.E.; et al. Genetic Improvement of Farmed Tilapias: Genetic Parameters for Body Weight at Harvest in Nile Tilapia (Oreochromis niloticus) during Five Generations of Testing in Multiple Environments. Aquaculture 2012, 338, 56–65. [Google Scholar] [CrossRef]
- Janhunen, M.; Kause, A.; Vehviläinen, H.; Nousiainen, A.; Koskinen, H. Correcting Within-Family Pre-Selection in Genetic Evaluation of Growth—A Simulation Study on Rainbow Trout. Aquaculture 2014, 434, 220–226. [Google Scholar] [CrossRef]
- Bai, S.C.; Lee, S. Culture of Olive Flounder: Korean Perspective. In Practical Flatfish Culture and Stock Enhancement; Wiley-Blackwell: Oxford, UK, 2010; pp. 156–168. [Google Scholar] [CrossRef]
- Gjedrem, T.; Baranski, M. Selective Breeding in Aquaculture: An Introduction. In Reviews: Methods and Technologies in Fish Biology and Fisheries; Springer Netherlands: Dordrecht, The Netherlands, 2009; Volume 10. [Google Scholar] [CrossRef]
- Hou, J.; Wang, G.; Zhang, X.; Sun, Z.; Liu, H.; Wang, Y. Cold-Shock Induced Androgenesis without Egg Irradiation and Subsequent Production of Doubled Haploids and a Clonal Line in Japanese Flounder, Paralichthys olivaceus. Aquaculture 2016, 464, 642–646. [Google Scholar] [CrossRef]
- Misztal, I.; Tsuruta, S.; Strabel, T.; Auvray, B.; Druet, T.; Lee, D.H. Blupf90 and Related Programs (Bgf90). In Proceedings of the 7th World Congress on Genetics Applied to Livestock Production, Montpellier, France, 19–23 August 2002. [Google Scholar]
- Stieglitz, J.D.; Hoenig, R.H.; Baggett, J.K.; Tudela, C.E.; Mathur, S.K.; Benetti, D.D. Advancing Production of Marine Fish in the United States: Olive Flounder, Paralichthys olivaceus, Aquaculture. J. World Aquac. Soc. 2021, 52, 566–581. [Google Scholar] [CrossRef]
- Kim, W.S.; Kim, S.R.; Kim, D.; Kim, J.O.; Park, M.A.; Kitamura, S.I.; Kim, H.Y.; Kim, D.H.; Han, H.J.; Jung, S.J.; et al. An Outbreak of VHSV (Viral Hemorrhagic Septicemia Virus) Infection in Farmed Olive Flounder Paralichthys olivaceus in Korea. Aquaculture 2009, 296, 165–168. [Google Scholar] [CrossRef]
- Kikuchi, K.; Takeda, S. Present Status of Research and Production of Japanese Flounder, Paralichthys olivaceus, in Japan. J. Appl. Aquac. 2001, 11, 165–175. [Google Scholar] [CrossRef]
- Liu, Y.X.; Wang, G.X.; Wang, Y.F.; Si, F.; Sun, Z.H.; Zhang, X.Y.; Wang, J.D.; Liu, H.J. Estimation of Genetic Parameters for Growth Traits of Japanese Flounder Paralichthys olivaceus Using an Animal Model. Fish. Sci. 2011, 77, 87–93. [Google Scholar] [CrossRef]
- Gjerde, B.; Gjedrem, T. Estimates of Phenotypic and Genetic Parameters for Carcass Traits in Atlantic Salmon and Rainbow Trout. Aquaculture 1984, 36, 97–110. [Google Scholar] [CrossRef]
Publisher’s Note: MDPI stays neutral with regard to jurisdictional claims in published maps and institutional affiliations. |
© 2022 by the authors. Licensee MDPI, Basel, Switzerland. This article is an open access article distributed under the terms and conditions of the Creative Commons Attribution (CC BY) license (https://creativecommons.org/licenses/by/4.0/).

