Article

Establishing the Signal above the Noise: Accounting for an Environmental Background in the Detection and Quantification of Salmonid Environmental DNA

by
Morgan D. Hocking
1,2,†,
Jeffrey C. MacAdams
1,2,†,
Michael J. Allison
3,
Lauren C. Bergman
3,
Robert Sneiderman
4,5,
Ben F. Koop
6,
Brian M. Starzomski
1,
Mary L. Lesperance
4 and
Caren C. Helbing
3,*
1
School of Environmental Studies, University of Victoria, Victoria, BC V8W 2Y2, Canada
2
Ecofish Research Ltd., Victoria, BC V8T 2C1, Canada
3
Department of Biochemistry and Microbiology, University of Victoria, Victoria, BC V8P 5C2, Canada
4
Department of Mathematics and Statistics, University of Victoria, Victoria, BC V8W 2Y2, Canada
5
Department of Analytical Studies, Methodology and Statistical Infrastructure, Statistics Canada, Ottawa, ON K1A 0T6, Canada
6
Department of Biology, University of Victoria, Victoria, BC V8P 5C2, Canada
*
Author to whom correspondence should be addressed.
These authors contributed equally to this work.
Fishes 2022, 7(5), 266; https://doi.org/10.3390/fishes7050266
Submission received: 3 September 2022 / Accepted: 25 September 2022 / Published: 29 September 2022
(This article belongs to the Special Issue Application of Environmental DNA Technology in Fishery Resources)

Abstract

:
A current challenge for environmental DNA (eDNA) applications is how to account for an environmental (or false-positive) background in surveys. We performed two controlled experiments in the Goldstream Hatchery in British Columbia using a validated coho salmon (Oncorhynchus kisutch) eDNA assay (eONKI4). In the density experiment at high copy number, eDNA in 2 L water samples was measured from four 10 kL tanks containing 1 to 65 juvenile coho salmon. At these densities, we obtained a strong positive 1:1 relationship between predicted copy number/L and coho salmon biomass (g/L). The dilution experiment simulated a situation where fish leave a pool environment, and water from upstream continues to flow through at rates of 141–159 L/min. Here, three coho salmon were placed in four 10 kL tanks, removed after nine days, and the amount of remaining eDNA was measured at times coinciding with dilutions of 20, 40, 80, 160, and 1000 kL. The dilution experiment demonstrates a novel method using Binomial–Poisson distributions to detect target species eDNA at low copy number in the presence of an environmental background. This includes determination of the limit of blank with background (LOB-B) with a controlled false positive rate, and limit of detection with background (LOD-B) with a controlled false negative rate, which provides a statistically robust “Detect” or “No Detect” assessment for eDNA surveys.

Graphical Abstract

1. Introduction

Accurately assessing species distribution and abundance can be challenging but is central for the conservation and management of biological diversity. For example, the monitoring of ecologically and culturally valuable fish species such as salmonids can be difficult and costly but is required to support effective fisheries management decision-making. Advances in non-invasive sampling for fisheries and wildlife monitoring have broadened the scope of research possibilities and increased capabilities of management agencies [1,2]. In the past two decades, environmental DNA (eDNA) has emerged on the forefront of these non-invasive monitoring techniques for both rare and abundant aquatic species, including many fish species [3,4,5,6,7,8,9]. eDNA methods in freshwater systems entail collecting small volumes of water and filtering or precipitating the DNA that animals shed to the environment without ever contacting the organisms themselves. Quantitative real-time polymerase chain reaction (qPCR) methods are employed across technical replicates to determine the presence and relative abundance of a given target species gene or DNA fragment per sample.
Environmental DNA methods have been applied successfully in diverse environments across wide animal taxonomy, often at higher sensitivity than with conventional methods [8,10,11]. However, eDNA methods still face considerable challenges such as in addressing uncertainties regarding minimum densities necessary for reliable and consistent detection, the persistence of eDNA in moving water, and the environmental determinants of eDNA signal strength [6,12,13,14,15]. In addition, there is a strong need to develop standards for eDNA monitoring methods so that eDNA can be readily adopted by management agencies to inform permitting, environmental assessment, and conservation decision-making [16,17]. Standards related to the performance of qPCR assays have begun to be developed and there is general agreement that performance measures such as the limits of blank (LOB), limits of detection (LOD), and limits of quantification (LOQ) should be published for each qPCR assay developed [13,18,19,20,21,22]. However, there remains uncertainty as to how these qPCR assay performance measures should be defined and used in situations of high target species abundance (high copy number environments), and, particularly, in situations when target species abundance is low, and many qPCR technical replicates fail (low copy number environments). To date, studies in high copy number situations have been rightly focused on determining the correlations between qPCR cycle threshold (Ct) or eDNA copy number and target species abundance or biomass [6,7,23], while experimental determinations of low-density detection thresholds and eDNA persistence have often been performed in aquaria and artificial ponds [5,24,25].
Beyond shortcomings of generalizability from laboratory and microcosm experiments to natural environments, standardization of eDNA results across studies is complicated by the wide range of processing and analysis protocols currently in use [13,26,27]. Consequently, different studies will carry out different levels of laboratory replication, opting to take even single PCR positive replicates as sufficient evidence to conclude site level detection [28,29]. Similarly, determination of experimental false positive rates is often overlooked [30,31,32,33]. False positive errors can be caused by contamination in the field or lab, failures of assay specificity, or simply because a background true signal is present even when the target species is not because of the spatiotemporal dynamics of eDNA and species movements (e.g., flow of water from upstream) [30]. This is even more troubling from a management perspective: low detection rate from field sampling needs to be distinguishable from some background level of false-positive error. Experimental determination of this background level and the integration of the background into the performance of assays, including the LOB and LOD that capture defined false-positive and negative rates, respectively, is critical for confidence in eDNA detections from sites where target species presence is unknown.
We set about addressing these shortcomings and knowledge gaps with two controlled experiments designed to detect coho salmon (Oncorhynchus kisutch) presence and abundance in simulated stream environments. Coho salmon are a species both of conservation and commercial interest, and their fishery is augmented in British Columbia by many hatcheries operating on rivers near the coast. Using hatchery rearing tanks with controlled densities of juvenile coho salmon, we sought to determine the methods for assessment of salmonid eDNA at high and low copy number, including methods to account for a low signal environmental (or false positive) background. We present a validated assay for coho salmon (eONKI4) and predictions of its performance in a controlled lab setting. From the Ct versus copy number standard curve, we developed a relationship between coho salmon biomass and target DNA copy number in a high copy number environment. In addition, we applied a Binomial–Poisson standard curve developed in Lesperance et al. [21] between the proportion of positive detections across technical replicates and the dilution water volume, simulating the loss of eDNA signal via degradation and dilution after fish have left a pool habitat. This includes new methods to define the limit of blank with background (LOB-B) and limit of detection with background (LOD-B), which provides a statistically robust approach for determining a “Detect” or “No Detect” assessment in eDNA surveys in the presence of an environmental background.

2. Materials and Methods

2.1. Experimental Study System and Design

We conducted eDNA experiments in 10 kL tanks with juvenile coho salmon at the Howard English Fish Hatchery on the Goldstream River (hereafter “Goldstream Hatchery”), near Victoria, B.C. The Goldstream River is home to runs of coho salmon (~1000 spawners), Chum Salmon (O. keta) (>20,000 spawners), and Chinook Salmon (O. tshawytscha) (<50 spawners). There is a waterfall barrier to anadromous fish several kilometers from the river mouth. The Goldstream Hatchery is located and uses water from the Goldstream River above this waterfall barrier, and therefore provides an ideal setup for controlled experimentation with juvenile salmon eDNA. Fish DNA present in the upper reach belongs exclusively to isolated freshwater fish populations (e.g., cutthroat trout (O. clarkii) and rainbow trout (O. mykiss)) and is therefore unlikely to contain DNA from anadromous salmon.
In the hatchery, rearing populations of coho, chum, and Chinook salmon number between 150,000 and 300,000 each year. Coho are always present, and Chinook and chum are present for two to four months in spring. All tanks are plumbed directly from the river and independent of one another. Water is pumped into a tank untreated and unfiltered and drains directly to the river in a “flow-through”, as opposed to a recirculating system. Thus, each tank is an independent replicate, unaffected by changes in fish abundance in the other tanks. Fish in experimental tanks do not require supplemental feeding because inflow of invertebrates and particulate plant matter from the river is adequate feed for fish. This eliminated the potential of fish DNA from feed pellets contributing to the eDNA signal, as observed in Kelly et al. [25].
We designed and implemented two experiments by manipulating the presence and abundance of juvenile coho salmon, which included a density experiment (Figure 1A) and a dilution experiment (Figure 1B). Four 10 kL tanks, with flow-through rates of 141–159 L/min served as independent replicates for each experiment. We estimated flow-through rates by averaging three complete filling times for each tank. Prior to sampling, we drained, pressure washed, and scrubbed all experimental tanks with 10% bleach solution to degrade residual DNA [34].
The density experiment was designed to test for eDNA quantification through a range of manipulated densities of juvenile coho salmon (Figure 1A), which simulates natural pools in a stream environment with different densities of fish. We collected five 2 L water samples from each of the four tanks at densities of 1, 2, 4, 8, 16, 32, and 65 fish. Each coho salmon weighed ~5.7 g (SD = 1.2 g) for a total range in fish biomass tested of 0.6 to 38.0 g/kL across experimental treatments. eDNA samples were taken 24 h after fish additions to allow equilibration of coho salmon DNA in each tank.
The dilution experiment was designed to test the limits of eDNA detection via eDNA signal decay from the combined effects of DNA degradation and dilution, after removal of fish (Figure 1B). This experiment simulates a situation where fish leave a pool environment, and water continues to flow through at rates of 141–159 L/min. We placed three juvenile coho salmon (biomass = 26.1 g/tank, SD = 1.0 g) into minnow traps in each 10 kL tank approximately 15 cm below the surface near the inflow and allowed the system to equilibrate for 9 days prior to fish-positive baseline sample collection. Traps were then removed, and three or four 2 L samples collected from each tank at time zero (10 kL) and times coinciding with dilution volumes of 20, 40, 80, 160, and 1000 kL. The times corresponding to these dilutions were 1 h and 7 min (20 kL), 3 h and 21 min (40 kL), 7 h and 51 min (80 kL), 16 h and 49 min (160 kL), and 4.6 days (1000 kL). Fill rates were calibrated independently for each tank, and thus sample collection times differed slightly for each tank and treatment.
In all eDNA studies, it is important to take control samples to confirm that sample contamination is not occurring and to determine the “background” levels of target DNA, if present [30,31,33]. For example, in a stream environment, the presence of fish upstream may confound estimates of local fish biomass using eDNA based on the background eDNA signal from upstream. Through both experiments, we took a total of 70 negative control samples to estimate the background levels of coho salmon eDNA. Despite bleaching and rinsing each tank prior to use, low levels of coho salmon DNA may still be present due to years of use for rearing coho salmon. In both experiments, we took two types of control samples: pre-fish samples collected directly from the tanks, after cleaning and before adding fish; and concurrent samples taken from one of three different upstream sources. These sources were the main hatchery water supply, a head pond upstream of the hatchery, and a sink in the hatchery kitchen. For the density experiment, we took twelve pilot experiment control samples (three per tank), 20 pre-fish control samples (five per tank), and 21 concurrent control samples (three per day, from main hatchery water supply). For the dilution experiment, we took 12 pre-fish control samples (three per tank) and five concurrent control samples (three from the head pond and two from the sink).

2.2. eDNA Sample Collection and Filtration

In sampling from the tanks, we filled 2 L bottles with water from the surface by partial submersion at arms’ reach (~0.5 m) from the edge of the tank. We filtered water samples through 47 mm diameter 0.45 µm mixed-cellulose ester (MCE) filter membranes (Advantec MFS, Inc., Dublin, CA, USA), with a Cole-Parmer Masterflex L/S 7553-80 peristaltic pump (Cole-Parmer, Montreal, QC, Canada), and a filtration unit consisting of ~1 m of #16 silicone tubing (Baoding Signal Fluid, Baoding City, China) and a reusable 47 mm in-line polypropylene filter holder (AMD Manufacturing, Mississauga, ON, Canada). We adapted a filtration protocol from Walsh et al. [35] to allow for filtration of four 2 L samples simultaneously. After filtration, we removed filter membranes from the filter holder and placed them in falcon tubes with sterile forceps. We then froze filter membranes at −20 °C within 30 min of filtering, where they remained for periods ranging from 27 to 164 days.
Prior to sample collection, we decontaminated all sampling equipment with the following procedure: rinsing of 2 L sample bottles three times in 10% bleach to degrade any residual DNA, and three times in double distilled H2O (ddH2O) to remove the bleach; for each filtration unit, pumping through of 100 mL of 10% bleach solution, 100 mL of ddH2O, and then autoclaving at 121 °C and 15 psi for 20 min. We re-used filtration units for replicate samples within tank and treatment level. We performed the same bleach and water rinsing, and autoclave procedures to decontaminate forceps for handling filter membranes.
For increased assurance against contamination in the field, we also used a “cooler blank” [36]. This entailed filling a 2 L bottle with ddH2O, bringing it to the experimental site, and subjecting it to the same handling, storage, and processing as the experimental samples. The frozen filter membrane of this cooler blank returned to the lab and became a “lab process blank” whereby filtered ddH2O underwent the same isolation protocol as experimental samples. We ran two such process blanks: one subject to potential hatchery contamination (filtered alongside experimental site samples), and another laboratory blank, subject only to potential contamination from DNA extraction and qPCR procedures. We did this to ensure the equipment decontamination process was effective, contamination at the experimental site did not occur, and lab sourced ddH2O was free of potentially contaminating DNA.

2.3. Lab Sample Processing

We thawed filter membranes and extracted the DNA with MO-BIO PowerWater DNA isolation kits (MO-BIO Laboratories, Carlsbad, CA, USA), following a modified manufacturer’s protocol for increased yield by applying heat treatments for a range of 1-24 h instead of the standard 1 h. Extracted samples were first evaluated for DNA integrity and inhibition by using the IntegritE-DNATM test, which is a primer/probe combination (ePlant5) that amplifies chloroplast DNA that is ubiquitous in freshwater systems [37,38]. We ran samples in four technical replicates with eight No-Template Controls (NTCs) and two positive controls per plate as in Hobbs et al. [37]. Positive controls consisted of synthetic double stranded DNA fragments corresponding to the target 196 bp amplicon of the respective primer/probe test at a concentration of 20 copies per reaction. If a sample failed the IntegritE-DNATM test, we cleaned the isolated DNA using the Zymo OneStepTM PCR Inhibitor Removal Kit (Cedarlane, Burlington, ON, Canada; Cat# D6030S) and re-tested. If the sample failed again, we determined it to have either insufficient intact DNA, or to have too great a presence of inhibitors to be effectively removed. Samples that failed the IntegritE-DNATM test a second time, after inhibitor removal, were excluded from further analysis to avoid false negative detections of the target taxa.
We then took all samples that passed this initial stage and tested them with the eONKI4 assay, using reaction conditions in Veldhoen et al. [38]. We tested all samples with eight technical qPCR replicates, eight negative (NTC) controls, and two coho salmon total DNA positive controls. On the qPCR plate, we set the negative control reactions between the experimental samples and the positive controls, so that if a contamination event occurred it would be detected in the negative controls [37].

2.4. Coho Salmon eDNA Assay (eONKI4) Design and Validation

We designed and validated a sensitive eDNA assay (eONKI4), which detected only the DNA of coho salmon (O. kisutch) in the lab environment. We developed TaqMan qPCR primers and probes using mitochondrial gene sequences obtained from the National Center for Biotechnology Information database (https://www.ncbi.nlm.nih.gov, accessed on 14 November 2019) (Table 1). We collected gene sequences for coho salmon as well as sympatric salmonids in the Genus Oncorhynchus, and more distantly related fish, amphibians, and humans (Table 2). Using ClustalW (http://www.genome.jp/tools-bin/clustalw, accessed on 14 January 2020) to align these sequences, we determined where the sequences share identity. Using the output.aln file with BioEdit (Ibis Biosciences, Carlsbad, CA, USA) and Primer Premier Version 6 (Premier Biosoft, Palo Alto, CA, USA), we designed primers and probes for coho salmon targeting unique regions where there was limited identity to the other species in the alignment (Supplementary Figure S1). We designed multiple primer candidates and tested for sensitivity and specificity to the target DNA, and the most successful primer/probe combination is shown in Table 1. We ordered the primers and probe containing a 5′ FAM reporter dye and 3′ ZEN/Iowa Black FQ quencher from Integrated DNA Technologies (IDT; Coralville, IA, USA).
We obtained specimens of target and sympatric species from grocery stores and DFO Chilliwack River Hatchery under Animal Use Protocol PPACC-1704 and isolated their total DNA. We also isolated human DNA from a HEK293 cell line (American Type Culture Collection (ATCC, Manassas, VA, USA) Catalog number CRL-1573) under the University of Victoria Biosafety permit #96876-028. We used the DNeasy Blood and Tissue Kit (QIAGEN Inc., Mississauga, ON, Canada; Cat# 69506) to isolate total DNA from these samples and used this DNA to determine the selectivity and sensitivity of the designed primer sets using a CFX96 qPCR machine (Bio-Rad Laboratories, Hercules, CA, USA) according to reaction and thermocycling conditions used in Veldhoen et al. [38].
To determine specificity, we first tested against total DNA of coho salmon, and other species listed in Table 2, with two technical replicates using a SYBR (Invitrogen, Carlsbad, CA, USA) qPCR assay and agarose gel visualization of the amplified product (amplicon) for the desired species and absence of the target 196 bp amplicon in all non-target species. After confirming the expected amplicon (Table 1), we combined the primers with the corresponding designed TaqMan hydrolysis probe candidates and tested on total DNA from all species in Table 2 (two technical replicates). To confirm the assay’s ability to detect a conserved region of the target species DNA, we used gDNA from five coho salmon specimens for validation. All qPCR runs were scored using a standardized cycle threshold of 50 relative fluorescence units. If amplification above the threshold was detected within 50 cycles (i.e., <50 Ct) then we scored that replicate as positive.
We selected the best primer/probe sets based on specificity for coho salmon. We tested these against all ten species with 23 additional technical replicates. In total, we ran 25 technical replicates for each species in Table 2.
After specificity testing, we initially determined assay sensitivity using a five-fold dilution series of the coho salmon total DNA between 0.008 and 5 µg/L. For each DNA concentration, and for the NTC, we ran twenty-five technical replicate qPCR reactions. Based on selectivity and sensitivity results, we selected the eONKI4 primer and probe combination as the best tool overall. Since tissue-derived mitochondrial DNA is not conducive for standardization of assay performance, we undertook further empirical evaluation of the sensitivity of the eONKI4 qPCR test using a synthetic DNA fragment and methods adapted and modified from Hobbs et al. [37] using double-stranded synthetic gBlocks® DNA (IDT) which consisted of the 196 bp amplicon sequence in Table 1. A five-fold serial dilution series was tested from 62,500 to 0.032 copies/reaction. This method is most conducive for standardization and inter-laboratory comparison as it relies on the use of synthetic DNA that can readily be prepared according to copy number to assess assay performance.

2.5. Generation of Standard Curves

Calibration standard curves were developed to estimate copy number for eONKI4 in both high copy number and low copy number situations using the gBlocks® data published in [20]. First, in the high copy number situation (where 100% technical replicates returned a Ct value < 50), a weighted linear regression standard curve was developed for the gBlocks® qPCR Ct values from samples with a Starting Quantity (SQ) greater than four copies per reaction following the methodology of Lavagnini and Magno [39]. A weighted regression was necessary because the variability of the gBlocks® Ct values decrease considerably with increasing SQ. The weights were estimated as the reciprocals of the sample variances of the Ct values for each SQ value. The weighted linear regression between transformed Ct (computed as: 50-Ct) and known input DNA copy number was applied to the density experiment results to estimate coho salmon DNA copies for each treatment.
In the low copy number situation where <100% technical replicates returned a Ct value < 50, we applied the eLowQuant method of Lesperance et al. [21] to the low copy SQ data, using gBlocks® samples with SQ’s less than or equal to four copies per reaction as they yielded less than 100 percent detection across technical replicates. We applied a Binomial–Poisson model with no intercept to fit a relationship between the proportion of technical replicates with positive detections (proportion detect) as a function of known input DNA copy number. The eLowQuant method also provides estimates for the limit of blank (LOB), the limit of detection (LOD), and limit of quantification (LOQ) for the eONKI4 assay at different numbers of technical replicates [21]. The Binomial–Poisson model for eONKI4 was applied to estimate copy number in the dilution experiment samples with detection proportions below one.
All data generated for the standard curves are provided in the supplementary data zip file.

2.6. Statistical Analyses of Fish Density and Dilution Experiments

All data used within the present study are provided in the supplementary data zip file. Coho salmon DNA copy number estimates were obtained using the weighted linear regression standard curve for the density and dilution experiment samples with 100 percent detection across technical replicates and using the Binomial–Poisson standard curve for the dilution experiment with detection proportions below one. For the density experiment, a linear regression model summarized the relationship between estimated log2 copy number and log2 coho biomass across the experimental treatments with increasing numbers of juvenile coho salmon in each experimental tank. The dilution experiment data were also analyzed using a nonlinear bent cable model for the relationship between log2 copy number and log2 water dilution volume [40].
The dilution experiment was used to illustrate the application of a novel and statistically rigorous method developed here to confirm the maximum dilution volume with detection of coho salmon DNA in the presence of an environmental background detection of target species DNA (or false-positive background). The 65 negative fish control samples (without the pond and sink samples) from the density and dilution experiments were used to estimate the background qPCR eDNA detection rate in the hatchery environment for the assay eONKI4. Each of the 65 samples had eight technical replicates resulting in 520 negative control technical replicates. The gBlocks® eLowQuant Binomial–Poisson model was used to estimate the background copy number as:
SQ Background = log ( 1 p ) / β
where p is the proportion of positive detections out of the total number of technical replicates and β is estimated from the low copy number standard curve [21].
The estimated coho salmon background in the Goldstream Hatchery tanks for the assay eONKI4 was used to derive the limit of blank with background (LOB-B, on the binomial scale) and the limit of detection with background (LOD-B, on the copy number scale), which are analogous to the LOB and LOD in Lesperance et al. [21], but where we accommodate the environmental background estimate, SQBackground. In deriving LOB and LOD for an assay using gBlocks® under “ideal” conditions, we construct a statistical test of the null hypothesis that the target DNA concentration is equal to zero with pre-specified false-positive and false-negative error rates (Type I and II error rates) [21]. Typically, we set the false-positive and false-negative error rates to be 0.05, but these can depend on the investigator’s level of error tolerances. In the absence of background DNA, let Y be the number of positive qPCR detections out of m technical replicates. We say that the test is negative if Y is less than or equal to LOB and otherwise the test is positive. The test is constructed so that if the target DNA concentration is truly zero, we expect in repeated sampling that 5% or fewer samples would test positive. The LOD is computed to control the false negative rate. If the true target DNA concentration is equal to LOD or higher, we expect in repeated sampling that 5% or fewer samples would test negative.
Herein, we construct a statistical test of the null hypothesis that the target eDNA concentration is equal to the environmental background, SQBackground, rather than zero, setting the false-negative rate at 0.05 and the false-positive rate at 0.05. We say that a sample result is “No Detect” if Y, the number of positive qPCR detections out of m technical replicates, is ≤ LOB-B. The LOB-B is computed so that if the true target DNA concentration is equal to SQBackground, we expect in repeated sampling that 95% or more samples would have a result of “No Detect”. The LOD-B is computed in a similar way as the LOD from Lesperance et al. [21], but is also calibrated to the environmental background and provides the copy number corresponding to a given false-negative rate. The LOD-B is computed so that if the true target DNA concentration is ≥ LOD-B, we expect in repeated sampling that 5% or fewer samples would result in Y ≤ LOB-B (i.e., “No Detect”), and that 95% or more samples would result in Y > LOB-B. The power of the test is ≥ 95% when the DNA concentration is ≥LOD-B. Thus, if the estimated sample DNA concentration is ≥ LOD-B, then we say that the sample is confirmed as “Detect” with high confidence. If the sample is ≥ LOB-B but < LOD-B then the sample is determined as “Detect*”, which means that the target DNA has been detected with some uncertainty and thus more sampling is recommended to confirm the result. Note that LOB-B is often measured on the binomial scale and LOD-B is measured on the DNA concentration or copy number scale.

3. Results

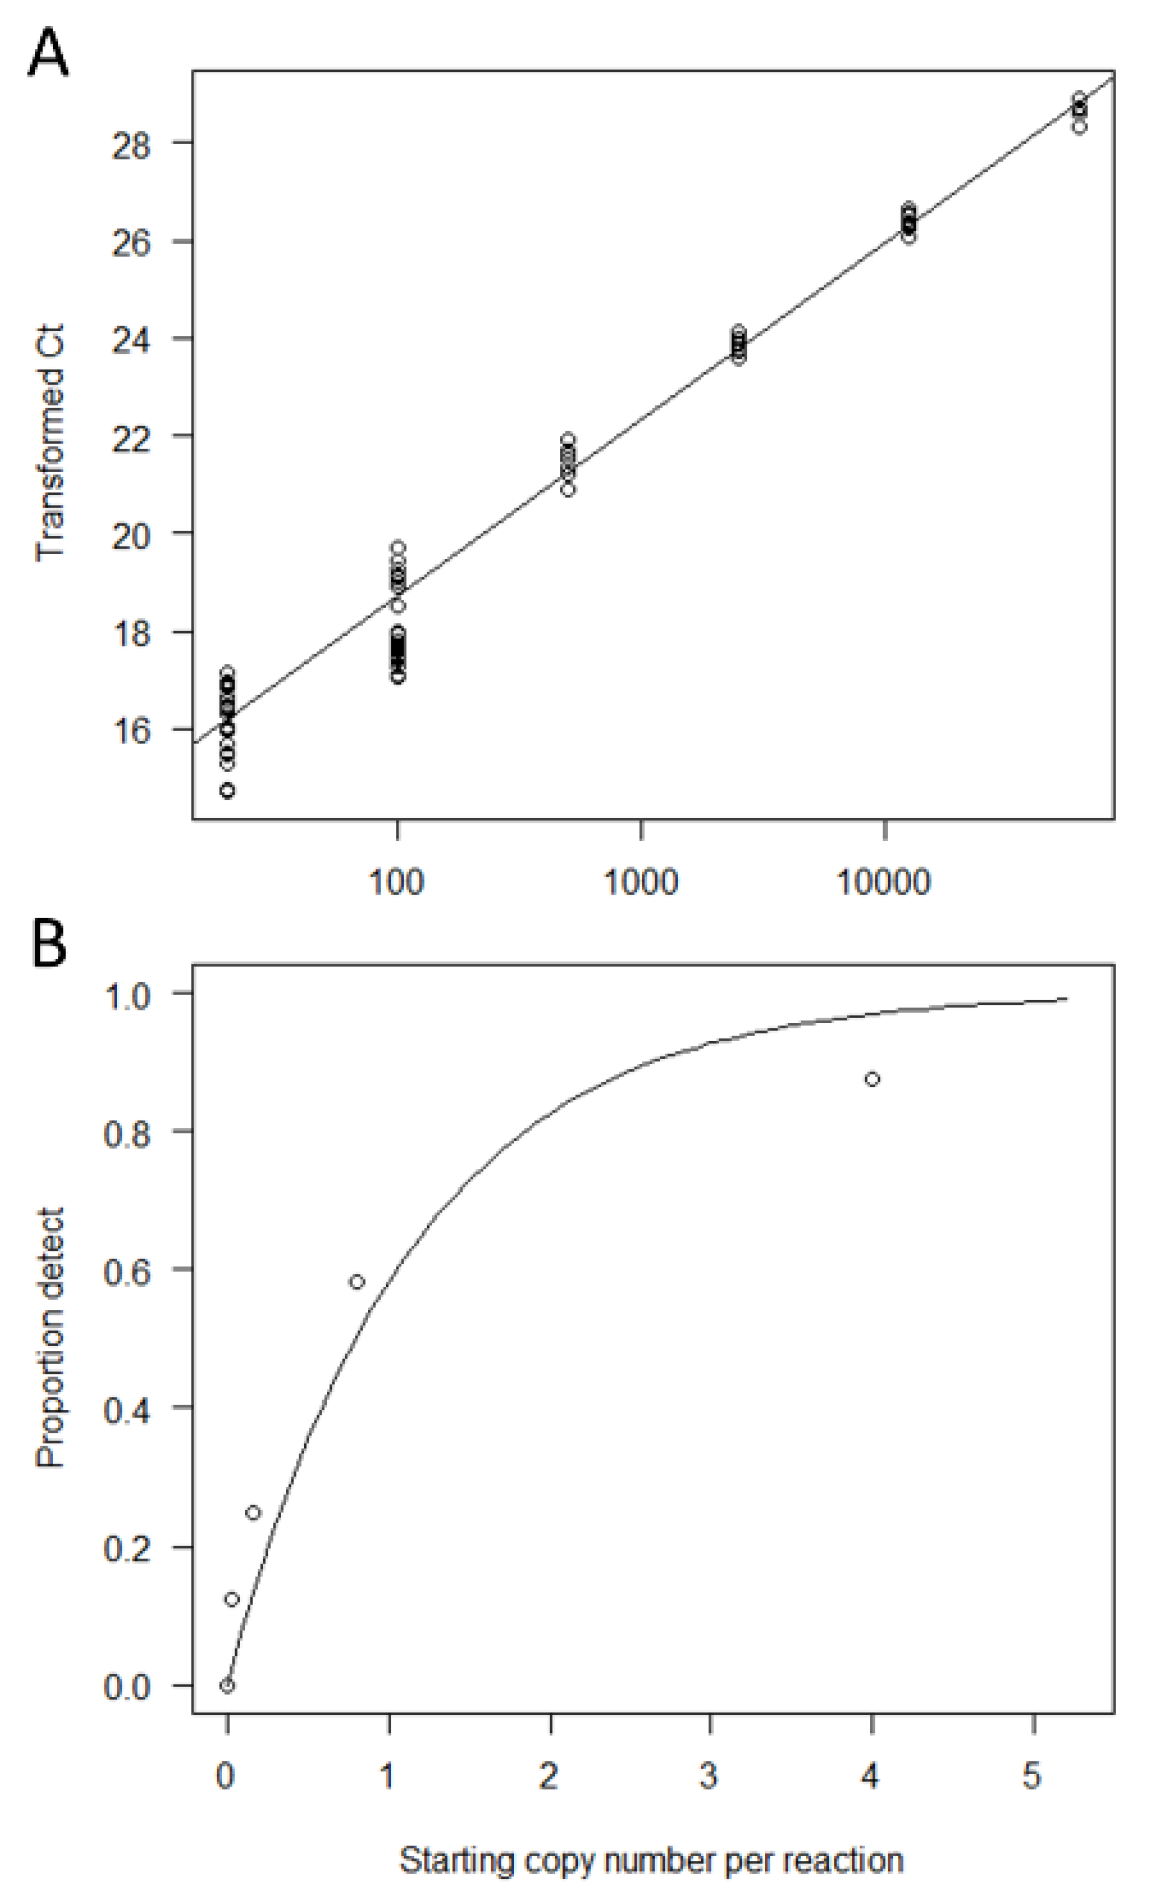
3.1. qPCR Salmon eDNA Assay Design and Calibration to Copy Number

Several candidate primer/probe assays were tested from designs using mitochondrial sequences from 12S RNA, 16S RNA, NADH:ubiquinone oxidoreductase core subunit 1 (mt-nd1) and cytochrome B genes. We chose eONKI4, which is derived from the mt-nd1 gene, due to its superior selectivity and sensitivity in lab validations using isolated specimen total DNA and synthetic DNA. The eONKI4 tool tested positive in 100% of the 25 technical replicates with 5 µg/L isolated coho salmon DNA, and none of 25 replicates containing non-target DNA (Table 2). We tested the assay efficiency using gBlocks® synthetic DNA fragments, from which we produced a standard curve of transformed qPCR cycle threshold (50-Ct) numbers versus known input DNA copy number (Figure 2A). This approach was valid for 100% detection at 20 copies/reaction. Below this (≤ 4 copies/reaction), we used the binomial data from the gBlocks® DNA assay to compute the Maximum Likelihood curve for the proportion of technical replicates with positive detections (proportion detect) as a function of known input DNA copy number (Figure 2B). Using the no-intercept model assuming no assay background that is consistent with observed assay NTC performance, the LODs for the eONKI4 assay and the confidence intervals are provided in Table 3 across a range of possible technical replicates per sample. For example, the LOD = 0.43 target DNA copies per reaction for eight technical replicates and 0.14 copies per reaction for 24 technical replicates (Table 3).

3.2. Determination of the LOB-B and LOD-B

The 65 negative fish control samples from the density and dilution experiments were used to estimate the background coho salmon eDNA in the Goldstream Hatchery environment. Each of the 65 samples had eight technical replicates and 28 of the 520 technical replicates had eDNA detections. The Binomial–Poisson model was used to estimate copy number as:
C o p y   N u m b e r = log ( 1 p ) / 0.872038
where p is the proportion detected out of all 520 technical replicates. The mean environmental background Copy Number was estimated as SQBackground = 0.063 copies/L (95% CI 0.047–0.098).
Given the environmental background in the Goldstream Hatchery experimental tanks, new LOBs and LODs with background (denoted LOB-B, and LOD-B) were calculated for various numbers of technical replicates (m) (Table 4). For example, the LOD-B = 1.05 target DNA copies per reaction for eight technical replicates and 0.40 copies per reaction for 24 technical replicates (Table 4), which are higher than the LODs shown in Table 3 without an environmental background. If the copy number is LOD-B or higher, at most 5% of repeated samples are expected to test negative (controlled for false-negative error). The LOB-Bs are now greater than zero and are defined so that at most 5% of repeated samples are expected to test positive (controlled for false-positive error) when the copy number is equal to SQBackground. For example, let Y be the number of detected technical replicates out of m. We say that a sample from the Goldstream Hatchery experimental tanks is assessed as “No Detect” if Y ≤ LOB-B and “Detect” or “Detect*” if Y > LOB-B if the estimated copy number is ≥ LOD-B or < LOD-B, respectively. The LOB-B is a count on the binomial scale. Using Equation 2, LOB-B can be converted to the copy number scale and is denoted as LOB-Bcn.

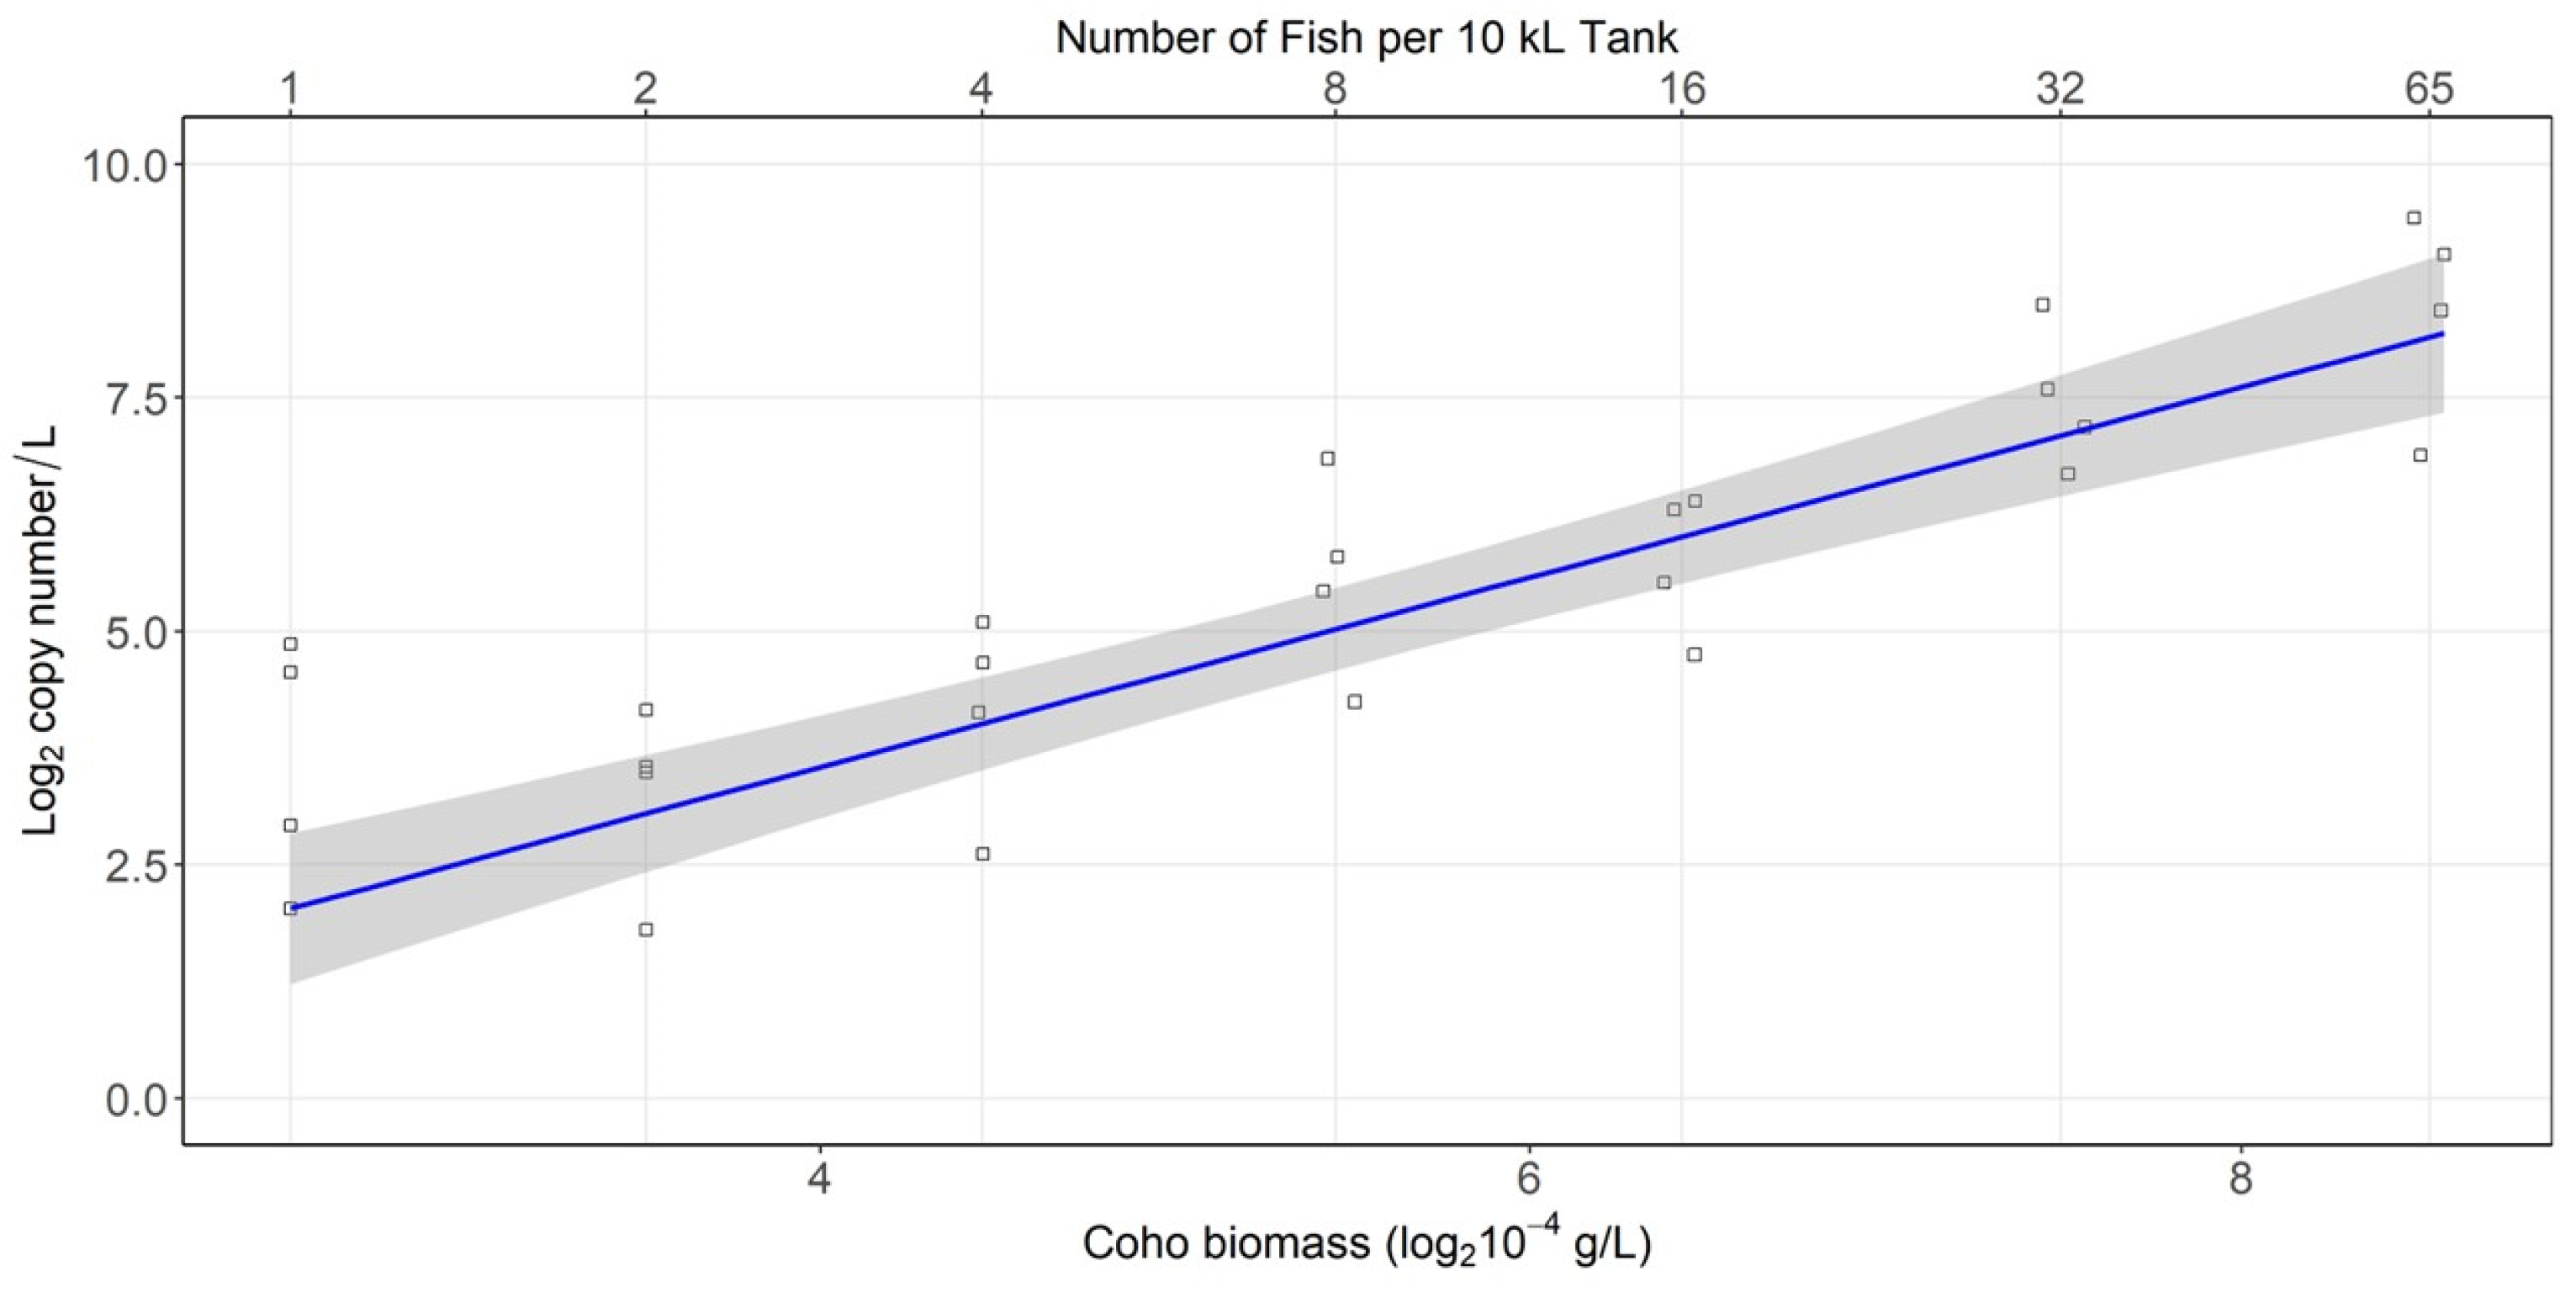
3.3. Density Experiment Results

There was a strong linear 1:1 positive relationship observed between the log2 copy number and log2 coho salmon biomass across experimental treatments with increasing numbers of juvenile coho salmon in 10 kL tanks (Figure 3). All technical replicates from the density experiment returned Ct values < 50. Ct means were computed by tank and by the number of coho salmon in the tank. Inverse regression was applied using the weighted regression standard curve (Figure 2A) to estimate copy number, which was logged and plotted versus log2 biomass. A weighted linear regression model was fit to log2 Copy number versus log2Biomass and the estimated equations to convert between copy number and biomass are:
log 2 C o p y   n u m b e r / L = 0.5146 + 1.0158 log 2 B i o m a s s   ( log 2   10 4   g / L )
log 2 B i o m a s s   ( log 2   10 4   g / L ) = ( log 2 C o p y   n u m b e r / L + 0.5146 ) / 1.0158
The regression equations have a slope close to 1, indicating that as the number (and biomass) of coho salmon doubles, the amount of coho salmon DNA also doubles (hence the 1:1 relationship on the log2 scale). These regression equations could be applied in a field setting to estimate coho salmon biomass in a stream environment from observed eDNA copy number when natural coho salmon densities are moderate to high and ≥ 95% technical replicates for eONKI4 are positive [20,21].

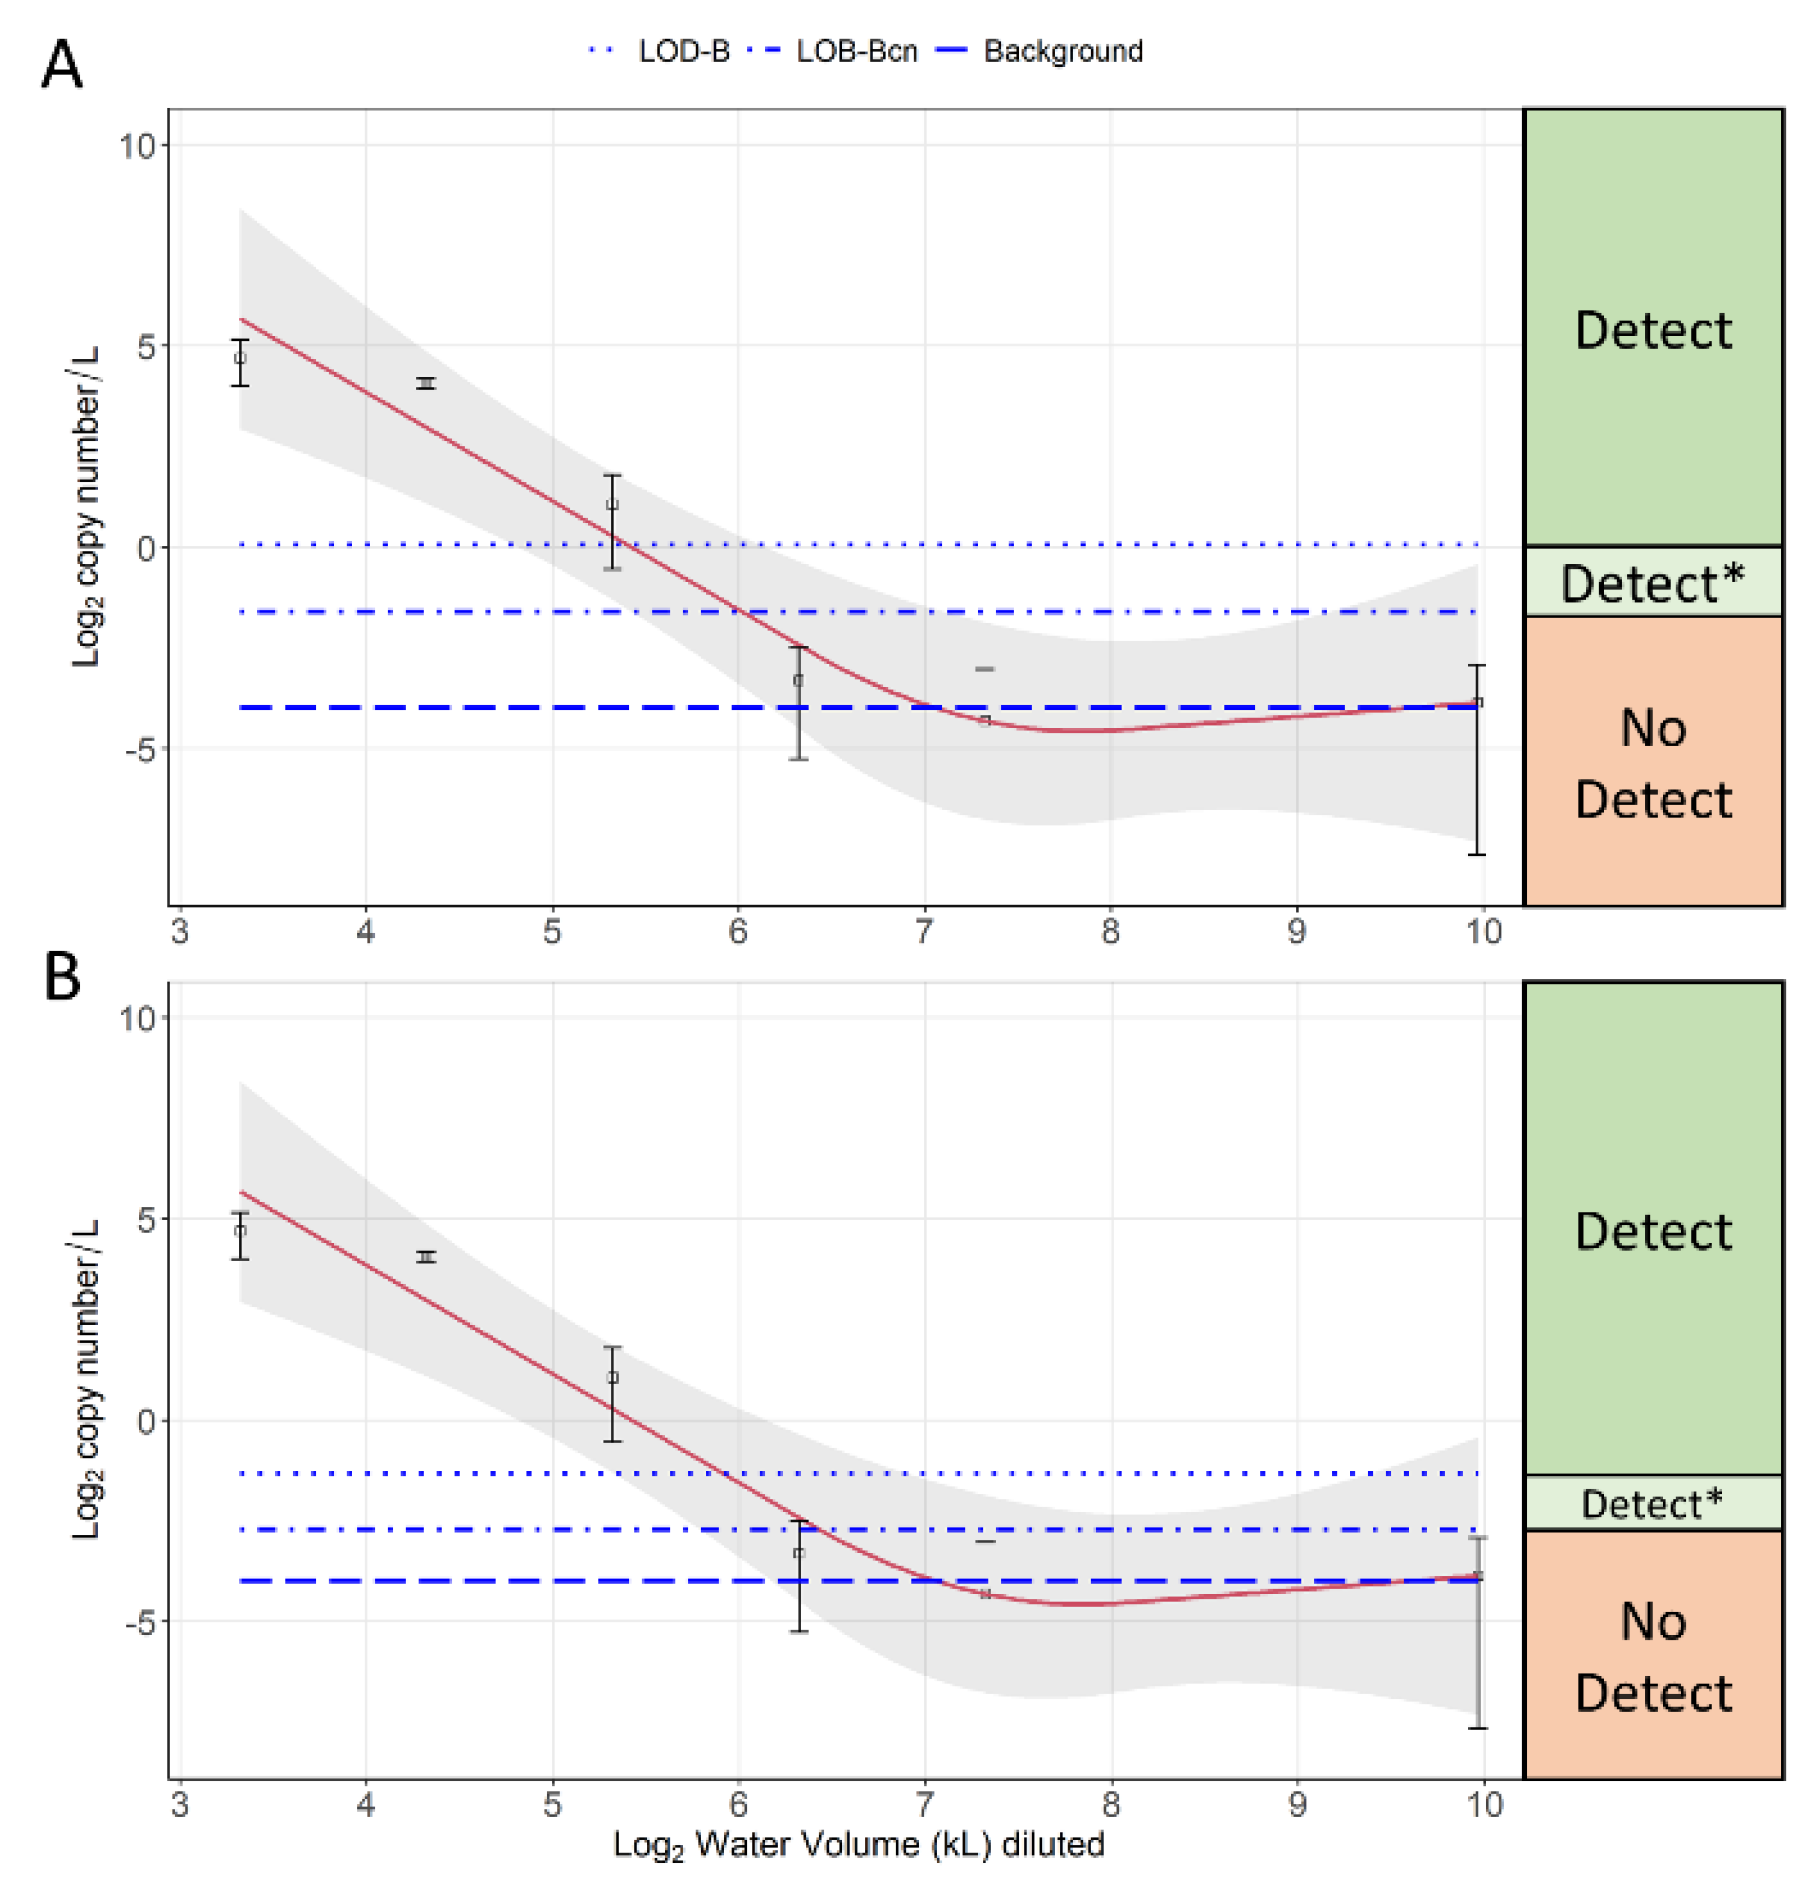
3.4. Dilution Experiment Results

The dilution experiment demonstrates a novel method to confirm the maximum dilution volume with detection of coho salmon DNA in the presence of an environmental background (or false-positive background) (Figure 4). Inverse regression was applied to both the weighted regression standard curve (Figure 2A) and the Binomial–Poisson standard curve (Figure 2B) to estimate copy number by dilution treatment, which was logged and plotted versus log2 water volume diluted. Super-imposed on Figure 4 is the estimate of the environmental background at the Goldstream Hatchery as well as the updated LOB-Bcn and LOD-B for the cases of eight and 24 technical replicates in panels A and B, respectively. At the starting volume of 10 kL (at fish removal) and a dilution volume of 20 kL (after 1 h), there was 100% detection and all samples confirmed as “Detect” of coho salmon DNA (Table 5). At a dilution volume of 40 kL (after 3 h), the tanks ranged from 11/24 to 23/24 detections of coho salmon DNA. At the sample level with eight technical replicates, some samples were greater than the LOB-B but less than the LOD-B and determined as “Detect*” (Table 6), which means that coho salmon DNA was detected with uncertainty and more sampling is recommended to confirm the result. However, all samples in each tank at the 40 kL dilution were confirmed as “Detect*” or “Detect” and thus the interpretation at the tank scale was confirmed as “Detect” for all experimental tanks (Table 5). At the 80 kL dilution (after ~8 h), the tanks ranged from 1/24 to 4/24 detections of coho salmon DNA. The tank #3 with 4/24 detections was greater than the LOB-B but less than the LOD-B and is estimated as “Detect*”. The remaining tanks were lower than the LOB-B (No Detect) and thus the interpretation for the 80 kL treatment is “No Detect” (Table 5). At 160 kL and 1000 kL dilutions, the detection rates were similar to the environmental background and were below the LOB-B and identified as “No Detect” at the tank and treatment level.
A non-linear, bent cable model for log2 mean estimated copy number was also applied, which intersects the LOB-Bcn for eight technical replicates at 0.33 copies per reaction and 65 kL and the LOB-Bcn for 24 technical replicates at 0.15 copies per reaction and 86 kL (Figure 4). The intersection of the bent cable model with the environmental background occurred at 134 kL indicating that increasing the number of technical replicates further could potentially increase the sensitivity of the “Detect” determination to include the 80kL dilution treatment.

4. Discussion

Herein, we demonstrate standardizable methods to assess salmonid presence and abundance at high and low copy number in qPCR studies, including methods to account for a low signal environmental background (or false-positive background). For the density experiment at high copy number, we provide a positive linear 1:1 relationship between predicted copy number and coho salmon biomass across experimental treatments that could be used to estimate juvenile salmon abundance in stream environments. Juvenile coho salmon densities in the density experiment ranged from 1 to 65 fish in 10 kL of water which is a similar range to natural densities of juvenile coho salmon in many streams in coastal BC. For example, Rosenfeld et al. [41] estimated juvenile coho densities at up to three individuals per square meter of stream. Applying a depth of 1 m to their observations (thus 1 kL of water) yields roughly 30 fish per 10 kL of stream, which is like the 32 fish treatment. Overall, the density experiment results confirm observations from previous studies that eDNA methods are likely to be useful to estimate aquatic species biomass such as salmonids in a field setting where target eDNA abundance is high [4,6,7,9,42]. We developed a model that predicts that one juvenile coho salmon with a biomass of ~5.7 g in 10 kL of water produces a signal of ~4.1 copies/L, while 65 fish with a total biomass of ~370.5 g in 10 kL of water produces a signal of ~284.3 copies/L. Inverse regression could be applied to this model to estimate coho salmon biomass in natural pools when abundance is unknown and an eDNA signal from the eONKI4 assay is measured. A corollary is that environmental covariates such as flow, temperature, turbidity, and pH are likely to influence this relationship in a field setting, as well as factors such as the coho salmon body size and eDNA collection methods, and these factors should be measured and tested where possible [6,12,13,14,23,43].
The dilution experiment simulated a situation where a small number of fish leave a pool environment, water continues to flow through, and the residual DNA settles and degrades. Using the eONKI4 assay, we demonstrate that coho salmon DNA can be detected with confidence above an environmental background signal of 0.063 copies/L at 40 kL dilution (after 3 h) but is not clearly discernable from background at 80 kL or greater dilution (after 8 h). Increases in the water volume relative to target species biomass (such as through higher stream flows) dilute eDNA concentrations and reduce detectability [43]. Experiments documenting eDNA degradation rates have shown variable results (hours to up to 25 days) [12,24,44], although these studies have not always occurred with low initial target species abundance, continued flow through dilution, nor consideration of an environmental background. eDNA degradation has been reported in meta-analyses to undergo simple exponential decay (i.e., degrades at a half-life of fixed duration) [45,46], and eDNA half-life is frequently recorded within the timeframe of our two-fold dilution series sampling of approximately 1–17 h [47,48,49]. This suggests a likely increasing effect of degradation through the dilution experiment, as the time interval between sampling bouts approximately doubled at each successive dilution treatment.
In situations of low copy number and presumably low target species abundance, recent papers agree that clear eDNA standards and performance measures associated with qPCR assays are required to increase the usability of eDNA methods by agencies for even seemingly simple presence versus absence assessments [13,17,20]. However, there remains some uncertainty regarding how to determine species presence with confidence at low copy number and how to define assay performance measures such as the LOB, LOD, and LOQ. The LOD, for example, has been described previously as either the lowest concentration from the target gene that is detectable with a Ct below a certain value (often 45 or 50 Ct) [37,50] or the lowest concentration at which a given percentage (often 90–95%) of technical replicates are detected [18,19,20]. Here, we applied the Binomial–Poisson model developed in Lesperance et al. [21] and the statistical definitions for the LOB and LOD from Lavagnini and Magno [39] derived from the relationship between the number of qPCR detected technical replicates and copy number from a sample. While this approach provides a statistically rigorous method to assess target species presence and abundance at low copy number, the LOBs, LODs, and LOQs estimated for the eONKI4 assay (and other assays) were developed under ideal lab conditions and the application of these methods to field-based conditions had remained outstanding [21].
Herein, new definitions for the limit of blank with background (LOB-B) and limit of detection with background (LOD-B) were developed and applied to the dilution experiment, which demonstrates a statistically rigorous approach to detect target species eDNA at low copy number in a field setting with an environmental background. An environmental (or false-positive) background could be caused by contamination in the field or lab, failures of assay specificity, or simply because a background true signal is present even when the target species is not [30]. We observed zero detections in the NTCs, as well as the laboratory and cooler blanks, suggesting that contamination of samples in the field and lab was not a concern. However, we estimated an environmental background copy number from the experimental negative controls of 0.063 copies/L (95% CI 0.047–0.098) using the Binomial–Poisson approach [21]. Despite cleaning and bleaching the tanks prior to the experiments, this environmental background is likely caused by years of use of these experimental tanks for rearing coho salmon. The detection of coho salmon DNA is thus likely a true detection of coho salmon DNA, despite the confirmed absence of live coho salmon both in the experimental tanks, and in isolated reaches upstream. This is a unique but not necessarily uncommon case of false-positive error where a real environmental background signal needs to be accounted for prior to confirming target species presence. For example, false-positive error, even if small, can bias detection rates in field studies substantially [31,33,51]. Statistical methods for incorporating known false-positive error have been performed [32,52,53]; however, adequately accounting for false-positive error remains a significant challenge of eDNA analyses.
We also construct a statistical test of the null hypothesis that the target eDNA concentration is equal to the environmental background, which controls for the false-positive error of the sampling environment at a defined error rate; in this case, from the Goldstream Hatchery experimental tanks. We say that a sample tests “Detect” or “Detect*” if Y, the number of qPCR positive detections out of m technical replicates, is greater than LOB-B and tests “No Detect” if Y is less than or equal to LOB-B. If the true target DNA concentration is equal to the estimated background, we expect in repeated sampling that 5% or fewer samples would test “Detect”, with a defined false-positive error rate of 0.05. In addition, the methods developed herein account for the possibility of false-negative errors, and thus the power of the test to detect the target species if it is indeed present while also accounting for the environmental background. To account for false-negative errors, the LOD-B is used, which is the LOD defined in Lesperance et al. [21], but also calibrated to the environmental background and provides the copy number corresponding to a given false negative rate. If the true target DNA concentration is LOD-B or higher, we expect in repeated sampling that 5% or fewer samples would test negative or “No Detect”, and that 95% or more samples would test “Detect”. Thus, if the sample copy number DNA concentration is greater or equal to the LOD-B then the sample is confirmed as “Detect” with high certainty. If copy number Y is greater than the LOB-B (low false-positive error) but the estimated DNA concentration is less than the LOD-B (unacceptable false-negative error) then we have provided a new narrow range determined as “Detect*”, which means that the target DNA has been detected with some uncertainty and thus more sampling is recommended to confirm the result. This statistical approach could be used in association with any field or lab-based error that is quantified using the eLowQuant method [21], including any contamination measured in the field blanks or from non-target amplification estimated in the field negative controls. The method could also be used to calibrate a low copy number eDNA signal from a target species occurring upstream in a river network with the locally measured copy number in a specific mesohabitat (e.g., pool) or stream reach.
There is a marked increase in power to confirm target species presence using eDNA with increased number of qPCR technical replicates and field sample replicates at a given site [13,21,51]. If target species density is high, then three qPCR technical replicates run per sample may be sufficient to minimize false-positive and false-negative errors [20,21]. However, in low copy number environments even eight technical replicates may not be sufficient to determine species presence, particularly if there is an environmental background. Herein, we demonstrate how the LOB-B and LOD-B, and thus the power of the test to account for false-positive and false-negative errors, is affected by increasing the number of technical replicates run per tank (e.g., Figure 4; Table 4, Table 5, and Table 6). Increasing the number of technical replicates can be achieved through increased qPCR replication in the lab, but also increasing the number of field sample replicates taken at the same station and time [51]. Increased replication from the sample scale (eight technical replicates) to the experimental tank or treatment scale (24 or more technical replicates) reduced the copy number at which a “Detect” determination can be made and helped resolve uncertain results such as the “Detect*” assessments in the 40 and 80 kL dilution treatments. This emphasizes the importance of appropriate sample design in field studies, including sufficient collection and replication of field blanks and field negative controls, and adequate numbers of samples collected per station at a given site and qPCR replicates run per sample. Analyzing detectability at the tank or treatment level (instead of sample level) is more applicable in a fisheries and wildlife management context, because site level presence or absence (e.g., stream, pool, lake) is often the fundamental question in environmental management and monitoring. Altering the threshold of evidence required for concluding site level presence is a consideration that will have management and legal implications, as endangered and invasive species are monitored with eDNA [16,17,26].

5. Conclusions

In summary, we used two controlled experiments at the Goldstream Hatchery in British Columbia to assess salmonid presence and abundance at high and low copy number, including how to determine an eDNA signal above the noise of an environmental background. The estimation of background eDNA signal in field studies and the integration of the background into the performance of assays, including the LOB-B and LOD-B that capture defined false-positive and negative rates, respectively, is an important advance that increases confidence in eDNA methods to confirm species presence when target species abundance is low or unknown. Improved field and laboratory methods and standardized performance measures of assays further validate eDNA monitoring as a reliable method for determining the distribution and abundance of biologically sensitive species and commercially valuable resources such as Pacific salmon.

Supplementary Materials

The following supporting information can be downloaded at: https://www.mdpi.com/article/10.3390/fishes7050266/s1, Figure S1: Sequence alignments of multiple species’ mt-nd1 genes at the forward primer, reverse primer, and probe regions of the eONKI4 assay. Zip file of data used in the present study.

Author Contributions

Conceptualization, M.D.H., J.C.M., B.F.K. and B.M.S.; Data curation, M.D.H., J.C.M., L.C.B., R.S., M.L.L. and C.C.H.; Formal analysis, M.D.H., J.C.M., M.J.A., L.C.B., R.S., M.L.L. and C.C.H.; Funding acquisition, M.D.H., B.F.K., B.M.S., M.L.L. and C.C.H.; Investigation, M.D.H., J.C.M., M.J.A., L.C.B., R.S., M.L.L. and C.C.H.; Methodology, M.D.H., J.C.M., M.J.A., L.C.B., M.L.L. and C.C.H.; Project administration, M.D.H. and C.C.H.; Software, M.L.L.; Supervision, M.D.H., B.M.S., M.L.L. and C.C.H.; Validation, M.D.H., J.C.M., M.J.A., R.S. and M.L.L.; Visualization, M.D.H., J.C.M., M.J.A., L.C.B., R.S., M.L.L. and C.C.H.; Writing–original draft, M.D.H., J.C.M., M.J.A., L.C.B., R.S., M.L.L. and C.C.H.; Writing–review and editing, M.D.H., J.C.M., M.J.A., L.C.B., R.S., B.F.K., B.M.S., M.L.L. and C.C.H. All authors have read and agreed to the published version of the manuscript.

Funding

Initial funding for data collection was provided by the Hakai Institute to support the graduate student project of JCM supervised by BMS and MDH in the School of Environmental Studies at the University of Victoria. The Ian McTaggart Cowan Professorship and an NSERC Discovery Grant (RGPIN 2017-04476) to BMS further supported this research during the data collection. Further funding was provided by a Mitacs Accelerate grant (IT09814) for JCM to BMS and CCH in partnership with Ecofish Research Ltd., and a Natural Sciences and Engineering Research Council of Canada (NSERC) Collaborative Research and Development Grant (CRDPJ 523633-18) to CCH and MLL, including student support for RS, in partnership with Ecofish Research Ltd. The project was also supported by Research & Development (R&D) funding to MDH and JCM by Ecofish Research Ltd.

Institutional Review Board Statement

All experiments involving fish were approved through the University of Victoria Animal Care Committee under the auspices of the Canadian Council on Animal Care (Protocol #2013-008).

Data Availability Statement

The data presented in the present study are provided in the supplementary material. The R code is freely available from Github at https://github.com/mlespera/eLowQuant-background.

Acknowledgments

We would like to thank Amber Messmer from the Koop lab at the University of Victoria for initial support in project development and PCR data analysis, and Peter McCully for support and use of the experimental tanks at the Goldstream Hatchery. Thanks also to Eric Peterson and many wonderful staff at the Hakai Institute for support in early phases of the project, and to staff at Ecofish Research Ltd. for support later in project implementation.

Conflicts of Interest

The authors declare no conflict of interest. The funders had no role in the design of the study; in the collection, analyses, or interpretation of data; in the writing of the manuscript; or in the decision to publish the results.

References

  1. Beja-Pereira, A.; Oliveira, R.; Alves, P.C.; Schwartz, M.K.; Luikart, G. Advancing ecological understandings through technological transformations in noninvasive genetics. Mol. Ecol. Resour. 2009, 9, 1279–1301. [Google Scholar] [CrossRef] [PubMed]
  2. Imbery, J.J.; Buday, C.; Miliano, R.C.; Shang, D.; Round, J.M.; Kwok, H.; Van Aggelen, G.; Helbing, C.C. Evaluation of gene bioindicators in the liver and caudal fin of juvenile Pacific coho salmon in response to low sulfur marine diesel seawater-accommodated fraction exposure. Environ. Sci. Technol. 2019, 53, 1627–1638. [Google Scholar] [CrossRef]
  3. Ficetola, G.F.; Miaud, C.; Pompanon, F.; Taberlet, P. Species detection using environmental DNA from water samples. Biol. Lett. 2008, 4, 423–425. [Google Scholar] [CrossRef] [PubMed]
  4. Levi, T.; Allen, J.M.; Bell, D.; Joyce, J.; Russell, J.R.; Tallmon, D.A.; Vulstek, S.C.; Yang, C.; Yu, D.W. Environmental DNA for the enumeration and management of Pacific salmon. Mol. Ecol. Resour. 2019, 19, 597–608. [Google Scholar] [CrossRef] [PubMed]
  5. Piaggio, A.J.; Engeman, R.M.; Hopken, M.W.; Humphrey, J.S.; Keacher, K.L.; Bruce, W.E.; Avery, M.L. Detecting an elusive invasive species: A diagnostic PCR to detect Burmese python in Florida waters and an assessment of persistence of environmental DNA. Mol. Ecol. Resour. 2014, 14, 374–380. [Google Scholar] [CrossRef]
  6. Rourke, M.L.; Fowler, A.M.; Hughes, J.M.; Broadhurst, M.K.; DiBattista, J.D.; Fielder, S.; Wilkes Walburn, J.; Furlan, E.M. Environmental DNA (eDNA) as a tool for assessing fish biomass: A review of approaches and future considerations for resource surveys. Environ. DNA 2022, 4, 3–33. [Google Scholar] [CrossRef]
  7. Spear, M.J.; Embke, H.S.; Krysan, P.J.; Vander Zanden, M.J. Application of eDNA as a tool for assessing fish population abundance. Environ. DNA 2020, 3, 83–91. [Google Scholar] [CrossRef]
  8. Thomsen, P.F.; Kielgast, J.; Iversen, L.L.; Wiuf, C.; Rasmussen, M.; Gilbert, M.T.; Orlando, L.; Willerslev, E. Monitoring endangered freshwater biodiversity using environmental DNA. Mol. Ecol. 2012, 21, 2565–2573. [Google Scholar] [CrossRef]
  9. Tillotson, M.D.; Kelly, R.P.; Duda, J.J.; Hoy, M.; Kralj, J.; Quinn, T.P. Concentrations of environmental DNA (eDNA) reflect spawning salmon abundance at fine spatial and temporal scales. Biol. Conserv. 2018, 220, 1–11. [Google Scholar] [CrossRef]
  10. Evans, N.T.; Shirey, P.D.; Wieringa, J.G.; Mahon, A.R.; Lamberti, G.A. Comparative cost and effort of fish distribution detection via environmental DNA analysis and electrofishing. Fisheries 2017, 42, 90–99. [Google Scholar] [CrossRef]
  11. Minamoto, T.; Yamanaka, H.; Takahara, T.; Honjo, M.N.; Kawabata, Z.i. Surveillance of fish species composition using environmental DNA. Limnology 2011, 13, 193–197. [Google Scholar] [CrossRef]
  12. Barnes, M.A.; Turner, C.R.; Jerde, C.L.; Renshaw, M.A.; Chadderton, W.L.; Lodge, D.M. Environmental conditions influence eDNA persistence in aquatic systems. Environ. Sci Technol. 2014, 48, 1819–1827. [Google Scholar] [CrossRef] [PubMed]
  13. Goldberg, C.S.; Turner, C.R.; Deiner, K.; Klymus, K.E.; Thomsen, P.F.; Murphy, M.A.; Spear, S.F.; McKee, A.; Oyler-McCance, S.J.; Cornman, R.S.; et al. Critical considerations for the application of environmental DNA methods to detect aquatic species. Methods Ecol. Evol. 2016, 7, 1299–1307. [Google Scholar] [CrossRef]
  14. Strickler, K.M.; Fremier, A.K.; Goldberg, C.S. Quantifying effects of UV-B, temperature, and pH on eDNA degradation in aquatic microcosms. Biol. Conserv. 2015, 183, 85–92. [Google Scholar] [CrossRef]
  15. Yates, M.C.; Cristescu, M.E.; Derry, A.M. Integrating physiology and environmental dynamics to operationalize environmental DNA (eDNA) as a means to monitor freshwater macro-organism abundance. Mol. Ecol. 2021, 30, 6531–6550. [Google Scholar] [CrossRef]
  16. Burian, A.; Mauvisseau, Q.; Bulling, M.; Domisch, S.; Qian, S.; Sweet, M. Improving the reliability of eDNA data interpretation. Mol. Ecol Resour 2021, 21, 1422–1433. [Google Scholar] [CrossRef]
  17. Kelly, R.P.; Port, J.A.; Yamahara, K.M.; Martone, R.G.; Lowell, N.; Thomsen, P.F.; Mach, M.E.; Bennett, M.; Prahler, E.; Caldwell, M.R.; et al. Environmental monitoring. Harnessing DNA to improve environmental management. Sci. Am. Assoc. Adv. Sci. 2014, 344, 1455–1456. [Google Scholar] [CrossRef]
  18. Bustin, S.A.; Benes, V.; Garson, J.A.; Hellemans, J.; Huggett, J.; Kubista, M.; Mueller, R.; Nolan, T.; Pfaffl, M.W.; Shipley, G.L.; et al. The MIQE guidelines: Minimum information for publication of quantitative real-time PCR experiments. Clin. Chem. 2009, 55, 611–622. [Google Scholar] [CrossRef]
  19. Forootan, A.; Sjoback, R.; Bjorkman, J.; Sjogreen, B.; Linz, L.; Kubista, M. Methods to determine limit of detection and limit of quantification in quantitative real-time PCR (qPCR). Biomol. Detect. Quantif. 2017, 12, 1–6. [Google Scholar] [CrossRef]
  20. Klymus, K.E.; Merkes, C.M.; Allison, M.J.; Goldberg, C.S.; Helbing, C.C.; Hunter, M.E.; Jackson, C.A.; Lance, R.F.; Mangan, A.M.; Monroe, E.M.; et al. Reporting the limits of detection and quantification for environmental DNA assays. Environ. DNA 2020, 2, 271–282. [Google Scholar] [CrossRef] [Green Version]
  21. Lesperance, M.L.; Allison, M.J.; Bergman, L.C.; Hocking, M.D.; Helbing, C.C. A statistical model for calibration and computation of detection and quantification limits for low copy number environmental DNA samples. Environ. DNA 2021, 3, 970–981. [Google Scholar] [CrossRef]
  22. Gagné, N.; Bernatchez, L.; Bright, D.; Côté, G.; Coulson, M.; Gurney, K.; Hanner, R.; Helbing, C.C.; Hobbs, J.; Hocking, M.; et al. Environmental DNA (eDNA) Reporting Requirements and Terminology; Canadian Standards Association: Toronto, ON, Canada, 2021; CSA W214:21; 31p. [Google Scholar]
  23. Doi, H.; Inui, R.; Akamatsu, Y.; Kanno, K.; Yamanaka, H.; Takahara, T.; Minamoto, T. Environmental DNA analysis for estimating the abundance and biomass of stream fish. Freshw. Biol. 2017, 62, 30–39. [Google Scholar] [CrossRef]
  24. Dejean, T.; Valentini, A.; Duparc, A.; Pellier-Cuit, S.; Pompanon, F.; Taberlet, P.; Miaud, C. Persistence of environmental DNA in freshwater ecosystems. PLoS ONE 2011, 6, e23398. [Google Scholar] [CrossRef] [PubMed]
  25. Kelly, R.P.; Port, J.A.; Yamahara, K.M.; Crowder, L.B. Using environmental DNA to census marine fishes in a large mesocosm. PLoS ONE 2014, 9, e86175. [Google Scholar] [CrossRef] [PubMed]
  26. Barnes, M.A.; Turner, C.R. The ecology of environmental DNA and implications for conservation genetics. Conserv. Genet. 2015, 17, 1–17. [Google Scholar] [CrossRef]
  27. Thomsen, P.F.; Willerslev, E. Environmental DNA—An emerging tool in conservation for monitoring past and present biodiversity. Biol. Conserv. 2015, 183, 4–18. [Google Scholar] [CrossRef]
  28. McKelvey, K.S.; Young, M.K.; Knotek, W.L.; Carim, K.J.; Wilcox, T.M.; Padgett-Stewart, T.M.; Schwartz, M.K. Sampling large geographic areas for rare species using environmental DNA: A study of bull trout Salvelinus confluentus occupancy in western Montana. J. Fish Biol. 2016, 88, 1215–1222. [Google Scholar] [CrossRef]
  29. Rees, H.C.; Baker, C.A.; Gardner, D.S.; Maddison, B.C.; Gough, K.C. The detection of great crested newts year round via environmental DNA analysis. BMC Res. Notes 2017, 10, 327. [Google Scholar] [CrossRef]
  30. Darling, J.A.; Jerde, C.L.; Sepulveda, A.J. What do you mean by false positive? Environ. DNA 2021, 3, 879–883. [Google Scholar] [CrossRef]
  31. Ficetola, G.F.; Taberlet, P.; Coissac, E. How to limit false positives in environmental DNA and metabarcoding? Mol. Ecol. Resour. 2016, 16, 604–607. [Google Scholar] [CrossRef] [Green Version]
  32. Lahoz-Monfort, J.J.; Guillera-Arroita, G.; Tingley, R. Statistical approaches to account for false-positive errors in environmental DNA samples. Mol. Ecol. Resour. 2016, 16, 673–685. [Google Scholar] [CrossRef] [PubMed]
  33. Sepulveda, A.J.; Hutchins, P.R.; Forstchen, M.; McKeefry, M.N.; Swigris, A.M. The Elephant in the Lab (and Field): Contamination in Aquatic Environmental DNA Studies. Front. Ecol. Evol. 2020, 8, 609973. [Google Scholar] [CrossRef]
  34. Prince, A.M.; Andrus, L. PCR: How to kill unwanted DNA. Biotechniques 1992, 12, 358–360. [Google Scholar] [PubMed]
  35. Walsh, D.A.; Zaikova, E.; Hallam, S.J. Large volume (20L+) filtration of coastal seawater samples. J. Vis. Exp. 2009, 28, 1161. [Google Scholar] [CrossRef] [PubMed]
  36. Jerde, C.L.; Mahon, A.R.; Chadderton, W.L.; Lodge, D.M. “Sight-unseen” detection of rare aquatic species using environmental DNA. Conserv. Lett. 2011, 4, 150–157. [Google Scholar] [CrossRef]
  37. Hobbs, J.; Round, J.M.; Allison, M.J.; Helbing, C.C. Expansion of the known distribution of the coastal tailed frog, Ascaphus truei, in British Columbia, Canada, using robust eDNA detection methods. PLoS ONE 2019, 14, 16. [Google Scholar] [CrossRef]
  38. Veldhoen, N.; Hobbs, J.; Ikonomou, G.; Hii, M.; Lesperance, M.; Helbing, C.C. Implementation of novel design features for qPCR-based eDNA assessment. PLoS ONE 2016, 11, e0164907. [Google Scholar] [CrossRef]
  39. Lavagnini, I.; Magno, F. A statistical overview on univariate calibration, inverse regression, and detection limits: Application to gas chromatography/mass spectrometry technique. Mass Spectrom. Rev. 2007, 26, 1–18. [Google Scholar] [CrossRef]
  40. Toms, J.D.; Lesperance, M. Piecewise regression: A tool for identifying ecological thresholds. Ecology 2003, 84, 2034–2041. [Google Scholar] [CrossRef]
  41. Rosenfeld, J.; Porter, M.; Parkinson, E. Habitat factors affecting the abundance and distribution of juvenile cutthroat trout (Oncorhynchus clarki) and coho salmon (Oncorhynchus kisutch). Can. J. Fish Aquat. Sci. 2000, 57, 766–774. [Google Scholar] [CrossRef]
  42. Wilcox, T.M.; McKelvey, K.S.; Young, M.K.; Sepulveda, A.J.; Shepard, B.B.; Jane, S.F.; Whiteley, A.R.; Lowe, W.H.; Schwartz, M.K. Understanding environmental DNA detection probabilities: A case study using a stream-dwelling char Salvelinus fontinalis. Biol. Conserv. 2016, 194, 209–216. [Google Scholar] [CrossRef]
  43. Curtis, A.N.; Tiemann, J.S.; Douglass, S.A.; Davis, M.A.; Larson, E.R.; Yang, J. High stream flows dilute environmental DNA (eDNA) concentrations and reduce detectability. Divers. Distrib. 2020, 27, 1918–1931. [Google Scholar] [CrossRef]
  44. Troth, C.R.; Sweet, M.J.; Nightingale, J.; Burian, A. Seasonality, DNA degradation and spatial heterogeneity as drivers of eDNA detection dynamics. Sci. Total Environ. 2021, 768, 144466. [Google Scholar] [CrossRef] [PubMed]
  45. Collins, R.A.; Wangensteen, O.S.; O’Gorman, E.J.; Mariani, S.; Sims, D.W.; Genner, M.J. Persistence of environmental DNA in marine systems. Commun. Biol. 2018, 1, 185. [Google Scholar] [CrossRef] [PubMed]
  46. Saito, T.; Doi, H. A model and simulation of the influence of temperature and amplicon length on environmental DNA degradation rates: A meta-analysis approach. Front. Ecol. Evol. 2021, 9, 623831. [Google Scholar] [CrossRef]
  47. Eichmiller, J.J.; Best, S.E.; Sorensen, P.W. Effects of temperature and trophic state on degradation of environmental DNA in lake water. Environ. Sci. Technol. 2016, 50, 1859–1867. [Google Scholar] [CrossRef]
  48. Seymour, M.; Durance, I.; Cosby, B.J.; Ransom-Jones, E.; Deiner, K.; Ormerod, S.J.; Colbourne, J.K.; Wilgar, G.; Carvalho, G.R.; de Bruyn, M.; et al. Acidity promotes degradation of multi-species environmental DNA in lotic mesocosms. Commun. Biol. 2018, 1, 4. [Google Scholar] [CrossRef]
  49. Tsuji, S.; Ushio, M.; Sakurai, S.; Minamoto, T.; Yamanaka, H. Water temperature-dependent degradation of environmental DNA and its relation to bacterial abundance. PLoS ONE 2017, 12, e0176608. [Google Scholar] [CrossRef]
  50. Mauvisseau, Q.; Davy-Bowker, J.; Bulling, M.; Brys, R.; Neyrinck, S.; Troth, C.; Sweet, M. Combining ddPCR and environmental DNA to improve detection capabilities of a critically endangered freshwater invertebrate. Sci. Rep. 2019, 9, 14064. [Google Scholar] [CrossRef]
  51. Buxton, A.; Matechou, E.; Griffin, J.; Diana, A.; Griffiths, R.A. Optimising sampling and analysis protocols in environmental DNA studies. Sci. Rep. 2021, 11, 11637. [Google Scholar] [CrossRef]
  52. Ficetola, G.F.; Pansu, J.; Bonin, A.; Coissac, E.; Giguet-Covex, C.; De Barba, M.; Gielly, L.; Lopes, C.M.; Boyer, F.; Pompanon, F.; et al. Replication levels, false presences and the estimation of the presence/absence from eDNA metabarcoding data. Mol. Ecol. Resour. 2015, 15, 543–556. [Google Scholar] [CrossRef] [PubMed]
  53. Chambert, T.; Miller, D.A.W.; Nichols, J.D. Modeling false positive detections in species occurrence data under different study designs. Ecology 2015, 96, 332–339. [Google Scholar] [CrossRef] [PubMed]
Figure 1. Schematic representations of the two experiments performed in 10 kL tanks at the Goldstream Hatchery. (A) a density experiment where pre-fish negative controls were collected from each tank prior to addition of juvenile coho salmon at increasing densities of 1, 2, 4, 8, 16, 32 and 65 fish per tank at 24 h intervals; and (B) a dilution experiment where three coho salmon were removed from the 10 kL tank after a 9 d equilibration and samples taken at time zero (10 kL) and after cumulative flow-through volumes of 20, 40, 80, 160 and 1000 kL. Four 10 kL tanks were used in each experiment. Collection times of 2 L water samples for eDNA analysis are indicated by green arrows.
Fishes 07 00266 g001
Figure 2. Calibration curves for the gBlock® data for the coho salmon assay eONKI4. (A) Weighted linear regression model for high copy number concentrations where 100% of technical replicates returned a detection in the form of a Ct value. This occurred at 20 copies/reaction. To facilitate comparison with the low copy number graph, transformed Ct (50-Ct) are plotted. (B) Maximum likelihood fit model using eLowQuant Binomial–Poisson low copy number concentrations of ≤ 4 copies/reaction.
Fishes 07 00266 g002
Figure 3. Density experiment results from 10 kL tanks at the Goldstream hatchery showing observed and predicted copy number (log2 copy number/L) for the coho salmon assay eONKI4 versus juvenile coho salmon biomass (log210−4 g/L).
Fishes 07 00266 g003
Figure 4. Illustration of the impact of technical replicate number of either (A) eight or (B) 24 on the interpretation of “Detect” and “No Detect” in the context of the dilution experiment results from 10 kL tanks at the Goldstream hatchery showing predicted copy number (log2 copies per L) for the coho salmon assay eONKI4 versus volume of water diluted (log2 kL). The bent cable model curve (red line) is shown with the estimated 95% confidence interval shaded in grey and the estimated background copy number/L (“Background”) indicated by the horizontal blue long dashed line. The background-corrected LOD and LOB (LOD-B and LOB-Bcn, respectively) were calculated for eight or 24 technical replicates. The log2 LOD-B is shown as a blue dotted horizontal line. The log2 LOB-Bcn (blue dot-dashed horizontal line) is the LOB-B converted to copy number/L. The rectangles to the right of the graphs indicate the detection interpretation zones. Detect* refers to possible detection but requires more data to determine.
Fishes 07 00266 g004
Table 1. Nucleotide sequences for the qPCR-based eONKI4 eDNA tool comprised of primers and a probe for coho salmon. The amplicon sequence for the creation of the synthetic DNA sequence is included. FAM, reporter dye; ZEN/Iowa Black FQ, quencher.
Sequence TypeSequence (5′→3′)
Forward PrimerCCCTTTTGACCTCACAGAG
Reverse PrimerGGTTCAGGGCAGTTAGTTCT
ProbeFAM- TGCCCTCTTTTTCCTAGCCGAGTACG-ZEN/Iowa Black FQ
AmpliconCCCTTTTGACCTCACAGAGGGGGAGTCAGAATTAGTCTCCGGATCAATGTAGAA TATGCTGGAGGGCCCTTTGCCCTCTTTTTCCTAGCCGAGTACGCTAACATCCTTCTAA TAAATACACTCTCAGCCATCCTATTCCTAGGCGCATCCCACATCCCCGCTTTAC CAGAACTAACTGCCCTGAACC
Table 2. Names and abbreviations of species used for eONKI4 coho salmon eDNA assay validation. All species listed were validated with 25 technical replicates.
Species NameCommon NameSpecies AbbreviationPercent Detection by eONKI4
Oncorhynchus kisutchCoho SalmonONKI100%
Oncorhynchus tschawytschaChinook SalmonONTS0%
Oncorhynchus clarkiiCutthroat TroutONCL0%
Oncorhynchus gorbuschaPink SalmonONGO0%
Oncorhynchus ketaChum SalmonONKE0%
Oncorhynchus mykissRainbow TroutONMY0%
Oncorhynchus nerkaSockeye SalmonONNE0%
Thymallus arcticusArctic GraylingTHAR0%
Lithobates (Rana) catesbeianaAmerican BullfrogLICA0%
Homo sapiensHumanHOSA0%
Table 3. Assay limits of detection (LOD) in copies per reaction and their lower and upper confidence limits for various numbers of technical replicates for the eONKI4 coho salmon assay in a controlled lab setting. The LOB for the assay was zero.
eONKI4 Limit of DetectionNumber of Technical Replicates
38162432486496
LOD1.150.430.210.140.110.070.050.04
LOD_lower0.850.320.160.110.080.050.040.03
LOD_upper1.770.660.330.220.170.110.080.06
Table 4. The limit of blank with background (LOB-B, LOB-Bcn) (number of hits, and copies per reaction), and limit of detection with background (LOD-B) (copies per reaction) for given numbers of technical replicates for the coho salmon assay eONKI4 as performance measures. The LOB-B and LOD-B were determined from the background coho salmon eDNA signal in the Goldstream Hatchery experimental tanks. The lower/upper confidence limits for LOD-B are shown. 1 Binomial scale, 2 Copy number scale.
LimitsNumber of Technical Replicates
3816243240486496
LOB-B 1123345579
LOB-Bcn 20.460.330.240.150.150.150.130.130.11
LOD-B 22.291.050.620.400.350.320.270.250.20
LOD-B_lower 21.690.780.460.290.260.240.200.180.15
LOD-B_upper 23.551.620.960.610.540.500.410.390.30
Table 5. The interpretation of Detect or No Detect of coho salmon DNA from eONKI4 in the dilution experiment at the Goldstream Hatchery in the presence of an environmental background eDNA signal. One Detect* was found at the tank level in the 80 kL treatment, which suggest that target DNA may be present, but more sampling is recommended to confirm the result. The remaining tanks at 80 kL were assessed as No Detect, which leads to a treatment level conclusion of No Detect.
Dilution Volume (kL) TreatmentTank
Number
Transformed Ct EstimateEstimated Number of Copies per
Reaction
Number of Samples per TankNumber of Technical
Replicates per Tank
Number of
Detects for All Technical
Replicates
Tank
Detection
Treatment
Detection
10116.3221.543232DetectDetect
216.8329.743232Detect
315.7414.832424Detect
417.2037.632424Detect
20115.7314.721616DetectDetect
216.0017.432424Detect
316.0017.532424Detect
415.9817.332424Detect
4015.930.7032411DetectDetect
213.473.6432423Detect
313.662.8532422Detect
48.071.1232415Detect
8010.410.0493241No DetectNo Detect
20.650.1003242No Detect
31.990.2093244Detect*
40.500.0493241No Detect
16010.000.0003240No DetectNo Detect
20.340.0493241No Detect
30.000.0003240No Detect
41.490.1533243No Detect
100010.000.0004320No DetectNo Detect
20.460.0493241No Detect
30.850.1534324No Detect
40.440.0744322No Detect
Table 6. The interpretation of Detect or No Detect of coho salmon DNA using the eONKI4 assay in the dilution experiment at the Goldstream Hatchery in the presence of an environmental background eDNA signal for the 40 kL dilution volume only. Several Detect* were found at the sample level, which suggest that target DNA may be present, but more sampling is recommended to confirm the result. The remaining samples in each tank at 40 kL were also assessed as either Detect or Detect*, which leads to a tank level conclusion of Detect for all tanks.
Tank NumberSample NumberTransformed
Ct Estimate
Estimated Copy Numbers per
Reaction
Number of Technical
Replicates per Sample
Number of Detects per
Sample
Sample
Detection
Tank
Detection
116.640.7984Detect*Detect
24.480.5483Detect*
36.660.7984Detect*
2111.892.3887DetectDetect
214.516.7588Detect
314.004.9088Detect
3114.255.7588DetectDetect
216.0417.9988Detect
310.671.5986Detect
4111.542.3887DetectDetect
23.160.3382Detect*
39.511.5986Detect
Publisher’s Note: MDPI stays neutral with regard to jurisdictional claims in published maps and institutional affiliations.

