Article

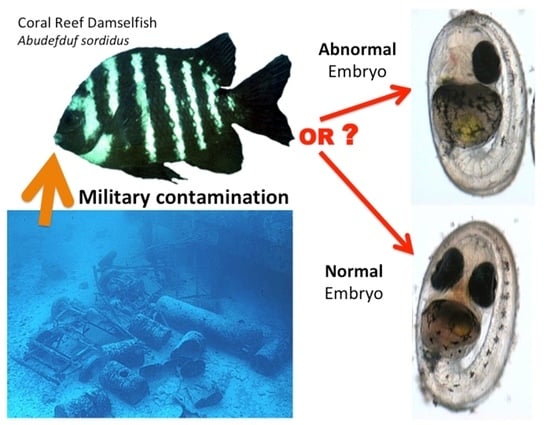
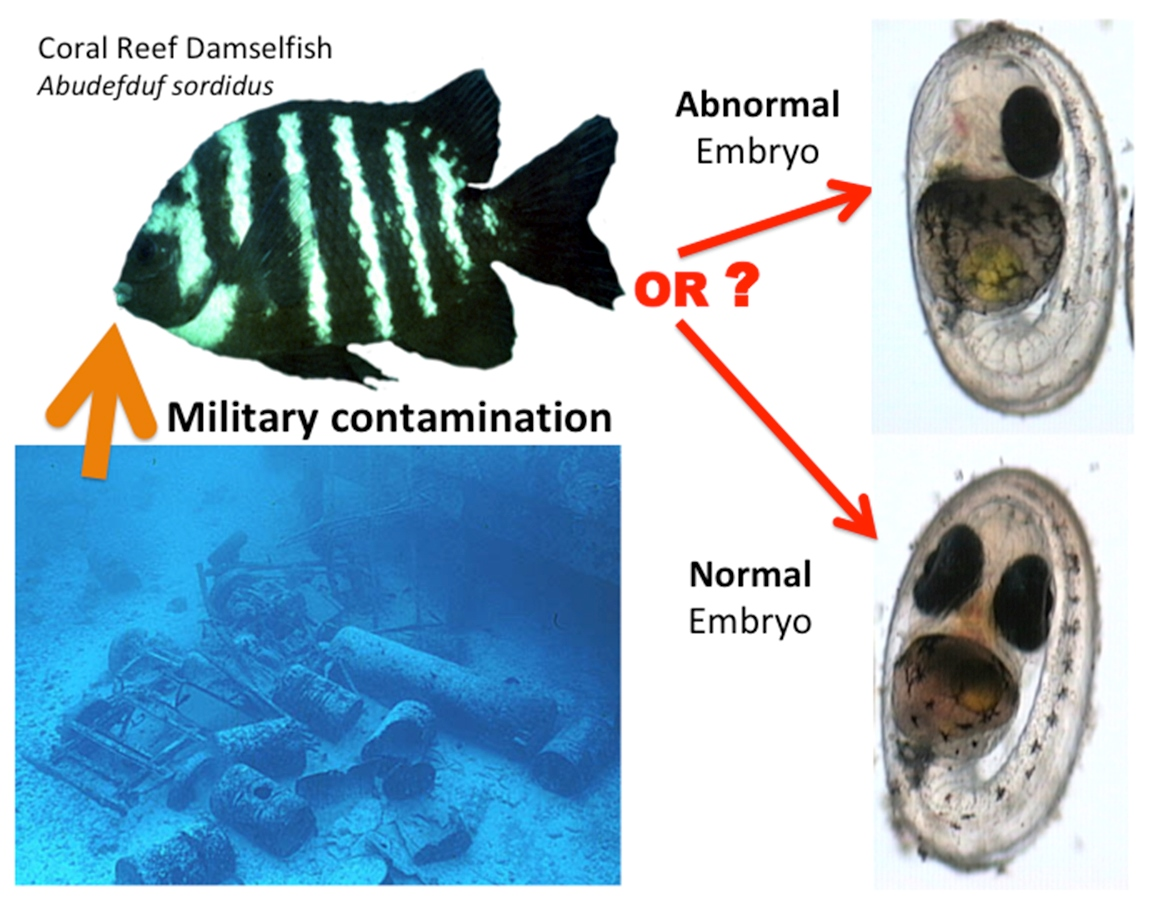
Damselfish Embryos as a Bioindicator for Military Contamination on Coral Reefs at Johnston Atoll, Pacific Ocean

by
Lisa Kerr Lobel
1,2 and
Phillip S. Lobel
2,*
1
Department of Science, Middlesex Community College, 591 Spring Rd., Bedford, MA 01730, USA
2
Department of Biology, Boston University, 5 Cummington Mall, Boston, MA 02215, USA
*
Author to whom correspondence should be addressed.
Fishes 2022, 7(2), 55; https://doi.org/10.3390/fishes7020055
Submission received: 16 December 2021 / Revised: 14 February 2022 / Accepted: 21 February 2022 / Published: 26 February 2022
(This article belongs to the Section Biology and Ecology)

Abstract

:
This study investigated the association between sediment contamination, PCB accumulation in adult nesting males and the occurrence of embryonic abnormalities in the damselfish, Abudefduf sordidus, from two sites with high PCB contamination and three “reference” sites (contaminants very low or not measurable) within Johnston Atoll, Central Pacific Ocean. Developmental abnormalities were assessed in damselfish embryos collected in the field during four natural spawning seasons (1996, 1998, 1999, and 2001). Laboratory incubations of abnormal embryos demonstrated that the observed abnormalities were lethal. PCBs were measured in fish collected in three years. Mean whole-body concentrations of total PCBs ranged from 364.6 to 138,032.5 ng/g lipid. A significant residue–effect relationship was found between total PCB concentration and embryo abnormalities. The occurrence of embryo abnormalities was positively related to fish PCB concentration (other contaminants were also evaluated including metals and dioxins). This study demonstrates the utility of using damselfish embryos as a bioindicator tool for monitoring coral reefs. It also provides baseline-monitoring criteria and evaluates sediment quality benchmarks used for ecological risk assessments on coral reefs.

Graphical Abstract

1. Introduction

Aquatic organisms are exposed to multiple causes of stress due to both natural and anthropogenic changes. Their responses to these perturbations are the result of integrated responses to both direct and indirect anthropogenic impacts and natural environmental stress. Interpreting and evaluating the effects of anthropogenic stresses on fishes in an inconstant environment are difficult. Stressors vary both spatially and temporally and may act synergistically or cumulatively with natural stressors [1].

1.1. Biomonitoring in Coral Reef Habitats

Assessing potential impacts of chemical contaminants in coral reef environments has been difficult due to a lack of baseline-monitoring criteria as well as appropriate benchmarks for risk assessment [2]. It is not known whether tropical organisms respond to xenobiotics in a similar manner or at similar concentrations as temperate organisms [3]. While there are many, extensive, coral reef monitoring programs, most have quantified ecological responses such as trends in coral cover and diversity but do not quantify specific stressors [4]. Therefore, knowledge of concentrations in the field at which adverse effects are observed is limited [4].
An appropriate indicator of coral reef health should respond to the same stressors as the framework builders (corals themselves) but should be more sensitive as revealed by an easily quantified response [5]. Proposed bioindicators for monitoring the health of coral reefs have included monitoring species abundance and distribution of: stomatopods [5], coral-associated organisms such as butterflyfishes [6,7], larval fish assemblages [8], and the sessile reef community as a whole [9].
The majority of these proposed bioindicators monitor pollution effects at the population or community level of biological organization. Stochastic processes, inherent in natural systems, make monitoring population-level processes such as changes in abundance, presence/absence of individuals, or species richness potentially misleading [10] or insensitive to detecting pollution-induced changes [11,12]. However, biochemical markers, reproductive indices, fecundity and embryo/larval effects are more sensitive to environmental changes and easier to measure than changes in assemblages or populations [13].
The early life stages of fishes have been widely used in both laboratory and field assessments of the potential toxicity of chemical contaminants. In the field, abnormal or impaired fish embryos or larvae collected from the sea surface micro-layer have been proposed as indicators of contaminant effects [14,15,16,17,18,19]. While the results of laboratory toxicity tests cannot be directly extrapolated to field situations [20,21,22,23], the link between cause and effect is well established. The difficulty with large-scale field studies is demonstrating a direct link between the proposed cause (contaminants) and the observed effect.
In coral reef systems, measuring the occurrence of embryonic abnormalities in damselfish embryos has several advantages over other proposed methods for assessing the biological effects of pollutants. Damselfishes (Pomacentridae) are numerous and conspicuous inhabitants of coral reefs throughout all tropical seas [24]. A large omnivorous pomacentrid, such as Abudefduf sordidus, has the potential to accumulate contaminants since it ingests sediments along with its diet of benthic invertebrates and algae [25,26]. Pomacentrids are territorial and thus have limited home ranges, which allows for a finer resolution in pollution studies. Their demersal spawning habit allows for the easy collection of embryos and larvae. Males spawn repeatedly in the same nest sites so that individuals can be identified and followed over time. The reproductive and feeding habits of Abudefduf sordidus have been previously described [27,28,29,30]. Comparative data on spawning patterns of other damselfishes are available since there are many studies on diel and lunar spawning patterns, as well as clutch loss due to filial cannibalism (see [30]). Comparative data on embryo development in two other Abudefduf species have also been reported [31,32].

1.2. PCBs

The primary contaminant of concern in this study were PCBs. Polychlorinated biphenyls (PCBs) contain a mixture of 209 PCB congeners varying in chlorine content from 20 to 60%. They were used extensively from the 1930s to the 1970s in heat transfer systems, hydraulics/lubricants, transformers, capacitors, plasticizers and petroleum additives [33]. Production was reduced and eventually banned when accumulation in the environment was discovered.
PCBs can have adverse effects in the early life stages of fishes as well as in adults [33,34]. Reproductive processes and behaviors may be affected since PCBs decrease circulating levels and affect metabolism of steroid hormones [35,36], potentially resulting in the lower gonadosomatic indices (gonad/body weight). Abnormally shaped or smaller oocytes or premature vitellogenesis found in fishes exposed to PCBs [37,38] may ultimately affect development of the embryo. PCBs concentrated in the liver of adult fish are incorporated into reproductive tissues, potentially causing embryo toxicity directly [39,40,41]. This toxicity may take the form of embryonic defects, larval defects or reduced hatching success as has been demonstrated in both wild and laboratory exposed fishes [42,43,44,45,46,47,48].
Johnston Atoll is a tropical atoll located approximately 800 miles southwest of the main Hawaiian Islands. The atoll was a US military base jointly managed by the US Air Force, the US Army and as a National Wildlife Refuge by the US Fish and Wildlife Service. Marine sediments from localized areas of the lagoon contained high concentrations of PCB [49,50]. The commonly used screening-level ecological effects evaluation, as defined in the ecological risk assessment process [22,23,51], was applied. The ER-L and ER-M sediment quality guidelines roughly correspond to a 10% and 50% probability of toxicity and since PCB concentrations exceeded these guidelines, there were concerns regarding adverse effects in resident biota. However, the validity of using sediment quality guidelines based on studies of temperate organisms for management decisions in tropical regions is unclear. Additionally, categorizing sediments as toxic based on ER-L values alone is misleading since these values are not thresholds, but concentrations on a continuum roughly relating bulk chemistry with toxicity [52].
The military base at Johnston Atoll was demolished and closed in 2004. No further sampling of fishes or underwater contaminants has been conducted since this study [50].

1.3. Study Objectives

The first objective of this field study was to determine whether increased levels of adverse biological effects were measurable in fish at PCB-contaminated sites compared to reference sites (with very low or non-detectable levels). Developmental abnormalities in damselfish embryos were used as the measurement endpoint. In order to determine if the measurement endpoint (abnormalities) was, in fact, lethal, laboratory incubations were conducted to examine survivorship.
The second objective was to examine the relationship between PCB levels in fish tissue and the level of abnormalities observed. This was accomplished by monitoring embryonic abnormalities from nests of damselfish spawning in colonies that occur in both PCB-contaminated and the significantly less contaminated “reference” sites.
The third objective was to examine variability in embryonic abnormalities and PCB concentrations within and between sites over several years in order to report baseline levels of damselfish embryonic abnormalities at the reference sites as compared to levels found at the highly contaminated sites.
The overall goal was to develop a screening indicator for coral reefs field studies which can be used a biological indicator to help guide sediment sampling strategies to assess contaminant levels.

2. Materials and Methods

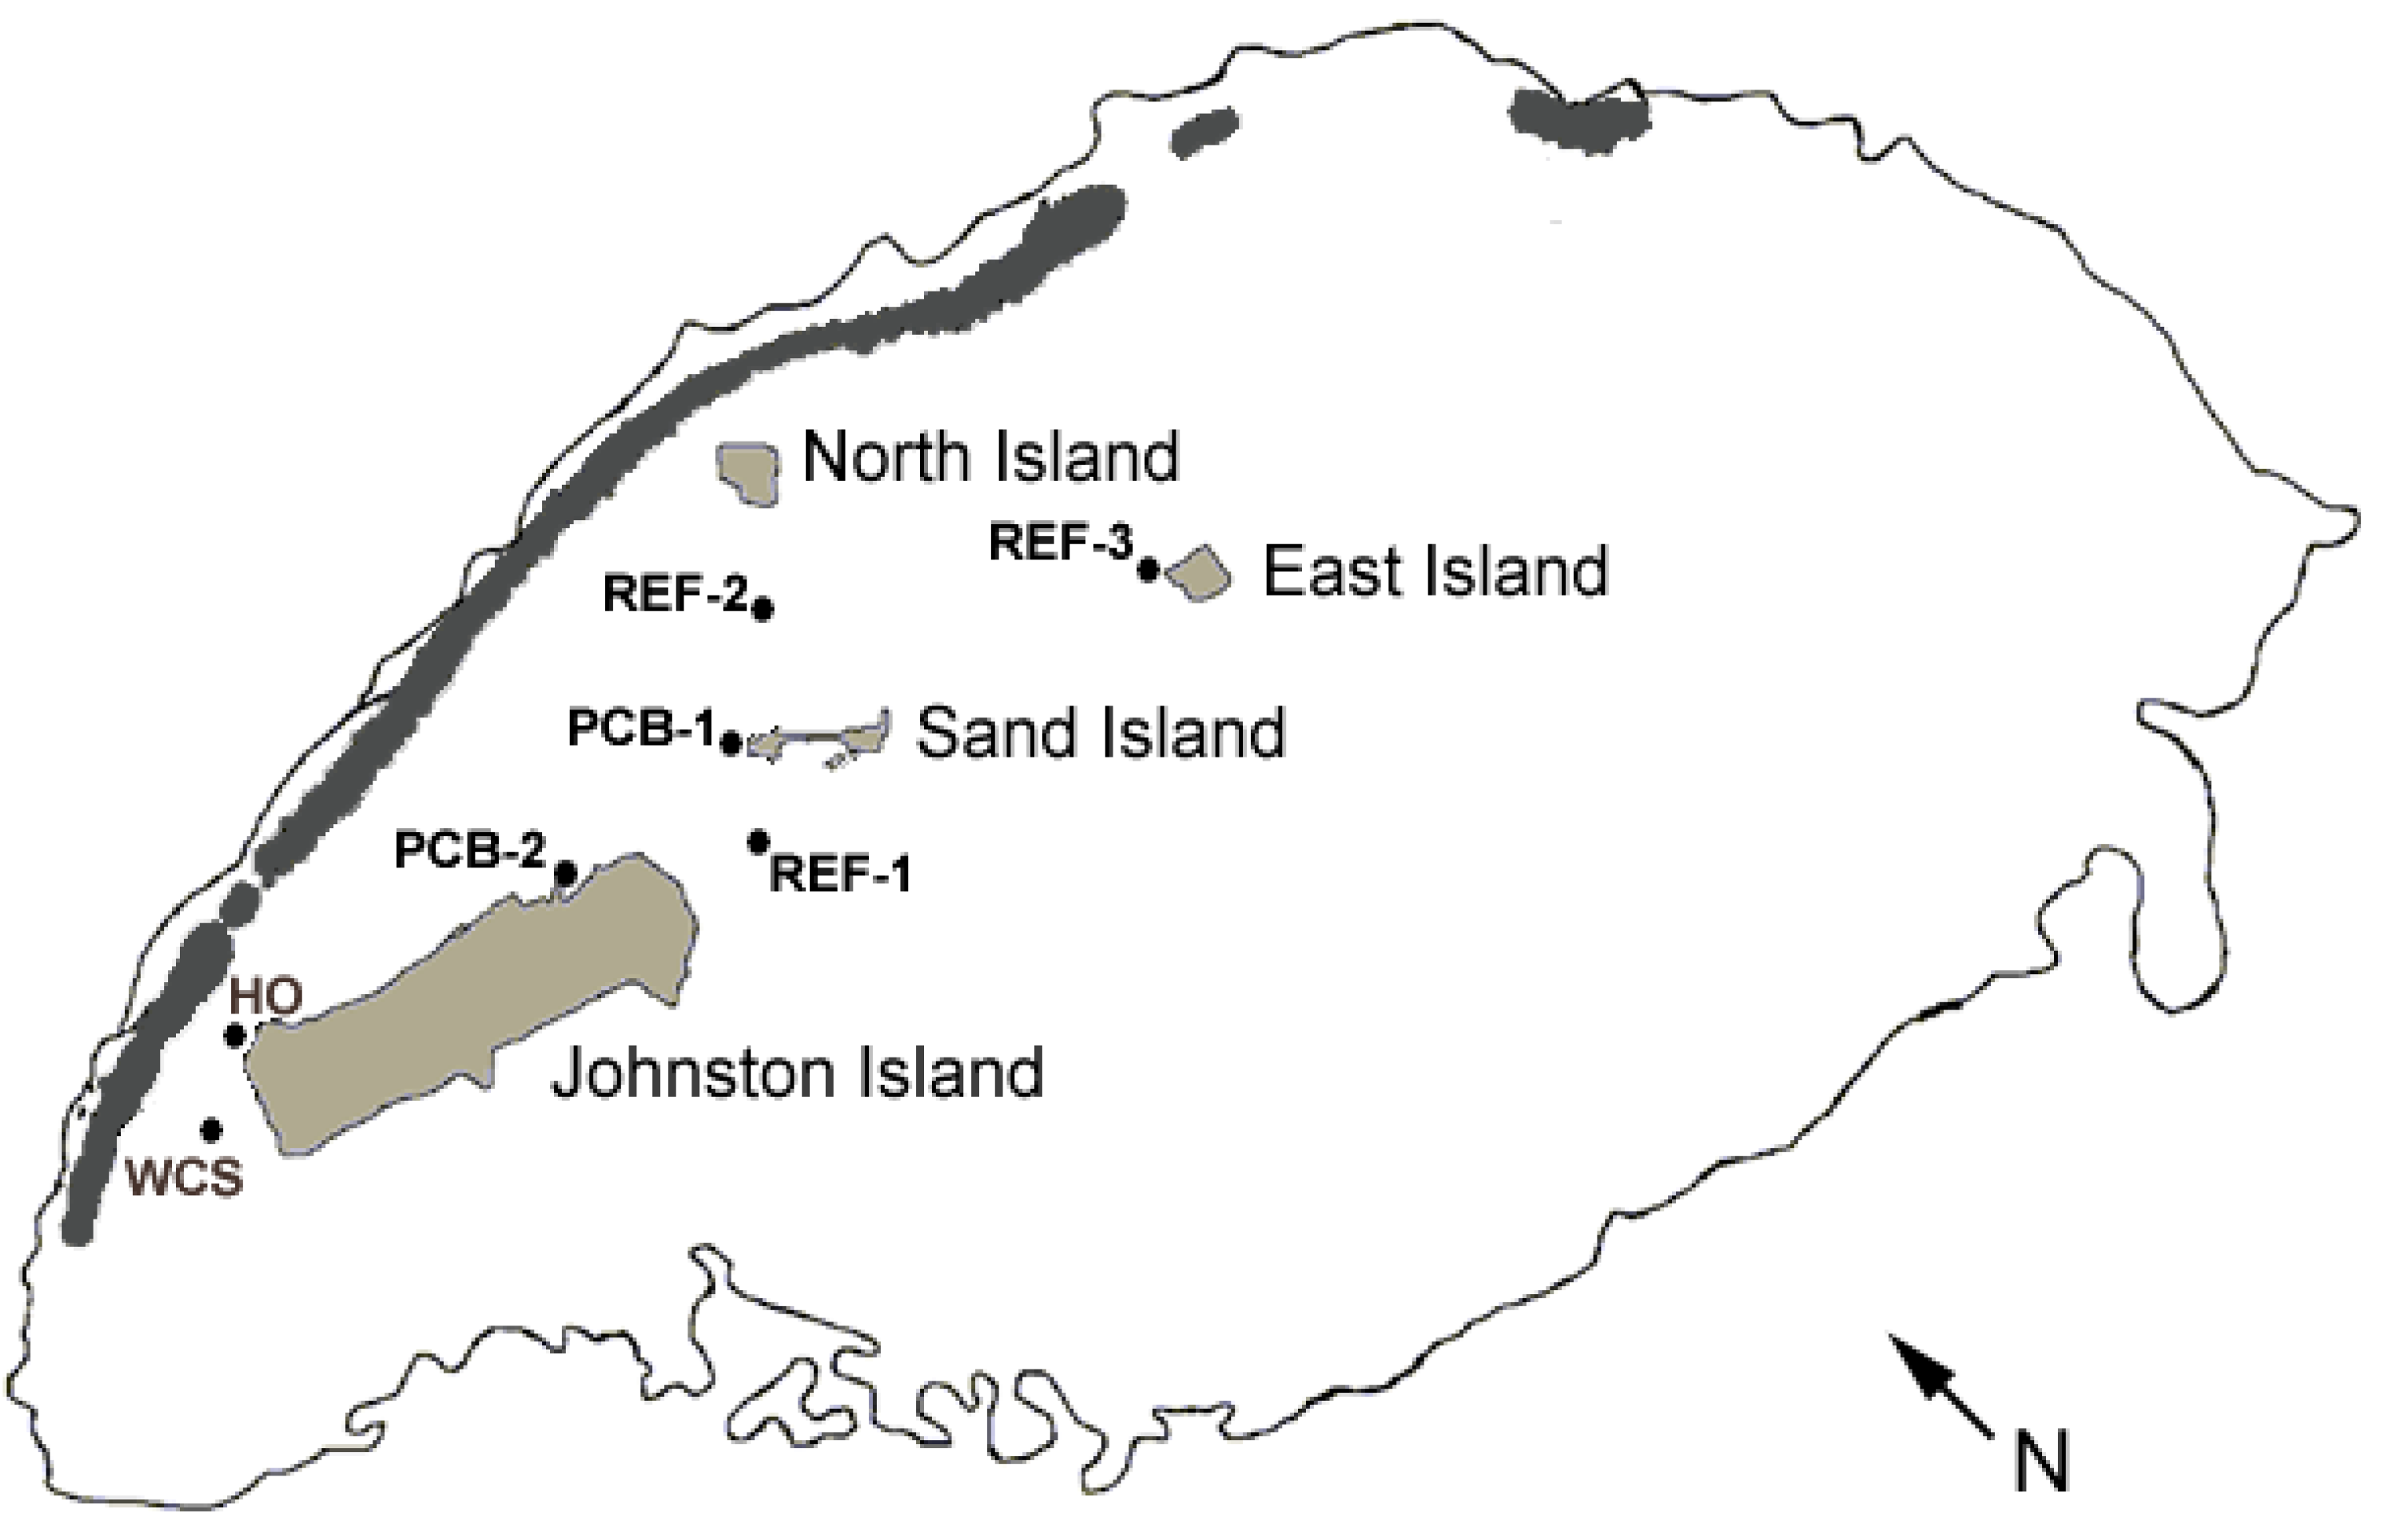
2.1. Study Site and Study Organism

Johnston Atoll (16°46′ N, 169°30′ W) is located approximately 800 miles southwest of Hawaii [52]. The atoll covers an area of approximately 39,000 acres with emergent reef only along its northern border. The shallow lagoon is dominated by the tabletop coral, Acropora cytherea, and contains a limited number of habitat types. The atoll contains four islands, two of which are completely artificial and the other two had been extensively modified and expanded. The marine fauna is relatively depauperate (305 species of fishes and 31 species of corals) most likely due to the atoll’s limited size and number of habitats [53,54,55,56].
Various types of sediment contamination occur in different localized areas throughout the lagoon [50,57]. Organochlorines including polychlorinated biphenyls, polychlorinated dibenzo-p-dioxins and dibenzofurans were main contaminants of concern due to their persistence, ability to accumulate in top predators, and their potential toxicity. Sites contaminated with polychlorinated biphenyls (PCBs) used in this study were found in two areas of the lagoon, the west end of Sand Island (PCB-1) and in the Navy pier area (PCB-2). Transformers and other discarded electrical equipment were the source of PCBs in Sand Island sediments while a leaking underground storage tank containing fuel oil contaminated with PCBs resulted in contamination at the Navy pier site. In other areas of the lagoon, PCDD/PCDFs were spilled into the area off of the former herbicide orange (HO, also known as “agent orange”) storage site from leaking HO containers. Plutonium from aborted atmospheric nuclear tests is also of concern for marine organisms. The distribution of plutonium within the lagoon is for the most part unknown. Other contaminants found in the lagoon include metals and polycyclic aromatic hydrocarbons. For details on these sites, see [49,50,53,56,57].
The sites within the lagoon chosen for this study were defined by the levels of PCB contamination present (Table 1). The initial study, conducted during 1996 and 1998, encompassed two sites, one with PCB contamination (PCB-1) and another nearby site with no known PCB contamination (REF-1). The study was expanded when PCB contamination was discovered at a second site (PCB-2). Two additional reference sites (REF-2, REF-3) were added to examine inter-site variability in 1999 and 2001 (Figure 1). An additional site off of the former herbicide orange storage site (HO) was also added in 1999. Even though sediments at the HO site contained low levels of PCBs, some samples contained polychlorinated dibenzo-p-dioxins and furans exceeding screening levels. No nests were found at the HO site in 1999 and very few nests were found in 2001.
The blackspot sergeant major damselfish, Abudefduf sordidus, is found throughout the Indo-west Pacific [55]. It is a large benthic omnivore that ingests sediment along with its diet of algae and small invertebrates [56]. Adults are not sexually dimorphic and can only be distinguished by behavior in the field. Like other damselfishes, A. sordidus spawns in demersal nests with parental care provided by the male [30]. A female leaves an average clutch of between 70,000 to 100,000 embryos in a male’s nest and a nest may contain clutches from multiple females [27,30]. Spawning at Johnston Atoll begins around late February to early March and peaks in mid to late April. A clutch spawned by one female is found in a monolayer and can be distinguished from other clutches spawned on different days by location within the nest and/or differences in color as development proceeds. Within a clutch, development is synchronous. Other aspects of this species applicability to being a key indicator species by using their embryos have been reviewed [25,26,29]. A. sordidus is a species where the males are site specific and very territorial over their nesting spot. Females reside on reefs nearby and often occur in small groups. Females are locally resident to a home reef and are not known to wander far; thus, it is unlikely that the females in our study moved between the different study sites. Study sites were separated by deep channels and/or sand flats, which these fishes would unlikely move across due to exposure to predators.

2.2. Data and Sample Collection

Surveys for newly spawned clutches were conducted during the peak-spawning season (March–June). Surveys were conducted daily (1996, 1998) or on alternate days (1999, 2001). Data collected during each survey included presence, number and size of clutches (l × w). A clutch was defined as a continuous mass of embryos of the same developmental stage, presumably spawned by one female. Embryo samples were collected by scraping embryos from the nest substrate into labeled 50 mL sample tubes. The tube was scraped through the nest for at least 20 cm during which thousands of embryos were collected in a single swath. Tubes were sealed underwater and taken back to the laboratory. From each tube, we randomly extracted “a sample” which contained approximately 200 embryos from a specific clutch within a specific nest. In the laboratory, embryos were placed in 500 mL Nalgene jars with fresh seawater until observation. Embryos were inspected using a dissecting microscope with transmitted light at 45× to 70× magnification. Developmental stage, yolk color, and the number abnormal or dead were recorded for approximately 200 embryos from each sample (i.e., the tube containing a few thousand embryos scrapped direct from the nest).
Samples from all new clutches were examined for developmental defects within a few hours of collection. Normal and abnormal development was determined by observation and comparison with diagrams, photographs and descriptions from the literature [31,32,40,58,59,60]. Since development within a clutch is synchronous, an embryo was considered defective if its developmental stage was grossly different from the developmental stage of other embryos in the sample or if there was no morphological differentiation observed in the embryo. Embryos damaged by sampling were detected by gently squeezing the embryo with forceps. An undamaged embryo was firm and did not have any yolk material in the perivitelline space. In contrast, a damaged embryo would remain misshapen if squeezed or would squirt yolk material. Damaged embryos were not included in the total counts. Dead embryos were also not included in the overall embryo counts since it was impossible to determine whether the cause of death was due to damage during collection or due to abnormalities that might have been present at an earlier stage.
Adult fish were collected by spear at the end of the spawning season in 1996, 1999 and 2001 for chemical analysis. We targeted the territorial resident males and any nearby females. Each specimen was weighed and measured (SL). Sex was determined by gonadal examination. The gonadosomatic (gonad weight/body weight × 100) and hepatosomatic (liver weight/body weight × 100) indices, and gut contents were examined for 2001 fish. Whole-fish PCB concentrations were determined. In addition, gonads with sufficient mass were analyzed for PCBs in 1996 (PCB-1 n = 4, REF-1 n = 2). In 1999, two females observed spawning were collected to determine their PCB body burden, concentration in their ovaries, and concentration in the embryos. Embryo samples were also collected for PCB analysis. In 2001, analyses included metals and PCDD/Fs in addition to PCBs to determine levels of other potential contaminants in fish tissues.

2.3. Embryo Incubations

Incubation plates were constructed by gluing the bottom one inch of plastic test tubes to a labeled grid drawn on a flat piece of PVC. The tubes were tall enough to keep the embryos from moving around but short enough to allow for good water exchange. An incubation plate was placed in an aerated five-gallon aquarium. Seawater was maintained at the ambient temperature observed during dives with an aquarium heater and was changed with each round of embryo incubations (<every five days). When an abnormal embryo was observed, it was paired with another embryo from the same clutch that appeared normal and placed in an incubation tube. In addition, two other normal embryos were placed in a separate tube. These normal embryos served as controls for survival. Two (i.e., duplicate) normal controls were used in the event that a dying abnormal embryo infected the normal embryo with fungus.
Each embryo pair was photographed and checked daily. Survival to hatching was the measurement endpoint. Therefore, abnormalities were considered lethal if an embryo died and therefore failed to hatch. Incubations were terminated when the normal embryos had hatched. In a few cases, the incubation was extended for an additional day if the abnormal embryos were still alive but had not hatched.

2.4. Chemical Analyses

All analyses were completed using US Environmental Protection Agency (EPA)-approved methods. Whole fish were used for contaminant analyses. Samples were extracted and separated following methods 3500, 3540 and 8000. Polychlorinated biphenyls (PCBs) were measured using high-resolution gas chromatography and low- or high-resolution mass spectrometry (HRGC/LRMS or HRGC/HRMS; SW486 8082 and modification 680 or EPA-14 1668). Total PCBs were taken as the sum of all mono- to deca-chlorinated congeners. Polychlorinated dibenzodioxins (PCDDs) and polychlorinated dibenzofurans (PCDFs) were measured using HRGC/HRMS (SW486 8290). Toxicity equivalents (TEQs) for 2,3,7,8 tetrachlorodibenzo-p-dioxin were calculated using fish-derived toxicity equivalency factors (TEF) for 17 2,3,7,8 substituted [61]. When calculating TEQs, half the detection limit was used for non-detects. Toxicity equivalents for PCBs were calculated using fish-specific TEFs based on early life stage mortality in rainbow trout [62]. PCB and PCDD/F concentrations were normalized to the percent lipid content of each fish. Metals were measured using inductively coupled plasma—mass spectrometry (SW486 6020) or the Manual Cold-Vapor Technique for mercury (EPA SW486 7471A).

2.5. Statistical Analyses

Analysis of variance was used to determine site differences for PCB concentration in fish and percent abnormal embryos observed within a given year. Both percentage and PCB concentration data were natural log transformed to better approximate the normal distribution. Fish weight and length were used as covariates in the PCB analyses. Levene’s homogeneity test was used to test equality of variance. Fisher’s protected LSD (homogeneous variances) or Dunnett’s T3 (heterogeneous variances) post hoc test results were used for determining site differences. If there were no PCB detections at a site, the mean detection limit for the samples was used. Linear regression analysis was used to determine if there was a relationship between mean PCB concentrations in fish and the mean proportion of abnormal embryos by site for each year. All statistics were calculated using SPSS version 27.

3. Results

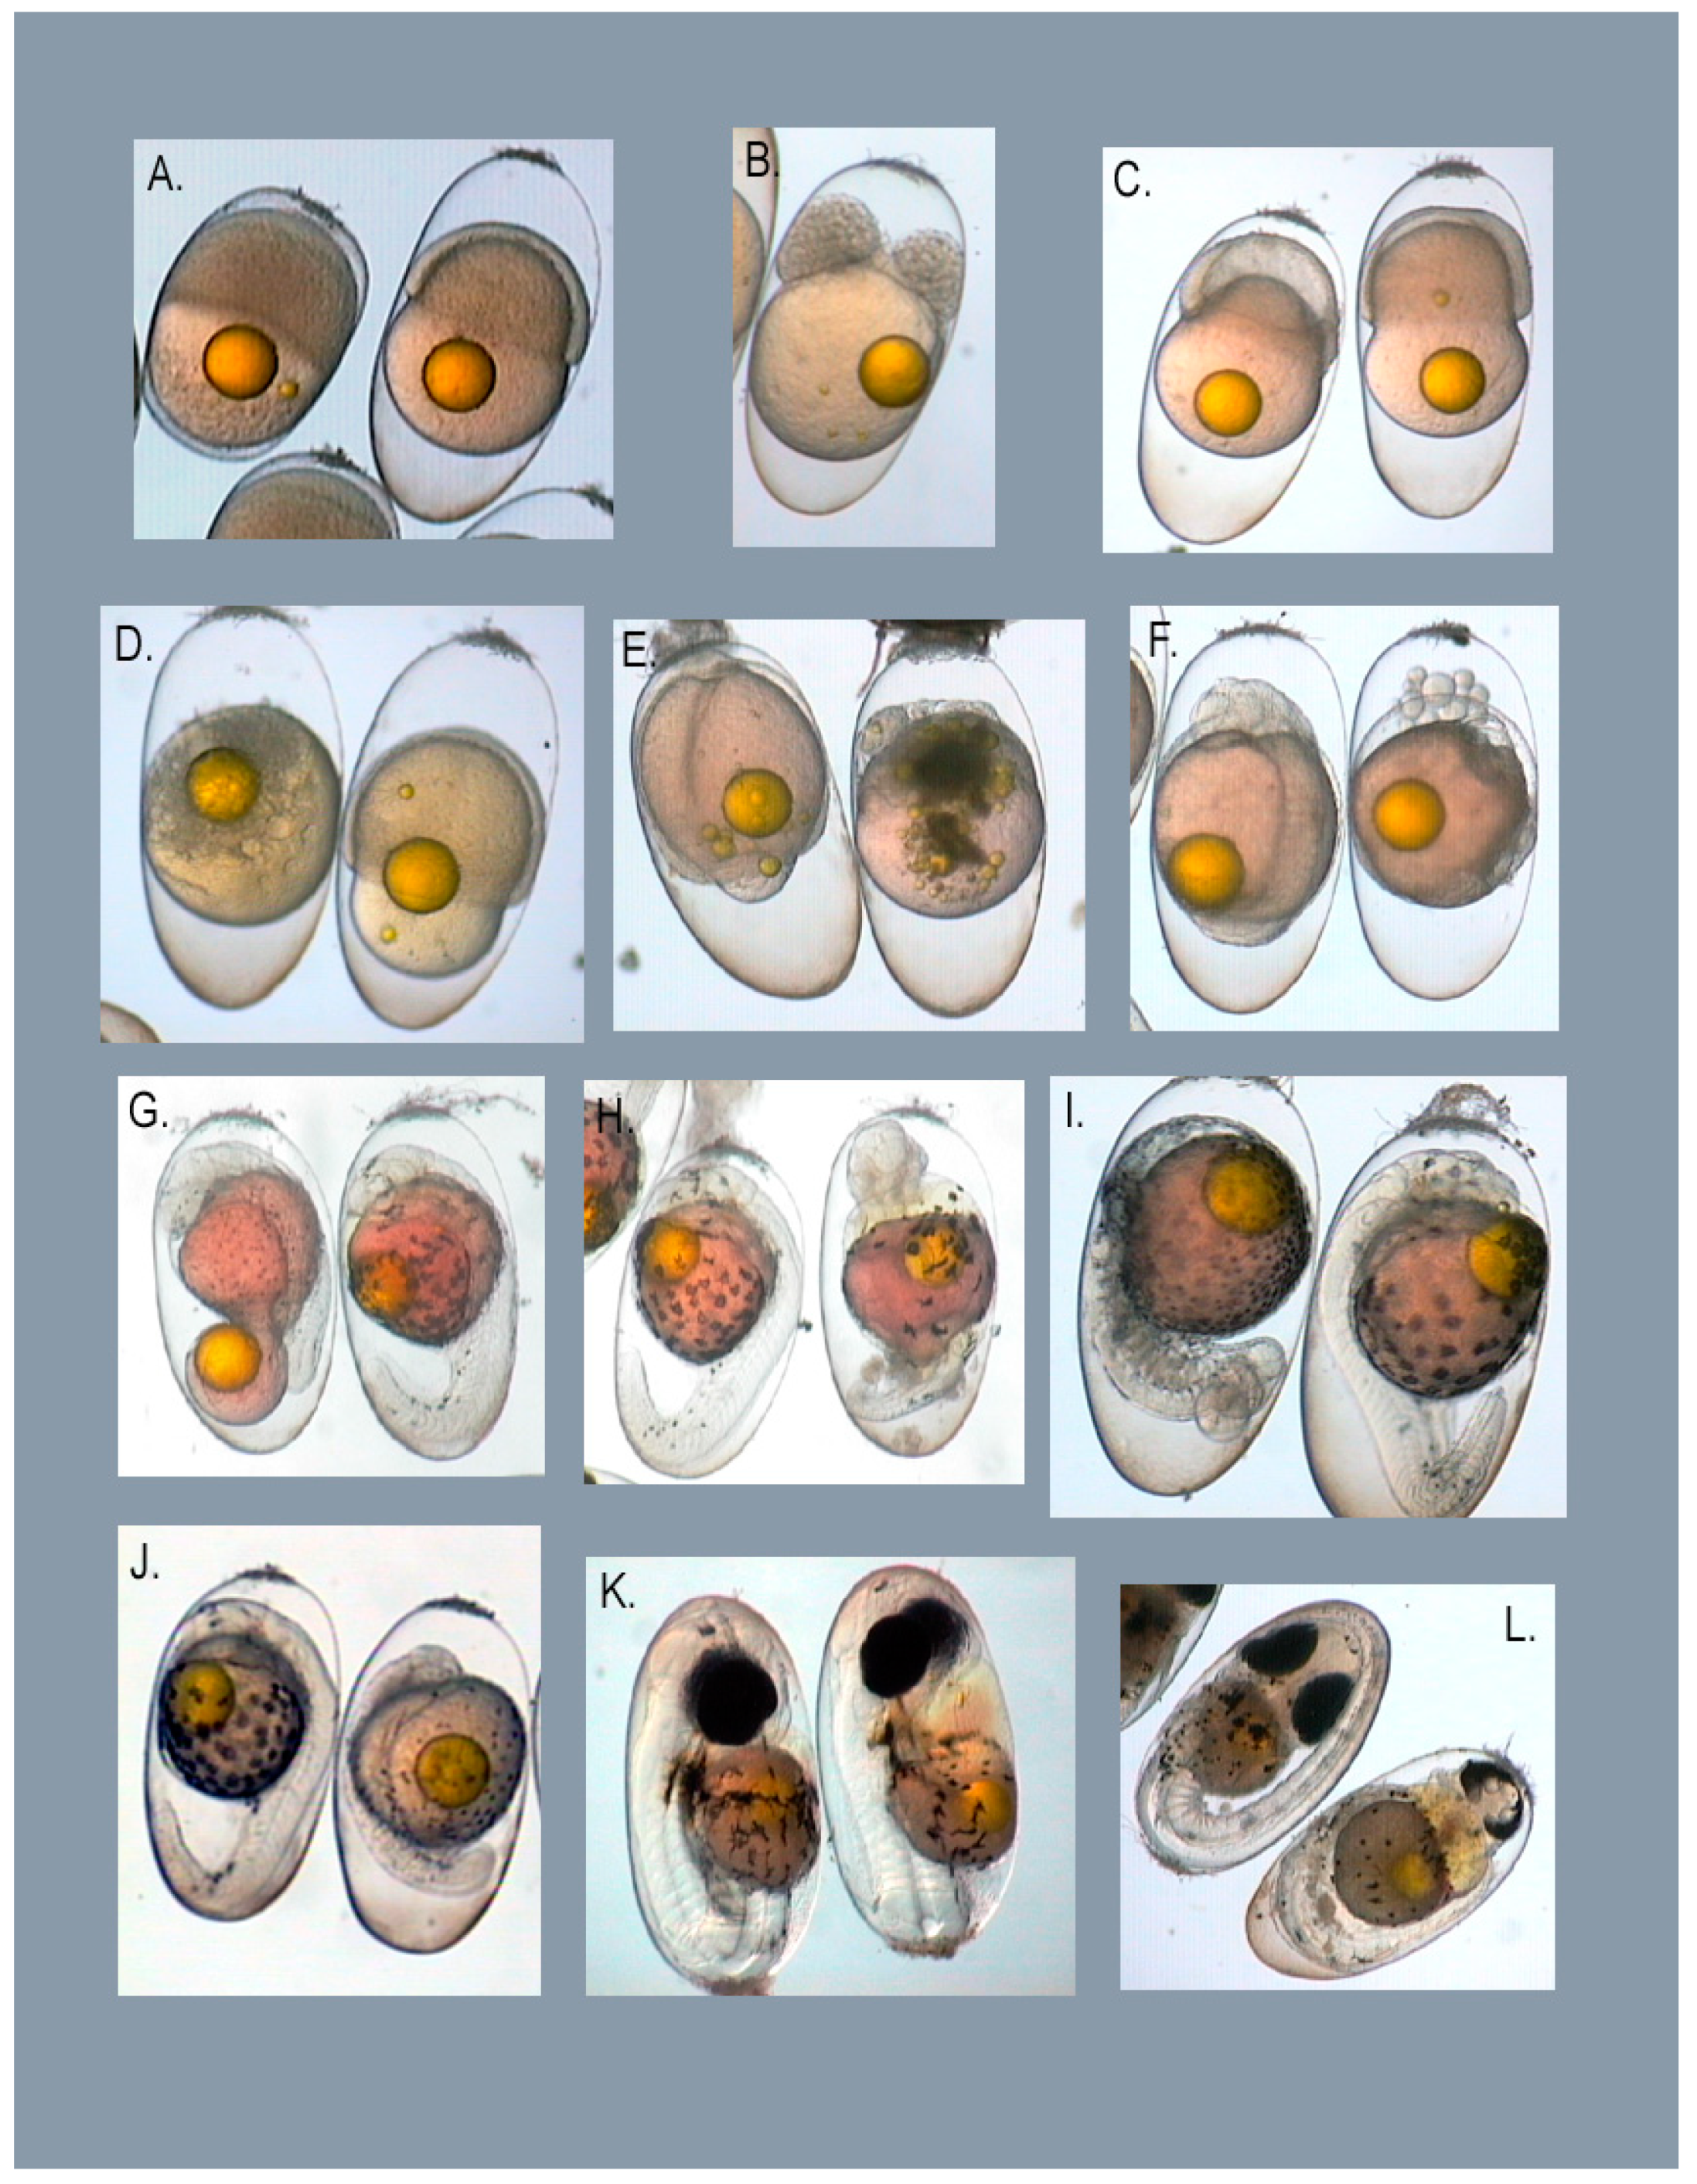
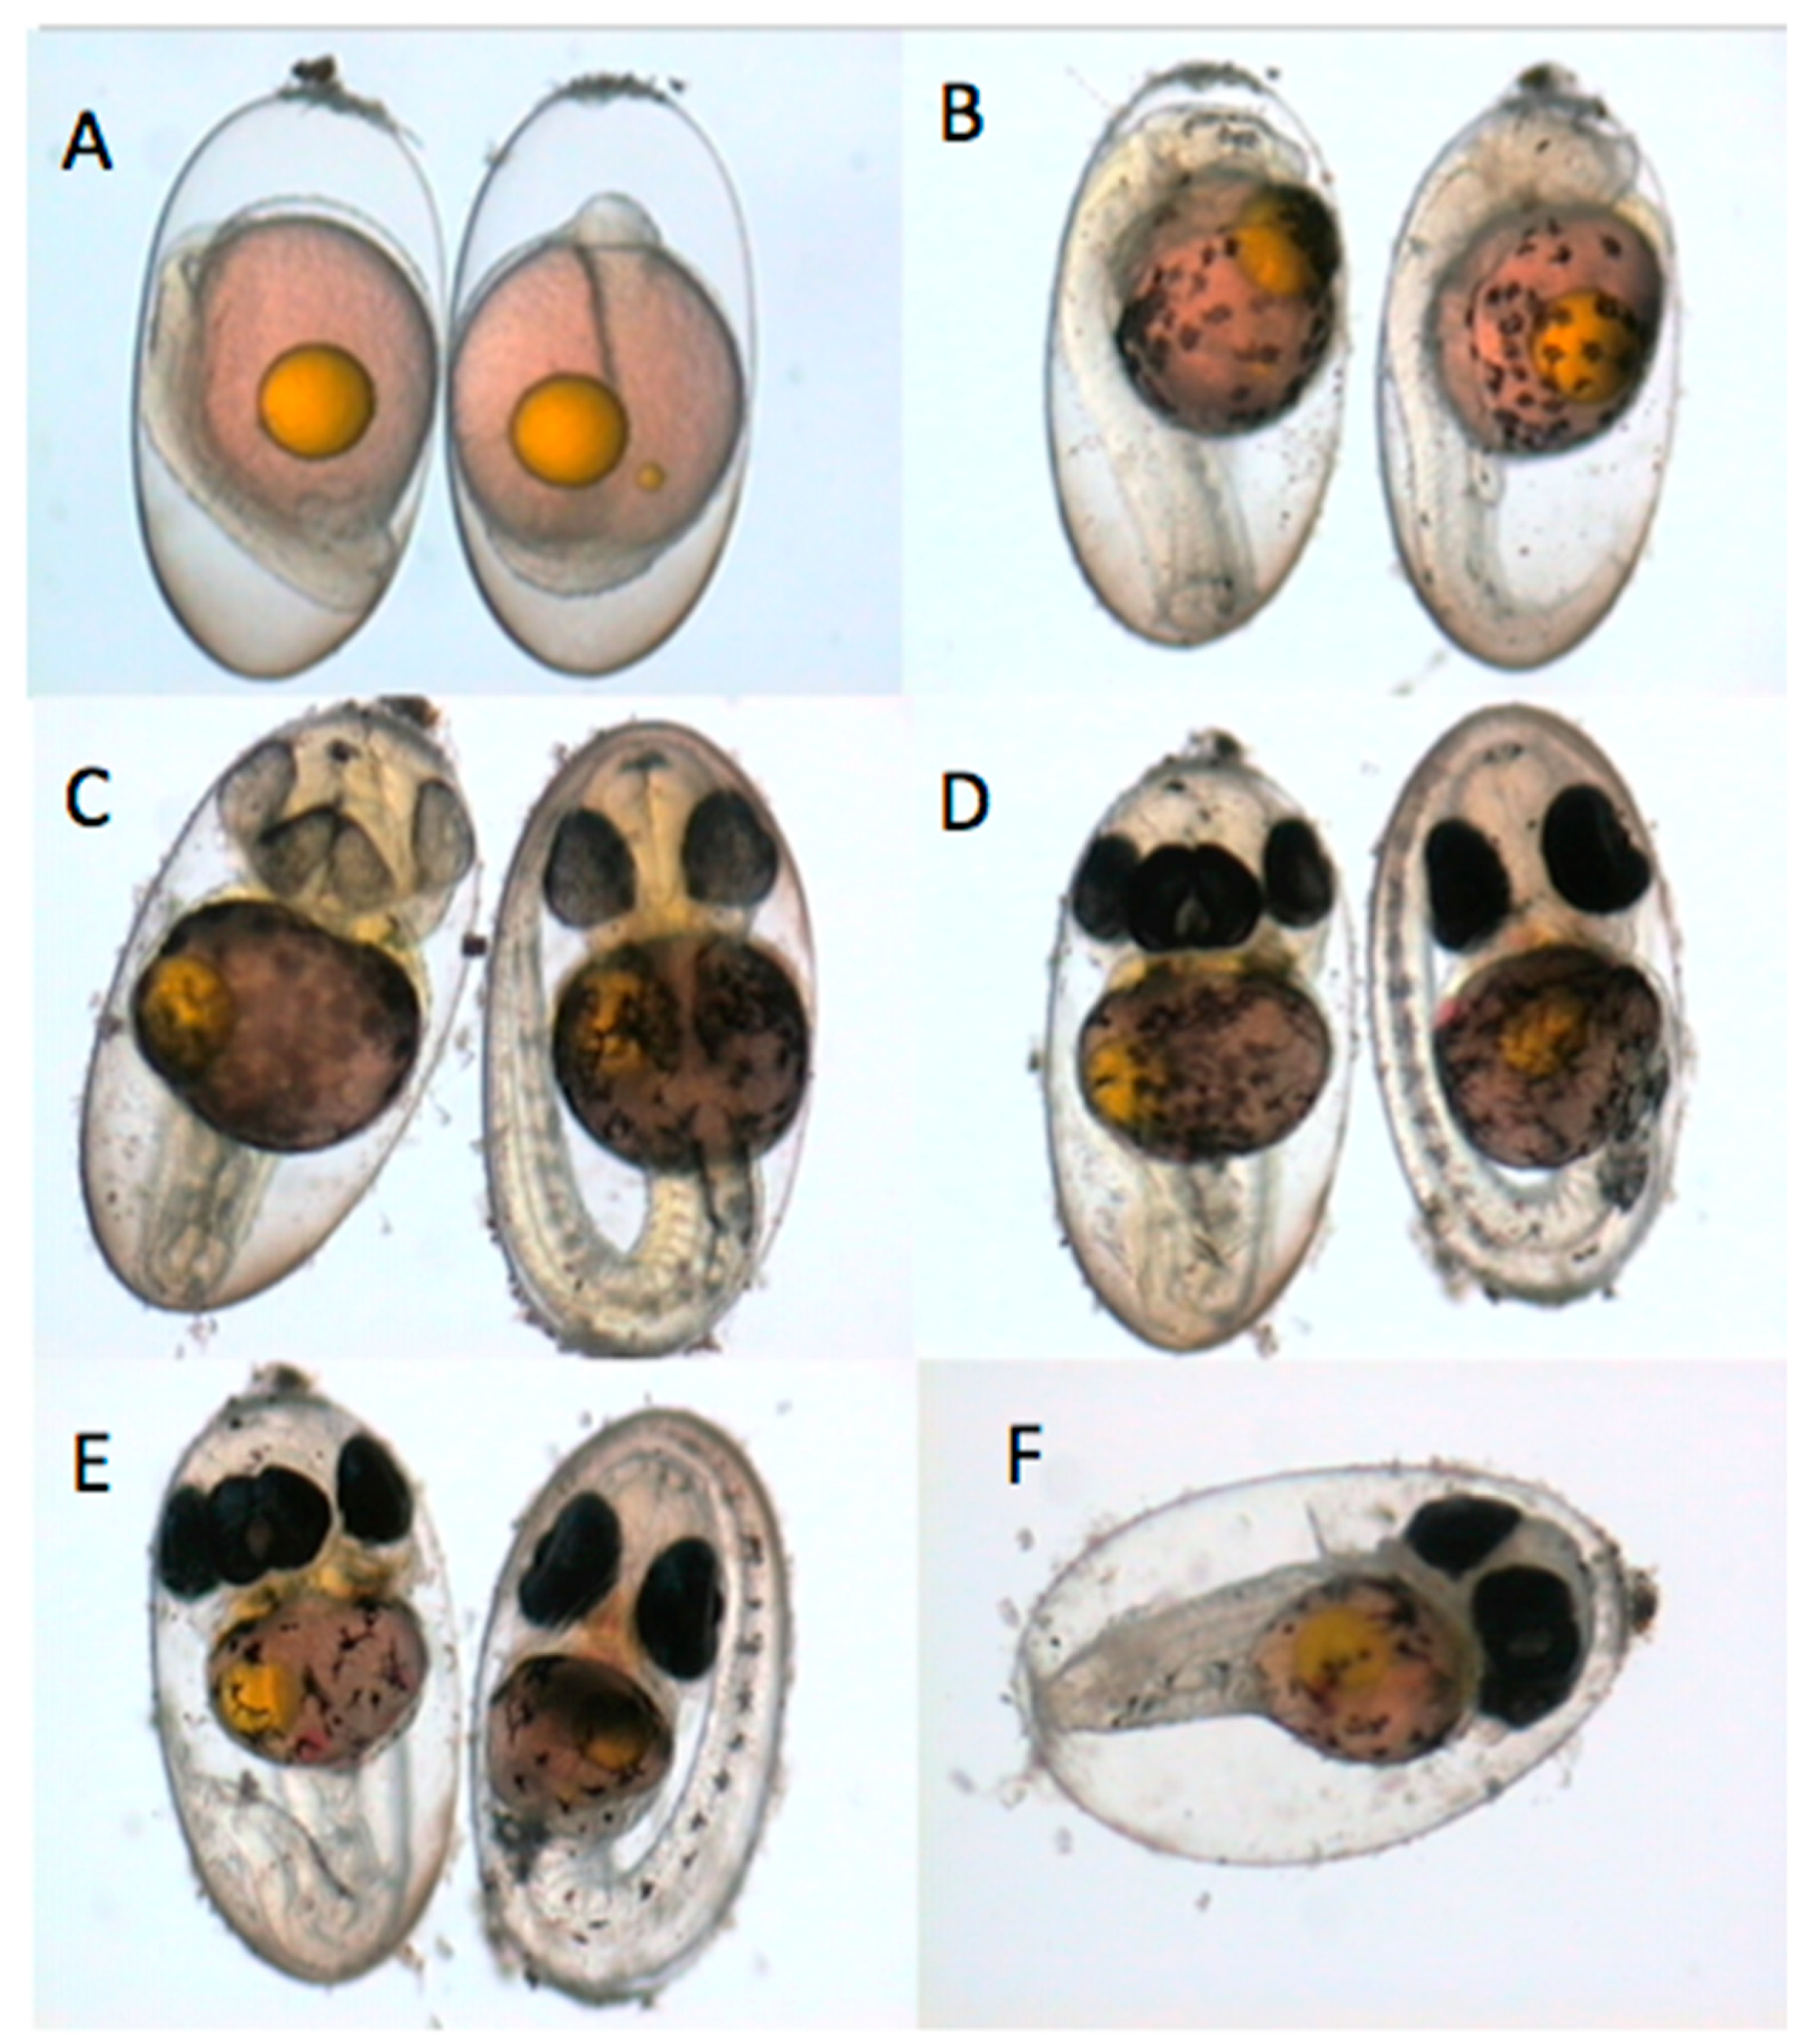
3.1. Types of Embryo Abnormalities Observed

Abnormalities were observed at all developmental stages. Abnormalities fell into eight categories: (1) unfertilized eggs (Figure 2A); (2) defects resulting from abnormal cleavage patterns in early embryos (Figure 2B); (3) defects resulting from abnormal cell movements during gastrulation (Figure 2C,D,F,G); (4) general developmental retardation (Figure 2J); (5) lack of morphological differentiation (Figure 2D–F); (6) cardiac (Figure 2K,L); (7) craniofacial (Figure 2H,I,L); and (8) axial/skeletal (Figure 2H,I). Abnormalities observed at early stages included abnormal cleavage patterns and loose cells in the perivitelline space. Some embryos developed at a dramatically slower rate when compared to other embryos within the same clutch. Incubation of these developmentally delayed embryos demonstrated that these embryos would not hatch. Cardiac malformations included tube heart, where the heart chambers failed to bend, and edema. Craniofacial abnormalities usually involved the eyes, although some jaw deformities were observed. Eye abnormalities observed included small eyes, fused to partially fused eyes, eye duplications and embryos lacking an eye on one side. Axial and skeletal abnormalities included bent or twisted notochords as well as more severe deformities where embryos failed to develop anterior or posterior structures. Yolk abnormalities included vacuoles in or darkened areas of the yolk. Occasionally, part of the yolk would be pinched off when the blastopore closed prematurely. Abnormal embryos would often show little or no morphological differentiation. Many, particularly late-stage embryos, displayed multiple abnormalities.

3.2. Embryo Incubation

Abnormal embryos from 21 nests were incubated in the laboratory to determine if the observed abnormalities were lethal (Figure 3). All incubations were started within 2 days of fertilization. A total of 166 abnormal and 354 normal embryos were incubated with 7% of abnormal and 90% of normal embryos hatching. The percentage of normal and abnormal embryos from individual nests hatching ranged from 63 to 100% and 0 to 43%, respectively (Table 2). No cases of fungus were observed in normal embryos incubated with abnormal embryos. Hatching in normal embryos may have been low in some cases when the overall level of abnormalities within a clutch was high. Since both “normal” and “abnormal” embryos were taken from the same clutch, the “normal” embryos may have had subtle abnormalities that were not easily identified. In one case (nest e1), no normal embryos were observed within that clutch.

3.3. The Gonadosomatic and Hepatosomatic Indices (GSI and HSI)

There was considerable variation in the gonadosomatic index within and between sites (Table 3). Fish from the HO site had significantly higher GSI than fish from PCB-1, REF-3 and REF-1. Mean GSI ranged from 0.64 to 2.89. There was also a significant difference between male and female GSIs explaining the higher GSI at HO. Five of the six fish sampled were female compared to no females at REF-1 and REF-3, and only two females at PCB-1. There were no site or sex differences for HSI. Mean HSIs ranged from 0.78 to 0.94.

3.4. Gut Contents

The stomach contents were examined fresh, from field-captured specimens; but even so, detailed identification of contents was difficult due to the advanced stage of digestion of the intestinal material. Stomach fullness ranged from empty to 15% full. Food items observed included red, green and coralline algae, detritus, polychaetes, fish scales, bryozoans, caridean shrimp, amphipods, micromolluscs, nudibranchs and damselfish embryos. In one fish’s stomach, 100 late-stage embryos were observed. Most of the other food items were observed as individual items within a stomach. One fish had eaten two nudibranchs, however. The most interesting and consistent item found in the stomach and intestine was coral sand. One of the larger pieces of coral found in a stomach weighed 2.1 g. Algae were observed on this piece of coral, suggesting the reason for ingestion. Most of the fish’s intestines were full of sand and larger coral pieces. Since this fish consumes such large volumes of sediment, this likely represents the major pathway of contaminant uptake.

3.5. PCB Accumulation and Embryo Abnormalities

Differences in adult fish tissue PCB concentrations among sites were not found consistently every year (Figure 4, Table 4). Due to some significant differences in fish length and weight between sites (Table 4), weight and length were used as covariates in all analyses. PCB concentrations were significantly higher in PCB-1 compared to REF-1 fish in 1996 (p < 0.001). While PCB concentrations were significantly higher in PCB-2 compared to PCB-1, REF-1, and REF-3 fish in 1999, no other differences were found among or between the other sites sampled (p < 0.001). Similarly, in 2001 PCB-1 concentrations were significantly higher than REF-1, REF-3 and HO and no other differences were found among or between the other sites sampled (p < 0.001). PCB-2 fish were not analyzed in 2001.
As with PCB concentrations, site differences in the occurrence of embryo abnormalities were not found consistently every year (Figure 5, Table 5). In both 1996 and 1998, damselfish embryonic abnormalities were significantly higher at PCB-1 when compared to samples collected from REF-1 (p = 0.001 and p = 0.008). In 1999, there were no significant differences in mean embryonic abnormalities between sites (p = 0.458). In 2001, significant differences were only found between PCB-1 and REF-1, REF-2 and REF-3 reference areas (p < 0.001). Clutches were observed containing 100% abnormal embryos in 1996 and 1998 but not in 1999 and 2001 (Table 5).
For comparison, levels of embryonic abnormalities were examined in a closely related planktivorous damselfish species, Abudefduf vaigiensis. These fish live along the reef edge and are therefore removed from any potential contaminant exposure. Embryo abnormalities in five samples ranged from 0 to 2.1% with a mean of 0.6%. PCBs were not measured in these fish.

3.6. Within Site Variation

Higher levels of intra-site variation in the occurrence of embryo abnormalities and PCB concentrations were found within the PCB sites compared to the REF sites (Table 5). Data on the occurrence of embryo abnormalities were collected during four spawning seasons (1996, 1998, 1999 and 2001) while PCBs were measured in fish tissues over three seasons (1996, 1999 and 2001) for both PCB-1 and REF-1. At REF-2, REF-3 and PCB-2, data on the occurrence of embryo abnormalities were collected during two spawning seasons (1999 and 2001) while PCBs were measured in fish tissues over two seasons (1999 and 2001) at REF-3 and only one season at PCB-2.
At both PCB-1 and PCB-2, the mean level embryo abnormalities decreased over the course of this study, even though no significant differences between years were detected (6.0 to 2.8% and 6.2% to 2.0%, respectively). Mean PCB concentration in fish ranged from 39,853.4 to 10,419.2 ng/g lipid. There was significant decrease in PCB concentration between 1996 and 1999 at PCB-1. No other differences were detected since there was a slight increase in mean PCB concentrations (14,643.2 ng/g lipid) in 2001.
Within the REF-1 and REF-3 sites, variation in the occurrence of abnormalities was low (1.4 to 1.8% and 1.6 to 1.7%, respectively). At REF-1, even though mean fish tissue PCB concentration appeared to decline over the course of this study (1819.7, to 434.7 ng/g lipid), there were no statistical differences between years. Mean fish PCB concentrations (350.2 and 364.6 ng/g lipid) at REF-3 showed little variation. At REF-2, the occurrence of mean embryo abnormalities was low, with a significant decrease in mean embryo abnormalities from 1999 to 2001, with values of 2.5 and 1.3%, respectively.

3.7. Between Site Variation

Site differences in the occurrence of embryonic abnormalities differed from year to year. In 1996, embryonic abnormalities were significantly higher at the PCB site (PCB-1 = 5.8%) compared to the reference site (REF-1 = 1.4%). In 1998, embryonic abnormalities were significantly higher at the PCB site (PCB-1 = 6.0%) compared to the reference site (REF-1 = 1.4%). An additional PCB site and two reference sites were added in 1999 and 2001 adding variability to this study. In 1999, there was no significant difference in embryonic abnormalities between any of the PCB-contaminated (PCB-1 = 2.8% and PCB-2 = 6.2%) and uncontaminated sites (REF-1 = 1.8%, REF-3 = 1.7%, REF-2 = 2.5%). In 2001, there were significant differences in the occurrence of embryonic abnormalities at the PCB-contaminated site (PCB-1 = 3.2%) as compared to the reference sites (REF-1 = 1.7%, REF-3 = 1.6%, REF-2 = 1.3%). There were no significant differences between the additional PCB-contaminated site (PCB-2 = 2.0%), the HO site (2.9%) and the reference sites (REF-2 = 1.3%, REF-3 = 1.6%).
Site differences in whole-fish PCB concentrations paralleled differences found in embryonic abnormalities. In 1996, whole-fish PCB concentrations were significantly higher at the PCB site (PCB-1 = 39.8 μg/g) compared to the reference site (REF-1 = 1.8 μg/g). PCB concentrations were not measured in 1998. In 1999, PCB concentrations were significantly higher at the PCB-2 site (138.0 μg/g) compared to all other sites. However, there were no significant differences in PCB concentrations between the PCB-contaminated (PCB-1 = 10.4 μg/g) and uncontaminated sites (REF-1 = 1.0 μg/g, REF-3 = 0.4 μg/g) due to the high levels of variability. In 2001, PCB concentrations were significantly higher at the PCB site (PCB-1 = 14.6 μg/g) compared to the reference sites (REF-1 = 0.4 μg/g, REF-3 = 0.4 μg/g). PCBs were not measured at the REF-2 reference site during any year or at the PCB-2 site during 2001. At PCB-1, decreases in the occurrence of embryo abnormalities corresponded with decreases in fish PCB concentrations.

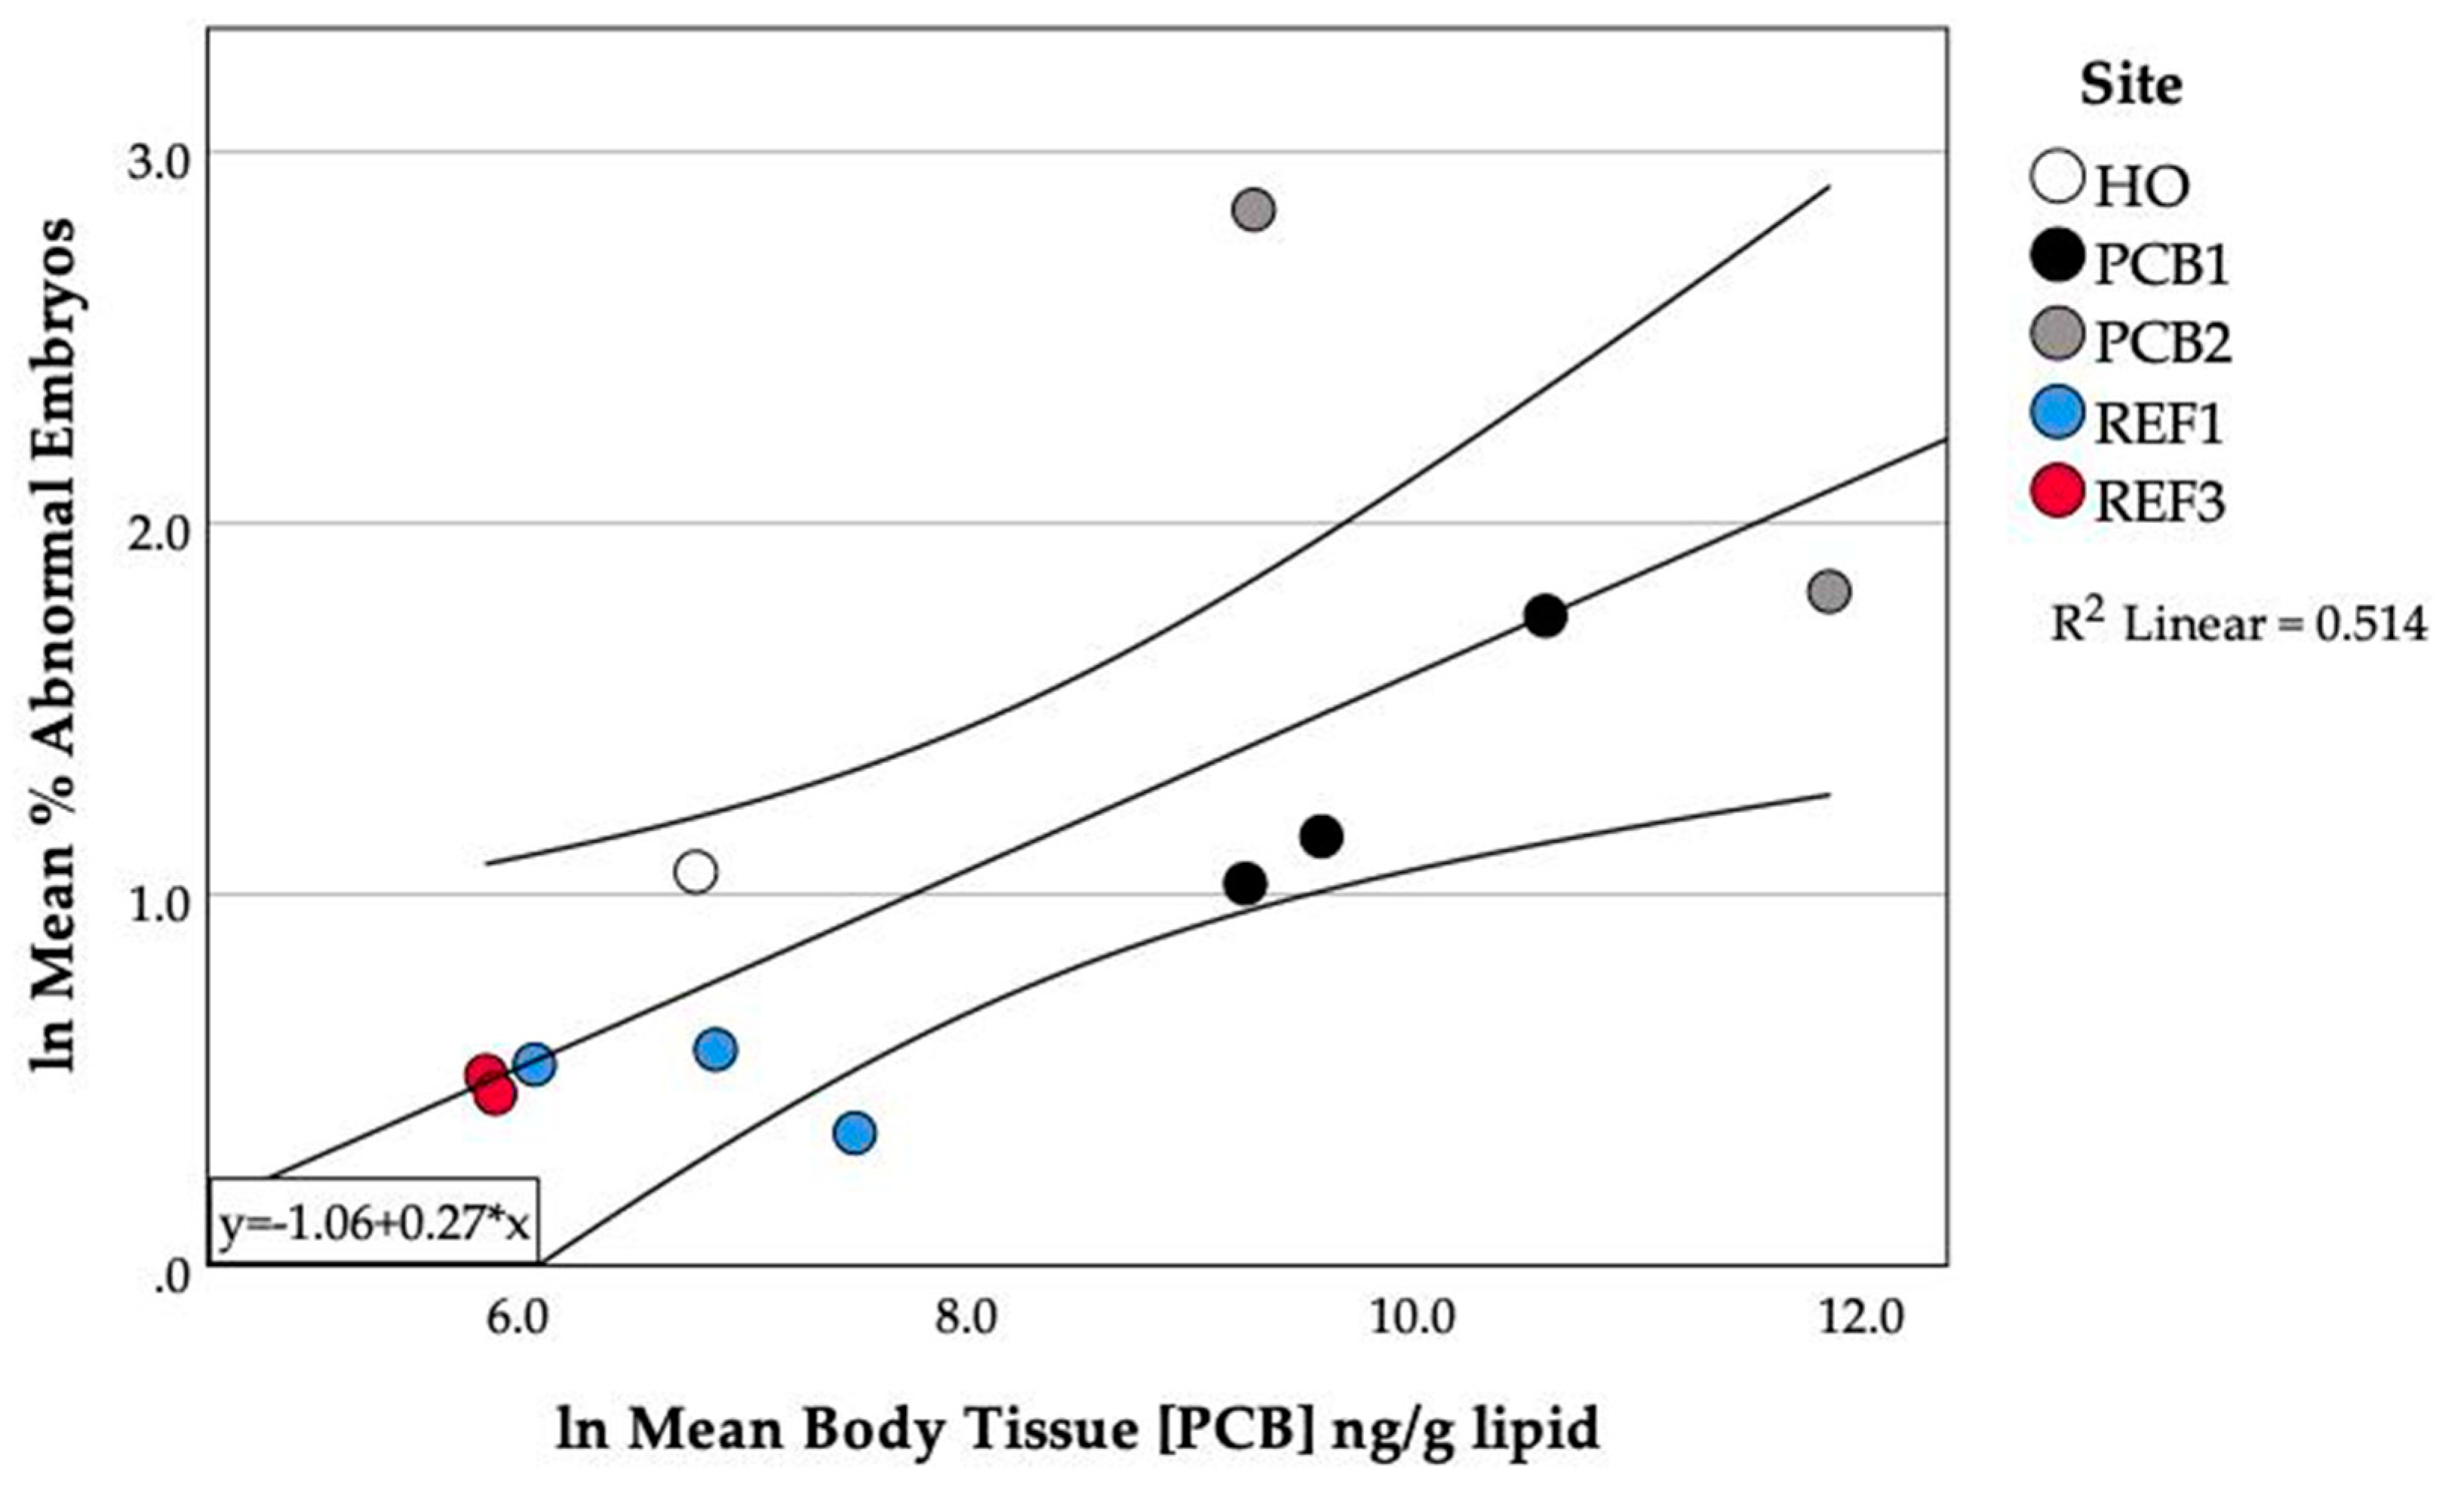
3.8. Relationship between PCBs in Fish and Abnormalities

Mean PCB concentrations and mean level of abnormalities in fish varied from year to year at each site. In order to determine whether there was a relationship between the occurrence of abnormalities and PCB concentration, the paired data collected during a given year (mean embryo abnormalities and mean PCB concentrations) for each site were subjected to regression analysis. A significant relationship (R2 = 0.514, p = 0.016) was found between the mean level of abnormalities observed and the mean lipid-normalized PCB concentration in fish tissues (Figure 6).

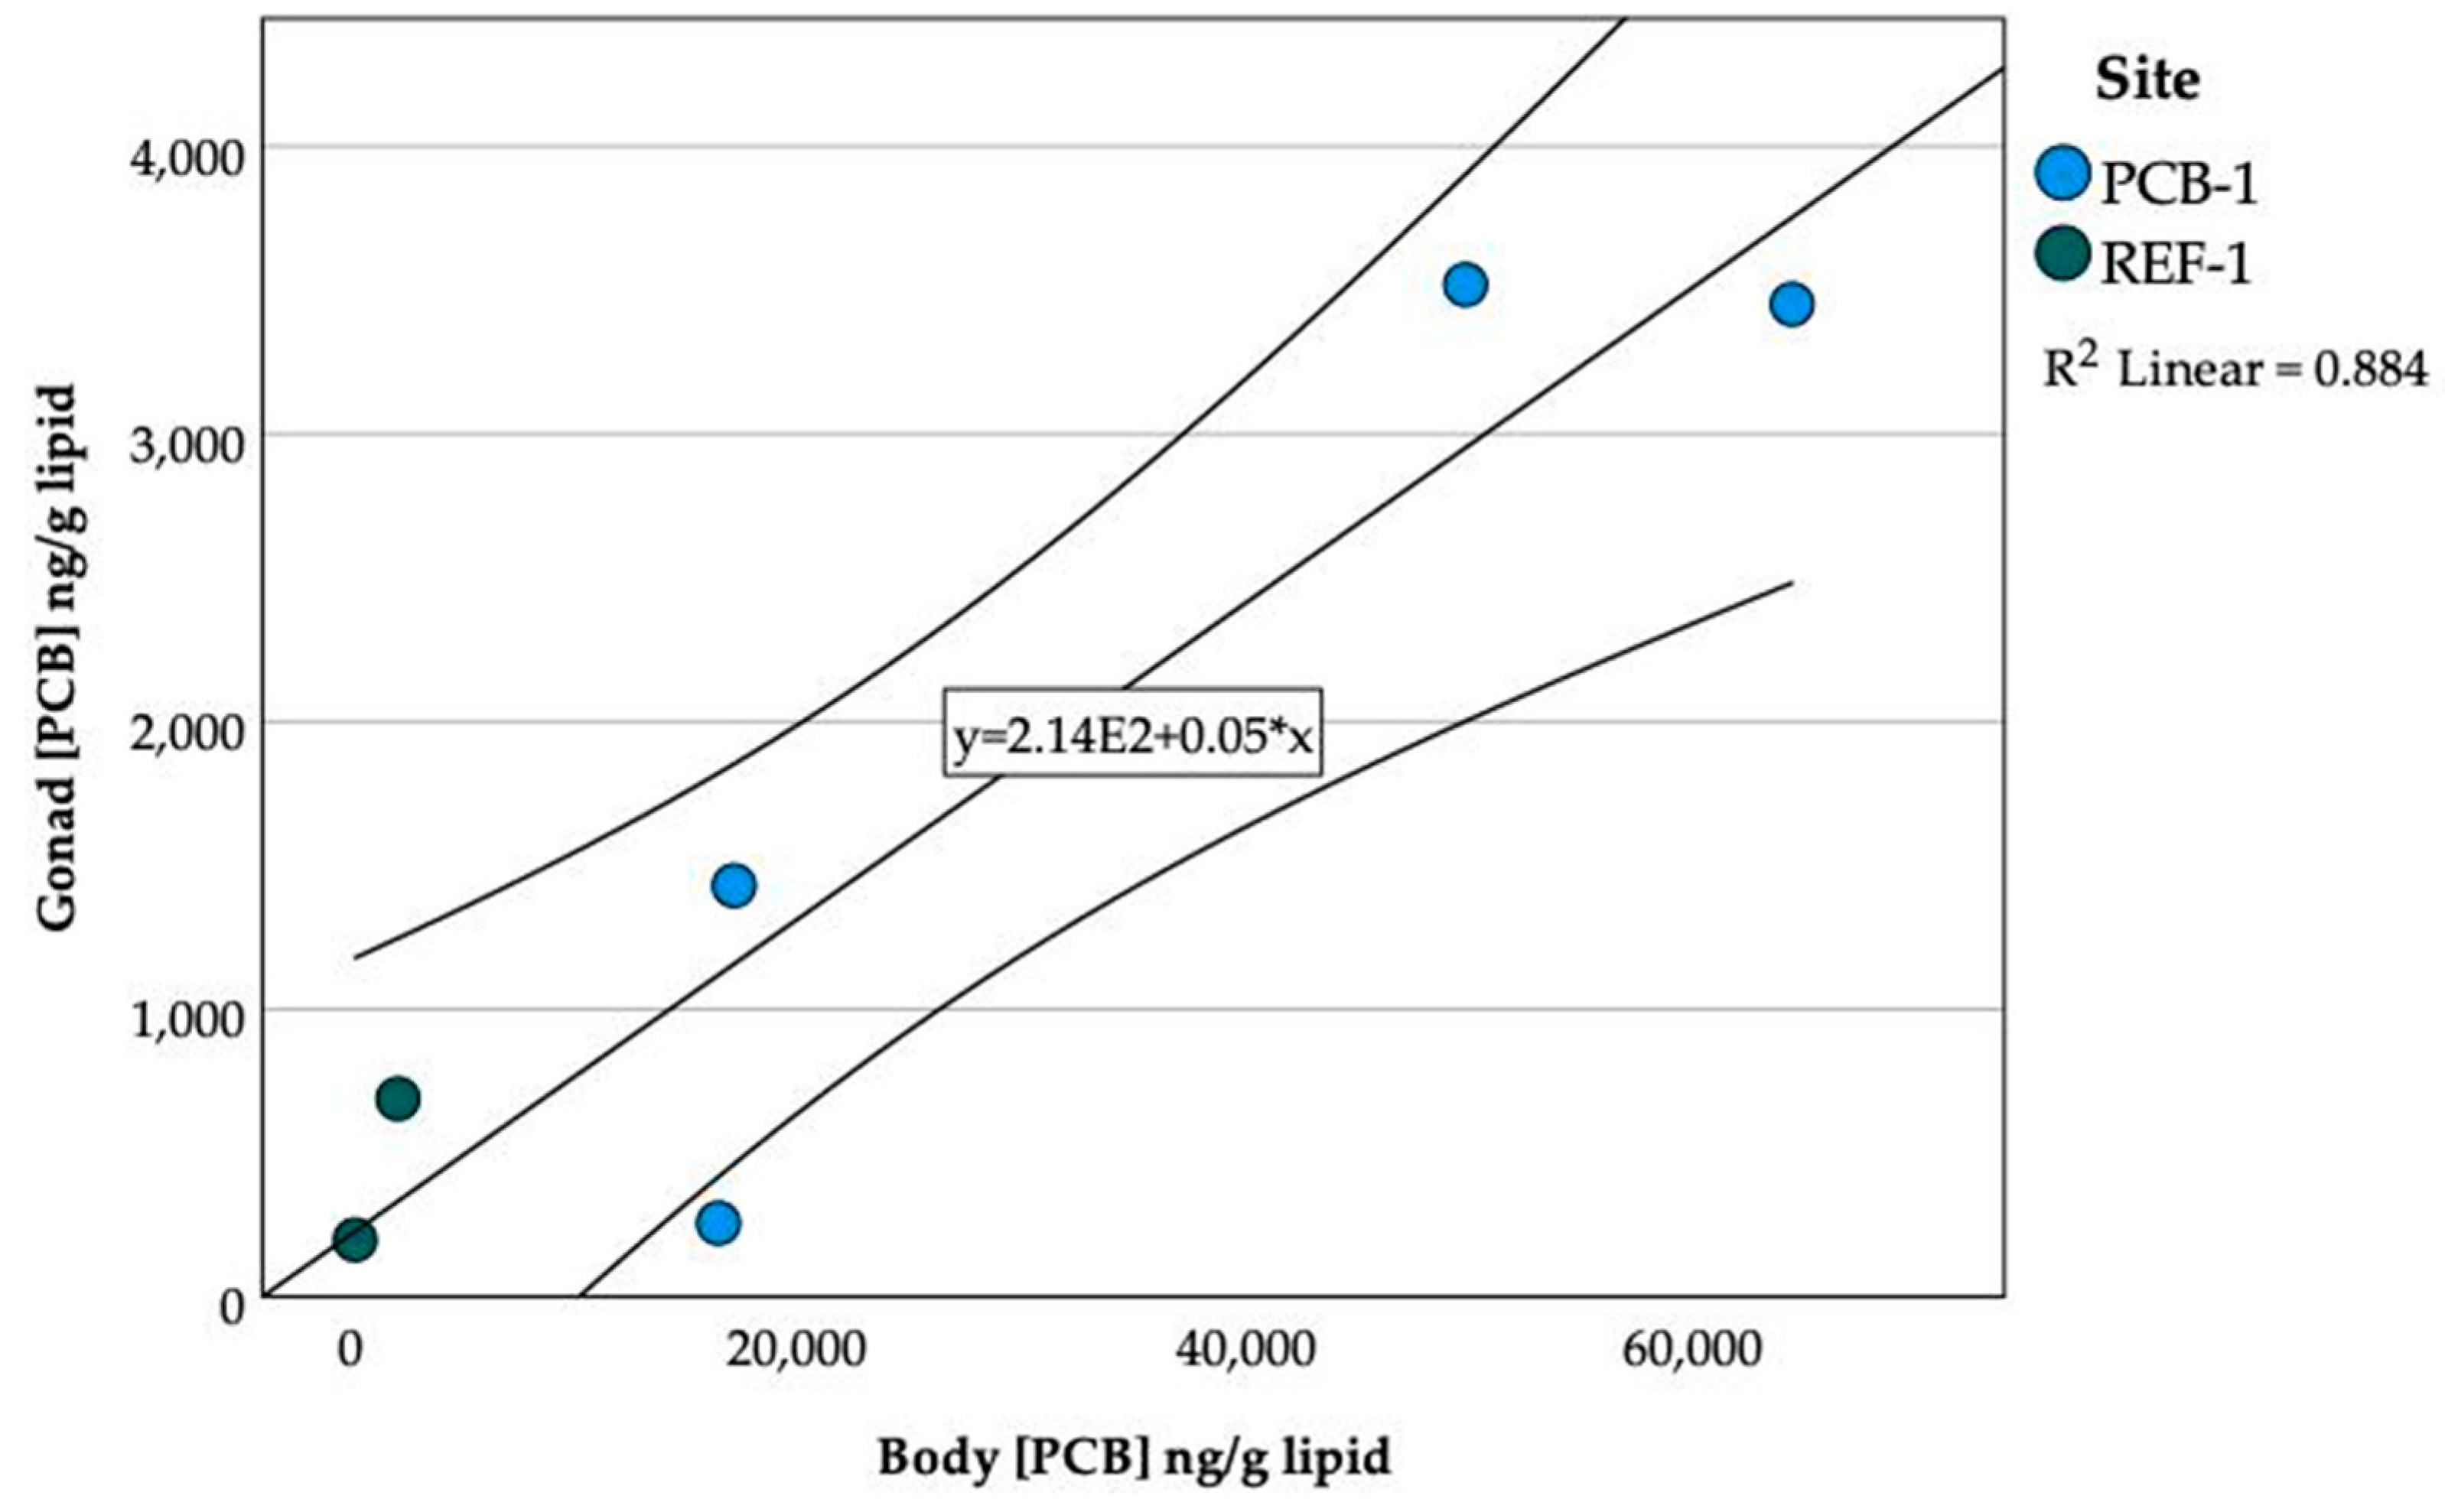
3.9. PCBs in Gonads and Embryos

PCBs were detected in gonad and embryo samples irrespective of site. PCBs were measured in gonads from selected PCB-1 and REF-1 fish (Table 6). Mean (SD) PCB concentrations in gonads from PCB-1 and REF-1 were 2164.6 (1599.1) and 444.0 (346.7) ng/g lipid, respectively. PCB concentrations were not significantly different between sites most likely due to the small number of gonads analyzed. There was a significant relationship between gonad and body PCB concentrations R2 = 0.88, p = 0.005 (Figure 7).
PCBs were found in embryo samples from PCB-1, REF-1 and PCB-2 (Table 7). Mean (SD) PCB concentrations in embryos from PCB-1 and REF-1 were 4879.3 (7944.4) and 2251.7 (2066.5) ng/g lipid, respectively. The one sample from the PCB-2 site contained 7117.6 ng/g lipid PCBs. Mean (SD) abnormalities in the embryo samples from PCB-1 and REF-1 were 5.3 (2.6) and 0.75 (0.4)%, respectively. The PCB-2 sample contained 34.7% abnormal embryos. There was no relationship between PCB concentration in embryos and % abnormal. PCBs were also measured in two female fish collected while spawning at Sand Island. These females had tissue body burdens of 635.6 and 503.4 ng/g lipid PCBs. The PCB concentration in embryos spawned by these females was 414.7 and 1223.1 ng/g lipid with 4.3 and 3.4% abnormal embryos observed, respectively.

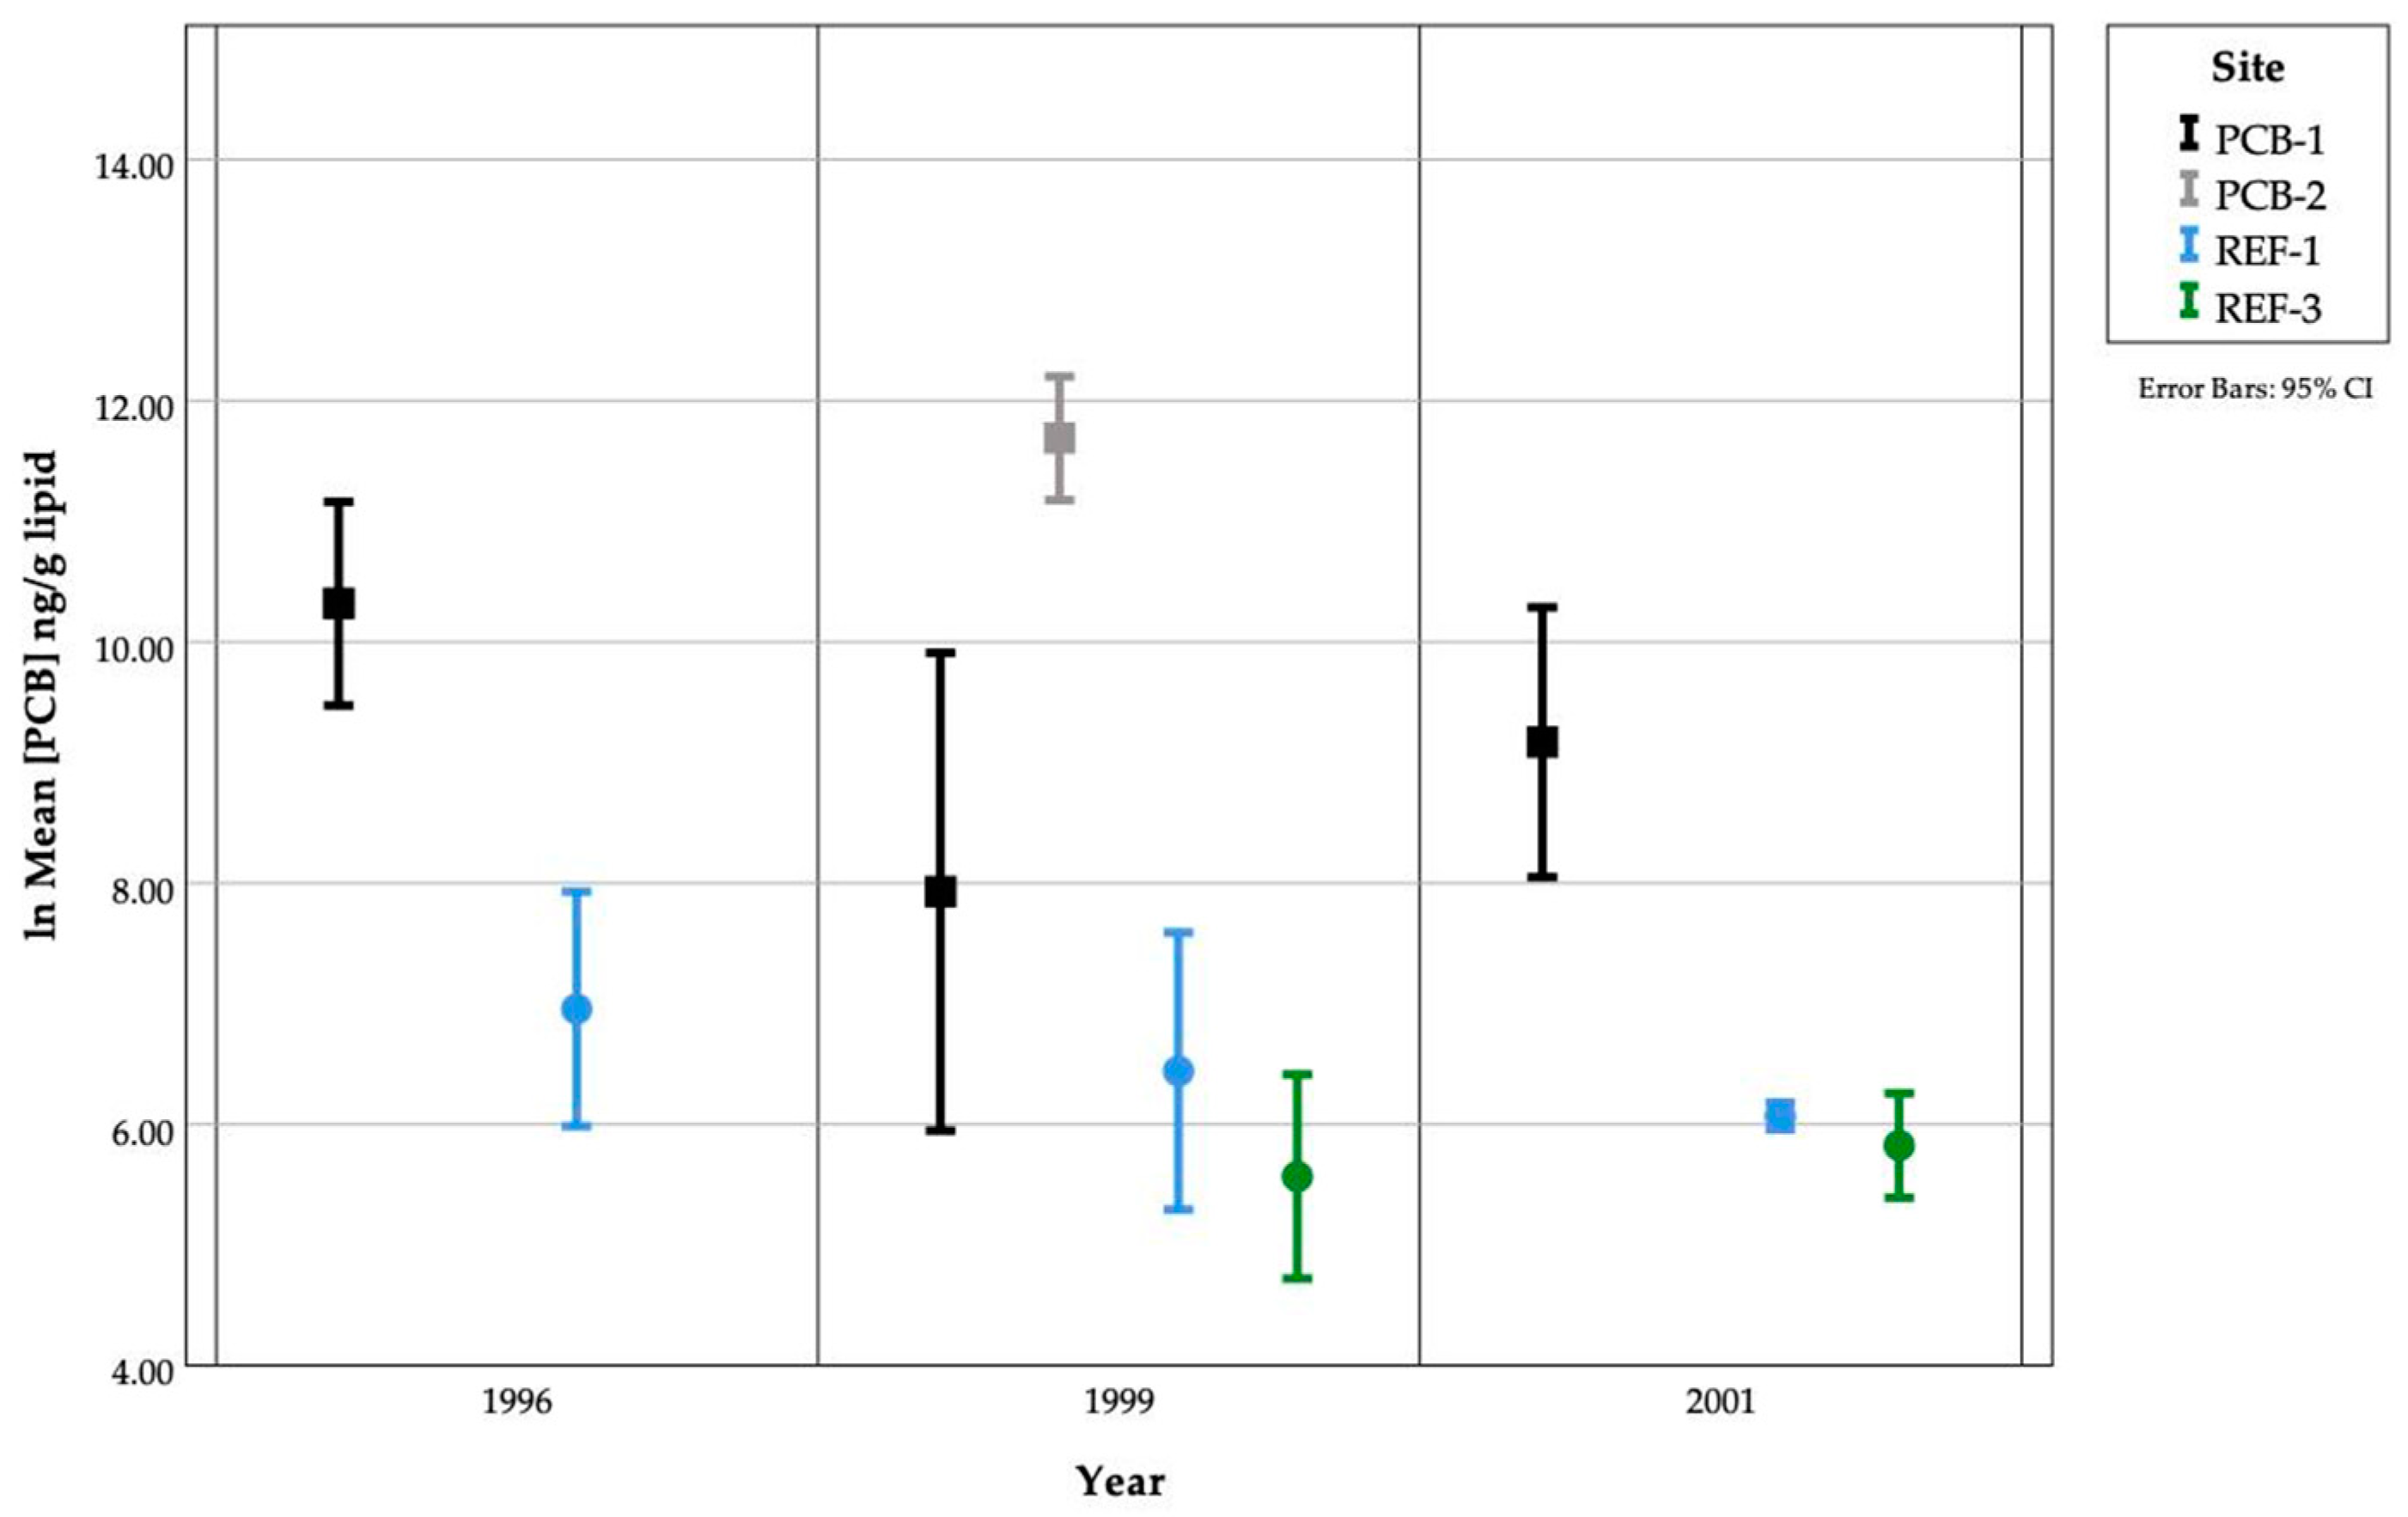
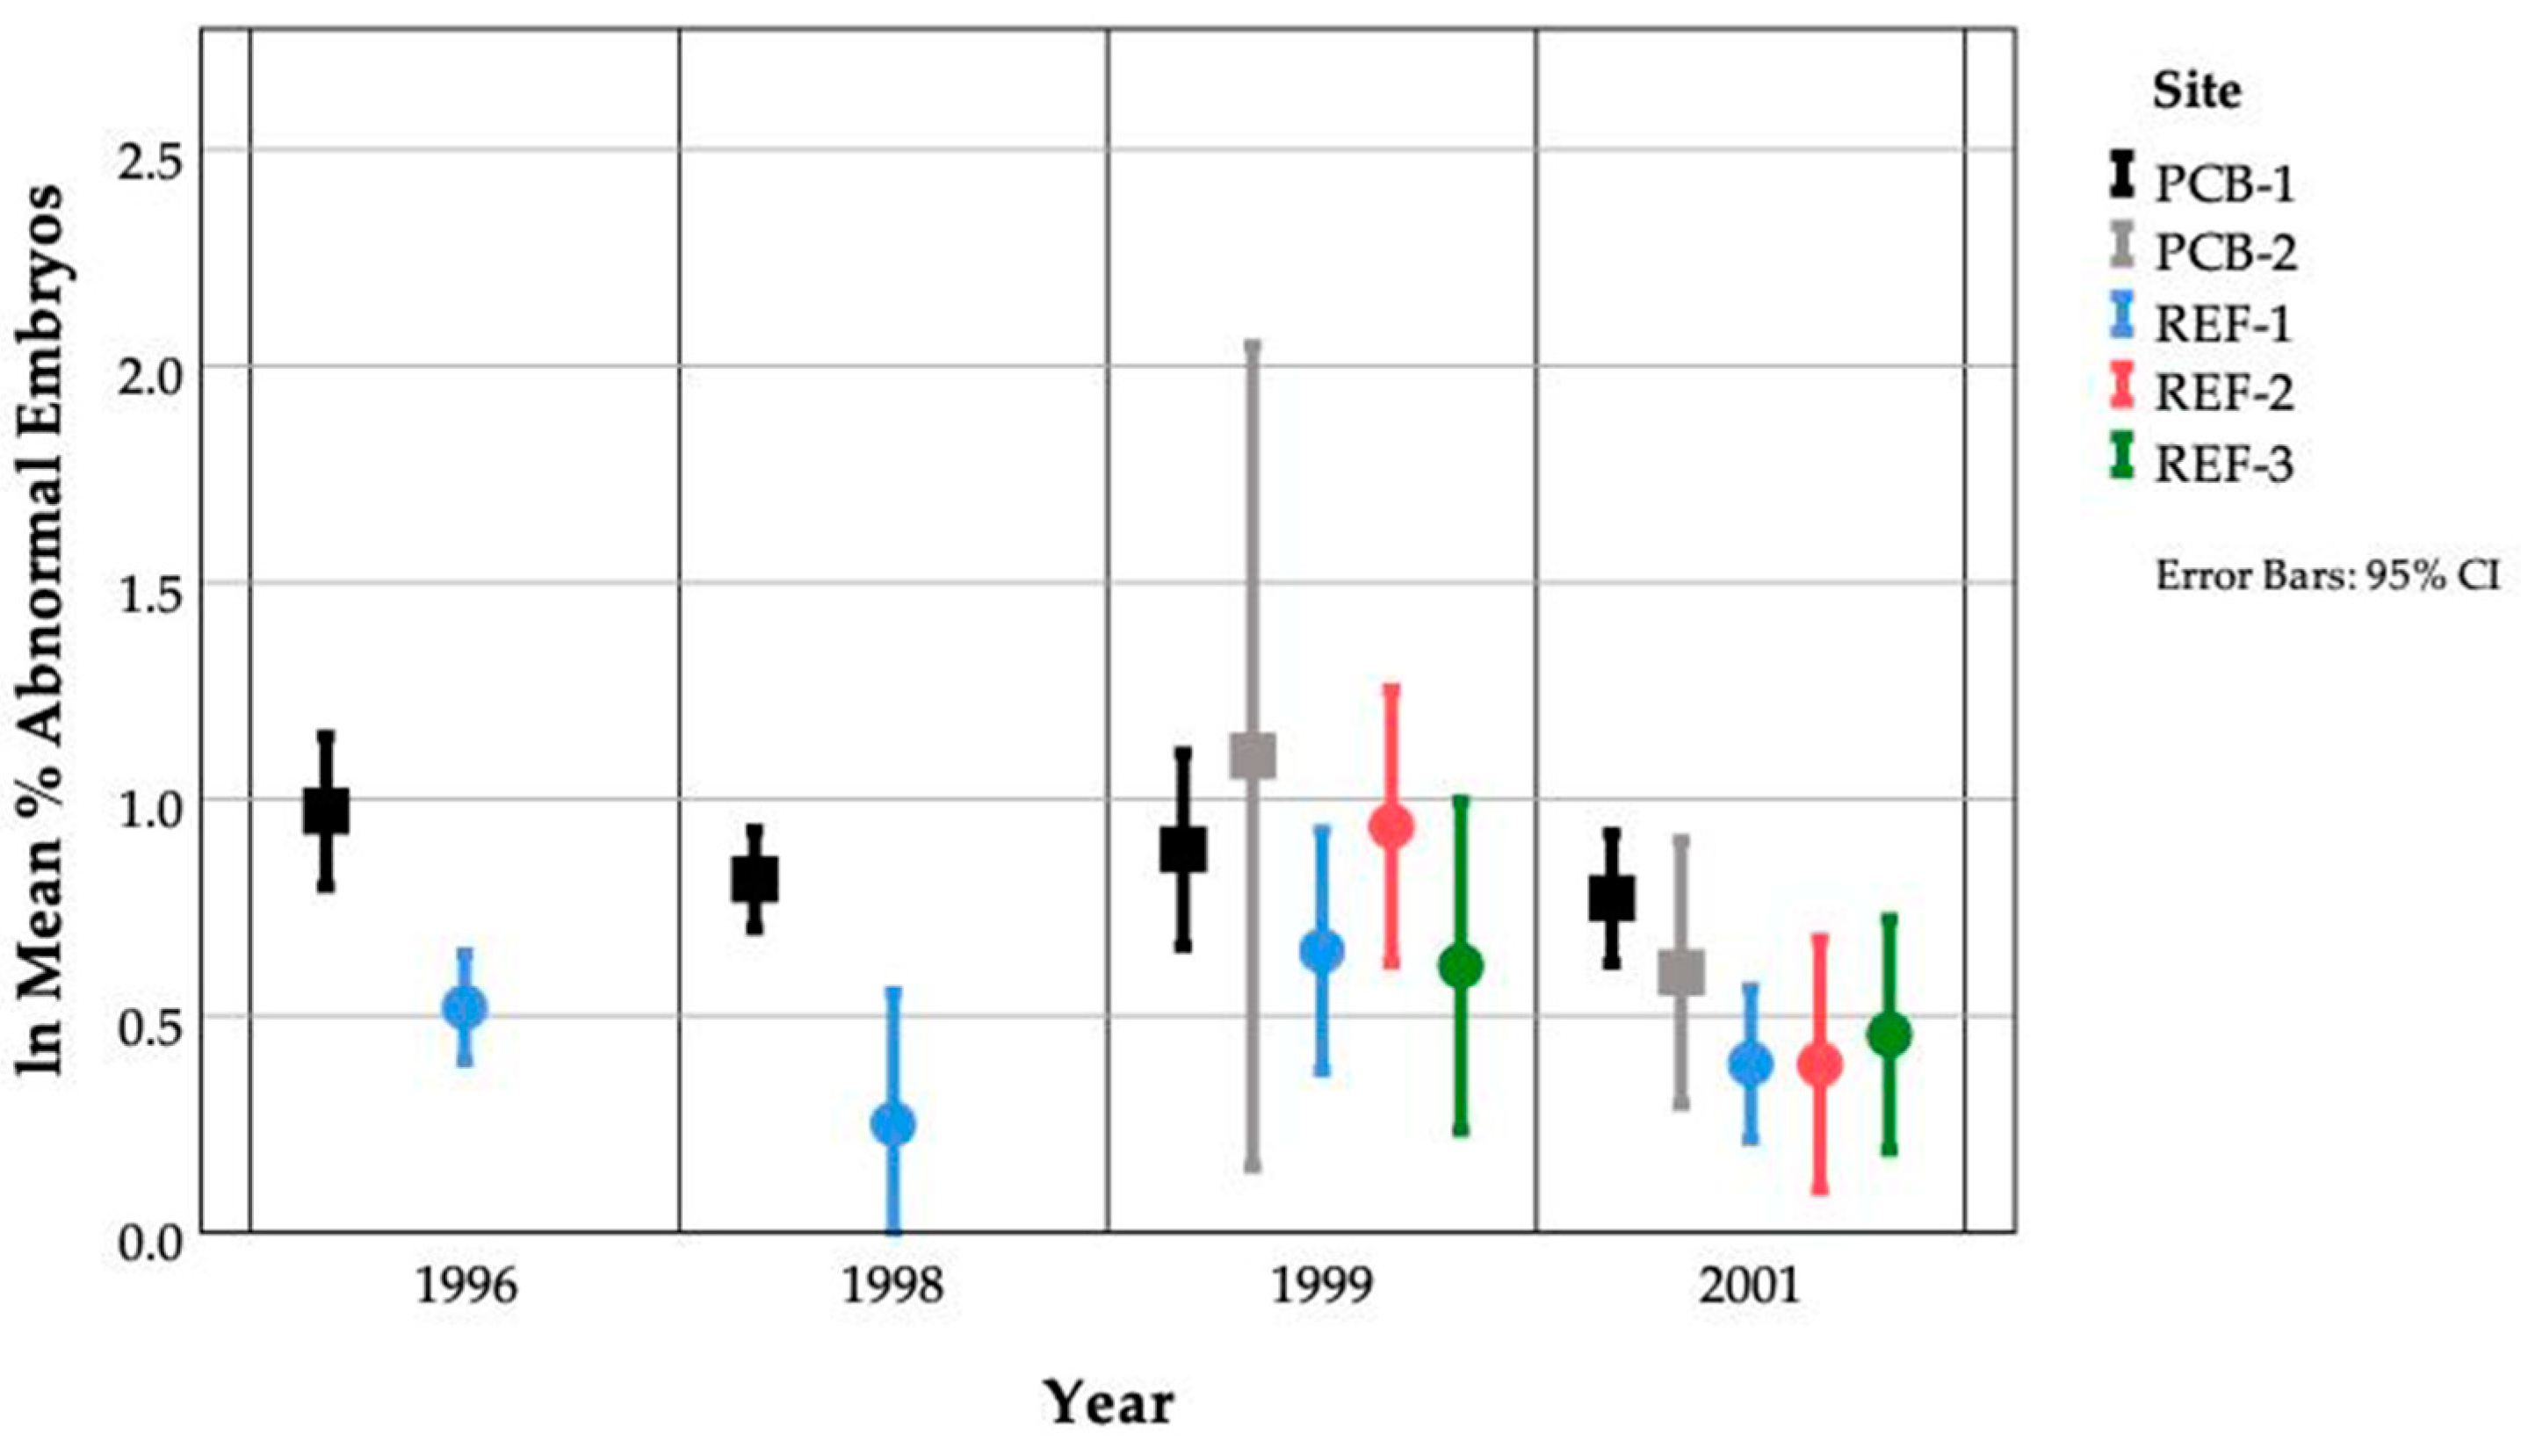
3.10. Inter-Annual Site Variation

The occurrence of embryonic abnormalities and fish PCB concentrations varied within sites between study seasons. Embryonic abnormalities at PCB-1 dropped from 5.8 and 6.0% in 1996 and 1998, respectively, to 2.8% and 3.2% in 1999 and 2001. Clutches were observed containing 100% abnormal embryos in 1996 and 1998 but not in 1999 and 2001. Mean fish PCB concentrations also dropped at PCB-1 from 39.8 μg/g in 1996 to 10.4 μg/g in 1999. Mean fish PCB concentrations rose again slightly in 2001 to 14.6 μg/g. Similarly at the PCB-2 site, mean embryo abnormalities decreased from 6.2% in 1999 to 2.0% in 2001. The seasonal differences were not significantly different for either embryo abnormalities or PCB concentration.
Year-to-year variation was much lower within the reference sites. During the four study seasons, embryo abnormalities at REF-1 ranged from 1.4 to 1.8%. Mean fish PCB concentrations dropped slightly between 1996 and 1999 (1.8 and 1.0 μg/g) and dropped again in 2001 (0.4 μg/g). Embryo abnormalities during 1999 and 2001 at REF-3 and REF-2 ranged from 1.6 to 1.7% and 1.3 to 2.5%, respectively. Mean fish PCB at REF-3 concentrations was the same between 1999 and 2001 (0.4 and 0.4 μg/g).

3.11. Other Contaminants

In 2001, polychlorinated dibenzo-p-dioxins, dibenzofurans, and nine metals were also measured in fish tissues. 2,3,7,8 tetrachlorodibenzo-p-dioxin (TCDD) was found in three of the six fish collected at the HO site (0.95 to 2.8 pg/g or 18.2 to 53.8 pg/g lipid). 2,3,7,8 tetrachlorodibenzofuran (TCDF) was found in one fish from the HO site (0.9 pg/g or 16.9 pg/g lipid). TCDF was also found in five of the six fish collected from PCB-1 (0.07–1.6 pg/g or 15.1–55.2 pg/g lipid). Octochlorinated dibenzodioxins were found in two fish from the HO site (6.5–6.7 pg/g or 146–406 pg/g lipid) and one fish from REF-3 (8.9 pg/g or 405 pg/g lipid). No other congeners were found.
Since TCDD and planar PCBs produce toxic effects through the same mechanism, TCDD toxicity equivalents (TEQs) in fish tissues were compared to TEQs calculated from mono-ortho and non-ortho PCBs (Table 8).
There were no consistent site differences in metal concentrations (Table 9). Site differences were found for barium, mercury and lead. Barium was significantly lower at REF-3 compared to REF-1 and HO but not different from PCB-1. However, PCB-1 was significantly lower than REF-1. Mercury was significantly higher at REF-3 while lead was significantly higher at PCB-1 compared to the other sites.

4. Discussion

The objective of this investigation was to determine if any adverse biological impacts could be identified at contaminated sites at Johnston Atoll. This assessment was accomplished by a survey of the occurrence of developmental abnormalities and the accumulation of PCBs in territorial damselfish occurring at two PCB-contaminated and three reference (with very low or non-measurable contaminants) sites within Johnston Atoll lagoon (details in [49,53,57]). Embryonic abnormalities, assessed in field-collected embryos, were positively related to fish whole-body PCB concentrations. PCBs were detected directly in these embryos using an Immunohistochemical detection technique [63]. As explained below in more detail, although embryonic abnormality rates are higher at the sites with PCB contamination, this increase is minimal and the sites are very localized. Thus, increased embryonic abnormalities do not appear to have an adverse effect at the population level. Furthermore, fishes have been exposed to this pollution for many generations.

4.1. Comparison of Tropical Species to Temperate-Zone Species

It is difficult to compare PCB accumulation in tropical fishes to their temperate counterparts. Environmental differences in factors such as temperature and organic carbon may result in different chemical bioavailability as well as detoxification and depuration rates. However, PCB biota sediment accumulation factors (BSAFs) for damselfish at Johnston Atoll were comparable to those found for temperate organisms. Accumulation factors for this study were 2.8 and 3.2 for PCB-1 (1996) and PCB-2, respectively. This compares to accumulation factors of 1.4 to 2.1 for grass shrimp, sandworms, and clams from New Bedford Harbor, Massachusetts [64]. A BSAF of 2.9 was measured for fish in a tidal river marsh on the Potomac River [65].

4.2. Comparison to Studies That Used Planktonic Embryos

Studies using planktonic embryos from temperate waters with high levels of environmental contamination found a wide range of embryonic abnormalities that generally increased with increasing contamination. In the southern North Sea, over four years, mean abnormality levels for the dab Limanda limanda (Pleuronectidae) and the flounder Platichthys flesus (Pleuronectidae) ranged from 11 to 22% and 15 to 21%, respectively. In contaminated areas mean abnormality rates ranged from 21 to 62% and 32 to 55% for dab and flounder, respectively [66]. These abnormality levels decreased with distance from shore and areas with the highest abnormalities were from stations near river estuaries and off the Dutch and German coasts. It was hypothesized that higher abnormalities were attributable to contaminants associated with hotspots such as those associated within Rhine and Elbe river runoff, contaminants from dumping wastes of titanium dioxide production and contaminants from an incineration area off the Dutch coast [66]. In the western Baltic, embryonic abnormalities were reported for cod (Gadus morhua, Gadidae) (18%), plaice (Pleuronectes platessa, Pleuronectidae) (24%) and flounder (Platichthys flesus) (44%) [17]. Natural causes were again ruled out and pollutants were suggested as causes for these high levels of abnormalities. There were positive statistical associations between high levels of abnormality and mortality in mackerel (Scomber scombrus, Scombridae) embryos from the New York Bight and heavy metals, aromatic and chlorinated hydrocarbons [14,67]. In one tropical study conducted in Australia, mean abnormality levels in coral reef, coastal undeveloped and coastal developed areas were 8.6%, 13.0% and 17.9%, respectively [18]. Although a statistical difference was observed in the abnormality levels for coastal developed areas that are influenced by agricultural and industrial runoff, it is difficult to compare these levels since embryos of all species were combined [18].

4.3. Natural or “Background” Levels of Abnormalities

In developing fish embryos, it would be expected that there is a natural or “background” level of morphological abnormalities that would be observed in “pristine” areas unaffected by anthropogenic inputs. Due to the atmospheric transport of contaminants such as chlorinated hydrocarbons, pristine environments that are completely isolated from anthropogenic inputs no longer exist. An estimate of atmospheric PCB input into the world’s oceans is 17 tons annually [68]. Contaminant inputs are increased dramatically in coastal regions due to industrial and sewer effluents [69]. The “background” levels of embryonic abnormalities in fish embryos (4–8%) defined by [18] were actually the lowest levels of abnormalities reported from the literature. These data were from several regions and several species including, pilchard and anchovy in the Aegean (9–12%), dab and sole in offshore areas of the North Sea (4–10%), and gadoid fishes off Norway (5–8%) [18,60,66,70]. Comparing these abnormality levels is interesting, but citing them as “background” is not appropriate because all of these areas are near high human population densities. It is unlikely that these areas are pristine. It is more appropriate to cite these values as the lowest abnormality levels reported. Data from this study suggest that “background” levels of embryonic abnormalities may be even lower than previously reported. The lowest mean abnormality levels reported for A. sordidus were 1.4 to 2.8% and mean abnormalities in D. albisella was 2%. In a pristine environment, these abnormality levels may be lower or may even approach zero. Since the “background” levels of embryonic abnormalities in fish embryos are unknown, laboratory studies may be necessary. However, laboratory studies still might not give abnormality levels similar to a pristine environment due to contamination already present in the fish and potential contamination of holding water and feeds.
Potential explanations for the lower abnormality levels observed in this study include Johnston’s remote location, natural differences between demersal and pelagic spawned embryos, species specific differences and trauma associated with sampling technique. The differing reproductive strategies of demersal and planktonic spawning fishes may be a source of variability, which could cause differences in levels of embryonic abnormalities. There is an enormous spectrum of demersal and planktonic eggs and larvae in terms of egg size and relative competency of the larvae at hatching. Pelagic spawning fishes provide no parental care and are continually producing gametes while demersal spawning fishes produce fewer offspring but provide parental care. In general, demersal spawning fishes put more energy into raising fewer offspring that are closer to competency at hatching. One hypothesis is that the millions of gametes produced by pelagic spawners would have a greater capacity to vary in terms of gamete quality, since their strategy is to produce as many offspring as possible which face extremely high levels of mortality. Demersal spawners that produce fewer offspring and invest more energy into producing larvae that hatch at a more advanced stage would have less variability in the quality of their gametes and thus a lower “background” abnormality level. While there is no supporting evidence for differences in the capacity of demersal and pelagic spawned embryos to vary in terms of “quality”, differences in the chemical makeup of the two types of embryos have been found. Planktonic embryos were found to contain a larger pool of free amino acids than demersal embryos which is thought to be important in final oocyte hydration. While the free amino acid content of demersal embryos is lower and very different from planktonic embryos, the protein content is higher in demersal embryos [71]. One potential example of the differences in the abnormality levels of demersal versus planktonic spawners is, the mean abnormality levels for two species of demersal spawners were between 1.4 to 2.8% for A. sordidus and D. albisella, respectively, in this study while the abnormality level from a remote coral reef site in Australia for tropical pelagic spawners was 8.6%.
Since the occurrence of embryonic abnormalities for other coral reef species in the tropics have not been measured at the species level, it is unknown whether or to what extent species specific differences occur. Species specific differences were found in mean embryonic abnormality levels for both winter and summer ichthyoplankton samples from the North Sea [66]. In winter-collected embryos, the mean abnormality levels for plaice, Pleuronectes platessa (11%) were lower than those for dab Limanda limanda (22%) and flounder Platichthys flesus (21%). In the summer common sole, Solea solea (Soleidae) mean embryonic abnormalities (4%) were lower than those for turbot, Psetta maxima (Scophthalmidae) (10%), little sole, Buglossidium luteum (Soleidae) (9%) and Norwegian topknot, Phrynorhombus norwegicus (Scophthalmidae) (9%). Species differences were found in in plaice (5–6%), sprat, Sprattus sprattus (Clupeidae) (20%), and whiting, Merlangius merlangus (Gadidae) (24%) [60]. Seasonal differences were also found in the North sea that were not attributable to species differences but most likely due to the extreme environmental conditions that occur in the North Sea [66]. While extreme seasonal changes in the tropics are not a factor, local changes in temperature and salinity may be important in determining regional differences in embryonic abnormality levels.
The incidence of developmental defects was not found to decrease by developmental stage, in contrast to studies that used planktonic embryos [17,18,60,66]. Declining levels of embryonic abnormalities with increasing developmental stage may be due to sampling bias of planktonic embryos in temperate regions. Several fishes from the Baltic are known to have species-specific differences in embryo buoyancy related to embryo size, volume and age [72]. Therefore, a sampling bias may occur due to the fact that advanced embryos are heavier than early embryos and may float deeper in the water column, resulting in fewer being sampled [17]. Certain pollutants may also affect the osmoregulatory abilities of the embryos, changing their buoyancy [72]. However, since early occurring abnormalities were found to be lethal in 85% of the cases, it is likely that the resulting dead embryos, which rapidly lose their ability to osmoregulate and therefore float, were not sampled [66].

4.4. Johnston Atoll

The Johnston Atoll study found 93% mortality in abnormal compared to 10% mortality in normal embryos incubated in the laboratory. This study did not include mortality during the larval phase. Other studies have found similar levels of mortality; 85% mortality in abnormal and only 5% mortality in normal embryos as well as negative correlations between hatching success and occurrence of embryonic abnormalities [17,66]. Mortality of only 93% suggests that a few embryos with minor abnormalities will survive to hatch. These larvae may be smaller at hatching or may be unable to feed or swim properly ultimately affecting survival to the juvenile phase. A few abnormal larvae were observed in the incubation chambers after hatching. These larvae had only one eye or bent notochords. However, other larvae may have appeared normal but could still have had subtle defects.
Reproductive impairment and reduced offspring survival have been observed in other fish species with embryo and ovary PCB concentrations similar to those observed in A. sordidus at Johnston Atoll. Mean embryo PCB concentrations from the Johnston PCB-contaminated sites (PCB-1 and PCB-2) were 4.9 and 7.1 μg/g, respectively. Mean embryo PCB concentration from one reference site (REF-1) was 2.2 μg/g. Gonad PCB concentrations were 2.2 and 0.4 μg/g at a PCB-contaminated (PCB-1) and uncontaminated site (REF-1), respectively. White croaker (Genyonemus lineatus) from coastal waters off of Los Angeles, CA with ovary PCB concentrations of 1.67 μg/g had lower fecundities and reduced fertilization compared to a reference population [73]. Hatchability was significantly reduced at ovary residues higher than 0.12 μg/g PCBs in wild Baltic flounder (Platichthys flesus) and herring (Clupea harengus) [40,41]. Embryo survival of starry flounder (Platichthys stellatus) from San Francisco Bay, CA decreased with increasing PCB concentrations from 0.05 to 20 μg/g in the embryos [48]. Offspring survival and the incidence of spinal abnormalities was inversely related to maternal liver TEQ in mummichogs (Fundulus heteroclitus) from New Bedford Harbor, MA [46,47]. Additionally, in New Bedford Harbor, MA wild winter flounder (Pseudopleuronectes americanus, Pleuronectidae) with ovary residues of 7.1 μg/g PCB had significantly shorter larvae than flounder from Fox Island (Narragansett Bay) with ovary residues of 0.2 μg/g [45].
It has been suggested that contaminants increase the variance of population attributes and this increased variance could be used as a biomarker of environmental stress [74,75]. Increased variability due to natural and anthropogenic stress decreases our ability to detect contaminant effects particularly when the focus is on the mean [76]. Increased variability was observed for mean % abnormal embryos at the PCB-contaminated sites in this study but not consistently. In 1999, mean abnormalities and CV for the PCB site PCB-1 were similar to that of the reference sites. This may be a function of the 74% decrease in fish PCB concentrations compared to 1996 and that PCB-1 fish PCBs were not significantly different from the reference sites. Conversely, the CV for the reference site REF-1 in 2001 was similar to that of the PCB-contaminated sites. The CV for the HO site was also high. However, the fishes at that site are exposed not only to low levels of PCBs but also to PAHs, dioxins and furans. In planktivorous damselfish (Abudefduf vaigiensis) embryos collected from the uncontaminated reef edge, the mean level of abnormalities was low compared to the reference sites. The CV was comparable to the PCB-contaminated sites. In this study, there was no overall consistent pattern in variability between PCB-contaminated and uncontaminated sites.
PCB concentrations and the occurrence of embryonic abnormalities in A. sordidus at Johnston Atoll seem to be decreasing over time. The decrease in PCBs could be the result of repeatedly sampling fish from the same areas. The PCB-1 and REF-1 sites were sampled 3 times over the course of 6 years and show a decrease in PCB concentrations, while REF-3 was sampled only twice over the course of three years and shows no change in fish PCB concentrations. A. sordidus live for at least 10 years and potentially longer [76]. When large reproductive adults are removed from the population, younger individuals replace them. These younger fish (which can be the same adult size as older fish) have not had as much time as the older fish to accumulate contaminants before the next sampling period. By removing the largest reproductive individuals from the population we may have removed those with the highest levels of contamination. It is likely that the majority of the subpopulation was removed from the PCB-2 site during the 1999 sampling since very few individuals were observed during this study. A previous study found no relationship between age and PCB concentration due to high variability in PCB concentrations [77]. However, it is likely that overall age of fish and therefore exposure time may have decreased. Otoliths were removed from all fish sampled in 1999 and 2001 but have not yet been analyzed to determine if these later samples are from younger fishes than those originally sampled in 1996.
We would have expected higher levels of embryo abnormalities from the PCB-2 pier site based on the PCB levels found in the fish during the 1999 season. However, very few embryo samples (n = 10) were collected from this site before the fish were collected for PCB analysis. Since the fish were collected early in the season, and it is unknown whether each fish spawns during each cycle, it is possible that the females collected had not spawned during our short embryo collection period. After fish were collected from this site, no more nests were observed. Unfortunately, no fish PCB analyses were conducted during 2001 at the PCB-2 site. Based on the levels of embryonic abnormalities observed in 2001, we would have expected lower PCB concentrations when compared to the 1999 sampling.
Similarly, we would have expected lower abnormality levels based on the relatively low PCB concentrations found at the HO site. However, other contaminants, including polychlorinated dibenzo-p-dioxins, furans and PAHs, are found at low concentrations and are additional stressors at this site. The TEQ including PCBs, dioxins and furans was much higher at the HO site (0.85 pg/g lipid) compared to the PCB-1 site (0.05 pg/g lipid) even though the mean level of abnormalities was slightly lower (HO = 2.9%, PCB-1 = 3.2%).
Determining the potential population-level effects of increased levels of embryonic abnormalities is difficult. It is unlikely that an increase from 2% to 6% in the mean level of embryonic abnormalities is biologically significant and would cause any change in recruitment for a species with a planktonic larval phase and extremely high levels of natural mortality. In 1996 and 1998, clutches were observed at the PCB-contaminated sites with 100% abnormal embryos. Based on the results of this study, higher tissue PCB concentrations correlate with higher levels of embryonic abnormalities. Therefore, we would expect the fish spawning the 100% abnormal clutches to have the highest levels of PCBs. However, even in the PCB-contaminated sites, the majority of clutches contained few abnormalities. Therefore, when the many “low” values are averaged with the few “high” values, the result is a relatively low overall mean level of abnormalities. Obviously, the reproductive output of the highly contaminated fish with 100% abnormal embryos will be affected dramatically. However, the reproductive success of the majority of fish at the PCB-contaminated sites will be affected very little compared to the fish at the reference locations.
The low mean levels of embryonic abnormalities at the PCB-contaminated sites are likely to be a function of the patchiness and localized nature of the PCB contamination in the sediments. PCB concentrations in the adult fishes were highly variable [77]. Since damselfish are territorial, those inhabiting the PCB-contaminated patches are going to have higher levels in their tissues. Damselfish often prefer artificial substrates (e.g., plastic and metal debris) and can often increase their reproductive success by using them [78,79]. A. sordidus at Johnston Atoll also seem to prefer artificial substrates since nests were not observed on natural structures in areas where artificial structures were present. Unfortunately, the areas with the artificial substrates are usually the areas with the highest levels of contamination, so if the fish are being drawn to the areas with artificial structures they are also being drawn to the contamination.
Another objective of this study was to determine if adverse affects were observed in PCB-contaminated areas as predicted by sediment quality benchmarks (ER-L, ER-M) [51]. Categorizing sediments, as toxic based on ER-L sediment quality guidelines alone is misleading since these values are not thresholds, but concentrations along a continuum roughly relating bulk chemistry with toxicity [52]. Some sediment samples at Johnston contained PCB concentrations exceeding these sediment quality guidelines. The ER-L and ER-M sediment quality guidelines roughly correspond to a 10% and 50% probability of toxicity. However, these guidelines are based on studies of temperate organisms and the values for PCBs are not as reliable as for other compounds [51]. Both the PCB-1 (1996) and PCB-2 sites had sediment samples (1 of 55 samples from PCB-1 and 3 of 27 samples from PCB-2) exceeding the ER-M [48]. Adverse effects in the form of increased levels of embryo abnormalities were observed at these sites. These adverse effects result in increased embryo mortality. In 1996, embryo abnormalities were significantly higher at the PCB-1 site compared to the REF-1 reference site. In 1999, the PCB-2 and PCB-1 PCB sites had the highest mean embryo abnormalities but due to the high levels of variability, not significantly so. The PCB-2 site has the highest levels of PCBs in both sediment and fish tissues and also has the highest level of embryo abnormalities. However, PCB concentrations in PCB-1 fish were not significantly different from the reference sites and were dramatically but not significantly lower than in 1996. In addition, the mean embryo abnormalities are much lower than at the PCB-2 site and much closer to the reference levels (PCB-1 = 2.8%, PCB-2 = 6.2%). Therefore, even though some sediment samples still contained PCB exceeding only the ER-L sediment quality guideline at PCB-1 in 1999 there appears to be no differences in the levels of embryo abnormalities between it and the reference sites.
Other factors are known to affect the quality of fish embryos, resulting in lowered viability. Natural or contaminant-induced site differences in habitat quality and food availability could cause differences in levels of embryo abnormalities. Nutrition and diet of fishes are known to influence fecundity, egg size, chemical composition and embryo and larval viability [80,81,82,83,84]. This study related fish PCB contamination to the occurrence of embryonic abnormalities at multiple sites with varying PCB contamination and habitat qualities.
While it is difficult to attribute observations of embryonic abnormalities to specific contaminants, their presence at higher levels compared to pristine or reference habitats may indicate their use as a significant monitoring tool. Chemical measurements alone cannot adequately assess the biological quality of the environment. Numerous biotic and abiotic factors play important roles in either attenuating or exacerbating the toxicity of a chemical in the environment. This study measured an integrated biological response to both natural and anthropogenic stressors in terms of damselfish development over several years. The outcome of this study has been to give a relative measure of pollution or contamination in Abudefduf sordidus and their habitats at Johnston Atoll. Additionally, this study provides a relative measure of the occurrence of embryonic abnormalities occurring in both PCB-contaminated and uncontaminated areas. Due to the unknown level of natural mortality in the embryonic, larval and post-settlement stages of marine fishes, it is difficult to relate levels of abnormalities to a biologically significant change in the fish population.

5. Conclusions

The use of embryonic abnormality levels in a demersal spawning damselfish is a sensitive bioindicator tool that has shown localized differences potentially due to anthropogenic changes in the environment. Statistically significant differences were found in embryonic abnormality rates between spawning colonies. In addition, embryonic abnormality levels were found to increase with increasing concentration of PCBs found in sediments. While this does not demonstrate “cause and effect”, it is suggestive of that pattern. Adverse effects measured as abnormalities in field-collected A. sordidus embryos occurred on average 1.5% more frequently at PCB-contaminated compared to reference (REF) sites. PCB concentration in sediments and adult fish tissue from these sites exceeded sediment quality guidelines and fish tissue benchmarks for the protection of aquatic organisms. While adverse effects were detected at sites with PCB concentrations exceeding environmental quality guidelines, it is unlikely that highly localized effects only 1.5% higher than background levels will result in population-level changes. The embryonic abnormality levels observed were among the lowest reported in the literature.
Embryo abnormalities could be considered an adverse effect since high mortality in abnormal compared to normal laboratory incubated embryos indicated increased embryo mortality. A significant residue–effect relationship was found between total PCB concentration in adult fish and embryo abnormalities. The occurrence of embryo abnormalities was positively related to fish PCB concentration, and adult gonad PCB concentration was positively related to whole-body PCB concentration, suggesting that embryo dose is directly related to adult fish tissue PCB concentration.

Author Contributions

Conceptualization, L.K.L. and P.S.L.; study design, L.K.L. and P.S.L.; underwater data collection, L.K.L. and P.S.L.; writing—original draft preparation, L.K.L.; writing—review and editing, P.S.L. and L.K.L.; visualization, L.K.L.; project administration, P.S.L. funding acquisition, P.S.L. All authors have read and agreed to the published version of the manuscript.

Funding

This work was supported by grants provided by the Army Research Office (DAAG55-98-1-0304, DAAD19-02-1-0218), the Office of Naval Research (N00014-19-J1519, N00014-92-J-1969 and N00014-95-1-1324), and the Legacy Resource Management Program (DADA87-00-H-0021, DACA87-01-H-0013).

Institutional Review Board Statement

The study was conducted in accordance with the Declaration of Helsinki, and approved by the Institutional Review Board (or Ethics Committee) of The Marine Biological Laboratory and Boston University (IACUC 97-04) and a US Fish and Wildlife Service special use permit 12515–00003.

Acknowledgments

This study was part of the US Army’s Johnston Atoll chemical weapons demilitarization program and was sponsored to implement coral reef conservation and protection. We owe our many friends and colleagues at DoD as well as our scientific partners huge thanks for making our research in the Pacific Islands possible. Chemical analyses were performed by Wright State University and Washington Group.

Conflicts of Interest

The authors declare no conflict of interest. The funders had no role in the design of the study; in the collection, analyses, or interpretation of data; in the writing of the manuscript, or in the decision to publish the results.

References

  1. Adams, S.M.; Ham, K.D. Current Challenges in Contaminant Effects Monitoring: Multiple Stressors and Ecological Significance (No. CONF-9607154-1); Oak Ridge National Lab.: Oak Ridge, TN, USA, 1996. [Google Scholar]
  2. Jameson, S.C.; Erdmann, M.V.; Gibson, G.R., Jr.; Potts, K.W. Development of biological criteria for coral reef ecosystem assessment. Atoll Res. Bull. 1998, 450, 102. [Google Scholar] [CrossRef] [Green Version]
  3. Johannes, R.E.; Betzer, S.B. Introduction: Marine communities respond differently to pollution in the tropics than at higher latitudes. In Elsevier Oceanography Series; Elsevier: Amsterdam, The Netherlands, 1975; Volume 12, pp. 1–12. [Google Scholar]
  4. Peters, E.C.; Gassman, N.J.; Firman, J.C.; Richmond, R.H.; Power, E.A. Ecotoxicology of tropical marine ecosystems. Environ. Toxicol. Chem. 1997, 16, 12–40. [Google Scholar] [CrossRef]
  5. Erdmann, M.V.; Caldwell, R.L. Stomatopod crustaceans as bioindicators of marine pollution stress on coral reefs. In Proceedings of the Eighth International Coral Reef Symposium, Panama City, Panama, 24–29 June 1997; Volume 2, pp. 1521–1526. [Google Scholar]
  6. Hourigan, T.F.; Timothy, C.T.; Reese, E.S. Coral reef fishes as indicators of environmental stress in coral reefs. In Marine Organisms as Indicators; Springer: New York, NY, USA, 1988; pp. 107–135. [Google Scholar]
  7. Crosby, M.P.; Reese, E. A Manual for Monitoring Coral Reefs with Indicator Species: Butterflyfishes as Indicators of Change on Indo-Pacific Reefs; Office of Ocean and Coastal Resource Management, National Oceanic and Atmospheric Administration: Silver Spring, MD, USA, 1996; 45p. [Google Scholar]
  8. Doherty, P.J. Spatial and temporal patterns in recruitment. In The Ecology of Fishes on Coral Reefs; Sale, P., Ed.; Academic Press: San Diego, CA, USA, 1991; pp. 261–293. [Google Scholar]
  9. Alcolado, P.M.; Herrera-Moreno, A.; Martinez-Estalella, N. Sessile communities as environmental bio-monitors in Cuban coral reefs. Oceanogr. Lit. Rev. 1995, 8, 680. [Google Scholar]
  10. Stephens, J.S.; Hose, J.E.; Love, M.S. Fish assemblages as indicators of environmental change in nearshore environments. In Marine Organisms as Indicators; Springer: New York, NY, USA, 1988; pp. 91–105. [Google Scholar]
  11. Brown, B.E. Assessing environmental impacts on coral reefs. In Proceedings of the Sixth International Coral Reef Symposium, Townsville, Australia, 8–12 August 1988; Volume 1, pp. 71–80. [Google Scholar]
  12. Wenner, A.M. Crustaceans and other invertebrates as indicators of beach pollution. In Marine Organisms as Indicators; Springer: New York, NY, USA, 1988; pp. 199–229. [Google Scholar]
  13. Donaldson, E.M. Reproductive indices as measures of the effects of environmental stressors in fish. Am. Fish. Soc. Symp. 1990, 8, 109–122. [Google Scholar]
  14. McIntyre, A.D.; Pearce, J.B.; Longwell, A.C.; Hughes, J.B. Cytologic, cytogenetic, and developmental state of Atlantic mackerel eggs from sea surface waters of the New York Bight, and prospects for biological effects monitoring with ichthyoplankton [pollution, cytogenetic observations]. Rapp. Proces-Verbaux Reun. 1980, 179, 275–291. [Google Scholar]
  15. Chang, S.; Longwell, A. Examining statistical associations of malformation cyto-pathology and cytogenic abnormality of Atlantic mackerel embryos with indictor levels of environmental contaminants in the New York Bight. CM/ICES 1984, 11, 1–9. [Google Scholar]
  16. Hardy, J.; Kiesser, S.; Antrim, L.; Stubin, A.; Kocan, R.; Strand, J. The sea-surface microlayer of Puget Sound: Part I. Toxic effects on fish eggs and larvae. Mar. Environ. Res. 1987, 23, 227–249. [Google Scholar]
  17. Westernhagen, H.V.; Dethlefsen, V.; Cameron, P.; Berg, J.; Fürstenberg, G. Developmental defects in pelagic fish embryos from the western Baltic. Helgol. Mar. Res. 1988, 42, 13–36. [Google Scholar] [CrossRef] [Green Version]
  18. Klumpp, D.W.; Von Westernhagen, H. Biological effects of pollutants in Australian tropical coastal waters: Embryonic malformations and chromosomal aberrations in developing fish eggs. Mar. Pollut. Bull. 1995, 30, 158–165. [Google Scholar] [CrossRef]
  19. Kingsford, M.J.; Gray, C.A. Influence of pollutants and oceanography on abundance and deformities of wild fish larvae. In Detecting Ecological Impacts: Concepts and Applications in Coastal Habitats; Schmitt, R.J., Osenberg, C.W., Eds.; Academic Press: San Diego, CA, USA, 1996; pp. 235–255. [Google Scholar]
  20. Seitz, A.; Ratte, H.T. Aquatic ecotoxicology: On the problems of extrapolation from laboratory experiments with individuals and populations to community effects in the field. Comp. Biochem. Physiol. 1991, 100, 301–304. [Google Scholar] [CrossRef]
  21. Chapman, P.M. Extrapolating laboratory toxicity results to the field. Environ. Toxicol. Chem. 1996, 14, 927–930. [Google Scholar] [CrossRef]
  22. EPA. Ecological Risk Assessment Guidance for Superfund: Process for Designing and Conducting Ecological Risk Assessments—Interim Final, EPA 540/R-97-006; Office of Solid Waste and Emergency Response, U.S. Environmental Protection Agency: Washington, DC, USA, 1997.
  23. EPA. EPA 821/R-97-001 Method 1668: Toxic Polychlorinated Biphenyls by Isotope Dilution High Resolution Gas Chromatography/High Resolution Mass Spectrometry; U.S. Environmental Protection Agency: Washington, DC, USA, 1997.
  24. Allen, G.R. Damselfishes of the World; Mergus Publishers: Melle, Germany, 1991; p. 271. [Google Scholar]
  25. Lobel, L.K. Toxic caviar: Using fish embryos to monitor contaminant impacts. In Diving for Science 2011. Proceedings of the American Acade My of Underwater Sciences 30th Symposium; Pollock, N.W., Ed.; AAUS: Dauphin Island, AL, USA, 2011; pp. 34–39. [Google Scholar]
  26. Lobel, L.K.; Lobel, P.S. Choosing organisms for monitoring contaminant exposure on coral reefs: Case studies from Johnston Atoll, Central Pacific Ocean. In Proceedings of the American Academy of Underwater Sciences 34th Symposium; Lobel, L.K., Ed.; Diving for Science 2015: Key West, FL, USA, 2015; pp. 48–64. [Google Scholar]
  27. Kerr, L.M. Embryonic Abnormalities and Reproductive Output for the Damselfish, Abudefduf sordidus (Pomacentridae), Relative to Environmental Contamination at Johnston Atoll, Central Pacific Ocean. Master’s Thesis, Boston University, Boston, MA, USA, 1997. [Google Scholar]
  28. Kerr, L.M.; Lobel, P.S.; Ingoglia, J.M. Evaluation of a reporter gene system biomarker for detecting contamination in tropical marine sediments. Biol. Bull. 1999, 197, 303–306. [Google Scholar] [CrossRef] [PubMed]
  29. Lobel, L.K.; Lobel, P.S. Junkyard damselfishes: Spawning behavior and nest site selection. In Proceedings of the AAUS/EDSP Joint International Diving Symposium, Curaçao, Netherlands Antilles, 24–27 October 2013; pp. 167–178. [Google Scholar]
  30. Kerr Lobel, L.; Drown, D.M.; Barber, P.H.; Lobel, P.S. A genetic assessment of parentage in the blackspot sergeant damselfish, Abudefduf sordidus (Pisces: Pomacentridae). Fishes 2019, 4, 53. [Google Scholar] [CrossRef] [Green Version]
  31. Shadrin, A.M.; Emel’yanova, N.G. Embryonic-larval development and some data on the reproductive biology of Abudefduf sexfasciatus (Pomacentridae: Perciformes). J. Ichthyol. 2007, 47, 67–80. [Google Scholar] [CrossRef]
  32. Wittenrich, M.L.; Turingan, R.G.; Cassiano, E.J. Rearing tank size effects feeding performance, growth, and survival of sergeant major, Abudefduf saxatilis, larvae. Aquac. Aquar. Conserv. Legis. 2012, 5, 393–402. [Google Scholar]
  33. Cairns, T.; Doose, G.M.; Froberg, J.E.; Jacobson, R.A.; Siegmund, E.G. Analytical chemistry of PCBs. PCBs Environ. 1986, 1, 1–45. [Google Scholar]
  34. Weis, J.S.; Weis, P. Effects of environmental pollutants on early fish development. Crit. Rev. Aquat. Sci. 1989, 1, 45–73. [Google Scholar]
  35. Freeman, H.C.; Sangalang, G.; Flemming, B. The sublethal effects of a polychlorinated biphenyl (Aroclor 1254) diet on the Atlantic cod (Gadus morhua). Sci. Total Environ. 1982, 24, 1–11. [Google Scholar] [CrossRef]
  36. Matsuyama, H.; Yano, T. Effect of PCB on the Steroid Hormone Metabolism in Goldfish Liver Microsome; Science Bulletin of the Faculty of Agriculture, Kyushu University: Fukuoka, Japan, 1987; Volume 42, pp. 1–7. [Google Scholar]
  37. Thomas, P. Reproductive endocrine function in female Atlantic croaker exposed to pollutants. Mar. Environ. Res. 1988, 24, 179–183. [Google Scholar] [CrossRef]
  38. Janssen, P.A.H.; Lambert, J.G.D.; Goos, H.T. The annual ovarian cycle and the influence of pollution on vitellogenesis in the flounder, Pleuronectes flesus. J. Fish Biol. 1995, 47, 509–523. [Google Scholar] [CrossRef]
  39. Hose, J.E.; Hannah, J.B.; Landolt, M.L.; Miller, B.S.; Felton, S.P.; Iwaoka, W.T. Uptake of benzo [α] pyrene by gonadal tissue of flatfish (family Pleuronectidae) and its effects on subsequent egg development. J. Toxicol. Environ. Health Part A Curr. Issues 1981, 7, 991–1000. [Google Scholar] [CrossRef] [PubMed]
  40. Von Westernhagen, H.; Rosenthal, H.; Dethlefsen, V.; Ernst, W.; Harms, U. Bioaccumulating substances and reproductive success in Baltic flounder Platichthys flesus. Aquat. Toxicol. 1981, 1, 85–99. [Google Scholar] [CrossRef]
  41. Hansen, P.D.; Von Westernhagen, H.; Rosenthal, H. Chlorinated hydrocarbons and hatching success in Baltic herring spring spawners. Mar. Environ. Res. 1985, 15, 59–76. [Google Scholar] [CrossRef]
  42. Halter, M.T.; Johnson, H.E. Acute toxicities of a polychlorinated biphenyl (PCB) and DDT alone and in combination to early life stages of coho salmon (Oncorhynchus kisutch). J. Fish. Board Can. 1974, 31, 1543–1547. [Google Scholar] [CrossRef]
  43. Schimmel, S.C.; Hansen, D.J.; Forester, J. Effects of aroclor (R) 1254 on laboratory-reared embryos and fry of sheepshead minnows (Cyprinodon variegatus). Trans. Am. Fish. Soc. 1974, 103, 582–586. [Google Scholar] [CrossRef]
  44. Billsson, K.; Westerlund, L.; Tysklind, M.; Olsson, P.E. Developmental disturbances caused by polychlorinated biphenyls in zebrafish (Brachydanio rerio). Mar. Environ. Res. 1998, 46, 461–464. [Google Scholar] [CrossRef]
  45. Black, D.E.; Phelps, D.K.; Lapan, R.L. The effect of inherited contamination on egg and larval winter flounder, Pseudopleuronectes americanus. Mar. Environ. Res. 1988, 25, 45–62. [Google Scholar] [CrossRef]
  46. Black, D.E.; Gutjahr-Gobell, R.; Pruell, R.J.; Bergen BMcElroy, A.E. Effects of non-ortho and mono-ortho polychlorinated biphenyls on reproduction in Fundulus heteroclitus (Linnaeus). Environ. Toxicol. Chem. 1998, 17, 1396–1404. [Google Scholar] [CrossRef]
  47. Black, D.E.; Gutjahr-Gobell, R.; Pruell, R.J.; Bergen, B.; Mills, L.; McElroy, A.E. Reproduction and polychlorinated biphenyls in Fundulus heteroclitus (Linnaeus) from new bedford harbor, massachusetts, USA. Environ. Toxicol. Chem. 1998, 17, 1405–1414. [Google Scholar] [CrossRef]
  48. Spies, R.B.; Rice, D.W. Effects of organic contamination on reproduction of the starry flounder (Platichthys stellatus) in San Francisco Bay. II. Reproductive success of fish captured in San Francisco Bay and spawned in the laboratory. Mar. Biol. 1988, 98, 191–200. [Google Scholar]
  49. Lobel, L.K.; Lobel, P.S. Contaminants in Fishes from Johnston Atoll. In 11th International Coral Reef Symposium; ReefBase: Fort Lauderdale, FL, USA, 2008. [Google Scholar]
  50. Lobel, L.K.; Lobel, P.S. Current status of the US military atolls in the Pacific: Johnston and Wake. In World Seas: An Environmental Evaluation; Academic Press: Cambridge, MA, USA, 2019; pp. 645–659. [Google Scholar]
  51. Long, E.R.; MacDonald, D.D.; Smith, S.L.; Calder, F.D. Incidence of adverse biological effects within ranges of chemical concentrations in marine and estuarine sediments. Environ. Manag. 1995, 19, 81–97. [Google Scholar] [CrossRef]
  52. O’Connor, T.P. The sediment quality guideline, ERL, is not a chemical concentration at the threshold of sediment toxicity. Mar. Pollut. Bull. 2004, 49, 383–385. [Google Scholar] [CrossRef] [PubMed] [Green Version]
  53. Lobel, P.S.; Lobel, L.K. Aspects of the biology and geomorphology of Johnston and Wake atolls, Pacific Ocean. In Coral Reefs of the USA; Springer: Dordrecht, The Netherlands, 2008; pp. 655–689. [Google Scholar]
  54. Randall, J.E.; Lobel, P.S.; Chave, E.H. Annotated checklist of the fishes of Johnston Island. Pac. Sci. 1985, 39, 24–80. [Google Scholar]
  55. Kosaki, R.K.; Pyle, R.L.; Randall, J.E.; Irons, D.K. New records of fishes from Johnston Atoll, with notes on biogeography. Pac. Sci. 1991, 45, 186–203. [Google Scholar]
  56. Lobel, P.S. Marine life of Johnston Atoll, Central Pacific Ocean; Natural World Press: Vida, OR, USA, 2003. [Google Scholar]
  57. Lobel, P.S.; Kerr, L.M. Status of contaminants in Johnston Atoll lagoon sediments after 70 years of US military activity. In Proceedings of the Ninth International Coral Reef Symposium, Bali, Indonesia, 23–27 October 2000; Volume 2, pp. 861–866. [Google Scholar]
  58. Shaw, E.S. The embryology of the sergeant major, Abudefduf saxatilis. Copeia 1955, 1955, 85–89. [Google Scholar] [CrossRef]
  59. Fritzsche, R.A. Chaetodontidae through Ophidiidae; in Development of Fishes of the Mid-Atlantic Bight; Fish and Wildlife Service, US Department of the Interior: Washington, DC, USA, 1978; Volume 4, 340p. [Google Scholar]
  60. Cameron, P.; Berg, J. Morphological and chromosomal aberrations during embryonic development in dab, Limanda. Mar. Ecol. Prog. Ser. 1992, 91, 163–169. [Google Scholar] [CrossRef]
  61. Van den Berg, M.; Birnbaum, L.; Bosveld, A.T.C.; Brunstrom, B.; Cook, P.; Freeley, M.; Giesey, J.P.; Hanberg, A.; Hasegawa, R.; Kennedy, S.W.; et al. Toxic equivalency factors (TEFs) for PCBs, PCDDs, PCDFs for humans and wildlife. Environ. Health Perspect. 1998, 106, 775–792. [Google Scholar] [CrossRef]
  62. Zabel, E.W.; Cook, P.M.; Peterson, R.E. Toxic equivalency factors of polychlorinated dibenzo-p-dioxin, dibenzofuran and biphenyl congeners based on early life stage mortality in rainbow trout (Oncorhynchus mykiss). Aquat. Toxicol. 1995, 31, 315–328. [Google Scholar] [CrossRef]
  63. Lobel, L.M.K.; Davis, E.A. Immunohistochemical detection of polychlorinated biphenyls in field collected damselfish (Abudefduf sordidus; Pomacentridae) embryos and larvae. Environ. Pollut. 2002, 120, 529–532. [Google Scholar] [CrossRef]
  64. Pruell, R.J.; Rubinstein, N.I.; Taplin, B.K.; LiVolsi, J.A.; Bowen, R.D. Accumulation of polychlorinated organic contaminants from sediment by three benthic marine species. Arch. Environ. Contam. Toxicol. 1993, 24, 290–297. [Google Scholar] [CrossRef]
  65. Crimmins, B.S.; Brown, P.D.; Kelso, D.P.; Foster, G.D. Bioaccumulation of PCBs in aquatic biota from a tidal freshwater marsh ecosystem. Arch. Environ. Contam. Toxicol. 2002, 42, 396–404. [Google Scholar] [CrossRef] [PubMed]
  66. Cameron, P.; Berg, J.; Dethlefsen, V.; Von Westernhagen, H. Developmental defects in pelagic embryos of several flatfish species in the southern North Sea. Neth. J. Sea Res. 1992, 29, 239–256. [Google Scholar] [CrossRef]
  67. Longwell, A.C.; Chang, S.; Hebert, A.; Hughes, J.B.; Perry, D. Pollution and developmental abnormalities of Atlantic fishes. Environ. Biol. Fishes 1992, 35, 1–21. [Google Scholar] [CrossRef]
  68. Atlas, E.; Bidleman, T.; Giam, C.S. Atmospheric transport of PCBs to the oceans. In PCBs and the Environment; CRC Press: Boca Raton, FL, USA, 1986; Volume 1, pp. 79–100. [Google Scholar]
  69. Stout, V.F. What is happening to PCBs. Elements of Effective Environmental Monitoring as Illustrated by an Analysis of PCB Trends in Terrestrial and Aquatic Organisms. In PCBs and the Environment; CRC Press: Boca Raton, FL, USA, 1986; Volume 1, pp. 163–206. [Google Scholar]
  70. Yannopoulos, A.; Yannopoulos, C. Fish egg mortality and abnormal embryogenesis. Rapp. Proces Verbaux Reun. Comm. Int. Pour I’Explor. 1981, 27, 143–146. [Google Scholar]
  71. Rønnestad, I.; Robertson, R.; Fyhn, H.J. Free amino acids and protein content in pelagic and demersal eggs of tropical marine fishes. In The Fish Egg; MacKinlay, D.D., Eldridge, M., Eds.; American Fisheries Society: Vancouver, BC, Canada, 1996; pp. 81–84. ISBN 0-9698631-0-7. [Google Scholar]
  72. Rosenthal, H.; Alderdice, D.F. Sublethal effects of environmental stressors, natural and pollutional, on marine fish eggs and larvae. J. Fish. Res. Board Can. 1976, 33, 2047–2065. [Google Scholar]
  73. Cross, J.N.; Ellen, H.J. Evidence for impaired reproduction in white croaker (Genyonemus lineatus) from contaminated areas off southern California. Mar. Environ. Res. 1988, 24, 185–188. [Google Scholar] [CrossRef]
  74. Forbes, V.E.; Moller, V.; Depledge, M.H. Intrapopulation variability in sublethal response to heavy metal stress in sexual and asexual gastropod populations. Funct. Ecol. 1995, 9, 477–484. [Google Scholar] [CrossRef]
  75. Callaghan, A.; Holloway, G.J. The relationship between environmental stress and variance. Ecol. Appl. 1999, 9, 456–462. [Google Scholar] [CrossRef]
  76. Forbes, V.E.; Depledge, M.H. Environmental stress and the distribution of traits within populations. In ECOtoxicology: Ecological Dimensions; Springer: Dordrecht, The Netherlands, 1996; pp. 71–86. [Google Scholar]
  77. Kerr, L.M.; Lang, K.L.; Lobel, P.S. PCB contamination relative to age for a Pacific damselfish, Abudefduf sordidus (Pomacentridae). Biol. Bull. 1997, 193, 279–281. [Google Scholar] [CrossRef]
  78. Itzkowitz, M. Habitat selection and subsequent reproductive success in the beaugregory damselfish. Environ. Biol. Fishes 1991, 30, 287–293. [Google Scholar] [CrossRef]
  79. Itzkowitz, M.; Itzkowitz, D.E.; Shelly, D. Territory use and disuse in the beaugregory damselfish. Bull. Mar. Sci. 1995, 57, 653–662. [Google Scholar]
  80. Eskelinen, P. Effects of different diets on egg production and egg quality of Atlantic salmon (Salmo salar L.). Aquaculture 1989, 79, 275–281. [Google Scholar] [CrossRef]
  81. Lovell, T. Nutrition and Feeding of Fish; Van Nostrand Reinhold: New York, NY, USA, 1989; Volume 260. [Google Scholar]
  82. Craik, J.C.A. Egg quality and egg pigment content in salmonid fishes. Aquaculture 1985, 47, 61–88. [Google Scholar] [CrossRef]
  83. Hubbs, C.; Stavenhagen, L. Effects of maternal carotenoid deficiency on the viability of darter (Osteichthyes) offspring. Physiol. Zool. 1958, 31, 280–283. [Google Scholar] [CrossRef]
  84. Bodammer, J.E. The teratological and pathological effects of contaminants on embryonic and larval fishes exposed as embryos: A brief review. In Water Quality and the Early Life Stages of Fishes; Fuiman, L.A., Ed.; American Fisheries Society: Bethesda, MD, USA, 1993; pp. 77–84. [Google Scholar]
Figure 1. Schematic map of the Johnston Atoll study sites. The atoll is outlined at the 10-fathom contour. Islands are shaded light gray and emergent reef is shaded dark gray. Study sites were: PCB-1, the West end of Sand Island; PCB-2, the former Navy pier lagoon; REF-1, the channel margin adjacent to Buoy 14; REF-2, the sunken tug boat; REF-3, the western corner of East Island; HO, offshore from the former herbicide orange storage area; and WCS, where sediment samples were taken for comparison. For scale, Johnston Island is 2 miles in length.
Fishes 07 00055 g001
Figure 2. Common abnormalities observed in damselfish embryos. Abnormal embryos are paired with a normal embryo at the same developmental stage for comparison. Abnormalities observed fell into the following general categories; defects resulting from abnormal cleavage patterns in early embryos, defects resulting from abnormal cell movements during gastrulation, general developmental retardation, lack of morphological differentiation, cardiac, craniofacial, and axial/skeletal. (A). Unfertilized embryo. (B). Divided blastocap. (C). Enlarged segmentation cavity. (D). No differentiation. (E). Yolk abnormality, in addition to no differentiation. (F). Cells that have separated from the developing embryo and lack of differentiation. (G). Premature closure of the blastopore. (H). Skeletal and heart deformities. (I). Axial deformity. (J). Developmental retardation. (K). Heart deformity, tube heart with edema. (L). Partial eye fusion and heart deformity.
Fishes 07 00055 g002
Figure 3. Daily photographs of a normal and abnormal embryo incubated in the laboratory. Both embryos are 24 h old at the beginning of the incubation. (A). Day 1 (top left): A subtle defect in the neural keel of the left embryo is observed. (B). Day 2: Both embryos appear to be developing normally. (C). Day 3: Four eyes have developed on the abnormal embryo. (D). Day 4: The abnormal embryo is not growing as long and appears to have edema in the heart area when compared to the normal embryo. (E). Day 5: The abnormal embryo is shorter and appears to have more yolk reserves remaining compared to the normal embryo. (F). Day 6: The normal embryo hatched and the abnormal embryo in the photo is dead.
Fishes 07 00055 g003
Figure 4. PCB concentrations in fish from Johnston Atoll from three sampling years. Note that these are natural log-transformed data.
Fishes 07 00055 g004
Figure 5. Percent embryo abnormalities occurring at five sites within Johnston Atoll over four years. Note that these are natural log-transformed data.
Fishes 07 00055 g005
Figure 6. Relationship between mean percent abnormal embryos and mean PCB concentration in damselfish from Johnston Atoll.
Fishes 07 00055 g006
Figure 7. Relationship between lipid normalized PCB concentrations found in the gonad and in the body tissues of damselfish from PCB-1 and REF-1, Johnston Atoll. Linear regression with 95% mean prediction interval.
Fishes 07 00055 g007
Table 1. Mean (SD) concentration of sediment contaminants found in selected regions of the Johnston Atoll lagoon.
SitePCBs (ng/g)TEQ (ng/g)PAHs (ng/g)AsSbBaCdCuCrPbHgZn
PCB-128.6 (61.0)0.6 (0.8)NA 0.6 (0.4) 0.8 (0.5) NANA8.1 (14.3)NA31.0 (35.1)0.02 (0.02)12.9 (16.8)
PCB-286.6 (126.9)NAND NANA NANANANANANANA
REF-10.45 (0.1)NAJ0.4 (0)NA172.2 (30.6)NDND10.4 (0.7)39.2 (1.5)NDND
REF-20.6 (0.2)NANA NA NA NANANANANANANA
REF-30.7 (0.4)NANANANA NANANANANANANA
HO2.4 (2.0)16.9 (113.6)589.6 (1845.6)0.6 (0.3)NA76.3 (67.3)ND5.1 (3.9)10.2 (9.0)10.1 (9.5)0.01 (0.003)13.0 (23.7)
NA—not analyzed. ND—not detected. J—detected below quantifiable limits.
Table 2. Types and frequency of abnormal embryos that were used in the embryo incubations. Survival or the % of abnormal embryos hatching is compared to normal embryos found within the same clutch.
SiteNest# Abnormal Embryos# Normal Embryos% Abnormal Hatching% Normal Hatching Abnormality Type
PCB-1sp561417100Developmental retardation, no differentiation, abnormal gastrulation
PCB-1e18013NAAbnormal cleavage
PCB-1h7214395Loose cells, enlarged segmentation cavity, abnormal gastrulation
PCB-1p130100Abnormal gastrulation
PCB-1f24120100Developmental retardation, axial, abnormal gastrulation
PCB-1v39089No differentiation, enlarged segmentation cavity, abnormal gastrulation
PCB-1k4180100Loose cells, enlarged segmentation cavity, abnormal blastodisc
PCB-1ag41225100Enlarged segmentation cavity, no differentiation
PCB-1d260100Abnormal keel, early blastopore closure
PCB-1341225100Enlarged segmentation cavity
PCB-1q2650100Enlarged segmentation cavity, abnormal gastrulation
PCB-1e21434088Loose cells, enlarged segmentation cavity
PCB-1q492589Enlarged segmentation cavity, abnormal gastrulation
PCB-1b1235894Abnormal keel, abnormal gastrulation
PCB-1g2440063Axial, abnormal cell proliferations, abnormal keel, no differentiation
PCB-1o823087Loose cells, abnormal gastrulation
PCB-1d825080Loose cells, enlarged segmentation cavity
REF-1b14-58240100Abnormal yolk, no differentiation, abnormal keel
REF-2tug1012200100Loose cells, enlarged segmentation cavity
REF-2tug16163188Loose cells
REF-3east151540100Abnormal yolk, abnormal cell proliferations, Abnormal gastrulation
Total1663546.790.4
Table 3. Individual fish data used to calculate the gonadosomatic and hepatosomatic indices from four sites within Johnston Atoll.
SiteSexSL (mm)Total
Weight (g)
Gonad Weight (g)GSILiver
Weight (g)
LSI
PCB-1M140173. 81.10.631.20.71
F142188.13.92.081.20.65
F135148.53.02.011.40.94
M146199.51.80.891.90.98
M135157.71.10.721.30.82
M165238.01.40.592.20.94
Mean (SD) 143.8
(11.2)
184.3
(32.4)
2.0
(1.15)
1.15
(0.70)
1.6
(0.4)
0.84
(0.13)
REF-1M145204.80.90.461.70.81
M149196.70.90.461.60.79
M143178.51.30.731.70.94
M160238.51.90.812.81.15
M137157.71.30.791.40.90
M145188.51.10.571.91.02
Mean (SD) 146.5
(7.7)
194.1
(27.2)
1.2
(0.4)
0.64
(0.16)
1.8
(0.5)
0.94
(0.14)
REF-3M137179.61.10.620.90.52
M139165.10.80.471.00.63
M145205.91.40.681.30.63
M163257.31.70.673.31.26
M151222.41.40.611.60.71
M148220.81.90.862.00.92
Mean (SD) 147.2
(9.4)
208.5
(33.0)
1.4
(0.4)
0.65
(0.13)
1.7
(0.9)
0.78
(0.27)
HOF144208.510.85.172.21.04
M145179.71.30.711.70.95
F145200.87.83.861.80.88
F146208.72.21.051.90.93
F150234.13.31.401.60.67
F137197.010.15.131.30.68
Mean (SD) 144.5
(4.2)
204.8
(17.9)
5.9
(4.2)
2.89
(2.07)
1.8
(0.3)
0.86
(0.15)
Table 4. Summary of mean (SD) fish parameters collected from the Johnston Atoll lagoon for contaminant analyses. Within a year, PCB concentrations with the same superscript letter are not significantly different while sites with different letters are significantly different at p < 0.05.
SiteNSL (mm)Weight
(g)
Sex (M/F)Lipid (%)PCBs (ng/g)
1996
PCB-16152
(4.7)
230.4
(16.8)
5/14.35
(1.6)
1591.1 a
(1122.2)
REF-17137
(8.9)
170.8
(32.6)
5/24.4
(2.5)
68.2 b
(77.2)
1999
PCB-16156
(12.6)
235.5
(41.8)
3/34.2
(1.5)
259.9 b
(308.0)
PCB-28147
(39.3)
179.7
(11.7)
5/32.6
(0.5)
3586.8 a
(1957.9)
REF-16135
(12.7)
147.4
(40.3)
5/12.0
(0.7)
18.5 b
(20.3)
REF-36146
(10.2)
204.4
(40.9)
2/43.6
(2.4)
9.4 b
(5.1)
2001
PCB-16144
(11.2)
184.3
(32.4)
4/23.1
(0.9)
409.4 a
(333.1)
REF-16146
(7.7)
194.1
(27.2)
6/04.1
(1.6)
17.8 b
(7.7)
REF-36147
(0.4)
208.5
(33.0)
6/04.3
(1.9)
16.1 b
(11.6)
HO6144
(4.2)
204.8
(17.8)
1/53.8
(1.5)
35.0 b
(27.6)
Table 5. Mean (SD) level of abnormalities in damselfish embryos collected in the Johnston Atoll lagoon. Within a year, Mean % abnormal and PCB concentrations with the same superscript letter are not significantly different while sites with different letters are significantly different at p < 0.05.
SiteNestsN #Mean % AbnormalCVRangeMean PCBs
(ng/g Lipid)
1996
PCB-1461455.8 (15.6) a2710–10039,853.4 a
(32,035.0)
REF-126711.4 (1.1) b770–5.91819.7 b
(2387.7)
1998
PCB-1413856.0 (18.2) a3020–100NA
REF-128301.4 (2.1) b1530–9.9NA
1999
PCB-130582.8 (2.4) a870–8.310,419.2 b
(14,347.3)
PCB-25106.2 (10.4) a1740–34.7138,032.5 a
(65,773.7)
REF-116231.8 (1.4) a790–5.7976.4 b
(902.2)
REF-28162.5 (1.9) a780.5–7.8NA
REF-310131.7 (1.3) a750–3.9350.3 b
(301.75)
2001
PCB-1351443.2 (5.8) a1830–35.914,643.3 a
(13,545.8)
PCB-27272.0 (2.5) a1290–13.0NA
REF-131881.7 (3.9) b1750–22.1434.7 b
(45.0)
REF-213241.3 (1.3) b980–4.8NA
REF-312361.6 (1.6) b990–7.4364.6 b
(155.4)
HO252.9 (4.8) a1750–11.5894.3 b
(520.3)
NESTS = number of nests sampled at each site. Each nest was tended to by one male. # Number of samples. Each sample contains a swath of 200 embryos collected from a unique clutch of embryos.
Table 6. PCB concentrations and lipid values for damselfish gonads and body.
SampleSiteGonad
PCB (ng/g)
Gonad
Lipid (%)
Gonad PCBs
(ng/g Lipid)
Body PCB (ng/g) *Body
Lipid (%)
Body PCBs
(ng/g Lipid)
2PCB-176.85.41430.2783.24.117,145.6
3PCB-1282.08.23451.722343.064,210.5
4PCB-1170.04.83519.720793.849,713.5
7PCB-126.210.2256.9463.22.716,245.4
1REF-18.34.2198.818.143.7264.4
6REF-148.16.9689.1251.39.32175.6
* Not including gonad PCBs.
Table 7. PCB concentrations and % abnormalities in damselfish embryos collected from nests at three sites within Johnston Atoll.
SiteNestPCBs (ng/g Lipid)% Abnormal
PCB-1AE414.74.3
PCB-1J1223.13.4
PCB-1I13,000.08.3
PCB-2Navy7117.634.7
REF-1B14790.50.5
REF-1B14-23713.01.0
Table 8. Mean (SD) mono-ortho and non-ortho PCB congener concentrations in damselfish tissues from Johnston Atoll. For NDs, the lipid-normalized mean of one half of the detection limit is given. In 2001, dioxins and furans were also measured in fish tissue. Mean TCDD TEQs are given for comparison.
PCB Congener Concentration (ng/g Lipid)
PCBPCB-1PCB-2REF-1REF-3HO
1996199920011999199619992001199920012001
Mono-ortho PCBs
118NA341.6 (626.0)1548.2 (1644.2)2294.0 (1418.1)51.1
(56.3)
32.4 (16.9)22.8 (10.0)36.5 (35.0)31.9 (6.6)20.2 (9.6)
105NA325.5 (689.3)901.0 (861.8)245.0 (105.0)35.9
(36.4)
16.9 (8.9)13.5 (2.6)22.0 (24.4)20.3 (3.6)9.5
(4.2)
167NANA170.6 (132.9)2658.6 (1051.3)NANA7.0 (1.5)NA4.7
(2.7)
8.9
(5.5)
156NA477.5 (827.4)388.3 (346.2)1923.8 (801.3)30.1
(32.2)
17.1 (11.2)10.4 (2.2)10.1 (10.7)7.8
(2.1)
8.8
(4.7)
157NANA90.2 (83.2)228.5 (90.4)NANA2.4
(0.4)
NA1.9
(0.6)
2.3
(1.2)
189NANA20.4 (15.9)808.8 (379.6)8.2 (12.0)NA1.8
(0.3)
NA0.7
(0.2)
3.8
(2.3)
Non-ortho PCBs
77NA3.7
(4.3)
ND
(5.9)
195 (36.6) 3.0
(2.8)
0.3
(0.1)
ND (0.1)0.3
(0.4)
ND (0.2)ND (0.2)
81NA2.0
(2.6)
ND
(2.6)
195 (36.6) 0.8
(1.4)
0.1
(0.1)
ND (0.03)0.003 (0.005)ND (0.05)ND (0.04)
126NA10.6 (17.2)8.6
(5.8)
431.6 (219.7)0.8
(0.9)
0.5
(0.5)
0.6
(0.1)
0.4
(0.4)
0.5
(0.2)
1.4
(0.7)
169NA2.2
(4.5)
0.4
(0.3)
133.8 (78.9)ND (0.0009)0.05 (0.1)0.08 (0.01)0.05
(0.1)
0.08 (0.05)0.4
(0.2)
SumNA1163.13127.79114.1129.967.358.669.467.955.3
TEQ aNA0.00710.00430.36170.00130.000350.00030.00030.00030.00072
TEQ bNANA0.0463NANANA0NA0.00010.4922
NA—Not analyzed, ND—Not detected. a Calculated as the sum of TEQs from congeners 77, 81, 126, 169, using TEFs for early life stage mortality by [63]. b Calculated as the sum of TEQs from 2,3,7,8 substituted dioxins and furans using TEFs from [64].
Table 9. Mean (SD) metal concentrations (mg/g) in damselfish tissues from Johnston Atoll. Sites with different letters are significantly different at p < 0.05.
SiteAsBaCdCrCuHgPbSbZn
PCB-12.17 (0.52)0.80 bc (0.52)0.04 (0.01)0.45 (0.07)0.73 (0.17)0.08 a (0.04)0.73 b (2.14)ND20.68 (5.08)
REF-12.05 (0.77)1.35 a (0.57)0.08 (0.05)0.34 (0.07)0.59 (0.07)0.02 a (0.00)0.59 a (0.26)ND19.07 (3.43)
REF-32.63 (0.21)0.49 b (0.17)0.09 (0.05)0.53 (0.28)0.69 (0.05)0.14 b (0.14)0.69 a (0.05)ND18.05 (2.63)
HO2.03 (0.19)0.95 ac (0.29)0.04 (0.02)0.61 (0.46)0.61 (0.07)0.03 a (0.01)0.61 a (0.25)0.01
(0)
17.40 (4.24)
WCS *2.100.950.290.450.650.020.07ND11.00
* Only one sample was collected from WCS, a relatively uncontaminated site. WCS values are for comparison only and were not included in the ANOVA.
Publisher’s Note: MDPI stays neutral with regard to jurisdictional claims in published maps and institutional affiliations.

