Article

Molecular Characterization and Nutrition Regulation of the Neutral Amino Acid Transporter ASCT2 in Triploid Crucian Carp

1
Hunan Provincial Key Laboratory of Nutrition and Quality Control of Aquatic Animals, Department of Biological and Environmental Engineering, Changsha University, Changsha 410022, China
2
State Key Laboratory of Developmental Biology of Freshwater Fish, College of Life Science, Hunan Normal University, Changsha 410081, China
*
Authors to whom correspondence should be addressed.
Fishes 2021, 6(4), 77; https://doi.org/10.3390/fishes6040077
Submission received: 19 October 2021 / Revised: 6 December 2021 / Accepted: 7 December 2021 / Published: 9 December 2021
(This article belongs to the Section Nutrition and Feeding)

Abstract

:
AlaSerCys Transporter 2 (ASCT2), encoded by the SLC1A5 gene, plays an important role in the absorption of glutamine. In this study, the full-length cDNA sequence of ASCT2 was cloned from triploid crucian carp. It encodes 539 amino acid residues and a stop codon. Phylogenetic analysis revealed that the sequences of the ASCT2 ORF region in cyprinid fishes shared high sequence homology. Comparing the abundance of ASCT2 in different tissues, we found its expression level in muscle was significantly higher than that in intestine (p < 0.05). In addition, the expression levels of ASCT2 also appeared different in diurnal variation. Then we found the addition of 2.5% glutamate in a feeding diet significantly increased the expression levels of ASCT2 in intestine and muscle (p < 0.05). However, in glutamine experiments, the muscle showed the highest expression level of ASCT2 when fish were fed the diet containing 3.0% glutamine (p < 0.05). In vitro, ASCT2 was sensitive to glutamine and its expression level appeared down-regulated when the addition of glutamine was added to 0.1 mg/mL. Finally, we found that the diet with 29% protein level significantly increased the expression level of ASCT2 in intestine (p < 0.05). Nevertheless, different protein sources (fish meal and soybean meal) had no significant effect on the expression levels of ASCT2 in intestine and muscle (p > 0.05). These results provided data for the study of ASCT2 in triploid crucian carp regulated by feeding nutrition, which had a potential application in improving feed formulation in aquaculture.

Graphical Abstract

1. Introduction

The Alanine, Serine, Cysteine Transporter 2 (ASCT2) is a Na+-dependent, broad scope neutral amino acid exchanger encoded by the SLC1A5 gene, which is the fifth member of the SLC1 family [1,2]. ASCT2 is highly expressed in many kinds of cancer cells and plays a key role in their growth [3,4,5]. It catalyzes the obligatory exchange of substrate amino acids, including alanine, serine, cysteine, threonine, glutamine and so on [6]. In addition to its role as a transporter, it also acts as a receptor for several retroviruses, such as RD-114 virus and simian retrovirus 4 [7,8]. Therefore, ASCT2 has increasingly gained attention over the past few years.
With the development of high-throughput sequencing technology, the sequences of SLC1A5 have been predicted in many species, which contribute to the research in molecular mechanism of ASCT2 as well as its related signaling pathways. Nevertheless, most previous studies of ASCT2 were focused on humans as well as a few mammals. In contrast to numerous research hotspots in human physiology and pathology, the research in aquaculture regarding ASCT2 molecular characterization and nutrition regulation, which can contribute to the research on the improvement of feed formula, has been sparse.
Although ASCT2 was named by the acronym of Alanine, Serine, Cysteine Transporter 2, the preferred substrate of ASCT2 is glutamine [9,10]. Glutamine is the major oxidative fuel of the enterocyte, an essential precursor for nucleic acid biosynthesis in all cells and a key link between carbon metabolism of carbohydrates and proteins [11,12,13]. It is a vehicle for nitrogen transfer between tissues, which plays an important role in cell growth [14]. Hu et al. reported that 7.5 g/kg glutamine and 2.5 g/kg glutamine dipeptide could remarkably increase the expression of ASCT2 in grass carp (Ctenopharyngodon idelus) [15]. Therefore, it is necessary to study the transport mechanism of glutamine in ASCT2. Moreover, Kanai et al. reported that glutamate was also one of the transport substrates of ASCT2 [16]. In the intestine, glutamate is taken up from the lumen or is produced in the epithelium from glutamine through glutaminase activity [17]. It is an important nutrient in the maintenance of intestinal mucosal activity. Thus, the regulatory effect of glutamate on ASCT2 is also worthy of our attention.
Protein is the core component in fish feed. Therefore, researchers improve the feed formula by adjusting the protein content, protein source and additives. In our previous research, we reported the effects of different dietary protein levels on the expression levels of peptide transporter 1 (PepT1), L-Type amino acid transporter 2 (LAT2), and glutamate dehydrogenase (GDH) in crucian carp [18,19,20]. These proteins showed different preferences for dietary protein levels. Therefore, studying the expression pattern of ASCT2 in fish fed under the different protein levels will help to deepen the understanding of ASCT2 and improve the dietary formula.
Crucian carp is one of the most important freshwater species for Chinese aquaculture. Triploid crucian carp (3n = 150) has the characteristics of resilience, sterile traits and fast growth rate [21]. However, the molecular mechanism of nutrition regulation on triploid crucian carp is still spare. Hence, we cloned ASCT2 cDNA from triploid crucian carp and studied the expression pattern in different tissues and diurnal variation. Furthermore, we analyzed the regulation of ASCT2 by dietary protein levels and protein source, as well as feed additives (glutamate and glutamine) in triploid crucian carp. The results of this study will contribute to enrich the knowledge of fish ASCT2 and have a potential application in improving fish feed formulation in aquaculture.

2. Materials and methods

2.1. Fish

All the triploid crucian carp in this experiment were provided by the Hunan Institute of Aquatic Science. Before the experiment, all of the fish were kept in a 300-L circular fiberglass container in an indoor recirculating freshwater system at 25 °C for 2 weeks of adaptation.

2.2. RNA Isolation and cDNA Synthesis

Total RNAs were isolated from the specimens of fish using Trizol reagent (Invitrogen, Carlsbad, CA, USA) according to the manufacturer’s instructions. The integrity of RNA samples was tested by agarose gel electrophoresis, and the quality of RNA samples was determined by calculating through the A260/A280 and A260/A230 ratios spectrophotometer (BioPhotometer Eppendorf, Hamburg, Germany). To eliminate endogenous DNA contamination, 1 g RNA was digested by DNase I prior to the cDNA synthesis. RNA was reversely transcribed to cDNA by a PrimeScript RT reagent kit with gDNA eraser (TaKaRa, Dalian, China). The products were separated by a 1% agarose gel and then cloned and tested.

2.3. Cloning of cDNA of ASCT2

The primers of SLC1A5 were designed based on conserved sequences of ASCT2/SLC1A5 in other teleosts (Table 1). Polymerase chain reactions (PCRs) were carried out using a volume of 20 μL with 1 μL of cDNA (approximately 20 ng), 10 μL of 2 × Taq PCR Master Mix (Tiangen, Beijing, China), 8 μL of ddH2O, and 0.5 μL of each primer (100 μM). The temperature profile during amplification was as follows: initial denaturation at 94 °C for 5 min, followed by 35 cycles at 94 °C for 30 s, 55 °C for 1 min, and 72 °C for 2 min. A final extension step was performed at 72 °C for 10 min. The PCR products were separated by polyacrylamide gel electrophoresis (PAGE). The DNA fragments were purified using a gel extraction kit (UNIQ-10 Spin Column DNA Gel Extraction Kit for PAGE, Sangon, Shanghai, China) and ligated into the pMD19-T vector. The plasmids were transformed into E.coli DH5α and purified. The inserted DNA fragments in the pMD19-T vector were sequenced using an automated DNA sequencer (ABI PRISM 3730, Applied Biosystems, Carlsbad, CA, USA). All the PCRs in this study were repeated, and the results were consistent.

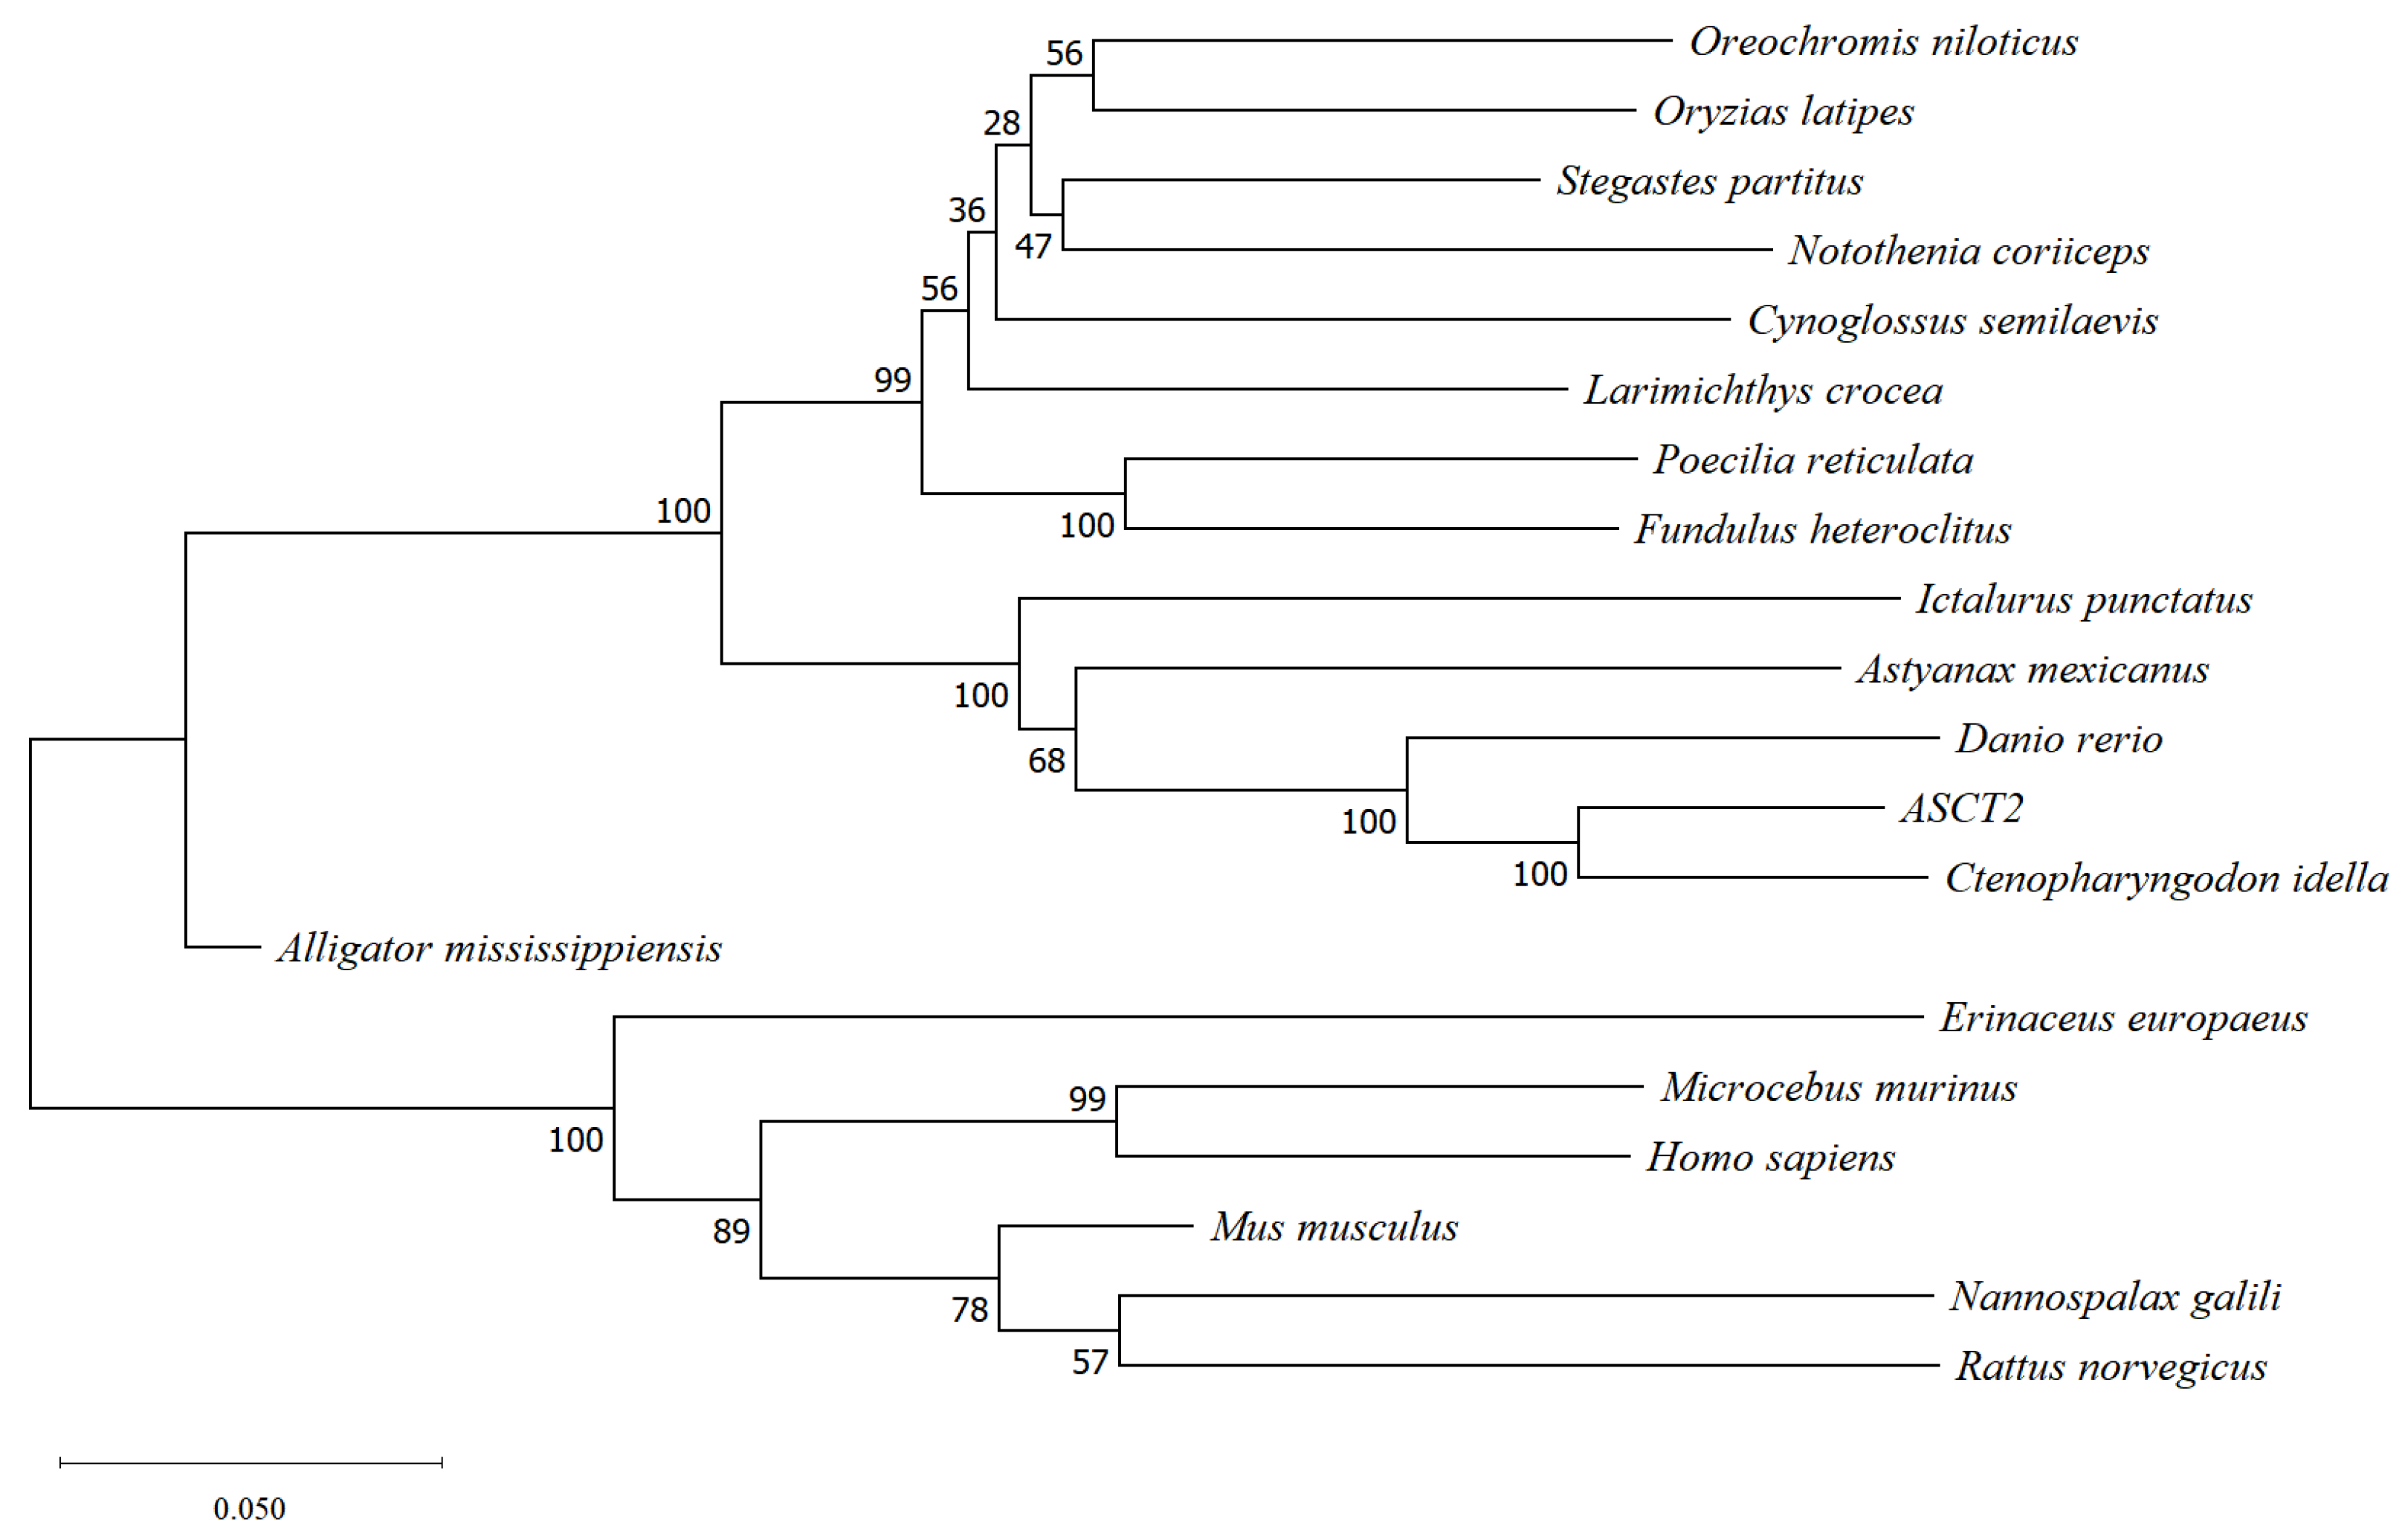
2.4. Phylogenetic Relationships

Phylogenetic analysis was conducted using the sequences of SLC1A5 homologs from triploid crucian carp and other vertebrates according to the methods of Mao et al. [22]. The nucleotide sequences of these species were derived from the National Center for Biotechnology Information database. Evolutionary analyses were conducted in MEGA-X [23]. Evolutionary history was inferred using the Neighbor-Joining method [24]. The tree was drawn to scale, with the same units for branch lengths and the evolutionary distances used to infer the phylogenetic tree. The evolutionary distances were computed using the maximum likelihood method and measured as the number of base substitutions per site. All positions containing gaps and missing data were eliminated from analysis.

2.5. Quantitative Real-Time PCR (qRT-PCR)

The ASCT2 expression levels were determined by qRT-PCR in a Prism 7500 Sequence Detection System (Applied Biosystems, Foster City, CA, USA). The primers were designed using Primer Premier 5.0 software and the single band of amplification is determined by agarose gel electrophoresis (Table 1). Beta-actin was used as an endogenous control. Five microliters of first-strand cDNAs (in a dilution of 1:20) as templates was added to 20 μL PCR solution containing 20 nmol/L primers and 10 μL SYBR Green PCR Master Mix (Applied Biosystems). For each sample, three repeats were performed with the following condition: 50 °C for 5 min and 95 ℃ for 10 min followed by 40 cycles at 95 °C for 15 s and 60 °C for 45 s. The efficiency of the assay was determined by the amplification of a dilution series of cDNA, and the analysis of relative mRNA expression was performed using the 2−ΔΔCt method [25].

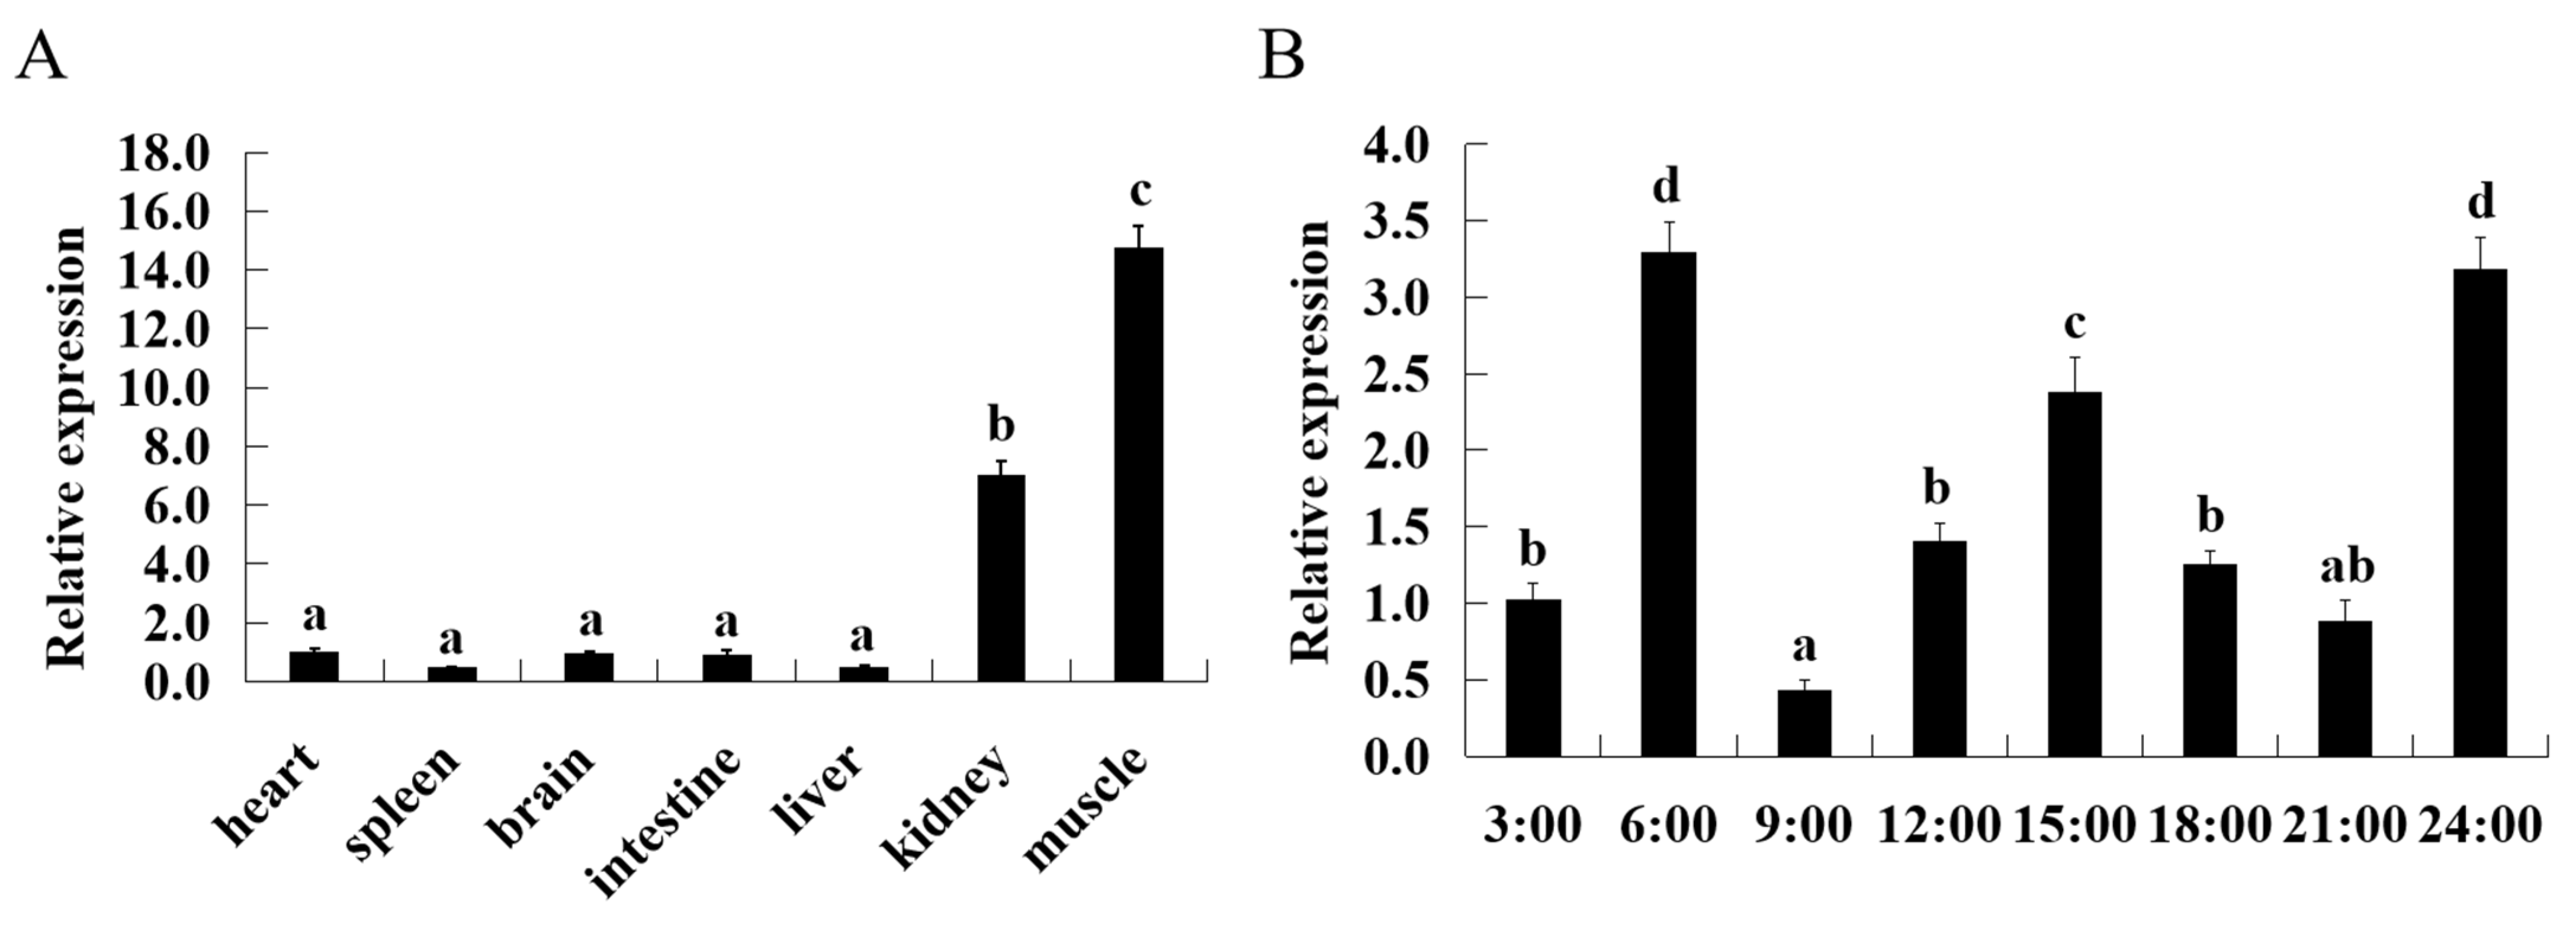
2.6. ASCT2 Expression in Various Tissues and Diurnal Variation

Before the experience, the fish (body weight 11.72 ± 0.11 g) were acclimatized for 2 weeks to an indoor recirculating aquaculture system comprising 4 glass fiber tanks (1500 L). They were fed twice daily at 8:30 a.m. and 2:30 p.m., respectively. In order to explore the expression differences of ASCT2 among different tissues, different tissues were collected from triploid crucian carp, including heart, spleen, brain, intestine, liver, kidney, and muscle. Later, the samples of muscle in triploid crucian carp were collected at eight different times (00:00, 03:00, 06:00, 09:00, 12:00, 15:00, 18:00, 21:00, and 24:00). Three replicates for each experimental group were designed. Total RNAs were isolated from these samples; after synthesis of cDNAs, ASCT2 expressions were assayed by qRT-PCR.

2.7. The Effect of Glutamate and Glutamine on ASCT2

In order to analyze the effects of different proportions of dietary glutamate and glutamine additives on ASCT2, the fish were randomly divided into 13 groups (n = 15 for each group, body weight of fish was 300.35 ± 0.04 g). The formula for the control group contained 32% CP, while the formula for the glutamate/glutamine groups was supplemented with 0.5, 1.0, 1.5, 2.0, 2.5, 3.0 g/kg glutamate or glutamine (Table 2 and Table 3). The fish were acclimatized for 2 weeks to an outdoor cage (1.2 m × 1.2 m × 2.0 m, water depth: 1.8 m). They were fed on the control diet twice daily at 8:30 a.m. and 2:30 p.m., respectively. There were 585 acclimatized fish of the same age and size (each weighing 300.00 ± 10.15 g) batch-weighed and randomly distributed into 39 cages. For each of the 39 diet treatments, triplicate cages were set up with each cage having 15 fish. The fish were fed manually to apparent satiation twice daily (at 8:30 a.m. and 2:30 p.m.). Feeding was done for 60 days with each of the 13 diets to the allocated cages. After 60 d, the fish were fasted for 24 h and then sacrificed with 50 mg L−1 MS-222 (tricaine methane sulfonate, Sigma-Aldrich, St. Louis, MO, USA) before sampling and the ASCT2 expression levels of intestine and muscle in triploid crucian carp (n = 3 for each group) were assayed by qRT-PCR.
In order to deepen explore the effects of additive of glutamate and glutamine on ASCT2, in vitro, muscle cell of triploid crucian carp was used to carry out the experiment. During the experiment, the muscle was rapidly separated from triploid crucian carp (25 g) after being anesthetized with 2-phenoxyethanol. The muscle was cut into pieces by using scissors. After 3 washes with PBS containing 500 U/mL penicillin (Gibco, Waltham, MA, USA) and 500 U/mL streptomycin (Gibco, Waltham, MA, USA), minced muscle tissues were seeded in dishes with DMEM/F12 containing 20% FBS (Gibco, Waltham, MA, USA), 500 U/mL penicillin, 500 U/mL streptomycin and 15 ng/mL fibroblast growth factor (FGF, PEPROTECH, East Windsor, NJ, USA) in 28 °C. Afterward, culture medium was replaced with fresh medium by half every 3 days. Subculture was carried out at a split ratio of 1:2 when primary cell cultures grew to above 90% of confluence. After subculture of 3 passages, the cells were inoculated into 6-well plates and randomly divided into 6 groups of 4 wells. After passaging, the cells had adhered well and were normally extended (3rd day). The original culture solution was aspirated using a sterile pipette and gently washed with 2 mL PBS. Complete cell medium containing different concentrations of glutamate/glutamine (0, 0.10, 0.25, 0.50, 1.00 and 2.00 mg/mL) was added to each group of cells. Because HEPES was added to DMEM/F12 medium, the pH of the medium remained stable (pH = 7.2). After 8 h of culture, we removed the cell culture medium and collected the cells. The relative mRNA expression levels of ASCT2 were detected by qRT-PCR.

2.8. Regulation of Dietary Protein Levels and Protein Sources on ASCT2

To reveal the effects of dietary protein levels on triploid crucian carp intestine ASCT2 expression, 6 isocaloric diets with 5 different dietary protein levels at 26, 29, 32, 35, 38 and 41%, respectively, were formulated (Table 4). To reveal the effects of different protein sources on triploid crucian carp intestine ASCT2 expression, two protein diets of fish meal and soybean meal were formulated (Table 5). The diets of different protein levels and sources were prepared by thoroughly mixing dry ingredients with oil and then water until a stiff dough was obtained. The dough was then passed through a meat mincer equipped with a 2 mm diameter, and the products were dried using an electrical fan at 28 °C. After drying, the material was broken up into regular pieces sieved to a convenient pellet size and stored at 20 °C. Juvenile triploids (body weight 11.72 ± 0.11 g) were cultured in 8 fiberglass tanks (1.2 m height 0.8 m depth; n = 25 per tank). Before the experiment, the fish were fasted for 24 h and then fed with different diets for 60 d. The fish were fed manually to apparent satiation twice daily, at 8:30 a.m. and 2:30 p.m. After 60 d, the fish were fasted for 24 h and then sacrificed with 50 mg L−1 MS-222 (tricaine methane sulfonate, Sigma-Aldrich, St. Louis, MO, USA) before sampling. Finally, the intestine of triploid crucian carp (n = 3 for each group) was collected for gene expression analysis by qRT-PCR.

2.9. Statistical Analysis

The data analysis was measured by using the SPSS 18 analysis program and represented as means ± standard error (SE) [26]. The significant difference between groups was confirmed using one-way ANOVA analysis. Differences between mean values of individual treatments were separated using the Least Significance Difference (LSD) test at p < 0.05.

3. Results

3.1. Isolation and Sequence Analysis of ASCT2 cDNA from Triploid Crucian Carp

The cDNA of ASCT2 was isolated from the cDNA library of triploid crucian carp intestine, and the sequence has been uploaded to the GenBank database (GenBank Accession No. MW435568.1). It had a length of 2250 bp and contained a complete open reading frame (ORF) sequence in length of 1620 bp, which encoded 539 amino acid residues and a stop codon. Compared to other species, its ORF region shared the highest sequence homology with that in Cyprinus carpio (XM_042770969.1, 99.57%), followed by Sinocyclocheilus anshuiensis (XM_016500377.1, 96.48%). The phylogenetic tree for ASCT2 was constructed and a total of 20 ORF sequences from different species including triploid crucian carp were analyzed using MEGA-X (Figure 1). The tree contained two main branches, including tetrapods and fish. Cyprinids shared a high sequence homology as zebrafish, triploid crucian carp and grass carp were clustered into one branch. They were significantly different from mammals and divided into two distinct clusters.

3.2. Tissue Expression Patterns and Diurnal Variation of ASCT2

The results showed that ASCT2 was expressed in all the assayed tissues (heart, spleen, brain, intestine, liver, kidneys and muscle), among which muscle had the highest expression level (p < 0.05), followed by kidneys (p < 0.05) (Figure 2A). There was no significant difference (p > 0.05) in other tissues, including heart, spleen, brain, intestine and liver. Therefore, muscle was selected to investigate the diurnal variation of ASCT2. The results showed that ASCT2 was highly expressed at 6:00 and 24:00 (p < 0.05), followed by 15:00 (Figure 2B). The lowest expression level was at 9:00. These results revealed that ASCT2 expression levels showed a diurnal variation in muscle.

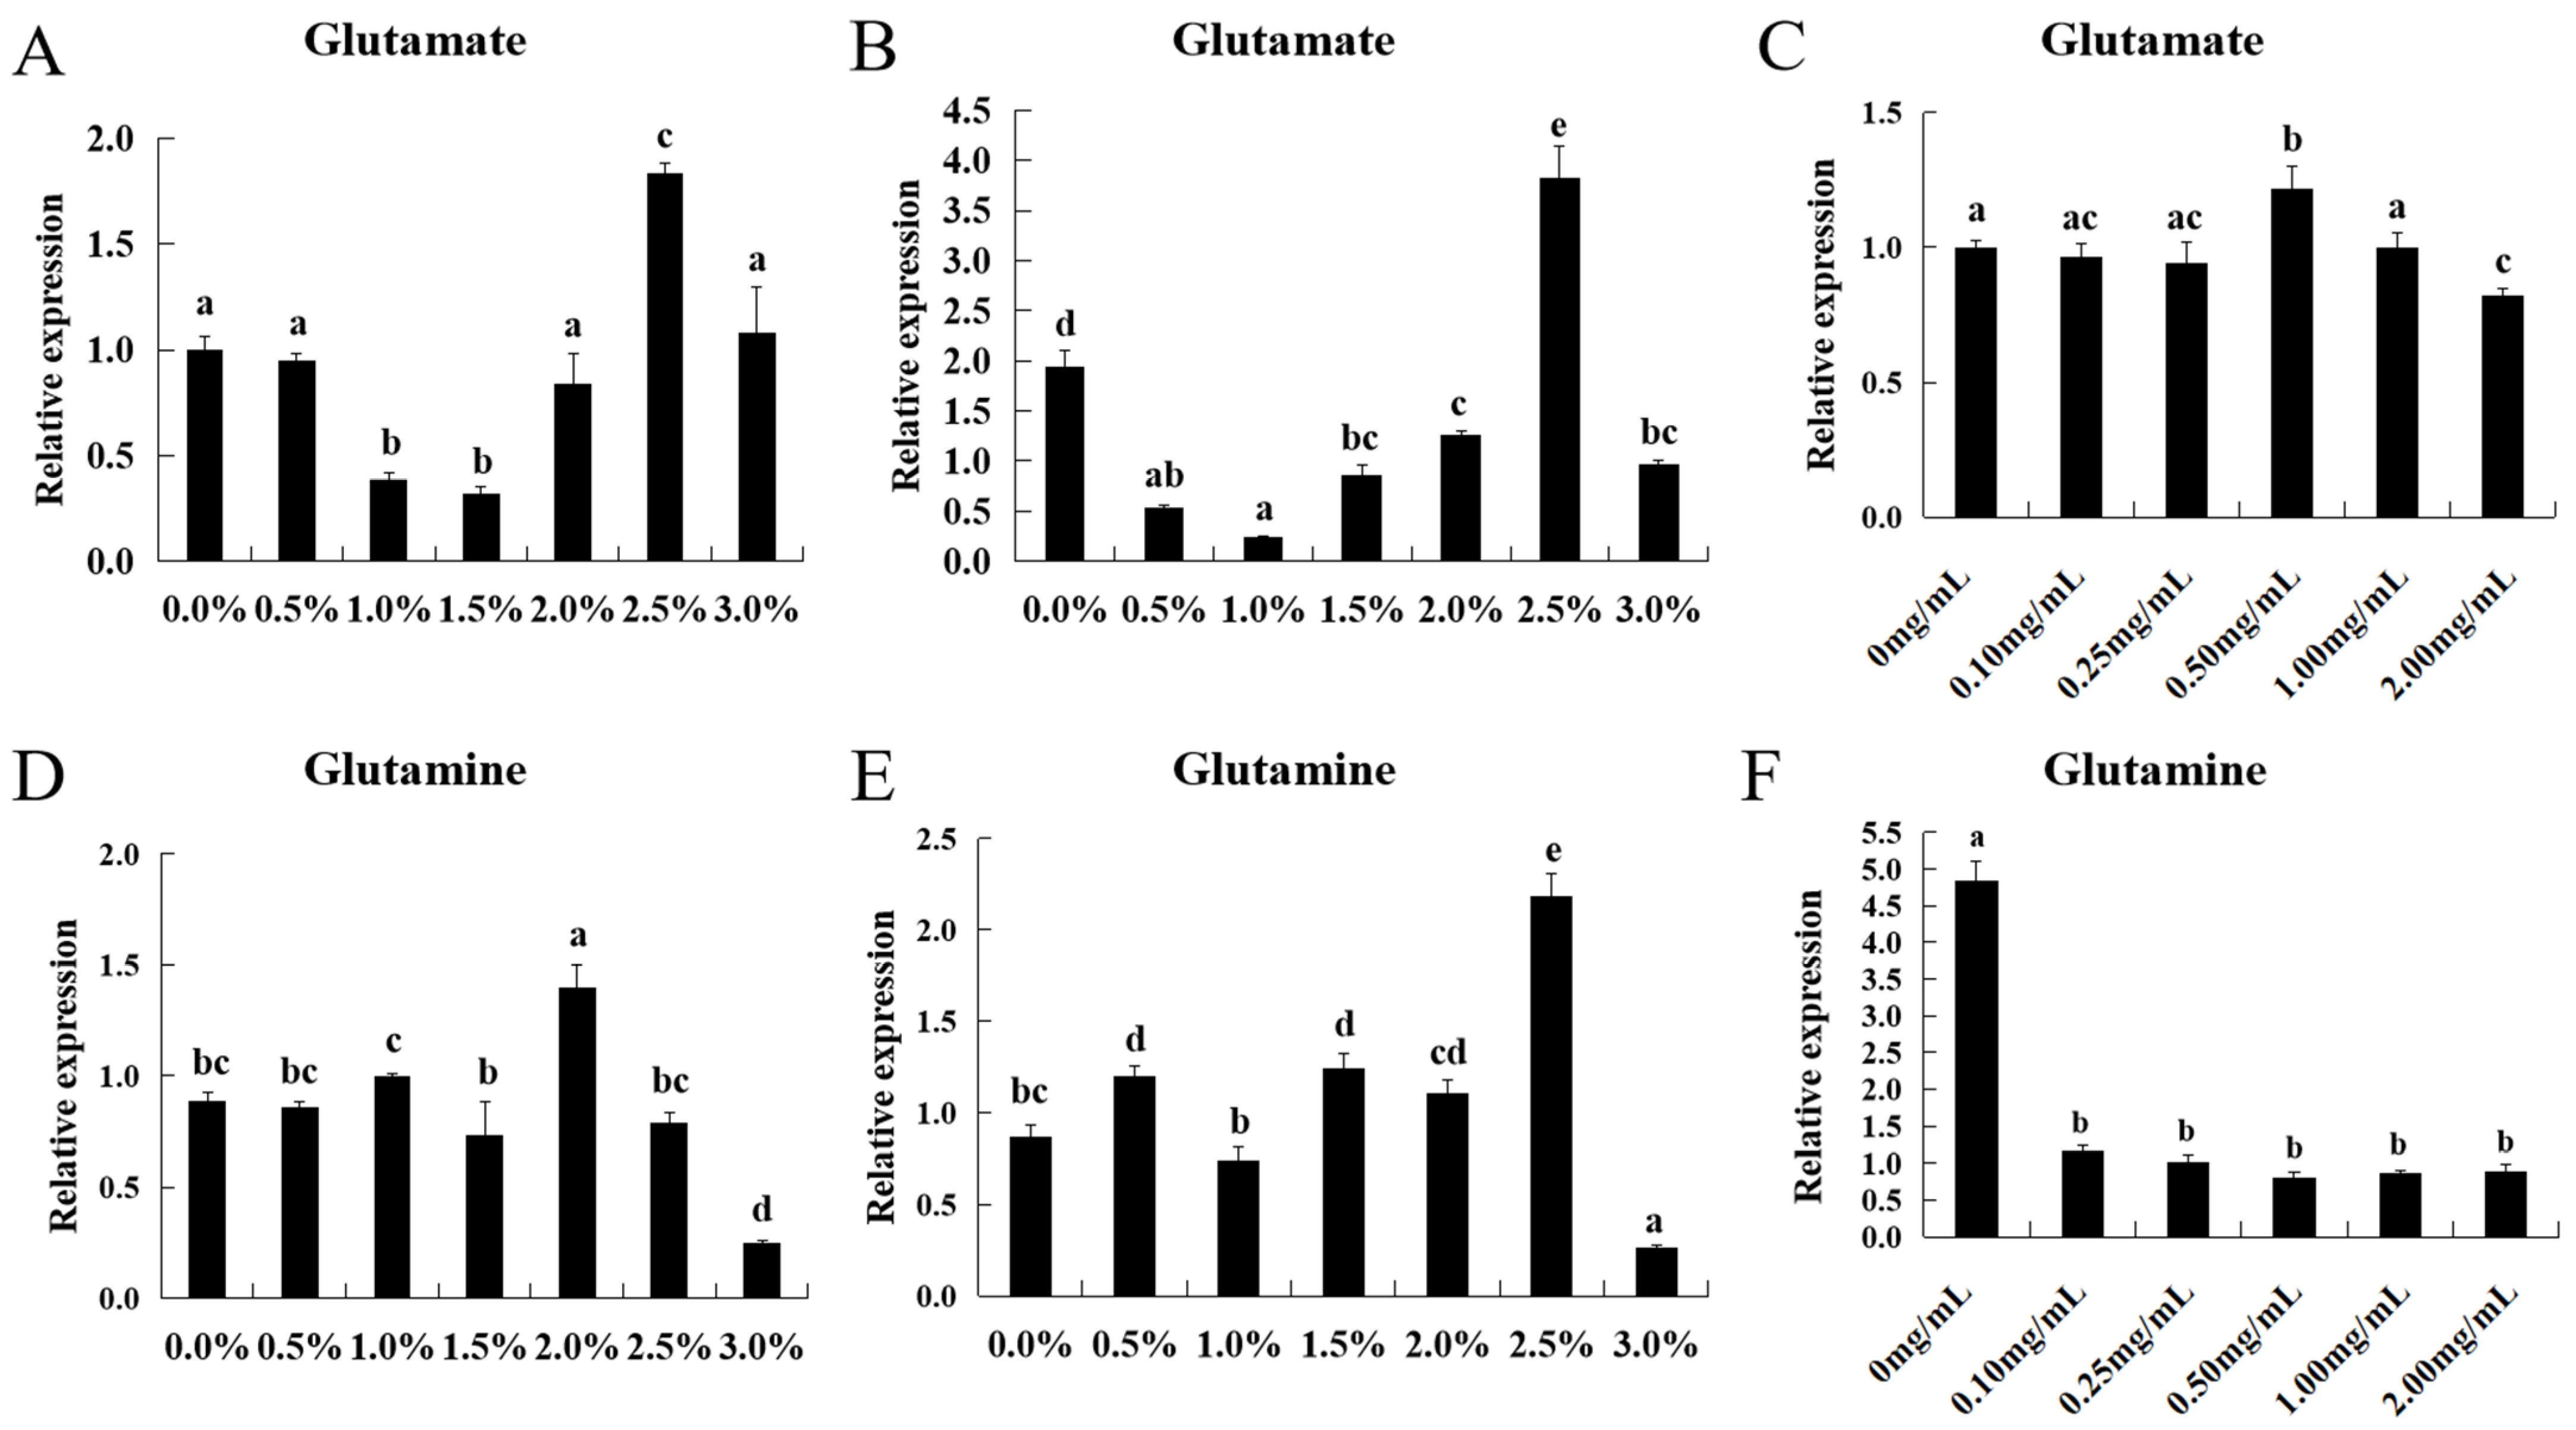
3.3. Effect of Glutamate and Glutamine Levels on the ASCT2 Expression

After 60 days of the feeding trial, the daily growth coefficient (DGC) of fish fed a diet with 1.0% glutamate, as well as 1.0%, 1.5%, and 2.5% glutamine, was significantly lower than fish fed a control diet (p < 0.05) (Table 6). The feed-conversion efficiency (FCR) of fish fed a 1.0% glutamate diet and a 2.5% diet glutamine was significantly higher than fish fed a control diet (p < 0.05). Additionally, the feeding rate (FR) of fish fed 3.0% glutamate was significantly higher than fish fed a control diet (p < 0.05).
The expression pattern of ASCT2 showed that the addition of 2.5% glutamate significantly increased its expression level in triploid crucian carp intestine and muscle (p < 0.05) (Figure 3A,B). In muscle cell, the addition of 0.5 mg/mL glutamate significantly increased the expression of ASCT2 (p < 0.05) (Figure 3C). After that, its expression levels continued to decline. In glutamine experiments, the results showed that the additions of 2.0 and 2.5% glutamine significantly increased the expression levels of ASCT2 in intestine and muscle, respectively (p < 0.05) (Figure 3D,E). However, the expression levels of ASCT2 in muscle cell were reduced in glutamine addition groups compared to the control group (p < 0.05) (Figure 3F).

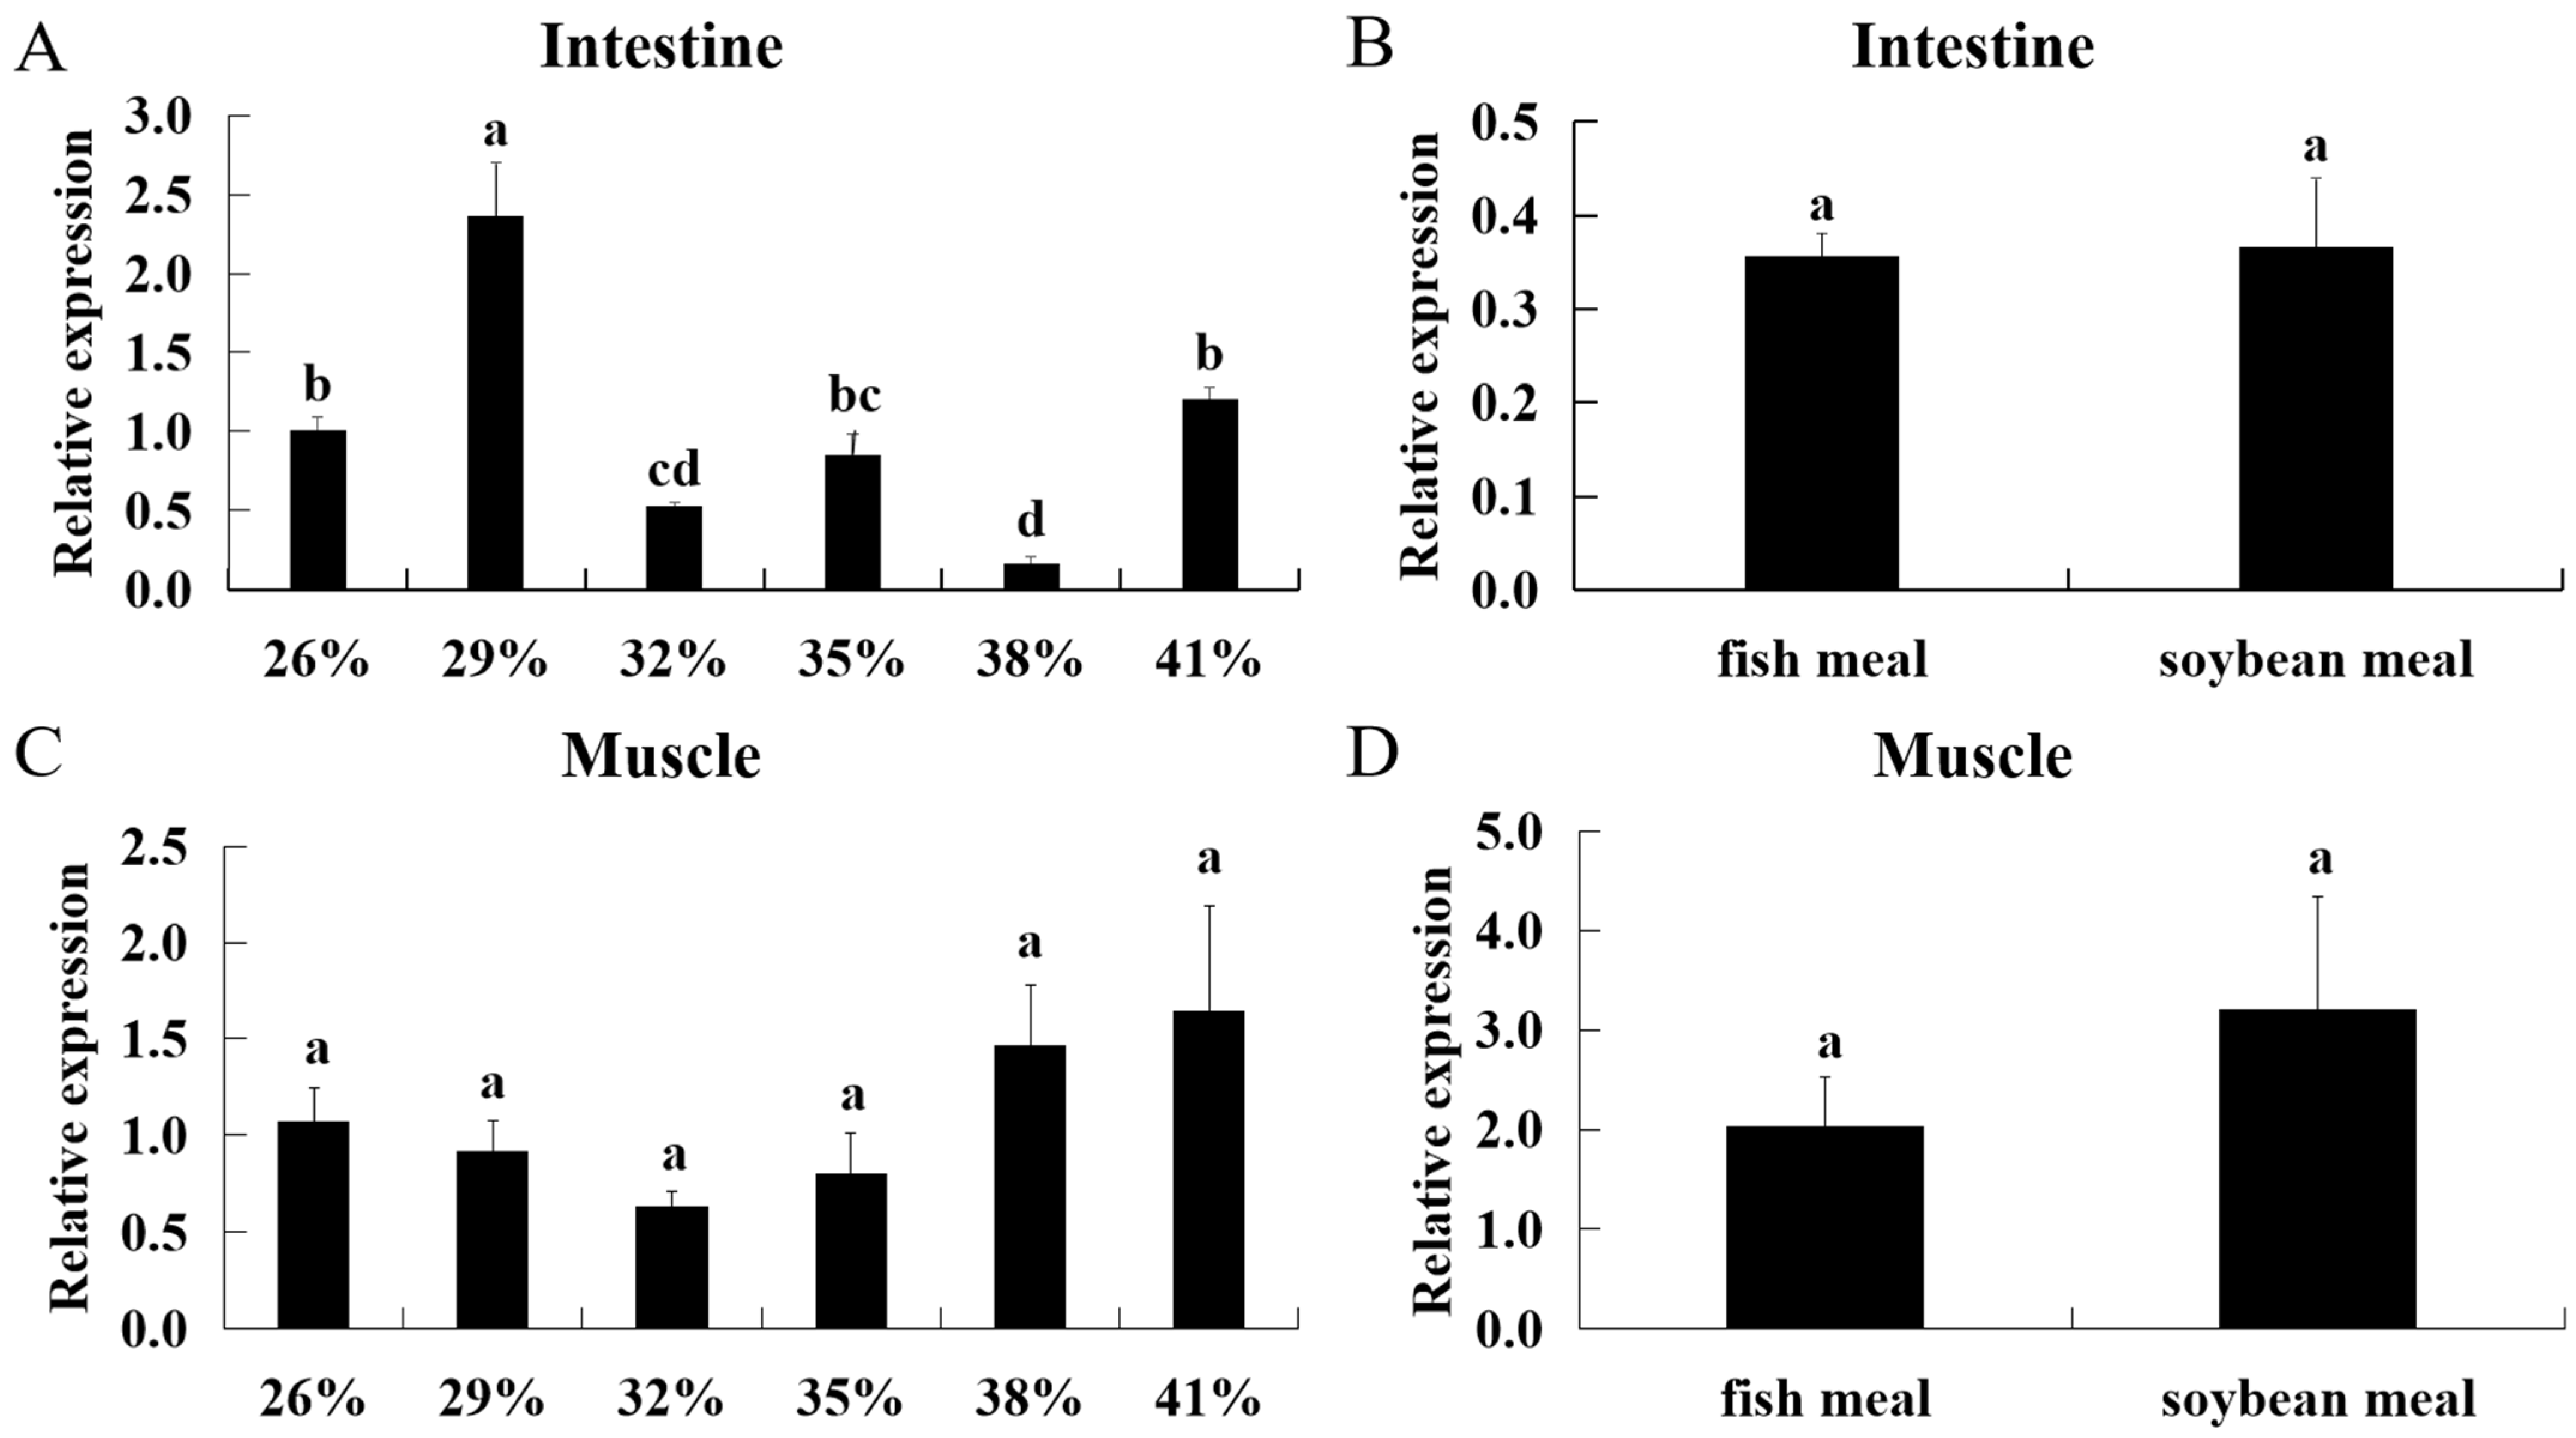
3.4. Effect of Diets with Different Protein Levels and Protein Sources on ASCT2 Expression in Triploid Crucian Carp

In the intestine, ASCT2 showed the highest expression level when fish were fed the diet containing 29% protein (p < 0.05) (Figure 4A). On the contrary, it showed the lowest expression level when fish were fed the diet containing 38% protein (p < 0.05). There was no significant difference between the groups of fish meal and soybean meal (p > 0.05) (Figure 4B). In muscle, there was no significant difference in expression level of ASCT2 between each group (p > 0.05) (Figure 4C,D).

4. Discussion

For aquaculture, dietary protein plays a crucial role in growth and development. ASCT2, which is a transporter of glutamine, plays an important role in dietary protein absorption. In this study, the sequence and expression characterization of ASCT2 in triploid crucian carp were analyzed. The sequence of ASCT2 in triploid crucian carp was cloned, and its ORF region shared the highest sequence homology with that in Cyprinus carpio, followed by Sinocyclocheilus anshuiensis. The phylogenetic tree showed that the ASCT2 of triploid crucian carp shared high sequence homology in cyprinid fish. Moreover, compared with amphibians and mammals, ASCT2 showed the higher homology among fish analyzed in this study. Taken together, it indicates that the evolution of ASCT2 is in accordance with classical taxonomy.
Gene is the internal factor that determines life and health, mRNA abundance in different tissues can reflect its primary function. In mammals, ASCT2 is widely expressed in many tissues, such as lung, skeletal muscle, kidney, testis, intestine, brain, placenta, and pancreas [27,28,29]. Moreover, the expression levels of ASCT2 in various tissues are different [30,31]. In our previous study of grass carp, ASCT2 was widely expressed in intestine, liver, brain, heart, kidney, gill, muscle, hypophysis, spleen and gonad [15]. In this study, the ASCT2 expression pattern in triploid crucian carp was analyzed. The results showed that ASCT2 is widely distributed in all the tissues examined in this study, including heart, spleen, brain, intestine, liver, kidney and muscle. It indicates that ASCT2 is widely distributed in various tissues. Nevertheless, there were significant differences in the mRNA abundance of ASCT2 in different tissues. Among them, the ASCT2 was highly expressed in muscle. This result was consistent with our previous study in grass carp, which indicated that ASCT2 played an important role in muscle. The circadian clock is a conserved pathway among all light-exposed organisms that enables them to maintain an endogenous rhythm of one day [32]. Individual tissues show different response to circadian oscillators [33]. Thus, we further explored the diurnal variation of ASCT2 in muscle. Within a day of 24 h, muscle appeared with high expression levels at 6:00, 15:00 and 24:00. It showed a cyclical change of 9 h during the day, which had reference value for the improvement of feeding strategy. In zebra fish, it is demonstrated that light can dramatically increase the expression of the clock genes period2 and cryptochrome 1a in vivo and in vitro [34,35]. In addition, the oxygen levels can also affect the circadian clock [36]. Thus, we supposed that the variation of diurnal variation in triploid crucian carp might be related to light and oxygen levels, which needs to be further explored.
Glutamine is the main respiratory substrate of intestinal cells, which can significantly improve the morphology and function of the intestine [11]. In this study, we found that the additions of glutamate and glutamine in daily feed increased the FCR and FR in triploid crucian carp. These results were consistent with the research in Atlantic salmon (Salmo salar L.) and grass carp [37,38]. By comparing the effects of glutamate additive on expression levels of ASCT2 between intestine and muscle, we found they had a similar trend. When the addition of glutamate in the feed was low, the expression levels of ASCT2 decreased with the increase of glutamate additives. We speculate it may be related to the change of proton concentration, as ASCT2 is a Na+-dependent neutral amino acid transporter. Then, the expression levels of ASCT2 increased with the increase of glutamate additives, which indicated that glutamate could increase the expression level of ASCT2. Later, the expression levels of ASCT2 decreased significantly with the increase of glutamate additives (p < 0.05). We speculated that it was a self-protection mechanism of ASCT2. By comparing the effects of glutamate on the expression levels in muscle between in vivo and in vitro, we found that they shared the similar trend. It is worth noting that ASCT2 is less sensitive to glutamate in vitro compared to in vivo, which may be due to the stable proton concentration in the medium. Compared to the glutamate group, the expression pattern of ASCT2 in the glutamine group showed the more complex trend. It indicates that ASCT2 is more sensitive to glutamine compared to glutamate. When the additive of glutamine in the feed was low, the expression levels of ASCT2 in the intestines and muscles showed oscillating changes, although the changes were not obvious. However, the expression levels of ASCT2 in the intestine and muscles showed significant increase when the glutamine additive reached 2.0 and 2.5%, respectively (p < 0.05). These results indicate that glutamine can increase the expression of ASCT2. After that, the expression levels of ASCT2 showed significant decrease (p < 0.05), which indicated that extra addition of glutamine could not further increase the expression level of ASCT2. In vitro, the expression levels of ASCT2 showed a sharp decline in the glutamine additive groups, which might be related to a certain concentration of glutamine in medium. It also indicates that ASCT2 is more sensitive to glutamine compared to glutamate.
Compared with plant-source protein, animal-source protein contains antioxidants such as taurine, creatine and phosphocreatine, and plays an important role in the energy metabolism of tissues [39]. In the feedstuff of fish, fish meal is the main source of protein. Given the global context of rapid development of aquaculture, the feedstuff costs are increasing and the protein-rich feedstuffs are lacking [40,41]. There has been an impending necessity to optimize dietary supply in tune with the different physiological needs of organisms [41]. The previous study of triploid crucian carp demonstrated that the different protein levels can affect the transcription levels of some transfer proteins, which play the important roles in nutrition regulation, such as DGH, PepT1 and LAT2 [18,19,20]. In the present study, we found fish fed a low-protein (29%) diet had the highest expression level of intestinal ASCT2 (p < 0.05). On the contrary, the lowest expression level occurred when fish were fed the diet containing 38% protein (p < 0.05). These results indicate that the lowprotein diet can promote the absorption of glutamine. Although the anti-nutritional factors in plant protein could affect nutrient absorption, the results in the present study showed that there was no significant effect on the expression levels of ASCT2 between fish meal and soybean meal.

5. Conclusions

In this study, we cloned the ASCT2 from triploid crucian carp and characterized its expression pattern in different tissues and diurnal variation. Furthermore, we investigated the nutritional regulation of glutamate, glutamine, and different protein levels and protein sources on ASCT2 in triploid crucian carp. In summary, the results in this study provided new statistics for the regulation of ASCT2 expression in teleost fish, enriched our insights into fish nutrient regulation, and played a guiding role in the development of fish feed formulations.

Author Contributions

J.T., Z.M., Z.L. and S.L. (Shaojun Liu) designed the study, participated in technical discussions and performed the analyses. Z.M. and S.L. (Shengwei Luo) prepared and drafted the manuscript. Z.M., X.Z., D.Z., Z.Z., Y.X. and S.L. (Shengwei Luo) performed the experimental work. Z.M., Z.Z. and S.C. performed the statistical analyses. Z.M., S.L. (Shengwei Luo), S.C., Y.X., X.Z., Z.Z. and D.Z. collected the experimental materials. The manuscript was written and modified by J.T., Z.L., S.L. (Shaojun Liu), Z.M., S.C. and Y.Z. All authors have read and agreed to the published version of the manuscript.

Funding

This research was supported by the National Natural Science Foundation of China (Grant No.U19A2041, 31772865, 32102813 and 31702378), State Key Laboratory of Developmental Biology of Freshwater Fish (Grant No.2021KF010), Hunan Provincial Natural Science Foundation of China (Grant No.2019JJ50687 and 2021JJ40627), and Scientific Research of Hunan Provincial Education Department, China (Grant No.20B058 and 19K010).

Institutional Review Board Statement

Fish treatments were carried out according to the regulations for protected wildlife and the Administration of Affairs Concerning Animal Experimentation and were approved by the Science and Technology Bureau of China. Approval from the Department of Wildlife Administration was not required for the experiments conducted in this paper. The Administration of Affairs Concerning Animal Experimentation Guidelines states that approval from the Science and Technology Bureau of China and the Department of Wildlife Administration is not necessary when the fish in question are not rare or near extinction (first-class or second-class state protection level). Therefore, ethical review and approval were waived for this study.

Informed Consent Statement

Not applicable.

Data Availability Statement

All the datasets used and/or analyzed throughout the present study are available from the corresponding author upon reasonable request.

Acknowledgments

The author would like to thank Luojing Zhou, Fufa Qu and Wenqian Xu for their help in this study.

Conflicts of Interest

The authors declare no conflict of interest.

References

  1. Garaeva, A.A.; Guskov, A.; Slotboom, D.J.; Paulino, C. A one-gate elevator mechanism for the human neutral amino acid transporter ASCT2. Nat. Commun. 2019, 10, 3427. [Google Scholar] [CrossRef] [Green Version]
  2. Ndaru, E.; Garibsingh, R.; Shi, Y.Y.; Wallace, E.; Zakrepine, P.; Wang, J.; Schlessinger, A.; Grewer, C. Novel alanine serine cysteine transporter 2 (ASCT2) inhibitors based on sulfonamide and sulfonic acid ester scaffolds. J. Gen. Physiol. 2019, 151, 357–368. [Google Scholar] [CrossRef] [Green Version]
  3. Scalise, M.; Pochini, L.; Panni, S.; Pingitore, P.; Hedfalk, K.; Indiveri, C. Transport mechanism and regulatory properties of the human amino acid transporter ASCT2 (SLC1A5). Amino Acids 2014, 46, 2463–2475. [Google Scholar] [CrossRef]
  4. Scalise, M.; Mazza, T.; Pappacoda, G.; Pochini, L.; Cosco, J.; Rovella, F.; Indiveri, C. The human SLC1A5 neutral amino acid transporter catalyzes a pH-dependent glutamate/glutamine antiport, as well. Front. Cell Dev. Biol. 2020, 8, 603. [Google Scholar] [CrossRef] [PubMed]
  5. Fox, A.D.; Kripke, S.A.; De, P.J.; Berman, J.M.; Settle, R.G.; Rombeau, J.L. Effect of a glutamine-supplemented enteral diet on methotrexate-induced enterocolitis. JPEN, J. Parenter. Enteral Nutr. 1988, 12, 325. [Google Scholar] [CrossRef] [PubMed]
  6. Wang, Q.; Hardie, R.A.; Hoy, A.J.; Geldermalsen, M.V.; Gao, D.; Fazli, L.; Sadowski, M.C.; Balaban, S.; Schreuder, M.; Nagarajah, R.; et al. Targeting ASCT2-mediated glutamine uptake blocks prostate cancer growth and tumour development. J. Pathol. 2015, 236, 278–289. [Google Scholar] [CrossRef] [PubMed] [Green Version]
  7. Souba, W.W.; Klimberg, V.S.; Plumley, D.A.; Salloum, R.M.; Flynn, T.C.; Bland, K.I.; Copeland, E.M. The role of glutamine in maintaining a healthy gut and supporting the metabolic response to injury and infection. J. Surg. Res. 1990, 48, 383–391. [Google Scholar] [CrossRef]
  8. Neu, J.; Shenoy, V.; Chakrabarti, R. Glutamine nutrition and metabolism: Where do we go from here? FASEB J. 1996, 10, 829–837. [Google Scholar] [CrossRef] [PubMed]
  9. Colas, C.; Grewer, C.; Otte, N.J.; Gameiro, A.; Albers, T.; Singh, K.; Shere, H.; Bonomi, M.; Holst, J.; Schlessinger, A. Ligand discovery for the alanine-serine-cysteine transporter (ASCT2, SLC1A5) from homology modeling and virtual screening. Biophys. J. 2015, 108, 54a. [Google Scholar] [CrossRef] [Green Version]
  10. Toda, K.; Nishikawa, G.; Iwamoto, M.; Itatani, Y.; Takahashi, R.; Sakai, Y.; Kawada, K. Clinical role of ASCT2 (SLC1A5) in KRAS-mutated colorectal cancer. Int. J. Mol. Sci. 2017, 18, 1632. [Google Scholar] [CrossRef] [PubMed] [Green Version]
  11. Van Geldermalsen, M.; Wang, Q.; Nagarajah, R.; Marshall, A.; Thoeng, A.; Gao, D.; Ritchie, W.; Feng, Y.; Bailey, C.; Deng, N.; et al. ASCT2/SLC1A5 controls glutamine uptake and tumour growth in triple-negative basal-like breast cancer. Oncogene 2016, 35, 3201–3208. [Google Scholar] [CrossRef] [PubMed] [Green Version]
  12. Shimode, S.; Nakaoka, R.; Shogen, H.; Miyazawa, T. Characterization of feline ASCT1 and ASCT2 as RD-114 virus receptor. J. Gen. Virol. 2013, 94, 1608–1612. [Google Scholar] [CrossRef] [PubMed]
  13. Yoshikawa, R.; Okamoto, M.; Sakaguchi, S.; Nakagawa, S.; Miura, T.; Hirai, H.; Miyazawa, T. Simian retrovirus 4 induces lethal acute thrombocytopenia in Japanese macaques. J. Virol. 2015, 89, 3965–3975. [Google Scholar] [CrossRef] [PubMed] [Green Version]
  14. Souba, W.W. Interorgan ammonia metabolism in health and disease: A surgeon’s view. JPEN, J. Parenter. Enteral Nutr. 1987, 11, 569–579. [Google Scholar] [CrossRef]
  15. Hu, R.; Wang, Y.; Qu, F.; Tang, J.; Zhou, Y.; Lu, S.; Zhang, J.; Liu, Z.; Zhou, Z.; Guo, X. Molecular characterization and dietary regulation of the AlaSerCys transporter 2 in grass carp, Ctenopharyngodon idella. J. World Aquacult. Soc. 2017, 48, 333–341. [Google Scholar] [CrossRef]
  16. Kanai, Y.; Hediger, M. The glutamate/neutral amino acid transporter family SLC1: Molecular, physiological and pharmacological aspects. Pfluegers Arch. 2004, 447, 469–479. [Google Scholar] [CrossRef]
  17. Tomé, D. The roles of dietary glutamate in the intestine. Ann. Nutr. Metab. 2018, 73, 15–20. [Google Scholar] [CrossRef] [PubMed]
  18. Liu, Z.; Zhou, Y.; Liu, S.; Zhao, Q.; Feng, J.; Lu, S.; Xiong, G.; Xie, D.; Zhang, J.; Liu, Y. Characterization and dietary regulation of oligopeptide transporter (PepT1) in different ploidy fishes. Peptides 2014, 52, 149–156. [Google Scholar] [CrossRef] [PubMed]
  19. Liu, Z.; Zhou, Y.; Wang, Y.; Lu, S.; Zhao, Q.; Wu, Q.; Xiong, G.; Hao, G.; Zhang, J. Characterization of l-type amino acid transporter 2 from crucian carp, Carassius auratus. J. World Aquacult. Soc. 2014, 45, 709–718. [Google Scholar] [CrossRef]
  20. Liu, Z.; Zhou, Y.; Liu, S.; Zhong, H.; Zhang, C.; Kang, X.; Liu, Y. Characterization and dietary regulation of glutamate dehydrogenase in different ploidy fishes. Amino Acids 2012, 43, 2339–2348. [Google Scholar] [CrossRef] [PubMed]
  21. Shen, J.; Liu, S.; Sun, Y.; Zhang, C.; Luo, K.; Tao, M.; Chen, Z.; Liu, Y. A new type of triploid crucian crap-red crucian crap (♀) × allotetraploid (♂). Prog. Nat. Sci. 2006, 16, 1348–1352. [Google Scholar]
  22. Mao, Z.; Fu, Y.; Wang, S.; Wang, Y.; Luo, K.; Zhang, C.; Tao, M.; Liu, S. Further evidence for paternal DNA transmission in gynogenetic grass carp. Sci. China: Life Sci. 2020, 63, 1287–1296. [Google Scholar] [CrossRef] [PubMed]
  23. Kumar, S.; Stecher, G.; Li, M.; Knyaz, C.; Tamura, K. MEGA X: Molecular Evolutionary Genetics Analysis across computing platforms. Mol. Biol. Evol. 2018, 35, 1547–1549. [Google Scholar] [CrossRef] [PubMed]
  24. Atteson, K. The performance of neighbor-joining methods of phylogenetic reconstruction. Algorithmica 1999, 25, 251–278. [Google Scholar] [CrossRef]
  25. Rao, X.; Huang, X.; Zhou, Z.; Lin, X. An improvement of the 2(-delta delta CT) method for quantitative real-time polymerase chain reaction data analysis. Biostat. Bioinform. Biomath. 2013, 3, 71–85. [Google Scholar]
  26. Cao, S.; Mo, P.; Xiao, Y.; Chen, Y.; Shi, Y.; Hu, Y.; Tang, J.; Qu, F.; Luo, M.; Ai, X.; et al. Dietary supplementation with fermented plant meal enhances growth, antioxidant capacity and expression of TOR signaling pathway genes in gibel carp (Carassius auratus gibelio var. CAS V). Aquacult. Rep. 2021, 19, 100559. [Google Scholar] [CrossRef]
  27. Scalise, M.; Pochini, L.; Console, L.; Losso, M.A.; Indiveri, C. The human SLC1A5 (ASCT2) amino acid transporter: From function to structure and role in cell biology. Front. Cell Dev. Biol. 2018, 6, 96. [Google Scholar] [CrossRef]
  28. Yang, C.; Yang, X.; Fan, M.Z. Apical Na+-dependent neutral amino acid exchanger ASCT2/ATB0 and mTOR-signaling components are expressed along the entire jejunal crypt–villus axis in young pigs fed a liquid milk replacer. Can. J. Anim. Sci. 2016, 97, 19–29. [Google Scholar] [CrossRef] [Green Version]
  29. Kanai, Y.; Clémençon, B.; Simonin, A.; Leuenberger, M.; Lochner, M.; Weisstanner, M.; Hediger, M.A. The SLC1 high-affinity glutamate and neutral amino acid transporter family. Mol. Asp. Med. 2013, 34, 108–120. [Google Scholar] [CrossRef] [PubMed]
  30. Utsunomiya-Tate, N.; Endou, H.; Kanai, Y. Cloning and functional characterization of a system ASC-like Na-dependent neutral amino acid transporter. J. Biol. Chem. 1996, 271, 14883–14890. [Google Scholar] [CrossRef] [Green Version]
  31. Ochiai, H.; Onda, K.; Ogihara, K.; Naya, Y.; Sugiyama, H.; Maruo, T. cDNA sequence and tissue distribution of canine Na-dependent neutral amino acid transporter 2 (ASCT 2). J. Vet. Med. Sci. 2012, 74, 1505. [Google Scholar] [CrossRef] [Green Version]
  32. Pelster, B.; Egg, M. Hypoxia-inducible transcription factors in fish: Expression, function and interconnection with the circadian clock. J. Exp. Biol. 2018, 221, jeb163709. [Google Scholar] [CrossRef] [Green Version]
  33. Whitmore, D.; Foulkes, N.; Strähle, U.; Sassone-Corsi, P. Zebrafish Clock rhythmic expression reveals independent peripheral circadian oscillators. Nat. Neurosci. 1998, 1, 701–707. [Google Scholar] [CrossRef] [PubMed]
  34. Tamai, T.K.; Young, L.C.; Whitmore, D. Light signaling to the zebrafish circadian clock by Cryptochrome 1a. Proc. Natl. Acad. Sci. USA 2007, 104, 14712–14717. [Google Scholar] [CrossRef] [PubMed] [Green Version]
  35. Frøland Steindal, I.A.; Whitmore, D. Circadian clocks in fish—What have we learned so far? Biology 2019, 8, 17. [Google Scholar] [CrossRef] [PubMed] [Green Version]
  36. Adamovich, Y.; Ladeuix, B.; Golik, M.; Koeners, M.; Asher, G. Rhythmic oxygen levels reset circadian clocks through HIF1α. Cell Metab. 2017, 25, 93–101. [Google Scholar] [CrossRef] [PubMed] [Green Version]
  37. Oehme, M.; Grammes, F.; Takle, H.; Zambonino-Infante, J.-L.; Refstie, S.; Thomassen, M.S.; Rørvik, K.-A.; Terjesen, B.F. Dietary supplementation of glutamate and arginine to Atlantic salmon (Salmo salar L.) increases growth during the first autumn in sea. Aquaculture 2010, 310, 156–163. [Google Scholar] [CrossRef]
  38. Qu, F.; Liu, Z.; Hu, Y.; Zhao, Q.; Zhou, Y.; Liu, Z.; Zhong, L.; Lu, S.; Li, J. Effects of dietary glutamine supplementation on growth performance, antioxidant status and intestinal function in juvenile grass carp (Ctenopharyngodon idella). Aquacult. Nutr. 2019, 25, 609–621. [Google Scholar] [CrossRef]
  39. Li, P.; Wu, G. Composition of amino acids and related nitrogenous nutrients in feedstuffs for animal diets. Amino Acids 2020, 52, 523–542. [Google Scholar] [CrossRef] [PubMed] [Green Version]
  40. Zhu, R.; Li, L.; Li, M.; Yu, Z.; Wang, H.; Wu, L. The effects of substituting fish meal with soy protein concentrate on growth performance, antioxidant capacity and intestinal histology in juvenile golden crucian carp, Cyprinus carpio × Carassius auratus—ScienceDirect. Aquacult. Rep. 2020, 18, 100435. [Google Scholar] [CrossRef]
  41. Kaushik, S.J.; Seiliez, I. Protein and amino acid nutrition and metabolism in fish: Current knowledge and future needs. Aquac. Res. 2010, 41, 322–332. [Google Scholar] [CrossRef]
Figure 1. Phylogenetic tree of ASCT2 constructed using the Neighbor-Joining method. The accession numbers are as below: Oreochromis niloticus XM_005455767.2, Oryzias latipes XM_004075403.2, Stegastes partitus XM_008280441.1, Notothenia coriiceps XM_010784363.1, Cynoglossus semilaevis XM_008309163.1, Larimichthys crocea XM_010729605.1, Poecilia reticulata XM_008425725.1, Fundulus heteroclitus XM_012877463.3, Ictalurus punctatus JT405397.1, Astyanax mexicanus XM_007240697.3, Danio rerio NM_001190755.1, Ctenopharyngodon idella AOM03290.1, Alligator mississippiensis XM_006277818.1, Erinaceus europaeus XM_007532183.1, Microcebus murinus XM_012761502.1, Homo sapiens KJ897563.1, Mus musculus XM_006539695.1, Nannospalax galili XM_008821784.1, Rattus norvegicus NM_175758.3. ASCT2 indicated triploid crucian carp. Numbers at the nodes represent the percentages of 1000 bootstrap replicates.
Fishes 06 00077 g001
Figure 2. ASCT2 expression levels in various tissues and diurnal variation. (A) The relative abundance of ASCT2 mRNA in different tissues. (B) The relative abundance of ASCT2 mRNA in muscle. Data are present as Means ± SE (n = 3). Different letters indicate significant differences, (p < 0.05).
Fishes 06 00077 g002
Figure 3. The effect of glutamate and glutamine additives on the ASCT2 expression levels in triploid crucian carp. (A) The effect of glutamate additives on the ASCT2 expression levels in the intestine of triploid crucian carp. (B) The effect of glutamate additives on the ASCT2 expression levels in the muscle of triploid crucian carp in vivo. (C) The effect of glutamate additives on the ASCT2 expression levels in the muscle cells of triploid crucian carp in vitro. (D) The effect of glutamine additives on the ASCT2 expression levels in the intestine of triploid crucian carp. (E) The effect of glutamine additives on the ASCT2 expression levels in the muscle of triploid crucian carp in vivo. (F) The effect of glutamine additives on the ASCT2 expression levels in the muscle cells of triploid crucian carp in vitro. Data are present as Means ± SE (n = 3). Different letters indicate significant differences (p < 0.05).
Fishes 06 00077 g003
Figure 4. ASCT2 expression levels of triploid crucian carp after feeding diets with different protein levels and protein sources. (A) ASCT2 expression levels in intestine after feeding diets with different protein levels. (B) ASCT2 expression levels in intestine after feeding diets with different protein sources. (C) ASCT2 expression levels in the muscle after feeding diets with different protein levels. (D) ASCT2 expression levels in muscle after feeding diets with different protein sources. Data are present as Means ± SE (n = 3). Different characters represent significant difference (p < 0.05).
Fishes 06 00077 g004
Table 1. The sequences of primers used in this study.
Primer NamesSequence Direction (5′ → 3′)Use
ASCT2-FCATAAGTCATTTCCACGCTGCCDS
ASCT2-RGGAATCAGCGTGAATGAGGTACDS
RT-actin-FCTGCCCACCAACGATCTGTCCCqRT-PCR
RT-actin-RCTTATTTAGCCCCGCCCCCTCTqRT-PCR
RT-ASCT2-FGAACACTGTGCTGTCTGGAGGTAqRT-PCR
RT-ASCT2-RCTTGGGTTGGTCGTTTGAATCqRT-PCR
Table 2. Formulations of glutamate diets.
GroupControlGlutamate
0.5%1.0%1.5%2.0%2.5%3.0%
Glutamate00.511.522.53
Fish meal2222222
Soybean meal34343434343434
Rapeseed meal23.623.623.623.623.623.623.6
Wheat flour16161616161616
Fish oil2222222
Soybean oil2.52.52.52.52.52.52.5
Corn starch6666666
Choline chloride0.110.110.110.110.110.110.11
Vitamin and mineral premix a1.51.51.51.51.51.51.5
Methionine0.50.50.50.50.50.50.5
CMC3333333
Cellulose8.798.297.797.296.796.295.79
Total100100100100100100100
a Vitamin and mineral premix provided by DSM, S.A. de C.V.
Table 3. Formulations of glutamine diets.
GroupControlGlutamine
0.5%1.0%1.5%2.0%2.5%3.0%
Glutamine00.511.522.53
Fish meal2222222
Soybean meal34343434343434
Rapeseed meal23.623.623.623.623.623.623.6
Wheat flour16161616161616
Fish oil2222222
Soybean oil2.52.52.52.52.52.52.5
Corn starch6666666
Choline chloride0.110.110.110.110.110.110.11
Vitamin and mineral premix a1.51.51.51.51.51.51.5
Methionine0.50.50.50.50.50.50.5
CMC3333333
Cellulose8.798.297.797.296.796.295.79
Total100100100100100100100
a Vitamin and mineral premix provided by DSM, S.A. de C.V.
Table 4. Experimental diet compositions with different protein levels.
Ingredients (g/kg)Diets of Protein Levels
26%29%32%35%38%41%
Fish meal12.00 12.00 12.00 12.00 12.00 12.00
Soybean meal20.00 20.00 20.00 20.00 20.00 20.00
Rapeseed meal15.00 15.00 15.00 15.00 15.00 15.00
Casein0.00 3.20 6.50 9.80 13.10 16.40
Fish oil3.00 3.00 3.00 3.00 3.00 3.00
Soybean oil3.00 3.00 3.00 3.00 3.00 3.00
Corn starch25.00 21.00 16.80 12.60 8.40 4.20
Wheat flour10.00 10.00 10.00 10.00 10.00 10.00
Choline chloride0.50 0.50 0.50 0.50 0.50 0.50
Vitamin and mineral premix a3.00 3.00 3.00 3.00 3.00 3.00
CMC3.00 3.00 3.00 3.00 3.00 3.00
Methyl cellulose5.50 6.30 7.20 8.10 9.00 9.00
a Vitamin and mineral premix provided by DSM, S.A. de C.V.
Table 5. Feed formulations in different protein sources.
Ingredients (g/kg)Fish Meal GroupSoybean Meal Group
Fish meal44.40 0.00
Soybean meal0.00 37.10
Rapeseed meal0.00 15.00
Casein0.00 6.50
Fish oil1.63 3.50
Soybean oil1.63 3.50
Corn starch31.00 10.00
Wheat flour10.00 10.00
Choline chloride0.50 0.50
Vitamin and mineral premix a3.00 3.00
CMC3.00 3.00
Methyl cellulose4.80 7.90
Nutrition level
Crude protein (%)32.05 32.03
Crude lipid (%)8.05 8.06
Gross energy (MJ/kg)18.06 18.00
a Vitamin and mineral premix provided by DSM, S.A. de C.V.
Table 6. Growth performance of triploid crucian carp fed with the experimental diets containing different contents of glutamate/glutamine.
GroupsDGC(%) 1FCR 2FR (%BW/Day) 3
Control0.65 ± 0.01 b4.50 ± 0.07 a 1.26 ± 0.00 a
Glu 0.5%0.57 ± 0.07 b5.26 ± 0.62 a 1.29 ± 0.02 ab
Glu 1.0%0.39 ± 0.03 a7.65 ± 0.60 b 1.31 ± 0.01 ab
Glu 1.5%0.57 ± 0.04 b5.21 ± 0.34 a 1.28 ± 0.01 ab
Glu 2.0%0.51 ± 0.05 ab5.86 ± 0.55 a 1.29 ± 0.01 ab
Glu 2.5%0.57 ± 0.06 b5.26 ± 0.57 a 1.28 ± 0.01 ab
Glu 3.0%0.52 ± 0.02 ab5.70 ± 0.19 a 1.33 ± 0.04 b
Gln 0.5%0.46 ± 0.05 ab6.62 ± 0.74 ab 1.31 ± 0.01 a
Gln 1.0%0.44 ± 0.05 a6.95 ± 0.75 ab 1.30 ± 0.01 a
Gln 1.5%0.45 ± 0.08 a6.95 ± 1.06 ab 1.30 ± 0.02 a
Gln 2.0%0.48 ± 0.06 ab6.34 ± 0.74 ab 1.29 ± 0.01 a
Gln 2.5%0.39 ± 0.04 a7.92 ± 0.95 b 1.31 ± 0.01 a
Gln 3.0%0.46 ± 0.02 ab6.54 ± 0.24 ab 1.25 ± 0.05 a
Note: Values are Means ± SE (n = 3). Values in the same row with different superscript letters are significantly different (p < 0.05). Absence of letters indicates no significant difference between treatments. Glu and Gln represent groups of glutamate and glutamine, respectively. Abbreviations: 1 Daily growth coefficient (DGC, %) = 100 × (final body weight1/3 − initial body weight1/3)/Σ(days). 2 Feed conversion efficiency (FCR) = (total dry feed intake)/(total final body weight − total initial body weight). 3 Feeding rate (FR, % body weight/day) = (total dry feed intake)/[days × (total final body weight + total initial body weight)/2] × 100.
Publisher’s Note: MDPI stays neutral with regard to jurisdictional claims in published maps and institutional affiliations.

