Article

Effects of Food Deprivation Duration on the Behavior and Metabolism of Black Rockfish (Sebastes schlegelii)

1
The Key Laboratory of Mariculture, Ministry of Education, Ocean University of China, Qingdao 266003, China
2
Fisheries College, Zhejiang Ocean University, Zhoushan 316022, China
3
Laboratory for Marine Fisheries Science and Food Production Processes, Qingdao National Laboratory for Marine Science and Technology, Qingdao 266237, China
*
Author to whom correspondence should be addressed.
Fishes 2021, 6(4), 58; https://doi.org/10.3390/fishes6040058
Submission received: 6 September 2021 / Revised: 27 October 2021 / Accepted: 4 November 2021 / Published: 6 November 2021

Abstract

:
Fish often undergo food shortages in nature, especially for juveniles that are relatively vulnerable in most aspects. Therefore, the effects of food deprivation on fish behavior and physiology are worth exploring. Here, we investigated the behavioral and metabolic adaptations of the juvenile black rockfish Sebastes schlegelii to different durations of food deprivation. In this study, three treatments were set: control group, short-term food deprivation (STFD) group, and long-term food deprivation (LTFD) group. The rearing lasted for six weeks. During this period, videos were recorded three times per week to assess the locomotor activity and aggression. After this, the fishes’ boldness, neophobia, and aggressiveness were assessed using different behavioral assessment devices, while the standard metabolic rate (SMR) was measured by flow-type respirometry. In general, the values of the four indicators (swimming time, the number of turns, movement number, and attack number) for the STFD group were significantly higher than those for the control and LTFD group during the same period of rearing. In a subsequent personality assessment, the STFD group was observed to be significantly bolder in an assessment measuring boldness than the control and LTFD group (indicated by time in the circle, swimming time, number of times through the circle, and frequency in the circle). The LTFD group was observed to be more exploratory in the assessment of neophobia (indicated by duration in the exploratory area, distance from novelty item, and frequency of stay in the exploratory area). Indeed, the LTFD group was observed to be significantly less aggressive in the assessment of aggressiveness than the control and STFD group (indicated by attack number, attack range frequency, first attack, and winner). SMR was noted to be significantly higher in the STFD group than in the control and LTFD group. In conclusion, this study firstly reported the effects of food deprivation duration on the personalities of black rockfish, as well as the behavioral and physiological mechanisms. Thus, we hope to provide insights into the work of stock enhancement.

Graphical Abstract

1. Introduction

Climate change and human activities have degraded marine habitats and threaten marine life, leading to the inability of many fish species to obtain adequate amounts of food [1]. Like other vertebrates, in order to cope with these changes, many fishes inevitably experience more or fewer periods of food deprivation and even extreme temporal and spatial variation in food availability [2,3]. For example, fish undergoing eutrophication in summer [4] and overwintering [5] are considered to be in a period of food deprivation. The deprivation of food will affect fishes in many aspects, such as their personality and physiological state. Juveniles with weak foraging ability are more likely to be affected by food deprivation. There have been previous studies on the effect of food deprivation on the boldness and shyness of guppy (Poecilia reticulata) [6], the social behavior of stickleback (Gasterosteus aculeatus) and zebrafish (Danio rerio) [7,8], the aggressive behavior of amberjack (Seriola dumerili) [9], and the metabolism of qingbo carp (Spinibarbus sinensis) and brown trout (Salmo trutta) [10,11]. However, most studies used only a relative single behavioral indicator, and the food deprivation duration used is relatively fixed. Differences in living environment can lead to intraspecific behavior variation [6]. As an environmental factor, food abundance can often cause intraspecific behavior variation [12], and this can also be referred to as an ability to respond to environmental conditions by changing phenotypes (developmental plasticity) during the ontogenetic process [13]. This has been demonstrated by almost all organisms studied so far [14]. Previous experiments have shown that the environment can continuously influence phenotypic traits, and the availability of food during the juvenile stage can completely influence the entire life history of an individual [15]. In this way, personalities shaped early in an individual’s life history often continue into adulthood [16]. Therefore, it is particularly important to explore the effects of different durations of food deprivation on the personalities and the mechanisms of juvenile fish during this phase.
Fish behavior is an external manifestation of their personality traits and can usually be categorized into two contrasting types: proactive (active coping, bold, or ‘fight–flight’) and reactive (passive coping, shy, or ‘non–aggressive’) [17]. Individuals with stronger personalities that are more aggressive may occupy a higher social rank in the population and have an advantageous position in individual competition and population reproduction [18,19]. However, sometimes being more aggressive is not an advantage [20]. Among these traits, boldness, neophobia (which is seen as a way of reducing the risk associated with initially encountering local threats), and aggressiveness are all important indicators of fishes’ personalities. Although innate heredity has an indelible contribution to the establishment of fishes’ personalities [21,22], the influence of acquired experience (phenotypic plasticity) on their personalities is still huge [23]. This topic has received extensive attention from ethologists [20,24]. It is well recognized that the behaviors of fish are closely related to their physiological characteristics [25,26]. Among them, energy metabolism is the fundamental condition required for the normal operation of individual survival activities and the related physiological functions of fish, while metabolic rate determines the energy cost of survival [11]. The minimum metabolic rate required to survive is called the standard metabolic rate (SMR) and is generally considered to be the lowest cost needed to support individuals’ “luxury” behaviors and physiological activities. Excess energy can only be allocated to other living activities when the basic energy requirements (SMR) are met [27]. Many researchers have studied the differences of an individual’s SMR and found that intraspecific SMR differences between individuals can reach several times or up to more than ten times even when controlling for multiple factors [28]. Higher energy metabolism means more activity and a faster speed of growth; active individuals tend to need a higher food intake, which also means they have higher energy costs [11]. Individuals with lower levels of SMR have a lower energy cost, meaning that they can allocate more remaining energy to other life activities [11,29]. Additionally, quite a few researchers believe that SMR is determined by genetics [30]. Some studies have been conducted on the effects of food deprivation on metabolism and the relationship between metabolism and a single behavior [10], but the effects of different levels of food deprivation on metabolism and the relationship between multiple behaviors have not been explored simultaneously.
As an important aquaculture fish species, the black rockfish (Sebastes schlegelii Hilgendorf, 1880) is widely distributed in the coastal areas of Northern China, Japan, and South Korea [31]. In the wild, black rockfish typically inhabit areas that include different types of rocks and plants. By contrast, artificial hatchery environments are relatively static, which could lead to juveniles experiencing difficulties in quickly adapting to dramatically changing natural environments after release, especially if there is a relatively high level of uncertainty surrounding obtaining food [32,33]. Here, in order to simulate the uncertainty of food availability in the wild environment, we investigated the effects of food deprivation for different durations on the personalities and behaviors of juvenile black rockfish, focusing on traits such as boldness, neophobia, and aggressiveness. The SMRs of the juveniles were also measured, as these are crucial for their survival in the wild. Specifically, we sought to explore how different durations of food deprivation affect the personalities of juvenile black rockfish, as well as the behavioral and physiological mechanisms of these personality changes.

2. Materials and Methods

We have read the policies related to animal experiments (the ARRIVE and PREPARE guidelines) and have confirmed this study complied. All procedures conducted in this study were reviewed and approved by the Institutional Animal Care and Use Committee of the Ocean University of China.

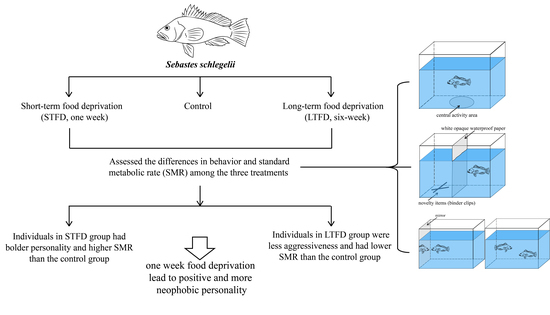
2.1. Experimental Design

Juveniles of black rockfish (mean body weight: 33.81 ± 0.94 g; mean body length: 12.67 ± 0.14 cm) were selected from a commercial hatchery (Wendenhaihe hatchery, Weihai, Shandong, China). Before the experiment began, the juveniles were reared in an indoor circulating water hatchery pond. After that, a total of 90 fish with similar initial body lengths and weights that had no body surface damage and who appeared to be the more dynamic of the group were selected for the experiment. The rearing container used was a reinforced glass tank (specification: 50 cm × 50 cm × 60 cm). Each tank was equipped with a gas stone to ensure an adequate dissolved oxygen content (6.30 mgL−1) was maintained. During the experimental period (from October to December), the water temperature gradually decreased from 19 °C to 13 °C. The photoperiod followed a natural day–night cycle, and the salinity was kept between 28 and 30. The water level was kept to 40 cm, and the suction bottom was cleaned 2–3 times a week to prevent the fish from experiencing excessive interference while maintaining a favorable environment for them. Dry feed pellets (moisture, ≤10.0%; crude protein, ≥48.0%; crude lipid, ≥9.0%; crude ash, ≤17.0%; crude fiber, ≤2.0%; total phosphorus, 1.5–3.0%; lysine, ≥2.5%; Kaido Brand, Santong Bioengineering Co. Ltd., Anqiu, China) were used in the experiment and the feeding time was always 9 a.m.
In this experiment, three treatment groups were set: control group, short-term food deprivation (STFD) group, and long-term food deprivation (LTFD) group. Three replicates were set for each treatment group, with a total of 10 fish in each replicate. The control group was fed with dry feed pellets at 1.5% of body weight per time. The STFD group received the same treatment as the control group in the first five weeks of the experiment—that is, daily feeding—and feeding was only stopped in the last week. The LTFD group was fed once only (about 3% of body weight), on the last day of each week during the trial. Each fish was measured in length and weight before the experiment began. During the rearing period, all the tanks were videotaped three times a week to record the locomotor activity and aggression of the fish. After six weeks of rearing, the metabolic rate was measured immediately, and the relative behavior was evaluated after the metabolic measurements. The size of each fish was measured again at the end of the experiment.

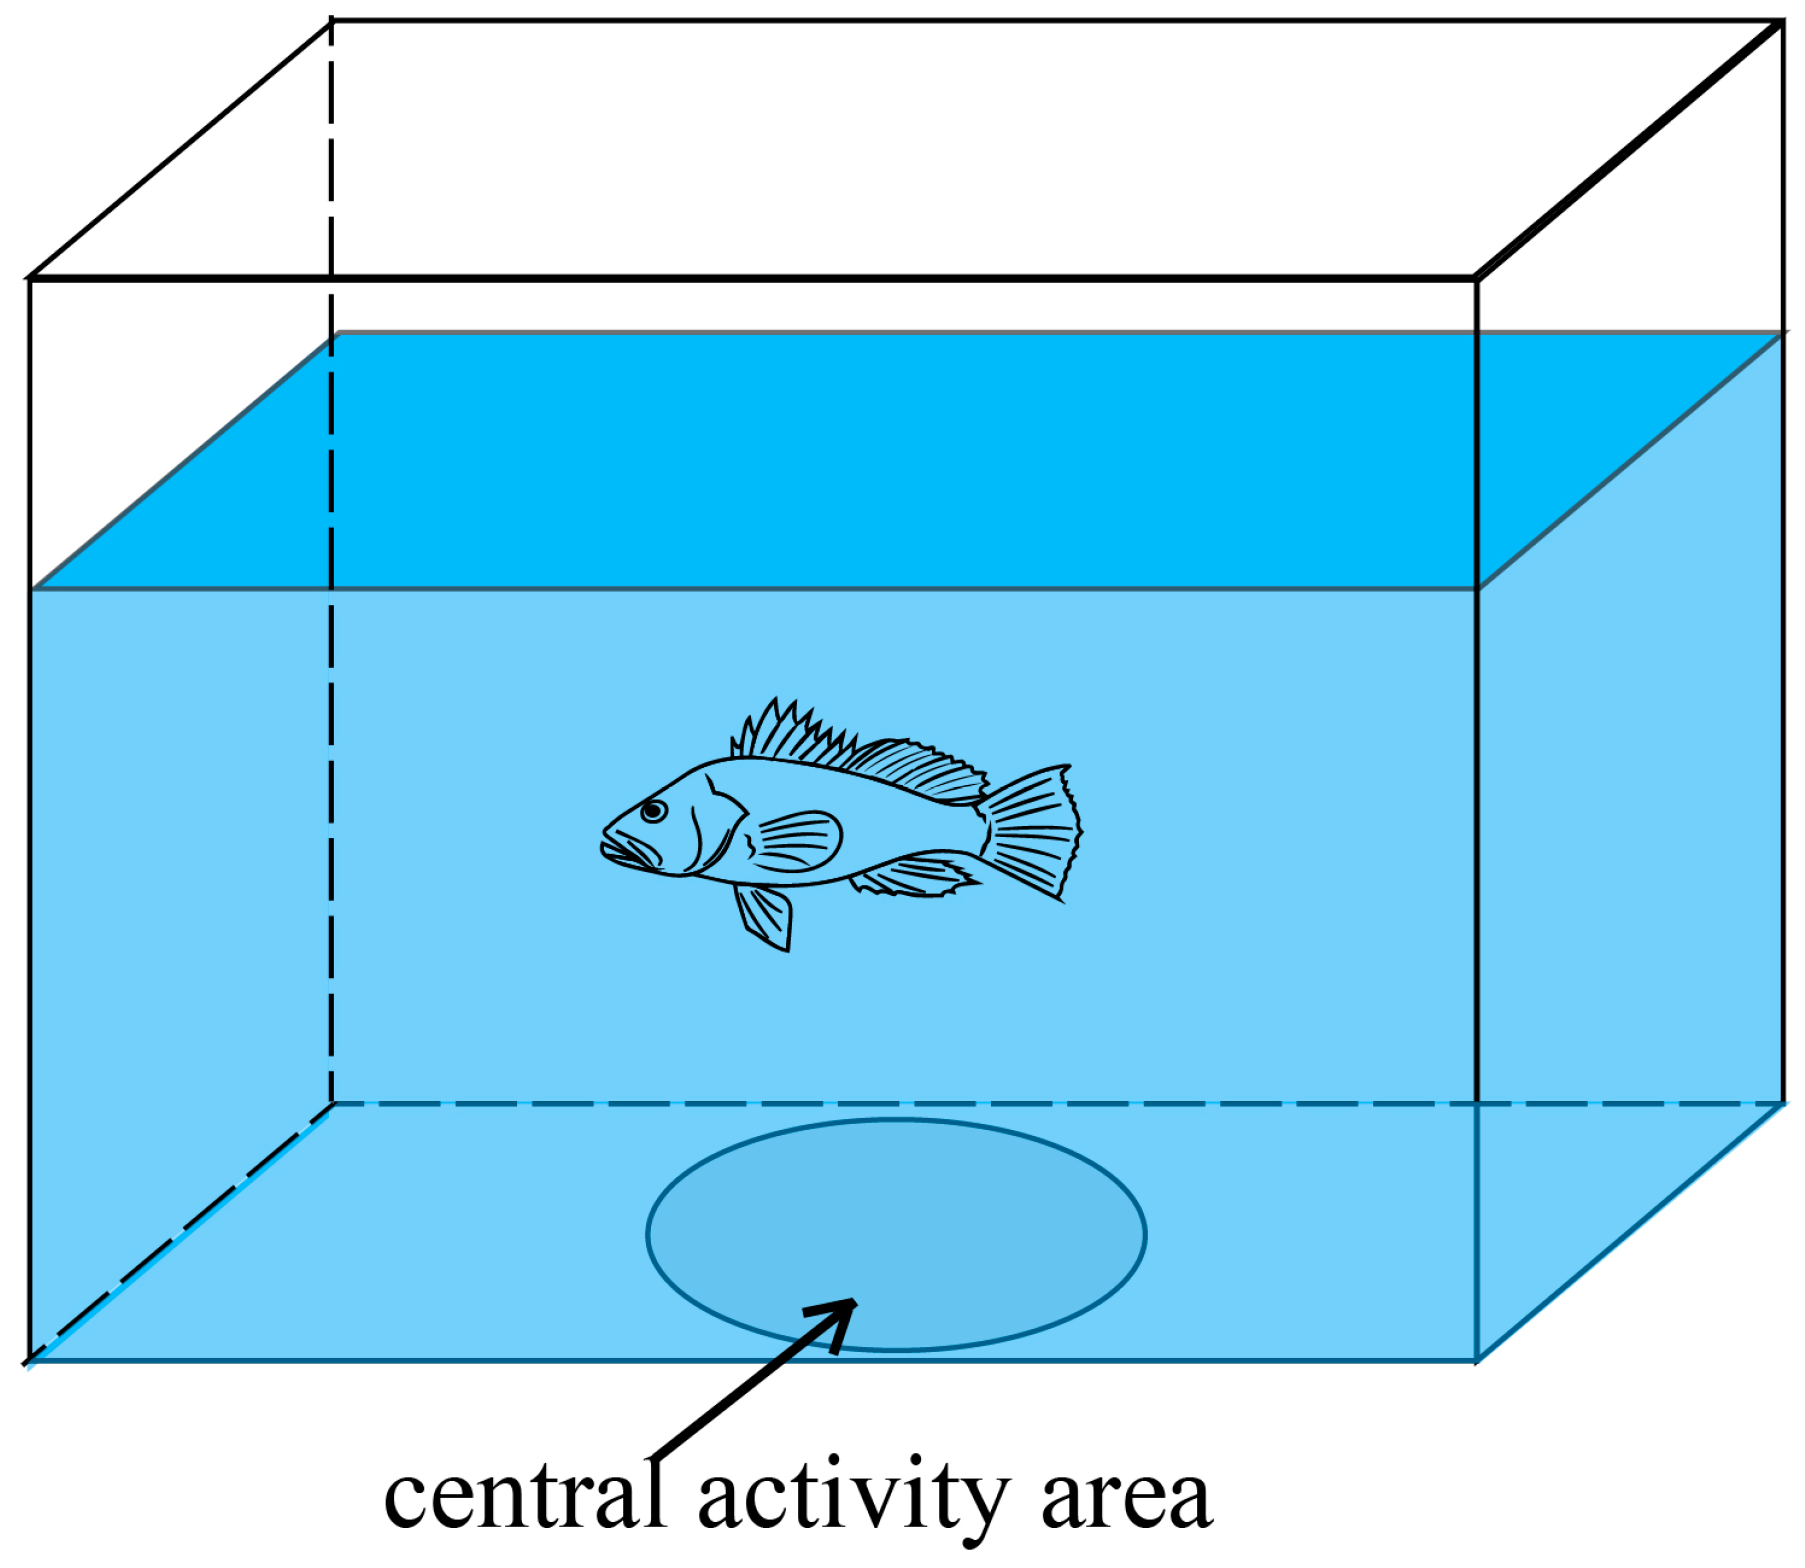
2.2. Behavior and Activity Observation and Quantification

Behavioral observations were made using a video camera (model number: Sony HDR-AS100V). The camera was placed on a bracket above the tank and kept at a certain distance from the tank to avoid disturbing the fish during the experiment.

2.2.1. Indicators of Activity Ability during Rearing

The behavioral recording time during the rearing experiment was at 12:00 noon on Tuesday, Thursday, and Saturday every week, and each recording lasted for 30 min. Videos were recorded for six consecutive weeks during the rearing period. In order to eliminate the influence caused by the actions of the operator during the video recording operation, we only used the 10-min clip taken in the middle of the video for analysis. In this experiment, we quantified the behavioral indicators. The swimming time (ST) was defined as the non-stationary state activity duration of each fish within a 10-min period. The number of turns (NT) was defined as the number of times the fish turned more than 90° in any direction within a 10-min period. The movement number (MN) was defined as the number of times each fish moved back and forth (forward or backward more than one body length) within a 10-min period. The attack number (AN) was defined as the number of times a fish engaged in chasing and pecking the other fish in the tank within a 10-min period (Table 1). During the results analysis, five fish were randomly selected from each tank for analysis—that is, fifteen fish were selected from each treatment group.

2.2.2. Boldness Assessment

The experimental device used for the boldness assessment was a tank with a white circular area in the middle of the bottom (specification: 40 cm × 30 cm × 30 cm; Figure 1). The white area was defined as the central activity area, which took up 1/9 of the entire bottom area of the tank. Before the boldness assessment was carried out, the experimental fish were placed into the device to acclimate them to the environment, and then the recording was conducted for 30 min by camera. During the analysis, only a 10-min clip of the middle part was used for analysis. The boldness assessment experiment was conducted separately for each fish. We defined four indicators to measure the fishes’ boldness. The time in the circle (CTb) refers to the time spent by the fish in the white circle within a 10-min period; the swimming time (STb) is the time the fish spent swimming within a 10-min period; and the number of times through the circle (NTCb) is the number of times the fish passed through the circle within a 10-min period. We took a screenshot of the video per minute for a total of ten times and defined the frequency of the fish appearing in the circle in the screenshot as the frequency in the circle (FCb, Table 1).

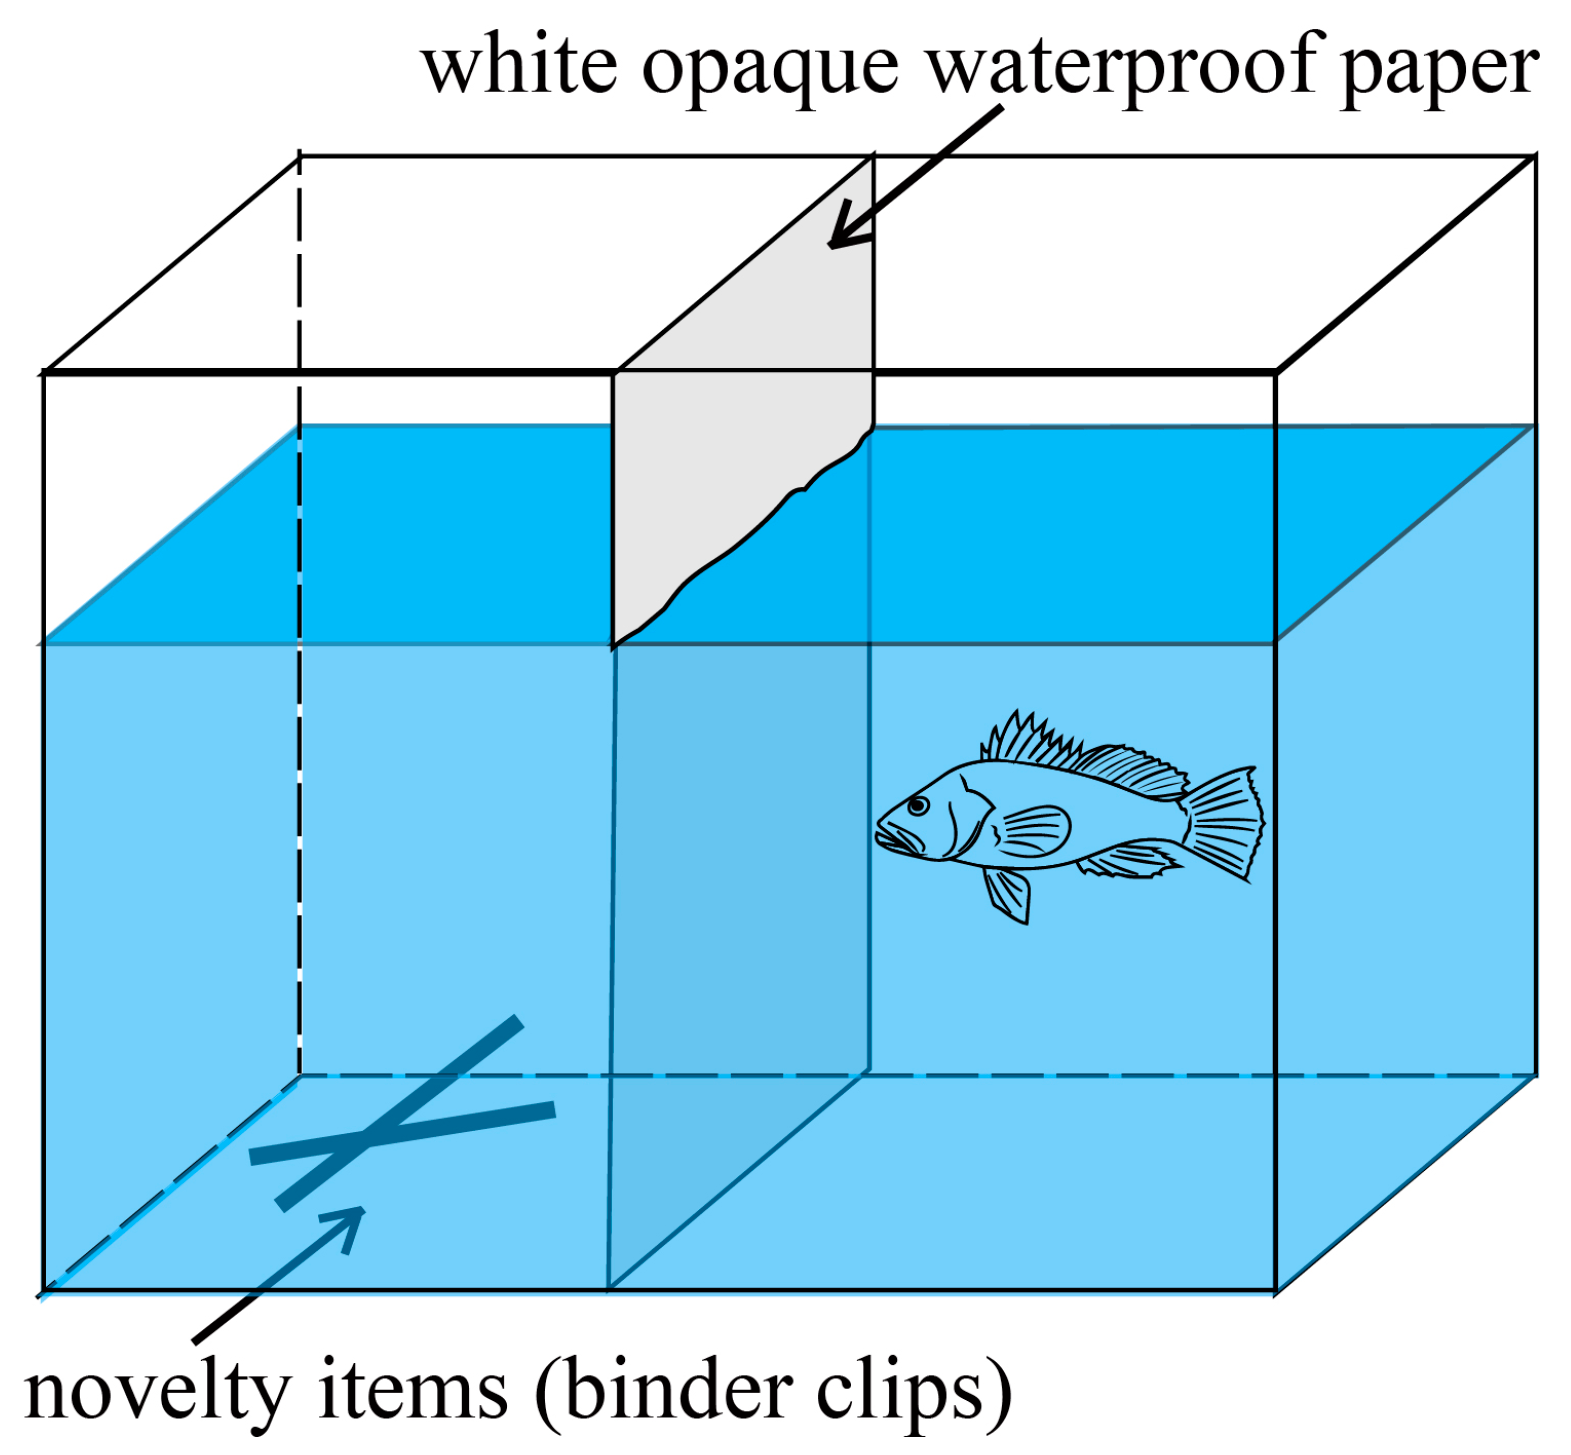
2.2.3. Neophobia Assessment

The neophobia experiment was conducted in a special tank. The tank was separated by a glass plate covered by one piece of white opaque waterproof paper (specification: 40 cm × 30 cm × 30 cm; Figure 2). Two regions were separated by the glass plate, namely, the starting area and exploring area, in which were placed the experimental fish and novelty items (binder clips), respectively. After the experimental fish were allowed to adapt to the environment for a period of time (half a day), we started by videotaping the fish for 30 min. Then, we removed the glass and exposed the novelty item to the fish’s visual field. Each fish was tested individually and 10 min in the middle of the video was captured for analysis. We defined three indicators to evaluate the neophobia of the experimental fish. The duration in the exploratory area (Te) is the time spent by the fish in the exploration area within 10 min. Screenshots were taken once per minute for a total of ten times throughout the video; then, using the ImageJ processing software, we calculated each fish’s distance to a novelty item based on the screenshots. The average of the ten distances was defined as the distance from the novelty item (De), while the frequency of the experimental fish appearing in the exploration area in the ten screenshots was defined as their frequency of stay in the exploratory area (Fe, Table 1).

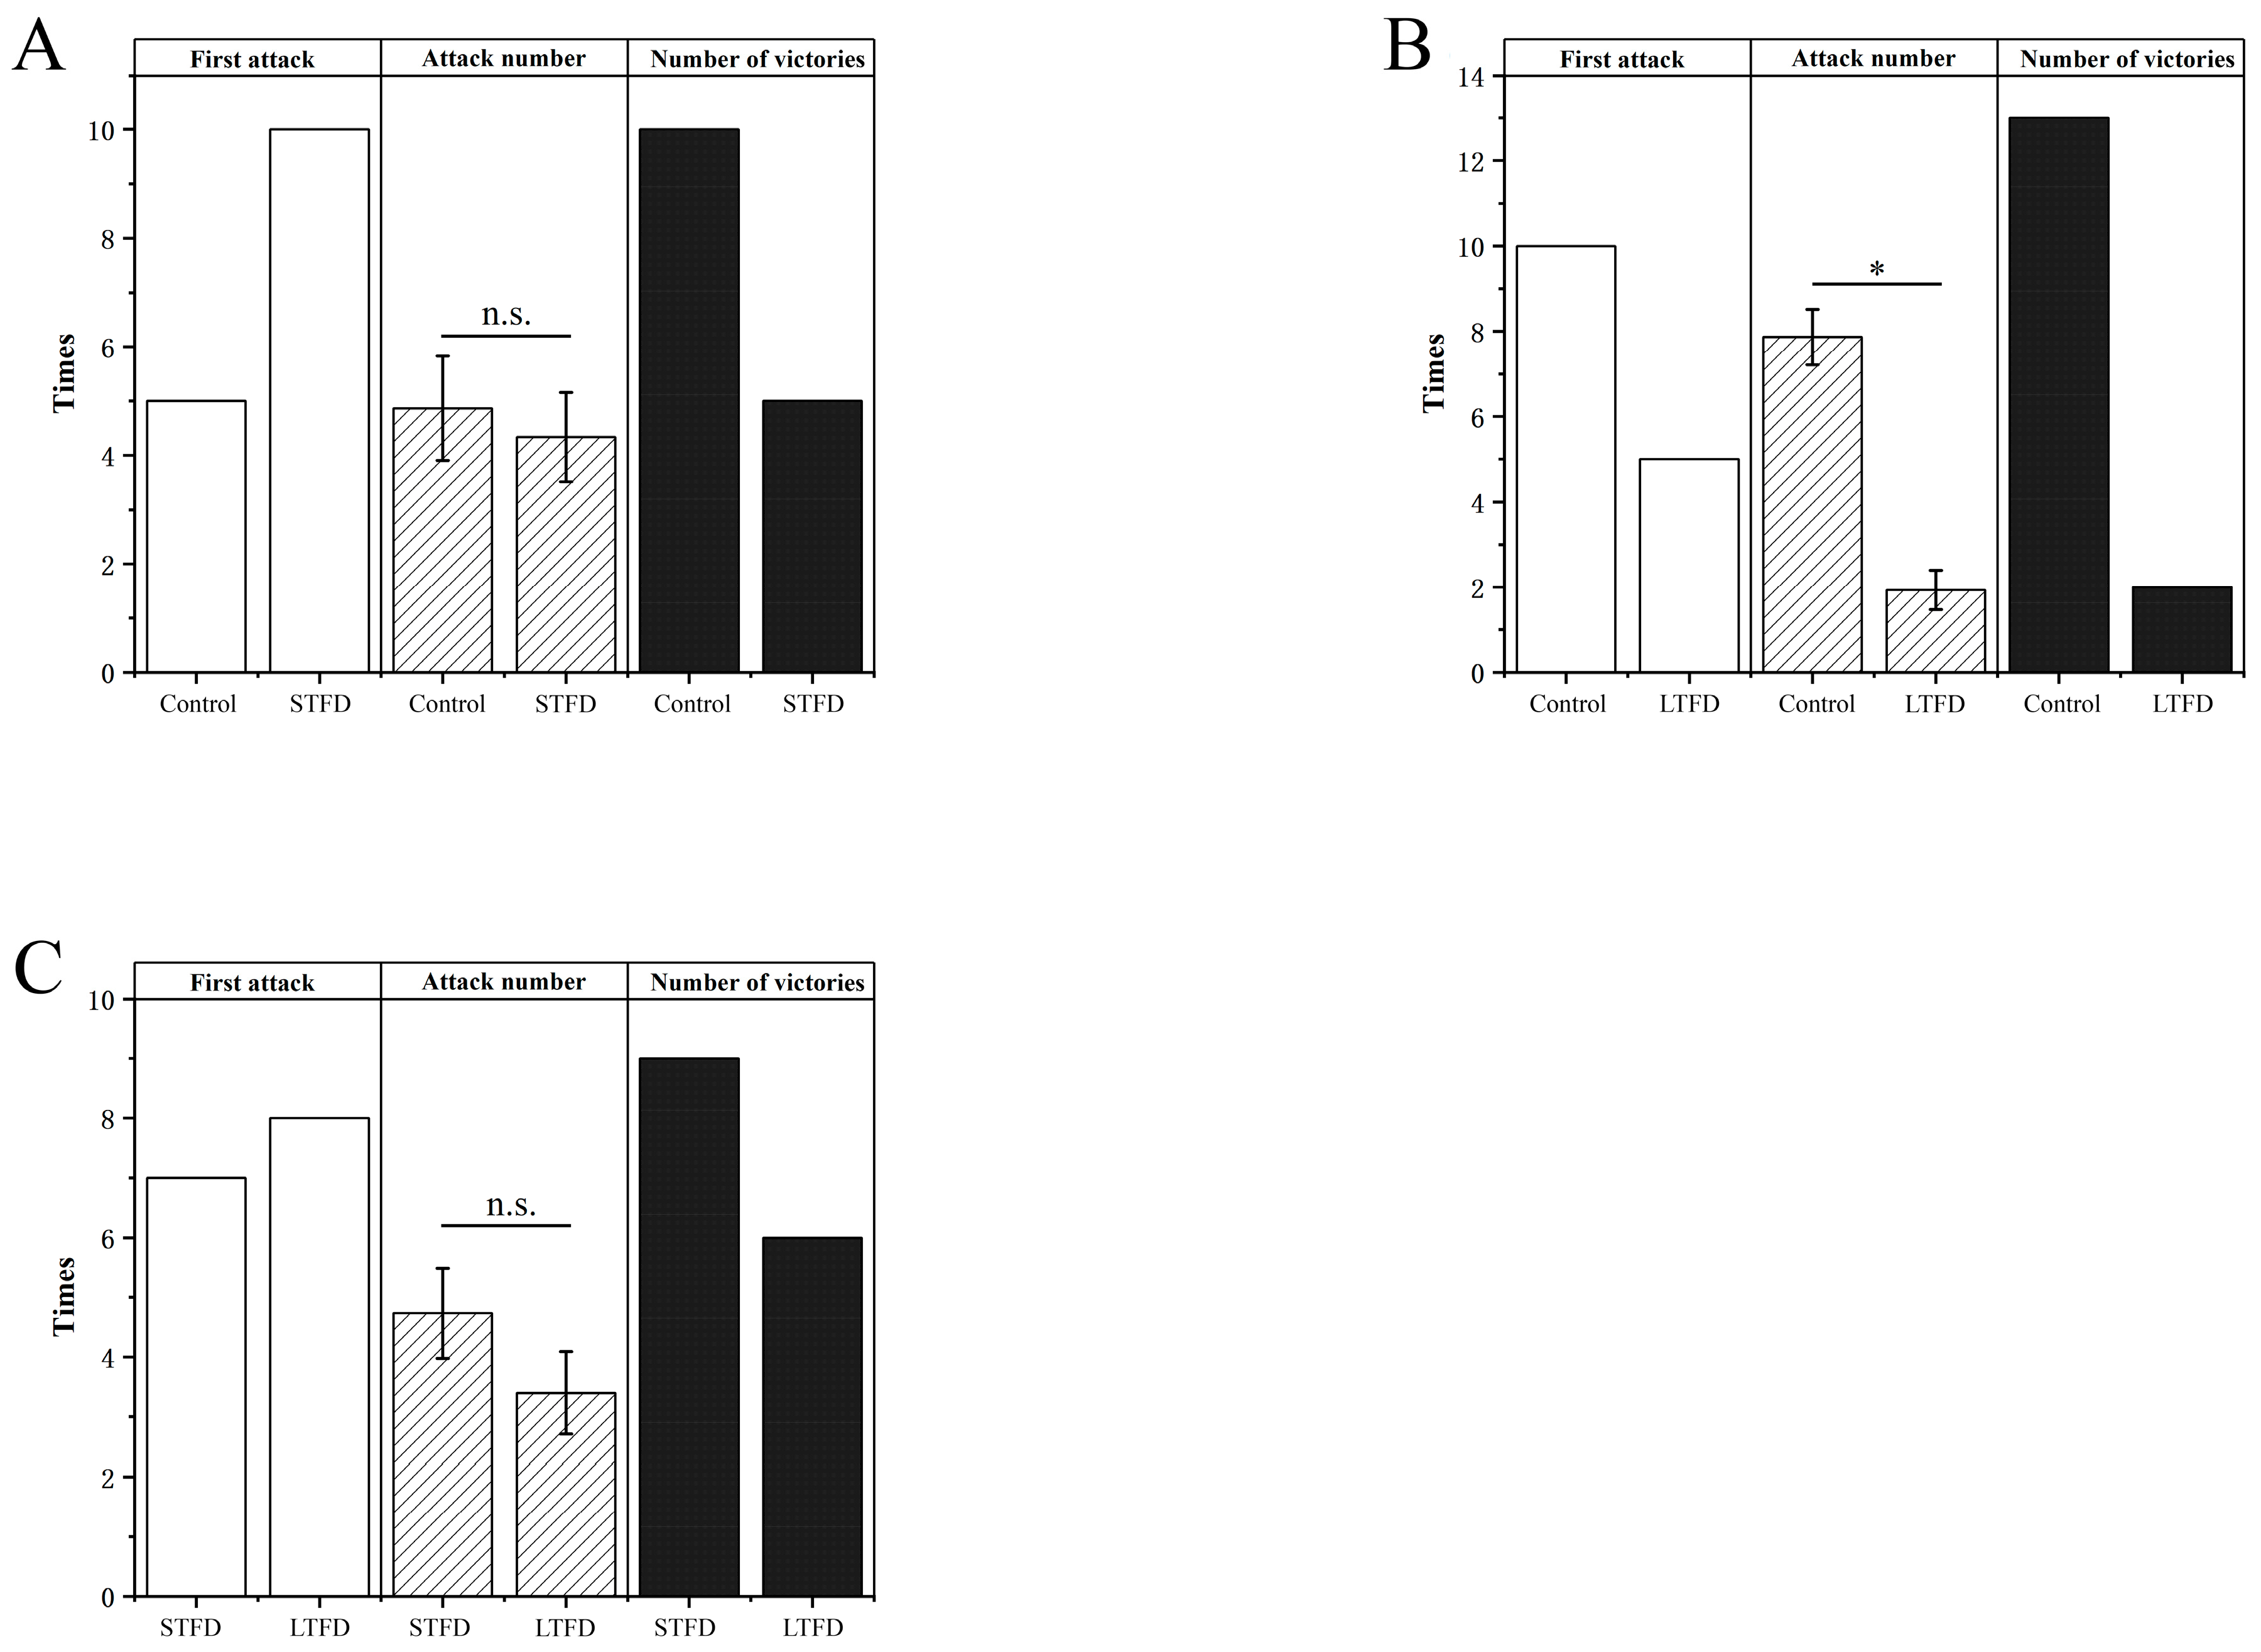
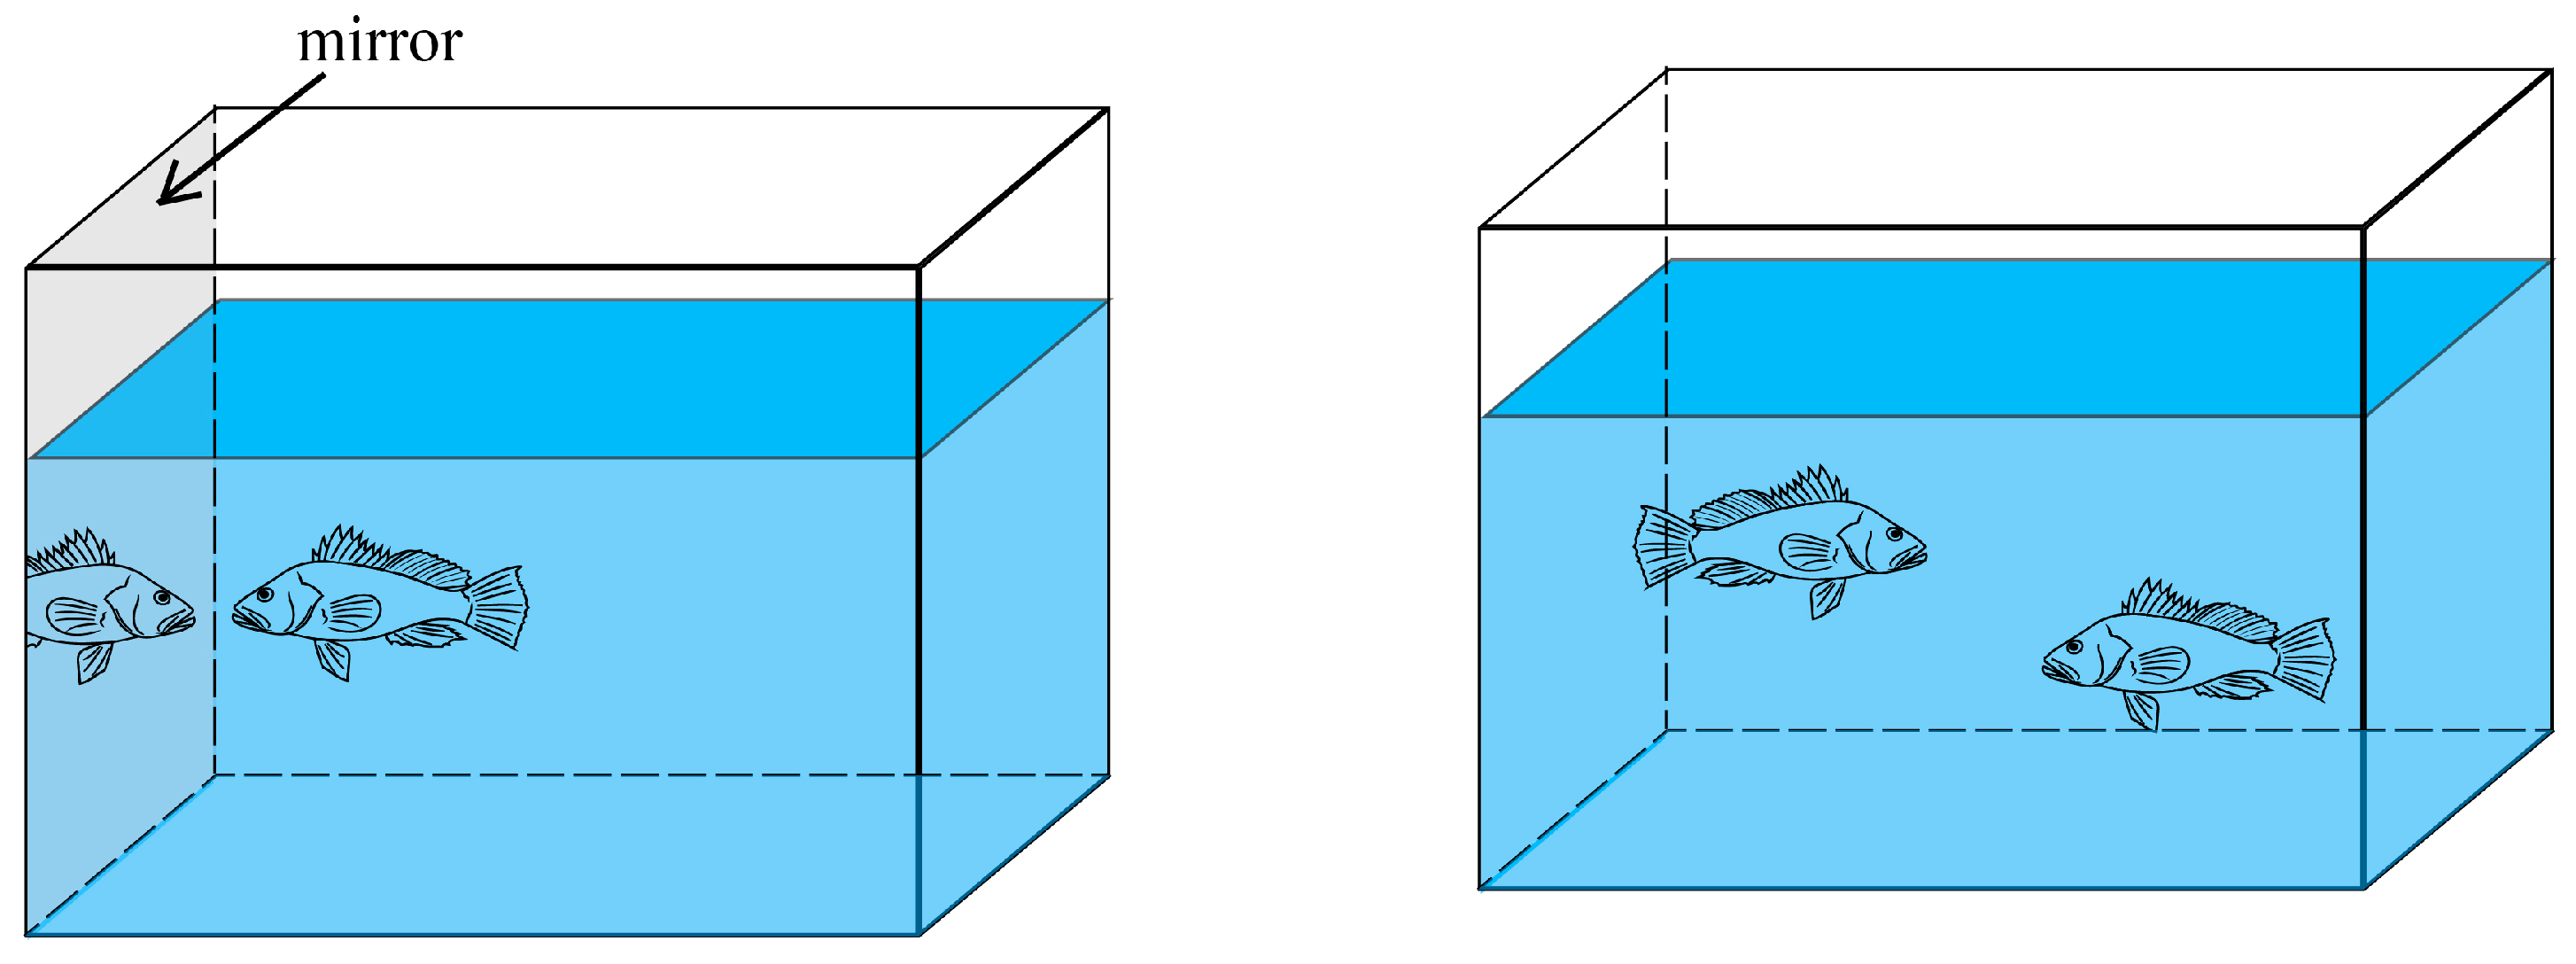
2.2.4. Aggressiveness Assessment

Two methods were used to assess fish aggressiveness: mirror stimulus and dyadic fights. The experimental device used had the same specifications as the boldness and neophobia devices (specification: 40 cm × 30 cm × 30 cm; Figure 3). In the mirror stimulation method, a mirror (specification: 30 cm × 30 cm) was placed on the side of the tank after the fish had adapted to the environment of the device. After that, a 30-min video was recorded, and 10 min of the middle part was captured for analysis. In this experiment, we defined two indicators to describe the aggressiveness of the fish. The attack number (ANm) was defined as the number of times a fish committed an attack, such as biting, within a 10-min period. The tank was evenly divided into two areas, where the mirror was located in the attack range area. From the video, we took one screenshot every minute for a total of 10 times, and the frequency of the fish appearing in the attack range area was defined as the attack range frequency (ARm). Dyadic fights were used to pair the control, long-term, and short-term groups—that is, half of the number of fishes in each treatment group (15 fish) and half of the fish in each of the other two groups were paired one-to-one. Before the experiment, the middle of the tank was separated by a glass plate with opaque waterproof paper. After videotaping, the glass plate was removed so that the two fish were exposed to each other’s vision. In this study, three behavioral indicators were defined as the criteria for evaluating the aggressiveness of the experimental fish under three different treatments: first attack (FAp), attack number (ANp), and the winner (Wp, Table 1). Pairing two fish in the dyadic fighting method will eventually show a relatively obvious superiority–inferiority level.

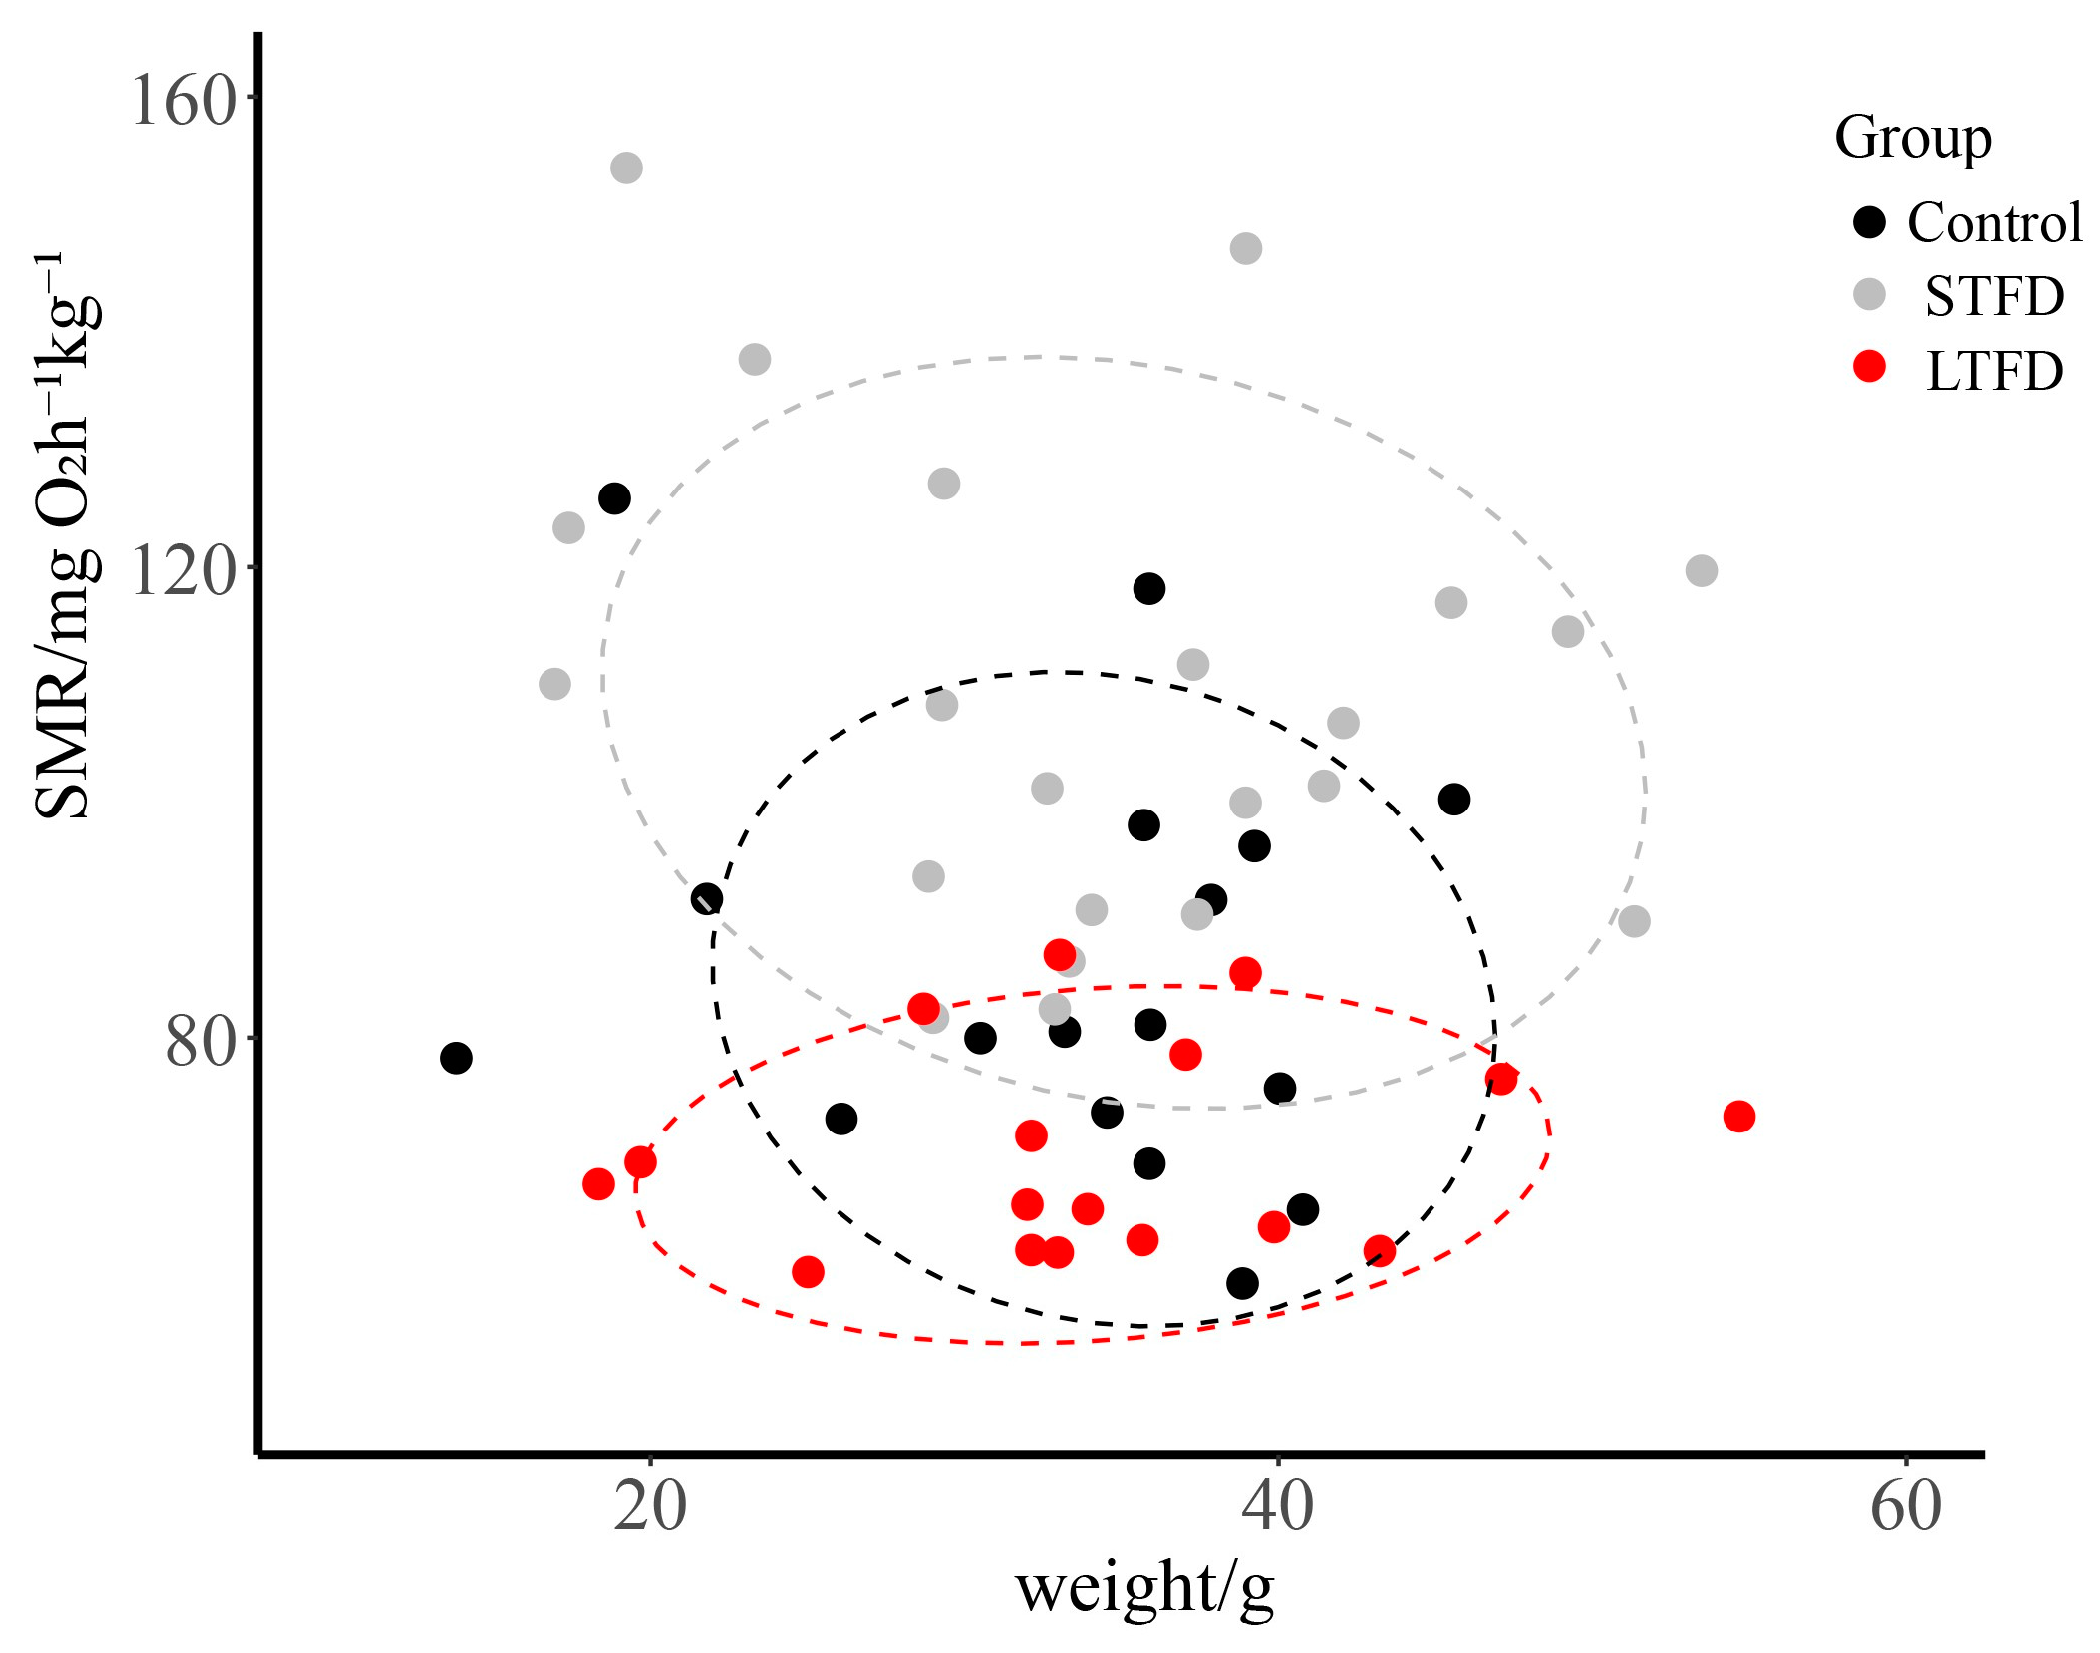
2.3. Measurement of Metabolic Rate

After six weeks of rearing, eighteen fish in each treatment were randomly selected for SMR measurement. The experimental apparatus used was an improved flow-type respirometry [11]. After the fish were placed into the respirometer chamber to adapt for a period of time (half a day), the dissolved oxygen concentration of each chamber was measured every hour on the same day with an oxygen meter and the average value of each measurement was set as the SMR. During the SMR measurement, the experimental environment was kept in a closed state to prevent external interference from affecting the experimental fish. The calculation formula of the SMR (mg O2h−1kg−1) is as follows:
SMR = ΔO2 × v/m,
where ΔO2 is the difference in the respirometer chamber exports’ dissolved oxygen concentration (mgO2L−1) between the experimental respirometer and the control without fish, ν is the flow rate of the respirometer chamber (Lh−1), and m is the body weight of the fish.

2.4. Data Analysis

ImageJ 1.46R was used for the video analysis and distance measurement of the video screenshots, and Origin Pro 2018C was used for all figures. All statistical analyses were conducted using SPSS 19.0. In order to compare the differences in locomotor activity, personality indicators, and SMR among the three treatment groups, a one-way analysis of variance (ANOVA) was used and Duncan’s multiple comparison was used to test the significance of the differences between each group. All data were expressed as the mean ± S.E., and the differences were considered significant at p < 0.05.

3. Results

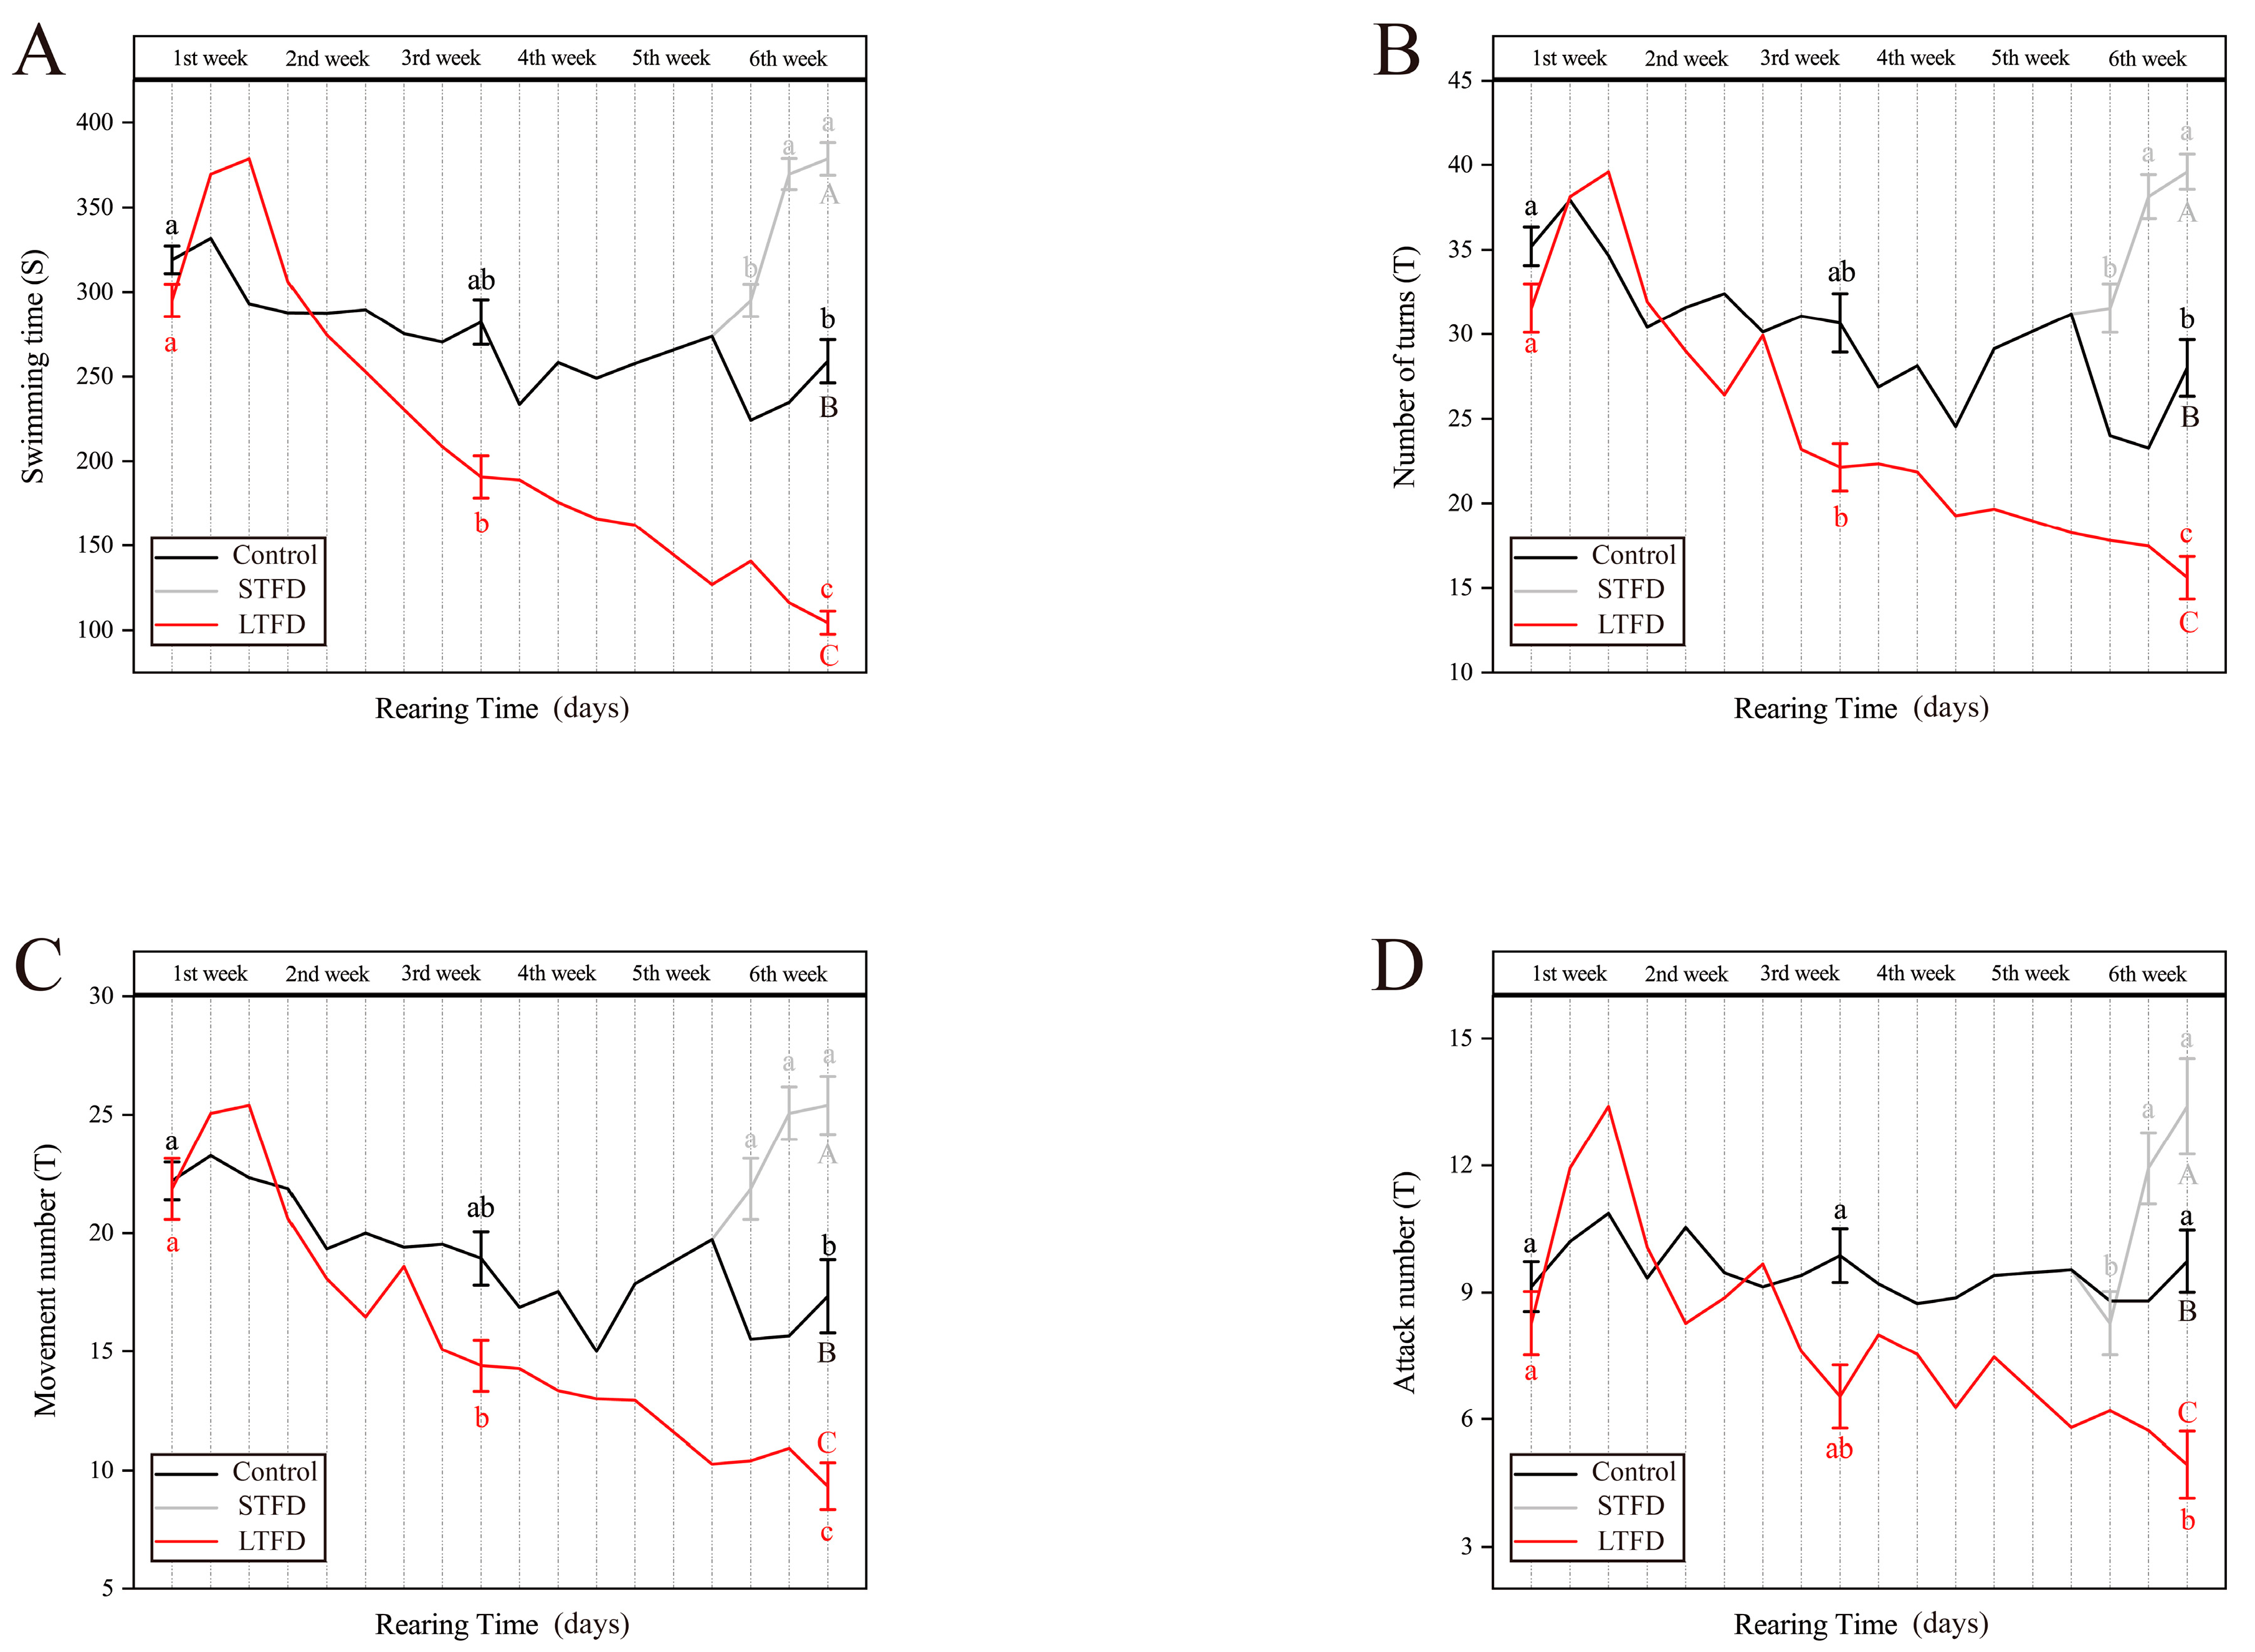
3.1. Effect of Food Deprivation on Locomotor Activity and Aggression during Rearing

At the beginning of the rearing period, there were no significant differences in all four indicators (swimming time, number of turns, movement number, and attack number) between the control and the LTFD group, but at the end of the six-week rearing period, there were significant differences in all indicators between fish in the three different treatments (p < 0.05).
The changing trends in the four parameters in each treatment group were roughly the same. The control group was relatively stable across the two adjacent phases. For swimming time (ST), significant differences were observed between the three stages (p < 0.05), but there was no significant difference between either the early and middle stages or the middle and late stages. For number of turns (NT), significant differences were observed between the three stages (p < 0.05), but there were no significant differences between either the early and middle stages or the middle and late stages. For movement number (MN), significant differences were observed between the three stages (p < 0.05), but there was no significant difference between either the early and middle stages or the middle and late stages. For attack number (AN), no significant differences were observed between the three stages.
In the STFD group, all indicators increased significantly in the first two adjacent stages. For swimming time (ST), significant differences were observed between the three stages (p < 0.05), and significant differences were observed between the early and the other two stages (p < 0.05), but no significant differences were observed between the middle and late stages. For number of turns (NT), significant differences were observed between the three stages (p < 0.05), and significant differences were observed between the early and the other two stages (p < 0.05); however, no significant difference was observed between the middle and late stages. For movement number (MN), no significant differences were observed between the three stages. For attack number (AN), significant differences were observed between the three stages (p < 0.05), and significant differences were observed between the early and the other two stages (p < 0.05), but no significant differences were observed between the middle and late periods.
In the LTFD group, the indicators increased significantly in the previous week (similar to the STFD group), but an overall downward trend was obvious. For swimming time (ST), significant differences were observed between the three stages (p < 0.05), and significant differences were observed in each stage (p < 0.05). For number of turns (NT), significant differences were observed between the three stages (p < 0.05), and significant differences were observed in each stage (p < 0.05). For movement number (MN), significant differences were observed between the three stages (p < 0.05), and significant differences were observed in each stage (p < 0.05). For attack number (AN), significant differences were observed between the three stages (p < 0.05), but no significant differences were observed between the early and middle stages, or between the middle and late stages. Additionally, a relatively small fluctuation in all indicators occurred during this period, especially in the AN. Regarding specific performances, we noticed a significant rebound in the AN immediately after the fishes had eaten (Figure 4).

3.2. Effect of Food Deprivation on Personalities after Rearing

One-way ANOVA revealed that there were significant effects of different duration of food deprivation on the boldness indicators (time in the circle: p < 0.05; swimming time: p < 0.05; number of times through the circle: p < 0.05; frequency in the circle: p < 0.05), neophobia indicators (duration in the exploratory area: p < 0.05; distance from novelty item: p < 0.05; frequency of stay in the exploratory area: p < 0.05), and aggressiveness indicators (attack number: p < 0.05; attack range frequency: p < 0.05).

3.2.1. Boldness

In the boldness assessment experiment, we observed significant differences in time in the circle (CTb) between the three treatments (p < 0.05). The average time spent in the center circle in the STFD group was significantly higher than that seen in the control and LTFD group (p < 0.05). A similar trend was also observed for the indicator swimming time (STb): the STb of the STFD group was significantly higher than that of the control and LTFD group (p < 0.05). For number of times through the circle (NTCb), we observed no significant differences between the control and LTFD group, but the values attained for the STFD group were significantly higher than those of the other two groups (p < 0.05). We also observed that frequency in the circle (FCb) was still the highest in the STFD group, which achieved a significantly higher value than the control group (p < 0.05), while the control group still achieved a significantly higher value than the LTFD group (p < 0.05; Table 2).

3.2.2. Neophobia

In the neophobia assessment experiment, the duration in the exploratory area (Te) was significantly higher in the LTFD group than in the control and STFD group (p < 0.05). The distance from novelty item (De) of the LTFD group was also significantly different from the control and STFD group (p < 0.05). Similarly, the frequency of stay in the exploratory area (Fe) in the LTFD group was still significantly higher than that in the other two groups (p < 0.05, Table 2).

3.2.3. Aggressiveness

Aggressiveness was assessed using mirror stimuli and dyadic fights. The results showed that the attack number (ANm) of the LTFD group was significantly lower than that of the control and STFD group under mirror stimulation (p < 0.05), while no significant difference was observed between the control and STFD group. We noted significant differences in attack range frequency (ARm) among the three groups (p < 0.05), with the control group achieving a value of 0.58, the STFD group achieving a value of 0.44, and the LTFD group achieving a value of 0.34 (Table 2). In the dyadic fights, members of the LTFD group proved to be the weakest party; they were at a competitive disadvantage to the control and STFD group and were less likely to attack first. From the results of the competition between the control and STFD group, the average number of attacks between the two groups was relatively similar. However, the fish in the control group were usually the ones that won (Figure 5).

3.3. Effect of Food Deprivation on SMR

Significant differences in the effects of different food deprivation durations on SMR were observed (p < 0.05). As can be seen from the figure below, among individuals of a similar body weight, SMR in the STFD group was significantly higher than that in the control group, while SMR in the LTFD group was significantly lower than that in the control group (Figure 6).

4. Discussion

Previously, little attention has been paid to the effect of different durations of food deprivation on multiple behaviors and the standard metabolic rate. In this study, we found that short-term food deprivation can make fish bolder and improve SMR, while long-term food deprivation can reduce neophobia and aggressiveness. In general, this study is the first to report the effects of three different durations of food deprivation on the locomotor activity of black rockfish as well as on its behavioral and physiological mechanisms in the laboratory.

4.1. Effects of Food Deprivation on Fish Personalities

Whether in captivity or in the wild, the “personalities” of fish always plays a crucial role in the survival of individuals, as well as the reproduction and evolution of populations [6,34]. After the end of rearing, the fish were assessed to determine their personalities. Boldness is one of the basic indicators used to evaluate “personalities” [35]. Based on the results of each treatment group, we observed that the fish in the STFD group seemed to act more boldly. The reasons for this phenomenon may be that the fish attempt to expand their foraging area in order to adapt to the short-term food deprivation. However, in long-term food deprivation, more active, bolder behavior did not lead to greater food gains over time, so the fish in the LTFD group were more cautious, a trade-off that the LTFD group made over time. One view holds that boldness is not conducive to survival, but the other holds that the existence of both boldness and timidity is, suggesting that both personalities have their strengths [36]. High returns are usually accompanied by high costs; bolder fish are more open to exploring unfamiliar things, which may expose them to more dangerous situations [6,35]. More cautious individuals may be better at camouflage and concealment, thus reducing their exposure to danger and making their situation safer and more conducive to reducing predation [37].
Organisms are most vulnerable to predation when they move to unfamiliar environments in their early life. Therefore, it is important for juveniles to be wary of unfamiliar things and conduct risk assessments within a short time. A connection between neophobia and boldness in the fish was found, but interestingly our results showed that fish in the LTFD group seemed to be more exploratory rather than the STFD and control group. This seems to go against the common view [38,39,40]. It is also suggested that bolder individuals tend to form habits, exhibit more muted behavioral responses to changes in the environment, and have a greater ability to learn. According to the performance of the fish during the assessment period from the beginning to the end of the experiment, we observed that fish in the STFD group maintained a high level of desire to explore the novelty items during the neophobia assessment period, but quickly moved to regions farther away from the novelty items after a brief period of exposure. Therefore, we considered that bold individuals with more frequent activities still had a strong exploratory ability, even if this was not reflected in the measured indicators. Either such exploratory ability was difficult to detect, or the exploratory ability of individuals experiencing short-term food deprivation was hidden under their sense of crisis. The reasons for this result may be as follows: after short-term food deprivation, bolder fish remain cautious, a phenomenon that is known as neophobia, and the maintenance of this state promotes a more effective escape response and higher survival in the wild [41].
The assessment of aggressiveness is very important for fishes with a high economic value. For example, in the captive stage before release, it is often seen as beneficial to reduce fighting so as to reduce losses [42]. However, when individuals are released into the wild, aggressiveness, as a key social behavior, becomes a means for individuals to protect their territory from aggression [43]. In the assessment of aggressiveness, our result showed that the fish in the LTFD group were significantly less aggressive than those in the other two treatments, but no significant difference was found between the STFD and control groups. Furthermore, fish in the STFD group, which tended to have bolder personalities, were even more disadvantaged in the dyadic fight method, showing less fighting behavior than the control group. This is a very interesting phenomenon that is worth exploring further: Why did the metabolically active black rockfish not show more aggressiveness? Less fighting could lead to fewer deaths and injury rates, which is also noteworthy. By this token, the short-term food deprivation of about one week resulted in a more positive personality during the captivity and post-release phases of stock enhancement, but further verification of this phenomenon is needed.

4.2. Behavioral Mechanisms for the Personalities Effects of Food Deprivation

As an external manifestation of personality differences, the results showed that there were significant differences in various behavioral indicators among the three treatments during the rearing period. The variation trend of each indicator in the three treatments was also significantly different. Compared with the other two treatments, the four indicators of the control group showed a relatively stable trend within six weeks. However, the evaluation of the other three indicators in the sixth week still showed a slight decrease compared with the evaluation of the first week, except for the attack number. Considering there was no food deprivation in the control group, we believe that this phenomenon under the adequate food condition is likely to be caused by the conventional hatchery. The homogenous and cramped rearing environment can easily cause experimental fish to feel “tired” [44]. Previous studies have also shown that barren living environments affect the behavior of experimental fish [45].
In the STFD group, black rockfish became more active during the six-day discontinuation of feeding, showing significant increases in all four indicators. In the LTFD group, the number and frequency of activities engaged in by fish began to decrease after the increase they experienced in the first week, similar to the results seen in the STFD group, and the four indicators began to show a continuous downward trend as the second week began. In the current research, the negative impact of food deprivation was more obvious over time. The results of the STFD group were also similar to the initial responses of most fish to food deprivation [46,47]; the increase in activity seems to represent stronger exploratory behavior and also inevitably increases the risk of being preyed upon by predators. However, we observed that though the fish in the STFD group had a strong desire to explore, they still remained cautious, which is a phenomenon that is worth investigating. Perhaps when the fish realizes that they will not be able to obtain enough food for a long time, they will make the relevant trade-offs and thus reduce their frequency of activities. Compared with our results, when the food supplied was not sufficient, in addition to the objective changes seen in the fishes’ energy metabolism, it may be because of the subjective trade-offs that all indicators of the experimental fish increased during the first week of food deprivation. In the following days, when the fish felt they could not obtain sufficient food in the long term, they made active trade-offs, which showed a consistent downward trend in the results. This is also similar to other relevant studies [48].

4.3. Metabolic Mechanisms for the Personality Effects of Food Deprivation

It is important to note the physiological mechanisms on fish’s personalities in addition to discussing the influence of food deprivation on their behaviors. In our results, part of the differences in personality were due to behavioral trade-offs. Another factor that makes these trade-offs is metabolism.
From an evolutionary perspective, organisms should make trade-offs in their allocation of energy [49]. Differences in behavior are sometimes caused by differences in the allocation of energy after the basic energy requirements (SMR) are met, which requires trade-offs taking place within the animals themselves. However, the SMR is heritable to some extent, and many researchers believe that the SMR differences between individuals are fixed [50]. Even after controlling for factors such as weight, age, and sex, the differences in SMR could still reach several times [28]. Therefore, the change in SMR caused by epigenetic influence is an interesting question that is worth exploring. Before the beginning of this experiment, the SMR of the experimental fish was not measured, which also ensured the randomness of the genetic influence on the SMR of the experimental fish in each treatment. Our final results proved that food deprivation would have an impact on SMR, and that short-term food deprivation would temporarily increase SMR and increase the activity frequency accordingly. However, the behavioral and metabolic differences among the three treatments also demonstrated that food deprivation could increase the SMR and locomotor activity first and then decrease them over time. Fish make trade-offs when they cannot obtain enough food: as time goes on, the preference between “high metabolism, high search intensity” and “low metabolism, low energy consume and long endurance” gradually shifts from the former to the latter. Previous studies have suggested that higher food intake leads to elevated SMR in coho salmon (Oncorhynchus kisutch) [30]. Similarly, brown trout will adjust their metabolic intensity according to the abundance of food to help them adapt to extreme environments [51]. Therefore, under different food deprivation durations, the amount of food obtained by the experimental fish was different, which led to differences in their energy allocation. Differences in energy distribution cause fish to make trade-offs between behavior and energy, leading to differences in their personalities. However, the factors influencing the trade-offs may not only be energy allocation, and these need to be further explored.

4.4. The Innovation and Deficiency of this Experiment

The exposure of black rockfish to three levels of food deprivation provided information related to changes in individual personalities and the behavioral and physiological mechanisms of personality changes. The information provided was more complete than that provided by studies with a fixed duration of food deprivation. For example, previous studies on boldness and exploratory changes in different species (e.g., rainbow trout Oncorhynchus mykiss, walleye pollock Theragra chalcogramma, and cichlid Pelvicachromis taeniatus) showed that different species exhibit distinct personality changes [35,52,53]. This may be because different species adopt different coping strategies in the face of food deprivation due to their different somatic functions and living environments. However, according to our results, when food availability is at a low level, changes in the individual’s personality and SMR trend over time will not be unidirectional or may even be opposite. Therefore, in further investigations it would be worth determining whether the results gained across different species for different durations of food deprivation are consistent. In addition, laboratory experiments have some limitations in some respects [45], and experimental fish sometimes experience a “captivity effect” [44]. Our behavior video analysis lasted for 10 min each time, also meaning that it had certain limitations. It may not be able to fully show the natural state of the fish; thus, this aspect also needs to be improved. Therefore, further field experiments on this topic still need to be carried out.

5. Conclusions

This study shows that food deprivation had an effect on the SMR of fish in addition to their capacity for action. Accordingly, the personalities of the experimental fish will also change. This change is related to the metabolic requirements of the fish. Moreover, the changes in the SMR and behavior of the fish fluctuated with the duration of food deprivation. We concluded that one week of food deprivation can lead to a bolder and more neophobic personality and reduce the damage due to by aggressive behavior, which can provide new insights into fish adaptation to food deprivation and relevant guidance for improving the efficiency of stock enhancement. However, this experiment was carried out in an indoor facility, and the monitoring of fish after their release into the wild still needs to be further investigated.

Author Contributions

Conceptualization, X.Z., F.S. and Z.Z. (Zonghang Zhang); investigation, F.S., Z.Z. (Zonghang Zhang), Y.F., X.D. and Z.Z. (Zhen Zhang); data curation, F.S., Z.Z. (Zonghang Zhang), X.S. and Y.F.; validation, X.Z.; format analysis, F.S. and X.Z.; resources, F.S. and X.Z.; writing—original draft preparation, F.S. and Z.Z. (Zonghang Zhang); writing—review and editing, F.S., Z.Z. (Zonghang Zhang), J.D., M.C. and X.Z.; project administration, X.Z.; funding acquisition, X.Z. All authors have read and agreed to the published version of the manuscript.

Funding

This research was funded by the National Key Research and Development Program of China (2019YFD0901303); the National Natural Science Foundation of China (32072966) and the Province Key Research and Development Program of Zhejiang (2021C02047).

Institutional Review Board Statement

The study was conducted according to the guidelines of the Declaration of Helsinki, and approved by the Institutional Animal Care and Use Committee of the Ocean University of China (protocol code 20180101).

Informed Consent Statement

Not applicable.

Data Availability Statement

The data used during the current study are available from the corresponding author on reasonable request.

Conflicts of Interest

The authors declare no conflict of interest.

References

  1. Naylor, R.L.; Goldburg, R.J.; Primavera, J.H.; Kautsky, N.; Beveridge, M.C.M.; Clay, J.; Folke, C.; Lubchenco, J.; Mooney, H.; Troell, M. Effect of aquaculture on world fish supplies. Nature 2000, 405, 1017–1024. [Google Scholar] [CrossRef] [Green Version]
  2. Zeng, L.; Zhang, A.; Killen, S.S.; Cao, Z.; Wang, Y.; Fu, S. Standard metabolic rate predicts growth trajectory of juvenile crucian carp (Carassius auratus) under changing food availability. Biol. Open 2017, 6, 1305–1309. [Google Scholar] [CrossRef] [Green Version]
  3. Martin-Smith, K.M.; Armstrong, J.D. Growth Rates of Wild Stream-Dwelling Atlantic Salmon Correlate with Activity and Sex but Not Dominance. J. Anim. Ecol. 2002, 71, 413–423. [Google Scholar] [CrossRef]
  4. Powers, S.P.; Peterson, C.H.; Christian, R.R.; Sullivan, E.; Powers, M.J.; Bishop, M.J.; Buzzelli, C.P. Effects of eutrophication on bottom habitat and prey resources of demersal fishes. Mar. Ecol. Prog. Ser. 2005, 302, 233–243. [Google Scholar] [CrossRef] [Green Version]
  5. Auer, S.K.; Salin, K.; Anderson, G.J.; Metcalfe, N.B. Flexibility in metabolic rate and activity level determines individual variation in overwinter performance. Oecologia 2016, 182, 703–712. [Google Scholar] [CrossRef] [Green Version]
  6. Chapman, B.B.; Morrell, L.J.; Krause, J. Unpredictability in food supply during early life influences boldness in fish. Behav. Ecol. 2010, 21, 501–506. [Google Scholar] [CrossRef]
  7. Frommen, J.G.; Luz, C.; Bakker, T.C.M. Nutritional state influences shoaling preference for familiars. Zoology 2007, 110, 369–376. [Google Scholar] [CrossRef]
  8. Krause, J.; Hartmann, N.; Pritchard, V.L. The influence of nutritional state on shoal choice in zebrafish, Danio rerio. Anim. Behav. 1999, 57, 771–775. [Google Scholar] [CrossRef] [Green Version]
  9. Miki, T.; Nakatsukasa, H.; Takahashi, N.; Murata, O.; Ishibashi, Y. Aggressive behaviour and cannibalism in greater amberjack, Seriola dumerili: Effects of stocking density, feeding conditions and size differences. Aquac. Res. 2011, 42, 1339–1349. [Google Scholar] [CrossRef]
  10. Killen, S.S.; Fu, C.; Wu, Q.; Wang, Y.X.; Fu, S.J. The relationship between metabolic rate and sociability is altered by food deprivation. Funct. Ecol. 2015, 30, 1358–1365. [Google Scholar] [CrossRef] [Green Version]
  11. Auer, S.K.; Salin, K.; Rudolf, A.M.; Anderson, G.J.; Metcalfe, N.B. The optimal combination of standard metabolic rate and aerobic scope for somatic growth depends on food availability. Funct. Ecol. 2015, 29, 479–486. [Google Scholar] [CrossRef]
  12. DeAngelis, D.L. Intraspecific trait variation and its effects on food chains. Math. Biosci. 2013, 244, 91–97. [Google Scholar] [CrossRef]
  13. Bolnick, D.I.; Amarasekare, P.; Araújo, M.S.; Bürger, R.; Levine, J.M.; Novak, M.; Rudolf, V.H.W.; Schreiber, S.J.; Urban, M.C.; Vasseur, D.A. Why intraspecific trait variation matters in community ecology. Trends Ecol. Evol. 2011, 26, 183–192. [Google Scholar] [CrossRef] [Green Version]
  14. Bateson, P.; Barker, D.; Clutton-Brock, T.; Deb, D.; D’Udine, B.; Foley, R.A.; Gluckman, P.; Godfrey, K.; Kirkwood, T.; Lahr, M.M.; et al. Developmental plasticity and human health. Nature 2004, 430, 419–421. [Google Scholar] [CrossRef]
  15. Johnston, I.A. Environment and plasticity of myogenesis in teleost fish. J. Exp. Biol. 2006, 209, 2249–2264. [Google Scholar] [CrossRef] [Green Version]
  16. Abbott, A. Clever fish. Nature 2015, 521, 412–414. [Google Scholar] [CrossRef] [Green Version]
  17. Szopa-Comley, A.W.; Duffield, C.; Ramnarine, I.W.; Ioannou, C.C. Predatory behaviour as a personality trait in a wild fish population. Anim. Behav. 2020, 170, 51–64. [Google Scholar] [CrossRef]
  18. Woodward, M.; Winder, L.; Watt, P. Enrichment Increases Aggression in Zebrafish. Fishes 2019, 4, 22. [Google Scholar] [CrossRef] [Green Version]
  19. Chuard, P.J.C.; Brown, G.E.; Grant, J.W.A. The effects of adult sex ratio on mating competition in male and female guppies (Poecilia reticulata) in two wild populations. Behav. Process 2016, 129, 1–10. [Google Scholar] [CrossRef]
  20. Manley, C.B.; Rakocinski, C.F.; Lee, P.G.; Blaylock, R.B. Stocking density effects on aggressive and cannibalistic behaviors in larval hatchery-reared spotted seatrout, Cynoscion nebulosus. Aquaculture 2014, 420–421, 89–94. [Google Scholar] [CrossRef]
  21. Biro, P.A.; Post, J.R. Rapid Depletion of Genotypes with Fast Growth and Bold Personality Traits from Harvested Fish Populations. Proc. Natl. Acad. Sci. USA 2008, 105, 2919–2922. [Google Scholar] [CrossRef] [PubMed] [Green Version]
  22. Brown, C.; Burgess, F.; Braithwaite, V.A. Heritable and experiential effects on boldness in a tropical poeciliid. Behav. Ecol. Sociobiol. 2007, 62, 237–243. [Google Scholar] [CrossRef] [Green Version]
  23. Chapman, B.B.; Ward, A.J.W.; Krause, J. Schooling and learning: Early social environment predicts social learning ability in the guppy, Poecilia reticulata. Anim. Behav. 2008, 76, 923–929. [Google Scholar] [CrossRef]
  24. Balon, E.K. Origin and domestication of the wild carp, Cyprinus carpio: From Roman gourmets to the swimming flowers. Aquaculture 1995, 129, 3–48. [Google Scholar] [CrossRef]
  25. Jolles, J.W.; Briggs, H.D.; Araya-Ajoy, Y.G.; Boogert, N.J. Personality, plasticity and predictability in sticklebacks: Bold fish are less plastic and more predictable than shy fish. Anim. Behav. 2019, 154, 193–202. [Google Scholar] [CrossRef]
  26. Bell, A.M.; Hankison, S.J.; Laskowski, K.L. The repeatability of behaviour: A meta-analysis. Anim. Behav. 2009, 77, 771–783. [Google Scholar] [CrossRef] [PubMed] [Green Version]
  27. Careau, V.; Thomas, D.; Humphries, M.M.; Réale, D. Energy Metabolism and Animal Personality. Oikos 2008, 117, 641–653. [Google Scholar] [CrossRef]
  28. Chabot, D.; Steffensen, J.F.; Farrell, A.P. The determination of standard metabolic rate in fishes. J. Fish Biol. 2016, 88, 81–121. [Google Scholar] [CrossRef]
  29. Biro, P.A.; Stamps, J.A. Do consistent individual differences in metabolic rate promote consistent individual differences in behavior? Trends Ecol. Evol. 2010, 25, 653–659. [Google Scholar] [CrossRef]
  30. Van Leeuwen, T.E.; Rosenfeld, J.S.; Richards, J.G. Effects of food ration on SMR: Influence of food consumption on individual variation in metabolic rate in juvenile coho salmon (Onchorhynchus kisutch). J. Anim. Ecol. 2012, 81, 395–402. [Google Scholar] [CrossRef]
  31. Zhang, Z.; Fu, Y.; Guo, H.; Zhang, X. Effect of environmental enrichment on the stress response of juvenile black rockfish Sebastes schlegelii. Aquaculture 2021, 533, 736088. [Google Scholar] [CrossRef]
  32. Zhang, Z.; Xu, X.; Wang, Y.; Zhang, X. Effects of environmental enrichment on growth performance, aggressive behavior and stress-induced changes in cortisol release and neurogenesis of black rockfish Sebastes schlegelii. Aquaculture 2020, 528, 735483. [Google Scholar] [CrossRef]
  33. Zhang, Z.; Bai, Q.; Xu, X.; Guo, H.; Zhang, X. Effects of environmental enrichment on the welfare of juvenile black rockfish Sebastes schlegelii: Growth, behavior and physiology. Aquaculture 2020, 518, 734782. [Google Scholar] [CrossRef]
  34. Gonçalves-de-Freitas, E.; Bolognesi, M.; Gauy, A.; Brandão, M.; Giaquinto, P.; Fernandes-Castilho, M. Social Behavior and Welfare in Nile Tilapia. Fishes 2019, 4, 23. [Google Scholar] [CrossRef] [Green Version]
  35. Sneddon, L.U. The bold and the shy: Individual differences in rainbow trout. J. Fish Biol. 2003, 62, 971–975. [Google Scholar] [CrossRef] [Green Version]
  36. Sloan, W.D.; Clark, A.B.; Coleman, K.; Dearstyne, T. Shyness and boldness in humans and other animals. Trends Ecol. Evol. 1994, 9, 442–446. [Google Scholar] [CrossRef]
  37. McCormick, M.I.; Chivers, D.P.; Allan, B.J.M.; Ferrari, M.C.O. Habitat degradation disrupts neophobia in juvenile coral reef fish. Glob. Chang. Biol. 2017, 23, 719–727. [Google Scholar] [CrossRef]
  38. Frost, A.J.; Winrow-Giffen, A.; Ashley, P.J.; Sneddon, L.U. Plasticity in animal personality traits: Does prior experience alter the degree of boldness? Proc. R. Soc. B Biol. Sci. 2007, 274, 333–339. [Google Scholar] [CrossRef] [PubMed]
  39. Réale, D.; Dingemanse, N.J.; Kazem, A.J.N.; Wright, J. Evolutionary and ecological approaches to the study of personality. Philos. Trans. R. Soc. B Biol. Sci. 2010, 365, 3937–3946. [Google Scholar] [CrossRef] [Green Version]
  40. Koolhaas, J.M.; Korte, S.M.; De Boer, S.F.; Van Der Vegt, B.J.; Van Reenen, C.G.; Hopster, H.; De Jong, I.C.; Ruis, M.A.; Blokhuis, H.J. Coping styles in animals: Current status in behavior and stress-physiology. Neurosci. Biobehav. R. 1999, 23, 925–935. [Google Scholar] [CrossRef]
  41. Ferrari, M.C.O.; McCormick, M.I.; Meekan, M.G.; Chivers, D.P. Background level of risk and the survival of predator-naive prey: Can neophobia compensate for predator naivety in juvenile coral reef fishes? Proc. R. Soc. B Biol. Sci. 2015, 282, 20142197. [Google Scholar] [CrossRef] [Green Version]
  42. Xu, X.; Guo, H.; Zhang, Z.; Wang, Y.; Qin, J.; Zhang, X. Impact of pre-aggressive experience on behavior and physiology of black rockfish (Sebastes schlegelii). Aquaculture 2021, 536, 736416. [Google Scholar] [CrossRef]
  43. Eisenreich, B.R.; Greene, S.; Szalda-Petree, A. Of fish and mirrors: Fluoxetine disrupts aggression and learning for social rewards. Physiol. Behav. 2017, 173, 258–262. [Google Scholar] [CrossRef] [PubMed]
  44. Garland, T., Jr.; Else, P.L.; Hulbert, A.J.; Tap, P. Effects of endurance training and captivity on activity metabolism of lizards. Am. J. Physiol.-Regul. Integr. Comp. Physiol. 1987, 252, R450–R456. [Google Scholar] [CrossRef] [PubMed]
  45. Zhang, Z.; Fu, Y.; Shen, F.; Zhang, Z.; Guo, H.; Zhang, X. Barren environment damages cognitive abilities in fish: Behavioral and transcriptome mechanisms. Sci. Total Environ. 2021, 794, 148805. [Google Scholar] [CrossRef]
  46. Miyazaki, T.; Masuda, R.; Furuta, S.; Tsukamoto, K. Feeding behaviour of hatchery-reared juveniles of the Japanese flounder following a period of starvation. Aquaculture 2000, 190, 129–138. [Google Scholar] [CrossRef]
  47. Poulsen, S.B.; Svendsen, J.C.; Jensen, L.F.; Schulz, C.; Jäger-Kleinicke, T.; Schwarten, H. Effects of food deprivation on refuge use and dispersal in juvenile North Sea houting Coregonus oxyrinchus under experimental conditions. J. Fish Biol. 2010, 77, 1702–1708. [Google Scholar] [CrossRef]
  48. Tang, Z.; Wu, Q.; Fu, S. Inspection behaviour and inter-individual cooperation in juvenile qingbo: The effects of prior predator exposure and food deprivation. J. Ethol. 2018, 36, 181–190. [Google Scholar] [CrossRef]
  49. Burton, T.; Killen, S.S.; Armstrong, J.D.; Metcalfe, N.B. What causes intraspecific variation in resting metabolic rate and what are its ecological consequences? Proc. R. Soc. B Biol. Sci. 2011, 278, 3465–3473. [Google Scholar] [CrossRef] [Green Version]
  50. Wone, B.; Sears, M.W.; Labocha, M.K.; Donovan, E.R.; Hayes, J.P. Genetic variances and covariances of aerobic metabolic rates in laboratory mice. Proc. R. Soc. B Biol. Sci. 2009, 276, 3695–3704. [Google Scholar] [CrossRef] [PubMed] [Green Version]
  51. Álvarez, D.; Nicieza, A.G. Is metabolic rate a reliable predictor of growth and survival of brown trout (Salmo trutta) in the wild? Can. J. Fish. Aquat. Sci. 2005, 62, 643–649. [Google Scholar] [CrossRef]
  52. Thünken, T.; Hesse, S.; Bakker, T.C.M.; Baldauf, S.A. Benefits of kin shoaling in a cichlid fish: Familiar and related juveniles show better growth. Behav. Ecol. 2016, 27, 419–425. [Google Scholar] [CrossRef] [Green Version]
  53. Sogard, S.M.; Olla, B.L. The influence of hunger and predation risk on group cohesion in a pelagic fish, walleye pollock Theragra chalcogramma. Environ. Biol. Fish. 1997, 50, 405–413. [Google Scholar] [CrossRef]
Figure 1. Device used to assess the boldness of black rockfish (Sebastes schlegelii Hilgendorf, 1880). The white circle area at the bottom of the device is the central activity area.
Fishes 06 00058 g001
Figure 2. Device used to assess the neophobia of black rockfish (Sebastes schlegelii Hilgendorf, 1880). The middle of the device was separated by white opaque waterproof paper. The experimental fish were placed on one side, while novelty items were placed on the other. The glass plate was removed at the beginning of the experiment.
Fishes 06 00058 g002
Figure 3. Device used to assess the aggressiveness of black rockfish (Sebastes schlegelii Hilgendorf, 1880). On the left is a mirror stimulation, in which a mirror is placed on the side of the tank to test the fish’s aggressiveness; on the right dyadic fights are shown, in which the three treatment groups are paired to assess their differences in aggressiveness.
Fishes 06 00058 g003
Figure 4. Trends in the different kinds of capacity for the action of black rockfish (Sebastes schlegelii Hilgendorf, 1880) during rearing. The horizontal axes of the four figures represent rearing time (from the first week to the end of the sixth week, measured three times a week), and the vertical axes are, respectively, swimming time (ST, A), number of turns (NT, B), movement number (MN, C), and attack number (AN, D). In each figure, the black line represents the control group, the light gray line represents the STFD group, and the red line represents the LTFD group. Different colors of lowercase letters represent significant differences within each treatment group (control group: black; STFD group: light gray; and LTFD group: red. One day was selected for the early, middle, and late stages for each treatment group). Different capital letters indicate significant differences between the three treatment groups. Data are presented as means ± S.E.
Fishes 06 00058 g004
Figure 5. Results of the dyadic fight of black rockfish (Sebastes schlegelii Hilgendorf, 1880). Half of each group was paired with fish of a similar size from the other two groups (A: control group paired with STFD group; B: control group paired with LTFD group; and C: STFD group paired with LTFD group). The first attack, attack number, and number of victories were recorded. Significant differences are indicated by asterisks (p < 0.05); n.s. (p > 0.05).
Fishes 06 00058 g005
Figure 6. Relationship between the standard metabolic rate and weight of the black rockfish (Sebastes schlegelii Hilgendorf, 1880). Legend: black dots represent the control group, gray dots represent the STFD group, and red dots represent the LTFD group.
Fishes 06 00058 g006
Table 1. Behavior measurement indicators and descriptions of the experiments with black rockfish (Sebastes schlegelii Hilgendorf, 1880) in two experimental stages: during rearing and after rearing.
StageBehaviorIndicatorsDescription
During rearing-swimming time (ST)Non-stationary state activity duration of each fish
-number of turns (NT)Number of times fish turns more than 90° in any direction
-movement number (MN)Number of times each fish moves back and forth (forward or backward more than one body length)
-attack number (AN)Number of times engaged in chasing and pecking other fish in the tank
After rearingBoldnesstime in the circle (CTb)Time spent by the fish in the white circle
swimming time (STb)Swimming duration of the fish
number of times through the circle (NTCb)Number of times the fish passed through the circle
frequency in the circle (FCb)Frequency of the fish appearing in the circle in the screenshot
Neophobiaduration in the exploratory area (Te)Time the fish spent in the exploration area
distance from novelty item (De)Average distance of the fish from a novelty item
frequency of stay in the exploratory area (Fe)Frequency of the experimental fish appearing in the exploration area
Aggressivenessattack number (ANm) (mirror stimulus)Number of times a fish committed an attack
attack range frequency (ARm)Frequency of fish appearing in the attack range area
first attack (FAp)Number of attacks initiated first
attack number (ANp) (dyadic fights)Number of times a fish committed an attack
winner (Wp)Number of victories
Table 2. Effects of the three different treatments on the behavioral indicators of black rockfish (Sebastes schlegelii Hilgendorf, 1880) after rearing. The indicators in the table are explained as follows: CTb = time in the circle, STb = swimming time, NTCb = number of times through the circle, FCb = frequency in the circle, Te = duration in the exploratory area, De = distance from novelty item, Fe = frequency of stay in the exploratory area, ANm = attack number, ARm = attack range. Groups with different superscripts are significantly different (p < 0.05). Data are presented as means ± S.E.
BehaviorIndicatorsTreatment
ControlSTFDLTFD
boldnessCTb (%)9.80 ± 0.90 b15.80 ± 1.45 a6.13 ± 0.50 c
STb (s)263.73 ± 8.03 b304.07 ± 9.02 a173.13 ± 8.33 c
NTCb (T)9.60 ± 0.62 b16.27 ± 1.62 a6.73 ± 0.56 b
FCb0.09 ± 0.02 b0.17 ± 0.03 a0.02 ± 0.01 c
NeophobiaTe (%)24.73 ± 1.87 b31.73 ± 2.73 b44.93 ± 3.17 a
De (cm)20.13 ± 0.8 b19.76 ± 1.43 b14.59 ± 1.27 a
Fe0.35 ± 0.04 b0.40 ± 0.07 b0.63 ± 0.06 a
AggressivenessANm (T)7.50 ± 0.50 a7.47 ± 0.74 a4.07 ± 0.37 b
ARm0.58 ± 0.03 a0.44 ± 0.03 b0.34 ± 0.03 c
Publisher’s Note: MDPI stays neutral with regard to jurisdictional claims in published maps and institutional affiliations.

