1H NMR-Based Metabolomics and Lipid Analyses Revealed the Effect of Dietary Replacement of Microbial Extracts or Mussel Meal with Fish Meal to Arctic Charr (Salvelinus alpinus)

 ,
,  ,
, 
Abstract
1. Introduction
2. Material and Methods
2.1. Fish Trial
2.2. Diet
2.3. Sampling
2.4. 1H NMR-Based Metabolomics Assays
2.4.1. Sample Preparation for Metabolomics Study of Liver and White Muscle
2.4.2. 1H NMR Spectroscopic Analyses
2.4.3. Data Processing and Signal Identification
2.5. Total Lipid and Fatty Acid Analysis
2.6. Lipid Class Analyses
2.7. Statistics
3. Results
3.1. Growth Performance
3.2. 1H NMR-Based Metabolomics Analysis
3.2.1. Aqueous Extracts from Liver Tissue
3.2.2. Aqueous Extracts from White Muscle Tissue
3.2.3. Chloroform Extracts from Liver Tissue
3.2.4. Chloroform Extracts from White Muscle Tissue
3.3. Lipid Class, Lipid Content, and Fatty Acid Analysis
3.3.1. Liver
3.3.2. White Muscle
4. Discussion
Supplementary Materials
Author Contributions
Funding
Acknowledgments
Conflicts of Interest
Abbreviations
| AA | amino acid |
| BW | body weight |
| CI | confidential interval |
| COSY | correlation spectroscopy |
| CV-ANOVA | cross validation analysis of variance |
| DHA | docosahexaenoic acid (22:6n-3) |
| EPA | eicosapentaenoic acid (20:5n-3) |
| EY | extracted baker’s yeast (Saccharomyces cerevisiae) |
| FA | fatty acid(s) |
| FAME | fatty acid methyl esters |
| FDR | false discovery rate |
| FM | fish meal |
| GC | gas chromatography |
| HPTLC | high performance thin layer chromatography |
| HSQC | heteronuclear single quantum correlation |
| MM | mussel meal |
| MT | million tonnes |
| MUFA | monounsaturated fatty acid(s) |
| n-3 | omega-3 |
| n-6 | omega-6 |
| NMR | nuclear magnet resonance |
| NY | non-extracted baker’s yeast (Saccharomyces cerevisiae) |
| OPLS-DA | orthogonal partial least squares-discriminant analysis |
| PCA | principal component analysis |
| PL | phospholipids |
| PUFA | polyunsaturated fatty acid(s) |
| REF | reference diet |
| SAFA | saturated fatty acid(s) |
| SEM | standard error of mean |
| SGR | specific growth rate |
| TAG | triacylglycerol |
| TOCSY | total correlation spectroscopy |
| TSP | d4-sodium-3-(trimethylsilyl)-2,2,3,3-tetradeuteriopropionate |
| VIP | variable influences in projection |
| ZYG | zygomycete fungi (Rhizopus oryzae) |
References
- FAO. The State of World Fisheries and Aquaculture 2018—Meeting the Sustainable Development Goals; Food and Agriculture Organization of the United Nations: Rome, Italy, 2018; p. 227. [Google Scholar]
- Schock, T.B.; Newton, S.; Brenkert, K.; Leffler, J.; Bearden, D.W. An NMR-based metabolomic assessment of cultured cobia health in response to dietary manipulation. Food Chem. 2012, 133, 90–101. [Google Scholar] [CrossRef]
- Wilson, R. Amino acids and proteins. In Fish Nutrition, 3rd ed.; Hardy, J.H.A.R., Ed.; Elsevier Science (Department of Biochemistry, Mississippi State University): Starkville, MS, USA, 2002; pp. 143–179. [Google Scholar]
- Kristofersson, D.; Anderson, J.L. Is there a relationship between fisheries and farming? Interdependence of fisheries, animal production and aquaculture. Mar. Policy 2006, 30, 721–725. [Google Scholar] [CrossRef]
- Berge, G.M.; Austreng, E. Blue Mussel in Feed for Rainbow-Trout. Aquaculture 1989, 81, 79–90. [Google Scholar] [CrossRef]
- Jönsson, L.; Elwinger, K. Mussel meal as a replacement for fish meal in feeds for organic poultry—A pilot short-term study. Acta Agric. Scand. Sect. A Anim. Sci. 2009, 59, 22–27. [Google Scholar] [CrossRef]
- Pan, J. Effects of Non-Fish Based Raw Materials on the Fish Muscle Quality of Salmonids; Swedish University of Agricultal Sciences: Uppsala, Sweden, 2013. [Google Scholar]
- Langeland, M.; Vidakovic, A.; Vielma, J.; Lindberg, J.E.; Kiessling, A.; Lundh, T. Digestibility of microbial and mussel meal for Arctic charr (Salvelinus alpinus) and Eurasian perch (Perca fluviatilis). Aquac. Nutr. 2016, 22, 485–495. [Google Scholar] [CrossRef]
- Kuhad, R.C.; Singh, A.; Tripathi, K.K.; Saxena, R.K.; Eriksson, K.E. Microorganisms as an alternative source of protein. Nutr. Rev. 1997, 55, 65–75. [Google Scholar] [CrossRef] [PubMed]
- Edebo, L. Zygomycetes for fish feed. Google Patents 12/338,295, 18 December 2008. [Google Scholar]
- Van Leeuwen, J.; Rasmussen, M.L.; Sankaran, S.; Koza, C.R.; Erickson, D.T.; Mitra, D.; Jin, B. Fungal Treatment of Crop Processing Wastewaters with Value-Added Co-Products. In Sustainable Bioenergy and Bioproducts; Gopalakrishnan, K., van Leeuwen, J., Brown, R.C., Eds.; Springer London: London, UK, 2012; pp. 13–44. [Google Scholar]
- Abro, R.; Moazzami, A.A.; Lindberg, J.E.; Lundh, T. Metabolic insights in Arctic charr (Salvelinus alpinus) fed with zygomycetes and fish meal diets as assessed in liver using nuclear magnetic resonance (NMR) spectroscopy. Int. Aquat. Res. 2014, 6, 1–11. [Google Scholar] [CrossRef]
- Mydland, L.T.; Landsverk, T.; Zimonja, T.; Kiessling, A.; Edebo, L.; Storebakken, T. Mycelium biomass from fungi (rhizopus oryzae) grown on spent sulphite liquor from paper pulp as a protein source in diets for rainbow trout (Oncorhynchus mykiss). In Proceedings of the Aquaculture Europe 2007, Istanbul, Turkey, 24–27 October 2007; pp. 375–376. [Google Scholar]
- Bankefors, J.; Kaszowska, M.; Schlechtriem, C.; Pickova, J.; Brannas, E.; Edebo, L.; Kiessling, A.; Sandstrom, C. A comparison of the metabolic profile on intact tissue and extracts of muscle and liver of juvenile Atlantic salmon (Salmo salar L.)—Application to a short feeding study. Food Chem. 2011, 129, 1397–1405. [Google Scholar] [CrossRef]
- Nasseri, A.T.; Rasoul-Amini, S.; Morowvat, M.H.; Ghasemi, Y. Single cell protein: Production and process. Am. J. Food Technol. 2011, 6, 472–485. [Google Scholar] [CrossRef]
- Rumsey, G.L.; Hughes, S.G.; Kinsella, J.L. Use of Dietary Yeast Saccharomyces cerevisiae Nitrogen by Lake Trout. J. World Aquac. Soc. 1990, 21, 205–209. [Google Scholar] [CrossRef]
- Oliva-Teles, A.; Goncalves, P. Partial replacement of fishmeal by brewers yeast (Saccaromyces cerevisae) in diets for sea bass (Dicentrarchus labrax) juveniles. Aquaculture 2001, 202, 269–278. [Google Scholar] [CrossRef]
- Øverland, M.; Karlsson, A.; Mydland, L.T.; Romarheim, O.H.; Skrede, A. Evaluation of Candida utilis, Kluyveromyces marxianus and Saccharomyces cerevisiae yeasts as protein sources in diets for Atlantic salmon (Salmo salar). Aquaculture 2013, 402–403, 1–7. [Google Scholar] [CrossRef]
- Goodacre, R.; Vaidyanathan, S.; Dunn, W.B.; Harrigan, G.G.; Kell, D.B. Metabolomics by numbers: Acquiring and understanding global metabolite data. Trends Biotechnol. 2004, 22, 245–252. [Google Scholar] [CrossRef] [PubMed]
- Wagner, L.; Trattner, S.; Pickova, J.; Gomez-Requeni, P.; Moazzami, A.A. (1)H NMR-based metabolomics studies on the effect of sesamin in Atlantic salmon (Salmo salar). Food Chem. 2014, 147, 98–105. [Google Scholar] [CrossRef] [PubMed]
- Cheng, K.; Wagner, L.; Pickova, J.; Moazzami, A.A. NMR-based metabolomics reveals compartmental metabolic heterogeneity in liver of Arctic char (Salvelinus alpinus). Can. J. Zool. 2016, 94, 665–669. [Google Scholar] [CrossRef]
- Jasour, M.S.; Wagner, L.; Sundekilde, U.K.; Larsen, B.K.; Greco, I.; Orlien, V.; Olsen, K.; Rasmussen, H.T.; Hjermitslev, N.H.; Hammershoj, M.; et al. A Comprehensive Approach to Assess Feathermeal as an Alternative Protein Source in Aquafeed. J. Agric. Food Chem. 2017, 65, 10673–10684. [Google Scholar] [CrossRef] [PubMed]
- Gribbestad, I.S.; Aursand, M.; Martinez, I. High-resolution 1H magnetic resonance spectroscopy of whole fish, fillets and extracts of farmed Atlantic salmon (Salmo salar) for quality assessment and compositional analyses. Aquaculture 2005, 250, 445–457. [Google Scholar] [CrossRef]
- Vidakovic, A.; Langeland, M.; Sundh, H.; Sundell, K.; Olstorpe, M.; Vielma, J.; Kiessling, A.; Lundh, T. Evaluation of growth performance and intestinal barrier function in Arctic Charr (Salvelinus alpinus) fed yeast (Saccharomyces cerevisiae), fungi (Rhizopus oryzae) and blue mussel (Mytilus edulis). Aquac. Nutr. 2016, 22, 1348–1360. [Google Scholar] [CrossRef]
- Linner, J.; Brannas, E. Growth in Arctic charr and rainbow trout fed temporally concentrated or spaced daily meals. Aquac. Int. 2001, 9, 35–44. [Google Scholar] [CrossRef]
- Moazzami, A.A.; Andersson, R.; Kamal-Eldin, A. Changes in the metabolic profile of rat liver after alpha-tocopherol deficiency as revealed by metabolomics analysis. NMR Biomed. 2011, 24, 499–505. [Google Scholar] [CrossRef] [PubMed]
- Ekman, D.R.; Teng, Q.; Villeneuve, D.L.; Kahl, M.D.; Jensen, K.M.; Durhan, E.J.; Ankley, G.T.; Collette, T.W. Profiling lipid metabolites yields unique information on sex- and time-dependent responses of fathead minnows (Pimephales promelas) exposed to 17α-ethynylestradiol. Metabolomics 2008, 5, 22–32. [Google Scholar] [CrossRef]
- Mraz, J.; Pickova, J. Differences between lipid content and composition of different parts of fillets from crossbred farmed carp (Cyprinus carpio). Fish Physiol. Biochem. 2009, 35, 615–623. [Google Scholar] [CrossRef] [PubMed]
- Appelqvist, L.-Å. Rapid methods of lipid extraction and fatty acid methyl ester preparation for seed and leaf tissue with special remarks on preventing the accumulation of lipid contaminants. Arkiv För Kemi 1968, 28, 551–570. [Google Scholar]
- Fredriksson Eriksson, S.; Pickova, J. Fatty acids and tocopherol levels in M. Longissimus dorsi of beef cattle in Sweden—A comparison between seasonal diets. Meat Sci. 2007, 76, 746–754. [Google Scholar] [CrossRef] [PubMed]
- Eriksson, L.; Trygg, J.; Wold, S. CV-ANOVA for significance testing of PLS and OPLS (R) models. J. Chemom. 2008, 22, 594–600. [Google Scholar] [CrossRef]
- Bell, J.G.; Henderson, R.J.; Tocher, D.R.; Sargent, J.R. Replacement of dietary fish oil with increasing levels of linseed oil: Modification of flesh fatty acid compositions in Atlantic salmon (Salmo salar) using a fish oil finishing diet. Lipids 2004, 39, 223–232. [Google Scholar] [CrossRef] [PubMed]
- Henderson, R.J.; Tocher, D.R. The Lipid-Composition and Biochemistry of Fresh-Water Fish. Prog. Lipid Res. 1987, 26, 281–347. [Google Scholar] [CrossRef]
- Gunstone, F.D.; Wijesundera, R.C. The component acids of the lipids in four commercial fish meals. J. Sci. Food Agric. 1978, 29, 28–32. [Google Scholar] [CrossRef]
- Pettersson, A.; Johnsson, L.; Brannas, E.; Pickova, J. Effects of rapeseed oil replacement in fish feed on lipid composition and self-selection by rainbow trout (Oncorhynchus mykiss). Aquac. Nutr. 2009, 15, 577–586. [Google Scholar] [CrossRef]
- Lever, M.; Slow, S. The clinical significance of betaine, an osmolyte with a key role in methyl group metabolism. Clin. Biochem. 2010, 43, 732–744. [Google Scholar] [CrossRef]
- Muona, M.; Virtanen, E. Effect of Dimethylglycine and Trimethylglycine (Betaine) on the Response of Atlantic Salmon (Salmo-salar L.) Smolts to Experimental Vibrio-Anguillarum Infection. Fish Shellfish Immunol. 1993, 3, 439–449. [Google Scholar] [CrossRef]
- Tocher, D.R.; Bendiksen, E.A.; Campbell, P.J.; Bell, J.G. The role of phospholipids in nutrition and metabolism of teleost fish. Aquaculture 2008, 280, 21–34. [Google Scholar] [CrossRef]
- Savorani, F.; Picone, G.; Badiani, A.; Fagioli, P.; Capozzi, F.; Engelsen, S.B. Metabolic profiling and aquaculture differentiation of gilthead sea bream by 1H NMR metabonomics. Food Chem. 2010, 120, 907–914. [Google Scholar] [CrossRef]
- Liu, Y.Z.; He, G.; Wang, Q.C.; Mai, K.S.; Xu, W.; Zhou, H.H. Hydroxyproline supplementation on the performances of high plant protein source based diets in turbot (Scophthalmus maximus L.). Aquaculture 2014, 433, 476–480. [Google Scholar] [CrossRef]
- Sunde, J.; Taranger, G.L.; Rungruangsak-Torrissen, K. Digestive protease activities and free amino acids in white muscle as indicators for feed conversion efficiency and growth rate in Atlantic salmon (Salmo salar L.). Fish Physiol. Biochem. 2001, 25, 335–345. [Google Scholar] [CrossRef]
- Pandhare, J.; Donald, S.P.; Cooper, S.K.; Phang, J.M. Regulation and function of proline oxidase under nutrient stress. J. Cell. Biochem. 2009, 107, 759–768. [Google Scholar] [CrossRef] [PubMed]
- Ogata, H.; Murai, T. White muscle of masu salmon, Oncorhynchus masou masou, smolts possesses a strong buffering capacity due to a high level of anserine. Fish Physiol. Biochem. 1994, 13, 285–293. [Google Scholar] [CrossRef] [PubMed]
- Ueno, S.; Morino, H.; Sano, A.; Kakimoto, Y. Purification and characterization of D-3-aminoisobutyrate-pyruvate aminotransferase from rat liver. Biochim. Biophys. Acta 1990, 1033, 169–175. [Google Scholar] [CrossRef]
- Awapara, J.; Allen, K. Occurrence of beta-aminoisobutyric acid in Mytilus edulis. Science 1959, 130, 1250. [Google Scholar] [CrossRef]
- DuBois, V.R.P.K.P. Studies on the mechanism of hydrogen transport in animal tissues. J. Gen. Physiol. 1943, 26, 391–404. [Google Scholar]

 ), MM (
 ), EY (
 ), NY (
 ) and ZYG (
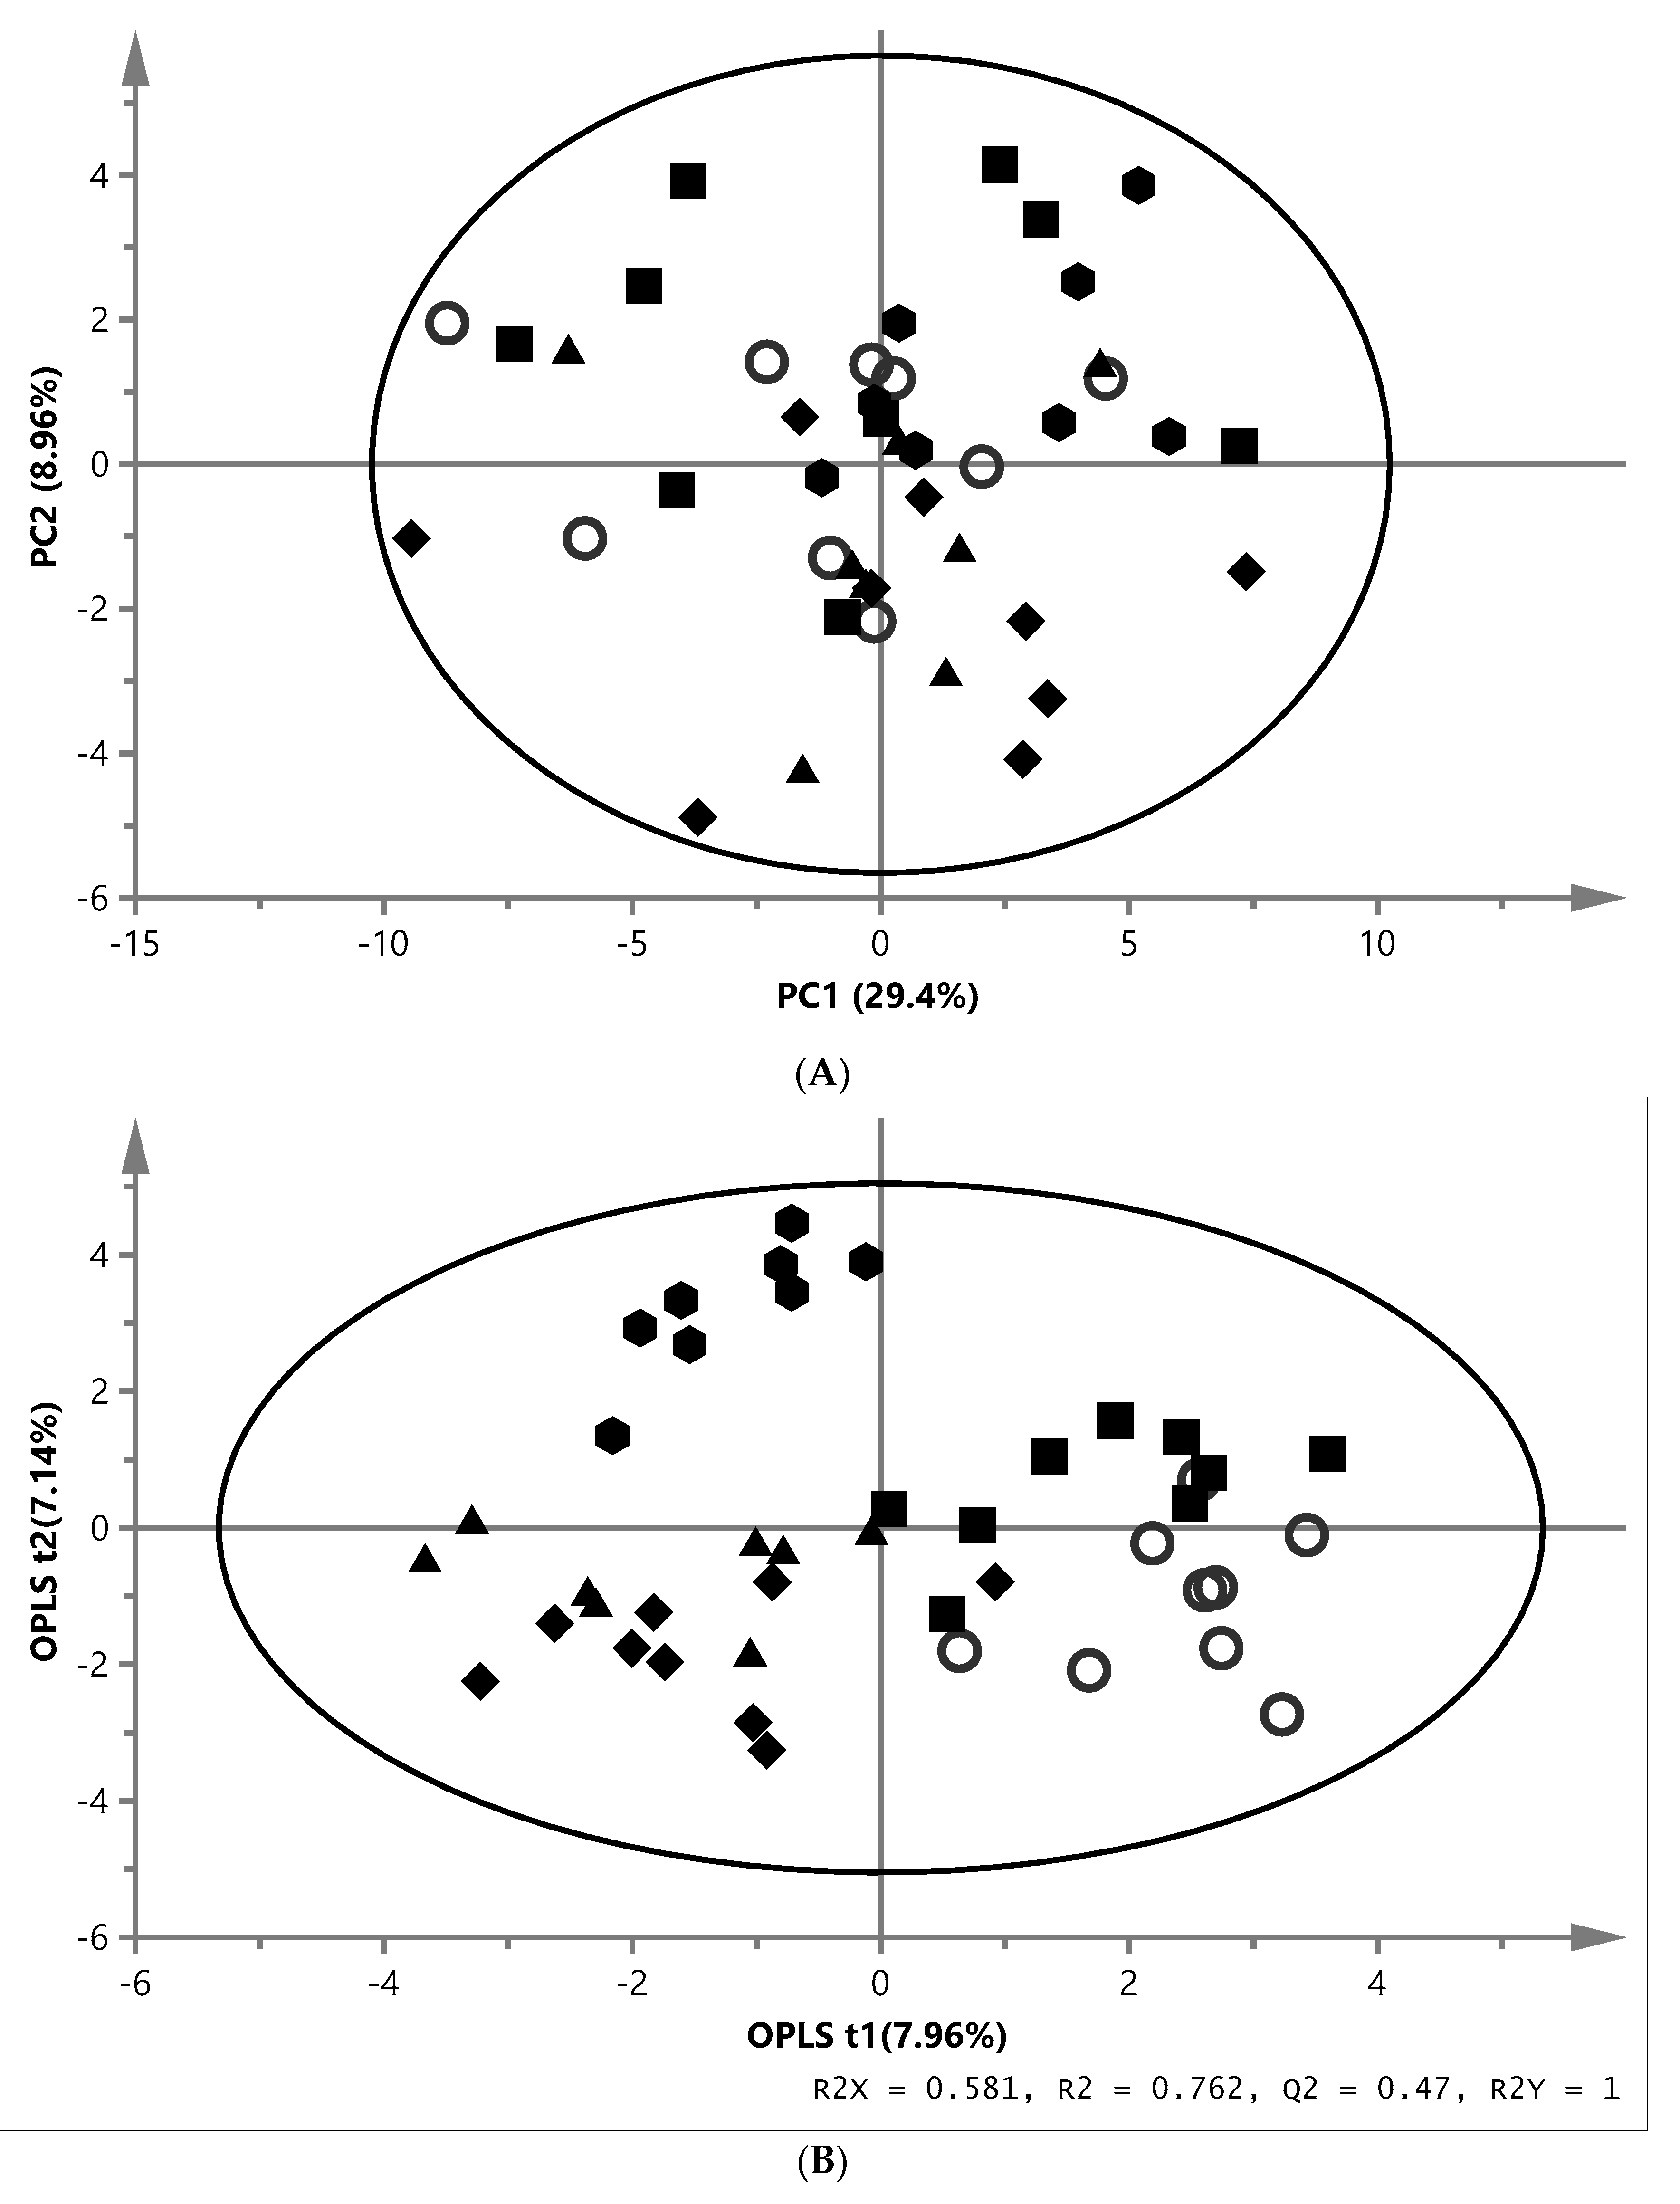
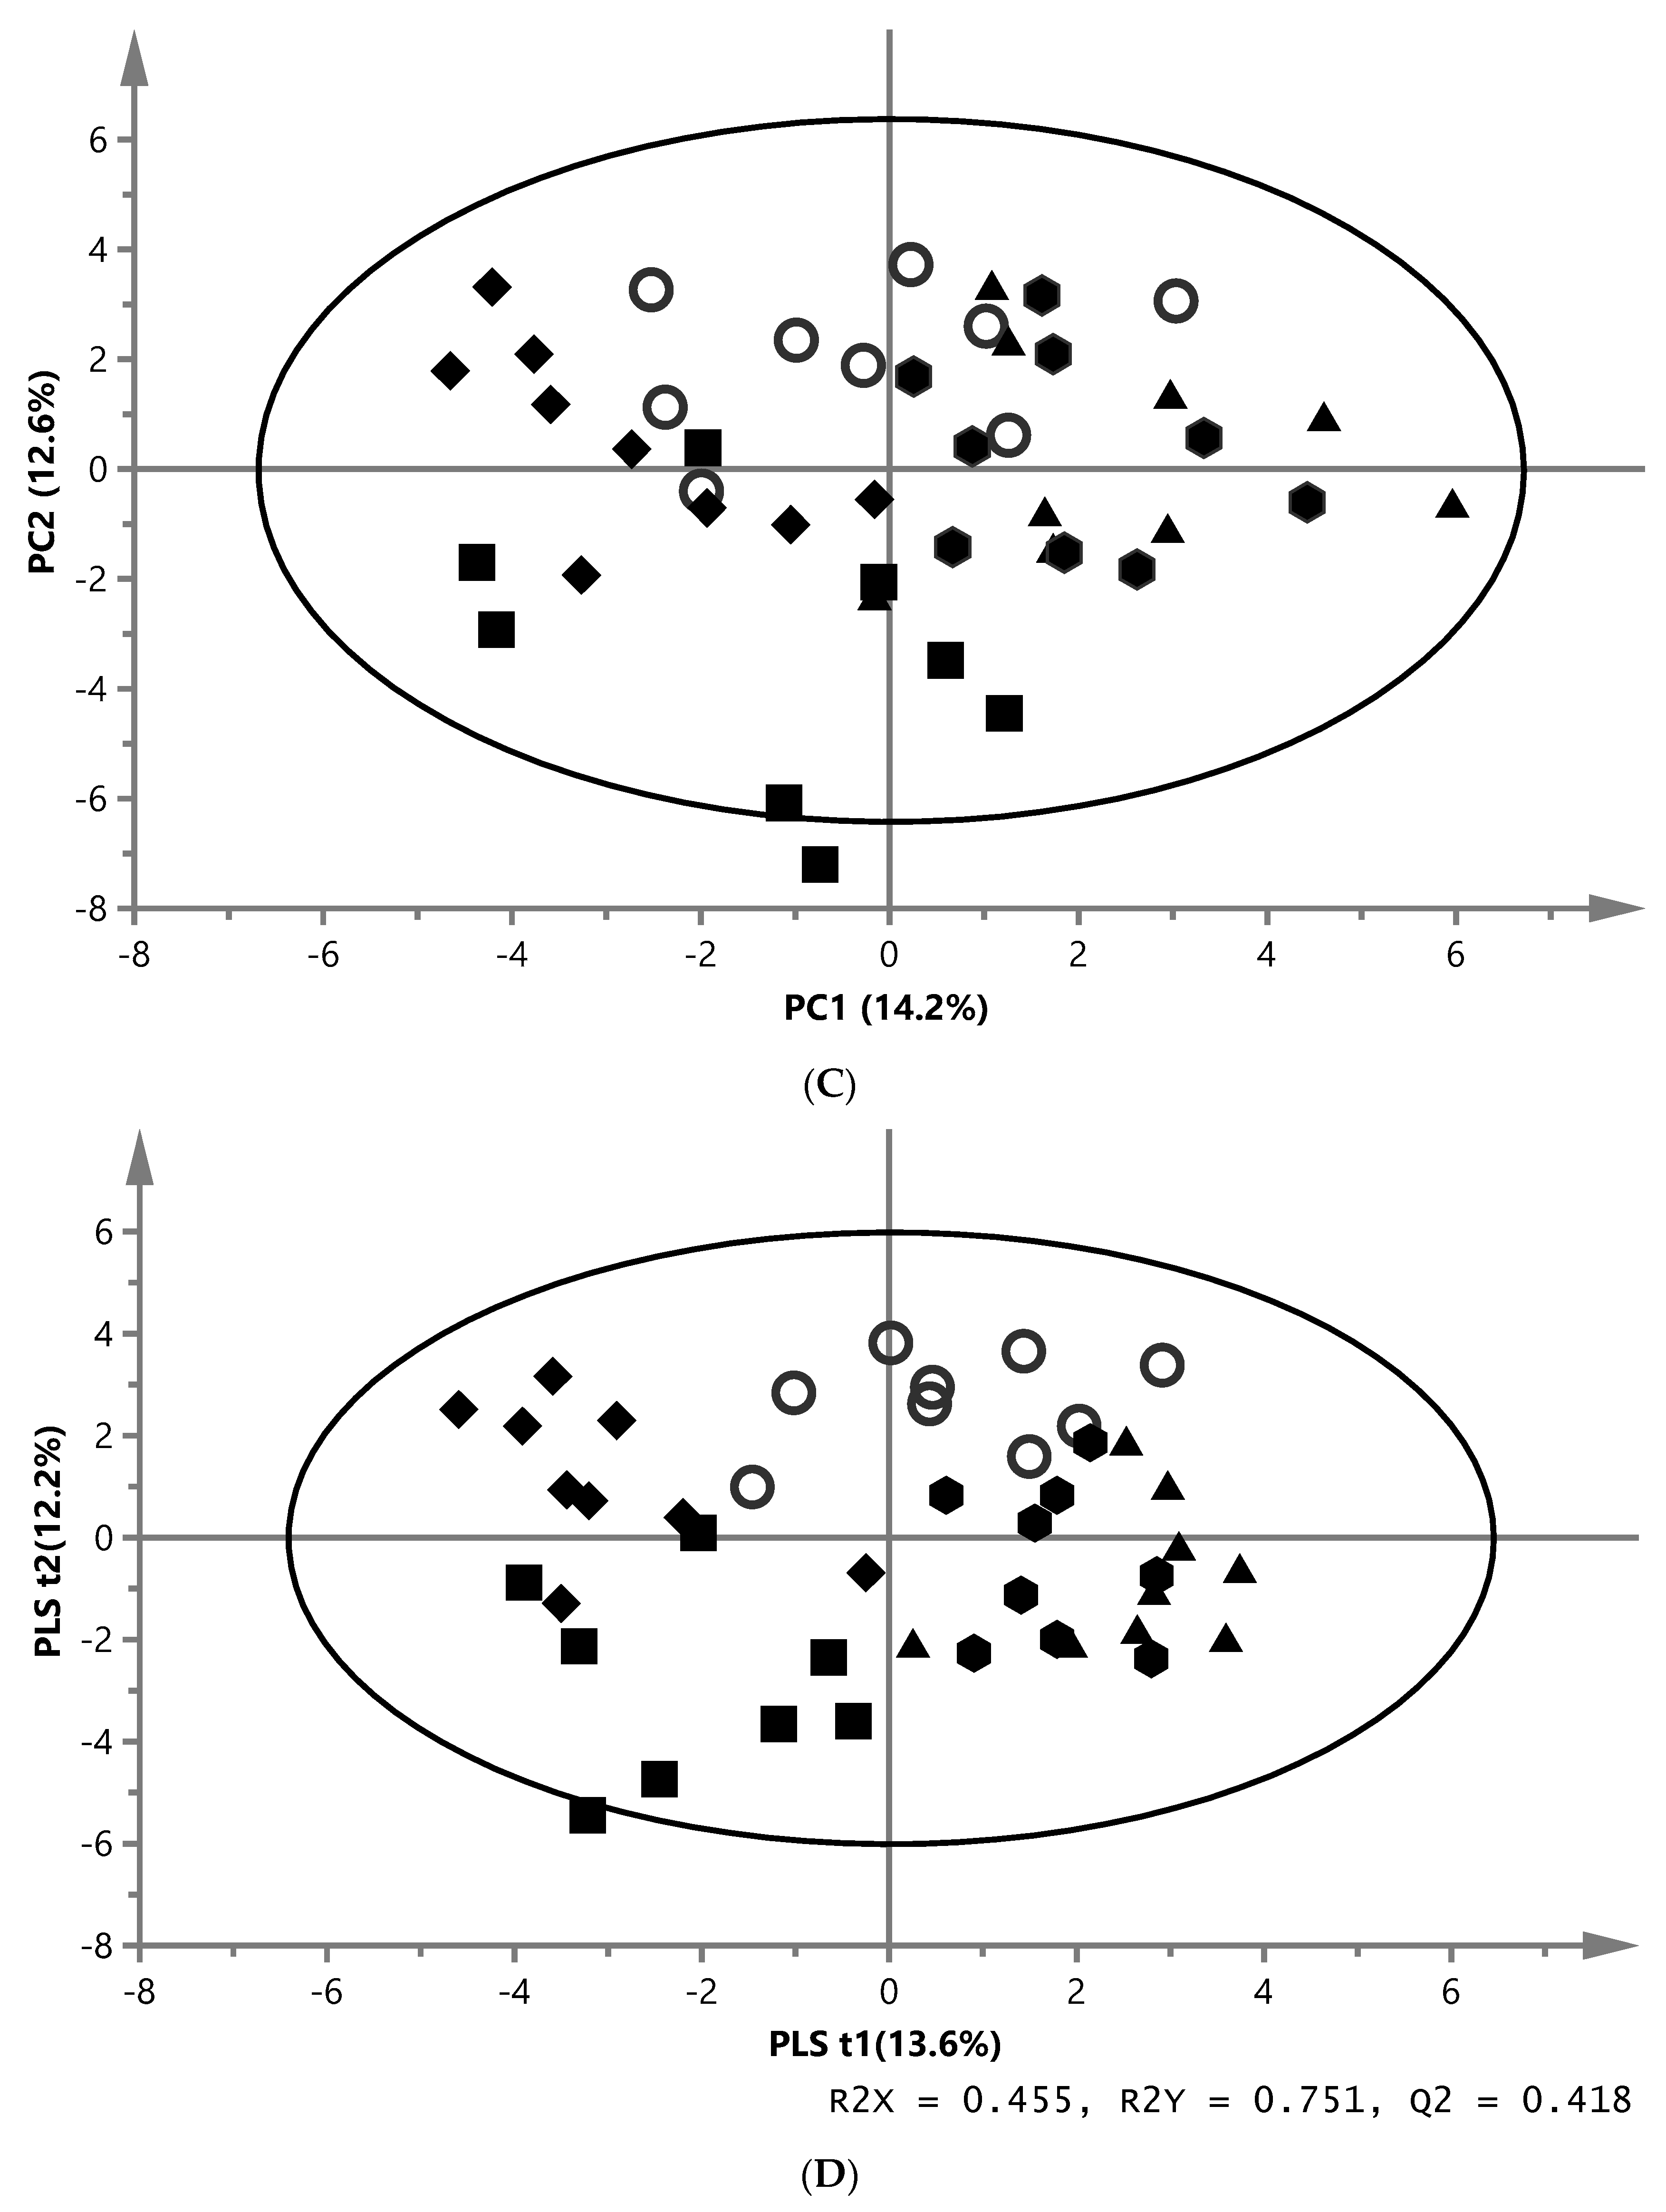
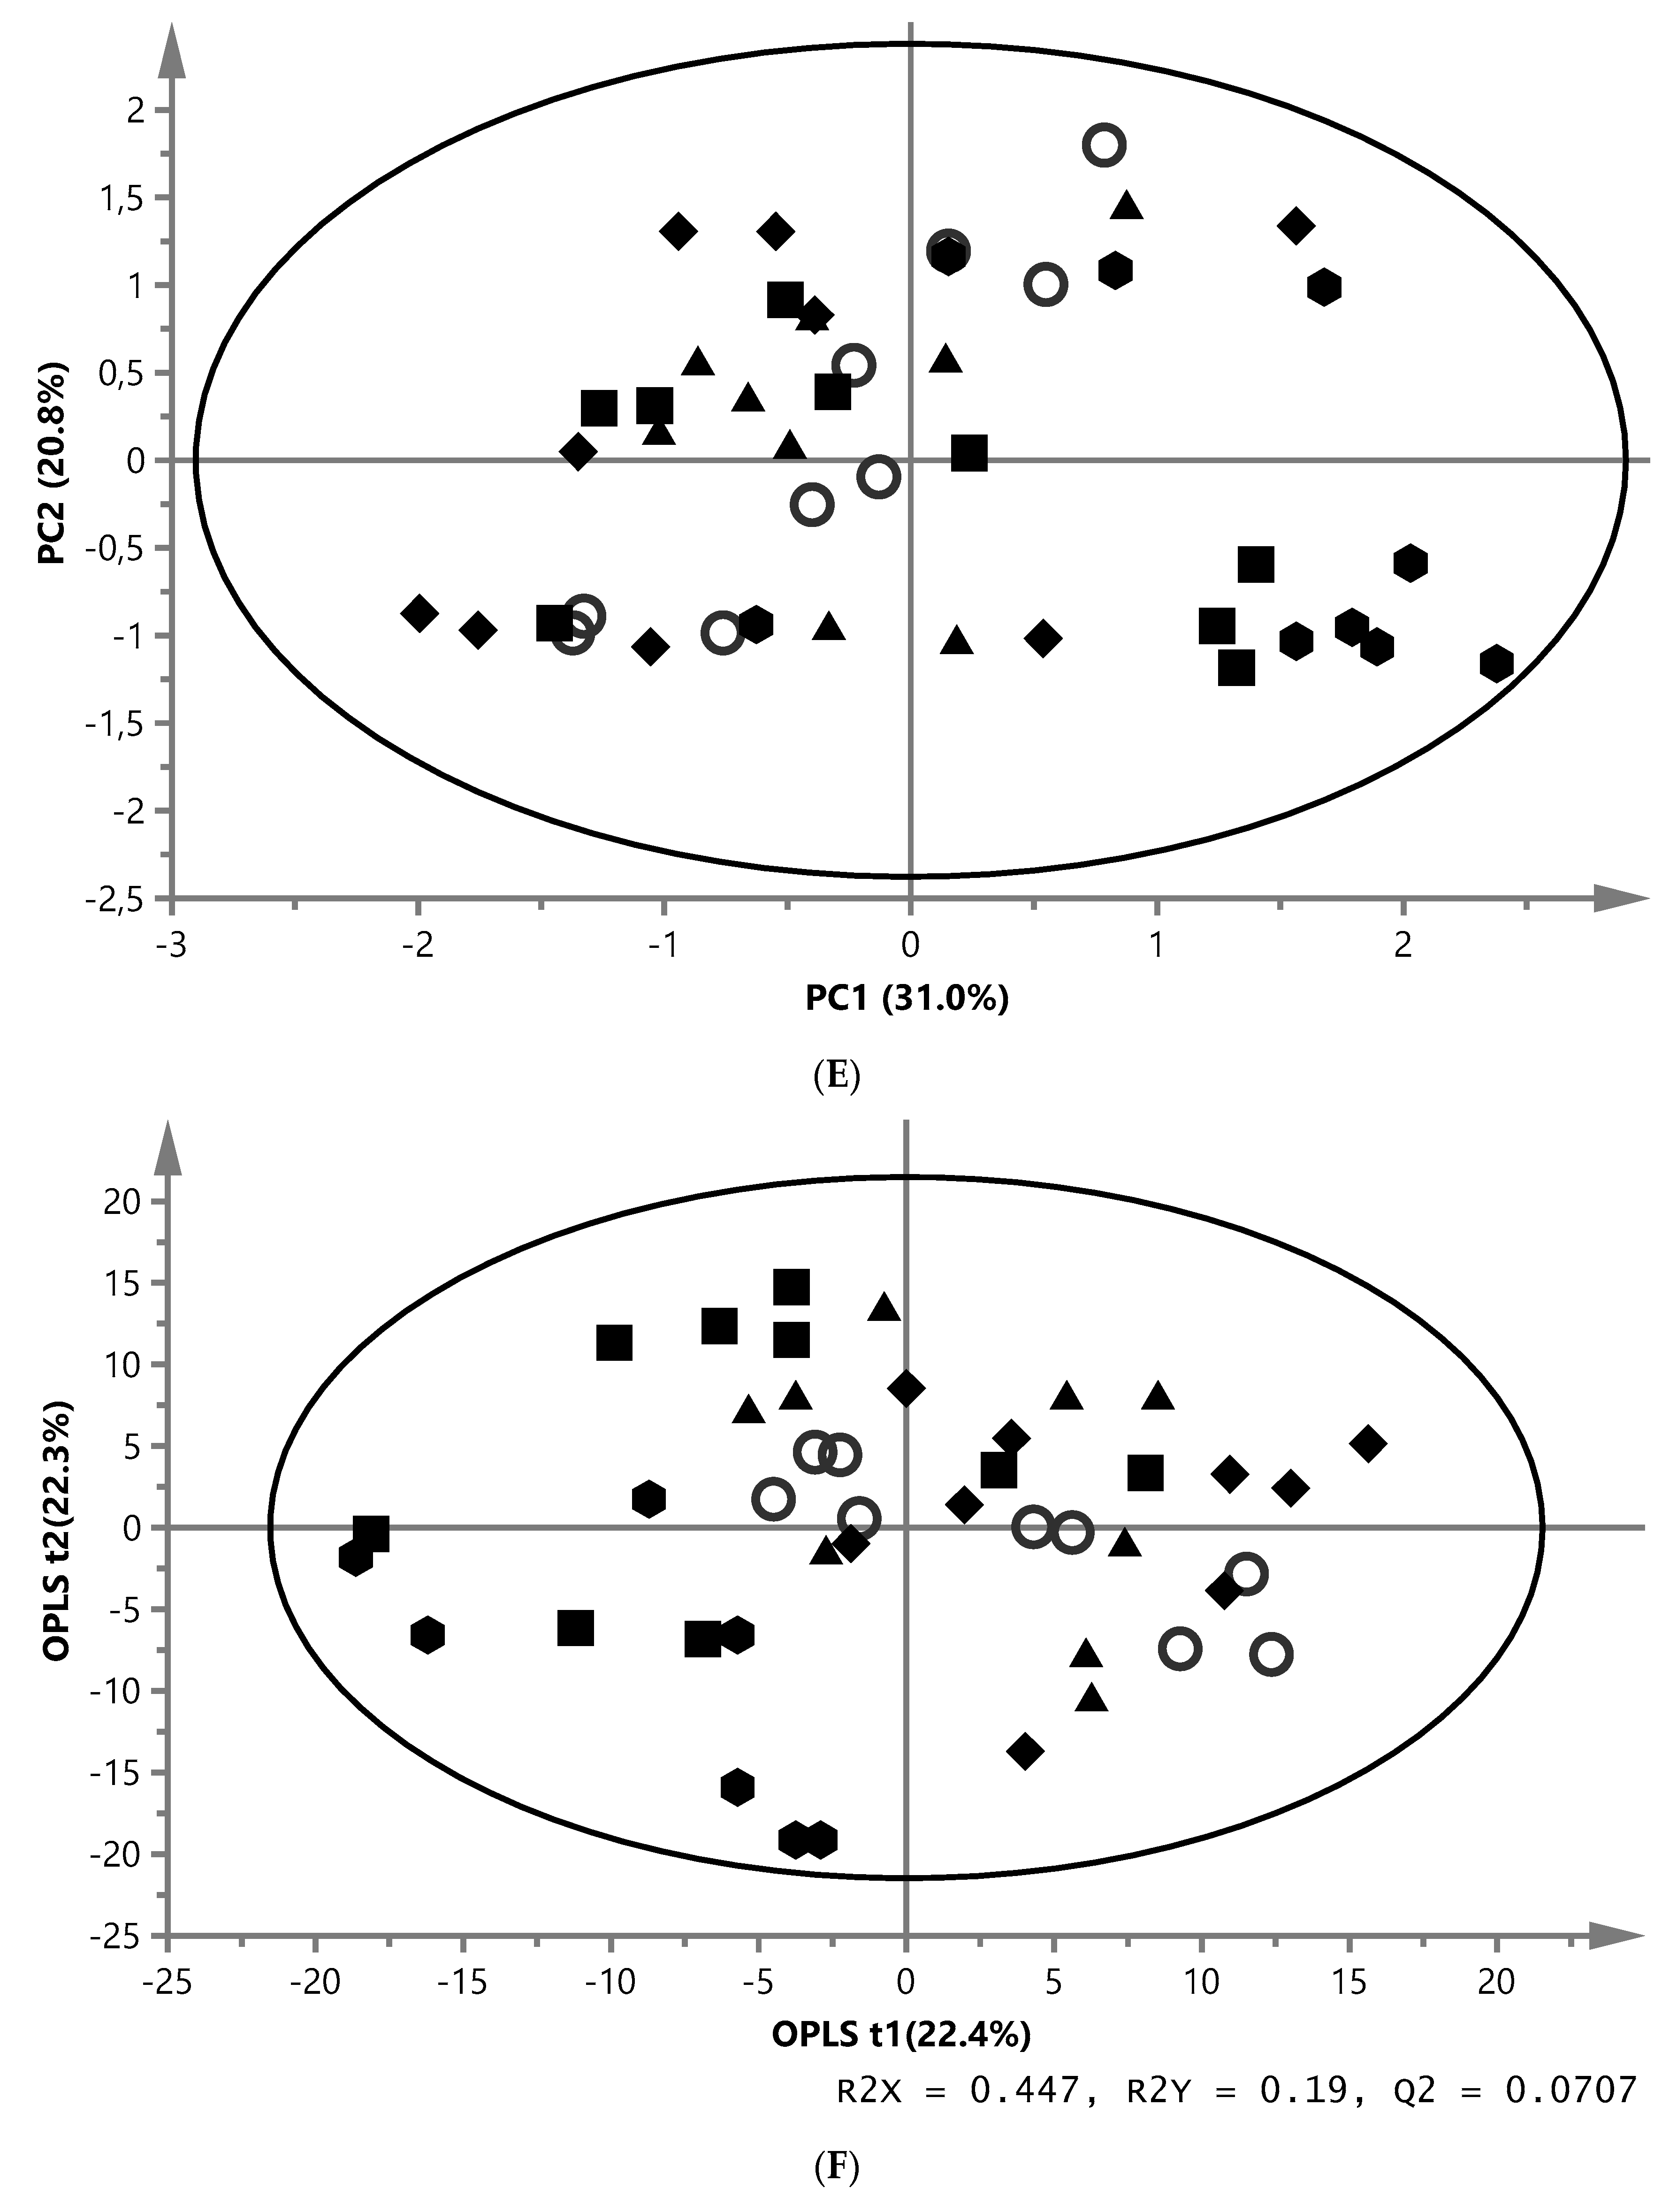
 ). (A) PCA score plot of aqueous liver extract. The first component explained 29.4% and the second 8.96% of variation (model parameters: R2X = 68.5%, Q2 = 21.9%, 7 components). (B) OPLS-DA score plot of aqueous liver extract. The total explained X variation was 58.1%. Of this, 24.5% was predictive and 33.6% was structured (model parameters: R2X = 58.1%, R2 = 76.2%, Q2 = 47.0%, R2Y = 100%, CV-ANOVA = 0.0023, 4 + 2 + 0 components). (C) PCA score plot of aqueous white muscle extracts. The first two components explained 14.2% and 12.6% of variation, respectively (R2X = 45.6%, Q2 = 4.06%, 4 components). (D) PLS-DA score plot of aqueous white muscle extract, using five components (R2X = 45.5%, Q2 = 41.8%, R2Y = 75.1%, CV-ANOVA = 0.000033). (E) PCA score plot of chloroform liver extract. The first component explained 31.0% of variation and the second 20.8% (model parameters: R2X = 61.5%, Q2 = 47.7%, 3 components). (F) OPLS-DA score plot of chloroform liver extract using two predictive components (model parameters: R2X = 44.7%, Q2 = 7.07%, R2Y = 19.0%, CV-ANOVA = 0.018). (G) PCA score plot of chloroform muscle extract. The first and second components explained 29.3% and 23.4% of variation, respectively (model parameters: R2X = 94.1%, Q2 = 70.8%, 10 components).
), MM (), EY (), NY () and ZYG (). (A) PCA score plot of aqueous liver extract. The first component explained 29.4% and the second 8.96% of variation (model parameters: R2X = 68.5%, Q2 = 21.9%, 7 components). (B) OPLS-DA score plot of aqueous liver extract. The total explained X variation was 58.1%. Of this, 24.5% was predictive and 33.6% was structured (model parameters: R2X = 58.1%, R2 = 76.2%, Q2 = 47.0%, R2Y = 100%, CV-ANOVA = 0.0023, 4 + 2 + 0 components). (C) PCA score plot of aqueous white muscle extracts. The first two components explained 14.2% and 12.6% of variation, respectively (R2X = 45.6%, Q2 = 4.06%, 4 components). (D) PLS-DA score plot of aqueous white muscle extract, using five components (R2X = 45.5%, Q2 = 41.8%, R2Y = 75.1%, CV-ANOVA = 0.000033). (E) PCA score plot of chloroform liver extract. The first component explained 31.0% of variation and the second 20.8% (model parameters: R2X = 61.5%, Q2 = 47.7%, 3 components). (F) OPLS-DA score plot of chloroform liver extract using two predictive components (model parameters: R2X = 44.7%, Q2 = 7.07%, R2Y = 19.0%, CV-ANOVA = 0.018). (G) PCA score plot of chloroform muscle extract. The first and second components explained 29.3% and 23.4% of variation, respectively (model parameters: R2X = 94.1%, Q2 = 70.8%, 10 components).
). (A) PCA score plot of aqueous liver extract. The first component explained 29.4% and the second 8.96% of variation (model parameters: R2X = 68.5%, Q2 = 21.9%, 7 components). (B) OPLS-DA score plot of aqueous liver extract. The total explained X variation was 58.1%. Of this, 24.5% was predictive and 33.6% was structured (model parameters: R2X = 58.1%, R2 = 76.2%, Q2 = 47.0%, R2Y = 100%, CV-ANOVA = 0.0023, 4 + 2 + 0 components). (C) PCA score plot of aqueous white muscle extracts. The first two components explained 14.2% and 12.6% of variation, respectively (R2X = 45.6%, Q2 = 4.06%, 4 components). (D) PLS-DA score plot of aqueous white muscle extract, using five components (R2X = 45.5%, Q2 = 41.8%, R2Y = 75.1%, CV-ANOVA = 0.000033). (E) PCA score plot of chloroform liver extract. The first component explained 31.0% of variation and the second 20.8% (model parameters: R2X = 61.5%, Q2 = 47.7%, 3 components). (F) OPLS-DA score plot of chloroform liver extract using two predictive components (model parameters: R2X = 44.7%, Q2 = 7.07%, R2Y = 19.0%, CV-ANOVA = 0.018). (G) PCA score plot of chloroform muscle extract. The first and second components explained 29.3% and 23.4% of variation, respectively (model parameters: R2X = 94.1%, Q2 = 70.8%, 10 components).
), MM (), EY (), NY () and ZYG (). (A) PCA score plot of aqueous liver extract. The first component explained 29.4% and the second 8.96% of variation (model parameters: R2X = 68.5%, Q2 = 21.9%, 7 components). (B) OPLS-DA score plot of aqueous liver extract. The total explained X variation was 58.1%. Of this, 24.5% was predictive and 33.6% was structured (model parameters: R2X = 58.1%, R2 = 76.2%, Q2 = 47.0%, R2Y = 100%, CV-ANOVA = 0.0023, 4 + 2 + 0 components). (C) PCA score plot of aqueous white muscle extracts. The first two components explained 14.2% and 12.6% of variation, respectively (R2X = 45.6%, Q2 = 4.06%, 4 components). (D) PLS-DA score plot of aqueous white muscle extract, using five components (R2X = 45.5%, Q2 = 41.8%, R2Y = 75.1%, CV-ANOVA = 0.000033). (E) PCA score plot of chloroform liver extract. The first component explained 31.0% of variation and the second 20.8% (model parameters: R2X = 61.5%, Q2 = 47.7%, 3 components). (F) OPLS-DA score plot of chloroform liver extract using two predictive components (model parameters: R2X = 44.7%, Q2 = 7.07%, R2Y = 19.0%, CV-ANOVA = 0.018). (G) PCA score plot of chloroform muscle extract. The first and second components explained 29.3% and 23.4% of variation, respectively (model parameters: R2X = 94.1%, Q2 = 70.8%, 10 components).


| Ingredients | Reference | Mussel Meal (M. edulis) | Extracted Baker’s Yeast (S. cerevisiae) | Non-Extracted Baker’s Yeast (S. cerevisiae) | Zygomycetes Fungi (Rhizopus oryzae) |
|---|---|---|---|---|---|
| REF | MM | EY | NY | ZYG | |
| Fish meal | 46.8 | 28.0 | 28.1 | 28.2 | 27.9 |
| Soy protein concentrate | 3.64 | 3.64 | 2.81 | 3.13 | 3.62 |
| Soybean meal | 11.4 | 10.4 | 8.32 | 11.5 | 11.4 |
| Fish oil | 8.94 | 8.93 | 9.17 | 9.70 | 8.16 |
| Rapeseed oil | 3.46 | 3.20 | 3.39 | 3.47 | 2.71 |
| Wheat mix | 23.7 | 21.7 | 24.7 | 17.2 | 18.1 |
| Premixes | 2.08 | 2.08 | 2.08 | 2.08 | 2.07 |
| Mussel meal | 22.0 | ||||
| Extracted yeast meal | 17.3 | ||||
| Non-extracted yeast meal | 28.9 | ||||
| Zygomycetes fungi meal | 26.1 | ||||
| Dry matter | 91.2 | 91.7 | 92.9 | 91.3 | 90.8 |
| Crude protein (N × 6.25) | 493 | 498 | 494 | 492 | 480 |
| Crude lipid | 201 | 201 | 174 | 190 | 186 |
| Ash | 76 | 74 | 75 | 67 | 73 |
| Gross energy | 24.1 | 24.4 | 23.2 | 23.9 | 23.9 |
| Experimental Diets | |||||
|---|---|---|---|---|---|
| Fatty Acids | REF | MM | EY | NY | ZYG |
| SAFA | 21.5 | 22.6 | 21.7 | 21.6 | 22.8 |
| 20:1n-9 | 6.14 | 5.33 | 5.62 | 5.54 | 5.22 |
| 22:1n-9 | 6.75 | 5.90 | 6.47 | 6.24 | 5.95 |
| MUFA | 44.7 | 43.4 | 43.7 | 44.6 | 44.6 |
| 18:2n-6 | 7.83 | 7.67 | 8.31 | 8.66 | 9.40 |
| 18:3n-6 | 0.09 | 0.00 | 0.10 | 0.09 | 0.34 |
| 20:4n-6 | 0.50 | 0.52 | 0.52 | 0.49 | 0.45 |
| n-6 PUFA | 8.55 | 8.34 | 9.06 | 9.38 | 10.3 |
| 18:3n-3 | 2.95 | 2.72 | 2.92 | 3.01 | 2.63 |
| 20:5n-3 (EPA) | 10.3 | 11.0 | 10.9 | 10.3 | 9.46 |
| 22:6n-3 (DHA) | 8.41 | 8.39 | 8.07 | 7.61 | 7.06 |
| n-3 PUFA | 25.2 | 25.6 | 25.5 | 24.4 | 22.3 |
| PUFA | 33.8 | 33.9 | 34.6 | 33.7 | 32.6 |
| n-6/n-3 | 0.34 | 0.33 | 0.36 | 0.39 | 0.46 |
| Metabolite | Signal 1 | Concentration in mmol/g (Mean ± SEM) | p-Value 2 | ||||
|---|---|---|---|---|---|---|---|
| REF | MM | EY | NY | ZYG | |||
| LIVER | |||||||
| 3-Aminoisobutyrate | 5 | 0.07 ± 0.01 | 0.42 ± 0.02 *** | 0.06 ± 0.01 | 0.06 ± 0.01 | 0.11 ± 0.02 | 0.0008 |
| Betaine | 19 | 0.39 ± 0.03 | 0.52 ± 0.05 | 0.51 ± 0.04 | 1.09 ± 0.14 ** | 0.58 ± 0.05 | 0.0043 |
| n,n-Dimethylglycine | 14 | 0.03 ± 0.01 | 0.03 ± 0.00 | 0.02 ± 0.00 | 0.10 ± 0.02 ** | 0.01 ± 0.00 | 0.0055 |
| o-Phosphocholine | 17 | 0.40 ± 0.05 | 0.65 ± 0.09 | 0.69 ± 0.14 | 0.65 ± 0.09 | 1.39 ± 0.07 ** | 0.0022 |
| WHITE MUSCLE | |||||||
| 3-Aminoisobutyrate | 5 | 0.05 ± 0.01 | 0.21 ± 0.03 *** | 0.06 ± 0.01 | 0.05 ± 0.00 | 0.09 ± 0.01 | 0.0007 |
| Alanine | 7 | 1.43 ± 0.15 | 2.29 ± 0.26 | 2.69 ± 0.16 * | 1.94 ± 0.26 | 1.94 ± 0.22 | 0.0164 |
| Anserine | 27 | 11.6 ± 0.39 | 13.7 ± 0.61 | 13.8 ± 0.63 | 11.8 ± 0.44 | 15.1 ± 0.30 ** | 0.0017 |
| Betaine | 19 | 1.39 ± 0.12 | 2.12 ± 0.22 | 3.23 ± 0.43 *** | 7.55 ± 0.76 *** | 1.89 ± 0.20 | 0.0001 |
| Hydroxyproline | 24 | 0.93 ± 0.04 | 0.92 ± 0.02 | 0.71 ± 0.06 ** | 0.78 ± 0.04 | 0.69 ± 0.04 ** | 0.0083 |
| Isoleucine | 1 | 0.10 ± 0.01 | 0.13 ± 0.01 | 0.17 ± 0.01 * | 0.12 ± 0.01 | 0.12 ± 0.01 | 0.0291 |
| Malonate | 32 | 0.20 ± 0.01 | 0.60 ± 0.03 *** | 0.20 ± 0.01 | 0.17 ± 0.01 | 0.24 ± 0.02 | 0.0001 |
| n,n-Dimethylglycine | 14 | 0.02 ± 0.00 | 0.02 ± 0.00 | 0.02 ± 0.00 | 0.04 ± 0.01 ** | 0.02 ± 0.00 | 0.0083 |
| Proline | 12 | 0.24 ± 0.03 | 0.24 ± 0.03 | 0.49 ± 0.05 * | 0.33 ± 0.03 | 0.24 ± 0.03 | 0.0188 |
| Succinate | 30 | 0.18 ± 0.01 | 0.21 ± 0.02 | 0.22 ± 0.03 | 0.27± 0.02 * | 0.21 ± 0.02 | 0.0395 |
| Valine | 4 | 0.28 ± 0.02 | 0.30 ± 0.02 | 0.41 ± 0.02 * | 0.29 ± 0.01 | 0.32 ± 0.02 | 0.0205 |
| Metabolite | Signal 1 | NMR Signal (ppm) | VIP (CI) 2 | p-Value 3 | Loading 4 |
|---|---|---|---|---|---|
| n-3 FA | c | 0.92–0.97 | 2.01 (0.21) | <0.0001 | + |
| All FA (except EPA and DHA) | d | 1.19–1.35 | 5.98 (1.10) | <0.0001 | − |
| All FA (except DHA) | e | 1.51–1.62 | 3.14 (0.37) | <0.0001 | − |
| EPA (20:5n-3) | f | 1.62–1.70 | 1.03 (0.07) | <0.0001 | + |
| Unsaturated FA | g | 1.90–2.10 | 2.94 (0.57) | <0.0001 | − |
| DHA (22:6n-3) | i | 2.32–2.38 | 2.38 (0.35) | <0.0001 | + |
| Polyunsaturated FA | j | 2.72–2.86 | 3.59 (0.09) | <0.0001 | + |
| Phosphatidylcholine/-ethanolamine | n | 3.84–4.00 | 1.77 (0.26) | <0.0001 | + |
| Glyceryl moiety | o | 4.04–4.16 4.24–4.34 | 1.79 (0.26) 2.29 (0.30) | <0.0001 <0.0001 | − − |
| REF | MM | EY | NY | ZYG | p-Value 1 | |
|---|---|---|---|---|---|---|
| Phospholipids | 36.4 ± 1.26 | 36.8 ± 1.39 | 40.1 ± 2.50 | 37.8 ± 2.47 | 46.8 ± 2.87 ** | 0.0088 |
| Diacylglycerols | 6.30 ± 0.58 | 6.20 ± 0.69 | 5.87 ± 0.84 | 6.55 ± 0.83 | 5.70 ± 0.65 | 0.925 |
| Cholesterol | 27.7 ± 0.29 | 27.4 ± 0.35 | 27.6 ± 0.73 | 27.4 ± 0.28 | 30.5 ± 0.78 | 0.0024 |
| Triacylglycerols | 29.2 ± 1.05 | 29.6 ± 0.98 | 26.5 ± 2.55 | 28.3 ± 2.02 | 17.0 ± 3.07 *** | 0.0007 |
| REF | MM | EY | NY | ZYG | p-Value 1 | |
|---|---|---|---|---|---|---|
| Lipid content | 8.67 ± 0.89 | 8.67 ± 0.87 | 7.89 ± 1.24 | 9.11 ± 1.18 | 4.85 ± 0.57 * | 0.0186 |
| Fatty acids | ||||||
| 14:0 | 2.06 ± 0.12 | 2.28 ± 0.07 | 2.10 ± 0.12 | 2.06 ± 0.10 | 1.86 ± 0.14 | 0.1413 |
| 15:0 | 0.09 ± 0.02 | 0.12 ± 0.01 | 0.11 ± 0.02 | 0.08 ± 0.02 | 0.19 ± 0.02 ** | 0.0003 |
| 16:0 | 11.7 ± 0.36 | 11.1 ± 0.36 | 11.8 ± 0.42 | 12.6 ± 0.32 | 12.8 ± 0.76 | 0.0863 |
| 17:0 | 0.31 ± 0.01 | 0.29 ± 0.01 | 0.22 ± 0.02 * | 0.21 ± 0.02 ** | 0.20 ± 0.03 ** | 0.0010 |
| 18:0 | 2.44 ± 0.12 | 2.39 ± 0.10 | 2.28 ± 0.14 | 3.18 ± 0.15 ** | 2.87 ± 0.14 | 0.0005 |
| SAFA | 16.6 ± 0.49 | 16.2 ± 0.46 | 16.5 ± 0.49 | 18.2 ± 0.38 | 18.0 ± 0.86 | 0.0632 |
| 16:1n-7 | 8.74 ± 0.54 | 9.47 ± 0.52 | 8.55 ± 0.93 | 9.54 ± 0.85 | 4.83 ± 0.61 ** | 0.0017 |
| 18:1n-9 | 30.6 ± 1.36 | 31.4 ± 1.33 | 30.0 ± 2.15 | 34.8 ± 2.10 | 23.0 ± 1.80 ** | 0.0040 |
| 18:1n-7 | 3.66 ± 0.06 | 4.07 ± 0.07 | 3.90 ± 0.11 | 3.85 ± 0.14 | 3.12 ± 0.15 ** | 0.0001 |
| 20:1n-9 | 4.59 ± 0.13 | 4.39 ± 0.11 | 4.34 ± 0.14 | 4.03 ± 0.16 | 3.65 ± 0.22 *** | 0.0085 |
| 22:1n-9 | 2.43 ± 0.07 | 2.02 ± 0.08 * | 2.06 ± 0.10 * | 1.73 ± 0.05 *** | 1.76 ± 0.15 *** | 0.0002 |
| 24:1 | 0.38 ± 0.01 | 0.30 ± 0.01 ** | 0.31 ± 0.02 | 0.29 ± 0.01 ** | 0.26 ± 0.02 *** | 0.0002 |
| MUFA | 50.8 ± 1.91 | 52.1 ± 1.83 | 49.7 ± 3.22 | 54.7 ± 2.95 | 37.0 ± 2.79 ** | 0.0032 |
| 18:2n-6 | 3.93 ± 0.19 | 3.87 ± 0.14 | 3.98 ± 0.19 | 3.32 ± 0.18 * | 5.11 ± 0.15 *** | <0.0001 |
| 18:3n-6 | 0.15 ± 0.02 | 0.14 ± 0.02 | 0.21 ± 0.02 | 0.20 ± 0.02 | 0.23 ± 0.03 | 0.0255 |
| 20:2n-6 | 0.46 ± 0.03 | 0.51 ± 0.02 | 0.50 ± 0.03 | 0.42 ± 0.04 | 0.59 ± 0.04 * | 0.0149 |
| 20:3n-6 | 0.35 ± 0.02 | 0.34 ± 0.02 | 0.47 ± 0.04 * | 0.44 ± 0.03 | 0.58 ± 0.05 *** | 0.0004 |
| 20:4n-6 | 1.02 ± 0.13 | 1.02 ± 0.10 | 1.30 ± 0.23 | 0.98 ± 0.17 | 1.99 ± 0.22 ** | 0.0082 |
| n-6 PUFA | 5.91 ± 0.31 | 5.88 ± 0.25 | 6.46 ± 0.35 | 5.35 ± 0.35 | 8.50 ± 0.21 *** | <0.0001 |
| 18:3n-3 | 0.89 ± 0.05 | 0.85 ± 0.03 | 0.79 ± 0.05 | 0.62 ± 0.05 *** | 0.80 ± 0.06 | 0.0048 |
| 18:4n-3 | 0.75 ± 0.04 | 0.58 ± 0.02 | 0.61 ± 0.04 | 0.61 ± 0.04 | 0.57 ± 0.04 * | 0.0187 |
| 20:5n-3 | 6.29 ± 0.30 | 6.35 ± 0.31 | 6.10 ± 0.42 | 5.04 ± 0.53 | 7.42 ± 0.39 | 0.0094 |
| 22:5n-3 | 1.82 ± 0.05 | 1.94 ± 0.12 | 1.64 ± 0.08 | 1.39 ± 0.13 ** | 1.58 ± 0.05 | 0.0031 |
| 22:6n-3 | 16.9 ± 1.51 | 16.1 ± 1.14 | 18.2 ± 2.31 | 14.1 ± 2.05 | 26.1 ± 1.88 ** | 0.0024 |
| n-3 PUFA | 26.7 ± 1.80 | 25.8 ± 1.38 | 27.2 ± 2.72 | 21.8 ± 2.70 | 36.4 ± 2.16 ** | 0.0024 |
| PUFA | 32.6 ± 2.08 | 31.7 ± 1.60 | 33.7 ± 3.03 | 27.2 ± 3.03 | 44.9 ± 2.26 ** | 0.0013 |
| n-3/n-6 | 4.50 ± 0.15 | 4.39 ± 0.12 | 4.16 ± 0.25 | 3.98 ± 0.25 | 4.28 ± 0.24 | 0.3923 |
| REF | MM | EY | NY | ZYG | p-Value 1 | |
|---|---|---|---|---|---|---|
| Lipid content | 1.68 ± 0.15 | 1.75 ± 0.22 | 1.89 ± 0.18 | 1.60 ± 0.14 | 1.77 ± 0.09 | 0.4821 |
| Fatty acids | ||||||
| 14:0 | 2.78 ± 0.14 | 2.82 ± 0.17 | 3.50 ± 0.13 * | 2.93 ± 0.18 | 2.90 ± 0.17 | 0.0161 |
| 15:0 | 0.22 ± 0.00 | 0.24 ± 0.01 * | 0.24 ± 0.00 * | 0.22 ± 0.00 | 0.26 ± 0.01 *** | 0.0005 |
| 16:0 | 16.8 ± 0.26 | 16.8 ± 0.27 | 16.5 ± 0.20 | 17.1 ± 0.30 | 15.9 ± 0.24 | 0.0588 |
| 17:0 | 0.14 ± 0.01 | 0.15 ± 0.01 | 0.14 ± 0.01 | 0.12 ± 0.01 | 0.13 ± 0.01 | 0.5904 |
| 18:0 | 2.41 ± 0.07 | 2.54 ± 0.05 | 2.37 ± 0.06 | 2.65 ± 0.12 | 2.58 ± 0.09 | 0.0745 |
| SAFA | 22.4 ± 0.29 | 22.6 ± 0.37 | 22.9 ± 0.16 | 23.1 ± 0.23 | 21.9 ± 0.37 | 0.0841 |
| 16:1n-7 | 5.01 ± 0.24 | 5.72 ± 0.26 | 5.89 ± 0.31 | 6.25 ± 0.45 * | 5.10 ± 0.16 | 0.0180 |
| 18:1n-9 | 18.7 ± 0.79 | 18.5 ± 0.65 | 19.8 ± 0.64 | 20.3 ± 1.11 | 19.5 ± 0.47 | 0.3076 |
| 18:1n-7 | 2.82 ± 0.04 | 2.84 ± 0.04 | 2.96 ± 0.07 | 2.84 ± 0.10 | 2.74 ± 0.06 | 0.3270 |
| 20:1n-9 | 3.68 ± 0.16 | 3.31 ± 0.18 | 3.39 ± 0.13 | 3.23 ± 0.14 | 3.29 ± 0.12 | 0.2598 |
| 22:1n-9 | 3.41 ± 0.17 | 2.92 ± 0.12 | 3.01 ± 0.12 | 2.84 ± 0.12 * | 2.91 ± 0.11 * | 0.0667 |
| 24:1 | 0.37 ± 0.02 | 0.29 ± 0.01 ** | 0.32 ± 0.01 | 0.31 ± 0.01 * | 0.31 ± 0.01 * | 0.0166 |
| MUFA | 34.4 ± 1.40 | 33.9 ± 1.19 | 35.7 ± 1.18 | 36.1 ± 1.91 | 34.2 ± 0.83 | 0.6093 |
| 18:2n-6 | 5.32 ± 0.18 | 5.18 ± 0.11 | 5.80 ± 0.15 | 5.20 ± 0.20 | 6.88 ± 0.22 *** | <0.0001 |
| 18:3n-6 | 0.10 ± 0.01 | 0.10 ± 0.01 | 0.14 ± 0.00 * | 0.14 ± 0.01 * | 0.26 ± 0.01 *** | <0.0001 |
| 20:2n-6 | 0.26 ± 0.01 | 0.27 ± 0.01 | 0.27 ± 0.01 | 0.27 ± 0.01 | 0.29 ± 0.01 | 0.2508 |
| 20:3n-6 | 0.17 ± 0.00 | 0.16 ± 0.00 | 0.21 ± 0.01 *** | 0.23 ± 0.00 *** | 0.25 ± 0.01 *** | <0.0001 |
| 20:4n-6 | 0.72 ± 0.03 | 0.77 ± 0.03 | 0.74 ± 0.03 | 0.75 ± 0.05 | 0.77 ± 0.02 | 0.4817 |
| n-6 PUFA | 6.56 ± 0.17 | 6.44 ± 0.10 | 7.16 ± 0.13 * | 6.56 ± 0.17 | 8.46 ± 0.23 *** | <0.0001 |
| 18:3n-3 | 1.57 ± 0.06 | 1.47 ± 0.04 | 1.58 ± 0.07 | 1.43 ± 0.06 | 1.54 ± 0.06 | 0.4802 |
| 18:4n-3 | 0.99 ± 0.13 | 1.44 ± 0.04 | 1.39 ± 0.12 | 1.09 ± 0.14 | 1.18 ± 0.16 | 0.0691 |
| 20:5n-3 | 9.30 ± 0.23 | 9.51 ± 0.35 | 9.10 ± 0.18 | 8.59 ± 0.30 | 9.08 ± 0.24 | 0.2255 |
| 22:5n-3 | 1.90 ± 0.03 | 1.99 ± 0.05 | 1.90 ± 0.05 | 1.82 ± 0.05 | 1.73 ± 0.02 * | 0.0015 |
| 22:6n-3 | 22.9 ± 1.29 | 22.6 ± 1.07 | 22.9 ± 1.30 | 21.3 ± 1.66 | 21.9 ± 0.87 | 0.6179 |
| n-3 PUFA | 36.7 ± 1.46 | 37.1 ± 1.37 | 34.3 ± 1.21 | 34.3 ± 1.87 | 35.5 ± 1.03 | 0.4812 |
| PUFA | 43.3 ± 1.34 | 43.5 ± 1.33 | 41.5 ± 1.09 | 40.8 ± 1.74 | 43.9 ± 0.91 | 0.3529 |
| n-3/n-6 | 5.66 ± 0.35 | 5.78 ± 0.26 | 4.83 ± 0.25 | 5.31 ± 0.42 | 4.23 ± 0.21 ** | 0.0051 |
© 2019 by the authors. Licensee MDPI, Basel, Switzerland. This article is an open access article distributed under the terms and conditions of the Creative Commons Attribution (CC BY) license (http://creativecommons.org/licenses/by/4.0/).
Share and Cite
Wagner, L.; Gómez-Requeni, P.; Moazzami, A.A.; Lundh, T.; Vidakovic, A.; Langeland, M.; Kiessling, A.; Pickova, J. 1H NMR-Based Metabolomics and Lipid Analyses Revealed the Effect of Dietary Replacement of Microbial Extracts or Mussel Meal with Fish Meal to Arctic Charr (Salvelinus alpinus). Fishes 2019, 4, 46. https://doi.org/10.3390/fishes4030046
Wagner L, Gómez-Requeni P, Moazzami AA, Lundh T, Vidakovic A, Langeland M, Kiessling A, Pickova J. 1H NMR-Based Metabolomics and Lipid Analyses Revealed the Effect of Dietary Replacement of Microbial Extracts or Mussel Meal with Fish Meal to Arctic Charr (Salvelinus alpinus). Fishes. 2019; 4(3):46. https://doi.org/10.3390/fishes4030046
Chicago/Turabian StyleWagner, Liane, Pedro Gómez-Requeni, Ali A. Moazzami, Torbjörn Lundh, Aleksandar Vidakovic, Markus Langeland, Anders Kiessling, and Jana Pickova. 2019. "1H NMR-Based Metabolomics and Lipid Analyses Revealed the Effect of Dietary Replacement of Microbial Extracts or Mussel Meal with Fish Meal to Arctic Charr (Salvelinus alpinus)" Fishes 4, no. 3: 46. https://doi.org/10.3390/fishes4030046
APA StyleWagner, L., Gómez-Requeni, P., Moazzami, A. A., Lundh, T., Vidakovic, A., Langeland, M., Kiessling, A., & Pickova, J. (2019). 1H NMR-Based Metabolomics and Lipid Analyses Revealed the Effect of Dietary Replacement of Microbial Extracts or Mussel Meal with Fish Meal to Arctic Charr (Salvelinus alpinus). Fishes, 4(3), 46. https://doi.org/10.3390/fishes4030046