Article

Diversity Analysis of Microbial Communities in Shrimp Polyculture Ponds in Coastal Saline–Alkali Regions of Hebei, China

1
College of Marine Science and Fisheries, Jiangsu Ocean University, Lianyungang 222005, China
2
State Key Laboratory of Mariculture Biobreeding and Sustainable Goods, Yellow Sea Fisheries Research Institute, Chinese Academy of Fishery Sciences, Qingdao 266071, China
3
Laboratory for Marine Fisheries Science and Food Production Processes, Qingdao Marine Science and Technology Center, Qingdao 266237, China
4
College of Fisheries and Life Science, Shanghai Ocean University, Shanghai 201306, China
*
Author to whom correspondence should be addressed.
Fishes 2025, 10(9), 433; https://doi.org/10.3390/fishes10090433
Submission received: 17 July 2025 / Revised: 16 August 2025 / Accepted: 26 August 2025 / Published: 2 September 2025
(This article belongs to the Section Sustainable Aquaculture)

Abstract

To investigate the structure and successional dynamics of microbial communities in shrimp culture ponds in coastal saline–alkali regions of Hebei, China, we compared the water microbiota of Litopenaeus vannamei monoculture ponds and L. vannameiMacrobrachium rosenbergii polyculture ponds in the early, mid, and late culture stages. The results revealed clear temporal succession patterns in both the diversity and composition of microeukaryotic and bacterial communities. Distinct differences were also observed between the two culture models. Compared with monoculture, polyculture ponds showed 2.23–34.76% lower abundances of parasitic microeukaryotes, such as Rozellomycota and Perkinsida. In contrast, the abundances of carbon- and nitrogen-cycling bacterial groups (e.g., LD29, CL500-29_marine_group) and Chlorophyta were 0.24–50.94% higher in the polyculture system. Co-occurrence network analysis showed that polyculture enhanced competitive interactions and increased the network structural complexity within bacterial and cross-domain microbial networks. These findings help elucidate the mechanisms underlying efficient shrimp production in saline–alkali ponds and support the optimization of aquaculture models.
Key Contribution: This study reveals the temporal dynamics of microbial communities in saline–alkali shrimp ponds and the effects of polyculture on their structures, offering new insights for optimizing sustainable aquaculture.

1. Introduction

China has an estimated 99.13 million hectares of saline–alkali land spanning 19 provincial regions [1]. It is unsuitable for common agricultural irrigation due to its increased alkalinity, high pH, and complex ionic composition. Therefore, how to efficiently exploit these salt–alkali land resources remains an important issue to be addressed [2]. In recent years, aquaculture has been considered an innovative and sustainable strategy for exploiting salt–alkali land resources, since it can mitigate the salinity and alkalinity in the soil through biological activity processes known as desalination and dealkalization [3].
The Pacific whiteleg shrimp (Litopenaeus vannamei) is a predominant species in global aquaculture due to its fast growth and resilience. It is native to the western Pacific coast of Latin America and was introduced into China at the end of the 1990s. In 2023, the total production of L. vannamei reared in marine water reached 1.4 million tons; 0.8 million tons of shrimp were also reared in inland freshwater, including on salt–alkali land in China [4]. L. vannamei exhibits euryhaline characteristics, tolerating salinity levels between 0.5 and 45 ppt [5]; however, salinity in the range of 15–25 is considered ideal [6]. To date, the culture of L. vannamei in inland areas has been successfully performed in Thailand, Ecuador, the US, and China, where the salinity of pond water is lower than 5 [7]. The giant freshwater prawn Macrobrachium rosenbergii has a wide distribution and is most favored for farming in tropical and subtropical areas of the world; adult M. rosenbergii can tolerate salinity ranging from 0 to 25 [8]. M. rosenbergii exhibits omnivorous feeding behaviour, a benthic and nocturnal lifestyle, and strong disease resistance, although their growth rate is slower and overall yield is lower [9]. Given their compatible ecological niches and complementary behaviours, co-culturing a small number of M. rosenbergii in L. vannamei ponds has been shown to improve space utilization, enhance material and energy cycling, and significantly increase the economic benefits [9,10,11]. Several local studies have also shown that stocking M. rosenbergii can improve water quality stability [12], enhance nutrient cycling–related microbial functions [13], and increase the abundance of beneficial gut bacteria in polyculturedspecies such as mitten crabs [14].
Microorganisms are integral components of aquaculture ecosystems, playing essential roles in biogeochemical cycling, energy flow, disease, and ecosystem homeostasis [15,16]. Bacteria and microeukaryotes are important components of microorganisms. Bacterial communities are particularly important in carbon and nitrogen cycling and the degradation of organic matter, thereby contributing to water quality regulation [17]. Microeukaryotes, including primary producers (e.g., algae), decomposers (e.g., fungi), and parasites, also fulfil diverse and critical ecological functions in aquaculture environments [18]. Moreover, complex inter-domain interactions between bacteria and microeukaryotes are essential for maintaining the structural and functional stability of aquatic ecosystems. Despite their importance, studies on microbial communities in saline–alkali aquaculture systems remain limited [19], and there are virtually no investigations into microeukaryotic assemblages in such environments.
This study investigated the microbial communities in monoculture ponds of L. vannamei and polyculture ponds of L. vannamei with M. rosenbergii. The aim was to clarify the differences between the two pond culture modes and the temporal dynamics of bacterial and microeukaryotic assemblages across early, middle, and late stages. These two models were selected because L. vannamei culture was the primary focus of this study, with M. rosenbergii included only as a complementary species in the polyculture system to evaluate its potential ecological effects. We hypothesized that (i) the microbial community structure in saline–alkali shrimp ponds would undergo significant stage–specific shifts across the culture period, and (ii) the polyculture model would support communities distinct from those in monoculture, particularly in diversity and species composition. These findings will provide microbiology-based theoretical support for optimizing aquaculture in saline–alkali pond ecosystems.

2. Materials and Methods

2.1. Basic Aquaculture Details

This experiment was conducted at the Haiyimokang Saline–Alkali Aquaculture Base in Tengzhuangzi Town, Huanghua, Cangzhou (38.36° N, 117.17° E). A total of four experimental ponds were used, covering an area of approximately 20 hectares. The ponds were stocked on 1 May 2024 and harvested on 31 October 2024.
In the L. vannamei monoculture ponds (N), the stocking density was approximately 24 ind/m2. In the polyculture ponds (H), L. vannamei and M. rosenbergii were stocked at densities of approximately 18 ind/m2 and 6 ind/m2, respectively. Each pond culture mode was set up in duplicate. Commercial feed was used and administered twice daily, in the morning and evening. No water exchange with external sources occurred during the culture period.
Throughout the culture cycle, key water quality parameters showed no marked differences between the two culture models at any stage. Salinity ranged from 3.15 to 3.66, pH from 8.78 to 9.20, temperature ranged from 15.68 to 29.55 °C, and dissolved oxygen from 4.10 to 11.25 mg/L.

2.2. Sample Collection and Processing

Water samples were collected during the early (June), middle (August), and late (October) culture stages. For each pond, samples were taken from three points along the diagonal, at a depth of 0–30 cm below the water surface. Samples from the six sites with the same culture model (two ponds per model) were pooled and homogenized to minimize small-scale spatial variation. Each pooled sample was then evenly divided into two portions: one was filtered through 0.22 μm pore-size membranes (47 mm diameter, China) for microbial community analysis, and the other was used for water quality measurements. Water temperature, dissolved oxygen (DO), pH, and salinity were measured on site using portable multi-parameter meters, while nutrient parameters, including ammonium nitrogen (NH4+–N), nitrite nitrogen (NO2–N), nitrate nitrogen (NO3–N), phosphate (PO43−–P), total nitrogen (TN), and total phosphorus (TP) were determined following standard analytical methods. The filtered samples for microbial analysis were sent to Majorbio Bio-Pharm Technology Co., Ltd. (Shanghai, China), for high-throughput sequencing.

2.3. DNA Extraction and Illumina Sequencing

DNA was isolated with an E.Z.N.A.® Soil DNA Kit (Omega Bio-Tek, Norcross, GA, USA), following the manufacturer’s protocol. Sterile water was extracted alongside samples as a blank control during DNA extraction to monitor potential contamination. For bacterial communities, the V3–V4 region of the 16S rRNA gene was amplified using the primers 338F (5′-ACTCCTACGGGAGGCAGCAG-3′) and 806R (5′-GGACTACHVGGGTWTCTAAT-3′). Microeukaryotic communities were targeted by amplifying the V4 region of the 18S rRNA gene with the primers TAReuk454FWD1F (5′-CCAGCASCYGCGGTAATTCC-3′) and TAReukREV3R (5′-ACTTTCGTTCTTGATYRA-3′). Negative controls were included during PCR amplification, and no amplification was observed. The Polymerase Chain Reaction (PCR) conditions were consistent with those of C. Wang et al. [20]. The amplified products were excised from agarose gels and purified using an AxyPrep DNA Gel Extraction Kit (Axygen Biosciences, Union City, CA, USA), as per the manufacturer’s instructions. DNA concentrations were measured with a Qubit 4.0 fluorometer (Thermo Fisher Scientific, Waltham, MA, USA), and sequencing was carried out on the Illumina NextSeq 2000 platform (Illumina, San Diego, CA, USA).

2.4. Data Analysis

Paired-end reads were joined using FLASH version 1.2.11. Clustering of operational taxonomic units (OTUs) was performed at 97% sequence similarity with Uparse version 7.1. Taxonomic classification was performed with the RDP Classifier version 2.11, referencing the SILVA 138.2 database for bacterial 16S rRNA gene sequences and the Protist Ribosomal Reference (PR2) database version 5.0.1 for microeukaryotic (18S rRNA) data. Alpha diversity metrics, including the ACE, Chao1, Shannon, and Simpson indices, were calculated in Mothur version 1.30.1 and compared between the monoculture and polyculture groups within the same culture stage using independent-sample t-tests. Principal coordinate analysis (PCoA) based on Bray–Curtis distances was used to assess differences in community composition, while analysis of similarities (ANOSIM) was performed to test the significance of group differences. Redundancy analysis (RDA) was performed to relate community variation to environmental variables after removing highly collinear factors (variance inflation factor, VIF > 10). Spearman correlation analysis (|r| > 0.8, p < 0.05) was applied to construct bacterial, microeukaryotic, and bacterial–microeukaryotic co-occurrence networks. Network visualization was performed using R version 4.4.2 and Gephi version 0.10.1.

3. Results

3.1. Diversity Analysis of Microeukaryotic and Bacterial Communities in Aquatic Environments

A total of 3558 OTUs of bacteria and 1049 OTUs of microeukaryotes were identified at a 97% similarity threshold. Based on taxonomic annotation and sequence alignment, 947 bacterial genera within 56 phyla and 394 microeukaryotic genera within 37 phyla were detected, respectively. The number of high-quality sequences retained after quality control for each sample is shown in Table S1.
Table 1 and Table S2 present the diversity and richness indices (ACE, Chao1, Shannon, and Simpson) of microeukaryotic and bacterial communities in the monoculture and polyculture ponds across different culture stages. As the culture period progressed, the ACE, Chao1, and Shannon indices of microeukaryotic and bacterial communities in both groups showed a significant decreasing trend (p < 0.05) (Table S2).
Further comparisons of α-diversity between the two groups revealed that, in microeukaryotic communities, the monoculture group had significantly higher ACE, Chao1, and Shannon indices than the polyculture group in the early stage, while the Shannon index was significantly higher in the polyculture group than in the monoculture group in the late stage (p < 0.05). For bacterial communities, the polyculture group exhibited significantly higher ACE, Chao1, and Shannon indices than the monoculture group in the middle stage (p < 0.05).
These results indicate that both the diversity and richness of microeukaryotic and bacterial communities declined over time, with significant differences observed between the two groups at different stages of the culture period.
The PCoA results (Figure 1) demonstrated that the microeukaryotic community structures differed significantly between the monoculture and polyculture groups (R = 0.405, p = 0.002). In contrast, no significant difference was observed in the bacterial communities between the two groups (R = −0.088, p = 0.885). Additional PCoA analyses based on culture stage (early, middle, and late) revealed significant temporal differentiation (p < 0.05) in both microeukaryotic and bacterial communities (Figure S1), with early-stage samples clearly separated in microeukaryotes and all three stages distinct in bacteria, indicating that temporal dynamics are key drivers of community variation.

3.2. Composition Analysis of Microeukaryotic and Bacterial Communities in Aquatic Environments

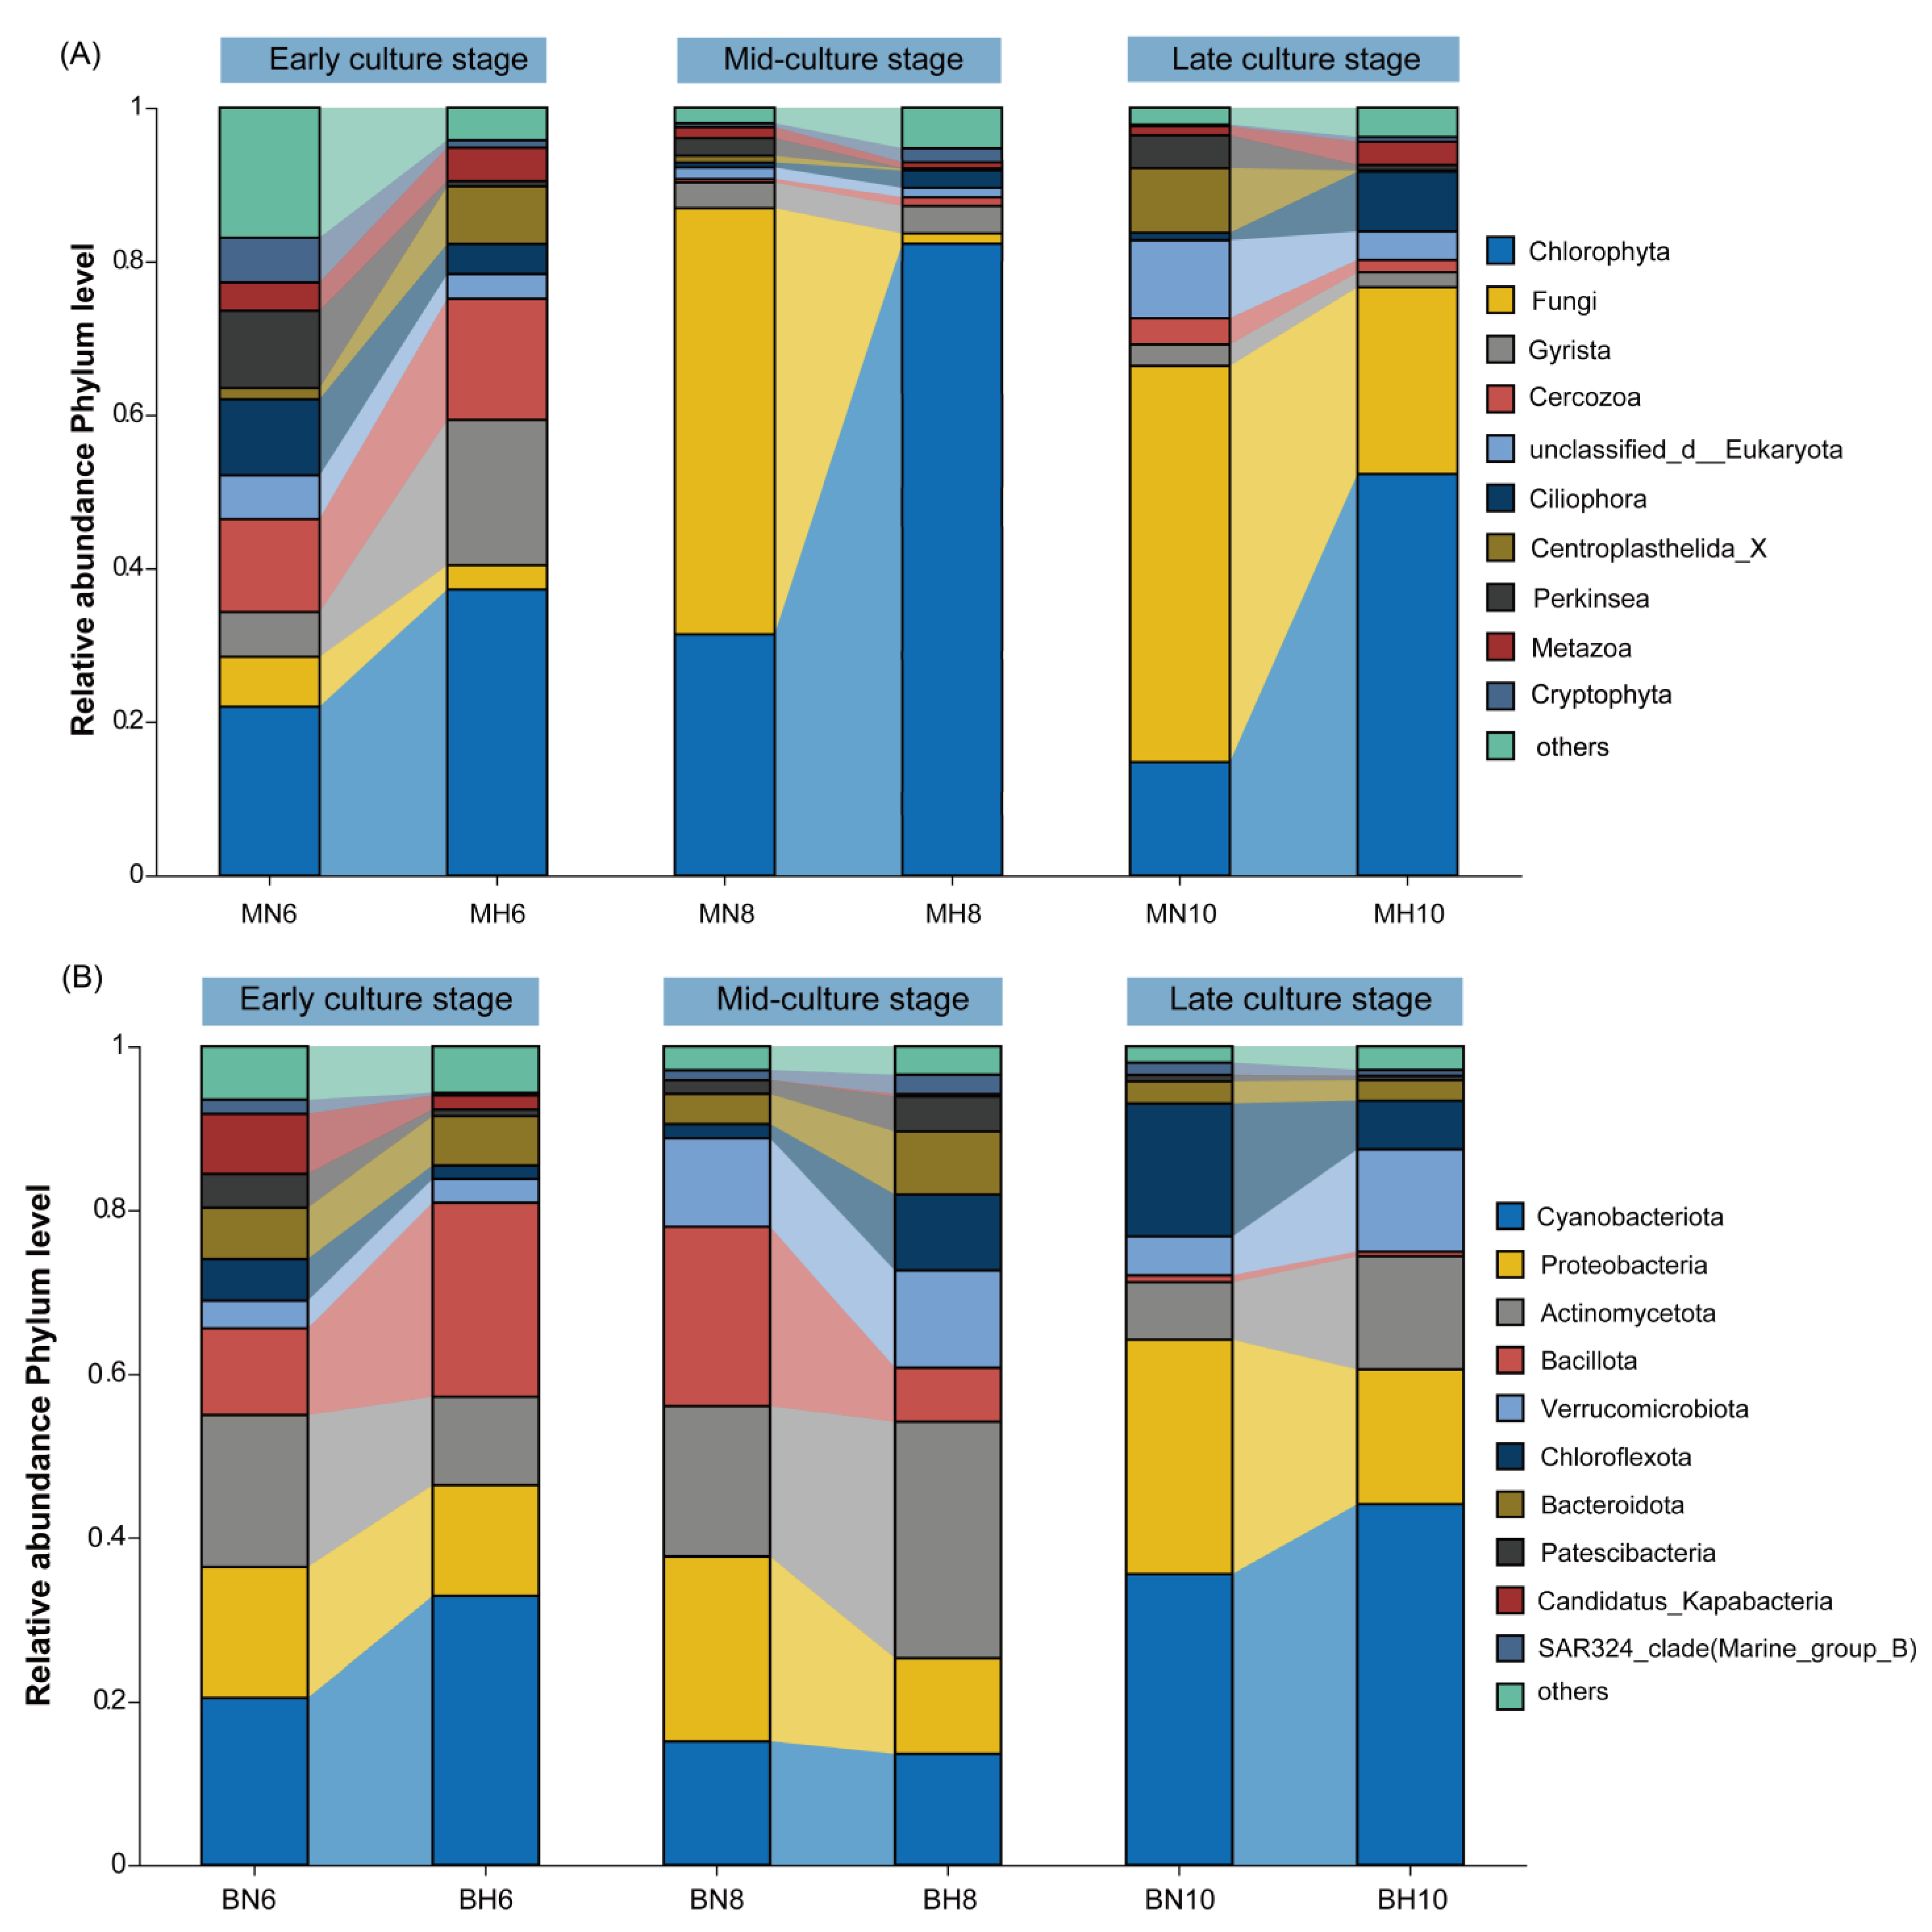
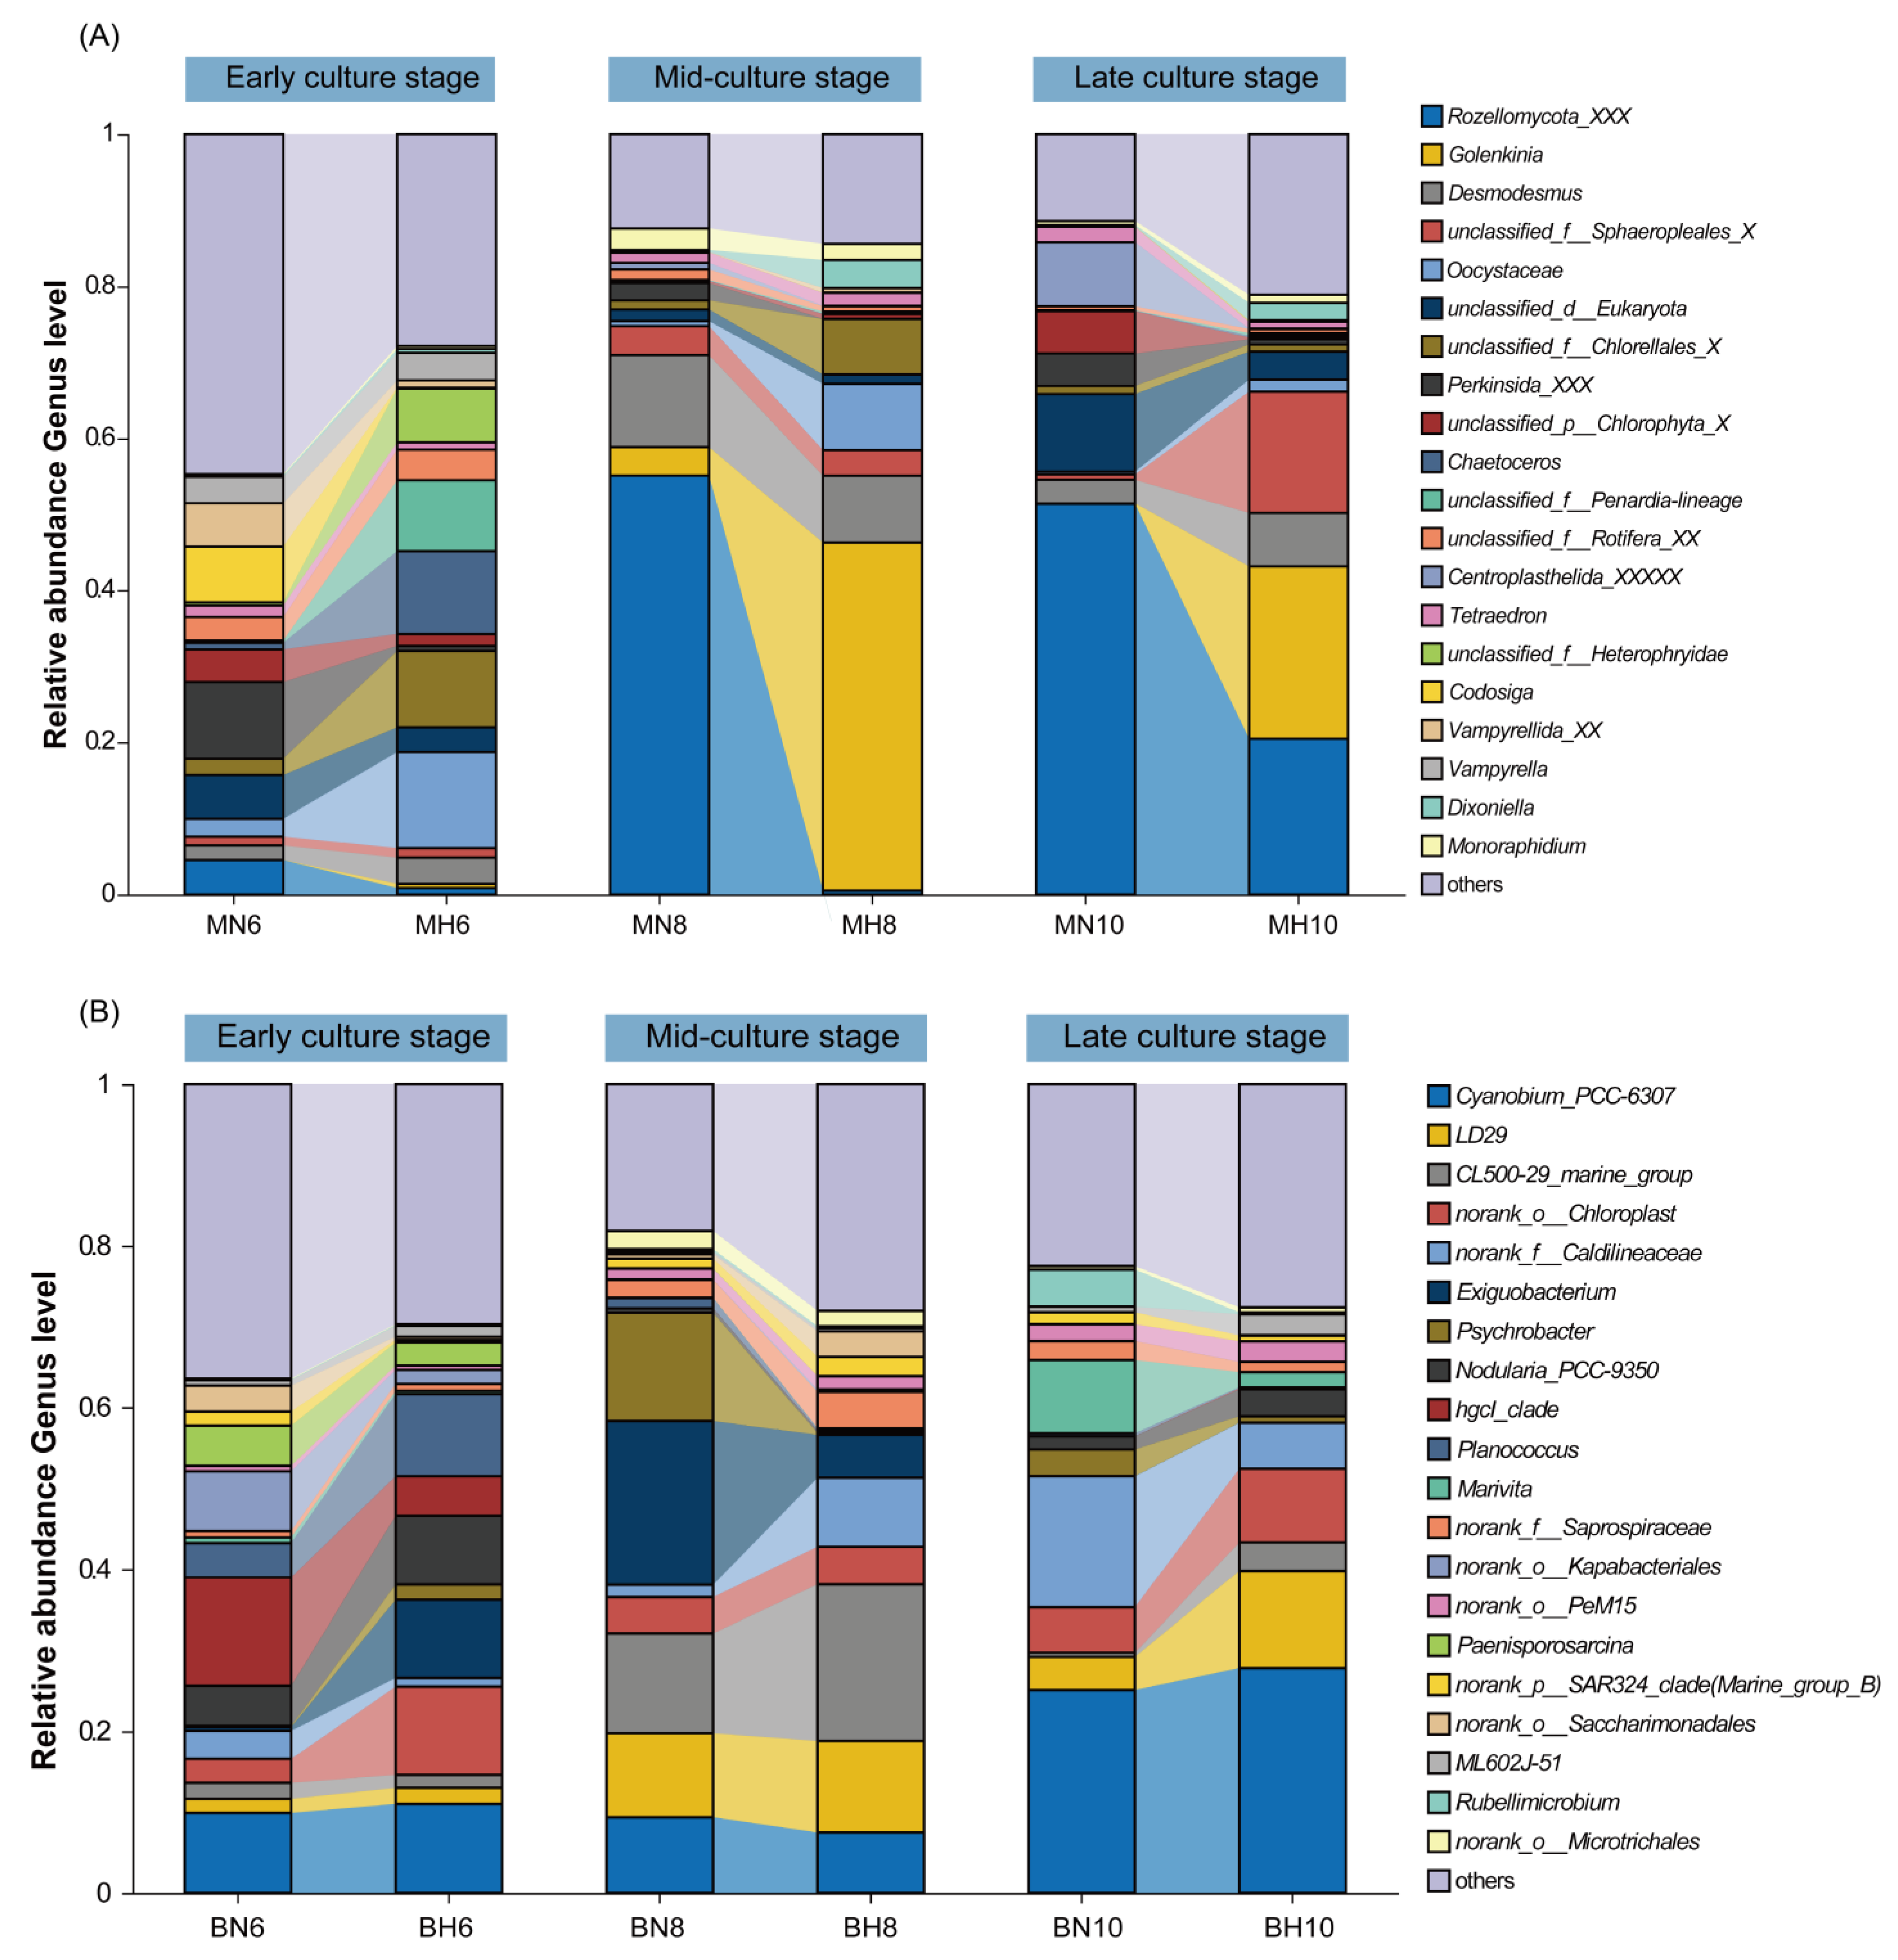
Taxa in Figure 2 and Figure 3 were selected based on average relative abundance, with the top 10 phyla and top 20 genera shown for each group. At the phylum level, the dominant phyla of microeukaryotic communities were Chlorophyta and Fungi (Figure 2A), while those of bacterial communities were Cyanobacteria, Proteobacteria, and Actinobacteriota (Figure 2B).
In the microeukaryotic communities, the dominant phyla in the two groups showed different trends over the culture period. In the monoculture group, the relative abundance of Fungi increased from 6.50% in the early stage to 51.62% in the late stage. In the polyculture group, Chlorophyta was the dominant phylum, with its abundance rising from 37.23% in the early stage to 82.30% in the middle stage and declining to 52.25% in the late stage. Further comparison of the dominant phyla between the two groups revealed significant differences in the abundances of Fungi, Perkinsea, and Chlorophyta (p < 0.05). Fungi exhibited a relative abundance range of 6.50–51.62% in the monoculture group, significantly higher than 1.29–24.36% in the polyculture group. Perkinsea showed a relative abundance of 2.28–10.07% in the monoculture group, significantly higher than 0.03–0.69% in the polyculture group. Chlorophyta displayed a relative abundance of 37.23–82.30% in the polyculture group, significantly higher than 14.72–31.36% in the monoculture group (p < 0.05).
In the bacterial communities, both groups exhibited similar overall trends in dominant phyla over time. The relative abundance of Proteobacteria ranged from 15.94 to 28.64% in the monoculture group and from 11.68 to 16.45% in the polyculture group; Verrucomicrobiota ranged from 3.43 to 10.85% in the monoculture group and from 2.93 to 12.48% in the polyculture group; Bacteroidota ranged from 1.74 to 16.29% in the monoculture group and from 1.61 to 9.26% in the polyculture group; all showed fluctuating increases during culture. Further comparison of the dominant phyla between the two groups revealed significant differences in the abundances of Actinobacteriota, Planctomycetota, and Verrucomicrobiota (p < 0.05). Actinobacteriota exhibited a relative abundance of 13.87–28.88% in the polyculture group during the middle and late stages, significantly higher than 7.08–18.4% in the monoculture group. Planctomycetota showed a relative abundance of 4.26% in the polyculture group during the middle stage, significantly higher than 1.66% in the monoculture group. Verrucomicrobiota displayed a relative abundance of 12.48% in the polyculture group during the late stage, significantly higher than 4.70% in the monoculture group (p < 0.05).
At the genus level, the dominant genera of microeukaryotic communities were Rozellomycota_XXX, Golenkinia, Desmodesmus, unclassified_f__Sphaeropleales_X, and Oocystaceae (Figure 3A), while those of bacterial communities were Cyanobium_PCC-6307, LD29, CL500-29_marine_group, norank_o__Chloroplast, and norank_f__Caldilineaceae (Figure 3B).
In the microeukaryotic communities, the dominant genera in the two groups showed different trends over the culture period. In the monoculture group, the relative abundance of Rozellomycota_XXX increased from 4.53% in the early stage to 51.35% in the late stage. In the polyculture group, the Golenkinia abundance rose from 0.56% in the early stage to 22.67% in the late stage. Further comparison of the dominant genera between the two groups revealed significant differences in the abundances of Rozellomycota_XXX, Perkinsida_XXX, Golenkinia, and Oocystaceae (p < 0.05). Rozellomycota_XXX exhibited a relative abundance range of 4.53–55.16% in the monoculture group, significantly higher than 0.53–20.40% in the polyculture group. Perkinsida_XXX showed a relative abundance of 2.28–10.07% in the monoculture group, also higher than 0.03–0.69% in the polyculture group. Golenkinia displayed a relative abundance of 22.67–45.71% in the polyculture group during the middle and late stages, markedly higher than 0.07–3.74% in the monoculture group. Oocystaceae exhibited a relative abundance range of 1.58–8.69% in the polyculture group, significantly higher than 0.37–0.68% in the monoculture group (p < 0.05).
In the bacterial communities, both groups showed similar trends in the dominant genera over time. hgcI_clade was the dominant genus in the early stage, while the relative abundances of Cyanobium_PCC-6307, LD29, CL500-29_marine_group, norank_f__Caldilineaceae, and norank_f__Saprospiraceae increased significantly during the middle and late stages (p < 0.05). Further comparison of the dominant genera between the two groups revealed that the abundances of LD29, CL500-29_marine_group, and norank_o__Chloroplast were consistently higher in the polyculture group than in the monoculture group. LD29 exhibited a relative abundance of 2.00–11.95% in the polyculture group, higher than 1.76–10.38% in the monoculture group. CL500-29_marine_group showed a relative abundance of 1.57–19.31% in the polyculture group, higher than 0.51–12.36% in the monoculture group. norank_o__Chloroplast displayed a relative abundance of 0.47–10.94% in the polyculture group, also higher than 0.29–0.56% in the monoculture group.

3.3. Correlation Analysis Between Environmental Factors and Microbial Communities

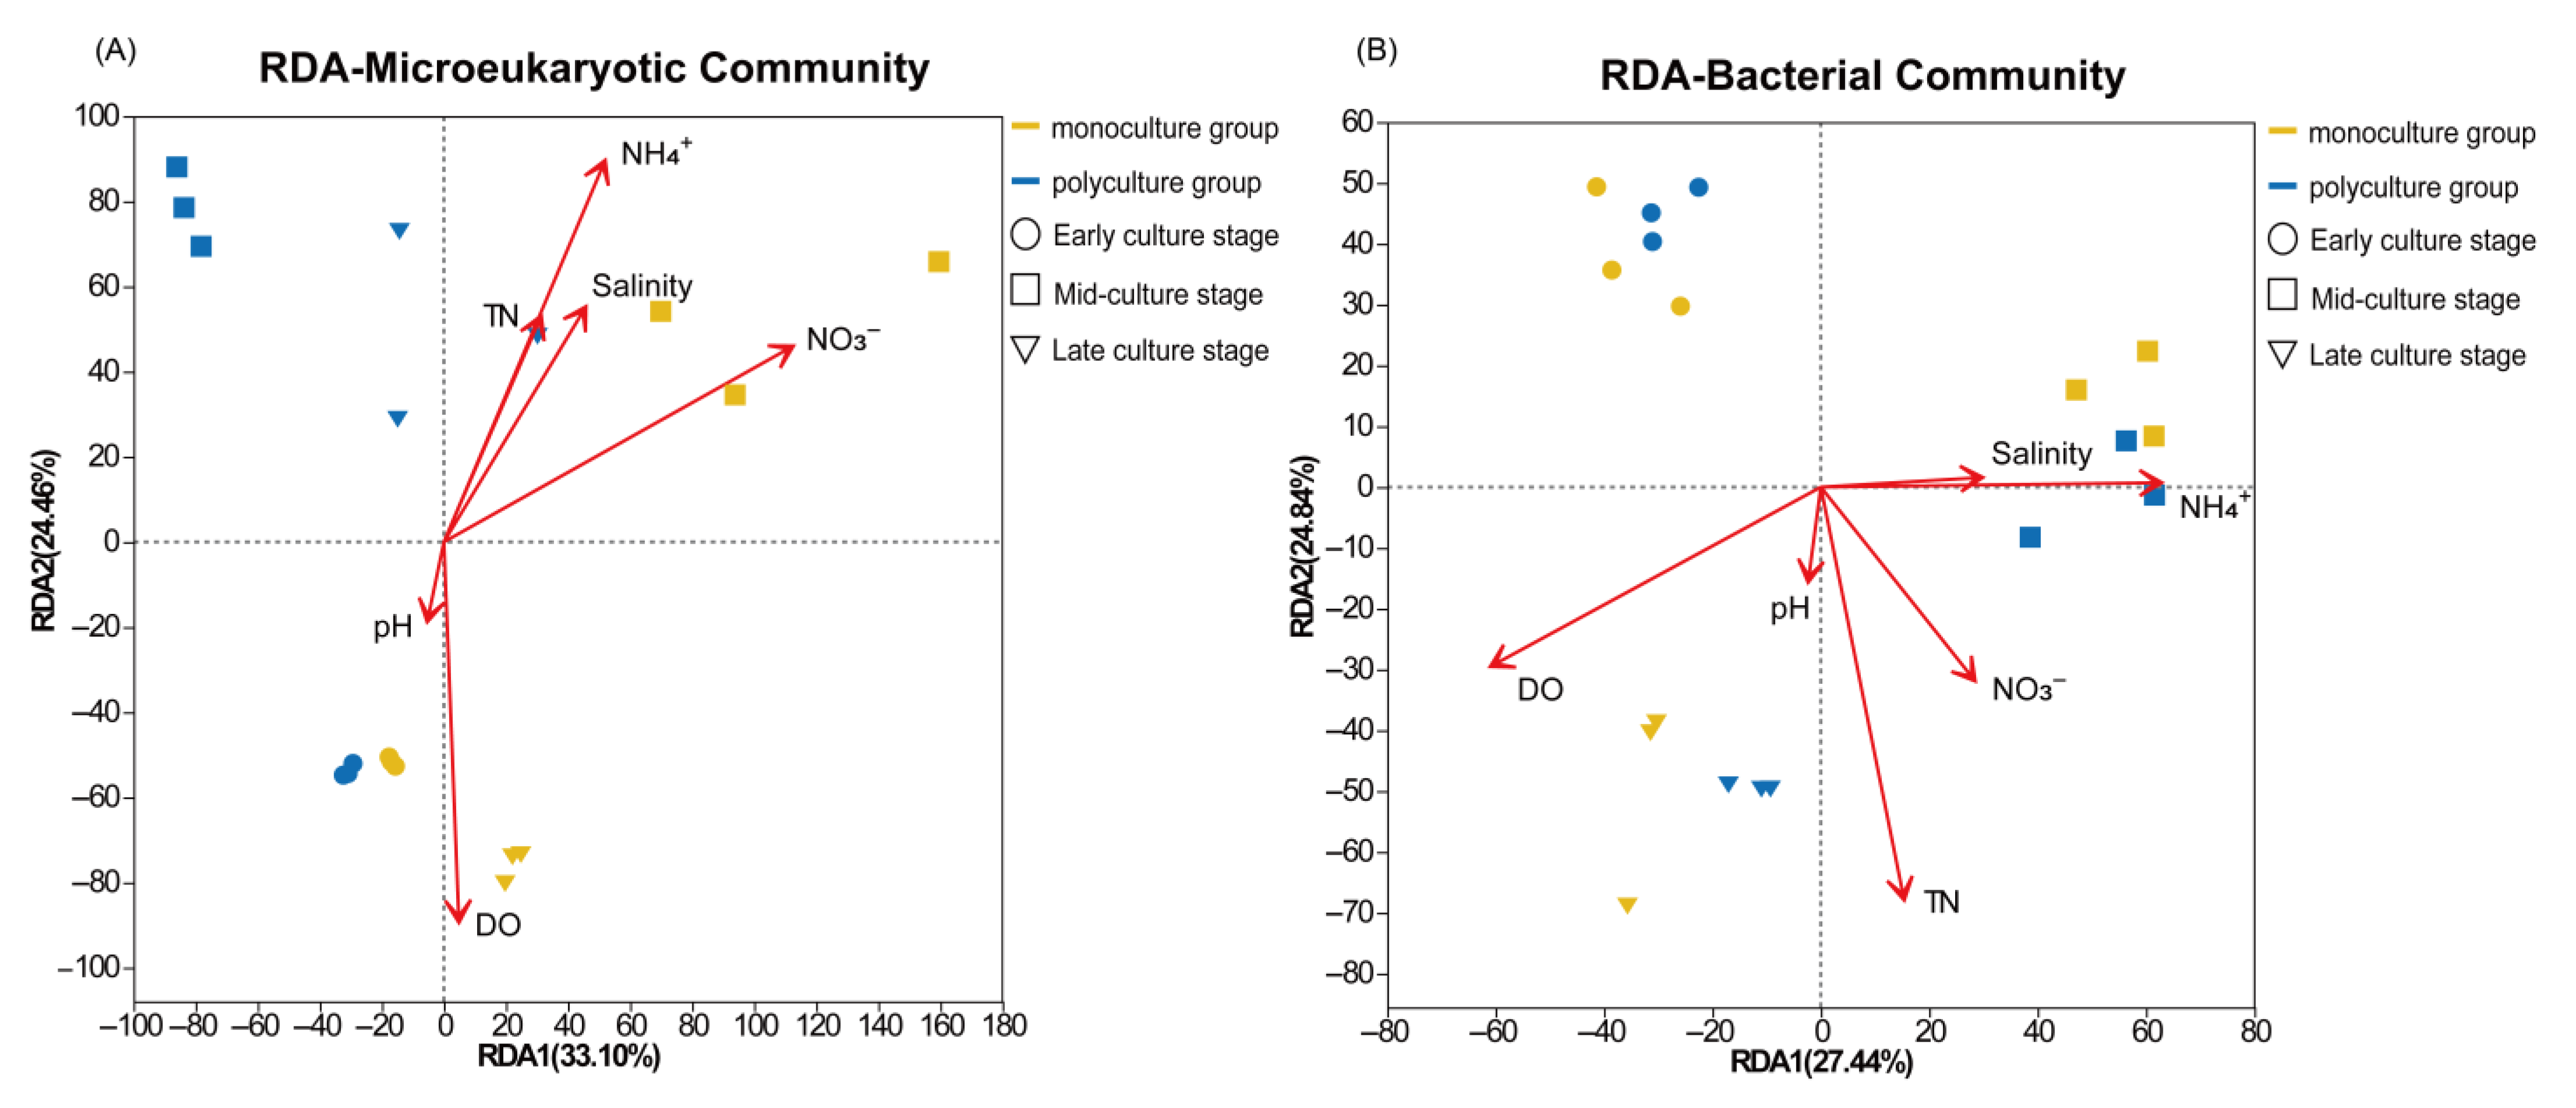
Redundancy analysis (RDA) showed that 57.7% of the variation in microeukaryotic communities could be explained by environmental factors (Figure 4A). Among them, DO (p = 0.023), NH4+-N (p = 0.006), and NO3-N (p = 0.001) were significantly correlated with the microeukaryotic communities (p < 0.05). In the early culture stage, microeukaryotic communities in both the monoculture and polyculture groups showed positive correlations with pH and DO. In the middle stage, the monoculture group exhibited a strong positive correlation with nitrate nitrogen and salinity, whereas the polyculture group showed weak associations with environmental factors. In the late stage, the polyculture group showed a negative correlation with DO, whereas the monoculture group exhibited the opposite trend. For bacterial communities, 52.28% of the variation could be explained by environmental factors (Figure 4B). Except for salinity (p = 0.261) and pH (p = 0.762), all other environmental factors were significantly associated with bacterial communities (p < 0.05). Notably, the bacterial communities in both the monoculture and polyculture groups responded similarly to environmental factors across the culture stages: showing negative correlations with nitrogen and phosphorus nutrients in the early stage; a strong positive correlation with ammonium nitrogen in the middle stage; and strong positive correlations with TN and DO in the late stage.

3.4. Co-Occurrence Network Analysis Between Monoculture and Polyculture Systems

The top 50 abundant genera were selected for separate co-occurrence network analyses of bacterial communities, microeukaryotic communities, and microeukaryote–bacteria communities. The results showed that the main taxa in the microeukaryotic co-occurrence network of the monoculture group (Figure S3A) were Chlorophyta, Cyrista, and Cercozoa. In the polyculture group (Figure S3B), Chlorophyta and Cyrista remained the two dominant taxa, while the contribution of Ciliophora increased. In the bacterial co-occurrence networks (Figure S3C,D), the main taxa in both groups were Proteobacteria, Actinobacteriota, and Cyanobacteria. In the microeukaryote–bacteria co-occurrence network, the monoculture group (Figure S3E) was dominated by Chlorophyta, Proteobacteria, and Cyanobacteria, while in the polyculture group (Figure S3F), Actinobacteriota replaced Cyanobacteria as a key cross-domain node and formed new interactive modules with Chlorophyta and Proteobacteria.
Correlation network topology analysis revealed clear structural differences between the monoculture and polyculture groups in the bacterial, microeukaryotic, and cross-domain co-occurrence networks. In the bacterial networks, the polyculture group showed higher values for the number of edges (287 vs. 197), proportion of negative correlations (51.9% vs. 31.5%), modularity (0.527 vs. 0.512), average degree (11.36 vs. 7.88), and average clustering coefficient (0.818 vs. 0.64) as compared to the monoculture group.
Similarly, in the cross-domain networks, the polyculture group exhibited higher edges (254 vs. 209), negative correlation proportion (49.2% vs. 46.4%), modularity (0.569 vs. 0.516), average degree (10.16 vs. 8.36), and average clustering coefficient (0.797 vs. 0.786), suggesting that polyculture enhanced the competition and increased the complexity of bacteria–microeukaryote interactions.
In contrast, the microeukaryotic networks of the polyculture group had fewer edges (185 vs. 226), a lower average degree (7.4 vs. 9.04), and a lower average clustering coefficient (0.582 vs. 0.642) than those of the monoculture group but exhibited higher modularity (0.520 vs. 0.399) and a longer average path length (2.697 vs. 1.887). This indicates a looser but potentially more disturbance-resistant community structure.
Notably, across all three networks, the polyculture group generally had a higher proportion of negative correlations than the monoculture group, whereas the latter was dominated by positive correlations. Consistent with these patterns, robustness tests further indicated that bacterial and cross-domain networks in the polyculture group maintained significantly higher structural integrity under simulated node loss, with the microeukaryotic network showing a similar but non-significant trend (Figure S4).

4. Discussion

4.1. Diversity Characteristics of Microeukaryotic and Bacterial Communities in the Water Column

Community diversity serves as a key indicator of ecosystem health and functional stability. In the present study, the α-diversity of both microeukaryotic and bacterial communities in saline–alkaline aquaculture ponds exhibited a declining trend over the course of the culture period (Table 1), consistent with previous research [21,22]. Romo et al. [22] demonstrated that elevated nutrient concentrations can ultimately lead to reduced phytoplankton diversity and species richness, which may also account for the decline in α-diversity observed in our study. Water quality monitoring showed late-stage increases in ammonium nitrogen, total nitrogen (3.89–4.01 mg/L), and total phosphorus (0.82–0.87 mg/L), exceeding typical shrimp pond levels and indicating eutrophication. This enrichment, mainly from uneaten feed, excreta, and organic debris, may shift microbial communities toward a few tolerant taxa, reducing α-diversity—a pattern also reported by Zhang et al. [23] in relation to TN and TP variation in long-term polyculture ponds. In addition to nutrient enrichment, the accumulation and decomposition of organic matter are also critical factors influencing water quality and microbial communities in aquaculture systems. Previous studies have shown that excessive organic matter increases BOD and decreases dissolved oxygen, thereby deteriorating water quality and ultimately affecting production [24,25]. Although these parameters were not directly measured in the present study, their potential importance suggests that future research should incorporate BOD and organic matter monitoring to provide a more comprehensive understanding of the environmental factors shaping microbial dynamics in aquaculture systems.
Furthermore, comparison between the two culture models revealed that in the mid and late culture stages, the polyculture group exhibited higher α-diversity indices (Shannon index) for both microeukaryotic and bacterial communities than the monoculture group. In the mid-stage, as M. rosenbergii grew larger, its bioturbation of the sediment likely enhanced nutrient redistribution and utilization, thereby promoting microbial diversity, which may explain the significantly higher bacterial α-diversity observed in the polyculture group (p < 0.05). However, in the late stage, α-diversity in both groups continued to decline, and the intensified eutrophication at this stage may have exerted a stronger influence on community structure than the positive effects of bioturbation, diminishing its contribution to diversity enhancement and resulting in no significant difference between groups.
PCoA (Figure 1) showed significant differences in microeukaryotic communities between culture models (p < 0.05) but not in bacterial communities (p > 0.05), indicating a stronger effect on microeukaryotes. Stage-based PCoA (Figure S1) revealed clear temporal shifts in both communities, consistent with the continuous succession typical of aquaculture systems [26], likely driven by changing environmental conditions, nutrient cycling, and biotic interactions such as parasitism and grazing.

4.2. Composition Characteristics of Microeukaryotic and Bacterial Communities in the Water Column

Taxonomic analysis of the microeukaryotic communities revealed that Chlorophyta and Fungi were the dominant phyla in the water column, consistent with previous findings [18,27]. In the mid and late culture stages, the relative abundance of Rozellomycota increased significantly in the monoculture group, whereas the Chlorophyta abundance was markedly elevated in the polyculture group. Rozellomycota remains relatively understudied; however, existing research indicates that all characterized members of this phylum are obligate endoparasites, commonly infecting motile fungi, oomycetes, and phytoplankton. Typical host taxa include Chytridiomycota, Blastocladiomycota, and Chlorophyta [28,29,30]. These parasitic organisms exhibit high host specificity and obtain nutrients via phagocytosis, typically leaving behind empty host cell walls [31]. Based on the observed abundance patterns, it is plausible that Rozellomycota in this study parasitized Chlorophyta such as Golenkinia and members of Oocystaceae, leading to substantial algal mortality and a consequent decline in Chlorophyta abundance in the monoculture system. Such parasitism may adversely affect the algal community structure.
Nevertheless, recent literature suggests that Rozellomycota may mediate carbon and energy transfer to higher trophic levels [32] and occur abundantly in biofilm systems, potentially influencing water purification processes [33]. While our data most directly support a parasitic role on certain green algae, these alternative functions warrant further investigation using microscopy, metagenomics, or transcriptomics.
In contrast, in the polyculture group, the presence of M. rosenbergii may have mitigated the proliferation of Rozellomycota through selective predation on infected algal cells. This likely contributed to a more stable and abundant green algal community. Rozellomycota are known obligate parasites of green algae and other hosts, and previous studies have shown that M. rosenbergii is an omnivorous benthic species capable of consuming algae, associated detritus, and other benthic organisms, providing a plausible mechanism for this effect. In addition to the parasitism-based explanation, other ecological processes may also have contributed. For example, nutrient partitioning caused by M. rosenbergii bioturbation could enhance nutrient recycling and stimulate the growth of fast-growing Chlorophyta. Meanwhile, selective grazing by shrimp or associated zooplankton on fungal spores or infected cells might have further supported the dominance of healthy algal populations [34]. The persistence of Chlorophyta-dominated communities provides multiple ecological advantages within aquaculture systems. As highlighted by Tao et al. [35], maintaining a stable aquatic environment is essential for successful aquaculture. Chlorophyta assimilate substantial nitrogen, improving water quality, and serve as nutrient-rich supplementary feed for shrimp, providing essential proteins, fatty acids, and vitamins for growth [36]. Moreover, certain lineages within Rozellomycota, particularly Microsporidia, are known pathogens of aquatic animals, including shrimp and crabs, and are associated with severe disease outbreaks in aquaculture systems [37,38]. It is also noteworthy that Perkinsida maintained consistently higher abundance in the monoculture group throughout the culture period. This taxon is recognized for its ecological invasiveness and pathogenic potential, with documented infections in dinoflagellates, fish, and mollusks that can lead to significant shellfish mortality [39,40]. In line with these findings, the lower abundance of eukaryotic parasites observed in the polyculture group of the present study suggests a reduced risk of disease transmission and enhanced system health.
In this study, the dominant bacterial phyla in the water column were Cyanobacteria, Proteobacteria, Actinobacteriota, Verrucomicrobiota, and Firmicutes, consistent with findings reported in previous studies [19,41]. At the genus level, the predominant taxa included Cyanobium_PCC-6307, LD29, CL500-29_marine_group, norank_o__Chloroplast, and norank_f__Caldilineaceae. Compared to microeukaryotes, the bacterial community exhibited more pronounced temporal dynamics.
In the early stage of the culture period, the relative abundance of hgcI_clade was relatively high. Previous research has indicated that hgcI_clade has adapted to oligotrophic freshwater environments [42] and plays a critical role in maintaining water quality stability during the initial phases of aquaculture.
LD29 and CL500-29_marine_group were among the dominant taxa in the mid and late culture stages, with higher relative abundances observed in the polyculture group. Correlation analyses revealed that LD29 was significantly positively correlated with TN, NH4+, and NO3, while CL500-29_marine_group was significantly positively correlated with NH4+ (Figure S2). These nitrogen-related parameters indicate nutrient-enriched conditions, and such positive associations suggest that these taxa may actively utilize elevated nitrogen pools. LD29, belonging to the Verrucomicrobia phylum, has been documented to degrade complex organic carbon sources and often increases in nitrogen-rich environments [43]. CL500-29_marine_group has been demonstrated to possess an ammonia-oxidizing capacity and efficiently assimilates both carbohydrates and nitrogenous organic compounds, thereby playing a vital role in carbon and nitrogen cycling in aquaculture ecosystems [44]. The potential synergistic interactions between these two taxa may enhance the carbon and nitrogen cycling efficiency of polyculture systems, although their specific ecological functions and relative contributions require further investigation.
Additionally, norank_f__Caldilineaceae and norank_f__Saprospiraceae, recognized as denitrifying bacterial groups [45,46,47], showed significantly higher abundances in the mid and late culture stages, indicating heightened denitrification activity in the latter stages of the aquaculture period. We monitored chlorophyll-a (Chl-a) concentrations at each culture stage. In the monoculture group, Chl-a ranged from 0.03 to 0.08 mg/L, while in the polyculture group, it ranged from 0.04 to 0.12 mg/L, with both groups showing an increasing trend toward the late culture stage. This pattern coincided with a relatively high abundance of Cyanobium_PCC-6307 in the late stage. As a widespread freshwater cyanobacterium, Cyanobium_PCC-6307 has the potential to proliferate excessively, triggering algal blooms and posing ecological risks to aquaculture species [48,49]. These findings highlight the need for targeted monitoring and control strategies, particularly during the late stage of culture.

4.3. Correlation Analysis of Environmental Factors

Environmental factors are known to play a crucial role in shaping the microbial community composition [50,51]. In this study, correlation analyses revealed that environmental variables accounted for a greater proportion of variation in the microeukaryotic community than in the bacterial community. This may be attributed to the higher sensitivity of certain microeukaryotic taxa to environmental fluctuations, rendering them more susceptible to external influences. In the early stage of aquaculture, environmental factors exerted similar influences on both the monoculture and polyculture groups. However, divergence in environmental influence became apparent in the mid andlate stages of culture. Specifically, in the mid stage, the nitrate concentration showed a strong positive correlation with the community structure in the monoculture group, whereas the polyculture group displayed only weak associations with environmental factors. This may be because the lower abundance of Chlorophyta in the monoculture system reduced nitrate assimilation, allowing nitrate to accumulate and favoring taxa adapted to nitrate-rich conditions.
Moreover, most environmental parameters exhibited significant correlations with the bacterial community composition, consistent with previous findings [52,53,54]. The bacterial assemblage displayed pronounced temporal dynamics, with distinct environmental drivers dominating at different stages of culture. For instance, Yu et al. [19] reported that planktonic bacterial communities were positively correlated with the water temperature and alkalinity in the initial 10 days of aquaculture, whereas after 20 days, they were more strongly associated with the nitrogen concentrations—findings that align with the temporal patterns observed in this study. Nitrogen and phosphorus are recognized as key environmental determinants of the aquatic microbial community structure [55,56]. In aquaculture systems, the accumulation of these nutrients—primarily derived from feed inputs and excretory waste—intensifies their influence on microbial community dynamics as the culture progresses. In addition, dissolved oxygen can regulate aerobic metabolic processes and influence nutrient cycling pathways that are sensitive to redox conditions, thereby shaping the relative abundance of functional groups [57].

4.4. Co-Occurrence Network Analysis

In this study, we constructed co-occurrence networks of microeukaryotes, bacteria, and cross-domain associations to illuminate microbial interaction patterns. The polyculture model significantly enhanced network complexity (number of edges, average degree, and modularity), suggesting more intricate interactions and resource-sharing pathways (Table 2). These changes may be partly attributed to bioturbation induced by M. rosenbergii, whose activity at the bottom of the water column promotes the degradation and resuspension of organic matter, thereby increasing resource transfer efficiency.
However, a distinct response pattern was observed in the microeukaryotic network. Although the polyculture group exhibited fewer edges, a lower average degree, and a lower network density, it had a higher modularity and longer average path length. Modularity describes how well a microbial network is divided into relatively independent modules. Higher modularity can localize disturbances within modules, while lower modularity may allow disturbances to spread more easily [58]. The average path length reflects the efficiency of information transmission across the network; a shorter path length indicates that information can quickly spread through the entire network, making the microbial community more susceptible to external disturbances [59]. In the monoculture group, parasitic microorganisms could affect the whole network in a shorter time, whereas in the polyculture group, the longer average path length may slow down the spread of parasitic organisms, thus reducing the potential risk of disease outbreaks. Moreover, the importance of Ciliophora increased in the microeukaryotic network of the polyculture group, which may be related to their key role in organic matter transformation [60].
Notably, across all three networks, the polyculture group generally had a higher proportion of negative correlations than the monoculture group, likely due to sediment disturbance and organic matter resuspension by M. rosenbergii, which can intensify competition among microbial groups. Such interactions may help limit the dominance of single taxa; however, if overly intense, they could suppress certain key functional groups, so a higher proportion of negative correlations is not inherently advantageous [61,62].
We also assessed network stability using robustness tests. The results showed that, under simulated node loss, bacterial and cross-domain networks in the polyculture group maintained significantly higher structural integrity than those in the monoculture group, while the microeukaryotic network displayed a similar but non-significant trend (Figure S4). Since robustness directly reflects a network’s tolerance to disturbance [63], the agreement between these results and the observed changes in negative correlation proportion, modularity, and average degree further supports the conclusion that the polyculture model reshaped microbial interactions and enhanced the system’s stability under environmental fluctuations.

5. Conclusions

Microeukaryotic and bacterial community diversity and composition between the monoculture pond of L. vannamei and the polyculture pond of L. vannamei and M. rosenbergii showed significant differences in a coastal saline-alkaline area. Moreover, the microbial communities exhibited significant succession patterns throughout the farming process. In terms of species composition, the polyculture group exhibited a marked reduction in the abundance of parasitic microeukaryotes such as Rozellomycota and Perkinsida, alongside a significant increase in beneficial Chlorophyta. In the bacterial community, the relative abundances of key functional taxa associated with carbon and nitrogen cycling, including LD29, CL500-29_marine_group, norank_f__Caldilineaceae, and norank_f__Saprospiraceae, increased substantially in the polyculture pond.
Environmental correlation analysis showed that dissolved oxygen, ammonium nitrogen, and nitrate were the main drivers shaping the microeukaryotic community, whereas bacterial communities were significantly influenced by dissolved oxygen, temperature, and nitrogen–phosphorus nutrients. Co-occurrence network analysis indicated that the bacterial and cross-domain microeukaryote–bacteria networks in the polyculture group were more complex than those in the monoculture group, implying stronger resource transfer efficiency and functional redundancy. Furthermore, the proportion of positive to negative interactions in the polyculture networks approached equilibrium, reflecting a healthier and more balanced ecological network structure. Collectively, these findings suggest that integrating a small number of M. rosenbergii into L. vannamei culture systems can effectively suppress the proliferation of parasitic microorganisms, thereby reducing the disease risk for L. vannamei. Additionally, this polyculture strategy enhances nutrient cycling and fosters a more stable and functionally diverse microbial network, ultimately contributing to the ecological balance and sustainability of aquaculture pond ecosystems.
When extrapolating these results to other systems or species, caution is warranted, as environmental conditions, farming practices, and species-specific feeding or behavioral traits may lead to different microbial responses. At commercial scales, this polyculture model could offer ecological and potential economic benefits, particularly by optimizing culture conditions and promoting nutrient cycling, provided that stocking ratios, feeding strategies, and disease management practices are optimized. From a management perspective, polyculture is currently one of the aquaculture models actively promoted in China due to its potential ecological and economic advantages, including improved water quality regulation, enhanced nutrient cycling, and reduced disease risk [64]. Based on our findings, successful application of this model requires careful optimization of species composition in combination with sound management practices, such as maintaining moderate nutrient inputs to prevent eutrophication and incorporating key microbial indicators into routine monitoring. These strategies could harness microbial community dynamics to promote more sustainable aquaculture production.

Supplementary Materials

The following supporting information can be downloaded at: https://www.mdpi.com/article/10.3390/fishes10090433/s1, Figure S1: PCoA plots based on different culture stages; Figure S2: Spearman correlations between dominant bacterial taxa and environmental factors; Figure S3: Microeukaryotic, bacterial, and cross-kingdom co-occurrence networks in monoculture and polyculture groups; Figure S4: Robustness analysis of microeukaryotic, bacterial, and cross-domain co-occurrence networks. Table S1: High-quality sequences per sample retained after quality control; Table S2: Alpha diversity indices of microeukaryotic and bacterial communities in monoculture (N) and polyculture (H) at different culture stages.

Author Contributions

E.S. and Z.C. (Zhiqiang Chang) designed the study. E.S. and S.Y. performed the experiment. E.S., H.G., Z.C. (Zhao Chen), and Z.C. (Zhiqiang Chang) analyzed the data. E.S., Z.C. (Zhao Chen), and Z.C. (Zhiqiang Chang) wrote the manuscript. All authors have read and agreed to the published version of the manuscript.

Funding

This research was funded by the National Key R&D Program of China (2023YFD2401704), the earmarked fund for China Agriculture Research System (CARS-48), and the Central Public-Interest Scientific Institution Basal Research Fund, CAFS (2023TD50).

Institutional Review Board Statement

Not applicable.

Informed Consent Statement

Not applicable.

Data Availability Statement

The original data presented in the study are openly available in the NCBI database under accession number PRJNA1290645.

Conflicts of Interest

The authors declare no conflicts of interest.

References

  1. Yang, J. Development and prospect of the research on salt-affected soils in China. Acta Pedol. Sin. 2008, 45, 837–845. [Google Scholar] [CrossRef]
  2. Wang, X.; Fang, W.; Liu, L.; Fu, Y.; Zhou, Y.; Zhou, D.; Huang, X.; Mu, C.; Wang, C. Molecular characterization and DNA methylation analysis of carbonic anhydrase (Sp-CA) in the mud crab Scylla paramamosain: Its potential osmoregulation role under carbonate alkalinity stress. Aquac. Rep. 2023, 30, 101591. [Google Scholar] [CrossRef]
  3. Zhao, G.; Yang, M.; Chen, S.; Su, J.; Lü, H.; Jia, H.; Liu, Z. Saline-alkali land management in China: Current situation, problems and prospects. J. Nanjing Agric. Univ. 2025, 48, 14–26. [Google Scholar] [CrossRef]
  4. Fishery Administration Bureau of the Ministry of Agriculture and Rural Affairs. 2024 China Fishery Statistical Yearbook; China Agriculture Press: Beijing, China, 2024.
  5. Wyban, J.; Sweeney, J.N.; Institute, O. Intensive Shrimp Production Technology: The Oceanic Institute Shrimp Manual; Argent Chemical Laboratories: Redmond, WA, USA, 1991. [Google Scholar]
  6. Bray, W.; Lawrence, A.; Leung-Trujillo, J. The effect of salinity on growth and survival of Penaeus vannamei, with observations on the interaction of IHHN virus and salinity. Aquaculture 1994, 122, 133–146. [Google Scholar] [CrossRef]
  7. Boyd, C.; Thunjai, T. Concentrations of Major Ions in Waters of Inland Shrimp Farms in China, Ecuador, Thailand, and the United States. J. World Aquac. Soc. 2007, 34, 524–532. [Google Scholar] [CrossRef]
  8. New, M. Freshwater prawn farming: Global status, recent research and a glance at the future. Aquac. Res. 2005, 36, 210–230. [Google Scholar] [CrossRef]
  9. Liu, Q.; Luo, D.; Zhao, Z.; Tu, Z.; Dai, C.; Li, X.; Chen, W. Ecological mixed culture technology of Macrobrachium rosenbergii and Litopenaeus vannamei in ponds. Mod. Agric. Sci. Technol. 2022, 175–180. [Google Scholar] [CrossRef]
  10. Cao, Y.; Zhang, M.; Dong, Q.; Wu, C. Experimental study on efficient culture of Litopenaeus vannamei and Macrobrachium rosenbergii. J. Anhui Agric. 2015, 43, 118–119+141. [Google Scholar] [CrossRef]
  11. Li, G.; Sui, C.; Hu, B.; Zheng, B. Experiment on mixed culture of Macrobrachium rosenbergii in the main pond of Litopenaeus vannamei. North. Chin. Fish. 2025, 44, 41–44. [Google Scholar]
  12. Ni, M.; Chen, X.-f.; Gao, Q.; Zhang, L.-m.; Yuan, J.-l.; Gu, Z.-m.; Zhou, Z.-m. Feasibility and compatibility of polyculture of Litopenaeus vannamei and Macrobrachium rosenbergii in the intertidal ponds. Aquac. Res. 2021, 52, 4205–4216. [Google Scholar] [CrossRef]
  13. Zhang, Y.; Hou, Y.; Jia, R.; Li, B.; Zhu, J.; Ge, X. Alterations in Soil Bacterial Community and Its Assembly Process within Paddy Field Induced by Integrated Rice–Giant River Prawn (Macrobrachium rosenbergii) Farming. Agronomy 2024, 14, 1600. [Google Scholar] [CrossRef]
  14. Che, S. Effects of Different Densities of Macrobrachium rosenbergii on Water Quality, Growth Performance, Nutritional Flavor, Intestinal Microflora of Chinese Mitten Crab (Eriocheir sinensis) Ponds. Master’s Thesis, Shanghai Ocean University, Shanghai, China, 2023. [Google Scholar]
  15. Zhang, M.; Pan, L.; Huang, F.; Gao, S.; Su, C.; Zhang, M.; He, Z. Metagenomic analysis of composition, function and cycling processes of microbial community in water, sediment and effluent of Litopenaeus vannamei farming environments under different culture modes. Aquaculture 2019, 506, 280–293. [Google Scholar] [CrossRef]
  16. Yan, Y.; Zhou, J.; Du, C.; Yang, Q.; Huang, J.; Wang, Z.; Xu, J.; Zhang, M. Relationship between Nitrogen Dynamics and Key Microbial Nitrogen-Cycling Genes in an Intensive Freshwater Aquaculture Pond. Microorganisms 2024, 12, 266. [Google Scholar] [CrossRef] [PubMed]
  17. Li, Z.; He, H.; Ding, J.; Zhang, Z.; Leng, Y.; Liao, M.; Xiong, W. Effects of Three Antibiotics on Nitrogen-Cycling Bacteria in Sediment of Aquaculture Water. Water 2024, 16, 1256. [Google Scholar] [CrossRef]
  18. Zhang, X.; Dong, H.; Zheng, P.; Li, G.; He, C.; Guo, X.; Zhang, J.; Gong, J. The habitat differentiation, dynamics and functional potentials of bacterial and micro-eukaryotic communities in shrimp aquaculture systems with limited water exchange. Aquaculture 2023, 566, 739156. [Google Scholar] [CrossRef]
  19. Yu, X.; Wu, T.; Wang, H.; Yan, H.; Han, J.; Guan, W. Dynamic changes of bacterioplankton communities in Litopenaeus vannamei farming pond using saline-alkaline water. J. Fish. Sci. China 2024, 31, 940–953. [Google Scholar]
  20. Wang, C.; Masoudi, A.; Wang, M.; Yang, J.; Yu, Z.; Liu, J. Land-use types shape soil microbial compositions under rapid urbanization in the Xiong’an New Area, China. Sci. Total Environ. 2021, 777, 145976. [Google Scholar] [CrossRef]
  21. Li, M. Study on the Structure of Phytoplankton-Microbial Community in Several Aquaculture Systems in Ningxia. Master’s Thesis, Shanghai Ocean University, Shanghai, China, 2023. [Google Scholar]
  22. Romo, S.; Villena, M. Phytoplankton strategies and diversity under different nutrient levels and planktivorous fish densities in a shallow Mediterranean lake. J. Plankton Res. 2005, 27, 1273–1286. [Google Scholar] [CrossRef]
  23. Zhang, Y.; Li, T.; Li, G.; Yuan, T.; Zhang, Y.; Jin, L. Profiling sediment bacterial communities and the response to pattern-driven variations of total nitrogen and phosphorus in long-term polyculture ponds. Front. Mar. Sci. 2024, 11, 1403909. [Google Scholar] [CrossRef]
  24. Barraza-Guardado, R.; Arreola-Lizárraga, J.; López-Torres, M.; Casillas-Hernández, R.; Miranda-Baeza, A.; Magallón-Barrajas, F.; Ibarra-Gámez, C. Effluents of Shrimp Farms and Its Influence on the Coastal Ecosystems of Bahía de Kino, Mexico. Sci. World J. 2013, 2013, 306370. [Google Scholar] [CrossRef]
  25. Cao, T.T.; Nguyen, K.L.P.; Le, H.A.; Eppe, G. The Integrating Impacts of Extreme Weather Events and Shrimp Farming Practices on Coastal Water Resource Quality in Ninh Thuan Province, Vietnam. Sustainability 2024, 16, 5701. [Google Scholar] [CrossRef]
  26. Yang, W.; Zhu, J.; Zheng, C.; Lukwambe, B.; Nicholaus, R.; Lu, K.; Zheng, Z. Succession of phytoplankton community during intensive shrimp (Litopenaeus vannamei) cultivation and its effects on cultivation systems. Aquaculture 2020, 520, 734733. [Google Scholar] [CrossRef]
  27. Zheng, X.; Xu, K.; Naoum, J.; Lian, Y.; Wu, B.; He, Z.; Yan, Q. Deciphering microeukaryotic–bacterial co-occurrence networks in coastal aquaculture ponds. Mar. Life Sci. Technol. 2023, 5, 44–55. [Google Scholar] [CrossRef]
  28. Grossart, H.; Wurzbacher, C.; James, T.; Kagami, M. Discovery of dark matter fungi in aquatic ecosystems demands a reappraisal of the phylogeny and ecology of zoosporic fungi. Fungal Ecol. 2016, 19, 28–38. [Google Scholar] [CrossRef]
  29. Letcher, P.; Longcore, J.; James, T.; Leite, D.; Simmons, D.; Powell, M. Morphology, Ultrastructure, and Molecular Phylogeny of Rozella multimorpha, a New Species in Cryptomycota. J. Eukaryot. Microbiol. 2017, 65, 180–190. [Google Scholar] [CrossRef]
  30. Gong, J.; Xing, B.; Zhang, Q. Researching progress of Cryptomycota (Eukaryota, Fungi). J. Ocean. Univ. China 2013, 43, 27–34. [Google Scholar] [CrossRef]
  31. Held, A. Development of Rozella in Allomyces: A single zoospore produces numerous zoosporangia and resistant sporangia. Can. J. Bot. 1980, 58, 959–979. [Google Scholar] [CrossRef]
  32. Gleason, F.; Carney, L.; Lilje, O.; Glockling, S. Ecological potentials of species of Rozella (Cryptomycota). Fungal Ecol. 2012, 5, 651–656. [Google Scholar] [CrossRef]
  33. Letcher, P.; Longcore, J.; Quandt, C.; Leite, D.; James, T.; Powell, M. Morphological, molecular, and ultrastructural characterization of Rozella rhizoclosmatii, a new species in Cryptomycota. Fungal Biol. 2017, 121, 1–10. [Google Scholar] [CrossRef] [PubMed]
  34. Laverock, B.; Smith, C.; Tait, K.; Osborn, A.; Widdicombe, S.; Gilbert, J. Bioturbating shrimp alter the structure and diversity of bacterial communities in coastal marine sediments. ISME J. 2010, 4, 1531–1544. [Google Scholar] [CrossRef]
  35. Tao, Y. To farm fish and shrimp is to manage water. Prim. Agric. Technol. Ext. 2013, 1, 20. [Google Scholar]
  36. Zhang, J.; Ran, Z.; Xie, H.; Kong, F.; Zhang, M.; Zhou, Y.; Li, Y.; Liao, K.; Yan, X.; Xu, J.-L. A systematic analysis and evaluation of nutritional composition of 23 strains of marine microalgae commonly used in aquaculture. Algal Res. 2023, 72, 103122. [Google Scholar] [CrossRef]
  37. Dewangan, N.; Gopalakrishnan, A.; Malaroli, R.; Roy, S.; Murugesan, P.; Somasundaram, S.; Kannan, D.; Singh, R. Occurrence of microsporidian in white faeces syndrome (WFS)-diseased Litopenaeus vannamei of intensive grow-out ponds of India. Aquac. Res. 2021, 52, 659–665. [Google Scholar] [CrossRef]
  38. López-Verdejo, A.; Montero, F.E.; de la Gándara, F.; Gallego, M.; Ortega, A.; Raga, J.; Palacios-Abella, J. A severe microsporidian disease in cultured Atlantic Bluefin Tuna (Thunnus thynnus). IMA Fungus 2022, 13, 5. [Google Scholar] [CrossRef]
  39. Itoïz, S.; Metz, S.; Derelle, E.; Reñé, A.; Garcés, E.; Bass, D.; Soudant, P.; Chambouvet, A. Emerging Parasitic Protists: The Case of Perkinsea. Front. Microbiol. 2022, 12, 735815. [Google Scholar] [CrossRef]
  40. Chen, A.; Jiang, Y.; Qian, D.; Chen, C.; Li, A.; Huang, J.; Yang, B. Infection with Perkinsus Olseni. China Fish. 2012, 436, 49–50. [Google Scholar] [CrossRef]
  41. Yano, Y.; Hamano, K.; Tsutsui, I.; Aue-umneoy, D.; Ban, M.; Satomi, M. Occurrence, molecular characterization, and antimicrobial susceptibility of Aeromonas spp. in marine species of shrimps cultured at inland low salinity ponds. Food Microbiol. 2015, 47, 21–27. [Google Scholar] [CrossRef]
  42. Ruprecht, J.; Birrer, S.; Dafforn, K.; Mitrovic, S.; Crane, S.L.; Johnston, E.; Wemheuer, F.; Navarro, A.; Harrison, A.; Turner, I.L.; et al. Wastewater effluents cause microbial community shifts and change trophic status. Water Res. 2021, 200, 117206. [Google Scholar] [CrossRef]
  43. Bergen, B.; Herlemann, D.R.; Labrenz, M.; Jürgens, K. Distribution of the verrucomicrobial clade Spartobacteria along a salinity gradient in the Baltic Sea. Environ. Microbiol. Rep. 2014, 6, 625–630. [Google Scholar] [CrossRef] [PubMed]
  44. Wei, G.; Zhang, J.; Li, M.; Gao, Z. The diversity and distribution pattern of bacterial community in the water of Yellow River estuary. Biotechnol. Bull. 2017, 33, 199–208. [Google Scholar] [CrossRef]
  45. Zhang, Y.; Qiao, Y.; Fu, Z. Shifts of bacterial community and predictive functional profiling of denitrifying phosphorus removal—Partial nitrification—Anammox three-stage nitrogen and phosphorus removal before and after coupling for treating simulated wastewater with low C/N. Chem. Eng. J. 2023, 451, 138601. [Google Scholar] [CrossRef]
  46. Liu, J.; Yin, J.; Li, Y.; Li, D.; Wu, J.; Wang, C.; Wang, C.; Yin, F.; Yang, B.; Zhang, W. High nitrite–nitrogen stress intensity drives nitrite anaerobic oxidation to nitrate and inhibits methanogenesis. Sci. Total Environ. 2022, 832, 155109. [Google Scholar] [CrossRef] [PubMed]
  47. Yuan, L.; Tan, L.; Shen, Z.; Zhou, Y.; He, X.; Chen, X. Enhanced denitrification of dispersed swine wastewater using Ca(OH)2-pretreated rice straw as a solid carbon source. Chemosphere 2022, 305, 135316. [Google Scholar] [CrossRef]
  48. Xv, K.; Zhang, S.; Pang, A.; Wang, T.; Dong, S.; Xv, Z.; Zhang, X.; Liang, J.; Fang, Y.; Tan, B.; et al. White feces syndrome is closely related with hypoimmunity and dysbiosis in Litopenaeus vannamei. Aquac. Rep. 2024, 38, 102329. [Google Scholar] [CrossRef]
  49. Xie, D.; Feng, C.; Hu, J.; Lin, H.; Luo, H.; Zhang, Q.; He, H. Impact of tidal fluctuations on bacterial community structure in Wuyuan Bay: A comparative analysis of waters inside and outside the tidal barrage. PLoS ONE 2024, 19, e0312283. [Google Scholar] [CrossRef]
  50. Huang, Z.; Chen, Y.; Weng, S.; Lu, X.; Zhong, L.; Fan, W.; Chen, X.; Zhang, H.; He, J. Multiple bacteria species were involved in hepatopancreas necrosis syndrome (HPNS) of Litopenaeus vannamei. Acta Sci. Nat. Univ. Sunyatseni 2016, 55, 1–11. [Google Scholar] [CrossRef]
  51. Hu, X.; Cao, Y.; Wen, G.; Zhang, X.; Xu, Y.; Xu, W.; Xu, Y.; Li, Z. Effect of combined use of Bacillus and molasses on microbial communities in shrimp cultural enclosure systems. Aquac. Res. 2017, 48, 2691–2705. [Google Scholar] [CrossRef]
  52. Lu, X.; Ding, Z.; Li, F.; Wan, C.; Guan, W. Microbial composition in water of recirculating aquaculture ponds of red swamp crayfish Procambarus clarkii. Fish. Sci. 2025, 44, 341–355. [Google Scholar] [CrossRef]
  53. Chen, X.; Ji, J.; Li, P.; Peng, X.; Wang, J.; Fu, C.; Zong, Y. Characterization of microbial communities in the upstream water body of Linzhi City section of Yarlung Tsangpo River and changes in nitrogen cycle-related microbiota. J. Ecol. Rural. Environ. 2025, 1–24. [Google Scholar] [CrossRef]
  54. Du, Y.; Dong, D.; Li, C.; Wang, F.; Shan, H. Relationship between concentrations of ammonia and nitrite in water, microbial community structure and abundance of nitrogen cycling function genes. Prog. Fish. Sci. 2025, 46, 1–14. [Google Scholar] [CrossRef]
  55. Zhang, D.; Wang, X.; Xiong, J.; Zhu, J.; Wang, Y.; Zhao, Q.; Chen, H.; Guo, A.; Wu, J.; Dai, H. Bacterioplankton assemblages as biological indicators of shrimp health status. Ecol. Indic. 2014, 38, 218–224. [Google Scholar] [CrossRef]
  56. Sun, F.; Wang, Y.; Wang, C.; Zhang, L.; Tu, K.; Zheng, Z. Insights into the intestinal microbiota of several aquatic organisms and association with the surrounding environment. Aquaculture 2019, 507, 196–202. [Google Scholar] [CrossRef]
  57. Cole, J.; Pace, M.; Carpenter, S.; Kitchell, J. Persistence of net heterotrophy in lakes during nutrient addition and food web manipulations. Limnol. Oceanogr. 2000, 45, 1718–1730. [Google Scholar] [CrossRef]
  58. Montoya, D.; Yallop, M.; Memmott, J. Functional group diversity increases with modularity in complex food webs. Nat. Commun. 2015, 6, 7379. [Google Scholar] [CrossRef]
  59. Barranca, V.; Zhou, D.; Cai, D. Low-rank network decomposition reveals structural characteristics of small-world networks. Phys. Rev. E 2015, 92, 062822. [Google Scholar] [CrossRef] [PubMed]
  60. Gao, S.; Fu, Y.; Peng, X.; Ma, S.; Liu, Y.-R.; Chen, W.; Huang, Q.; Hao, X. Microplastics Trigger Soil Dissolved Organic Carbon and Nutrient Turnover by Strengthening Microbial Network Connectivity and Cross-Trophic Interactions. Environ. Sci. Technol. 2025, 59, 5596–5606. [Google Scholar] [CrossRef] [PubMed]
  61. Chang, C.; Bajić, D.; Vila, J.C.; Estrela, S.; Sanchez, A. Emergent coexistence in multispecies microbial communities. Science 2023, 381, 343–348. [Google Scholar] [CrossRef]
  62. Deng, Y.; Zhang, P.; Qin, Y.; Tu, Q.; Yang, Y.; He, Z.; Schadt, C.; Zhou, J. Network succession reveals the importance of competition in response to emulsified vegetable oil amendment for uranium bioremediation. Environ. Microbiol. 2015, 18, 205–218. [Google Scholar] [CrossRef]
  63. Artime, O.; Grassia, M.; De Domenico, M.; Gleeson, J.; Makse, H.; Mangioni, G.; Perc, M.; Radicchi, F. Robustness and resilience of complex networks. Nat. Rev. Phys. 2024, 6, 114–131. [Google Scholar] [CrossRef]
  64. Chang, Z.; Neori, A.; He, Y.; Li, J.; Qiao, L.; Preston, S.; Liu, P.; Li, J. Development and current state of seawater shrimp farming, with an emphasis on integrated multi-trophic pond aquaculture farms, in China—A review. Rev. Aquac. 2020, 12, 2544–2558. [Google Scholar] [CrossRef]
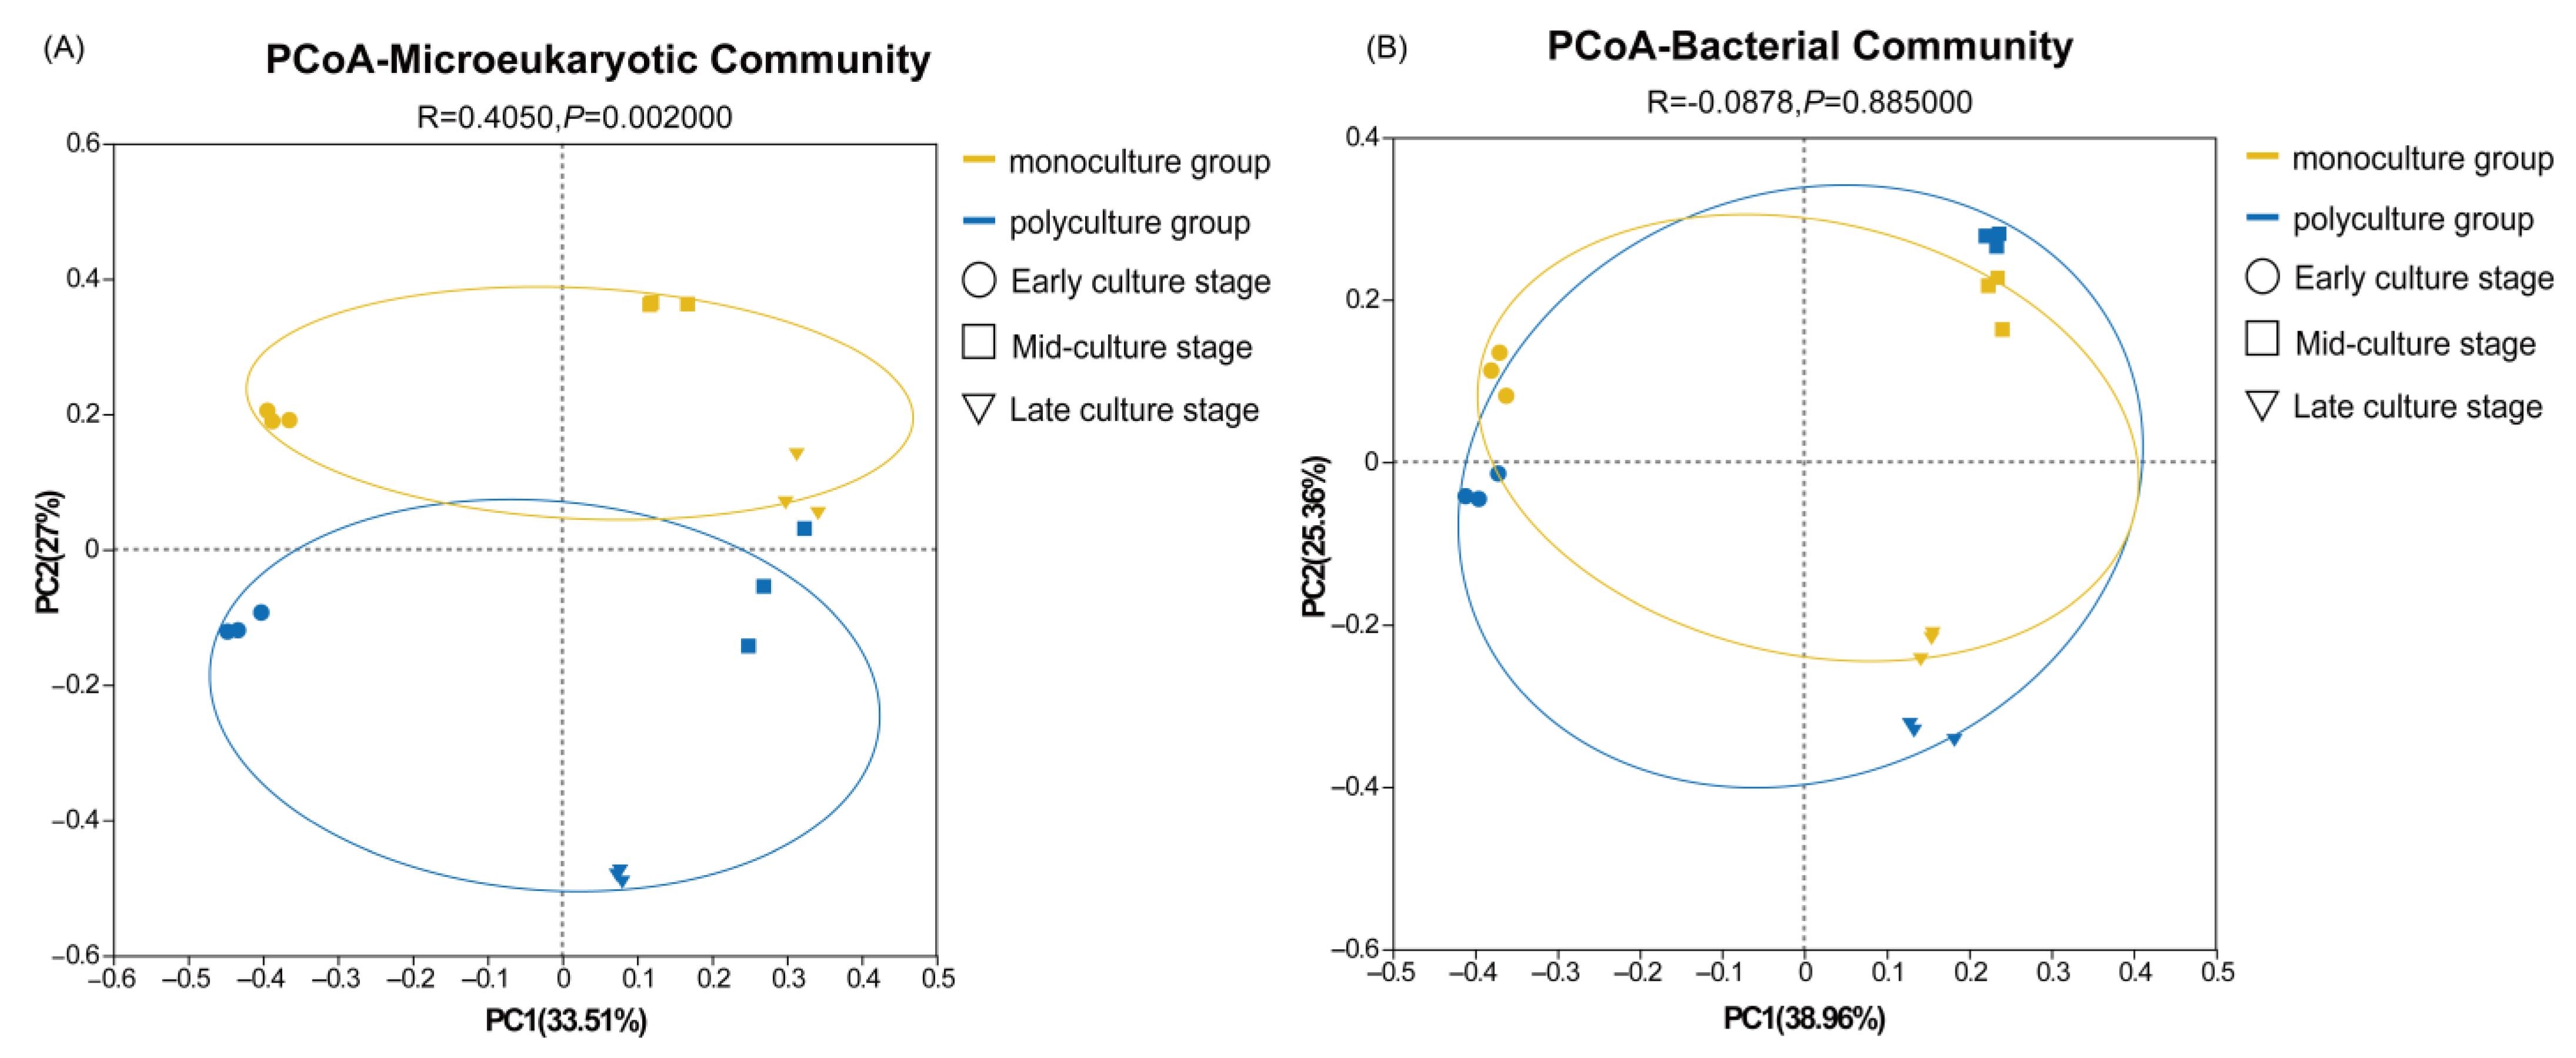
Figure 1. (A) Principal coordinate analysis (PCoA) of microeukaryotic community. (B) PCoA of bacterial community.
Fishes 10 00433 g001
Figure 2. (A) Microeukaryotic community at the phylum level. (B) Bacterial community at the phylum level. Notes: M and B represent microeukaryotic and bacterial communities, respectively; N and H represent monoculture and polyculture groups, respectively; 6, 8, and 10 represent the early, mid, and late culture stage, respectively.
Fishes 10 00433 g002
Figure 3. (A) Microeukaryotic community at the genus level. (B) Bacterial community at the genus level. Notes: M and B represent microeukaryotic and bacterial communities, respectively; N and H represent monoculture and polyculture groups, respectively; 6, 8, and 10 represent the early, mid, and late culture stage, respectively.
Fishes 10 00433 g003
Figure 4. (A) Redundancy analysis (RDA) of microeukaryotic community with environmental factors. (B) RDA of bacterial community with environmental factors.
Fishes 10 00433 g004
Table 1. Alpha diversity of microeukaryotes and bacteria in monoculture group (N) and polyculture group (H) during different aquaculture phases.
Culture StageGroupACEChao1ShannonSimpson
microeukaryotesEarly culture stageN554.11 ± 25.91 a554.46 ± 33.80 a4.34 ± 0.02 a0.03 ± 0.00 a
H478.92 ± 7.62 b489.18 ± 14.16 b4.02 ± 0.14 b0.04 ± 0.01 a
Mid-culture stageN290.46 ± 47.89 a301.36 ± 50.97 a2.06 ± 0.56 a0.34 ± 0.19 a
H287.09 ± 3.41 a288.40 ± 7.51 a2.62 ± 0.15 a0.23 ± 0.03 a
Late culture stageN204.61 ± 51.77 a215.31 ± 57.63 a2.40 ± 0.05 b0.20 ± 0.02 a
H231.83 ± 128.41 a227.32 ± 117.92 a2.76 ± 0.19 a0.14 ± 0.04 b
BacteriaEarly culture stageN1347.4 ± 157.44 a1241.2 ± 86.70 a4.46 ± 0.37 a0.04 ± 0.02 a
H1252 ± 168.72 a1194.1 ± 90.10 a4.48 ± 0.08 a0.03 ± 0.00 a
Mid-culture stageN946.52 ± 111.55 b906.55 ± 110.78 b3.79 ± 0.21 b0.07 ± 0.01 a
H1198.4 ± 86.52 a1159 ± 102.47 a4.29 ± 0.13 a0.05 ± 0.01 a
Late culture stageN749.63 ± 125.77 a680.56 ± 48.816 a3.79 ± 0.28 a0.06 ± 0.02 a
H681.2 ± 283.39 a674.75 ± 260.36 a4.03 ± 0.01 a0.06 ± 0.00 a
Different superscript letters indicate significant differences (p < 0.05) in diversity indices between the monoculture group (N) and polyculture group (H) within the same culture stage.
Table 2. Topological parameters of cross-kingdom correlation networks among microeukaryotes, bacteria, and microeukaryote–bacteria communities in aquaculture water bodies.
Topological ParametersBacterial CommunitiesMicroeukaryotic CommunitiesMicroeukaryote–Bacteria Communities
NHNHNH
Number of nodes505050505050
Number of edges197287226185209254
Number of positive edges135
(68.5%)
138
(48.1%)
139
(61.5%)
94
(50.8%)
112
(53.6%)
129
(50.8%)
Number of negative edges62
(31.5%)
149
(51.9%)
87
(38.5%)
91
(49.2%)
97
(46.4%)
125
(49.2%)
Average degree7.8811.369.047.48.3610.16
Average weighted degree13.9020.1215.7312.8114.7017.97
Diameter784655
Density0.1610.2320.1840.1510.1710.207
Modularity0.5120.5270.3990.520.5160.569
Average clustering coefficient0.640.8180.6420.5820.7860.797
Average path length2.8973.3461.8872.6972.2312.313
N represents monoculture ponds, and H represents polyculture ponds.
Disclaimer/Publisher’s Note: The statements, opinions and data contained in all publications are solely those of the individual author(s) and contributor(s) and not of MDPI and/or the editor(s). MDPI and/or the editor(s) disclaim responsibility for any injury to people or property resulting from any ideas, methods, instructions or products referred to in the content.