Article

Characterization of the NFAT Gene Family in Grass Carp (Ctenopharyngodon idellus) and Functional Analysis of NFAT1 During GCRV Infection

1
Fisheries College, Hunan Agricultural University, Changsha 410128, China
2
Yuelushan Laboratory, Changsha 410128, China
*
Author to whom correspondence should be addressed.
Fishes 2025, 10(9), 422; https://doi.org/10.3390/fishes10090422
Submission received: 9 July 2025 / Revised: 17 August 2025 / Accepted: 19 August 2025 / Published: 22 August 2025
(This article belongs to the Special Issue Molecular Design Breeding in Aquaculture)

Abstract

Nuclear factors of activated T cells (NFATs) are pivotal regulatory factors of immune responses, primarily by modulating T cell activity and regulating inflammatory cytokine gene transcription. The grass carp reovirus (GCRV) triggers a serious hemorrhagic condition, posing a significant threat to sustainable grass carp (Ctenopharyngodon idella) aquaculture. However, the precise function of NFAT in the host’s defense against GCRV infection is mostly undefined. This study comprehensively identified and characterized the NFAT genetic family in grass carp, cloned grass carp NFAT1 (CiNFAT1), and investigated its expression and function during GCRV infection. Eight NFAT genes encoding seventeen isoforms have been detected within the grass carp’s genomic sequence, distributed across six different chromosomes. Comparative analysis revealed homology with zebrafish NFATs. CiNFAT1 possesses a 2697 bp open reading frame, encoding 898 amino acids, and contains conserved Rel homology domain (RHD) and NFAT-homology (IPT) domains. Quantitative PCR (qPCR) revealed ubiquitous CiNFAT1 expression in healthy grass carp tissues, with the highest expression in gills and skin and the lowest in liver. Following GCRV challenge in vivo, CiNFAT1 expression in immune tissues (liver, spleen, kidney, gill, intestine) showed dynamic changes over time. In vitro experiments in CIK cells demonstrated that CiNFAT1 expression peaked at 12 h post-GCRV infection. Further functional studies revealed that overexpression of CiNFAT1 significantly reduced GCRV replication at 36 h post-infection. This reduction was accompanied by elevated expression of type I interferon (IFN-I) and interferon regulatory factor 7 (IRF7) at 24 and 36 h, respectively, as well as modulated IL-2, IL-8, and IL-10. Conversely, RNA interference-mediated knockdown of CiNFAT1 enhanced GCRV VP5 and VP7 mRNA levels and suppressed IL-2 and IL-8 expression. These results suggest that CiNFAT1 contributes to anti-GCRV immunity by promoting antiviral and inflammatory cytokine responses, thereby inhibiting viral replication. This study provides a foundational understanding of the NFAT genetic family in grass carp and highlights an important role of CiNFAT1 in mediating the body’s inherent defense mechanism against GCRV infection, offering insights for disease control strategies in aquaculture.
Key Contribution: A total of eight NFAT genes along with seventeen isoforms have been detected within the grass carp’s genomic sequence. Among those, NFAT1 was selected for in-depth investigation. CiNFAT1 exhibited broad tissue expression across healthy grass carp, with predominant expression levels in immune-related organs such as gill and skin. The expression profile of CiNFAT1 showed dynamic regulation in response to GCRV infection. Functional analyses revealed that CiNFAT1 overexpression suppressed GCRV replication and modulated key immune-related genes, whereas its silencing elicited the opposite effects. Collectively, these results demonstrate the important role of CiNFAT1 in antiviral immune defense against GCRV.

1. Introduction

Grass carp (Ctenopharyngodon idella) is currently the largest freshwater aquaculture species in China, boasting an annual output surpassing 5.94 million tons in 2023 [1]. However, hemorrhage disease, due to grass carp reovirus (GCRV), is a serious constraint to the sustainable development of the grass carp aquaculture industry [2]. Despite extensive research into GCRV’s pathogenic mechanism and host antiviral response [3,4,5], a substantial knowledge gap persists regarding the genetic basis for resistance and the development of resistant breeding lines. Consequently, elucidating grass carp’s immune mechanisms against GCRV infection is imperative for ensuring industry stability and growth.
Fish, as the most primitive vertebrates, possess an adaptive immune system mediated by T cells, which is essential for protecting against infections. While early research predominantly focused on innate immunity, recent studies increasingly underscore the significance of adaptive immunity, particularly T cell responses, in combating infectious diseases in fish. Nuclear factor of activated T cells (NFAT) transmit factor is central to adaptive immunity, having been initially identified in mammalian T lymphocytes [6]. NFAT proteins are known to orchestrate T cell maturation and polarization and modulate the transcription of a broad spectrum of inflammatory cytokine genes, thus playing a pivotal role in the formation and function of the vertebrate immune system [7].
The NFAT protein family comprises five members: NFAT1, NFAT2, NFAT3, and NFAT4 are activated via the Ca2+/Calcineurin (CaN) signaling pathway, whereas NFAT5 (also known as TonEBP) is primarily regulated by osmotic stress [8,9,10]. Among the Ca2+ dependent NFATs (NFAT1-4), NFAT1 is the most abundant, accounting for between 80 and 90% of the overall NFAT content in quiescent immune cells. These proteins share conserved domains, including the amino-terminal transactivation domain (TAD), the NFAT homology region (NHR), the DNA-binding domain (DBD) or the Rel homology domain (RHD), and the carboxy-terminal domain [9,11]. RHD is critical for DNA sequence recognition and binding specificity. The NHR region in NFAT1-4, containing a serine-rich region (SRR) with multiple phosphorylation sites, is crucial for cytoplasmic retention in the resting state and mediates interaction with CaN for dephosphorylation and nuclear translocation [12,13]. Unlike other members, NFAT5 lacks the NHR and CDS regions, relying on osmotic pressure for regulation [14].
NFAT activation is a tightly regulated process involving post-translational modifications, particularly phosphorylation. In quiescent cells, NFAT1 is phosphorylated and localized in the cytoplasm. Ca2+ influx stimulates CaN, which dephosphorylates NFAT1, exposing its nuclear localization sequence and promoting its transfer from the cytoplasm to the nucleus [15]. Subsequently, NFAT integrates with several signaling pathways to mediate a transcriptional regulatory network of genes encoding cytokines, inflammatory mediators, and immune-related molecules. This process precisely controls T cells and the activity of antiviral effector molecules, thereby maintaining the homeostasis of the immune system. This translocation can also be influenced by intracellular signaling pathways and protein-protein interactions [16]. In pearl oysters (Pinctada fucata), the expression of PfNFAT, an NFAT homologue, was significantly up-regulated following stimulation with LPS and poly I:C [17]. In flounder (Paralichthys olivaceus), anti-CD28 antibodies induced a significant increase in the initial expression of NFAT and interleukin-2 (IL-2), thereby affecting the extent of lymphocyte proliferation [18]. NFAT levels elevated upon stimulation with Staphylococcus aureus, Vibrio anguillarum, and poly I:C, suggesting its involvement in immune and inflammatory responses in lamprey (Lethenteron reissneri) [19]. Collectively, there is mounting evidence that NFAT is crucial for all things considered; there is growing evidence that NFAT plays a crucial role in controlling the immunological response.
Given the important role of NFAT in immune responses and the significant economic impact of GCRV disease in grass carp, this investigation was designed to systematically identify and characterize the NFAT gene family in C. idella. Specifically, we focused on cloning and elucidating the function of the grass carp NFAT1 (CiNFAT1) during GCRV infection, providing novel insights into grass carp immunity against this devastating pathogen.

2. Materials and Methods

2.1. Animals, Cells, and Pathogens

Grass carp samples were obtained from the Xiangyin Laboratory of Fishery Sciences in Hunan Province, China, with a mean weight of 50 ± 0.5 g. They were acclimated in a 28 °C circulating aquaculture system for one week and fed commercial feed twice a day, with a daily feed intake of 3% of body weight.
CIK (C.idella kidney cell) and GCRV-I (used for cell infection experiments) were provided by the Yangtze River Fisheries Research Institute, Chinese Academy of Fishery Science (Wuhan, China). In an incubator set at 28 °C and 5% CO2, the CIK cells were cultivated in M199 with 10% fetal bovine serum and a 1% penicillin-streptomycin double antibiotic solution.
GCRV-II (HN-1307, for challenge assay in vivo) was provided by researcher Shi Cunbin, Pearl River Fisheries Research Institute, Guangzhou Academy of Fishery Sciences, China. The preparation method of virus supernatant from Yang et al. was referred [20], and the virus supernatant was kept at −80 °C.

2.2. Characterization of the NFAT Gene Family Members in Grass Carp

The genome-wide data of grass carp were obtained by NCBI [21] (Table S1). Initially, redundant and imperfect sequences were removed from the dataset. Subsequently, the coding sequence (CDS) was extracted and translated into amino acids using TBtools -Ⅱv2.331 software (Guangzhou, China). Then, the hidden Markov model (HMM) of the RHD domain (PF16179) of the Pfam database was used as a seed sequence. Based on this seed sequence, the Simple HMM Search module in TBtools was utilized for genome-wide screening to identify potential NFAT family members in grass carp. Additionally, the amino acid sequences of the zebrafish (Danio rerio) NFAT family members were used as a secondary seed sequence. The NFAT protein sequences of zebrafish and grass carp were aligned using the BLAST module in TBtools -Ⅱv2.331 (Guangzhou, China). Subsequently, the intersection of the results from the two steps was selected as the candidate NFAT family proteins in grass carp. Finally, the conserved domains of these candidate proteins were analyzed using NCBI and SMART databases [22]. Through this approach, the NFAT family members were successfully identified.

2.3. Physicochemical Characteristics and Subcellular Location Prediction of NFAT Genetic Family Members in Grass Carp

The amino acid sequences of NFAT family members were extracted from the grass carp genome using TBtools, and their physicochemical properties were predicted using the Protein Parameter Calc function. The subcellular location of NFAT family members was predicted by the WoLF PSORT website (Table S1).

2.4. Protein Structure Analysis and Phylogenetic Tree Construction of Grass Carp NFAT Gene Family Members

After retrieving the domain architecture of grass carp NFAT proteins from the NCBI database, the motif discovery was performed using MEME Suite 5.3.3 software, and the parameters were set to identify 10 motifs for systematic analysis. Subsequently, conserved domains were recognized using the NCBI Batch CD-search tool. Multi-sequence alignment was conducted using MEGA7 software with default parameters, followed by phylogenetic tree construction by the neighbor-joining (NJ) method. The phylogenetic tree was verified by 1000 repeated bootstrap analyses.

2.5. Chromosomal Mapping and Collinearity Analysis of NFAT Gene Family Members in Grass Carp

The chromosome distribution and gene density of NFAT genes in grass carp were analyzed using TBtools. First, genome-wide sequences of zebrafish and grass carp were retrieved using NCBI database. Subsequently, collinearity analysis was conducted between these two species, revealing conserved synteny of NFAT family homologous gene pairs at the chromosomal level.

2.6. GCRV Infection and Sample Collection

In the GCRV immersion challenge experiment, the produced GCRV solution (3.63 × 10⁷ TCID 50/mL) was used to submerge 120 grass carp that were free of illness for 20 min. The infected fish were transferred to a circulating water system.
Liver, spleen, kidney, gill, and intestinal tissues from six grass carp were extracted independently at three distinct times: latent, onset, and recovering period [20]. The same issues from healthy, virus-unexposed grass carp served as controls. Samples were stored in liquid nitrogen until further analysis.
CIK cells were used as a model in vitro experiments. Trypsin was used to separate the cells and seed them onto 6-well plates once the cell monolayer had reached 80% confluence. Subsequently, cells were infected with GCRV-I (1.58 × 10⁴ TCID 50/mL). Following 0, 3, 6, 12, 24, and 36 h after infection, the cells underwent two PBS washes. Each time point was carried out three times. The Trizol method was used to extract RNA from the cell samples (Vazyme, Nanjing, China). Cells without virus added for 0 h were used as the control group.
Total RNA was used to extract from each grass carp tissue using the RNA isolater Total RNA Extraction Reagent (Vazyme, Nanjing, China). The RNA was evaluated by spectrophotometry and 1% agarose gel electrophoresis. Reverse transcription into cDNA was performed using the RevertAid First Strand cDNA Synthesis Kit (Thermo Fisher Scientific, Waltham, MA, USA).

2.7. Cloning and Sequence Analysis of CiNFAT1

The NFAT1-cF/R primers (Table S3) were designed using Oligo 7.0 based on the XM_051880145.1 sequence from NCBI, and cDNA from grass carp liver tissue was used as a template to amplify the target fragment. The polymerase chain reaction (PCR) system was as follows: 10 μL Taq Master Mix (TaKaRa, Kyoto, Japan), 7 μL ddH2O, 1 μL cDNA, 1 μL NFAT1-cF, and 1 μL NFAT1-cR. The PCR protocol consisted of an initial denaturation step at 94 °C for 5 min, followed by 35 cycles, each of which included 30 s at 94 °C, 30 s at 56 °C, 2 min at 72 °C, and finally 7 min at 72 °C extension. The PCR product was purified according to the instructions of HiPure Gel Pure DNA Mini Kit (Magen, Guangzhou, China), cloned into pMD19-T vector (TaKaRa, Kyoto, Japan) and sequenced using universal primers.
The CiNFAT1 (XM_051880145.1) registered in NCBI was used as a template. Signal peptide was used to predict by SignalP 6.0 software (Table S1), and the physicochemical characteristics of the protein were analyzed using the ProtParam tool on the Expasy website. The amino acid sequences of NFAT1 from all kinds of fish species were obtained, and the sequence similarity between CiNFAT1 and other fish species was analyzed using BLAST. The phylogenetic tree was constructed using MEGA 7.0, employing the neighbor-joining method and performing 1000 bootstrap replicates. The phylogenetic tree was finalized, and the annotation was completed using the iTOL platform. The secondary structure domains of grass carp NFAT1 were predicted using the SMART database, and the tertiary structure was modeled by the SWISS-MODEL platform.

2.8. Construction and Transfection of CiNFAT1 Recombinant Vector

Specific primers NFAT1-tF/tR (Table S3) were designed using the ORF sequence of grass carp NFAT1 from NCBI as a template. The PCR product of grass carp NFAT1-ORF and the double-digested (BamH I and Hind III) pEGFP-N1-Flag vector were gel-purified. The target gene was ligated into the digested vector to generate the recombinant plasmid pEGFP-N1-Flag-NFAT1. The plasmid was transformed into E.coli competent cells (DH5α). Following overnight incubation at 37 °C for 14 h on LB solid medium containing 50 μg/μL kanamycin, positive single colonies were selected for sequencing. The correct recombinant plasmid was extracted and stored at −20 °C.
CIK cells were inoculated into 6-well plates and cultivated overnight in a 5% CO2 incubator (10–15 h). Transfection experiments were performed when the cells achieved approximately 80% confluency. Cells were used to transfect with pEGFP-N1-Flag-NFAT1 and pEGFP-N1-Flag.
Prior to the transfection procedure, the original culture medium was discarded and replaced by Opti-MEM supplemented without serum components to eliminate potential interference. Preparation of the transfection solution: Six μL PEI liposome were diluted with 200 μL OPti-MEN to form Solution A; 2 μg plasmid DNA were diluted with 200 μL OPti-MEN as Solution B. After incubation both solutions for 5 min, respectively. Then, Solution B was added to Solution A. After gently combining the components, the mixture was left to incubate at room temperature for a duration of 15 min. The cells were then rinsed twice with PBS, and 2 mL of the complete medium containing 10% FBS were added. The A/B complex was slowly added to the six-well plate. Six hours later, the original culture medium was substituted with fresh medium, and the cells were then maintained at a temperature of 37 °C for continued growth and experimentation.
After 24 h of incubation, fluorescence microscopy, quantitative PCR, and Western blot were used to detect transfection efficiency. After 48 h of transfection, GCRV dilution was added for infection, and the cells were collected at 0, 12, 24, and 36 h of GCRV attack infection, with triplicate independent biological replicates at each time.

2.9. Subcellular Localization

After 48 h of transfection, cells were exposed to GCRV infection for 24 h and then fixed with 4% paraformaldehyde solution for 15 min. Afterwards, DAPI was added, and the samples were incubated at room temperature for 15 min. The subcellular localization of the fluorescent protein was visualized using a fluorescence inverted microscope.

2.10. Extracting Protein and Western Blot Analysis

The transfected CIK cells were disrupted using 1 mL of RIPA lysis buffer supplemented with 10 μL of PMST to extract total cellular proteins. Cell lysates were separated by SDS-PAGE (GenScript, Nanjing, China). Following separation, the proteins were incubated with the specified first antibody and corresponding second antibody, followed by visualization using an ECL chromogenic agent. The PVDF membrane was then visualized and imaged using a fluorescence imager. The levels of protein expression were assessed by measuring the grayscale intensity of the target protein bands, which were then normalized against the grayscale value of a housekeeping protein used as an internal control.

2.11. RNA Interference Assay

Based on the ORF sequence of CiNFAT, SiRNA-NFAT1-F / R primers (Table S3) were designed. The Lipo 8000TM Transfection Reagent (Beyotime, Shanghai, China) was used when cell confluency reached 80%. The experiments were performed in triplicate using 6-well plates. A mixture of 100 picomoles siRNA and 4 μL Lipo 8000 transfection reagent was prepared by first adding 125 μL Opti-MEM to a centrifuge tube, followed by the addition of siRNA. The mixture was gently mixed and incubated at room temperature for 20 min. Subsequently, each well of the six-well plates received 125 microliters of the prepared solution. After 5 h, transfection efficiency was assessed using fluorescence microscopy.

2.12. Real-Time Fluorescence Quantitative PCR Analysis

Primers tailored explicitly for quantitative PCR were meticulously designed to ensure specificity and efficiency in amplification using Oligo 7.0 software, with the β-actin gene in C. idellus as an internal reference [23] (Table S3). The composition of the qPCR reaction mixture included 5 μL ChamQTM Universal SYBR® qPCR Master Mix (Vazyme, Nanjing, China), 0.4 μL of each primer (upstream and downstream), 1 μL cDNA, and 3.2 μL ddH2O. The quantitative PCR protocol was carried out through a series of defined steps: an initial heat denaturation at 95 °C for 10 min, followed by 35 amplification cycles. Each cycle comprised three steps: denaturation at 95 °C for 10 s, annealing at 60 °C for 10 s, and extension at 72 °C for 15 s. To assess the specificity of the amplification products, a melting curve analysis was performed at the end of the cycles, gradually increasing the temperature from 65 °C to 95 °C at a rate of 0.5 °C every 5 s. The expressions of target genes relative to a control were determined utilizing the 2−ΔΔCt method [24]. Subsequent data processing and analysis were carried out with the Bio-Rad CFX Manager 3.1 software.

2.13. Statistical Analysis

The results are expressed as the average value accompanied by the standard deviation (SD), calculated from three independent biological experiments. Data analysis was performed utilizing the Statistical Package for Social Sciences Version 25.0 (SPSS Inc., Chicago, IL, USA). Statistical differences were performed using one-way ANOVA followed by Tukey’s post-hoc test for multiple comparisons. A p-value less than 0.05 (p < 0.05) was considered indicative of statistical significance. Data were sorted out in Excel and plotted by GraphPad Prism 8.0 software.

3. Results

3.1. Identification and Feature Analysis of NFAT Genetic Family Members in Grass Carp

Eight NFAT genes with seventeen isoforms were identified throughout the entire genome of the grass carp species by double matching of the HMM model and blast analysis, and finally their intersection was taken. The name of each family member, length of protein coding, molecular weight size, isoelectric point, instability index, aliphatic index, grand average of hydropathicity, and subcellular localization results are shown in Table S2. The amino acid number range of the NFAT family members is 373–1443, and the molecular weight of the protein was predicted to be 40.60–156.20 KDa. A spectrum of isoelectric points was identified, ranging from 4.76 to 6.87. The subcellular distribution model analysis showed that most family proteins are located in the nuclear region. The instability index of all members exceeded 40, and the protein structure was predicted to be unstable. The results of the grand average hydrophilicity (GRAVY) parameters were all negative, so the members of the NFAT family were hydrophilic proteins [25].

3.2. Structure and Phylogenetic Analysis of NFAT Gene Family Members in Grass Carp

From the phylogenetic analysis presented in Figure 1A, the eight NFAT gene family members in grass carp segregated into two distinct groups, containing a total of five subfamilies: NFAT1-4 (green) and NFAT5 (blue). Ten conserved motifs of NFAT family members were predicted using MEME Suite. The analysis indicated the ubiquitous presence of motifs 1–6 and 9–10 and additional structural elements across all NFAT family members. An exception was observed in NFAT5, which uniquely lacked both motif 7 and motif 8 (Figure 1B).
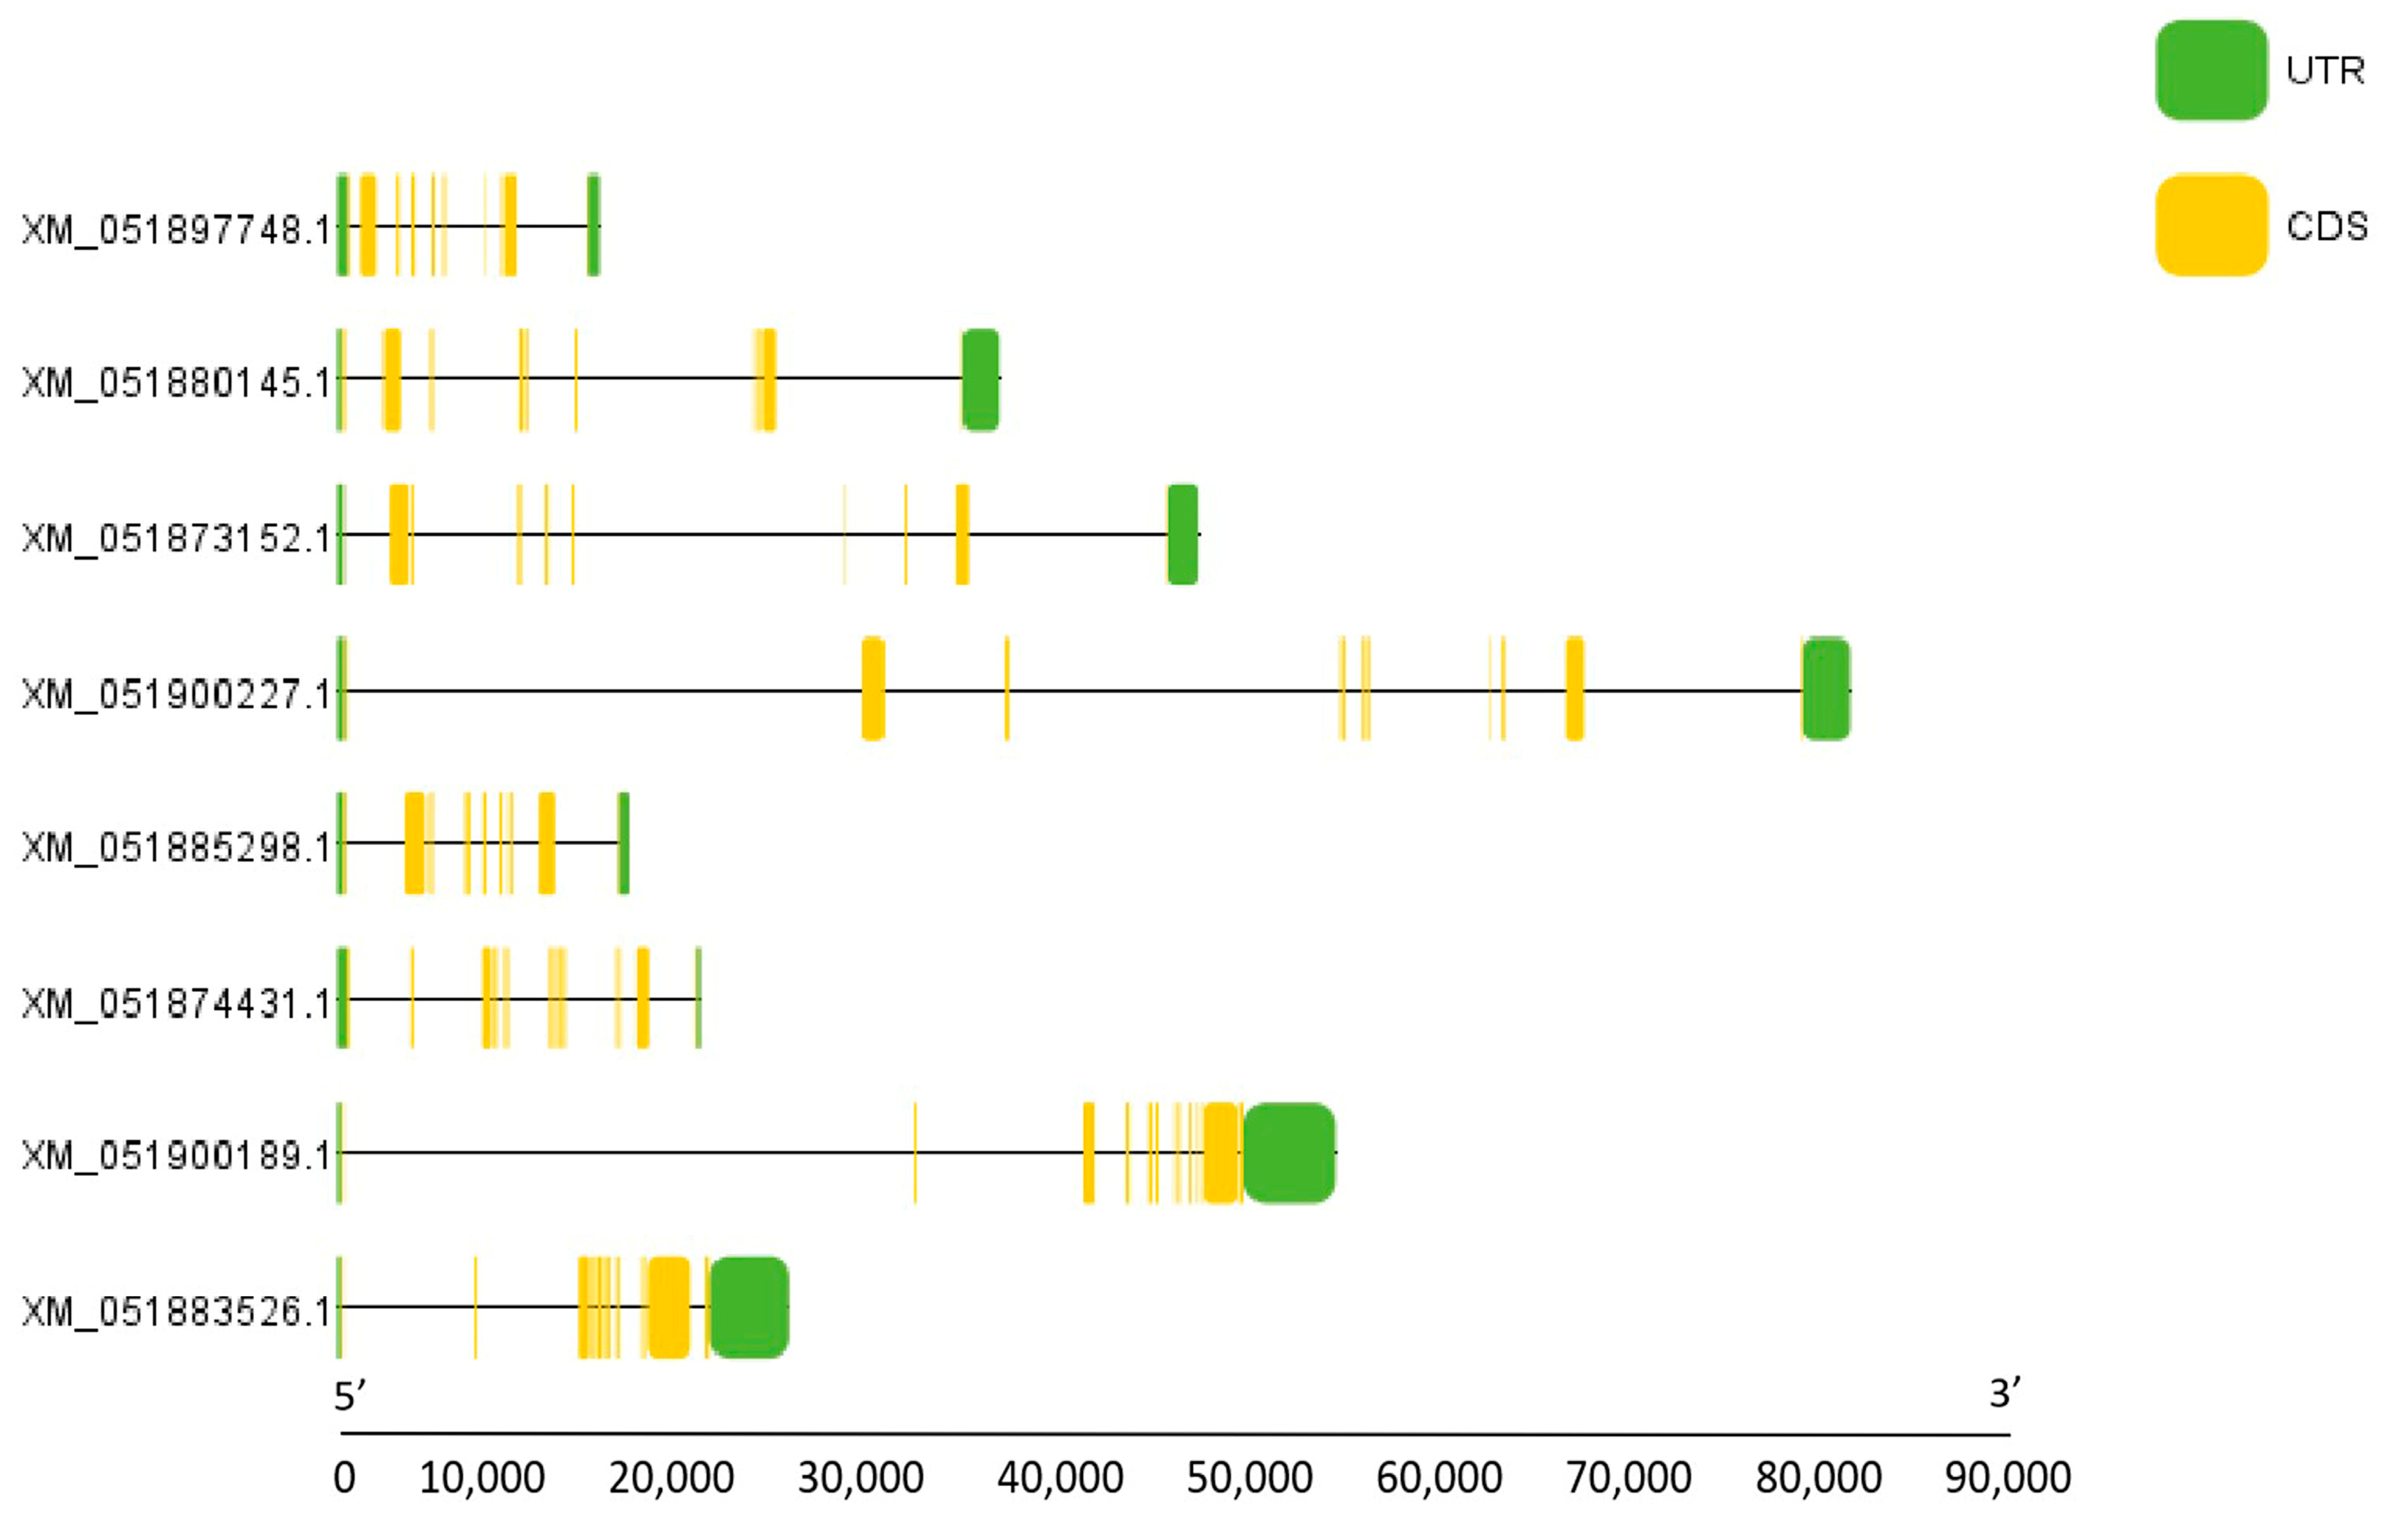
Domain analysis confirmed that all NFAT proteins possess the RHD and IPT regions, signifying high conservation within this family (Figure 1C). Gene structure analysis of the NFAT family members showed that there were great differences in the location and length of the UTR region and intron among different subfamilies, especially in the number of exons. However, the quantity and length of exons in the coding region were relatively similar (Figure 2).

3.3. Chromosomal Localization of NFAT Gene Family Members in Grass Carp

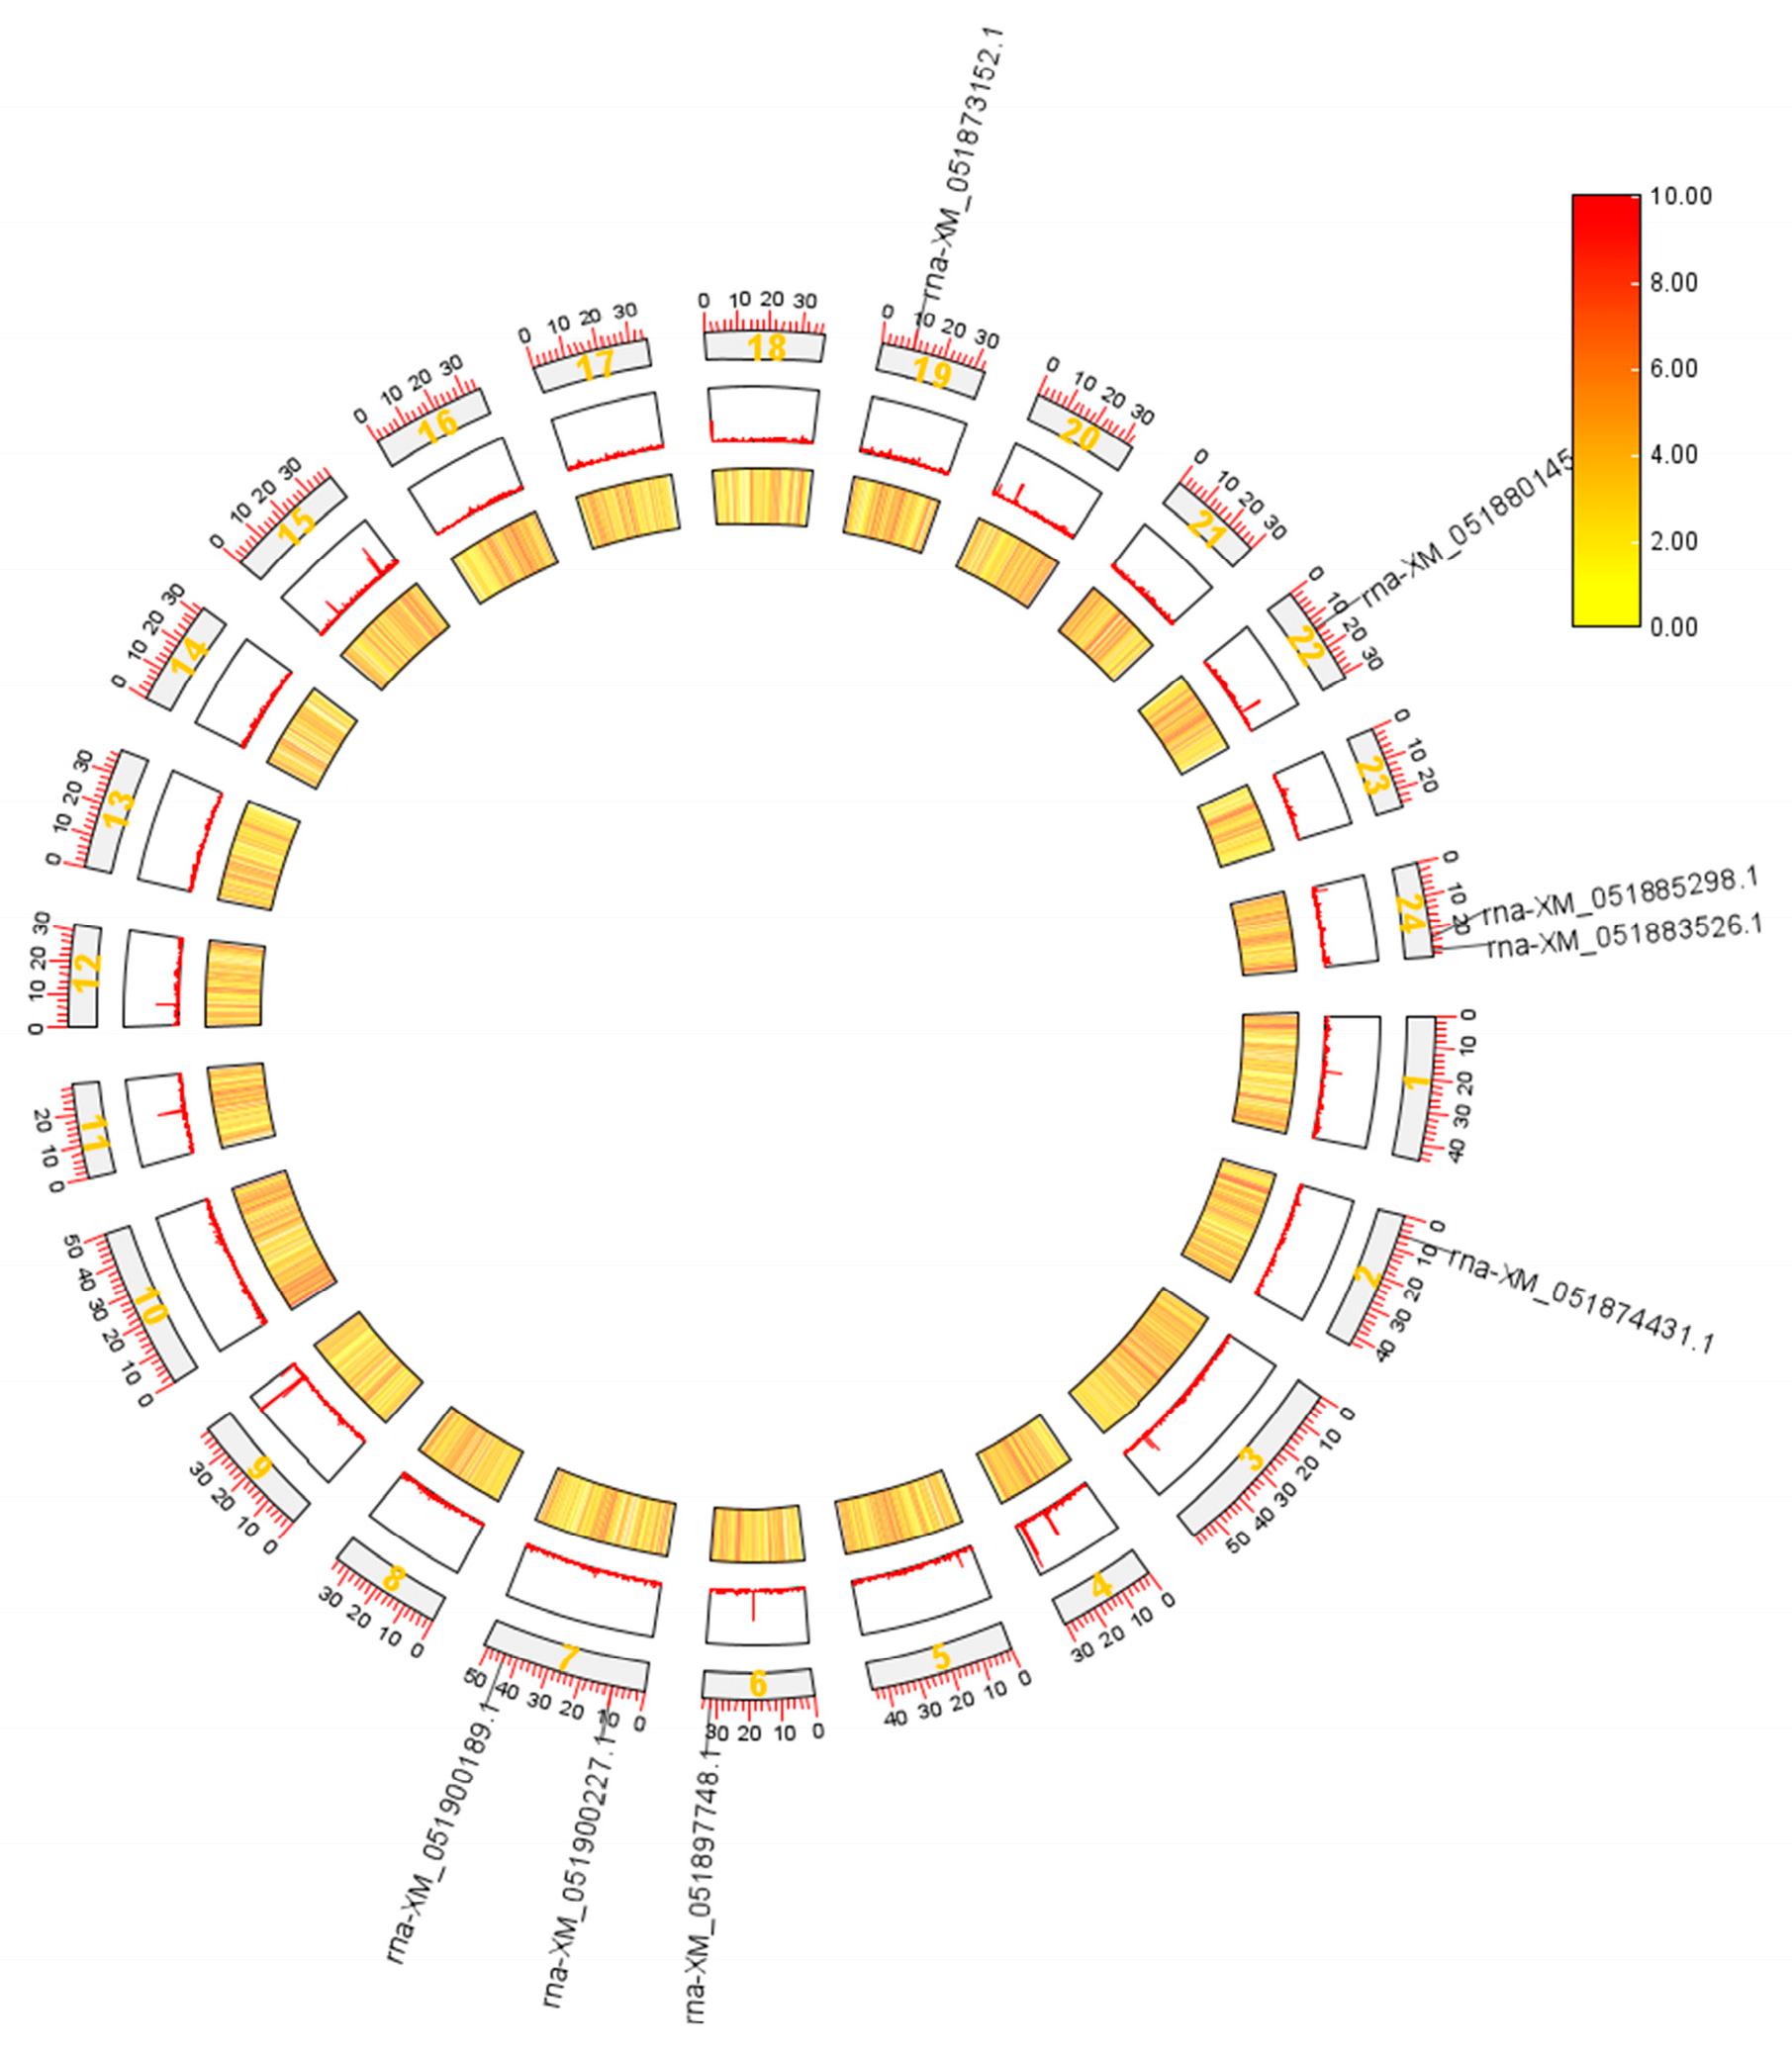
Eight members of the NFAT gene family were distributed on six chromosomes, which were the second, sixth, seventh, nineteenth, twenty-second, and twenty-fourth chromosomes through TBtools software analysis. Notably, there were two NFAT subunit genes on chromosomes 7 and 24, which are NFAT4a, NFAT5b and NFAT4b, NFAT5a, respectively (Figure 3).

3.4. Gene Collinearity Between Grass Carp NFAT Gene Family and Zebrafish

In order to further clarify the evolutionary characteristics of NFAT gene family members, a covariance comparison on the whole genome sequences of grass carp and zebrafish was implemented using the MCScanX module of TBtools. Through the optimization of MCScanX algorithm parameters, ten pairs of gene pairs were finally identified. Five subfamilies of the NFAT family have found homologous genes in zebrafish, indicating that the kinds and relative order of eight NFAT genes were more conserved and very close (Figure 4).

3.5. Sequence and Characteristics Analysis of CiNFAT1

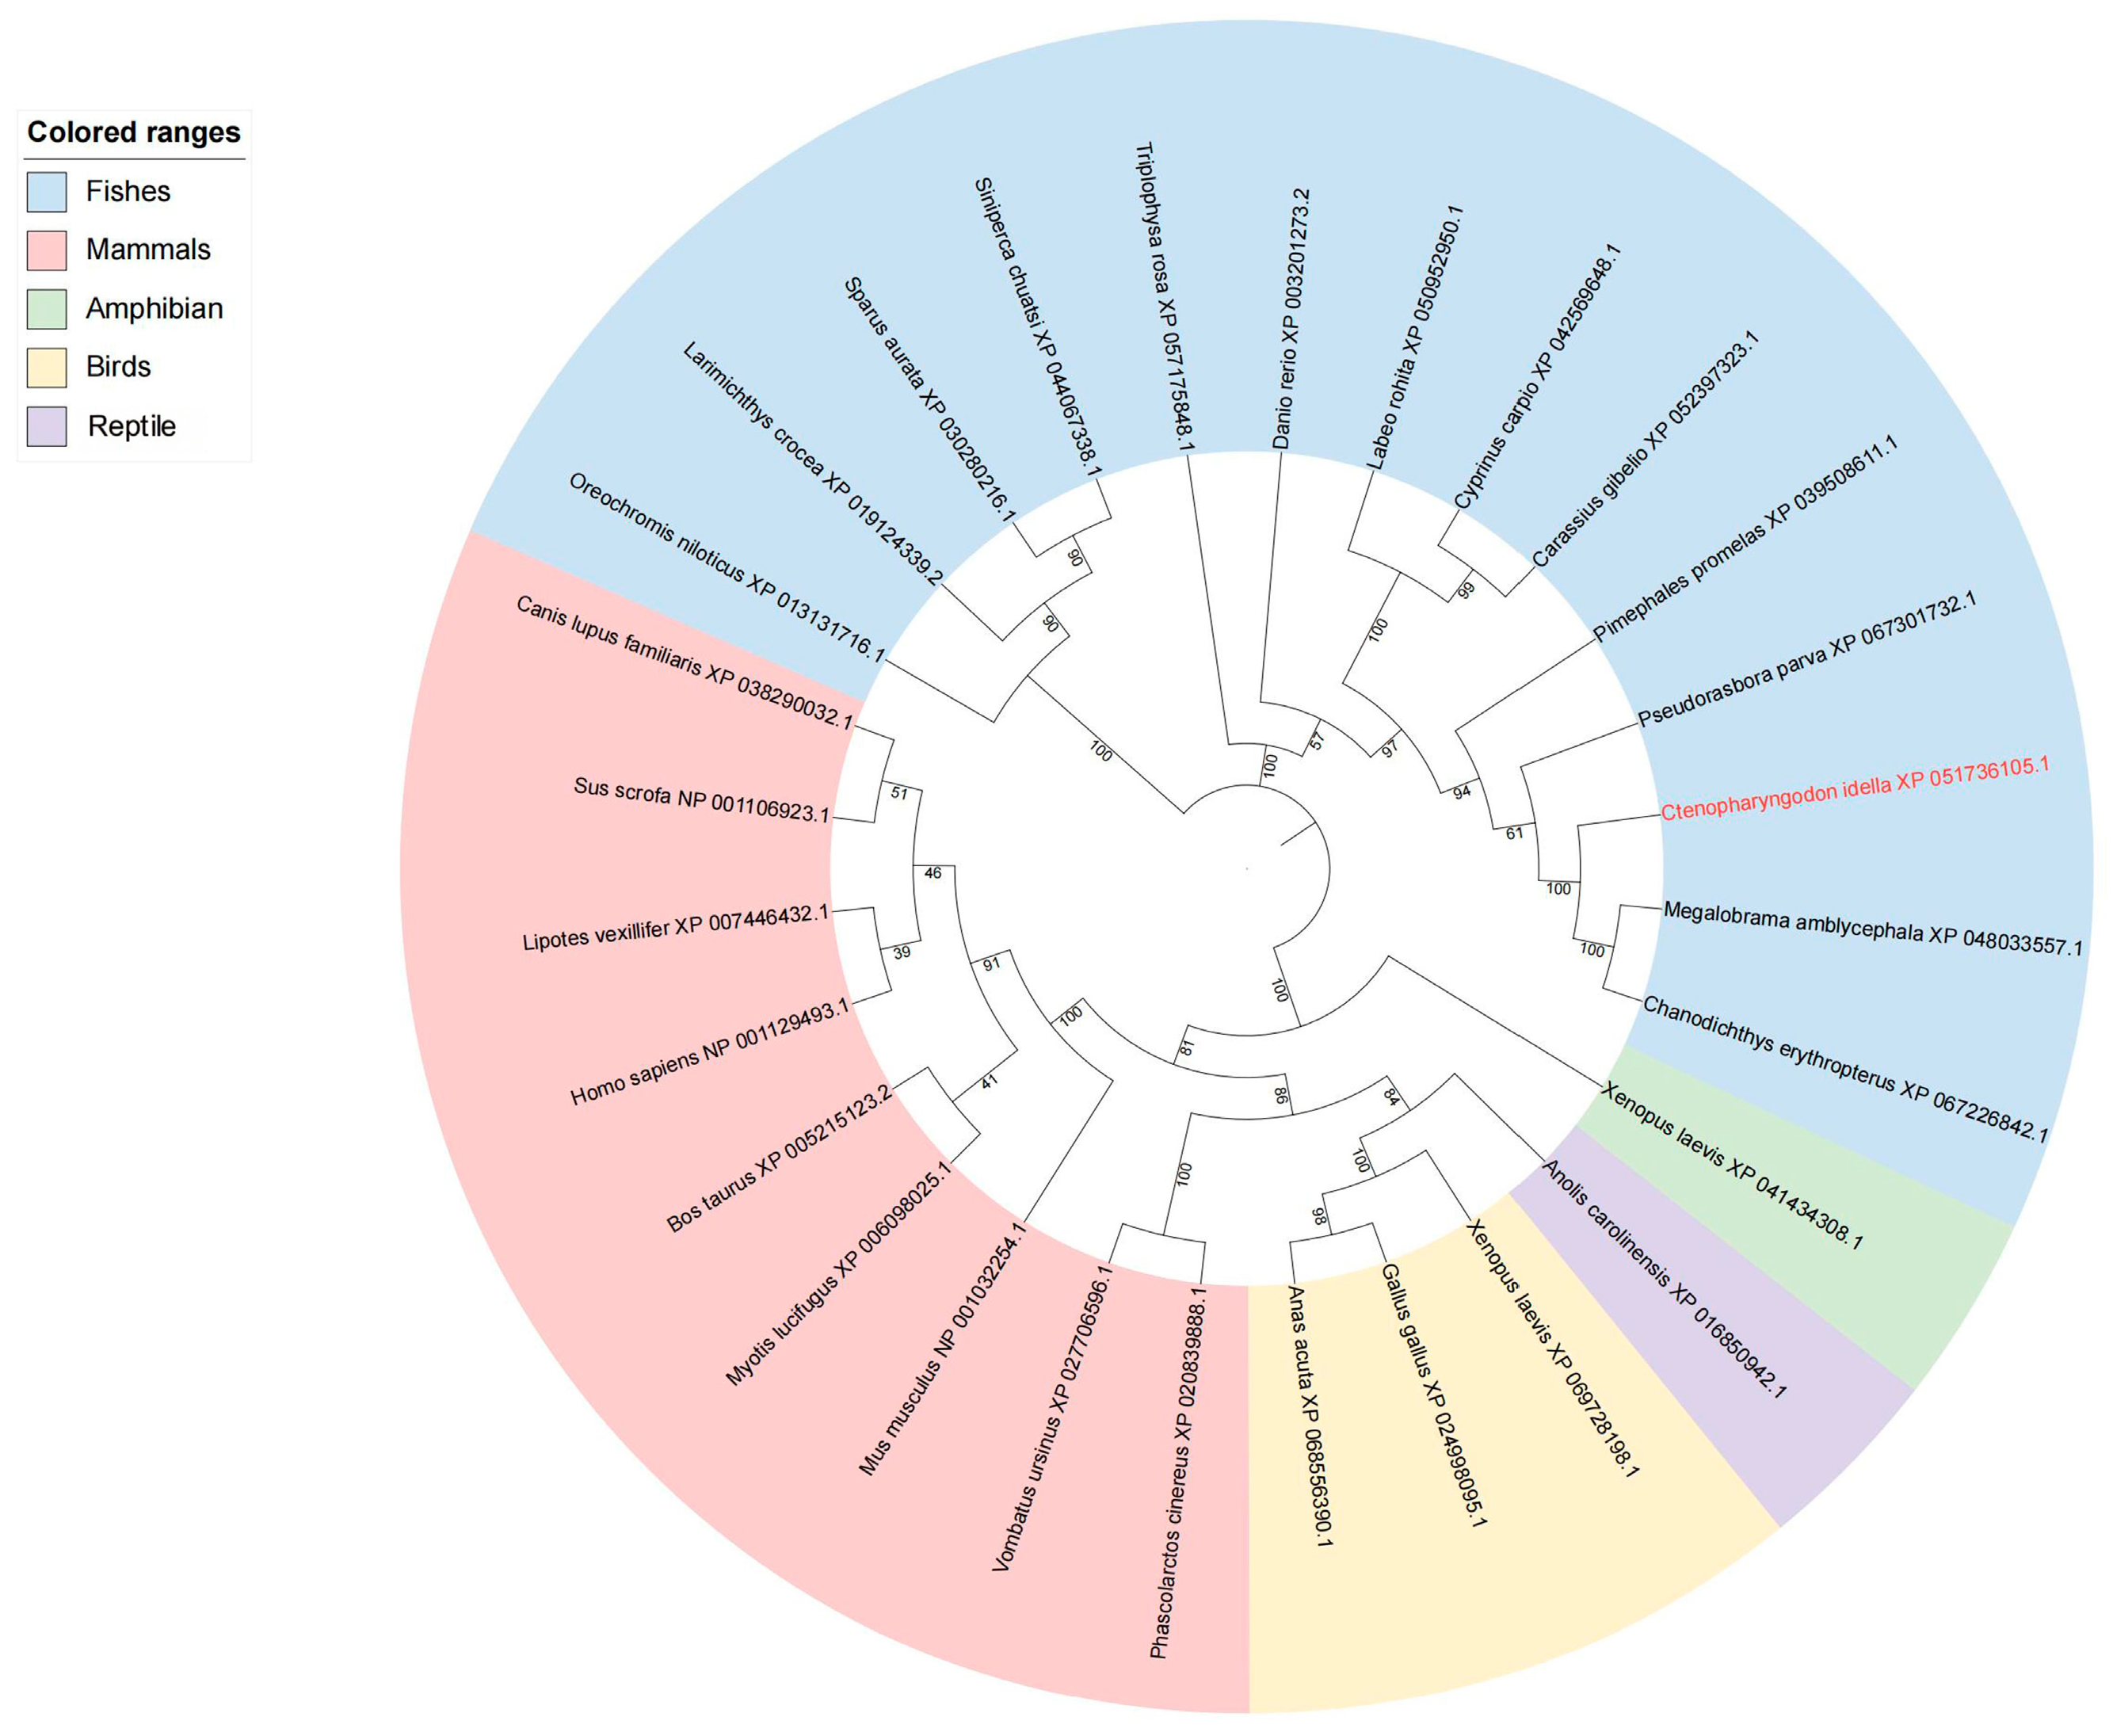
As shown in Figure S1, the open reading frame (ORF) regions of the CiNFAT1 gene were successfully cloned. The CiNFAT1 gene has a length of 2697 base pairs, encoding a protein of 898 amino acids and containing the RHD domain and IPT domain, which were located at 367–528 aa (yellow underlined marker in Figure S1) and 535–634 aa, respectively (green underlined marker in Figure S1). According to Expasy’s prediction, the relative molecular mass of CiNFAT1 protein was 98.8 kDa, and the predicted isoelectric point was 6.87. Multiple sequence alignment findings indicated that CiNFAT1’s amino acid sequence shared 98.66% similarity, its highest observed, with Megalobrama amblycephala (Table S4). At the same time, it was found that the repeat sequences in the RHD were highly conserved (Figure S2). For CiNFAT1, isoleucine at position 472 exhibited the greatest hydrophobicity, reaching a value of 2.167. Conversely, arginine at position 625 was the most hydrophilic, with a minimum value of −3.267. (Figure S3A). In addition, the prediction regarding the transmembrane structure showed that there was no transmembrane structural domain and no signal peptide in CiNFAT1 (Figure S3B,C). SMART structural domain prediction showed that CiNFAT1 contained a conserved RHD domain and an IPT domain, which were located at amino acid sites 367–528 and 535–634, respectively (Figure S4A). The tertiary structural model of CiNFAT1 was predicted to contain 6 α-helices and 27 β-folds using the Swiss model (Figure S4B). The evolutionary analysis of NFAT1 from 28 species of five categories was carried out by the NJ method in MEGA software. The results showed that CiNFAT1 had the highest homology with Megalobrama amblycephala and then clustered with Cyprinidae fish such as Cyprinus carpio and zebrafish (Figure 5).

3.6. The mRNA Expression Levels of CiNFAT1 In Vivo and In Vitro After GCRV Infection

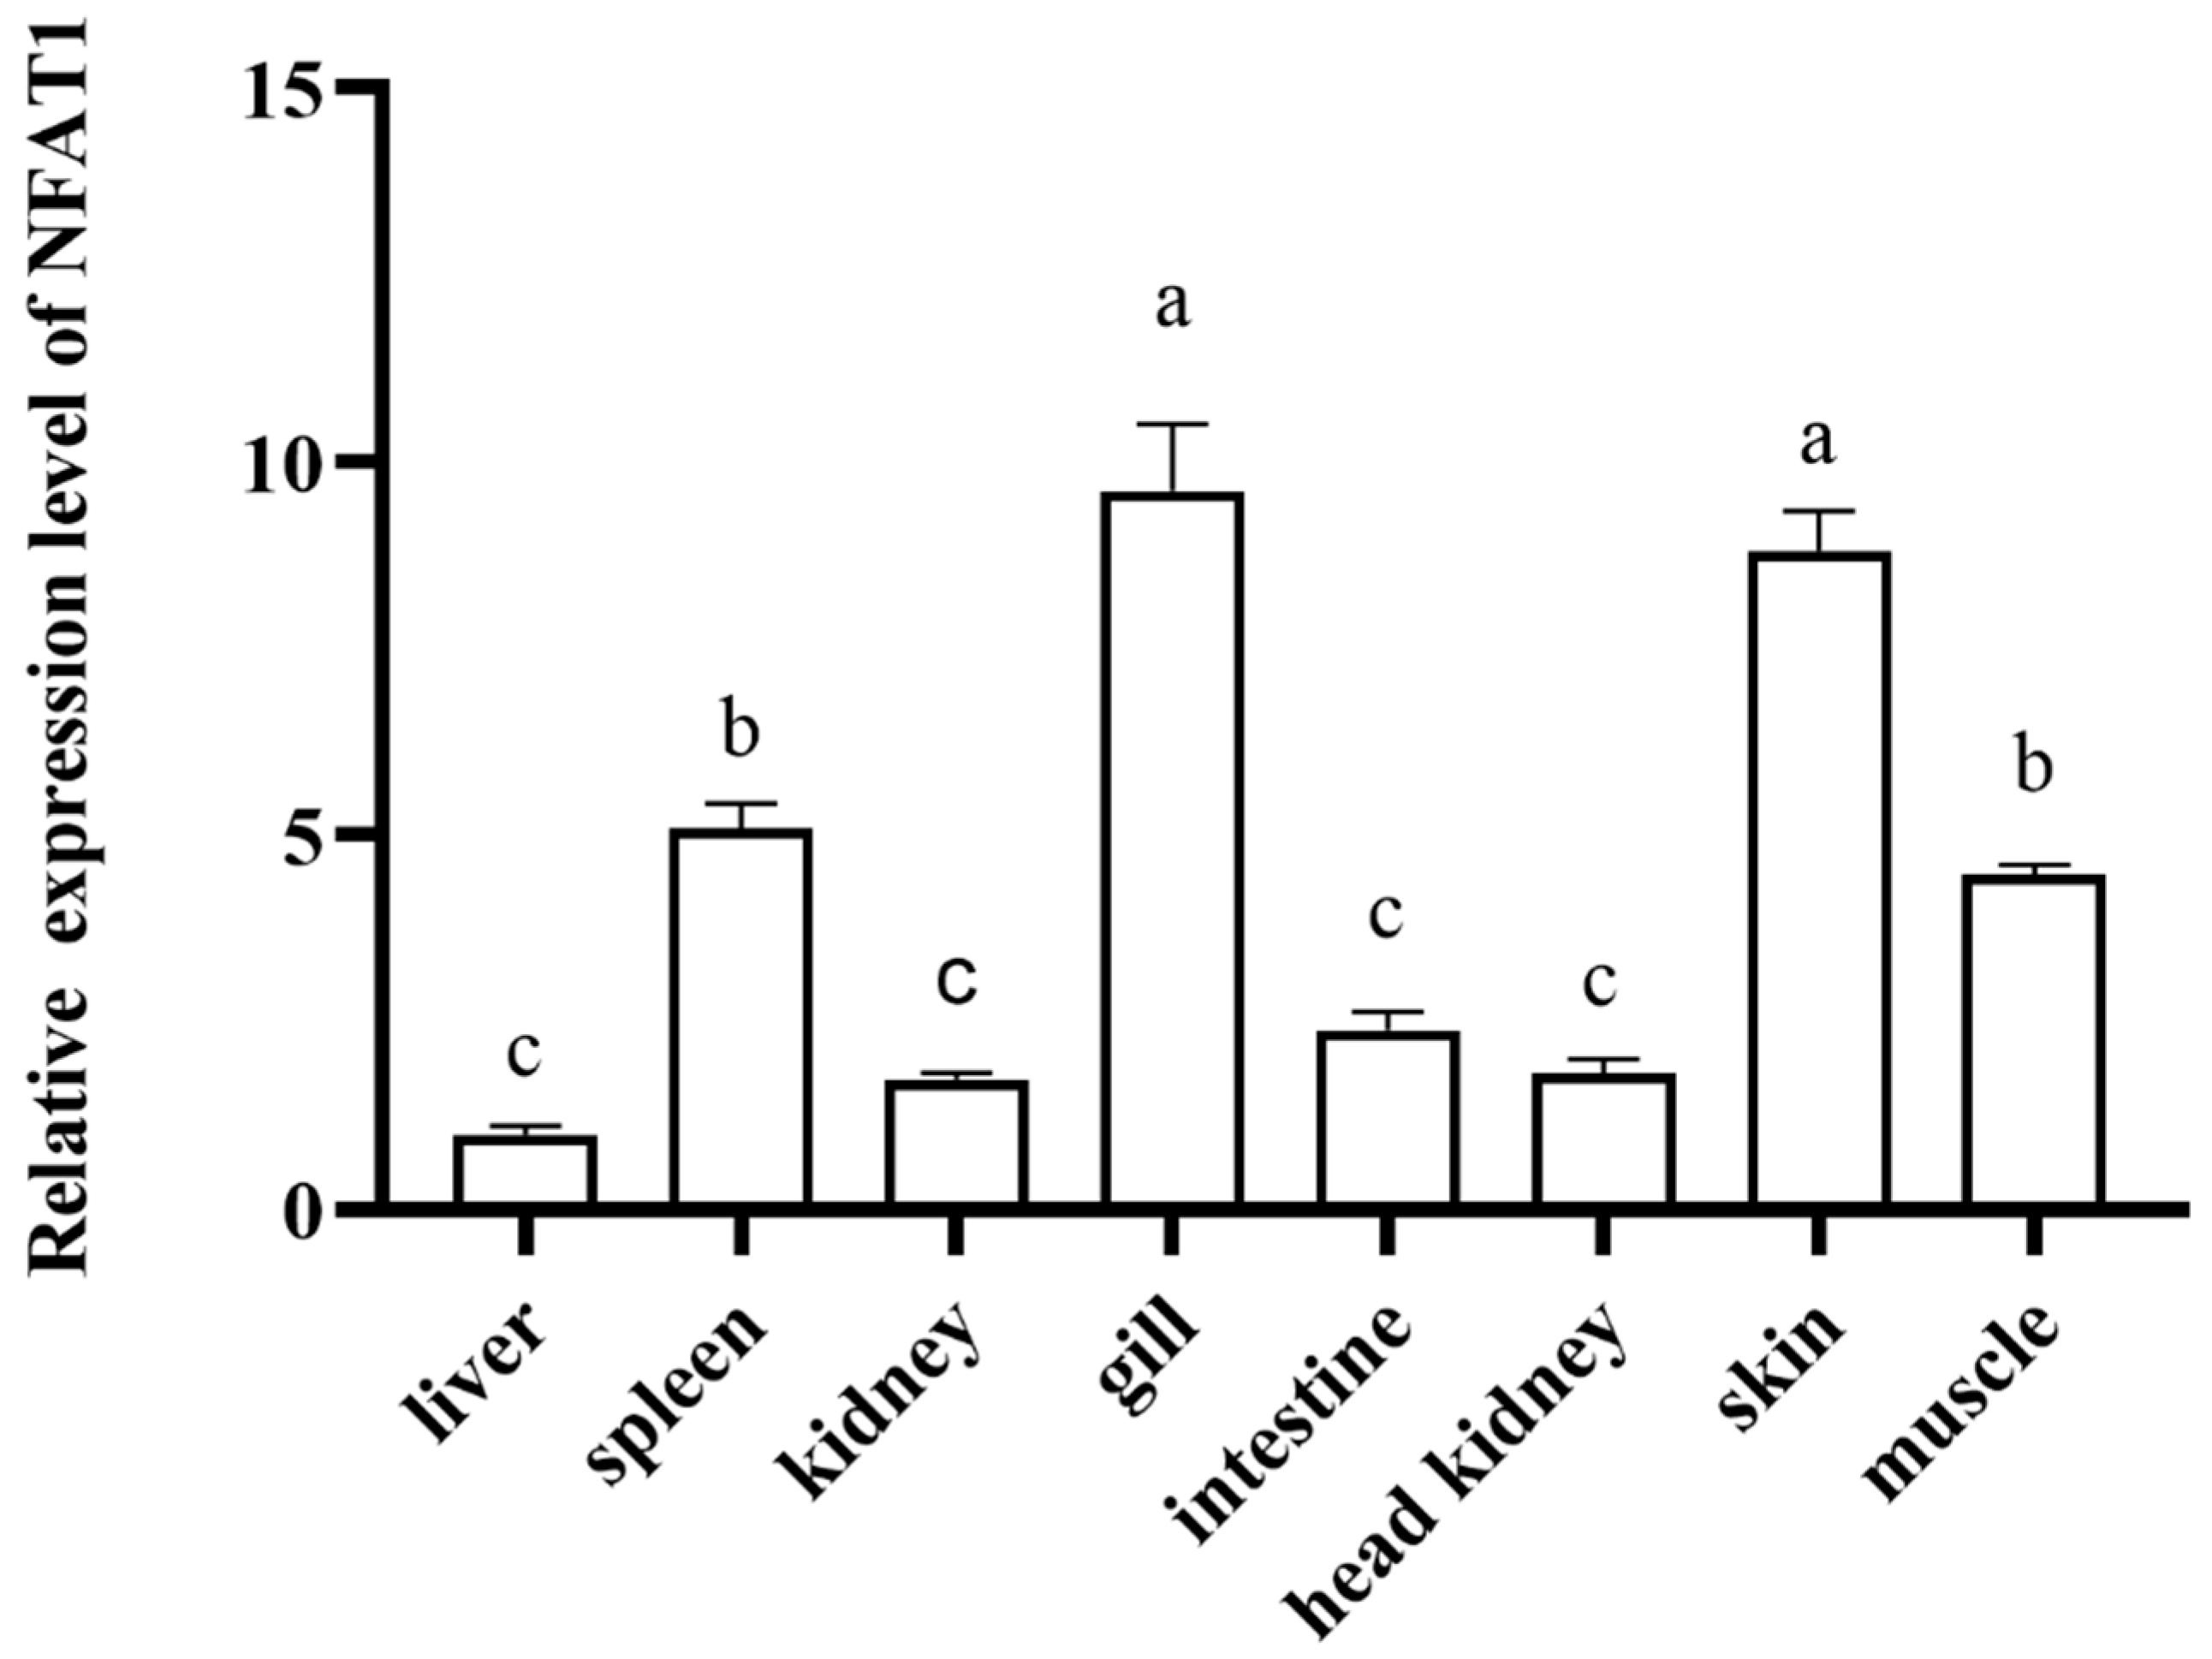
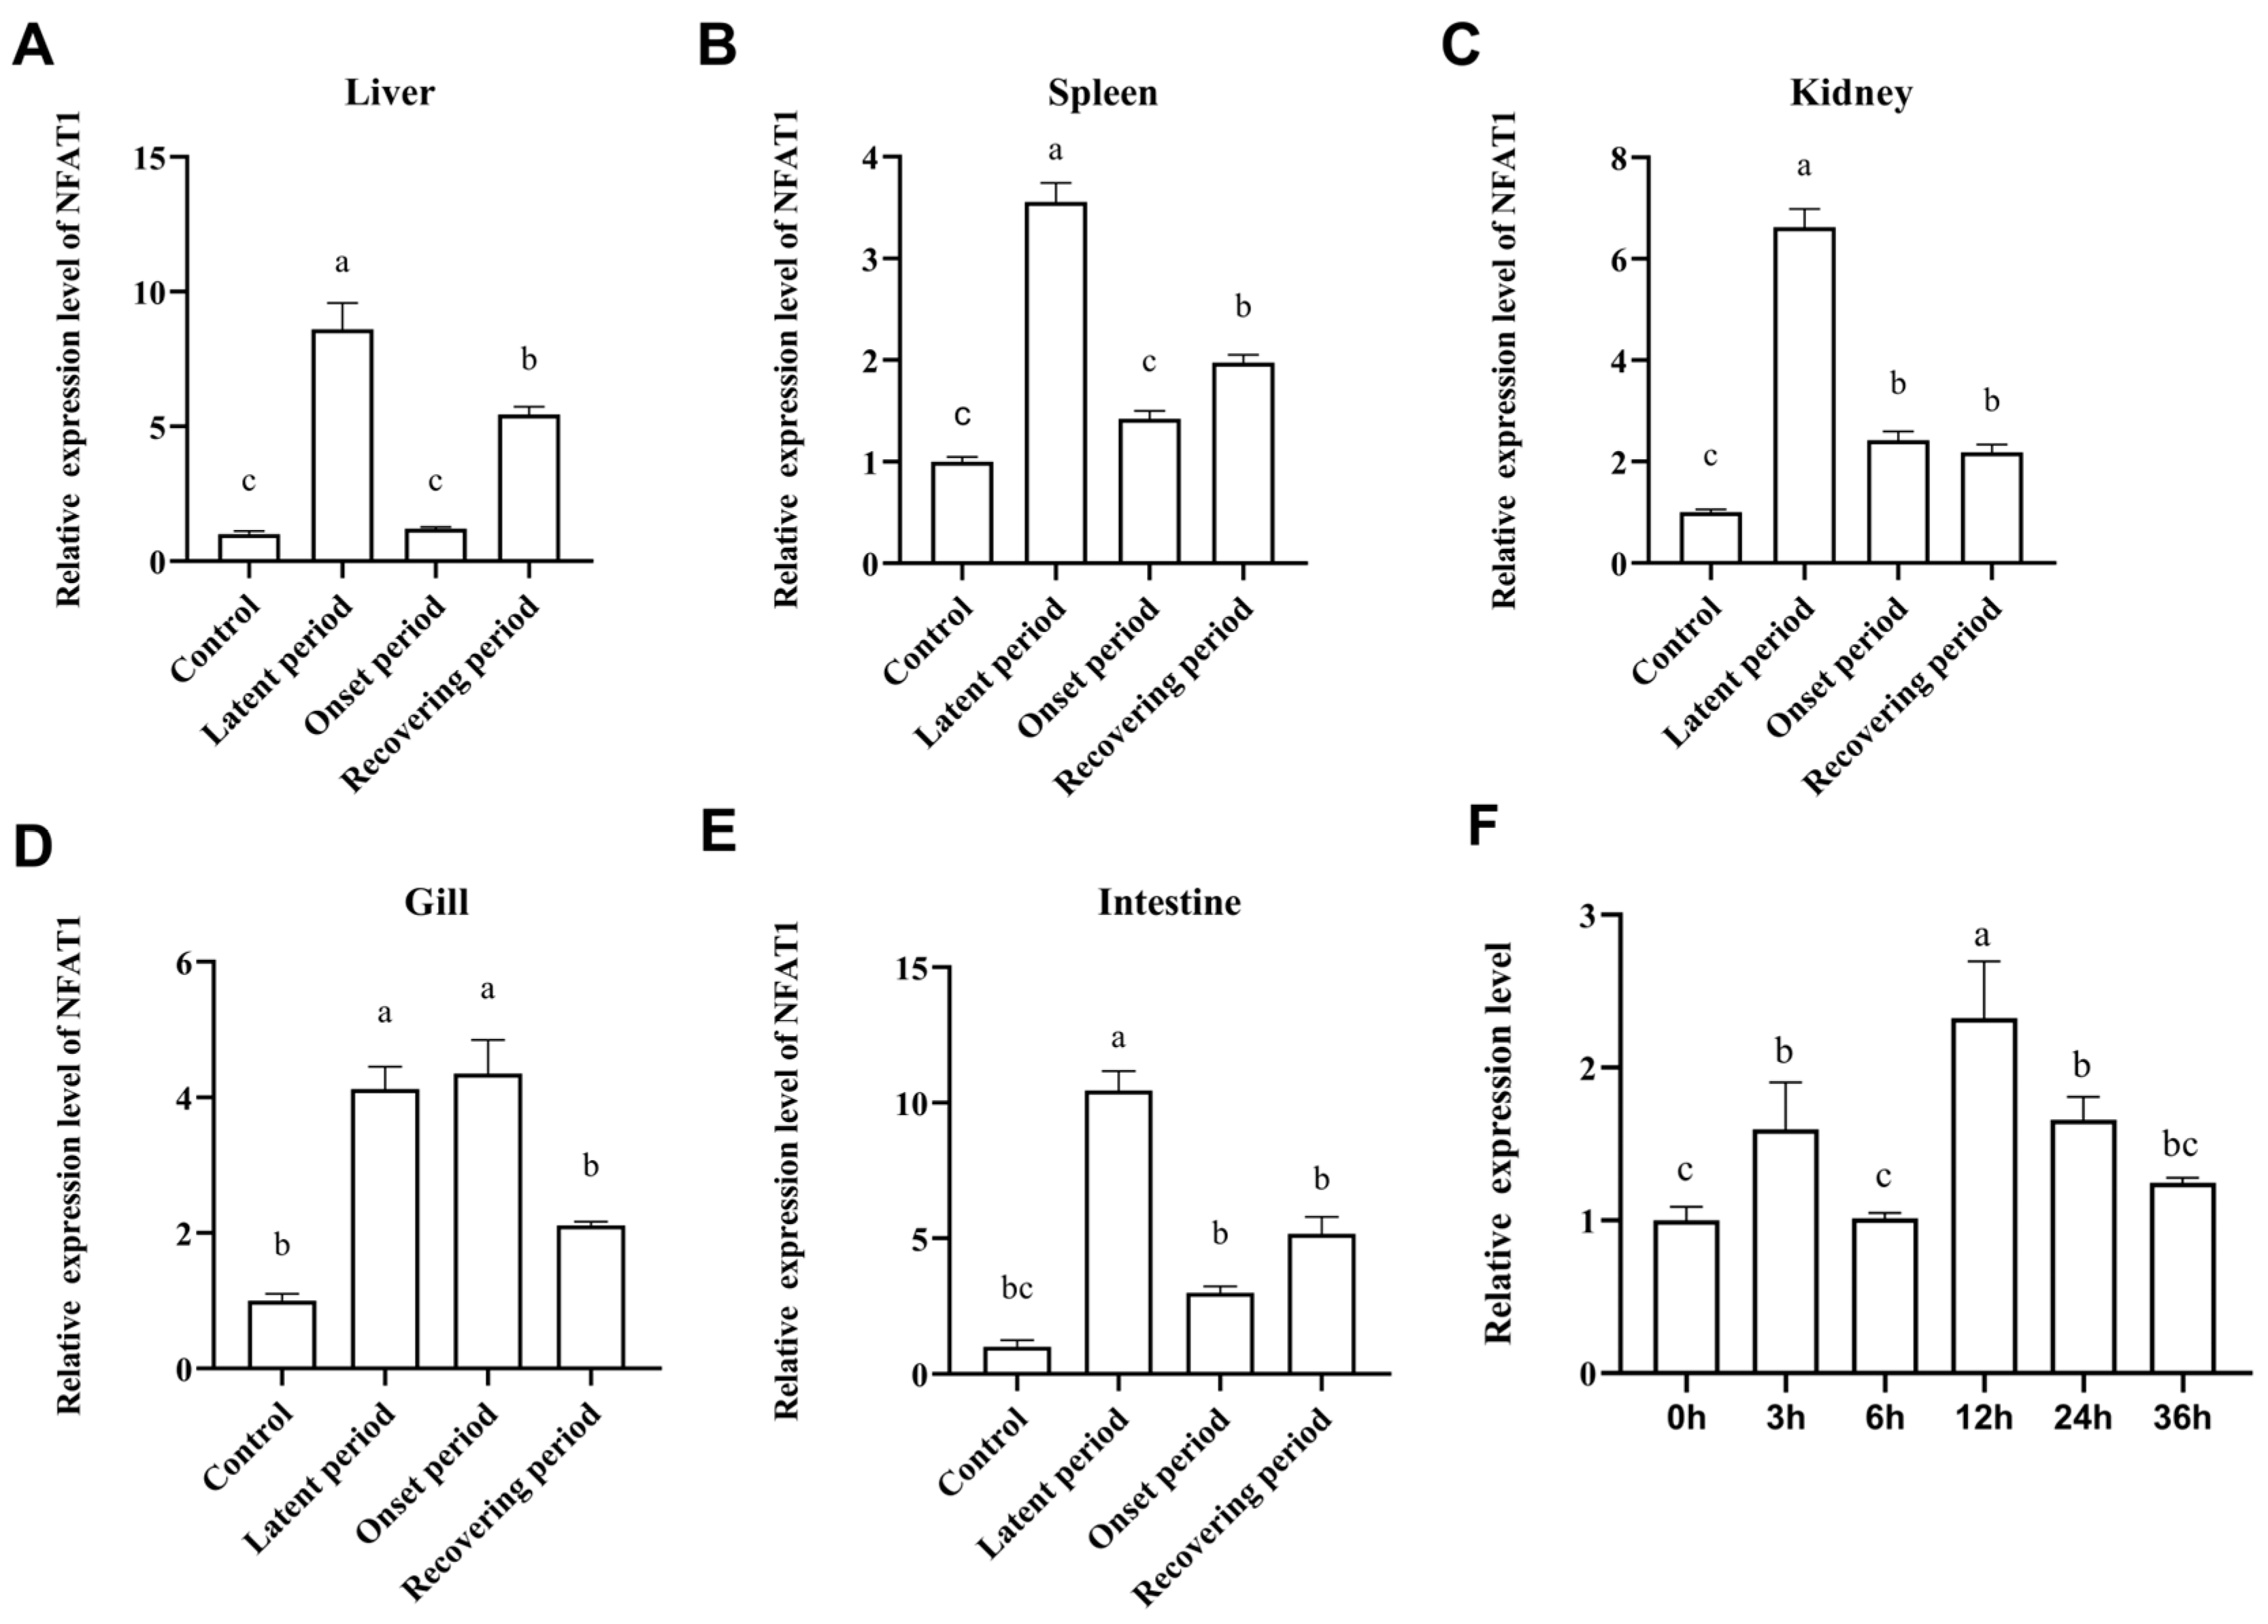
The expression characteristics of CiNFAT1 in several tissues of healthy grass carp were analyzed by real-time fluorescence quantification. The findings indicated that eight tissues had the CiNFAT1 mRNA transcript. Expression of CiNFAT1 was highest in the gill and skin, markedly elevated (p < 0.05) compared to other tissue types. Although its levels in the spleen were elevated relative to most other sites, no statistical distinction was found when contrasted with muscle expression. While CiNFAT1 expression proved minimal in liver tissue, it did not significantly differ from the levels observed in the kidney, intestine, or head kidney (Figure 6). After GCRV infection, the expression trend of CiNFAT1 in the liver, spleen, kidney, gill, and intestine increased first and then decreased, and all of them showed a peak. Among them, the expression levels in liver, spleen, and intestine showed a triphasic pattern, reaching the peak at the latent period, then gradually decreasing, and slowly increasing in the recovering period (Figure 7A,B,E). In the kidney and gill, there was first an increase, then a decrease in gene expression, with the peaks appearing at latent and onset periods after challenge, respectively (Figure 7C,D).
Within 36 h of GCRV infection, the expression of NFAT1 in CIK cells showed a tetraphasic pattern, which increased before 3 h, began to decrease at 6 h, peaked at 12 h, and then decreased. The first increase peak was at 3 h after infection, and the second increase peak was at 12 h, when the expression level was the highest, followed by a gradual decline (Figure 7F).

3.7. GCRV Infection Induces CiNFAT1 Transfer from Cytoplasm to Nucleus in CIK Cells

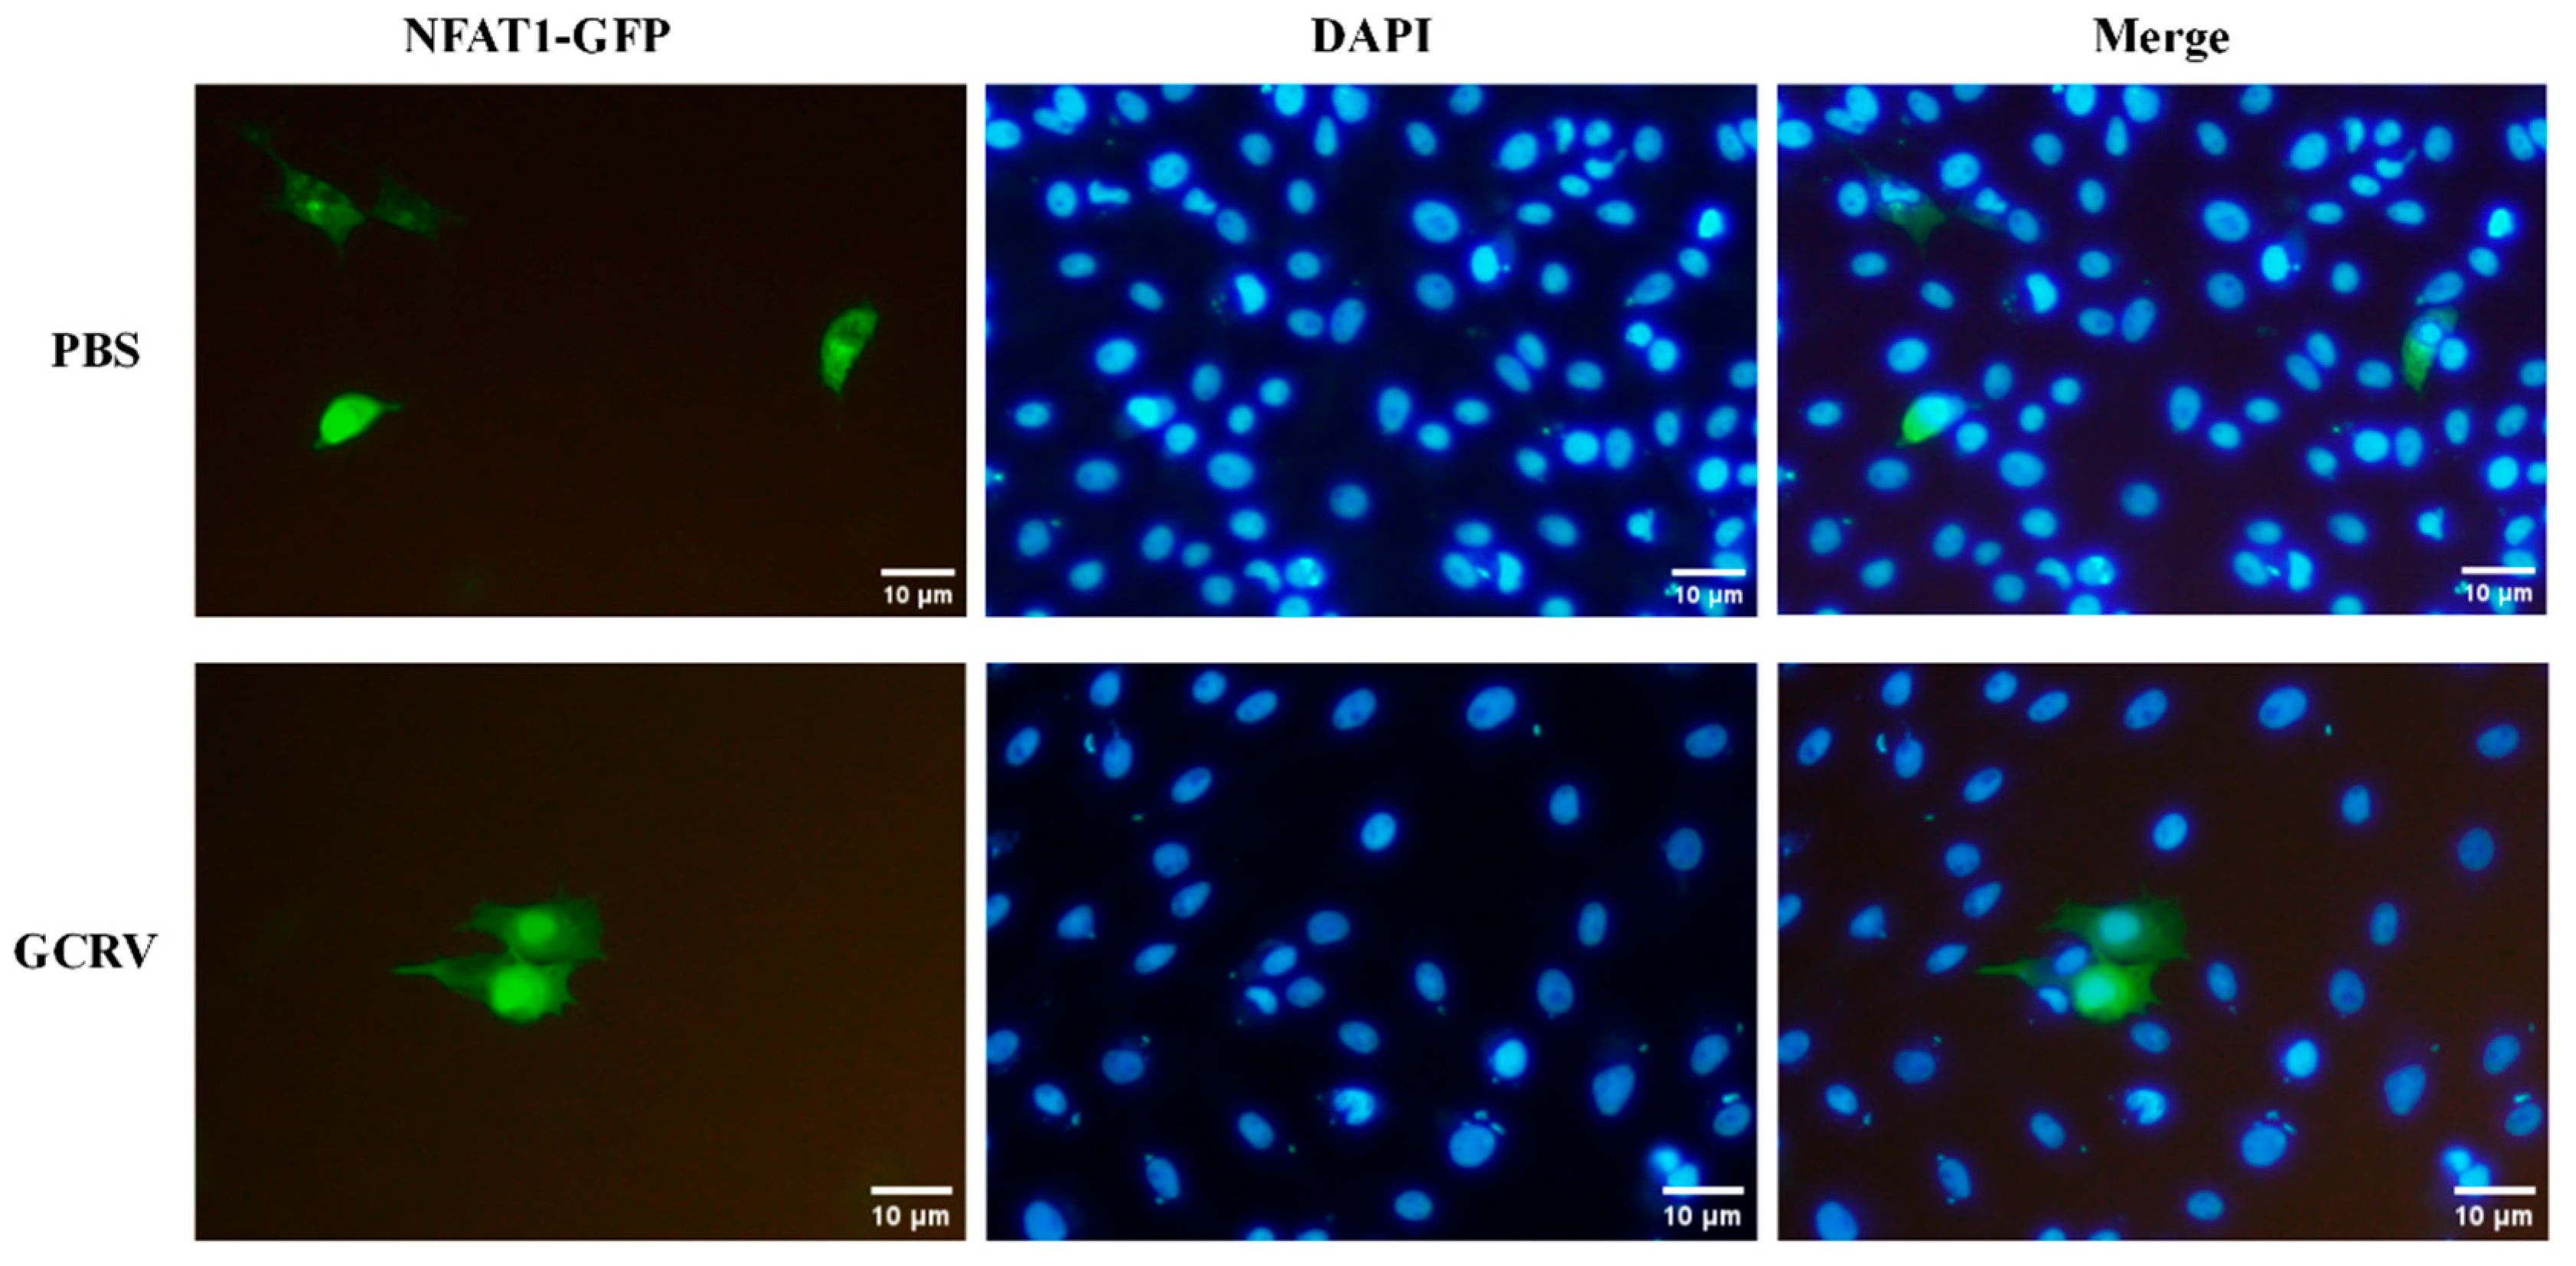
The findings of subcellular localization indicated that NFAT1 in uninfected CIK cells was mainly distributed in the cytoplasm. After GCRV stimulation, the fluorescence was obviously aggregated into the nucleus, indicating that NFAT1 was transferred from the cytoplasm to the nucleus (Figure 8).

3.8. NFAT1 Regulates Interferon and Inflammatory Cytokines Levels Following GCRV Infection

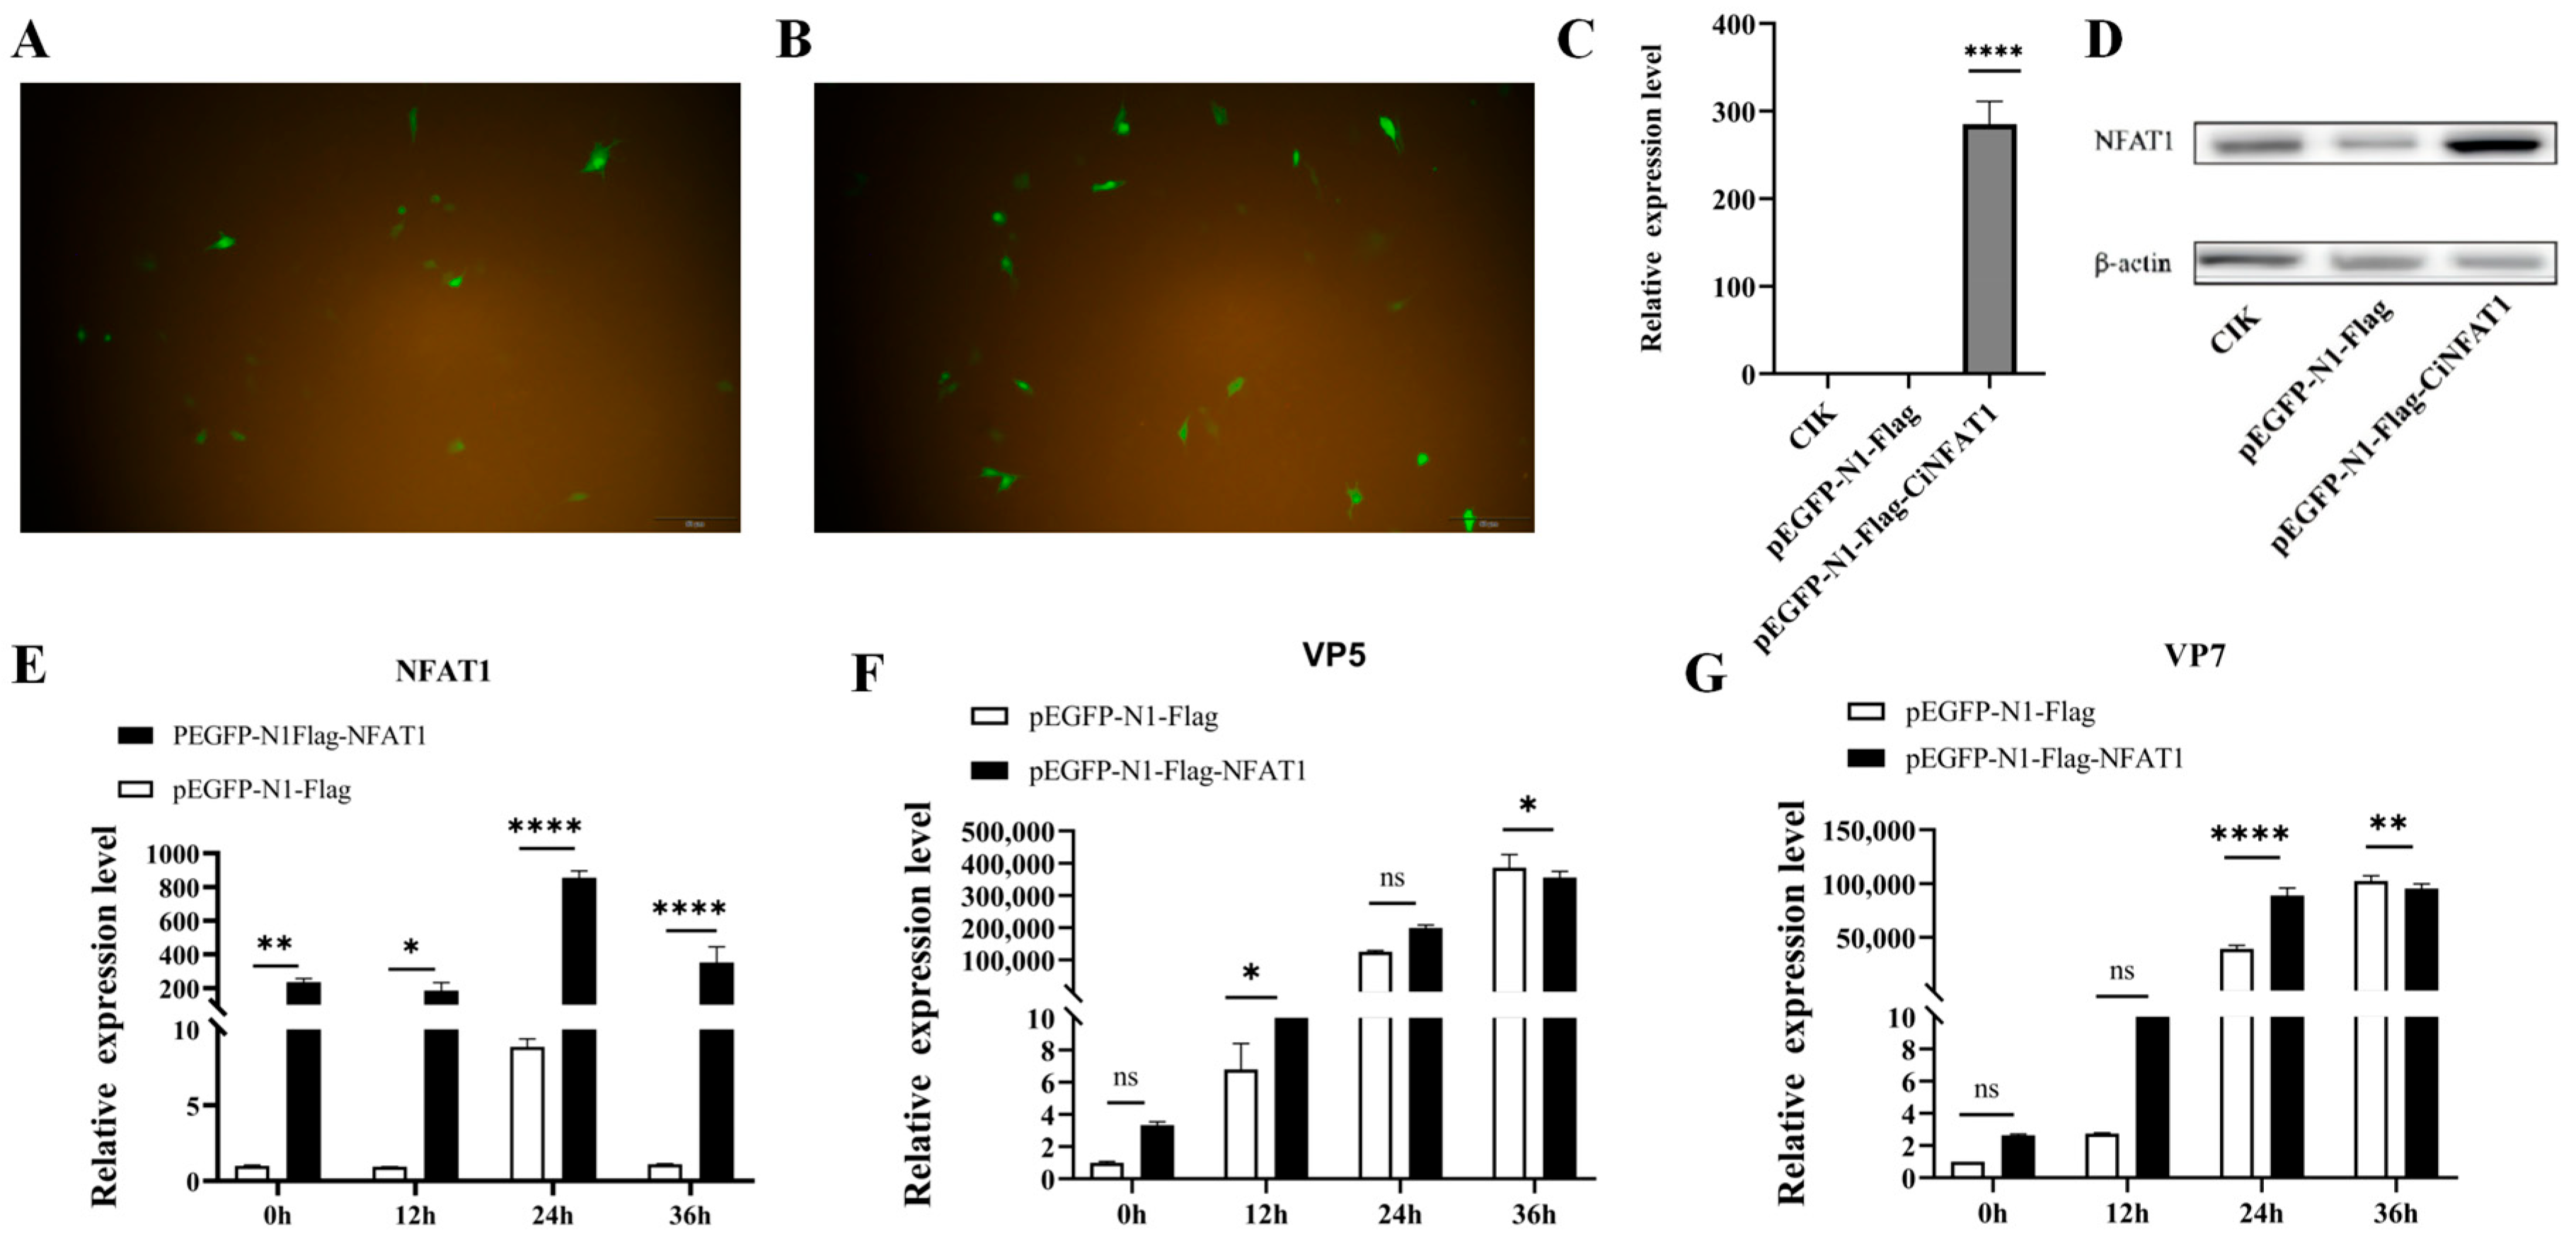
An overexpression experiment of CiNFAT1 was conducted in CIK to determine its effect on the GCRV challenge, and successful overexpression was confirmed (Figure 9A,B). After transient transfection of pEGFP-N1-Flag-NFAT1 recombinant plasmid, the mRNA expression of grass carp NFAT1 was obviously increased in CIK (p < 0.05) (Figure 9C). The protein expression of CiNFAT1 was detected by the Flag tag antibody, and the protein band size was about 98 kDa (Figure 9D), which was in line with the anticipated outcome. After GCRV stimulation, the expression of NFAT1 in both the overexpression group and the control group showed a bimodal trend, reaching a peak at 24 h. At 0–24 h, compared to the controls, the overexpression group’s viral replication was greater. After 36 h, viral replication of the overexpression group was significantly lower (Figure 9E–G).
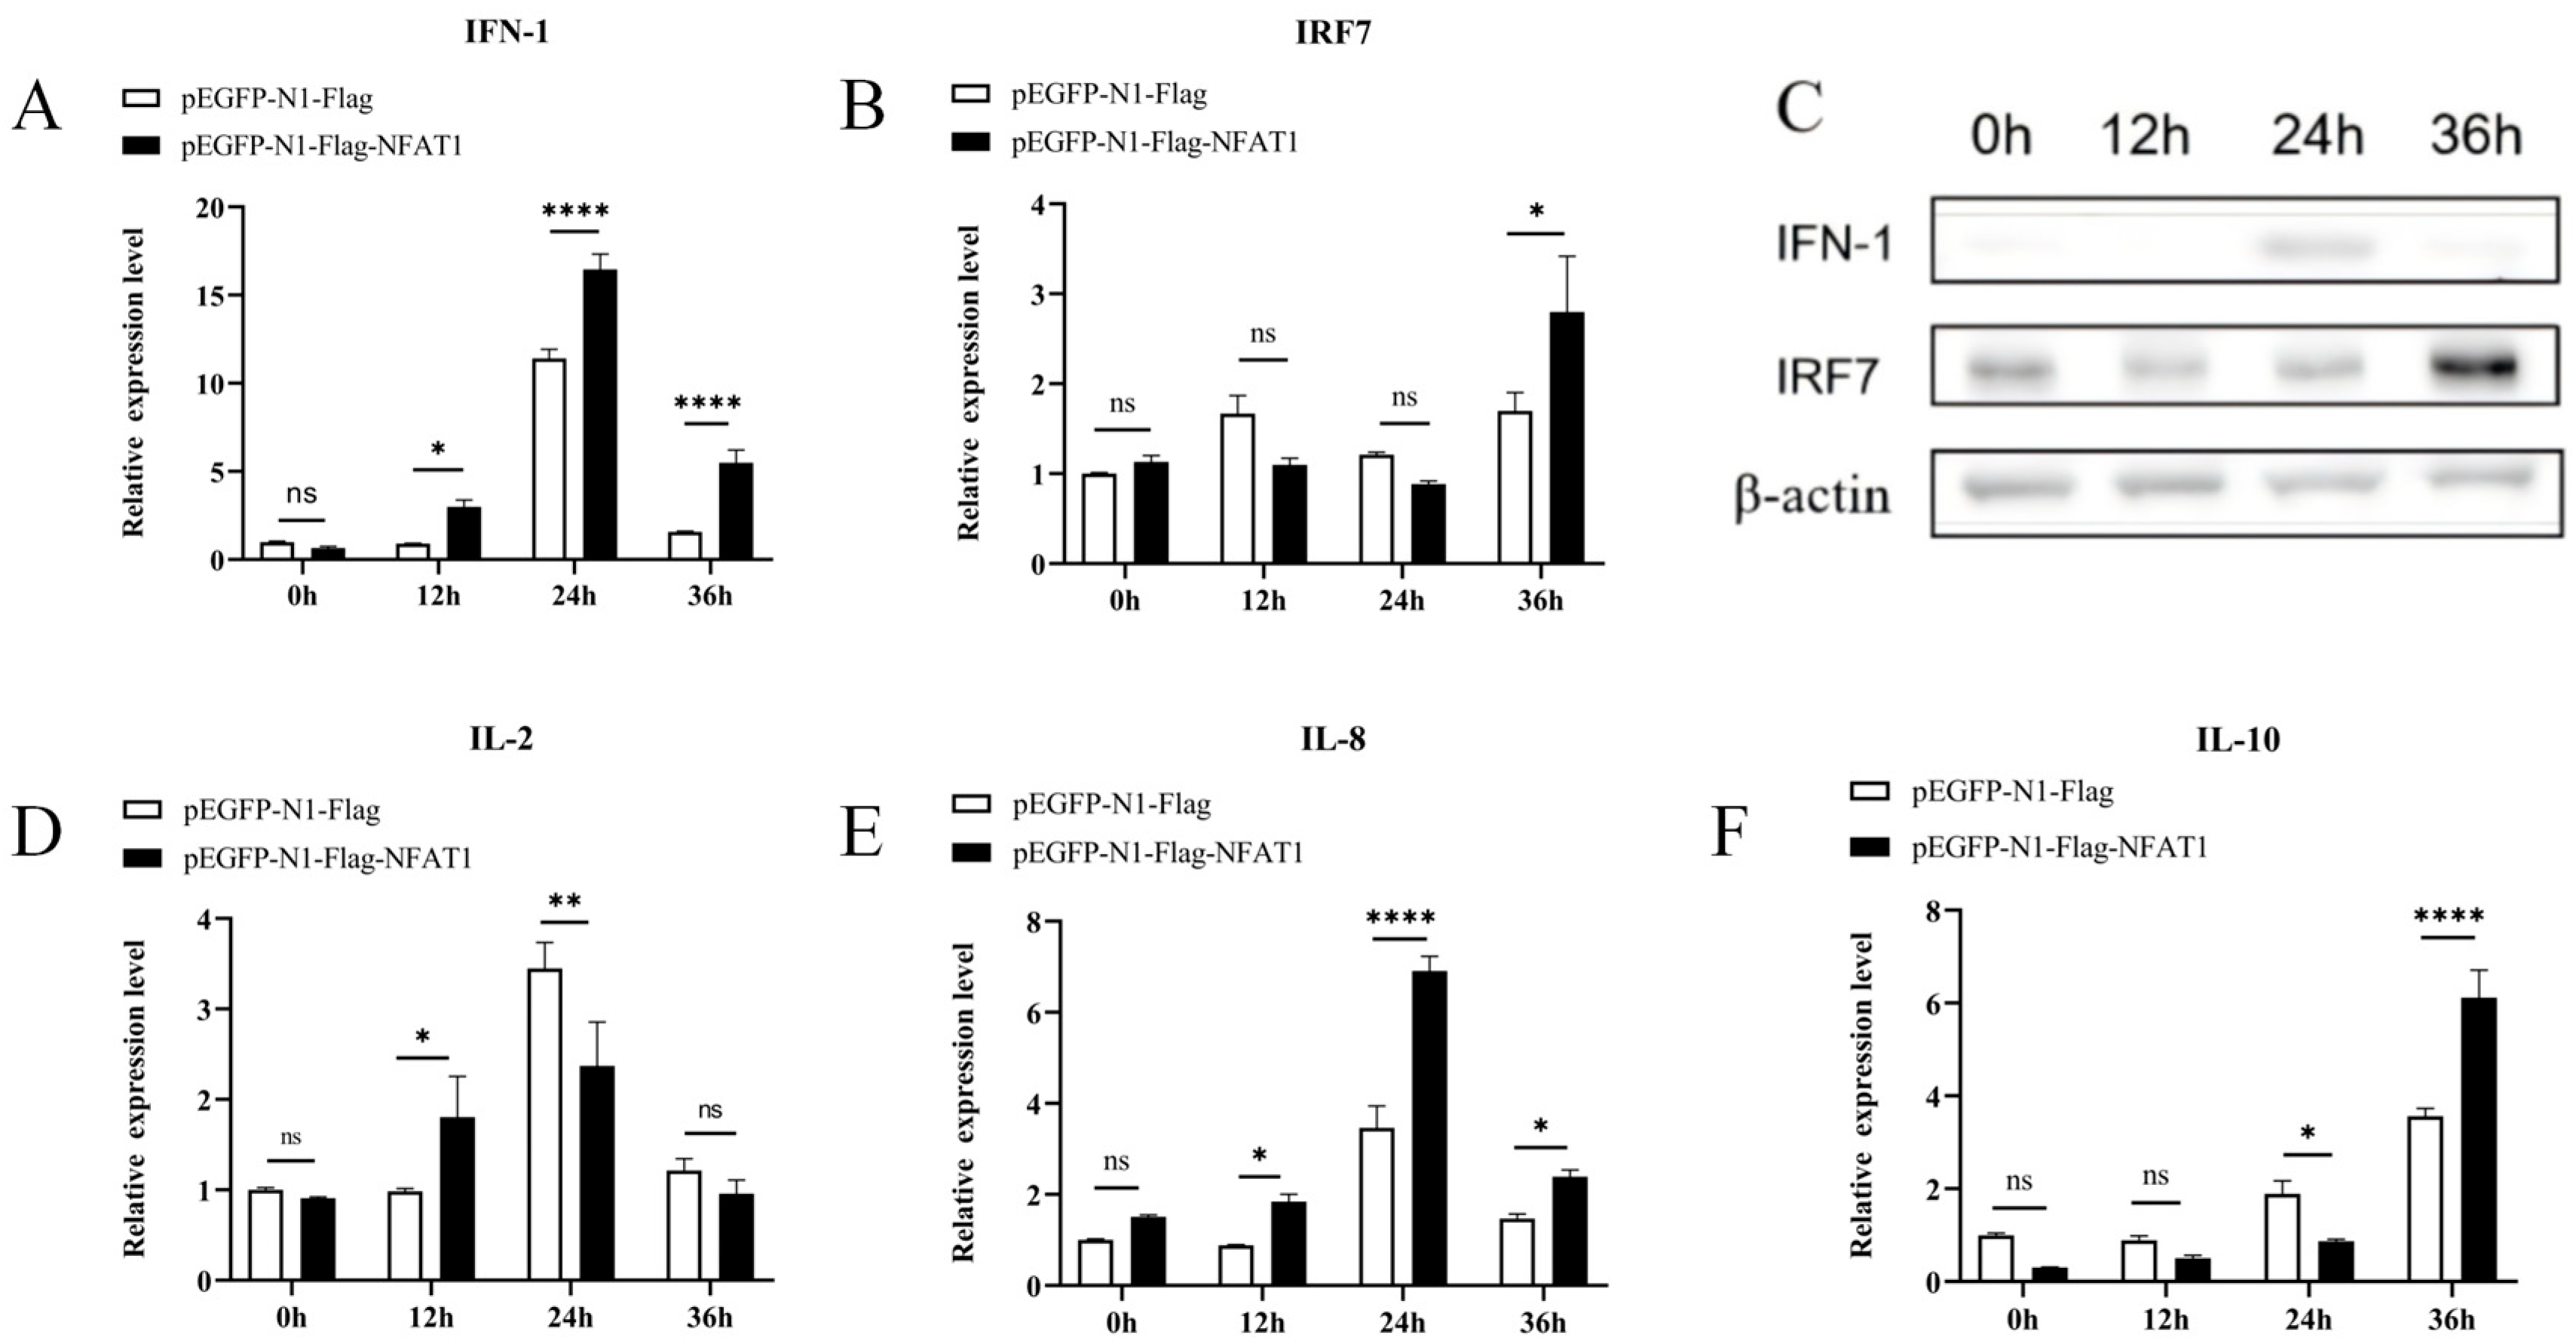
To look at how NFAT1 regulates cytokine expression, several cytokines were also examined in the interim. After overexpression of NFAT1, Interferon I (IFN-I) (Figure 10A) and Interferon regulatory factor 7 (IRF7) (Figure 10B) both had greater mRNA expression levels than the control group, peaking at 24 and 36 h, respectively. Protein expression patterns of IFN and IRF7 were concordant with their mRNA expression patterns (Figure 10C). The expression levels of IL-2 and IL-8 increased first and then decreased with the challenge time. At 24 h, the expression of IL-2 in the controls was higher (Figure 10D), while the results of IL-8 were opposite (Figure 10E). At the 36-hour mark, IL-10 expression was markedly elevated in the overexpression cohort compared to controls (Figure 10F).
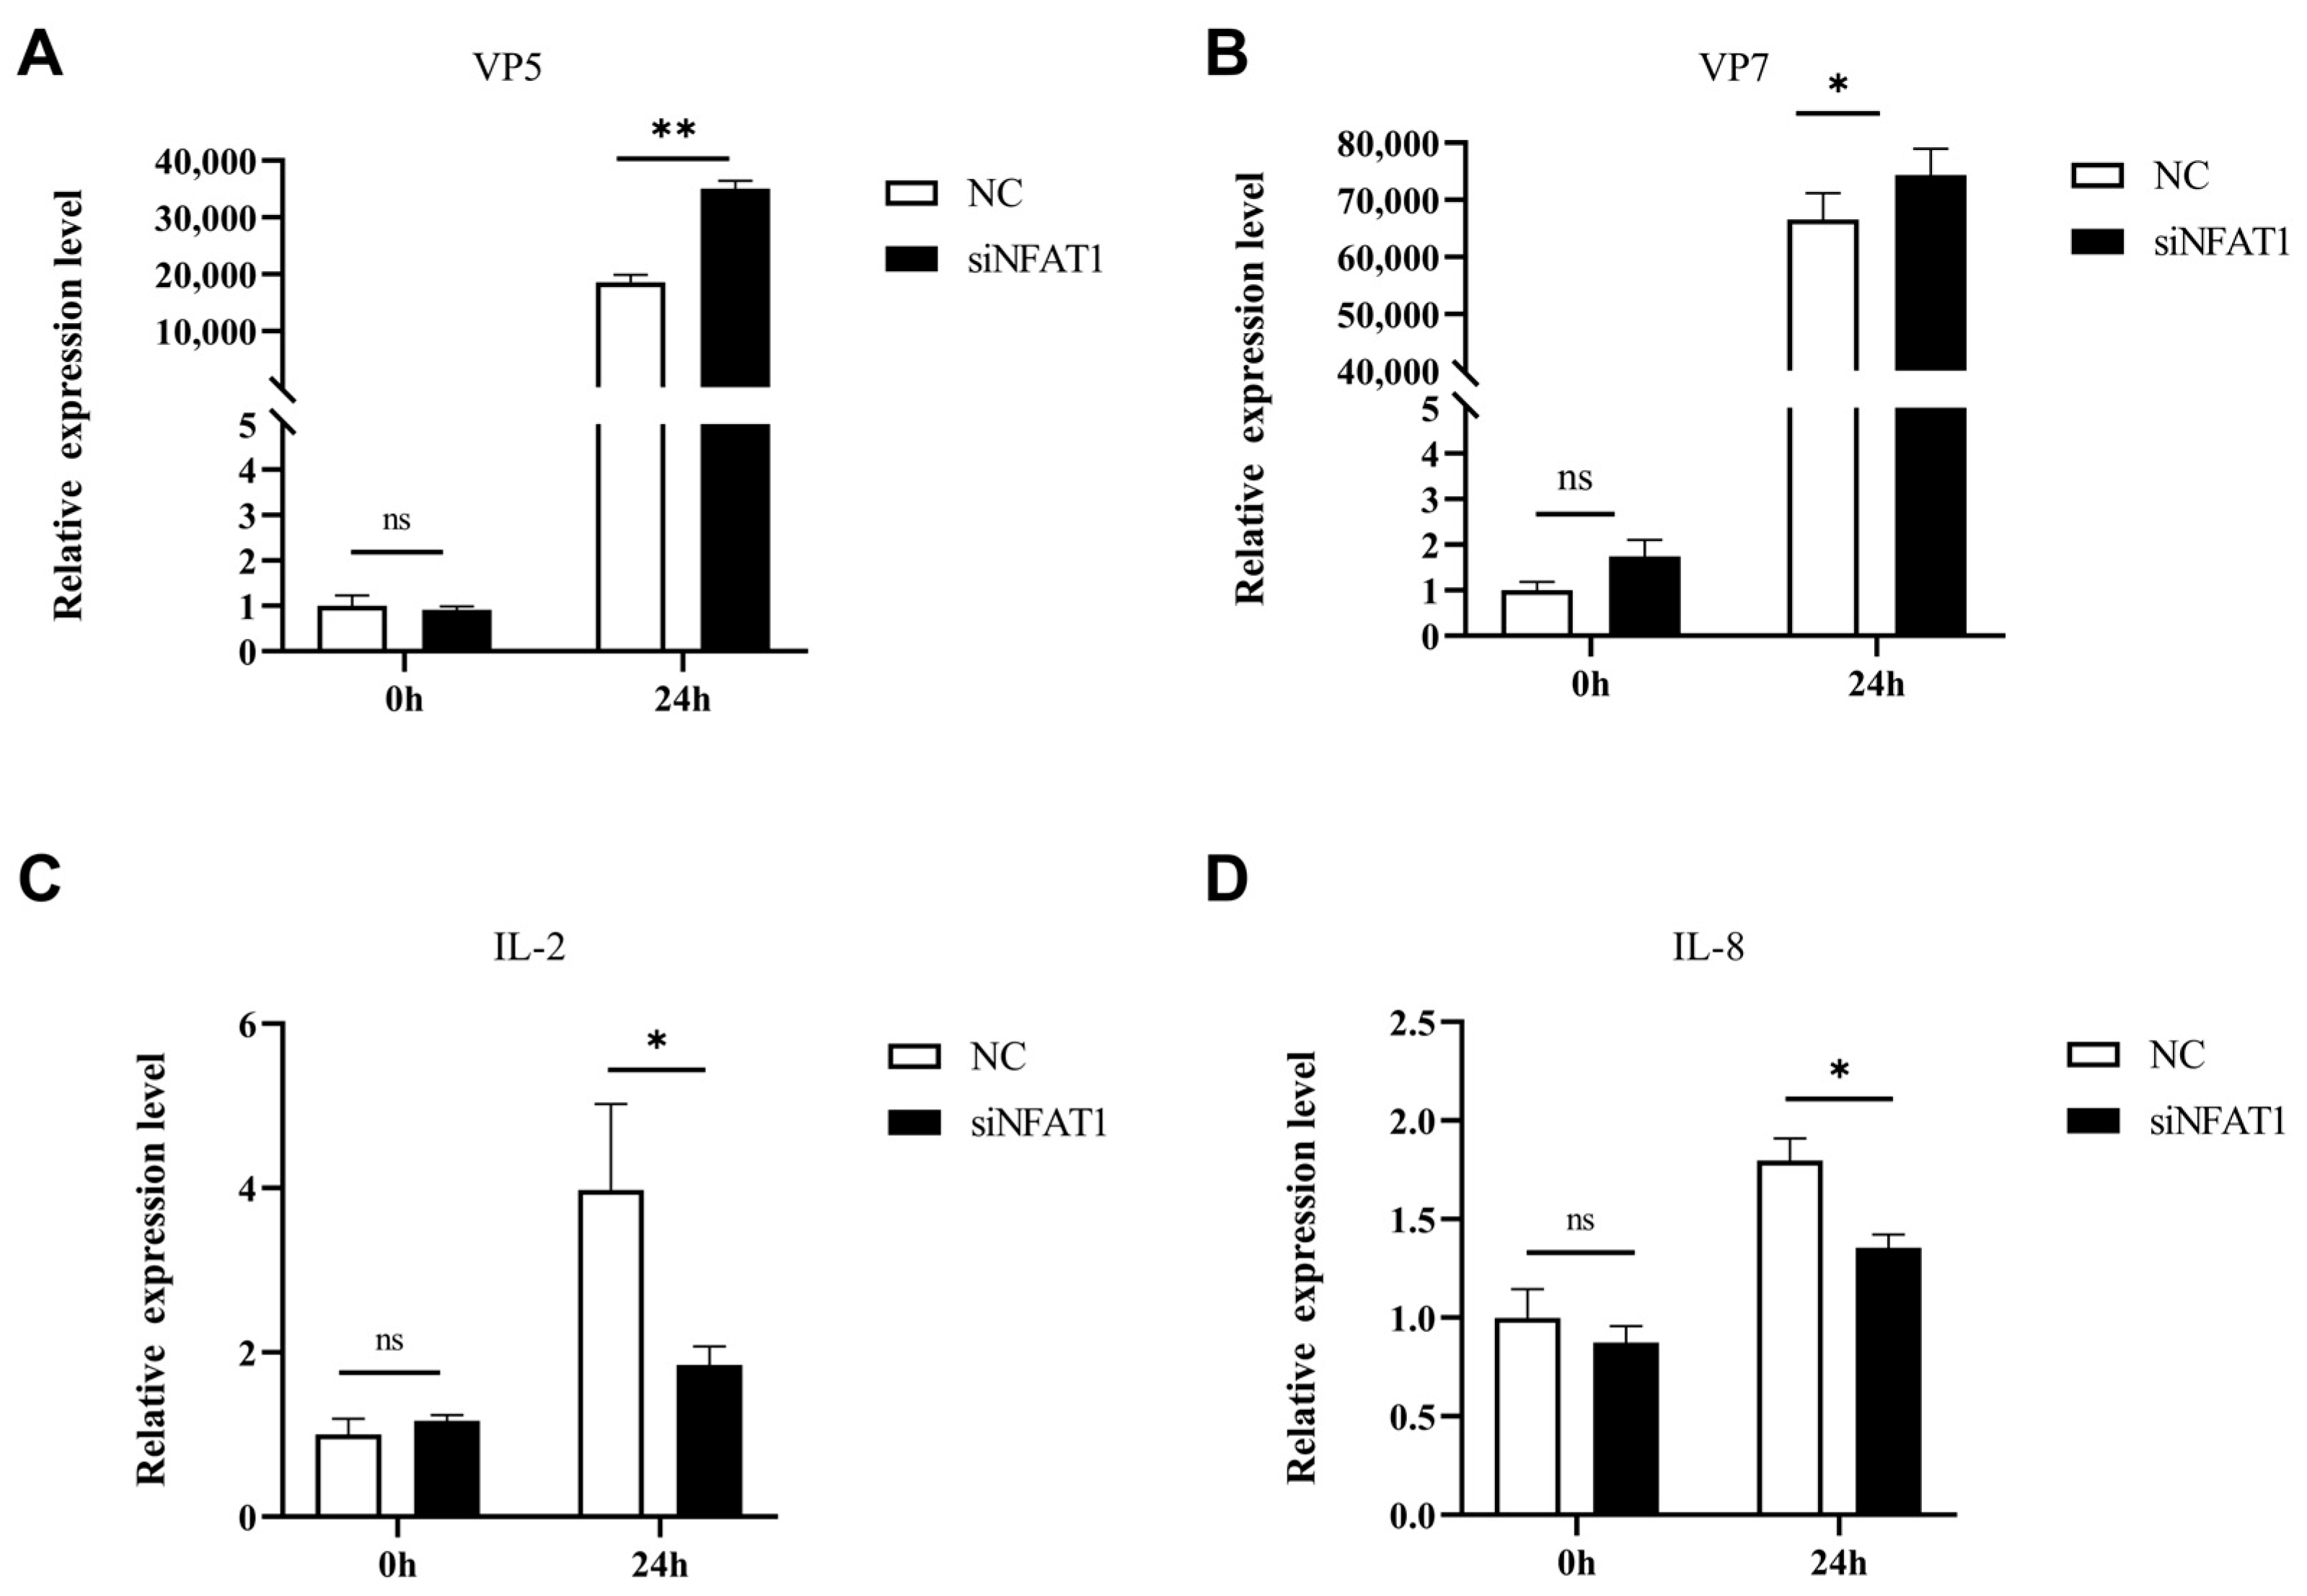
For a deeper exploration of CiNFAT involvement in immunological reaction to GCRV infection, NFAT1-specific siRNAs were designed to knock down its expression in CIK cells. Successful NFAT1 knockdown in CIK cells was confirmed (Figure S5). Subsequently, CIK cells with siRNA-mediated NFAT1 silencing (36 h post-transfection) were infected with GCRV. Cell samples collected 24 h post-infection revealed that NFAT1 knockdown led to significantly higher expression levels of GCRV structural proteins VP5 and VP7 compared to control cells (Figure 11A,B). Furthermore, the expression levels of inflammatory cytokines IL-2 and IL-8 both showed a downward trend upon GCRV stimulation in NFAT1-silenced cells. Specifically, IL-2 expression showed a marked reduction when contrasted with the control group at 24 h (Figure 11C), while IL-8 showed a less pronounced reduction (Figure 11D).

4. Discussion

In this study, analysis of the grass carp’s whole genome led to the detection of eight NFAT genes and seventeen associated isoforms. These were classified into the NFAT1, NFAT2, NFAT3, NFAT4, and NFAT5 subfamilies. Subsequently, their sequence attributes, genomic loci, and patterns of collinearity underwent detailed study. Specifically, the CiNFAT1 gene was cloned, and its in vivo and in vitro expression patterns were analyzed. Furthermore, NFAT1 overexpression and RNA interference experiments in CIK cells were conducted to explore its impact on GCRV replication and cytokine regulation, thereby elucidating the role of NFAT1 in GCRV infection.
To identify specific NFAT family members in grass carp, an HMM model based on conserved NFAT subunit domains was employed. Members of the NFAT gene family exhibit significant domain conservation, particularly within the RHD domain. As a characteristic structure of the Rel family, the RHD domain directly mediates the recognition and binding of DNA target sequences. The DNA binding module of NFAT transcription factors shares significant structural homology with Rel family proteins. This evolutionary conserved feature enables functional synergy with transcription regulatory elements such as NF-κB [26]. The high instability index of NFAT protein suggests that it may be rapidly degraded in cells, which may affect its role in the signal transduction pathway. It is speculated that this instability may be related to the rapid activation and inactivation of NFAT protein in the immune response, thus playing a role in immune regulation. NFAT genes are widely distributed across the animal kingdom, with family members identified in diverse species including Homo sapiens, Danio rerio [27], Petromyzontiformes [19], and Xenopus laevis [28]. NFAT homologous sequences have not been detected in unicellular eukaryotes. However, NFAT genes highly similar to human NFAT5 have been identified in the sea anemone genome [29]. Invertebrates and primitive chordates possess only a single NFAT homolog. It was not until the emergence of jawless vertebrates such as Petromyzon marinus that the family began to exhibit characteristics of gradual differentiation. Gene duplication events not only generated two major lineages (NFAT5 and NFAT1-4) but also led to significant differentiation in functional modules and structural composition [30]. Studies have demonstrated that the complete NFAT gene family likely underwent three rounds of genome-wide duplication events [31,32]. Therefore, among the five NFAT subfamilies of grass carp, it is speculated that the gene family may also have experienced three rounds of duplication events. More evidence is still needed to enhance the possibility of evolutionary assertions.
To explore the immune-regulatory role of CiNFAT1 during GCRV infection, the full-length ORF sequence of CiNFAT1 was amplified and subjected to multiple sequence alignments. The results indicated that CiNFAT1 exhibited the highest homology with blunt snout bream and clustered within the Cyprinidae family. CiNFAT1 lacks a signal peptide and transmembrane structure, yet its conserved domain suggests that its regulatory function may be consistent with that observed in higher animals [33]. qPCR results revealed that NFAT1 was widely distributed across eight tissues in grass carp, demonstrating elevated levels in the spleen, gill, and skin, aligning with the established notion that NFAT is extensively expressed in various tissues [34]. In this study, the HN-1307 virus was employed for in vivo challenge experiments. The pathogen is known to cause significant morbidity and swift dissemination among grass carp, inducing serious signs in hepatic, splenic, and renal tissues [35]. Upon GCRV stimulation of major immune tissues, NFAT1 expression initially increased and then decreased, suggesting a close relationship between NFAT1 and GCRV-induced hemorrhagic diseases. NFAT1’s critical involvement in immunity has been previously established [36,37,38]. Similarly, following GCRV stimulation, the expression level of NFAT1 in CIK cells changed dynamically with the infection time. These results further indicate that CiNFAT1 exerts a regulatory influence over the interaction with GCRV in grass carp. However, the specific underlying mechanisms warrant further investigation.
NFAT1 activity and function are tightly regulated by its intracellular localization, particularly its translocation between the cytoplasm and nucleus [15]. During immune responses, stimulation and activation of T lymphocytes lead to changes in intracellular Ca2+ concentration. A classic pathway involved is the Ca2+/CaN/NFAT pathway. Increased intracellular Ca2+ concentration activates CaN, leading to NFAT dephosphorylation and the migration from its cytoplasmic localization into the nuclear compartment. This nuclear localization enables NFAT to exert its immune response function in T lymphocytes [39,40]. Studies have shown that in allergic lung inflammation, myocyte-specific enhancer factor 2d (Mef2d) inhibits Regnase-1 endonuclease expression, thereby enhancing interleukin-33 (IL-33) receptor production and IL-33 signal transduction. Mef2d acts downstream of calcium-mediated signal transduction by promoting NFAT1 nuclear translocation, thus promoting type 2 cytokine-mediated immunity [41]. To gain a clearer understanding of the involvement of CiNFAT1 during GCRV infection, its subcellular localization was analyzed in this study. In CIK cells, NFAT1 was predominantly concentrated in the cytoplasm. Interestingly, after GCRV stimulation, the NFAT1 fluorescence signal significantly translocated to the nucleus, consistent with previous reports. This indicates that GCRV stimulation activates NFAT1, induces alterations in its phosphorylation status, and triggers its translocation. This process enables its translocation into the cellular nucleus, where it can then regulate the transcription of specific genetic sequences.
In the immune system, NFAT1 activity is closely associated with the dynamic balance of cytokine secretion profiles and the intensity of immune responses [42]. Studies have shown that impaired NFAT activation can lead to abnormal expression of various cytokines, potentially inducing systemic immunodeficiency in severe cases. Gene knockout studies have confirmed that NFAT1/2 double knockout mice exhibited significantly decreased cytokine expression [43]. Previous reports have identified NFAT binding sites on the enhancers or promoters of numerous inflammatory cytokines [7]. Upon activation, following stimulation of the T cell antigen receptor, NFAT is capable of associating with the interleukin-2 gene’s upstream regulatory region, thereby upregulating its expression [6,44,45]. Additionally, NFAT1 has been found to activate inflammation-related genes like IL-6 and IL-8 and to exert inflammatory effects on retinal pigment epithelial (RPE) cells [46]. The mechanism analysis revealed that the promoter region of the IL-2 gene encompasses a collaborative element for NFAT, ECR-1, and IRF-4. This particular site is critical for governing the genetic transcription of IL-2, thereby instigating the engagement and rapid multiplication of T lymphocytes [47,48,49]. Furthermore, VIVIT, a specific NFAT dephosphorylation peptide inhibitor with transmembrane transport capacity, significantly inhibits the production and secretion of TNF-α and IL-6 triggered by lipopolysaccharide [46].
To further investigate the function of NFAT1 in response to GCRV infection, RNA interference (RNAi) was employed [50]. After GCRV infection, it was found that in NFAT1 knocked-down CIK cells, the heightened expression of viral genes VP5 and VP7 was accompanied by a suppression in the production of IL-2 and IL-8. Similarly, silencing the NFAT1 gene with siRNA has been shown to significantly enhance the signal transducer and activator of transcription 5 (STAT5)-mediated gene activation and breast cancer cell proliferation [51]. In summary, we speculate that CiNFAT1 suppression may impair the ability to withstand GCRV infection, suggesting that NFAT1 might exert a specific immunological function in combating GCRV. In future studies, more relevant work is essential to rigorously explore this premise.

5. Conclusions

This study comprehensively characterized eight NFAT genes in the grass carp genome, belonging to five distinct subfamilies (NFAT1-NFAT5), with a particular focus on grass carp NFAT1. NFAT1 exhibited widespread tissue expression in healthy fish, with prominent levels in immune-relevant organs such as the gill and skin. Importantly, NFAT1 expression was in dynamic expression patterns both in vivo and in vitro upon GCRV exposure. Functional investigations revealed that CiNFAT1 contributes to the immune reaction to GCRV infection in grass carp. Specifically, NFAT1 overexpression significantly suppressed GCRV replication and modulated the expression levels of key immunomodulatory genes, including the upregulation of antiviral factors (IFN-1, IRF7) and the regulation of inflammatory cytokines (IL-2, IL-8, IL-10). Conversely, NFAT1 silencing led to increased viral loads (VP5, VP7) and attenuated the expression of pro-inflammatory cytokines (IL-2, IL-8) following GCRV challenge. Collectively, these findings establish grass carp NFAT1 as a crucial regulator of antiviral immune defense against GCRV infection. These findings offer fundamental understanding concerning NFAT1’s involvement in piscine immune responses and suggest its potential as a target for enhancing disease resistance in aquaculture. In the future, additional investigations will be imperative to comprehensively clarify the complex molecular pathways governing NFAT1-dependent antiviral defenses in fish.

Supplementary Materials

The following supporting information can be downloaded at https://www.mdpi.com/article/10.3390/fishes10090422/s1: Table S1: Bioinformatics analysis websites; Table S2: Overall information for the NFAT subunit gene family. Table S3: Primers for experiments; Table S4: Comparison of amino acid sequence similarity of NFAT1 protein between grass carp and other fish; Figure S1: ORF and amino acid sequence of grass carp NFAT1. The initiation codon (ATG) and the termination codon (TAA) are in red font. The RHD structural domain is underlined in yellow and the IPT structural domain is underlined in green; Figure S2: Multiple sequence alignments of NFAT1. The amino acid residues shaded in dark are conserved sites. The series used for comparison includes Ctenopharyngodon idella, Megalobrama amblycephala, Oreochromis niloticus, Cyprinus carpio, Danio rerio, Siniperca chuatsi, Homo sapiens, Myotis lucifugus, Gallus gallus, Xenopus laevis; Figure S3: Hydrophobicity, signal peptide analysis, and transmembrane structure prediction for the NFAT1 in grass carp. (A) Hydrophobicity results of NFAT1 in grass carp. (B) The signaling peptide results of NFAT1. (C) The prediction results regarding the transmembrane structure in grass carp NFAT1; Figure S4: Structural domain prediction and 3D structure of grass carp NFAT1. (A) The structural domain prediction of NFAT1 in grass carp by SMART. (B) The tertiary structural model of grass carp NFAT1 was predicted using Swiss-model; Figure S5: Validation of siRNA interference efficiency. The siRNA and NC (40 pmol, 12-well plate) were transfected into CIK cells, and NC was used as control. The cells were collected after 36 h of transfection to detect the transfection efficiency.

Author Contributions

Conceptualization, Q.L.; methodology, Q.L.; investigation, Y.S.; data curation, Y.Z. (Yitong Zhang) and C.C.; writing—original draft preparation, Y.S.; writing—review and editing, Q.L.; visualization, Y.S.; supervision, B.X. and T.X.; participation in work, S.H., J.L., and Y.Z. (Yiling Zhang). All authors have read and agreed to the published version of the manuscript.

Funding

This work was supported by the National Key Research and Development Program of China (2023YFD2401602) and the Natural Science Foundation of Changsha City (kq2502218).

Institutional Review Board Statement

The animal experiments were conducted in accordance with the guidelines approved by the Animal Care and Use Committee of Hunan Agricultural University (Changsha, China; Approval Code: 202403286; Approval Date: 28 March 2024).

Informed Consent Statement

Not applicable.

Data Availability Statement

All relevant data are available from the authors upon request, and the corresponding author is responsible for replying to the request.

Acknowledgments

Thank you to Zeng Lingbing from the Yangtze River Fisheries Research Institute of the Chinese Academy of Fishery Sciences (Wuhan) for providing grass carp reovirus GCRV-I and CIK. Thanks to Shi Cunbin from the Pearl River Fisheries Research Institute of the Chinese Academy of Fishery Sciences (Guangzhou) for providing GCRV-II (HN-1307).

Conflicts of Interest

The authors declare no conflicts of interest regarding the publication of this article.

References

  1. China Fisheries Statistics Yearbook; Bureau of Fisheries and Fishery Administration; Ministry of Agriculture and Rural Affairs: Beijing, China, 2024; Volume 25.
  2. Zhu, C.; Liu, W.; Jia, S.; Sun, X.; Wang, Z.; Deng, H.; Bai, Y.; Xiao, W.; Liu, X. Grass carp (Ctenopharyngodon idella) SIRT3 enhances MAVS-mediated antiviral innate immunity in response to GCRV infection. Aquaculture 2024, 587, 740871. [Google Scholar] [CrossRef]
  3. Huang, Z.; Wang, Y.; Wu, S.; Yin, J.; Zhou, W.; Gao, T.; Li, Y.; Bergmann, S.M.; Gao, C.; Wang, Y.; et al. An iTRAQ-based comparative proteomic analysis of grass carp infected with virulent and avirulent isolates of grass carp reovirus genotype II. Aquaculture 2021, 535, 736426. [Google Scholar] [CrossRef]
  4. Huang, J.; Lv, Z.; Li, B.; Ying, Y.; Yang, L.; Xiao, T.; Xion, S. Characterization of multi-copy C3 genes and association analysis of C3.1 polymorphism with GCRV resistance traits in Ctenopharyngodon idella. Aquaculture 2024, 583, 740567. [Google Scholar] [CrossRef]
  5. Liao, Z.; Wan, Q.; Shang, X.; Su, J. Large-scale SNP screenings identify markers linked with GCRV resistant traits through transcriptomes of individuals and cell lines in Ctenopharyngodon Idella. Sci. Rep. 2017, 7, 1184. [Google Scholar] [CrossRef]
  6. Shaw, J.P.; Utz, P.J.; Durand, D.B.; Toole, J.J.; Emmel, E.A.; Crabtree, G.R. Identification of a putative regulator of early T cell activation genes. Science 1988, 241, 202–205. [Google Scholar] [CrossRef]
  7. Neefjes, M.; Van Caam, A.P.M.; Van der Kraan, P.M. Transcription Factors in Cartilage Homeostasis and Osteoarthritis. Biology 2020, 9, 290. [Google Scholar] [CrossRef] [PubMed]
  8. Shou, J.; Jing, J.; Xie, J.; You, L.; Jing, Z.; Yao, J.; Han, W.; Pan, H. Nuclear factor of activated T cells in cancer development and treatment. Cancer Lett. 2015, 361, 174–184. [Google Scholar] [CrossRef]
  9. Mognol, G.P.; Carneiro, F.R.G.; Robbs, B.K.; Faget, D.V.; Viola, J.P.D.B. Cell cycle and apoptosis regulation by NFAT transcription factors: New roles for an old player. Cell Death Dis. 2016, 7, e2199. [Google Scholar] [CrossRef]
  10. Guan, B.; Tong, J.; Hao, H.; Yang, Z.; Chen, K.; Xu, H.; Wang, A. Bile acid coordinates microbiota homeostasis and systemic immunometabolism in cardiometabolic diseases. Acta Pharm. Sin. B 2022, 12, 2129–2149. [Google Scholar] [CrossRef]
  11. Qin, J.J.; Nag, S.; Wang, W.; Zhou, J.; Zhang, W.D.; Wang, H.; Zhang, R. NFAT as cancer target: Mission possible? Biochim. Biophys. Acta 2014, 1846, 297–311. [Google Scholar] [CrossRef]
  12. Luo, C.; Burgeon, E.; Carew, J.A.; McCaffrey, P.G.; Badalian, T.M.; Lane, W.S.; Hogan, P.G.; Rao, A. Recombinant NFAT1 (NFATp) is regulated by calcineurin in T cells and mediates transcription of several cytokine genes. Mol. Cell. Biol. 1996, 1, 3955–3966. [Google Scholar] [CrossRef]
  13. Okamura, H.; Aramburu, J.; Garcia-Rodriguez, C.; Viola, J.P.; Raghavan, A.; Tahiliani, M.; Zhang, X.; Qin, J.; Hogan, P.G.; Rao, A. Concerted dephosphorylation of the transcription factor NFAT1 induces a conformational switch that regulates transcriptional activity. Mol. Cell 2000, 6, 539–550. [Google Scholar] [CrossRef] [PubMed]
  14. Trama, J.; Go, W.Y.; Ho, S.N. The osmoprotective function of the NFAT5 transcription factor in T cell development and activation. J. Immunol. 2002, 169, 5477–5488. [Google Scholar] [CrossRef] [PubMed]
  15. Muller, M.R.; Rao, A. NFAT, immunity and cancer: A transcription factor comes of age. Nat. Rev. Immunol. 2010, 10, 645–656. [Google Scholar] [CrossRef]
  16. Macian, F. NFAT proteins: Key regulators of T-cell development and function. Nat. Rev. Immunol. 2005, 5, 472–484. [Google Scholar] [CrossRef]
  17. Huang, X.D.; Wei, G.; Zhang, H.; He, M.X. Nuclear factor of activated T cells (NFAT) in pearl oyster Pinctada fucata: Molecular cloning and functional characterization. Fish Shellfish Immunol. 2015, 42, 108–113. [Google Scholar] [CrossRef]
  18. Xing, J.; Liu, W.; Tang, X.; Sheng, X.; Chi, H.; Zhan, W. The Expression of CD28 and Its Synergism on the Immune Response of Flounder (Paralichthys olivaceus) to Thymus-Dependent Antigen. Front. Immunol. 2021, 12, 765036. [Google Scholar] [CrossRef]
  19. Duan, X.; Lv, M.; Liu, A.; Pang, Y.; Li, Q.; Su, P.; Gou, M. Identification and evolution of transcription factors RHR gene family (NFAT and RBPJ) involving lamprey (Lethenteron reissneri) innate immunity. Mol. Immunol. 2021, 138, 38–47. [Google Scholar] [CrossRef]
  20. Yang, L.; Wang, C.; Huang, Y.; Xu, B.; Liu, Y.; Yu, J.; Xiong, L.; Xiao, T.; Liu, Q. Identification of the C1qDC gene family in grass carp (Ctenopharyngodon idellus) and the response of C1qA, C1qB, and C1qC to GCRV infection in vivo and in vitro. Fish Shellfish Immunol. 2024, 148, 109477. [Google Scholar] [CrossRef]
  21. Wu, C.S.; Ma, Z.Y.; Zheng, G.D.; Zou, S.M.; Zhang, X.J.; Zhang, Y.A. Chromosome-level genome assembly of grass carp (Ctenopharyngodon idella) provides insights into its genome evolution. BMC Genom. 2022, 23, 271. [Google Scholar] [CrossRef] [PubMed]
  22. Yang, M.; Derbyshire, M.K.; Yamashita, R.A.; Marchler-Bauer, A. NCBI’s Conserved Domain Database and Tools for Protein Domain Analysis. Curr. Protoc. Bioinform. 2020, 69, e90. [Google Scholar] [CrossRef]
  23. Zhang, Y.; Shi, J.; Lu, Y.; Luo, Q.; Chu, P.; Huang, R.; Chen, K.; Zhao, J.; Wang, Y.; Ou, M. Molecular Cloning and Characterization of Scavenger Receptor Class B Type 1 in Grass Carp (Ctenopharyngodon idellus) and Its Expression Profile following Grass Carp Reovirus Challenge. Fishes 2024, 9, 276. [Google Scholar] [CrossRef]
  24. Livak, K.J.; Schmittgen, T.D. Analysis of relative gene expression data using real-time quantitative PCR and the 2-ΔΔCt Method. Methods 2001, 25, 402–408. [Google Scholar] [CrossRef]
  25. Hamzi, H.; Rajabpour, A.; Roldan, E.; Hassanali, A. Learning the Hydrophobic, Hydrophilic, and Aromatic Character of Amino Acids from Thermal Relaxation and Interfacial Thermal Conductance. J. Phys. Chem. B 2022, 126, 670–678. [Google Scholar] [CrossRef]
  26. Liu, Q.; Chen, Y.; Auger-Messier, M.; Molkentin, J.D. Interaction between NFκB and NFAT coordinates cardiac hypertrophy and pathological remodeling. Circ. Res. 2012, 110, 1077–1086. [Google Scholar] [CrossRef]
  27. Shakur Ahammad, A.K.; Asaduzzaman, M.; Ceyhun, S.B.; Ceylan, H.; Asakawa, S.; Watabe, S.; Kinoshita, S. Multiple transcription factors mediating the expressional regulation of myosin heavy chain gene involved in the indeterminate muscle growth of fish. Gene 2019, 687, 308–318. [Google Scholar] [CrossRef]
  28. Zhang, Y.; English, S.G.; Storey, K.B. Regulation of nuclear factor of activated T cells (NFAT) and downstream myogenic proteins during dehydration in the African clawed frog. Mol. Biol. Rep. 2018, 45, 751–761. [Google Scholar] [CrossRef] [PubMed]
  29. Sullivan, J.C.; Kalaitzidis, D.; Gilmore, T.D.; Finnerty, J.R. Rel homology domain-containing transcription factors in the cnidarian Nematostella vectensis. Dev. Genes Evol. 2007, 217, 63–72. [Google Scholar] [CrossRef] [PubMed]
  30. Lee, N.; Kim, D.; Kim, W. Role of NFAT5 in the Immune System and Pathogenesis of Autoimmune Diseases. Front. Immunol. 2019, 10, 270. [Google Scholar] [CrossRef] [PubMed]
  31. Meyer, A.; Van de Peer, Y. From 2R to 3R: Evidence for a fish-specific genome duplication (FSGD). Bioessays 2005, 27, 937–945. [Google Scholar] [CrossRef]
  32. Hoegg, S.; Meyer, A. Hox clusters as models for vertebrate genome evolution. Trends Genet. 2005, 21, 421–424. [Google Scholar] [CrossRef]
  33. Tothova, J.; Blaauw, B.; Pallafacchina, G.; Rudolf, R.; Argentini, C.; Reggiani, C.; Schiaffino, S. NFATc1 nucleocytoplasmic shuttling is controlled by nerve activity in skeletal muscle. J. Cell Sci. 2006, 119, 1604–1611. [Google Scholar] [CrossRef]
  34. Kaminuma, O.; Kitamura, N.; Nishito, Y.; Nemoto, S.; Tatsumi, H.; Mori, A.; Hiroi, T. Downregulation of NFAT3 Due to Lack of T-Box Transcription Factor TBX5 Is Crucial for Cytokine Expression in T Cells. J. Immunol. 2018, 200, 92–100. [Google Scholar] [CrossRef]
  35. Wang, Y.; Zheng, S.; Zeng, W.; Yin, J.; Li, Y.; Ren, Y.; Mo, X.; Shi, C.; Bergmann, S.M.; Wang, Q. Comparative transcriptional analysis between virulent isolate HN1307 and avirulent isolate GD1108 of grass carp reovirus genotype II. Immunology 2023, 147, 104893. [Google Scholar] [CrossRef]
  36. Xanthoudakis, S.; Viola, J.P.; Shaw, K.T.; Luo, C.; Wallace, J.D.; Bozza, P.T.; Luk, D.C.; Curran, T.; Rao, A. An enhanced immune response in mice lacking the transcription factor NFAT1. Science 1996, 272, 892–895. [Google Scholar] [CrossRef]
  37. Hodge, M.R.; Ranger, A.M.; Charles De La Brousse, F.; Hoey, T.; Grusby, M.J.; Glimcher, L.H. Hyperproliferation and dysregulation of IL-4 expression in NF-ATp-deficient mice. Immunity 1996, 4, 397–405. [Google Scholar] [CrossRef]
  38. Teixeira, L.K.; Carrossini, N.; Secca, C.; Kroll, J.E.; DaCunha, D.C.; Faget, D.V.; Carvalho, L.D.S.; Viola, J.P. NFAT1 transcription factor regulates cell cycle progression and cyclin E expression in B lymphocytes. Cell Cycle 2016, 15, 2346–2359. [Google Scholar] [CrossRef]
  39. Kar, P.; Mirams, G.R.; Christian, H.C.; Parekh, A.B. Control of NFAT Isoform Activation and NFAT-Dependent Gene Expression through Two Coincident and Spatially Segregated Intracellular Ca2+ Signals. Mol. Cell 2016, 64, 746–759. [Google Scholar] [CrossRef]
  40. Park, Y.J.; Yoo, S.A.; Kim, M.; Kim, W.U. The Role of Calcium-Calcineurin-NFAT Signaling Pathway in Health and Autoimmune Diseases. Front. Immunol. 2020, 11, 195. [Google Scholar] [CrossRef]
  41. Szeto, A.C.; Clark, P.A.; Ferreira, A.C.; Heycock, M.; Griffiths, E.L.; Jou, E.; Mannion, J.; Luan, S.L. Mef2d potentiates type-2 immune responses and allergic lung inflammation. Science 2024, 384, l370. [Google Scholar] [CrossRef]
  42. Hernandez, G.L.; Volpert, O.V.; Iniguez, M.A.; Lorenzo, E.; Martinez-Martinez, S.; Grau, R.; Fresno, M.; Redondo, J.M. Selective inhibition of vascular endothelial growth factor-mediated angiogenesis by cyclosporin A: Roles of the nuclear factor of activated T cells and cyclooxygenase 2. J. Exp. Med. 2001, 193, 607–620. [Google Scholar] [CrossRef]
  43. Xu, T.; Keller, A.; Martinez, G.J. NFAT1 and NFAT2 differentially regulate CTL differentiation upon acute viral infection. Front. Immunol. 2019, 10, 184. [Google Scholar] [CrossRef] [PubMed]
  44. Chen, L.; Rao, A.; Harrison, S.C. Signal integration by transcription-factor assemblies: Interactions of NF-AT1 and AP-1 on the IL-2 promoter. Cold Spring Harb. Symp. Quant. Biol. 1999, 64, 527–531. [Google Scholar] [CrossRef]
  45. Henderson, D.J.; Naya, I.; Bundick, R.V.; Smith, G.M.; Schmidt, J.A. Comparison of the effects of FK-506, cyclosporin A and rapamycin on IL-2 production. Immunology 1991, 73, 316–321. [Google Scholar]
  46. Pan, H.; Ladd, A.V.; Biswal, M.R.; Valapala, M. Role of Nuclear Factor of Activated T Cells (NFAT) Pathway in Regulating Autophagy and Inflammation in Retinal Pigment Epithelial Cells. Int. J. Mol. Sci. 2021, 22, 8684. [Google Scholar] [CrossRef]
  47. Hu, C.; Jang, S.; Fanzo, J.C.; Pernis, A.B. Modulation of T cell cytokine production by interferon regulatory factor-4. J. Biol. Chem. 2002, 277, 49238–49246. [Google Scholar] [CrossRef] [PubMed]
  48. Decker, E.L.; Skerka, C.; Zipfel, P.F. The early growth response protein (EGR-1) regulates interleukin-2 transcription by synergistic interaction with the nuclear factor of activated T cells. J. Biol. Chem. 1998, 273, 26923–26930. [Google Scholar] [CrossRef] [PubMed]
  49. Decker, E.L.; Nehmann, N.; Kampen, E.; Kampen, E.; Eibel, H.; Zipfel, P.F.; Skerka, C. Early growth response proteins (EGR) and nuclear factors of activated T cells (NFAT) form heterodimers and regulate proinflammatory cytokine gene expression. Nucleic Acids Res. 2003, 31, 911–921. [Google Scholar] [CrossRef]
  50. Stevenson, M. Therapeutic potential of RNA interference. N. Engl. J. Med. 2004, 351, 1772–1777. [Google Scholar] [CrossRef]
  51. Zheng, J.; Fang, F.; Zeng, X.; Medler, T.R.; Fiorillo, A.A.; Clevenger, C.V. Negative cross talk between NFAT1 and Stat5 signaling in breast cancer. Mol. Endocrinol. 2011, 25, 2054–2064. [Google Scholar] [CrossRef]
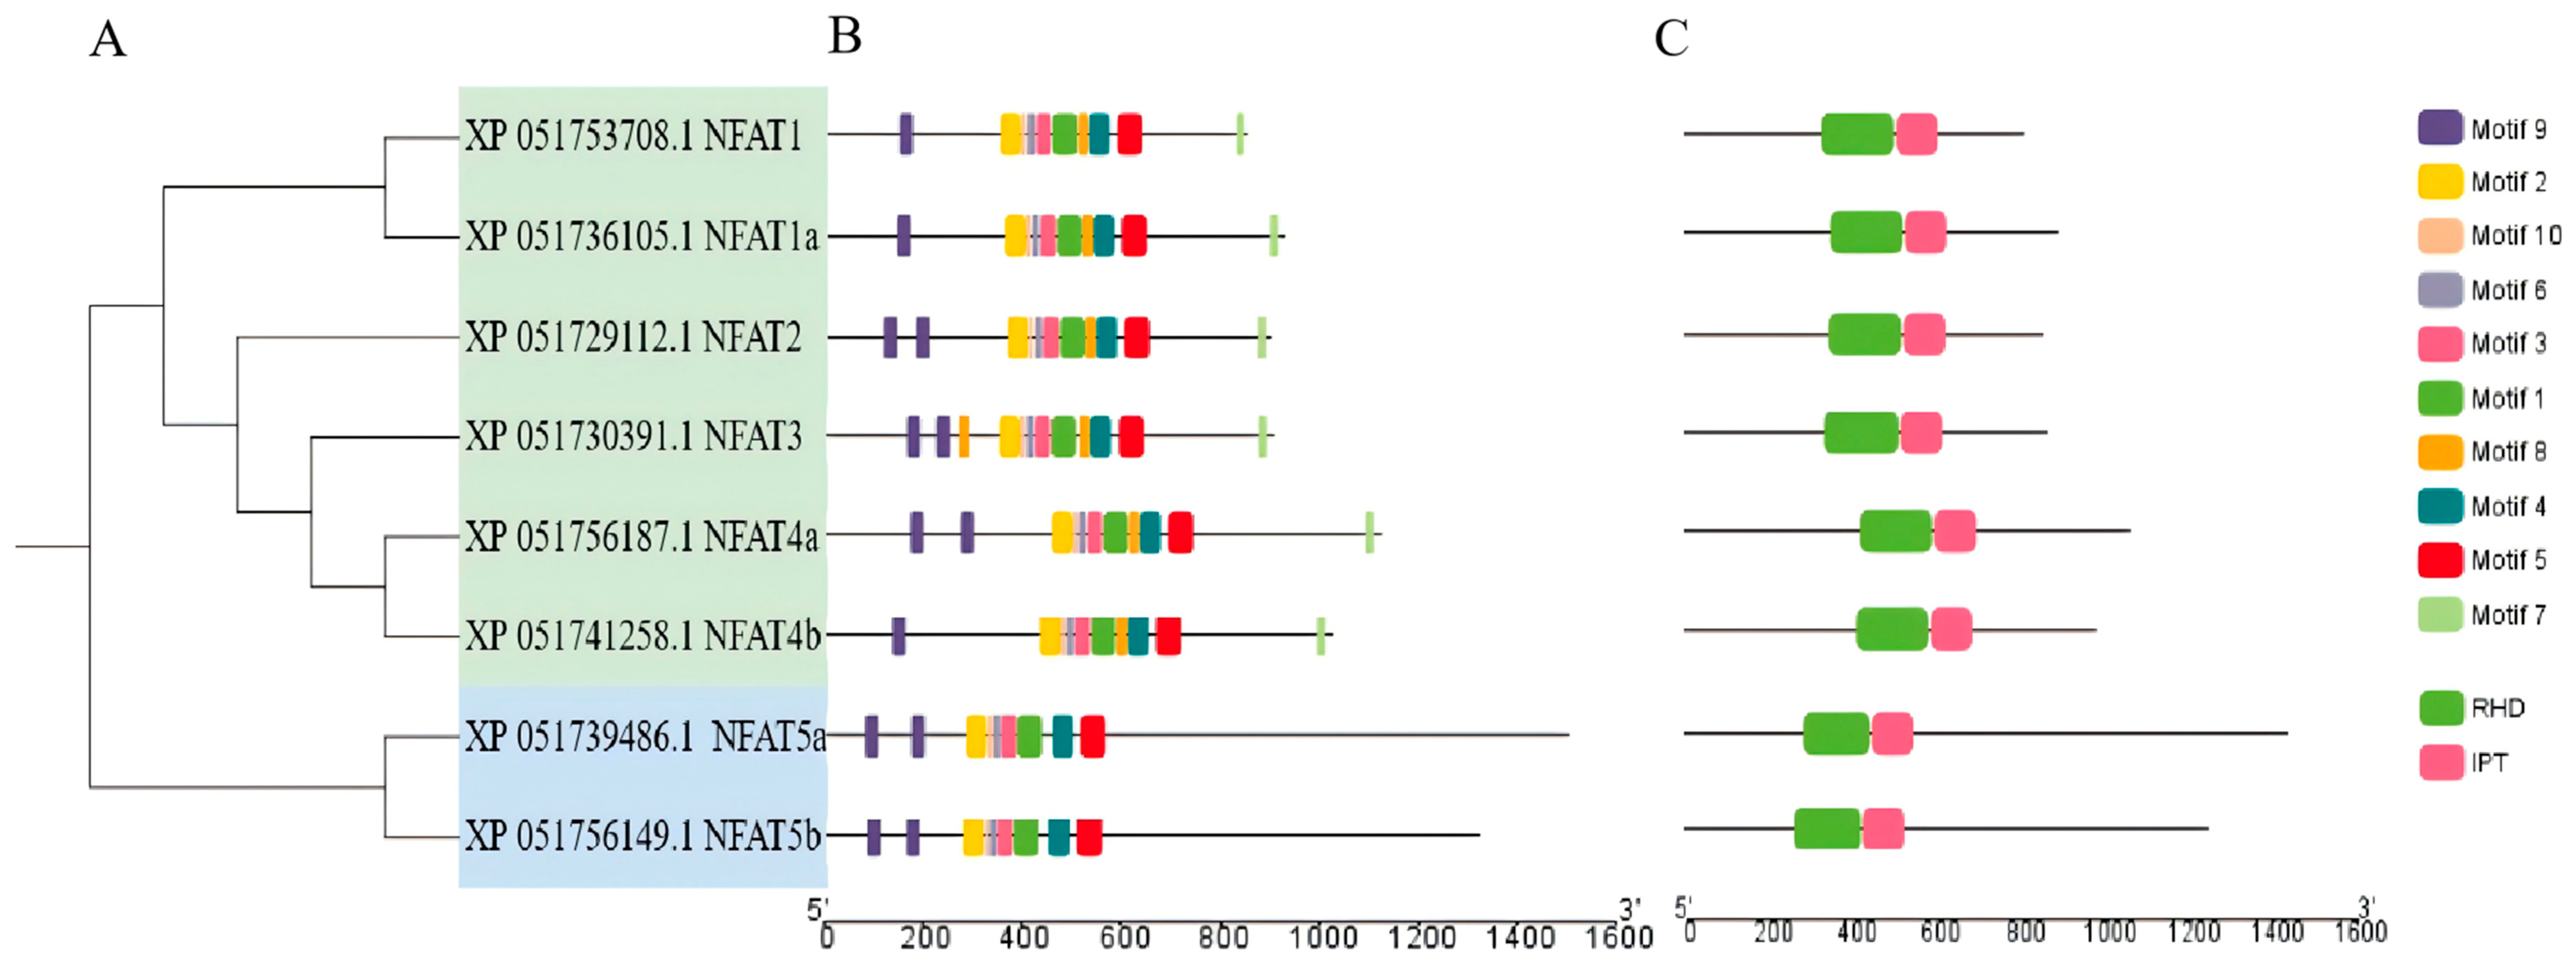
Figure 1. Systematic evolutionary relationships, motifs, and conserved domains of NFAT gene family members. (A) Phylogenetic tree of NFAT gene family members constructed by neighbor-joining method. The NFAT gene families were divided into five subfamilies. Green: NFAT1-4 subfamilies; blue: NFAT5. (B) Motifs of NFAT gene family members. (C) Conserved domain diagram of NFAT gene family members; green: RHD domain region; red: IPT domain region.
Fishes 10 00422 g001
Figure 2. Gene structure of NFAT gene family members. Green and yellow represent UTR and CDS, respectively. The scale below represents the length of the base.
Fishes 10 00422 g002
Figure 3. The distribution of grass carp NFAT genes on chromosomes. Gene abundance is shown by the middle line map and internal heat map, while the black text on the outside indicates the number of chromosomes and the locations of NFAT gene family members. Scale is in millions (Mb), bin size = 1,000,000 B.
Fishes 10 00422 g003
Figure 4. Gene collinearity analysis of NFAT gene family in grass carp compared with that of zebrafish. Short green segments symbolize grass carp chromosomes, with short orange segments representing those from zebrafish. Homologous NFAT gene pairs shared between these two fish species are highlighted by red lines.
Fishes 10 00422 g004
Figure 5. Phylogenetic tree constructed for NFAT1. Fishes, mammals, amphibian, birds and reptile are represented by blue, pink, green, yellow, and purple, respectively. The protein of NFAT1 of grass carp is highlighted in red.
Fishes 10 00422 g005
Figure 6. The relative expression of CiNFAT1 in several tissues from healthy grass crap. Lowercase letters on a bar chart (such as a, b, or c) indicate significant differences (p < 0.05). Each data point reflects the mean ± standard error (n = 3).
Fishes 10 00422 g006
Figure 7. The CiNFAT1 mRNA expression of various tissues and CIK cells after GCRV infection. The mRNA expression patterns of CiNFAT1 in grass carp liver (A), spleen (B), kidney (C), gill (D), and intestine (E) after GCRV stimulation. (F) The CiNFAT1 mRNA expression level in CIK cells. Lowercase letters on a bar chart (such as a, b, or c) indicate significant differences (p < 0.05). Each data point reflects the mean ± standard error (n = 3).
Fishes 10 00422 g007
Figure 8. Fluorescence localization changes of CiNFAT1 after GCRV infection. Green fluorescence showed the target protein, and blue fluorescence was the nucleus.
Fishes 10 00422 g008
Figure 9. Overexpression of CiNFAT1 in CIK cells. The transfection results of pEGFP-N1-Flag (A) and pEGFP-N1-Flag-NFAT1 (B). (C) The mRNA expression patterns of NFAT1 in pEGFP-N1-Flag and pEGFP-N1-Flag-NFAT1 group. (D) The protein expression level of NFAT1 in pEGFP-N1-Flag and pEGFP-N1-Flag-NFAT1 group. Expression of NFAT1 (E), VP5 (F), and VP7 (G) in NFAT1-overexpressing CIK cells during the GCRV challenge. The presence of asterisks serves as an indicator of a statistically significant result: * p < 0.05, ** p < 0.01, and **** p < 0.0001. The ns indicates that there is no significant difference between samples. Each data point reflects the mean ± standard error (n = 3).
Fishes 10 00422 g009
Figure 10. Expression of interferon and inflammatory cytokines in NFAT1-overexpressing CIK cells. Following a 24-hour period of pEGFP-N1-Flag-NFAT1 transfection, the CIK cells were subsequently exposed to GCRV infection. Cell samples were taken at 12, 24, and 36 h post-infection to detect the mRNA expression patterns of cytokines IFN-I (A), IRF7 (B), IL-2 (D), IL-8 (E), and IL-10 (F). (C) Protein expression of IFN-I and IRF7. The presence of asterisks serves as an indicator of a statistically significant result: * p < 0.05, ** p < 0.01, and **** p < 0.0001. The ns indicates that there is no significant difference between samples. Each data point reflects the mean ± standard error (n = 3).
Fishes 10 00422 g010
Figure 11. NFAT1 knockdown promoted GCRV replication and suppressed inflammatory cytokines expression. The mRNA expression patterns of viral genes VP5 (A) and VP7 (B) and inflammatory cytokines IL-2 (C) and IL-8 (D) were detected 24 h after infection. NC was the control group. The presence of asterisks serves as an indicator of a statistically significant result: * p < 0.05, ** p < 0.01. The ns indicates that there is no significant difference between samples. Each data point reflects the mean ± standard error (n = 3).
Fishes 10 00422 g011
Disclaimer/Publisher’s Note: The statements, opinions and data contained in all publications are solely those of the individual author(s) and contributor(s) and not of MDPI and/or the editor(s). MDPI and/or the editor(s) disclaim responsibility for any injury to people or property resulting from any ideas, methods, instructions or products referred to in the content.