Article

Ontogenetic and Sex-Specific Isotopic Niches of Blue Sharks (Prionace glauca) in the Northwestern Pacific

Graduate School of Agricultural Science, Tohoku University, Sendai 980-8572, Japan
*
Author to whom correspondence should be addressed.
Fishes 2025, 10(8), 402; https://doi.org/10.3390/fishes10080402
Submission received: 1 July 2025 / Revised: 1 August 2025 / Accepted: 8 August 2025 / Published: 12 August 2025
(This article belongs to the Section Biology and Ecology)

Abstract

The blue shark (Prionace glauca) is a pelagic species widely distributed in the northwestern Pacific Ocean. The trophic roles of blue sharks across different developmental stages and between sexes remain poorly understood. Fifty-four sharks were sampled (October 2022–March 2024) for precaudal length (PCL) and stable isotope levels (δ13C, δ15N) in the muscle tissue (n = 52). Mean PCL varied based on the month of sampling (p = 0.034), with the smallest individuals occurring in July (143.0 ± 4.3 cm) and the largest in October (178.0 ± 2.6 cm). Stable isotope analysis (δ13C and δ15N) indicated consistent offshore habitat use (δ13C: from −20.70 to −18.82‰) and significant nitrogen isotopic differences among life history (δ15N: from 10.23 to 15.72‰; Kruskal–Wallis test, p = 0.037). The elevated δ15N values observed in the subadult group (relative to juvenile individuals) are likely due to trophic enrichment associated with morphological development. Females exhibited markedly larger isotopic niches (SEAc = 2.42‰2) than did males (0.57‰2), and niche overlap was greater within each sex (40–52%) than between sexes (<21%). These results revealed sex-specific ecological roles and trophic strategies throughout the life history of P. glauca. Understanding these foraging differences can help with catch reduction and habitat-protection measures in the transboundary pelagic fisheries of the northwestern Pacific.
Key Contribution: This study identifies significant δ15N differences among life stages, with subadult blue sharks exhibiting elevated δ15N values, and demonstrates marked sex-specific niche differentiation characterized by broader isotopic niches in females compared to males.

1. Introduction

As species ecology and community structure have become a focus of research in marine biology, understanding the variation in resource use among individuals in a population has become more critical [1,2,3,4]. In marine ecosystems, such variation is especially pronounced in the case of large migratory predators whose foraging behavior and movement patterns mediate energy flow and regulate trophic interactions across broad spatial scales [5,6,7]. Sharks exhibit ontogenetic shifts in feeding behavior and habitat use, leading to individual- and life-stage-specific differences in resource utilization [8,9].
Human activities such as habitat degradation, pollution, and climate change are increasingly threatening global marine biodiversity [10]. According to the latest assessment by the International Union for Conservation of Nature [11], more than 30% of elasmobranch species (sharks, rays, skates, and chimeras) are now threatened with extinction, a marked increase from approximately 25% in 2014 [12]. This highlights a continuing deterioration in the stock of elasmobranchs worldwide. Consequently, identifying key species and gaining a deeper understanding of their ecological roles and conservation status is essential for developing effective management strategies.
The blue shark Prionace glauca (Linnaeus, 1758) is among the most widely distributed and abundant pelagic shark species [13,14], occurring in the tropical and temperate waters of all major oceans [15,16]. As apex predators, sharks play an important role in maintaining the balance and stability of open ocean food webs [17,18]. The diet of P. glauca is highly diverse, consisting of a large variety of fish [19,20], small pelagic crustaceans [21,22], cephalopods [23,24], and marine mammals [25]. While blue sharks are frequently caught as bycatch in pelagic longline fisheries in the North Pacific, they are also directly targeted because of their significant economic value in the shark fin trade [13,26,27,28,29]. In Japan, landings are heavily concentrated in Kesennuma City, Miyagi Prefecture, which accounts for approximately 80% of the nation’s blue shark catch [26]. Despite blue sharks being more resilient to exploitation than many other shark species, owing to their fecundity and fast growth [30,31], fishing mortality is close to or possibly exceeding the maximum sustainable yield levels [32]. As a result, this species is currently listed as “near-threatened” by the IUCN [33]. There is an urgent need to improve our understanding of its life history, trophic ecology, and habitat use across its developmental stages to support more effective management and conservation efforts.
Previous studies of the feeding ecology of blue sharks primarily relied on stomach content analysis [25,34]. This method provides detailed taxonomic information on prey items, yet it fails to fully encapsulate the diet of the target species. Only the food consumed recently will be reflected in the data, and prey that are easily digested are often under-represented due to the digestive process [35]. In addition, without a large sample size, the statistical power of the results remains limited. Obtaining such large and representative sample sizes is particularly challenging, especially for deep-sea and/or threatened species, such as sharks [36,37]. As an alternative, stable isotope analysis (SIA) captures the prey consumed over periods of several weeks to months and provides a view of the target species’ contribution to the overall marine food web over space and time [38]. This effectively complements the instantaneous snapshot offered by stomach content analysis. Moreover, δ13C and δ15N signatures delineate isotopic niches, enabling researchers to assess prey-resource overlap in various biological scales [39,40].
Different tissues and bone matter have been sampled for SIA and have been widely applied to various body parts, such as muscle [22,41,42], vertebrae [43], and teeth [44]. Each of these targets offers unique insights into dietary patterns over different integration periods. These studies reported δ13C values range from −19.3‰ to −13.1‰, and δ15N values from 9.5‰ to 19.0‰, reflecting the use by the sharks of diverse oceanic habitats and prey resources [22,24,43].
Ontogenetic dietary variation in blue sharks has been documented in previous studies: variations in δ15N and δ13C have been correlated with body size, suggesting ontogenetic shifts in trophic position or habitat use. This has been observed across several ocean regions, including the southwestern Indian Ocean [45], eastern Atlantic Ocean south of the Canary Islands, northwestern Mediterranean Sea [46], and Eastern Pacific [43]. However, such studies remain scarce in the northwest Pacific, which limits our understanding of the ontogenetic trophic ecology of blue sharks in this region.
Notably, in most published studies, individual blue sharks are classified based on body length, a variable that may not reliably reflect developmental stages owing to factors such as sexual dimorphism and differential growth rates [47,48]. Although age determination provides a more robust method to evaluate developmental stages, in a few studies has age determination been combined with SIA to examine ontogenetic trophic shifts and isotopic niche dynamics in blue sharks from the northwestern Pacific.
This study investigates ontogenetic and sex-specific variation in the isotopic composition of blue sharks in the northwestern Pacific, based on δ13C and δ15N analysis of muscle tissue. Isotopic niches and overlap were quantified across life history and sexes to evaluate the demographic patterns of trophic segregation. Our goal was to improve our understanding of ontogenetic shifts in this species, providing new insights into its ecological role in marine food webs throughout its life cycle.

2. Materials and Methods

2.1. Sampling

A total of 54 blue sharks were obtained from the long-line fishery at the Kesennuma Fish Market in Kesennuma city, Miyagi Prefecture, Japan, in the northwestern Pacific Ocean between October 2022 and May 2024 (Figure 1). Catch location data were obtained from the Japan Fisheries Information Service Center (JAFIC, Tokyo, Japan). Of the sharks caught, 38 were male and 16 were female. The sex of each individual was determined based on external morphology, and precaudal length (PCL) was measured to the nearest centimeter. The vertebrae sample was taken from the region under the first dorsal fin. A small portion of the muscle (without skin) was removed from the ventral region and stored at −20 °C for stable isotope analysis.

2.2. Age Estimation

In the laboratory, digital images of each whole vertebral face were obtained under reflected light using an M165C Leica microscope(Leica, Wetzlar, Germany). Vertebral ages were determined for 54 blue sharks (38 males, 16 females). Growth bands were identified as pairs of opaque (calcified) and translucent (less calcified) zones [47,49]. The birth band, defined as “the first opaque band distal to the focus,” corresponds with a noticeable change in the angle of the centrum face [50,51]. After the whole images had been collected, the vertebrae were stained to enhance visibility of the growth bands. The alcian blue staining technique was employed, with each centrum soaked for several hours in a staining solution consisting of 16 mL of pure ethanol (FUJIFILM Wako Pure Chemical Corporation, Osaka, Japan), 2 mg alcian blue, 4 mL glacial acetic acid(FUJIFILM Wako Pure Chemical Corporation, Osaka, Japan), and 0.8 mL distilled water(FUJIFILM Wako Pure Chemical Corporation, Osaka, Japan) [52]. Whole vertebrae were aged independently of stained vertebrae. For stained images, two independent readers conducted blind counts without knowledge of the specimen’s length. When disagreement occurred, consensus was reached through discussion. For each individual, vertebral age was estimated independently from unstained and stained centra. The final age assigned to each shark was calculated as the average of the two methods.

2.3. Relative Age-Group Classification

To examine ontogenetic variation in isotopic niche, sharks were classified into three age-based groups defined by sex-specific age ranges. Breakpoints were chosen from natural gaps in our sample’s age-frequency distribution and are broadly consistent with published age-growth trajectories for North-Pacific Prionace glauca [53,54]. Thus, females were classified using the following definitions as juvenile (<4 years), subadult (4 ≤ age < 6 years), or adult (≥6 years). Males were defined using the same categories but different ages as juvenile (≤4.5 years), subadult (4.5 < age < 6.5 years), or adult (≥6.5 years). This classification reflects chronological age structure and does not imply reproductive maturity, providing a consistent framework for evaluating age-related isotopic variation in the absence of direct maturity indicators.

2.4. Stable Isotope Analysis Procedures

A total of 52 muscle samples were processed for stable isotope analysis. Urea was removed from the muscle samples prior to stable isotope analysis to prevent potential biases in the estimation of δ13C and δ15N values [55,56]. To extract urea, approximately 3.0 mg of freeze-dried powdered muscle tissue was placed in 2 mL vials and rinsed in 1.5 mL of Jack bean urease solution (FUJIFILM Wako Pure Chemical Corporation, Osaka, Japan). Urease (FUJIFILM Wako Pure Chemical Corporation, Osaka, Japan) was prepared by dissolving 0.3 mg of urease in 10 mL of distilled water. The solution was then added in excess to the muscle tissue and incubated at 35 °C for 36 h to catalyze urea breakdown of urea [57]. After incubation, the muscle samples were separated from the solution and freeze-dried to obtain a powder. Subsequently, 0.6–1.0 mg of each processed sample was weighed and sealed in aluminum foil capsules for stable isotope analysis.
Stable carbon (δ13C) and nitrogen (δ15N) isotope ratios were determined using an elemental analyzer coupled to an isotope ratio mass spectrometer via a continuous flow interface. Isotopic values were expressed in standard δ notation as follows:
δX (‰) = [(R_sample/R_standard) − 1] × 1000
where X represents 13C or 15N, R_sample is the ratio of heavy to light isotopes in the sample, and R_standard is the ratio in the reference standard. The standards used were Pee Dee Belemnite (PDB) for δ13C and atmospheric N2 for δ15N. All isotope values are reported in parts per thousand (‰). Analytical precision, assessed through replicate measurements of internal laboratory standards, was ±0.1‰ for both δ13C and δ15N values.

2.5. Niche Breadth and Isotopic Overlap Analysis

We estimated the isotopic niche and overlap among groups defined by sex and age groups using the SIBER package (v2.1.9) in R (v4.4.1) [39]. Ellipses were constructed from the covariance matrix of δ13C and δ15N values to represent the core isotopic niche of each group. Niche breadth was quantified using the corrected standard ellipse area (SEAc), which encompasses approximately 40% of the data in bivariate isotopic space. The ellipses were fitted using a Bayesian framework with 10,000 posterior draws to incorporate uncertainty into the estimates. Isotopic niche overlap between groups was estimated based on the proportion of shared area between 95% maximum likelihood ellipses within the SIBER framework [39]. Given the extremely small sample size of the juvenile female group (n = 2), this category was excluded from isotopic niche analyses, including SEAc estimation and pairwise overlap calculations, to avoid unreliable inference.

2.6. Statistical Analyses

Normality of δ13C and δ15N values was assessed using the Shapiro–Wilk test, and homogeneity of variances was tested using Levene’s test. Depending on the distributional properties, either parametric (Student’s t-test and one-way ANOVA) or non-parametric (Mann–Whitney U test and Kruskal–Wallis test) methods were used to evaluate differences across sex, life stage, and combinations of the two. When significant differences were detected (p < 0.05), post hoc pairwise comparisons were conducted using the Wilcoxon rank-sum test with Bonferroni correction. To examine seasonal variations in body size, a two-way analysis of variance (ANOVA) was performed to assess differences in precaudal length (PCL) across months and between sexes. Tukey’s HSD test was used for post hoc comparisons when the main effects were significant (p < 0.05). All statistical analyses were performed using the R software, version 4.4.1.

3. Results

3.1. Age Determination and Verification

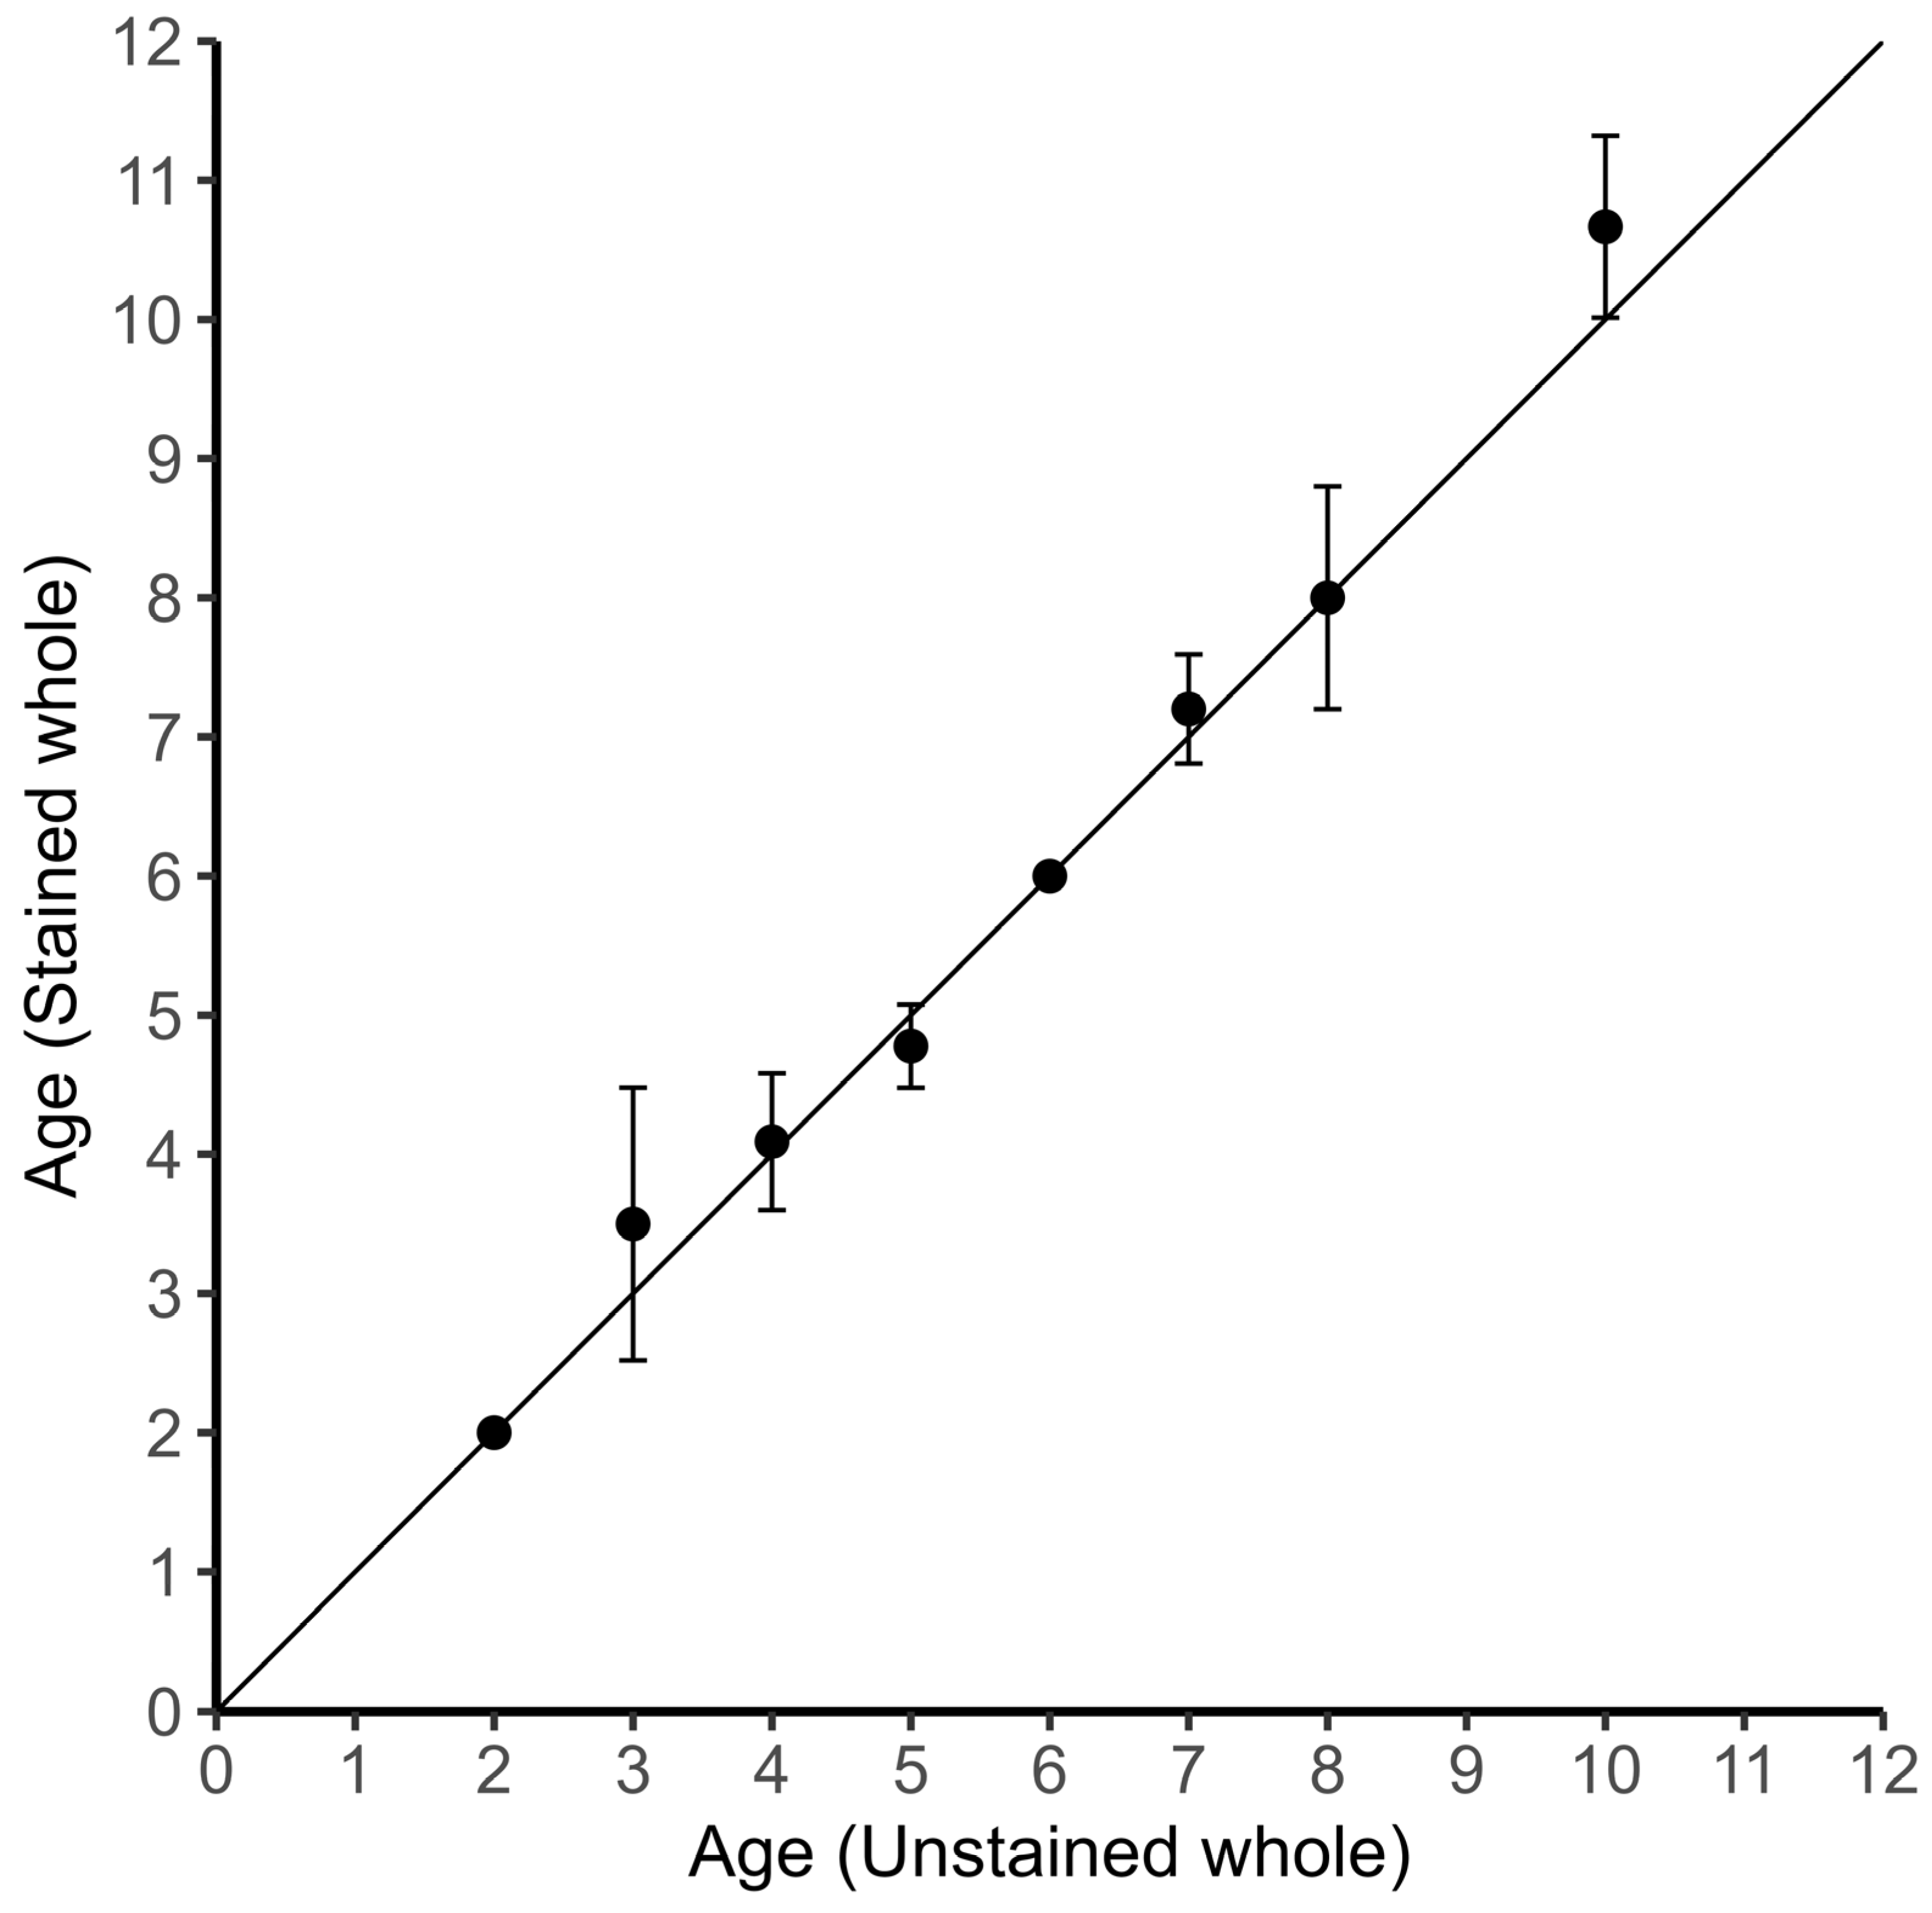
The age-bias plot comparing stained and unstained whole vertebrae (Figure 2) showed no consistent bias between the two methods across the age range of from 2 to 11 years. Most data points fell along the 1:1 reference line, indicating a strong agreement between the two techniques. Error bars were relatively small for intermediate ages (4–6 years), suggesting high consistency in age estimates within this range. In contrast, error bars widened at older ages (8–10 years), indicating increased variability and reduced precision in the age determination for these older individuals. A coefficient of variation of 6.3% and an average percent error of 4.5% confirmed the consistency of age readings between the two approaches.

3.2. Seasonal Variation in Body Size

We analyzed the monthly patterns in precaudal length (PCL) of blue sharks of both sexes (Figure 3). The overall mean PCL was 155.1 ± 3.2 SE cm. A two-way ANOVA revealed a significant effect of month on PCL (F(6, 41) = 2.56, p = 0.034), with the lowest mean values observed in July (143.0 ± 4.3 SE cm) and the highest in October (178.0 ± 2.6 SE cm). The width of the confidence intervals indicated greater individual variability in the PCL during January, March, and September, whereas the values in October were more narrowly distributed, suggesting a more uniform size composition during that month. No significant difference in the PCL was found between sexes (F(1, 41) = 0.83, p = 0.368), and there was no significant interaction between month and sex (F(5, 41) = 0.53, p = 0.756). Post-hoc comparisons using Tukey’s HSD test did not detect statistically significant pairwise differences between months (adjusted p > 0.05), although sharks sampled in October tended to have larger PCLs than those sampled in May (p = 0.100) and July (p = 0.089). These results indicate that seasonal variations in body size occurred independently of sex, with both males and females showing similar temporal growth patterns during the sampling period.

3.3. Stable Isotopic Results

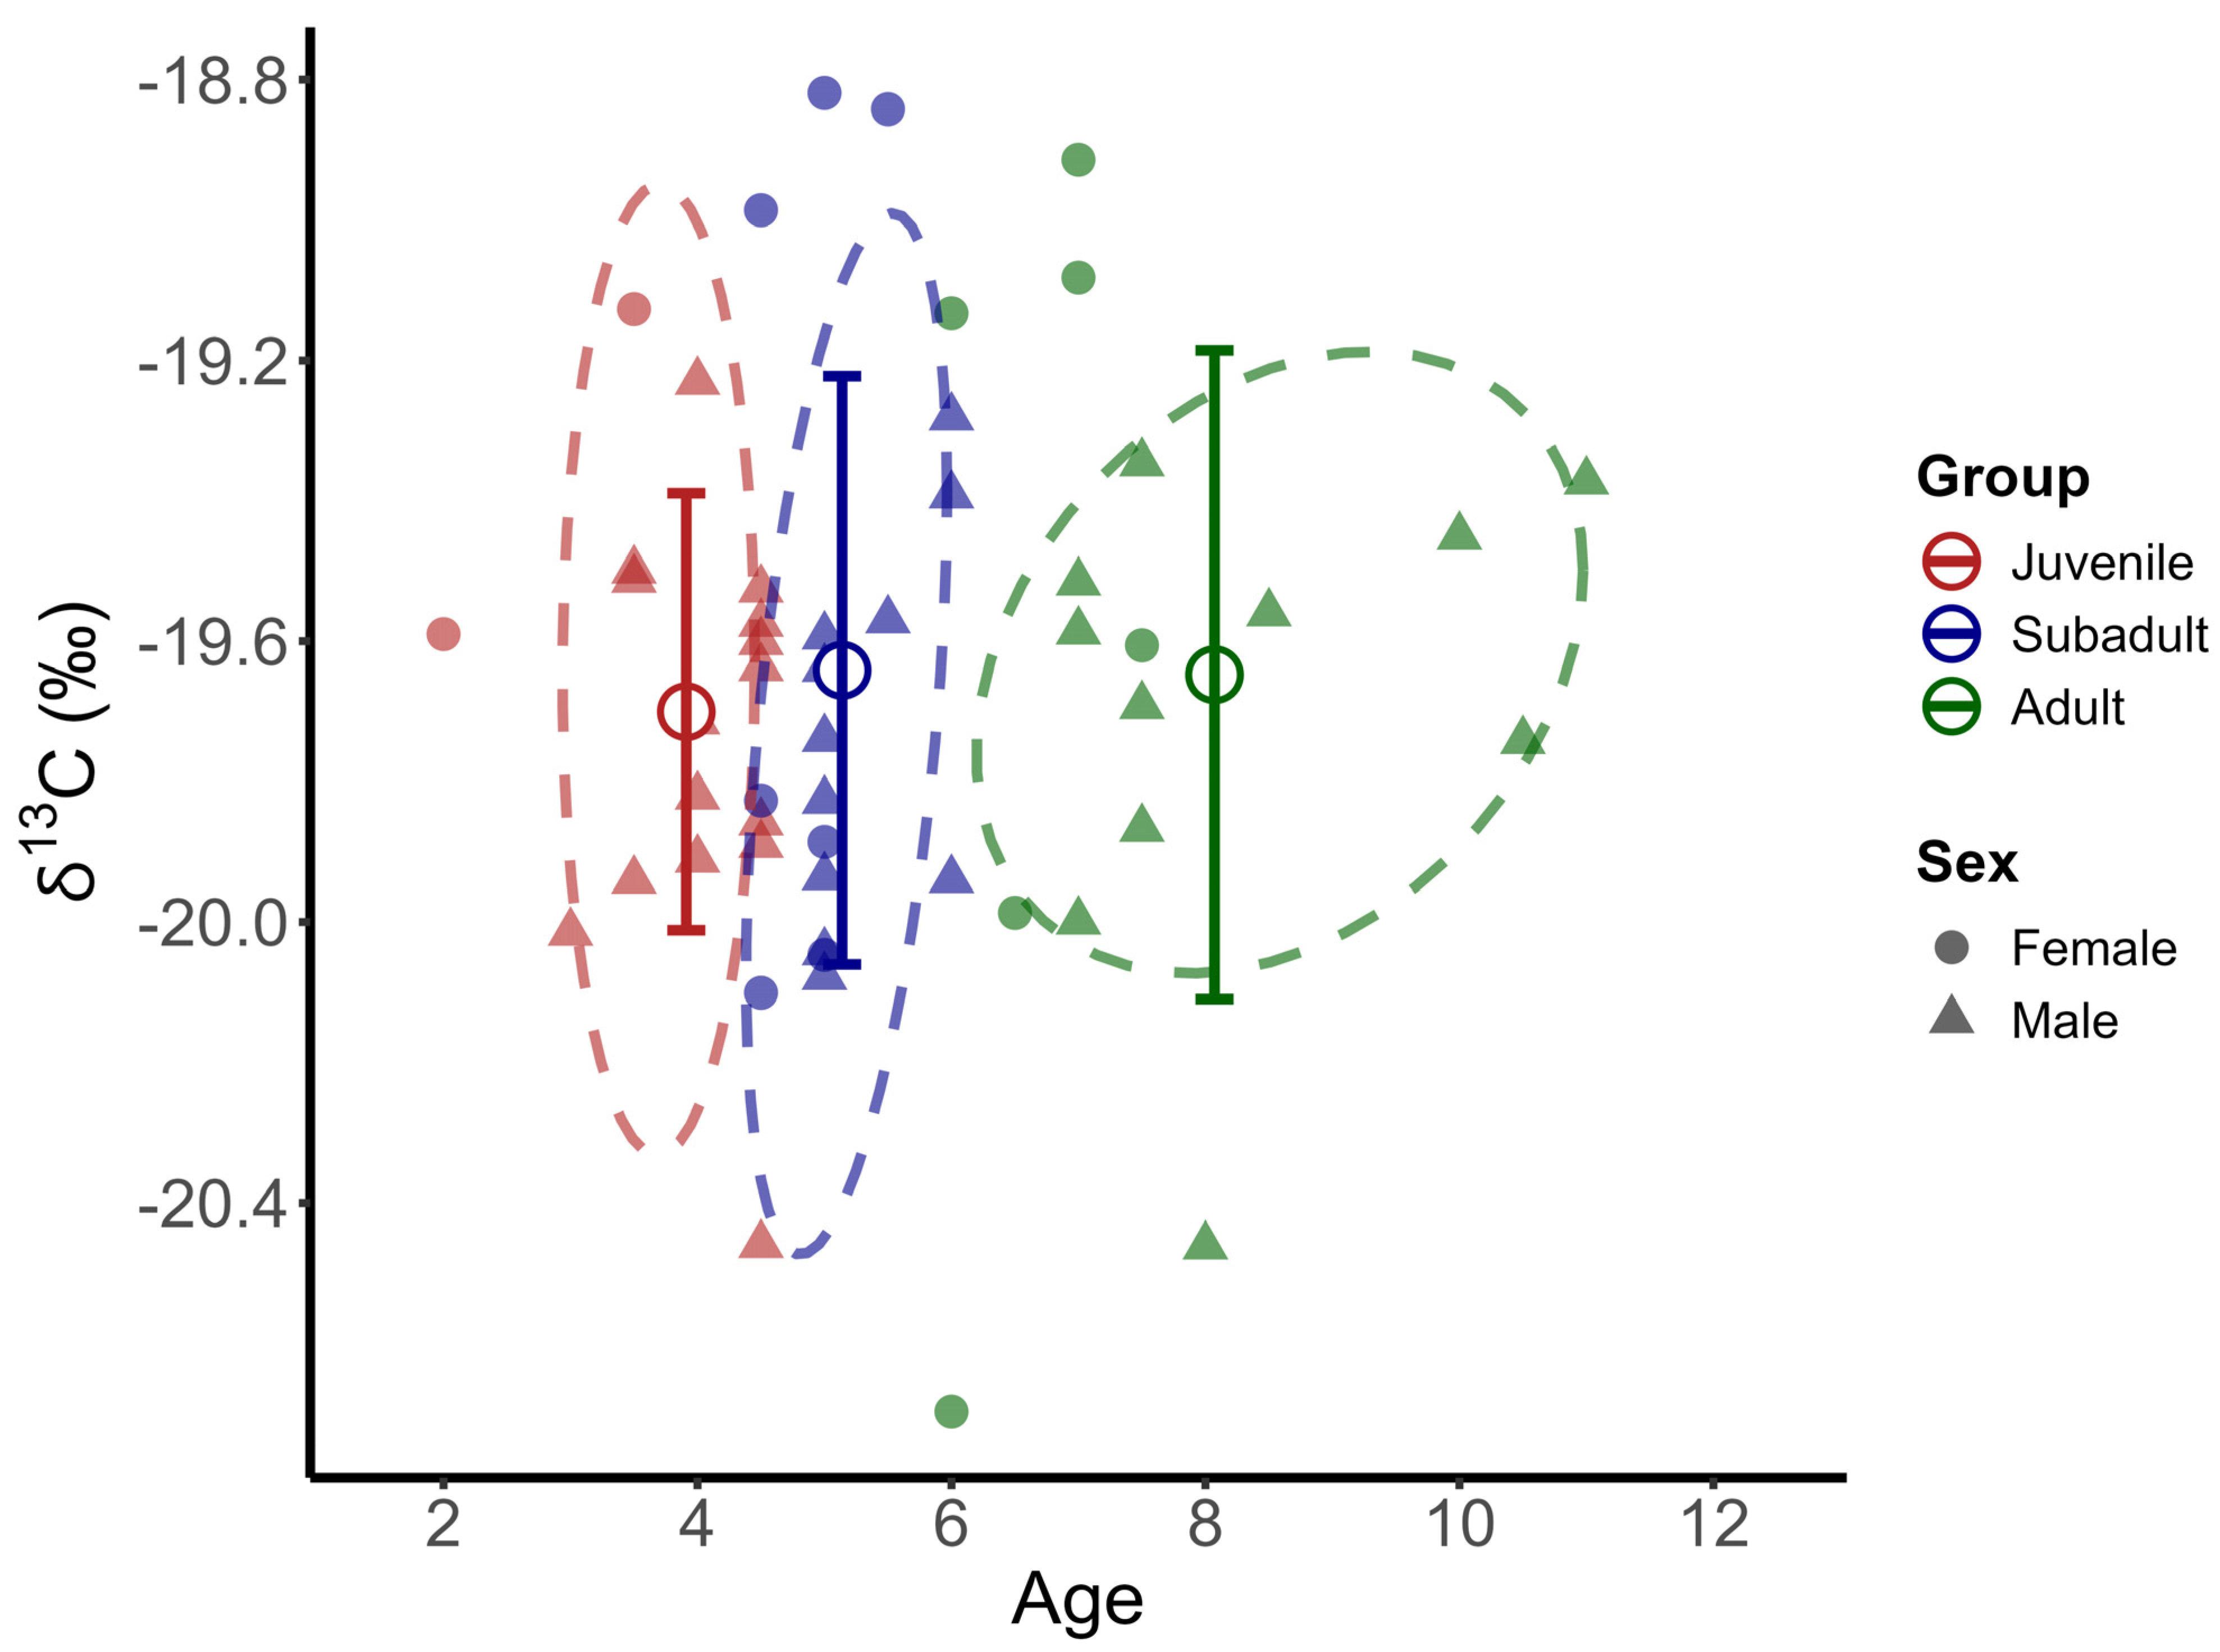
The δ13C values ranged from −20.70‰ to −18.82‰, with a population mean of −19.67 ± 0.39‰ SD (Figure 4). The group-specific statistics are summarized in Table 1. Mean δ13C values were −19.71 ± 0.31‰ (juvenile), −19.62 ± 0.43‰ (subadult), and −19.65 ± 0.46‰ (adult), with no significant differences detected among the three age-defined groups (ANOVA, p = 0.62). When examined by sex, males exhibited a narrower isotopic range (from −20.46 to −19.23‰; mean −19.73 ± 0.29‰) than did the females (from −20.70 to −18.82‰; mean −19.51 ± 0.57‰), but the difference in mean δ13C was not statistically significant (Student’s t-test, p = 0.17). Pairwise comparisons between the sexes also revealed no significant ontogenetic variation (females: p = 0.12; males: p = 0.88).
Although Levene’s test indicated no significant difference in δ13C variance among the five sex–stage groups (excluding juvenile females due to low sample size; p = 0.40), coefficient of variation (CV) values were higher in subadult females (3.02%) and adult females (3.47%) than any of the male groups (CV range: 1.35–1.65%).
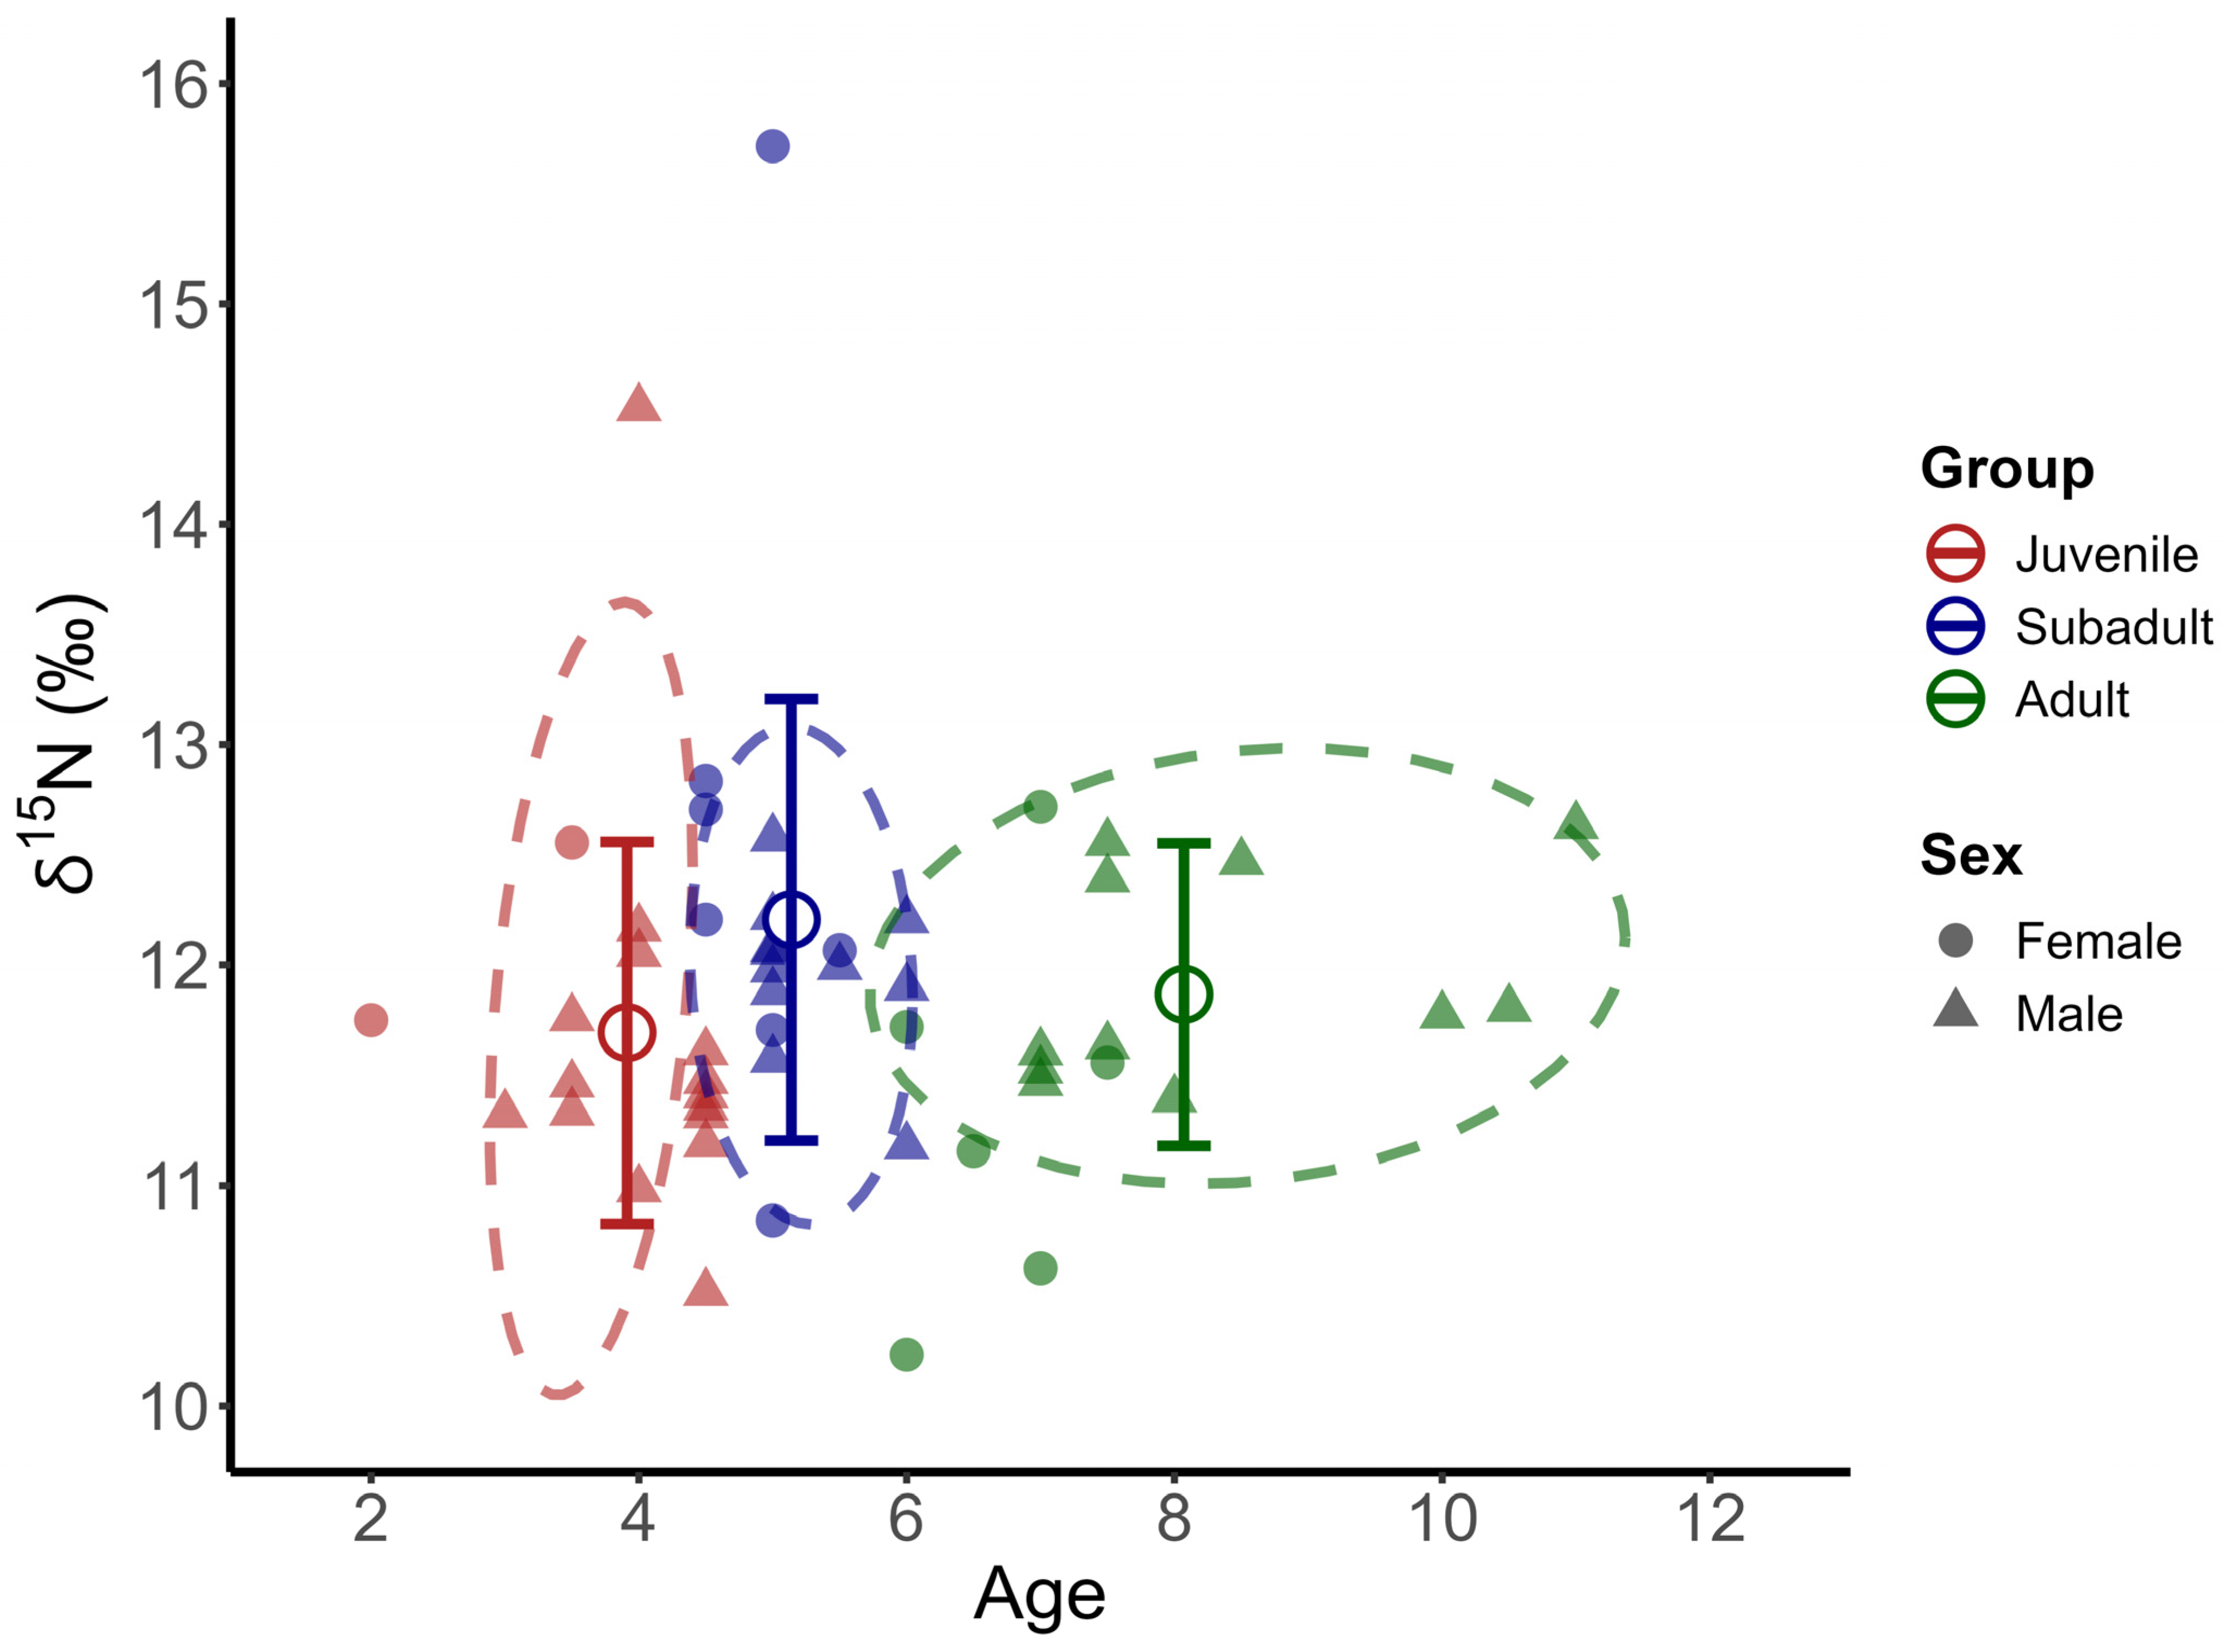
Muscle δ15N values in blue sharks ranged from 10.23‰ to 15.72‰, with a population mean of 11.87 ± 0.88‰ SD (Figure 5). Nitrogen isotopic values differed significantly among the groups (Kruskal–Wallis test, p = 0.037), with subadult sharks exhibiting higher mean values (12.22 ± 1.03‰) than was the case in juvenile individuals (11.70 ± 0.84‰); Bonferroni-adjusted pairwise test, p = 0.014; Table 2). However, δ15N values did not differ significantly between subadult and adult sharks (11.72 ± 0.69‰).
In terms of differences by sex, males had δ15N values ranging from 10.52‰ to 14.53‰ (mean = 11.82 ± 0.66‰), whereas the corresponding values in females ranged from 10.23‰ to 15.72‰ (mean = 12.03 ± 1.29‰), with no significant difference detected between sexes (Mann–Whitney U test, p = 0.51). Intrasexual comparisons across the age-defined groups were also insignificant (females: p = 0.72; males: p = 0.62). Levene’s test indicated no significant differences in δ15N variance among the five sex–age groups (p = 0.24), although subadult females exhibited the highest within-group variability (CV = 12.16%).

3.4. Isotopic Niche Breadth and Overlap

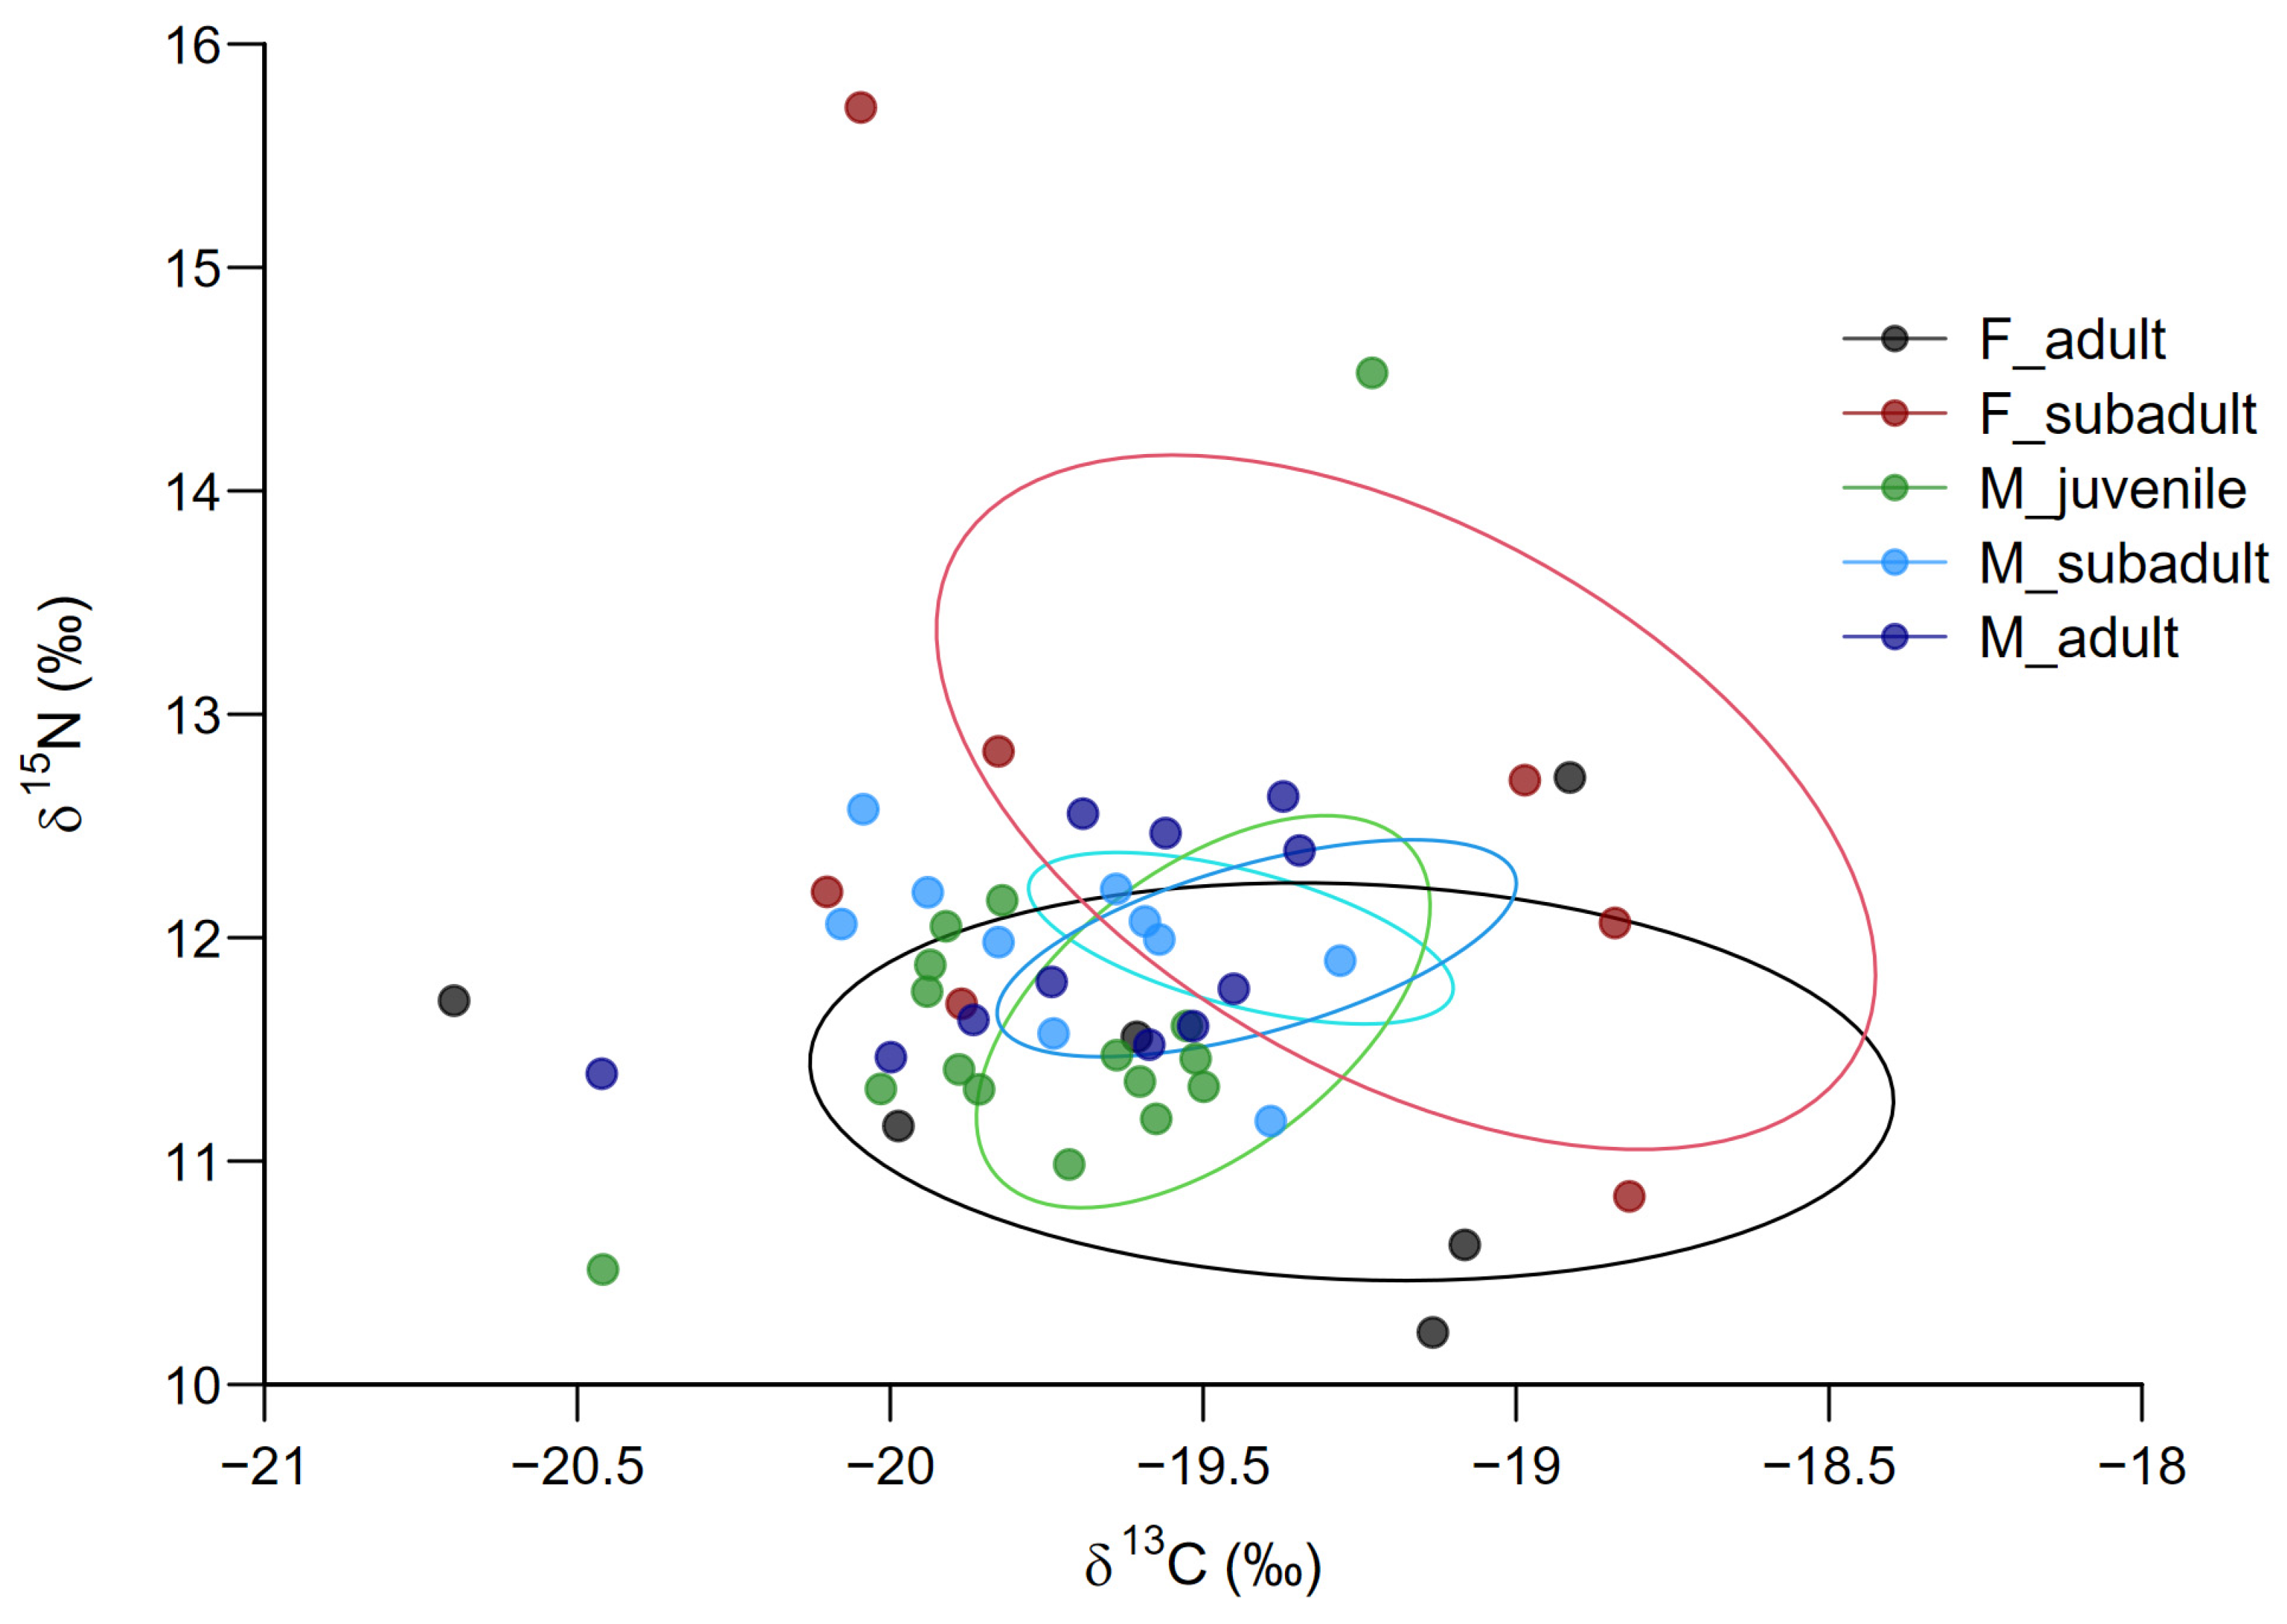
The corrected standard ellipse area (SEAc) revealed marked differences in the isotopic niche structure between the sexes. At the population level, females exhibited a substantially broader isotopic niche (SEAc = 2.42‰2, 95% credible interval:1.47–4.05‰2) than males (0.57‰2, 95% credible interval: 0.41–0.79‰2), with the female-occupied niche being nearly four times larger. This suggests greater trophic variability and individual-level heterogeneity among females.
When individuals were partitioned by both sex and age-defined class, subadult and adult females were found to exhibit the widest ellipses (2.95‰2 and 2.33‰2, respectively), whereas male ellipses ranged from 0.29 to 0.70‰2 (Table 3). Bayesian posterior comparisons provided strong evidence of broader female niches across all age classes (posterior probability > 0.99).
Niche overlap was generally higher within than between sexes (Figure 6). Among males, juvenile and adult individuals showed the greatest overlap (51.9%). In contrast, the overlap between sexes was consistently low. Notably, the overlap between subadult females and subadult males was only 9.81%. This revealed clear sex-based differentiation in resource use, even among individuals in comparable age classes.

4. Discussion

4.1. Temporal and Spatial Distribution Patterns

The mean precaudal length (PCL) exhibited a pronounced trough in July (indicative of the dominance of juvenile and subadult individuals) and a sharp peak in October (all adult individuals; Figure 3). These patterns reflect seasonal shifts in the stage composition and spatial distribution of blue sharks in the northwestern Pacific. The July samples were dominated by juvenile and subadult individuals, consistent with the migration model proposed by Nakano [54], which designated the 30°–40° N region as a nursery ground based on the seasonal aggregation of young sharks. In contrast, all sharks captured in October were large and older. Throughout the autumn sampling period, catch locations were consistently situated at or above 40° N. Some females are believed to linger in the North Pacific Transition Zone (35–45° N) after giving birth before initiating their southward return [13].
March samples (80% adult individuals; ~35° N) likely represent older sharks, possibly associated with reproductive movements or north-bound females potentially aggregating along the southern margin of nursery areas [54,58]. Together, these seasonal shifts in shark size composition and catch locations reflect a clear spatiotemporal partitioning of habitats among age-defined groups. This could potentially be driven by differences in ontogenetic energy demands and reproductive schedules. Such patterns provide a framework for investigating whether life stage-dependent habitat use translates into distinct stable isotope signatures, a question explored in subsequent sections.

4.2. Food Sources

Our study revealed that muscle δ13C values of North Pacific blue sharks ranged from −20.7‰ to −18.8‰ (Table 1), reflecting the isotopically depleted carbon baseline typical of oceanic ecosystems [20,22,59]. Previous stomach content analyses have shown that blue sharks predominantly consume small pelagic fish and cephalopods, and their diel vertical movements align closely with this diet [20,21,34]. Small mesopelagic fishes, such as myctophids, gonostomatids, and anchovy, made up a large portion of the fish prey [20,21]. Because some of these fish rely on phytoplankton-based production, they display relatively enriched (less negative) δ13C values [17,19,60]. Consistent with targeting these small pelagic fishes, the sharks commonly occupy shallower depths (about 80–150 m depth) during the night [61,62]. The sharks also prey on deep-sea organisms such as cephalopods like Gonatus spp., Histioteuthis spp., and Chiroteuthis calyx [20,34]. This kind of prey may inhabit depths upwards of 1500 m, and some possess depleted δ13C signatures [63,64]. During daylight hours, the sharks can dive to depths of over several thousand meters to capture such deep-sea prey [61,62]. These dietary inputs, made accessible by the extensive vertical movements of blue sharks [65], contribute to the mixing of contrasting carbon sources, which likely lowers the overall δ13C signature in muscle tissue.

4.3. Trophic Levels

The statistically significant δ15N enrichment in subadult individuals (Kruskal–Wallis, p = 0.037; Bonferroni-adjusted, p = 0.014) strongly supports growth-driven dietary shifts toward protein-rich prey, aligning with similar observations in other pelagic predators [46,66]. Morphological development, notably gap enlargement and dental maturation from the juvenile and subadult stages, allows for the consumption of larger, protein-rich prey. This ecological mechanism produces δ15N increases without the expected trophic shift [67,68,69]. Although the increment is below the 2.3‰ threshold for a discrete trophic level shift [70], it coincides with the accelerated somatic growth of subadult sharks, a phase marked by elevated protein requirements [71].
The mean δ15N value of adult blue sharks was approximately 0.50‰ lower than that of subadult individuals (Figure 5), mainly driven by adult females. Nearly 53% of adult individuals in this study were collected in waters north of 40° N and between 160°–170° E, where cephalopod baseline δ15N values are typically <8‰ [59]. During the later developmental stages, females may increasingly use shallower waters (<200 m) to maintain thermal stability and compensate for buoyancy changes associated with body growth [7,49,72], as shallow waters receive 15N-poor atmospheric nitrogen, whereas deeper waters are enriched by homogeneous nitrate originating from detritus [73,74,75]. This combination of regional baseline effects and vertical foraging behavior explains the apparent decline in δ15N without reflecting a true change in trophic position.
Notably, two individuals exhibited exceptionally high δ15N values, and one younger (age 4, δ15N = 14.53‰) and one subadult individual (age 5, δ15N = 15.72‰), both exceeding the expected regional range for the northwestern Pacific (10.3–14.0‰; [20,76]. Repeated analyses yielded consistent results, effectively ruling out laboratory errors. Given their age and tissue type, maternal isotopic influence is likely limited, as previous studies have shown that detectable maternal signatures in muscle tissue persist for up to 3.5 years after birth [77]. Instead, the enriched δ15N signatures observed here fall within the range (14.0‰–18.0‰) reported for blue shark muscle in the eastern Pacific, a region with productive upwelling zones [22,41,42]. Because muscle tissue has an isotopic turnover on the scale of several months or longer [78], enriched δ15N signatures acquired in distant foraging areas can persist long after sharks return to the northwestern Pacific. Conventional and electronic tagging efforts have helped uncover the trans-Pacific migration behavior of blue sharks [79,80], supporting long-range foraging as the ecological driver behind these anomalously high isotopic values.
These δ15N patterns reveal pronounced trophic plasticity and spatial connectivity throughout the blue shark’s life cycle. Thus, effective interpretation of isotopic data for such highly mobile predators necessitates consideration of regional baseline heterogeneity, migratory behaviors, and tissue-specific isotopic turnover rates.

4.4. Niche Breadth and Isotopic Overlap

This study revealed that the corrected standard ellipse area (SEAc) of female blue sharks was approximately four times larger than that of males (2.42‰2 vs. 0.57‰2), with niche overlap below 21% (Figure 6). This pronounced sex- and age-specific divergence likely reflects underlying ontogenetic shifts in physiology, reproductive energetics, and habitat use.
Thermal capacity. Large female blue sharks possess an epidermis approximately two-fold thicker [81], likely enhancing thermal tolerance and enabling the exploitation of cooler, nutrient-rich temperate waters during spring and autumn. During the rest of the year, they predominantly inhabit oligotrophic subtropical gyres [82,83,84]. In contrast, males are constrained to intermediate temperature zones (21.7–24 °C) as this temperature range optimally promotes physiological development despite lower productivity [84,85]. These intermediate-temperature zones likely serve as transitional habitats, being suitable for fertilization and early embryonic development, but suboptimal for extended gestation or neonatal survival [86,87]; thus, these zones serve as brief stopover habitats for female sharks, which reinforces the pronounced spatial segregation between the sexes. As a result, the two sexes encounter distinct isotopic baselines and prey fields, creating an asymmetry in niche breadth.
Energetic requirements. Subadult females, transitioning from predominantly somatic growth toward older ages where reproductive capability may arise, exhibited the great δ13C–δ15N dispersion, reflecting their flexible foraging strategies across dynamic oceanographic gradients and variable prey landscapes [88]. Potential reproductive processes, such as mating and gestation, might further elevate these energetic demands, though direct reproductive status was not determined [13,49]. To meet these requirements, females engage in flexible foraging across dynamic oceanographic features and oceanic water masses, thereby enhancing both individual isotopic variability and the overall niche breadth.
Risk avoidance. Spatial segregation may also reflect potential avoidance of aggressive mating behaviors and possible predation risks for neonates [54,89,90]. Consequently, females may enter male-dominated areas in association with their reproductive behavior [84]. During periods when females may become reproductively capable, they migrate to high-latitude, nutrient-rich frontal waters to balance offspring safety with heightened energy demands [58]. Collectively, this risk-avoidant behavior makes spatial segregation an adaptive strategy for female blue sharks.
It is important to note that our study did not aim to determine age at maturity or reproductive condition. Rather, age-based groupings were used as an ecological framework to evaluate isotopic variation across broad ontogenetic stages. Overall, these ecological processes create pronounced isotopic niche divergence between the sexes, reducing intraspecific competition. Demography-specific spatial patterns highlight the critical need for tailored conservation strategies. These strategies should ideally recognize that fishery pressures applied unevenly across habitats may disproportionately affect reproductive females, thereby impacting population dynamics.
It should be noted that the stable isotope analysis was based on 52 individuals, and the small number of juvenile females (n = 2) limited our ability to evaluate sex-specific ecological variations at early ages. Moreover, the uneven representation of certain groups reduced the overall statistical power of the analysis, necessitating cautious interpretation of the corresponding results. In addition, the absence of gonadal or clasper-related anatomical data may have led to the misclassification of individuals near the maturity thresholds into adjacent developmental stages. This potential misclassification could further affect group-level comparisons of isotopic variation. Nonetheless, the classification scheme used here was based on published age-at-50%-maturity estimates [49], which provides a biologically reasonable framework under current sampling constraints. The exploratory spatial modeling using Generalized Additive Models was constrained by the limited number of sampling sites (n = 9), which compromised the reliability of the geographic inference owing to potential overfitting and low spatial resolution. Future research should aim to increase the representation of early-stage females, expand spatial sampling coverage to strengthen demographic comparisons, and improve the resolution of spatial ecological patterns. These efforts are critical for refining our ecological understanding of and providing spatially explicit management strategies for P. glauca in the North Pacific.

Author Contributions

Conceptualization, S.K.; methodology, P.D. and S.K.; software, P.D.; validation, P.D.; formal analysis, P.D.; investigation, P.D. and T.A.R.; resources, S.K.; data curation, P.D.; writing—original draft preparation, P.D.; writing—review and editing, P.D., S.K. and H.M.; visualization, P.D. and H.M.; supervision, S.K. All authors have read and agreed to the published version of the manuscript.

Funding

This work was supported by JST SPRING, Grant Number JPMJSP2114.

Institutional Review Board Statement

Ethical review and approval were waived for this study due to the fact that no live animals were captured, handled, or euthanized specifically for the purpose of this research. Samples were obtained directly from the longline fishery of Kesennuma port in Japan.

Informed Consent Statement

Not applicable.

Data Availability Statement

Data are contained within the article.

Acknowledgments

We thank the fishermen and researchers who worked on the sampling. We would like to thank S. Marcks for English language correction.

Conflicts of Interest

There are no conflicts of interest.

References

  1. Sih, A.; Cote, J.; Evans, M.; Fogarty, S.; Pruitt, J. Ecological implications of behavioural syndromes. Ecol. Lett. 2012, 15, 278–289. [Google Scholar] [CrossRef]
  2. Dall, S.R.; Bell, A.M.; Bolnick, D.I.; Ratnieks, F.L. An evolutionary ecology of individual differences. Ecol. Lett. 2012, 15, 1189–1198. [Google Scholar] [CrossRef]
  3. Bolnick, D.I.; Svanbäck, R.; Fordyce, J.A.; Yang, L.H.; Davis, J.M.; Hulsey, C.D.; Forister, M.L. The ecology of individuals: Incidence and implications of individual specialization. Am. Nat. 2003, 161, 1–28. [Google Scholar] [CrossRef] [PubMed]
  4. Réale, D.; Garant, D.; Humphries, M.M.; Bergeron, P.; Careau, V.; Montiglio, P.O. Personality and the emergence of the pace-of-life syndrome concept at the population level. Philos. Trans. R. Soc. B Biol. Sci. 2010, 365, 4051–4063. [Google Scholar] [CrossRef] [PubMed]
  5. Carlisle, A.B.; Goldman, K.J.; Litvin, S.Y.; Madigan, D.J.; Bigman, J.S.; Swithenbank, A.M.; Kline, T.C., Jr.; Block, B.A. Stable isotope analysis of vertebrae reveals ontogenetic changes in habitat in an endothermic pelagic shark. Proc. R. Soc. B Biol. Sci. 2015, 282, 20141446. [Google Scholar] [CrossRef]
  6. Nasby-Lucas, N.; Dewar, H.; Sosa-Nishizaki, O.; Wilson, C.; Hyde, J.R.; Vetter, R.D.; Wraith, J.; Block, B.A.; Kinney, M.J.; Sippel, T.; et al. Movements of electronically tagged shortfin mako sharks (Isurus oxyrinchus) in the eastern North Pacific Ocean. Anim. Biotelemetry 2019, 7, 12. [Google Scholar] [CrossRef]
  7. Nosal, A.P.; Cartamil, D.P.; Wegner, N.C.; Lam, C.H.; Hastings, P.A. Movement ecology of young-of-the-year blue sharks Prionace glauca and shortfin makos Isurus oxyrinchus within a putative binational nursery area. Mar. Ecol. Prog. Ser. 2019, 623, 99–115. [Google Scholar] [CrossRef]
  8. Newman, S.P.; Handy, R.D.; Gruber, S.H. Ontogenetic diet shifts and prey selection in nursery bound lemon sharks, Negaprion brevirostris, indicate a flexible foraging tactic. Environ. Biol. Fishes 2012, 95, 115–126. [Google Scholar] [CrossRef]
  9. Bonfil, R.; Clarke, S.; Nakano, H. The biology and ecology of the oceanic whitetip shark, Carcharhinus longimanus. In Sharks of the Open Ocean: Biology, Fisheries and Conservation; Wiley-Blackwell: Hoboken, NJ, USA, 2008; pp. 128–139. [Google Scholar] [CrossRef]
  10. O’Keefe, M.; Bengil, E.G.T.; Palmer, J.L.; Beton, D.; Çağlar, Ç.; Godley, B.J.; Özkan, M.; Snape, R.T.E.; Broderick, A.C. Diversity and distribution of elasmobranchs in the coastal waters of Cyprus: Using bycatch data to inform management and conservation. Front. Mar. Sci. 2023, 10, 1181437. [Google Scholar] [CrossRef]
  11. IUCN. The IUCN Red List of Threatened Species. Version 2022-2; IUCN: Gland, Switzerland, 2022. [Google Scholar]
  12. Dulvy, N.K.; Fowler, S.L.; Musick, J.A.; Cavanagh, R.D.; Kyne, P.M.; Harrison, L.R.; Carlson, J.K.; Davidson, L.N.; Fordham, S.V.; Francis, M.P.; et al. Extinction risk and conservation of the world’s sharks and rays. eLife 2014, 3, e00590. [Google Scholar] [CrossRef]
  13. Nakano, H.; Seki, M.P. Synopsis of biological data on the blue shark, Prionace glauca Linnaeus. Bull. Fish. Res. Agency Jpn. 2003, 2003, 18–55. [Google Scholar]
  14. King, J.R.; Wetklo, M.; Supernault, J.; Taguchi, M.; Yokawa, K.; Sosa-Nishizaki, O.; Withler, R.E. Genetic analysis of stock structure of blue shark (Prionace glauca) in the north Pacific ocean. Fish. Res. 2015, 172, 181–189. [Google Scholar] [CrossRef]
  15. Abascal, F.J.; Quintans, M.; Ramos-Cartelle, A.; Mejuto, J. Movements and environmental preferences of the shortfin mako, Isurus oxyrinchus, in the southeastern Pacific Ocean. Mar. Biol. 2011, 158, 1175–1184. [Google Scholar] [CrossRef]
  16. Compagno, L.; Dando, M.; Fowler, S. A Field Guide to the Sharks of the World; Collins: London, UK, 2005. [Google Scholar]
  17. Cortés, E. Standardized diet compositions and trophic levels of sharks. ICES J. Mar. Sci. 1999, 56, 707–717. [Google Scholar] [CrossRef]
  18. Heupel, M.R.; Knip, D.M.; Simpfendorfer, C.A.; Dulvy, N.K. Sizing up the ecological role of sharks as predators. Mar. Ecol. Prog. Ser. 2014, 495, 291–298. [Google Scholar] [CrossRef]
  19. Lopez, S.; Meléndez, R.; Barría, P. Preliminary diet analysis of the blue shark Prionace glauca in the eastern South Pacific. Rev. Biol. Mar. Oceanogr. 2010, 45, 745–749. [Google Scholar] [CrossRef]
  20. Fujinami, Y.; Nakatsuka, S.; Ohshimo, S. Feeding Habits of the Blue Shark (Prionace glauca) in the Northwestern Pacific Based on Stomach Contents and Stable Isotope Ratios. Pac. Sci. 2018, 72, 21–39. [Google Scholar] [CrossRef]
  21. Preti, A.; Soykan, C.U.; Dewar, H.; Wells, R.D.; Spear, N.; Kohin, S. Comparative feeding ecology of shortfin mako, blue and thresher sharks in the California Current. Environ. Biol. Fishes 2012, 95, 127–146. [Google Scholar] [CrossRef]
  22. Hernández-Aguilar, S.B.; Escobar-Sánchez, O.; Galván-Magaña, F.; Abitia-Cárdenas, L.A. Trophic ecology of the blue shark (Prionace glauca) based on stable isotopes (δ13C and δ15N) and stomach content. J. Mar. Biol. Assoc. U. K. 2016, 96, 1403–1410. [Google Scholar] [CrossRef]
  23. Clarke, M.R.; Clarke, D.C.; Martins, H.R.; Silva, H.M. The Diet of the Blue Shark (Prionace glauca L.) in Azorean Waters. 1996. Available online: http://hdl.handle.net/10400.3/1491 (accessed on 30 June 2025).
  24. Rosas-Luis, R.; Navarro, J.; Loor-Andrade, P.; Forero, M.G. Feeding ecology and trophic relationships of pelagic sharks and billfishes coexisting in the central eastern Pacific Ocean. Mar. Ecol. Prog. Ser. 2017, 573, 191–201. [Google Scholar] [CrossRef]
  25. Markaida, U.; Sosa-Nishizaki, O. Food and feeding habits of the blue shark Prionace glauca caught off Ensenada, Baja California, Mexico, with a review on its feeding. J. Mar. Biol. Assoc. U. K. 2010, 90, 977–994. [Google Scholar] [CrossRef]
  26. Hiraoka, Y.; Kanaiwa, M.; Ohshimo, S.; Takahashi, N.; Kai, M.; Yokawa, K. Relative abundance trend of the blue shark Prionace glauca based on Japanese distant-water and offshore longliner activity in the North Pacific. Fish. Sci. 2016, 82, 687–699. [Google Scholar] [CrossRef]
  27. Porcher, I.F.; Darvell, B.W. Shark fishing vs. conservation: Analysis and synthesis. Sustainability 2022, 14, 9548. [Google Scholar] [CrossRef]
  28. Macfadyen, G. Blue Shark: Economic Valuation of the Global Market for Blue Shark Products and Interdependent. 2022. Available online: https://coilink.org/20.500.12592/tvmxxs (accessed on 30 June 2025).
  29. Kai, M. Spatio-temporal changes in catch rates of pelagic sharks caught by Japanese research and training vessels in the western and central North Pacific. Fish. Res. 2019, 216, 177–195. [Google Scholar] [CrossRef]
  30. Castro, J.I.; Woodley, C.M.; Brudek, R.L. A Preliminary Evaluation of the Status of Shark Species; Food and Agriculture Organization of the United Nations: Rome, Italy, 1999. [Google Scholar]
  31. Aires-da-Silva, A.M.; Gallucci, V.F. Demographic and risk analyses applied to management and conservation of the blue shark (Prionace glauca) in the North Atlantic Ocean. Mar. Freshw. Res. 2007, 58, 570–580. [Google Scholar] [CrossRef]
  32. Clarke, S.C.; McAllister, M.K.; Milner-Gulland, E.J.; Kirkwood, G.P.; Michielsens, C.G.J.; Agnew, D.J.; Pikitch, E.K.; Nakano, H.; Shivji, M.S. Global estimates of shark catches using trade records from commercial markets. Ecol. Lett. 2006, 9, 1115–1126. [Google Scholar] [CrossRef]
  33. Rigby, C.L.; Barreto, R.; Carlson, J.; Fernando, D.; Fordham, S.; Francis, M.P.; Herman, K.; Jabado, R.W.; Liu, K.M.; Marshall, A.; et al. Prionace glauca . IUCN Red List Threat. Species 2019, 2019, e.T39381A2915850. [Google Scholar] [CrossRef]
  34. Kubodera, T.; Watanabe, H.; Ichii, T. Feeding habits of the blue shark, Prionace glauca, and salmon shark, Lamna ditropis, in the transition region of the Western North Pacific. Rev. Fish Biol. Fish. 2007, 17, 111–124. [Google Scholar] [CrossRef]
  35. García-Rodríguez, E.; Herzka, S.Z.; Sosa-Nishizaki, O.; Lowe, C.G.; O’Sullivan, J.B. Stable isotope analysis of juvenile white sharks inside a nursery area reveals foraging in demersal-inshore habitats and trophic overlap with sympatric sharks. Front. Mar. Sci. 2021, 8, 687738. [Google Scholar] [CrossRef]
  36. Hussey, N.E.; MacNeil, M.A.; Olin, J.A.; McMeans, B.C.; Kinney, M.J.; Chapman, D.D.; Fisk, A.T. Stable isotopes and elasmobranchs: Tissue types, methods, applications and assumptions. J. Fish Biol. 2012, 80, 1449–1484. [Google Scholar] [CrossRef]
  37. Navarro, J.; López, L.; Coll, M.; Barría, C.; Sáez-Liante, R. Short-and long-term importance of small sharks in the diet of the rare deep-sea shark Dalatias licha. Mar. Biol. 2014, 161, 1697–1707. [Google Scholar] [CrossRef]
  38. Kim, S.L.; Tinker, M.T.; Estes, J.A.; Koch, P.L. Ontogenetic and among-individual variation in foraging strategies of northeast Pacific white sharks based on stable isotope analysis. PLoS ONE 2012, 7, e45068. [Google Scholar] [CrossRef] [PubMed]
  39. Jackson, A.; Inger, R.; Parnell, A.; Bearhop, S. Comparing isotopic niche widths among and within communities: SIBER—Stable Isotope Bayesian Ellipses. J. Anim. Ecol. 2011, 80, 595–602. [Google Scholar] [CrossRef]
  40. Hette-Tronquart, N. Isotopic niche is not equal to trophic niche. Ecol. Lett. 2019, 22, 1987–1989. [Google Scholar] [CrossRef]
  41. Madigan, D.J.; Carlisle, A.B.; Dewar, H.; Snodgrass, O.E.; Litvin, S.Y.; Micheli, F.; Block, B.A. Stable isotope analysis challenges wasp-waist food web assumptions in an upwelling pelagic ecosystem. Sci. Rep. 2012, 2, 654. [Google Scholar] [CrossRef]
  42. Li, Y.; Gong, Y.; Chen, X.; Dai, X.; Zhu, J. Trophic ecology of sharks in the mid-east Pacific ocean inferred from stable isotopes. J. Ocean. Univ. China 2014, 13, 278–282. [Google Scholar] [CrossRef]
  43. Estupiñán-Montaño, C.; Galván-Magaña, F.; Sánchez-González, A.; Elorriaga-Verplancken, F.R.; Delgado-Huertas, A.; Páez-Rosas, D. Dietary ontogeny of the blue shark, Prionace glauca, based on the analysis of δ13C and δ15N in vertebrae. Mar. Biol. 2019, 166, 101. [Google Scholar] [CrossRef]
  44. Polo-Silva, C.J.; Galván-Magaña, F.; Delgado-Huertas, A. Trophic inferences of blue shark (Prionace glauca) in the Mexican Pacific from stable isotope analysis in teeth. Rapid Commun. Mass Spectrom. 2012, 26, 1631–1638. [Google Scholar] [CrossRef]
  45. Rabehagasoa, N.; Lorrain, A.; Bach, P.; Potier, M.; Jaquemet, S.; Richard, P.; Ménard, F. Isotopic niches of the blue shark Prionace glauca and the silky shark Carcharhinus falciformis in the southwestern Indian Ocean. Endanger. Species Res. 2012, 17, 83–92. [Google Scholar] [CrossRef]
  46. Vidal, A.; Cardador, L.; Garcia-Barcelona, S.; Macias, D.; Druon, J.N.; Coll, M.; Navarro, J. The relative importance of biological and environmental factors on the trophodynamics of a pelagic marine predator, the blue shark (Prionace glauca). Mar. Environ. Res. 2023, 183, 105808. [Google Scholar] [CrossRef]
  47. Cailliet, G.M.; Smith, W.D.; Mollet, H.F.; Goldman, K.J. Age and growth studies of chondrichthyan fishes: The need for consistency in terminology, verification, validation, and growth function fitting. Environ. Biol. Fishes 2006, 77, 211–228. [Google Scholar] [CrossRef]
  48. Campana, S.E. Age Determination of Elasmobranchs, with Special Reference to Mediterranean Species: A Technical Manual. In General Fisheries Commission for the Mediterranean; Studies and Reviews; FAO: Rome, Italy, 2014; Volume 94, p. 1. [Google Scholar]
  49. Fujinami, Y.; Semba, Y.; Tanaka, S. Age determination and growth of the blue shark (Prionace glauca) in the western North Pacific Ocean. Fish. Bull. 2019, 117, 107–120. [Google Scholar] [CrossRef]
  50. Megalofonou, P.; Damalas, D.; De Metrio, G. Biological characteristics of blue shark, Prionace glauca, in the Mediterranean Sea. J. Mar. Biol. Assoc. U. K. 2009, 89, 1233–1242. [Google Scholar] [CrossRef]
  51. Skomal, G.B.; Natanson, L.J. Age and growth of the blue shark (Prionace glauca) in the North Atlantic Ocean. Fish. Bull.-Natl. Ocean. Atmos. Adm. 2003, 101, 627–639. [Google Scholar]
  52. Başusta, N.; Demirhan, S.A.; Çiçek, E.; Başusta, A.; Kuleli, T. Age and growth of the common guitarfish, Rhinobatos rhinobatos, in Iskenderun Bay (north-eastern Mediterranean, Turkey). J. Mar. Biol. Assoc. U. K. 2008, 88, 837–842. [Google Scholar] [CrossRef]
  53. Kinney, M.J.; Carvalho, F.; Kai, M.; Semba, Y.; Liu, K.M.; Tsai, W.P.; Leonardo, C.G.; Horacio, H.A.; Daniel, C.C.; Teo, S.L.H. Cluster Analysis Used to Re-Examine Fleet Definitions of North Pacific Fisheries with Spatiotemporal Consideration of Blue Shark Size and Sex Data. 2022. Available online: https://repository.library.noaa.gov/view/noaa/40453 (accessed on 30 June 2025).
  54. Nakano, H. Age, reproduction and migration of blue shark Prionace in the north Pacific ocean. Bull. Natl. Res. Inst. Far Seas Fish. 1994, 31, 141–256. [Google Scholar]
  55. Kim, S.L.; Koch, P.L. Methods to collect, preserve, and prepare elasmobranch tissues for stable isotope analysis. Environ. Biol. Fishes 2012, 95, 53–63. [Google Scholar] [CrossRef]
  56. Shiffman, D.S.; Gallagher, A.J.; Boyle, M.D.; Hammerschlag-Peyer, C.M.; Hammerschlag, N. Stable isotope analysis as a tool for elasmobranch conservation research: A primer for non-specialists. Mar. Freshw. Res. 2012, 63, 635–643. [Google Scholar] [CrossRef]
  57. Suyama, M.; Tokuhiro, T.; Suyama, Y. On the urea content and the ammonia formation of the muscle of sharkfish. I. Bull. Japan. Soc. Sci. Fish. 1950, 16, 211. [Google Scholar] [CrossRef]
  58. Fujinami, Y.; Kurashima, A.; Shiozaki, K.; Hiraoka, Y.; Semba, Y.; Ohshimo, S.; Nakano, H.; Kai, M. New insights into spatial segregation by sex and life-history stage in blue sharks Prionace glauca in the northwestern Pacific. Mar. Ecol. Prog. Ser. 2022, 696, 69–84. [Google Scholar] [CrossRef]
  59. Ohshimo, S.; Madigan, D.J.; Kodama, T.; Tanaka, H.; Komoto, K.; Suyama, S.; Ono, T.; Yamakawa, T. Isoscapes reveal patterns of δ13C and δ15N of pelagic forage fish and squid in the Northwest Pacific Ocean. Prog. Oceanogr. 2019, 175, 124–138. [Google Scholar] [CrossRef]
  60. Estrada, J.A.; Rice, A.N.; Lutcavage, M.E.; Skomal, G.B. Predicting trophic position in sharks of the north-west Atlantic Ocean using stable isotope analysis. J. Mar. Biol. Assoc. U. K. 2003, 83, 1347–1350. [Google Scholar] [CrossRef]
  61. Carey, F.G.; Scharold, J.V.; Kalmijn, A.J. Movements of blue sharks (Prionace glauca) in depth and course. Mar. Biol. 1990, 106, 329–342. [Google Scholar] [CrossRef]
  62. Weng, K.C.; Castilho, P.C.; Morrissette, J.M.; Landeira-Fernandez, A.M.; Holts, D.B.; Schallert, R.J.; Goldman, K.J.; Block, B.A. Satellite tagging and cardiac physiology reveal niche expansion in salmon sharks. Science 2005, 310, 104–106. [Google Scholar] [CrossRef]
  63. Watanabe, H.; Kubodera, T.; Moku, M.; Kawaguchi, K. Diel vertical migration of squid in the warm core ring and cold water masses in the transition region of the western North Pacific. Mar. Ecol. Prog. Ser. 2006, 315, 187–197. [Google Scholar] [CrossRef]
  64. Kubodera, T. Cephalopod fauna off Sanriku and Joban districts, northeastern Japan. In Memoirs of the National Science Museum, Tokyo; National Science Museum: Tokyo, Japan, 1996; Volume 29, pp. 187–207. [Google Scholar]
  65. Carbonara, P.; Prato, G.; Alfonso, S.; Bottaro, M.; Hinrichs, T.; Krumme, U.; Neglia, C.; Niedermüller, S.; Toomey, L.; Zupa, W. Blue shark vertical movement patterns in the Central Mediterranean: Bycatch mitigation windows revealed from pop-up satellite archival tag data. Rev. Fish Biol. Fish. 2024, 34, 1–23. [Google Scholar] [CrossRef]
  66. Martínez-Rincón, R.O.; Acosta-Pachón, T.A. Effect of environmental factors, fish size, and baseline on carbon and nitrogen stable isotope variability in Thunnus alalunga, T. albacares, and T. obesus in the Pacific Ocean. Prog. Oceanogr. 2022, 203, 102786. [Google Scholar] [CrossRef]
  67. Tricas, T.C. Relationships of the blue shark, Prionace glauca, and its prey species near Santa Catalina Island, California. Fish. Bull. 1979, 77, 175–182. [Google Scholar]
  68. Scharf, F.S.; Juanes, F.; Rountree, R.A. Predator size-prey size relationships of marine fish predators: Interspecific variation and effects of ontogeny and body size on trophic-niche breadth. Mar. Ecol. Prog. Ser. 2000, 208, 229–248. [Google Scholar] [CrossRef]
  69. Litvinov, F.F. On the role of dense aggregations of males and juveniles in the functional structure of the range of the blue shark Prionace glauca. J. Ichthyol. 2006, 46, 613–624. [Google Scholar] [CrossRef]
  70. Hussey, N.E.; Brush, J.; McCarthy, I.D.; Fisk, A.T. δ15N and δ13C diet–tissue discrimination factors for large sharks under semi-controlled conditions. Comp. Biochem. Physiol. Part A Mol. Integr. Physiol. 2010, 155, 445–453. [Google Scholar] [CrossRef]
  71. Goñi, N.; Arrizabalaga, H. Seasonal and interannual variability of fat content of juvenile albacore (Thunnus alalunga) and bluefin (Thunnus thynnus) tunas during their feeding migration to the Bay of Biscay. Prog. Oceanogr. 2010, 86, 115–123. [Google Scholar] [CrossRef]
  72. Vaudo, J.J.; Wetherbee, B.M.; Wood, A.D.; Weng, K.; Howey-Jordan, L.A.; Harvey, G.M.; Shivji, M.S. Vertical movements of shortfin mako sharks Isurus oxyrinchus in the western North Atlantic Ocean are strongly influenced by temperature. Mar. Ecol. Prog. Ser. 2016, 547, 163–175. [Google Scholar] [CrossRef]
  73. Altabet, M.A. Nitrogen isotopic evidence for micronutrient control of fractional NO3− utilization in the equatorial Pacific. Limnol. Oceanogr. 2001, 46, 368–380. [Google Scholar] [CrossRef]
  74. Sigman, D.M.; Granger, J.; DiFiore, P.J.; Lehmann, M.M.; Ho, R.; Cane, G.; Van Geen, A. Coupled nitrogen and oxygen isotope measurements of nitrate along the eastern North Pacific margin. Glob. Biogeochem. Cycles 2005, 19. [Google Scholar] [CrossRef]
  75. Pethybridge, H.; Choy, C.A.; Logan, J.M.; Allain, V.; Lorrain, A.; Bodin, N.; Somes, C.J.; Young, J.; Ménard, F.; Langlais, C.; et al. A global meta-analysis of marine predator nitrogen stable isotopes: Relationships between trophic structure and environmental conditions. Glob. Ecol. Biogeogr. 2018, 27, 1043–1055. [Google Scholar] [CrossRef]
  76. Madigan, D.J.; Shipley, O.N.; Carlisle, A.B.; Dewar, H.; Snodgrass, O.E.; Hussey, N.E. Isotopic tracers suggest limited trans-oceanic movements and regional residency in North Pacific blue sharks (Prionace glauca). Front. Mar. Sci. 2021, 8, 653606. [Google Scholar] [CrossRef]
  77. Niella, Y.; Raoult, V.; Gaston, T.; Peddemors, V.M.; Harcourt, R.; Smoothey, A.F. Overcoming multi-year impacts of maternal isotope signatures using multi-tracers and fast turnover tissues in juvenile sharks. Chemosphere 2021, 269, 129393. [Google Scholar] [CrossRef]
  78. Logan, J.M.; Lutcavage, M.E. Stable isotope dynamics in elasmobranch fishes. Hydrobiologia 2010, 644, 231–244. [Google Scholar] [CrossRef]
  79. Musyl, M.K.; Brill, R.; Curran, D.S.; Fragoso, N.M.; McNaughton, L.; Nielsen, A.; Kikkawa, B.S.; Moyes, C.D. Postrelease survival, vertical and horizontal movements, and thermal habitats of five species of pelagic sharks in the central Pacific Ocean. Fish. Bull. 2011, 109, 341–368. [Google Scholar]
  80. Maxwell, S.M.; Scales, K.L.; Bograd, S.J.; Briscoe, D.K.; Dewar, H.; Hazen, E.L.; Lewison, R.L.; Welch, H.; Crowder, L.B. Seasonal spatial segregation in blue sharks (Prionace glauca) by sex and size class in the Northeast Pacific Ocean. Divers. Distrib. 2019, 25, 1304–1317. [Google Scholar] [CrossRef]
  81. Pratt, H.L., Jr. Reproduction in the blue shark, Prionace glauca. Fish. Bull. 1979, 77, 445–470. [Google Scholar]
  82. Vandeperre, F.; Aires-da-Silva, A.; Fontes, J.; Santos, M.; Serrão Santos, R.; Afonso, P. Movements of blue sharks (Prionace glauca ) across their life history. PLoS ONE 2014, 9, e103538. [Google Scholar] [CrossRef] [PubMed]
  83. Howey, L.A.; Wetherbee, B.M.; Tolentino, E.R.; Shivji, M.S. Biogeophysical and physiological processes drive movement patterns in a marine predator. Mov. Ecol. 2017, 5, 16. [Google Scholar] [CrossRef]
  84. Druon, J.N.; Campana, S.; Vandeperre, F.; Hazin, F.H.; Bowlby, H.; Coelho, R.; Queiroz, N.; Serena, F.; Abascal, F.; Damalas, D.; et al. Global-scale environmental niche and habitat of blue shark (Prionace glauca) by size and sex: A pivotal step to improving stock management. Front. Mar. Sci. 2022, 9, 828412. [Google Scholar] [CrossRef]
  85. Wearmouth, V.J.; Sims, D.W. Sexual segregation in marine fish, reptiles, birds and mammals: Behaviour patterns, mechanisms and conservation implications. Adv. Mar. Biol. 2008, 54, 107–170. [Google Scholar] [CrossRef]
  86. Hazin, F.H.; Kihara, K.; Otsuka, K.; Boeckman, C.E.; Leal, E.C. Reproduction of the blue shark Prionace glauca in the south-western equatorial Atlantic Ocean. Fish. Sci. 1994, 60, 487–491. [Google Scholar] [CrossRef]
  87. Fujinami, Y.; Shiozaki, K.; Hiraoka, Y.; Semba, Y.; Ohshimo, S.; Kai, M. Seasonal migrations of pregnant blue sharks Prionace glauca in the northwestern Pacific. Mar. Ecol. Prog. Ser. 2021, 658, 163–179. [Google Scholar] [CrossRef]
  88. Klimley, A.P. The determinants of sexual segregation in the scalloped hammerhead shark, Sphyrna lewini. Environ. Biol. Fishes 1987, 18, 27–40. [Google Scholar] [CrossRef]
  89. Hampton, J. Indicators of the spatial distribution of blue shark (Prionace glauca) in the North Pacific. WCPFC-SC14-2018/SA WP-09. In Proceedings of the 14th Regular Session of the Scientific Committee, Busan, Republic of Korea, 21 July 2018; p. 16. [Google Scholar]
  90. McCord, M.E.; Campana, S.E. A quantitative assessment of the diet of the blue shark (Prionace glauca) off Nova Scotia, Canada. J. Northwest Atl. Fish. Sci. 2003, 32, 57–63. [Google Scholar] [CrossRef]
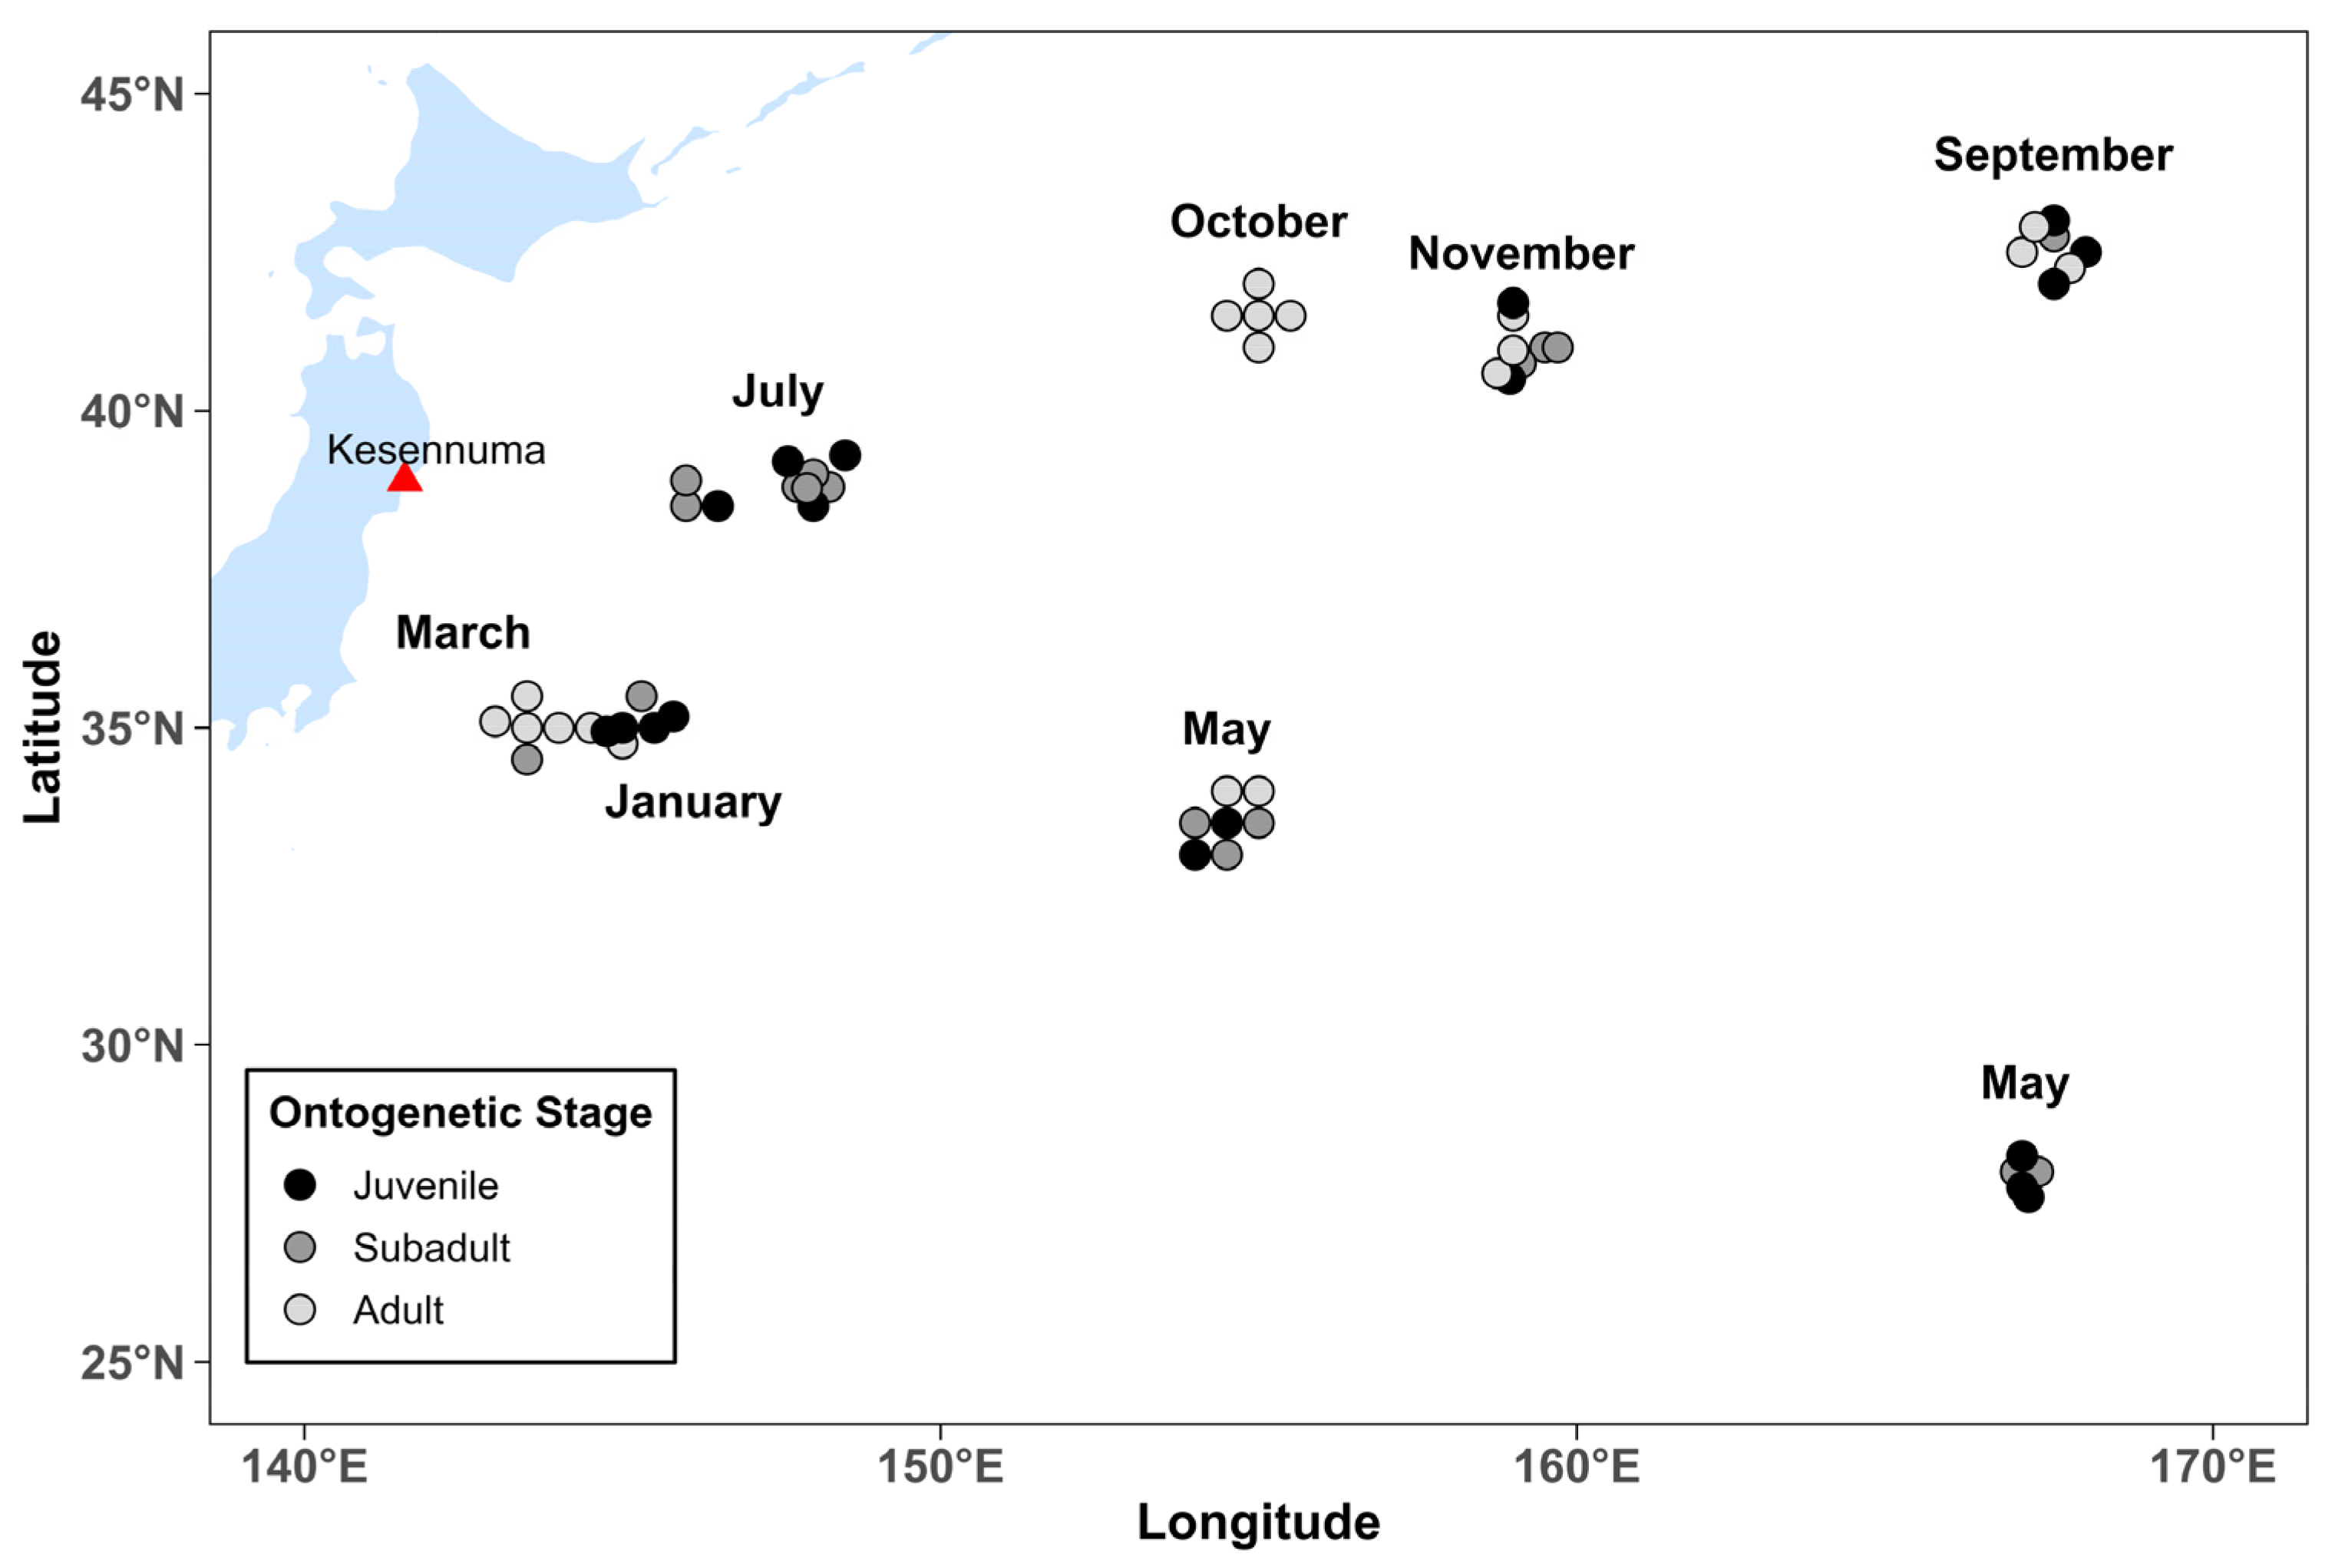
Figure 1. Sampling sites for blue sharks in the northwestern Pacific Ocean.
Fishes 10 00402 g001
Figure 2. Age-bias plot comparing ages from unstained whole and stained whole blue sharks’ vertebrae. The extent of deviation of the 95% confidence interval bar from the 1:1 line indicates the extent of ageing bias.
Fishes 10 00402 g002
Figure 3. Variation in precaudal length (PCL) of blue sharks (Prionace glauca) across sampling months, showing mean values for males (M) and females (F). Shaded areas indicate the standard error (SE) of the mean for each sex.
Fishes 10 00402 g003
Figure 4. Mean δ13C values and standard deviation (SD) of blue sharks across age-defined groups and sex. Dashed ellipses represent the bivariate data dispersion for each age-defined group, enclosing 90% of observations for Juveniles and Subadults, and 75% for Adults.
Fishes 10 00402 g004
Figure 5. Mean δ15N values and standard deviation (SD) of blue sharks across age-defined groups and sex. Dashed ellipses represent the bivariate data dispersion, enclosing 90% of observations for Juveniles and Subadults and 85% for Adults.
Fishes 10 00402 g005
Figure 6. Isotopic niche areas (δ13C and δ15N) of blue sharks across ontogenetic stages and sexes in the northwestern Pacific Ocean.
Fishes 10 00402 g006
Table 1. Summary of δ13C and δ15N values (mean ± SE and range) by sex and ontogenetic stage in blue sharks.
SexAge-Defined Groupnδ13C (‰)
Mean ± SE
CV_δ13C (%)δ15N (‰)
Mean ± SE
CV_δ15N (%)
FJuvenile 2−19.36 ± 0.231.6912.15 ± 0.404.69
FSubadult7−19.50 ± 0.223.0212.58 ± 0.5812.16
FAdult6−19.57 ± 0.283.4711.33 ± 0.367.75
MJuvenile 16−19.76 ± 0.071.4411.65 ± 0.227.44
MSubadult 10−19.71 ± 0.081.3511.97 ± 0.123.16
MAdult11−19.69 ± 0.101.6511.93 ± 0.144.02
Table 2. Isotopic values of δ15N of different age-defined groups of blue sharks.
Age-Defined GroupJuvenileSubadultAdult
Juvenile-0.0140.530
Subadult -0.148
Adult -
Table 3. Percentage overlap of SEAc (‰2) for a sex-stage demographic group of blue sharks.
CategoryM_JuvenileM_SubadultM_AdultF_SubadultF_AdultIsotopic Niche SEAc (95% Credible Interval)
M_juvenile-32.0351.9320.8929.520.70 (0.43–1.15)
M_subadult -40.789.8112.430.29 (0.16–0.57)
M_adult -14.6818.720.44 (0.25–0.84)
F_subadult -50.202.33 (0.96–4.98)
F_adult -2.95 (1.41–6.43)
Disclaimer/Publisher’s Note: The statements, opinions and data contained in all publications are solely those of the individual author(s) and contributor(s) and not of MDPI and/or the editor(s). MDPI and/or the editor(s) disclaim responsibility for any injury to people or property resulting from any ideas, methods, instructions or products referred to in the content.