Article

Microplastics Induce Structural Color Deterioration in Fish Poecilia reticulata Mediated by Oxidative Stress

1
Key Laboratory of Freshwater Aquatic Genetic Resources, Ministry of Agriculture and Rural Affairs, Shanghai Ocean University, Shanghai 201306, China
2
Key Laboratory of Exploration and Utilization of Aquatic Genetic Resources, Ministry of Education, Shanghai Ocean University, Shanghai 201306, China
3
National Demonstration Center for Experimental Fisheries Science Education, Shanghai Ocean University, Shanghai 201306, China
4
Zhuhai Modern Agriculture Development Center, Zhuhai 519000, China
*
Authors to whom correspondence should be addressed.
These authors contributed equally to the work.
Fishes 2025, 10(8), 382; https://doi.org/10.3390/fishes10080382
Submission received: 9 June 2025 / Revised: 9 July 2025 / Accepted: 24 July 2025 / Published: 5 August 2025
(This article belongs to the Special Issue Impact of Climate Change and Adverse Environments on Aquaculture)

Abstract

Microplastics (MPs) can affect fish health by inducing oxidative stress, but their impact on structural coloration remains poorly understood. This study investigated the effects of environmentally relevant concentrations (16 and 160 μg/L) of MPs and nanoplastics (NPs) exposure on growth, oxidative stress and structural coloration in blue strain guppy fish (Poecilia reticulata). Results showed exposure to 160 μg/L MPs significantly reduced specific growth rate of fish compared to controls. Plastic accumulation followed a dose-dependent pattern, especially within gut concentrations. Oxidative stress responses differed between MPs and NPs: 160 μg/L MPs decreased SOD activity in skin and reduced GSH levels, while 160 μg/L NPs increased MDA levels in gut tissues, indicating severe lipid peroxidation. Structural coloration analysis revealed exposure to 160 μg/L MPs decreased lightness and increased yellowness, demonstrating reduced blue coloration. This was accompanied by an increase in skin uric acid content, suggesting that guanine conversion might occur to combat oxidative stress. These findings demonstrate that MPs, particularly at high concentrations, impair growth and induce oxidative stress in guppies. To counteract stress, guanine in iridophores may be converted into uric acid, leading to a decline in structural coloration. This study is the first to reveal that MPs disrupt structural coloration of fish, providing new insights into the ecological risks of plastic pollution on aquatic organisms.
Key Contribution: This study reports MPs reduce the structural color of fish with implications for aquatic organism and ecosystems health.

1. Introduction

Body color is an important trait for fish, as it is involved in transmitting social signals, camouflage, avoiding natural enemies, courtship, temperature regulation, and resisting UV damage [1]. For ornamental fish, those with better body color quality have higher economic value. The body color of fish is formed by the interaction of pigment cells and pigments within them [2]. So far, researchers have identified six different types of chromatophores in fish, including melanophores, erythrophores, xanthophores, iridophores, leucophores, and cyanophores [3,4]. Based on different mechanisms, the formation of fish body color can be divided into two types [5]. One is pigmentary colors that are achieved by the absorption of specific wavelengths of light by intracellular pigments. Melanophores, erythrophores, xanthophores, and cyanophores belong to this type. For example, the red and black colors of fish are usually caused by astaxanthin within erythrophores and melanin with melanophores, respectively [2,3,6]. Another is structural colors that are achieved by reflecting light of a specific frequency and wavelength. Iridophores and leucophores usually belong to this type. For example, the blue–green color of fish was formed by guanine stacks within iridophores [2,7].
It has been reported that the body color of fish is very sensitive to environmental pollutants, and fish can reduce their body color to compensate for oxidative stress when they are under environmental stress [8,9,10]. For example, the monocrotophos pesticide reduced the area and intensity of sexually attractive orange spots in male guppies [11]. Bisphenol A caused a decrease in the body color intensity of male red Cyprinella lutrensis [12]. Triphenyltin exposure could induce oxidative stress and reduce carotenoid-based coloration in male guppies [13]. Exposure to medetomidine could cause skin lightening and aggregation of chromatophores in rainbow trout [14]. These studies suggest the importance of using body color tests as a sensitive tool in assessing the impact of pollutants present in aquatic environments. However, the current research on the impact of environmental pollutants on fish body color has mainly focused on pigmentary color, while studies on the influence of structural color are relatively scarce. Only Cahn et al. [15] reported that guanine-based structural coloration could also be used as an indicator of oxidative stress induced by ultraviolet-B exposure in a cichlid fish.
Microplastics (MPs), as a new pollutant, are often defined as plastic particles with a size of less than 5 mm [16,17,18,19]. The small size of MPs makes them easy for aquatic animals to ingest. After being ingested, MPs can be accumulated in the gut of aquatic organisms, causing oxidative stress, metabolic disorders, intestinal damage, and growth inhibition [20,21,22]. For example, after being exposed to polystyrene-MPs, the growth performance of discus fish decreased and oxidative damage was induced [23]. When guppies were exposed to polystyrene-MPs, the condition factor was inhibited, and SOD and GSH antioxidant systems were also activated [20]. These studies have shown that MPs can cause oxidative stress in fish, but there are relatively few studies on the impact of nanoplastics (NPs, size smaller than 1 μm) on fish oxidative stress.
Fish pigmentation can also be influenced by oxidative stress caused by MPs. Previous studies have shown that lightness and redness values of discus fish skin were significantly inhibited by MPs, because astaxanthin could mitigate the oxidative stress caused by MPs but at the expense of reduced skin pigmentation [24]. Fish iridophores, which produce structural color using guanine stacks, might be affected by the prooxidant–antioxidant balance of the fish, because their metabolic product of uric acid is an antioxidant [15]. It has been proven that guanine can be synthesized endogenously in organisms, but the expression of guanine-based structural colors depends on external environmental conditions [25,26]. Guanine may also alleviate the oxidative stress caused by MPs, but at the cost of a decrease in structural color. Blue guppy is characterized by no melanin deposition all over the body and many iridophores within the caudal fin, making the tail of the guppy blue. Therefore, this strain of guppy is an ideal experimental material for studying the regulation of fish structural color. It is hypothesized that guppies exposed to MPs/NPs would cause oxidative stress, and guanine in guppy iridocytes might be partially converted to uric acid due to oxidative stress compensation, resulting in an increase in uric acid content and a decrease in structural color produced by guanine crystal plates. These results are helpful to reveal the regulatory mechanisms of fish body color and the toxicological effects of MPs/NPs on aquatic organisms.

2. Materials and Methods

2.1. Experimental Materials

Juvenile blue guppies (Poecilia reticulata) were provided by the Key Laboratory of Freshwater Aquatic Genetic Resources, Ministry of Agriculture and Rural Affairs, Shanghai Ocean University (Shanghai, China). Before the experiment, the fish were temporarily reared for two weeks in ten tanks (100 × 60 × 50 cm, 300 L). Dechlorinated tap water was filtered by reverse osmosis and kept at 26 ± 1.0 °C. Dissolved oxygen was maintained above 6.5 mg/L, and the light/dark photoperiod was 12:12 h. The Artemia nauplii were fed three times a day via satiation feeding. The animals were cultured and euthanized following the terms of use of animals approved by the Institutional Animal Care and Use Committee at Shanghai Ocean University, China.
Polyethylene fluorescent MPs (32–40 μm) and NPs (88 nm) (manufactured by Tianjin Baseline Chromtech Research Centre, Tianjin, China) were used. The suspension of MPs was prepared with sterile ultra-pure water and ethanol (4:1, v/v), and Tween-20 surfactant (0.1%, v/v) was added to disperse MPs [27]. The solution concentration of MPs/NPs was measured using a flow cytometer (FC 500 MPL, Beckman Coulter, CA, USA). The MPs/NPs stocks (density 10 mg/mL) were stored at 4 °C in the dark and sonicated before use.

2.2. Experimental Design

The fish were starved for 24 h before the start of the experiment. A total of 240 juvenile guppies with similar size (initial weight 0.12 g) were selected and randomly distributed to 15 tanks (15 × 45 × 30 cm), with 16 fish per tank. The 15 tanks were divided into five groups, with three tanks for each group. There were two plastic types (MPs and NPs) and two concentrations (16 µg/L and 160 µg/L), so four treatments, including NPs-16 (16 µg/L NPs), NPs-160 (160 µg/L NPs), MPs-16 (16 µg/L MPs), MPs-160 (160 µg/L MPs), and one control (0 µg/L) were set. The MPs concentrations of 16 µg/L (41.6 particles/L) and 160 µg/L (416 particles/L) were employed according to the environmentally realistic and ecologically relevant concentrations, respectively [28,29]. Concentrations of NPs were selected based on the detected environmental concentrations, e.g., ~15 μg L−1 [30] and previous studies, e.g., 100–500 μg L−1 PS NPs [31,32,33].
During the exposure, all tanks were continuously aerated to ensure comparable O2 saturation levels and to prevent MPs from aggregating and sinking. The culture water used in the experiment was dechlorinated tap water filtered by a reverse osmosis membrane to reduce the effect of relevant contamination. One-third of the water was changed in each tank every day. MPs were supplemented to keep the concentrations unchanged. The newly hatched Artemia nauplii were fed three times a day throughout the experiment. The dead fish were immediately removed from the tank and recorded during the experiment. The survival rate (SR% = final number/initial number × 100%) was calculated. After being exposed to MPs/NPs for 30 days, the fish were fasted for 24 h. The final weights of the fish were measured. The specific growth rate (SGR%/day) was calculated as (ln final weight − ln initial weight)/days of exposure × 100%.

2.3. Sample Collection

After the exposure experiment, the fish were anesthetized with 200 mg/L MS-222. After anesthesia, the body color of the fish was measured. The fish were then dissected on ice for skin, gill, and gut sampling. In each tank, three gills and three guts were mixed as one sample for MPs and NPs quantification. Three skins and three guts were respectively mixed for the determination of antioxidant-related indexes. Similarly, three skins and three guts were respectively mixed for uric acid determination. MPs and NPs quantitative samples were kept at −20 °C for preservation; the rest of the samples were frozen in liquid nitrogen and stored at −80 °C.

2.4. Body Color Measurement

Skin color values of the fish were measured by using a Konica Minolta CR-10 plus Chroma Meter (Minolta Camera Co. Ltd., Asaka, Japan) in D65 light source. The L, a, and b measurement mode was measured on the middle of the caudal fin for each fish. L, a, and b refer to the absolute value of the color. “L” represents the lightness variable: 0–100 means from black to white. “a” represents the red–green chromaticity: positive values indicate a red bias; negative values indicate a green bias. “b” represents the yellow–blue chromaticity: positive values indicate yellowish, negative values indicate blueish. The average L, a, and b values measured before the start of the experiment were used as the standard values of the samples, and the values measured at the end of the exposure were used as the sample values. △L = L sample − L standard (lightness difference); △a = a sample − a standard (red/green difference); △b = b sample − b standard (yellow/blue difference). The color difference is expressed by ΔE = [(ΔL)2 + (Δa)2 + (Δb)2]1/2. The larger the value of ΔE, the greater the color difference [34].

2.5. Accumulation of MPs/NPs in Fish Gill and Gut

Concentrations of MPs and NPs accumulated in the fish gill and gut were determined by the method of Karami et al. (2017) with slight modifications [35]. The whole gut and gill were digested by 10% KOH solution at 40 °C for 48 h. Deionized water was used to digest solutions to 10 mL as a final volume. A Synergy H4 Hybrid Multi-Mode Microplate Reader (BioTek Instruments, Winooski, VT, USA) was adopted to measure MPs/NPs concentrations [33]. Polyethylene fluorescent MPs (32–40 μm) and NPs (88 nm) (manufactured by Tianjin Baseline Chromtech Research Centre, China) were employed as standards. The standard concentrations were 0, 2, 4, 6, 8, and 10 µg/L, at the reading wavelengths 488 and 518 nm. The accumulation was calculated by the standard curve that was generated by using serial dilutions of MPs/NPs. The recovery rate of fluorescent MPs could reach 98% [36]. The concentration was expressed as μg per mg of tissue (μg/mg).

2.6. Quality Assurance and Quality Control

During sampling, all tools such as glassware capped with aluminum foil were thoroughly rinsed with ethanol and filtered ultrapure water prior to use, to avoid the potential contamination caused by MPs/NPs in the air. To minimize potential contamination in the laboratory, clean lab coats and latex gloves were employed during the experiments. Blank procedures were carried out to ascertain MPs/NPs contamination level during the laboratory works, and no MPs/NPs were found.

2.7. Measurement of Antioxidant Capacity

Superoxide dismutase (SOD) was determined by the xanthine oxidase method. The principle of determination is that, under aerobic conditions, xanthine oxidase catalyzes xanthine substrate to produce superoxide anion radical (O2), which oxidizes hydroxylamine to produce nitrite, which becomes purple–red under the action of the chromogenic agent. SOD activity is defined as the SOD inhibition rate of 50% in 1 mL of reaction solution for each mg of tissue protein, corresponding to the amount of SOD for 1 activity unit (U). Total SOD activity was expressed as (U/mg protein). The determination of catalase (CAT) was performed by the ammonium molybdate method. The principle is that the decomposition of H2O2 by CAT can be absorbed by the addition of ammonium molybdate. The undecomposable H2O2 interacts with the ammonium molybdate to produce a yellowish complex, and the amount of which can be measured at 405 nm. CAT activity was expressed as (U/mg protein).
Glutathione was determined using a microtitration assay. Total glutathione (T-GSH) and oxidized glutathione (GSSG) levels in fish tissues can be determined using the DTNB cycle reaction. Reduced glutathione (GSH) = T-GSH content − 2 × GSSG content. The total antioxidant capacity (T-AOC) was determined by the colorimetric method. The unit was defined as one unit of total antioxidant capacity per mg of histone per minute of OD increase of the reaction system at 37 °C. The unit of total antioxidant capacity was expressed as (U/mg protein). Malondialdehyde (MDA) was determined by the thiobarbituric acid (TBA) method. The measurement principle is that MDA can be condensed with TBA to form a red product with a maximum absorption peak of 532 nm. The unit of MDA is expressed as (nmol/mg protein).
Total protein was determined using the Bradford method. Tissue samples were weighed and then added to saline and diluted at a ratio of 1:9. The samples were homogenized under ice water bath conditions. After homogenization, the tissues were centrifuged at 2500 rpm for 10 min at 4 °C. The supernatant was diluted to 1% tissue homogenate for measurement of the total protein concentration. All antioxidant indices were determined using kits produced by Nanjing Jiancheng Bioengineering Research Institute Ltd., Nanjing, China.

2.8. Determination of Uric Acid

The principle of uric acid determination is that uric acid in protein-free filtrate can reduce phosphotungstic acid under alkaline conditions to produce tungsten blue, allantoin, and carbon dioxide. The shade of blue in the reaction solution is proportional to the concentration of uric acid. A 0.1 g quantity of skin and gut was diluted 10 times using sterile saline (0.85%) and homogenized in an ice water bath. After homogenization, the supernatant was centrifuged at 2500 rpm for 10 min at 4 °C. The uric acid content was measured using a uric acid (UA) kit (Nanjing Jiancheng Institute of Biological Engineering). The unit of uric acid was expressed as µmol/g tissue.

2.9. Data Analysis

One-way ANOVA was performed to assess the impact of MPs/NPs on the growth performance, body color, biochemical parameters, and antioxidant capacity of juvenile guppies. All data were tested for normal distribution with the Shapiro–Wilk Test. Bartlett’s test was used for homogeneity of variances. Then, a Turkey test was performed to indicate significant differences at p < 0.05. If the data were not normally distributed, a non-parametric Kruskal–Wallis test was used for comparing groups. Statistical analyses were conducted using IBM SPSS Statistics (v29).

3. Results

3.1. Growth Performance

After the exposure experiment, no significant difference in survival rate was found between groups (Figure 1A). Also, no significant differences in SGR between control and NPs-16/NPs-160/MPs-16 were observed. However, the SGR of MPs-160 was significantly lower than the control (Figure 1B).

3.2. MPs and NPs Accumulation

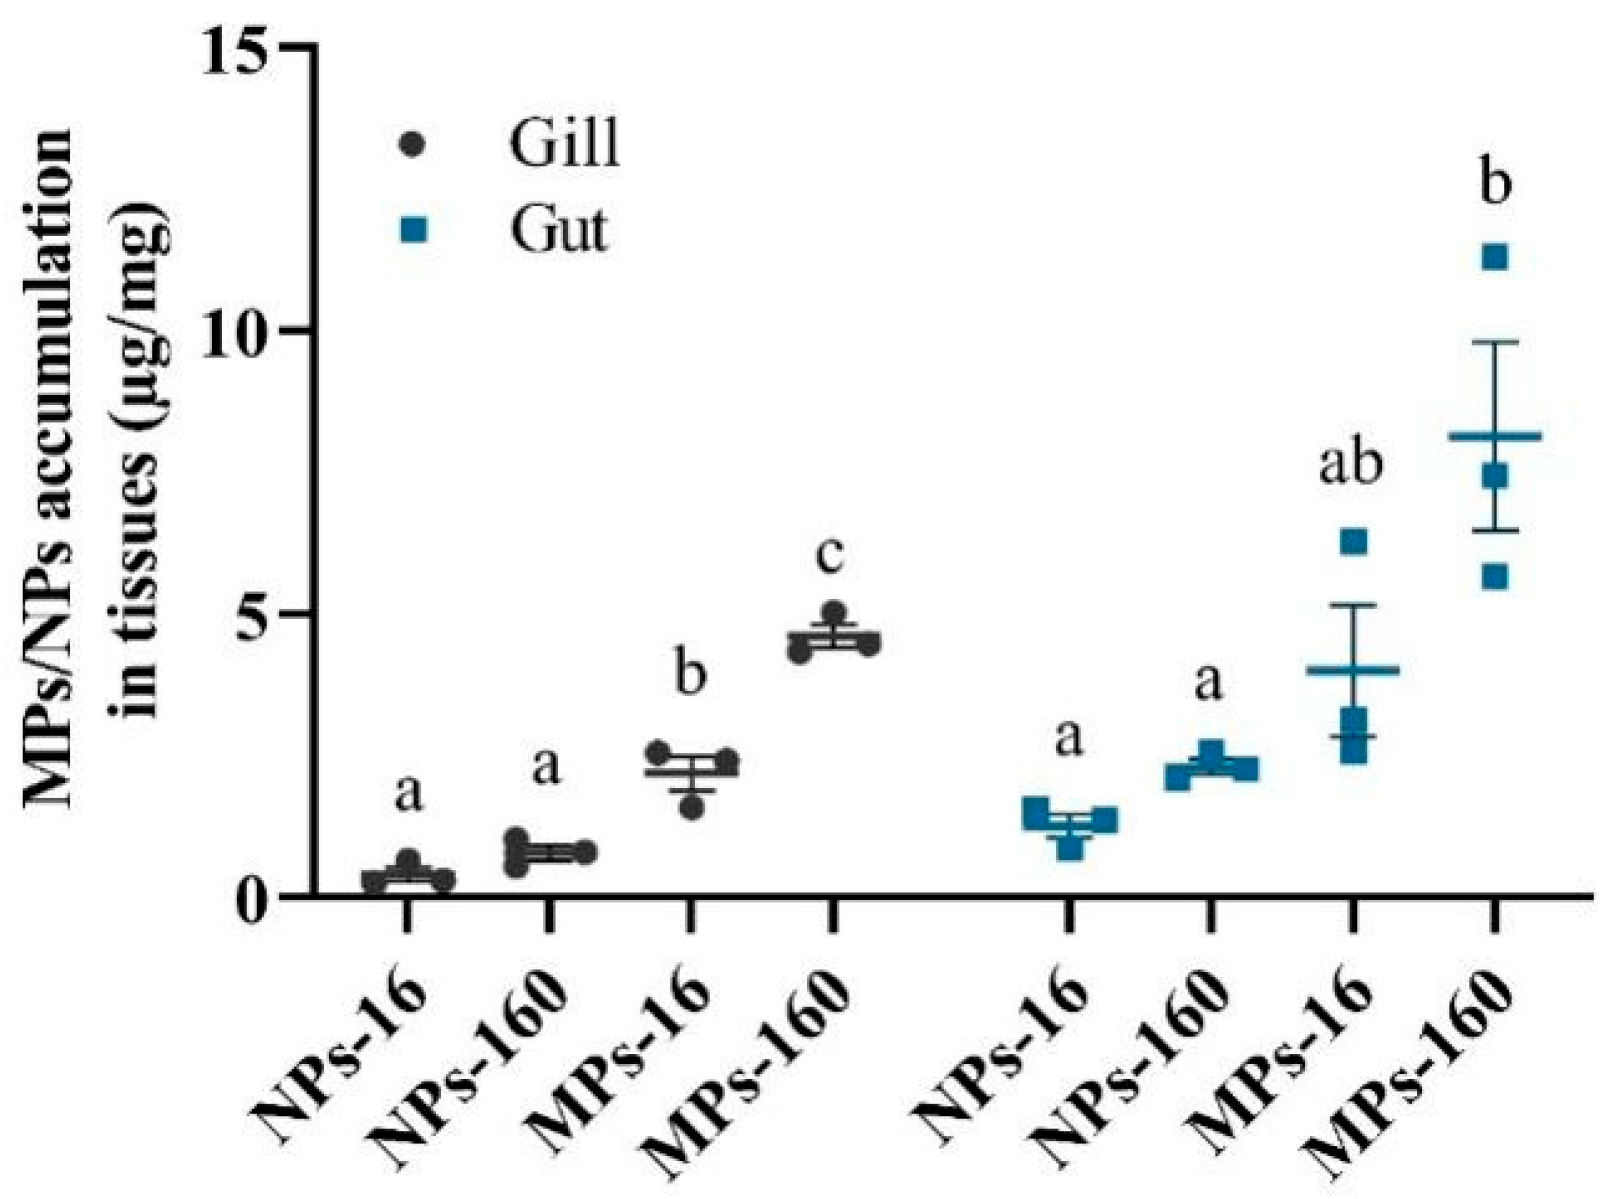
After the exposure experiment, MPs and NPs could be accumulated in the gill and gut of guppies, and accumulated at a higher level in the gut than the gill. No significant differences were observed in NPs accumulation between NPs-16 and NPs-160, both in the fish gill and gut. However, MPs accumulation was higher in MPs-160 than in MPs-16 for the fish gill (Figure 2).

3.3. Change of Body Color

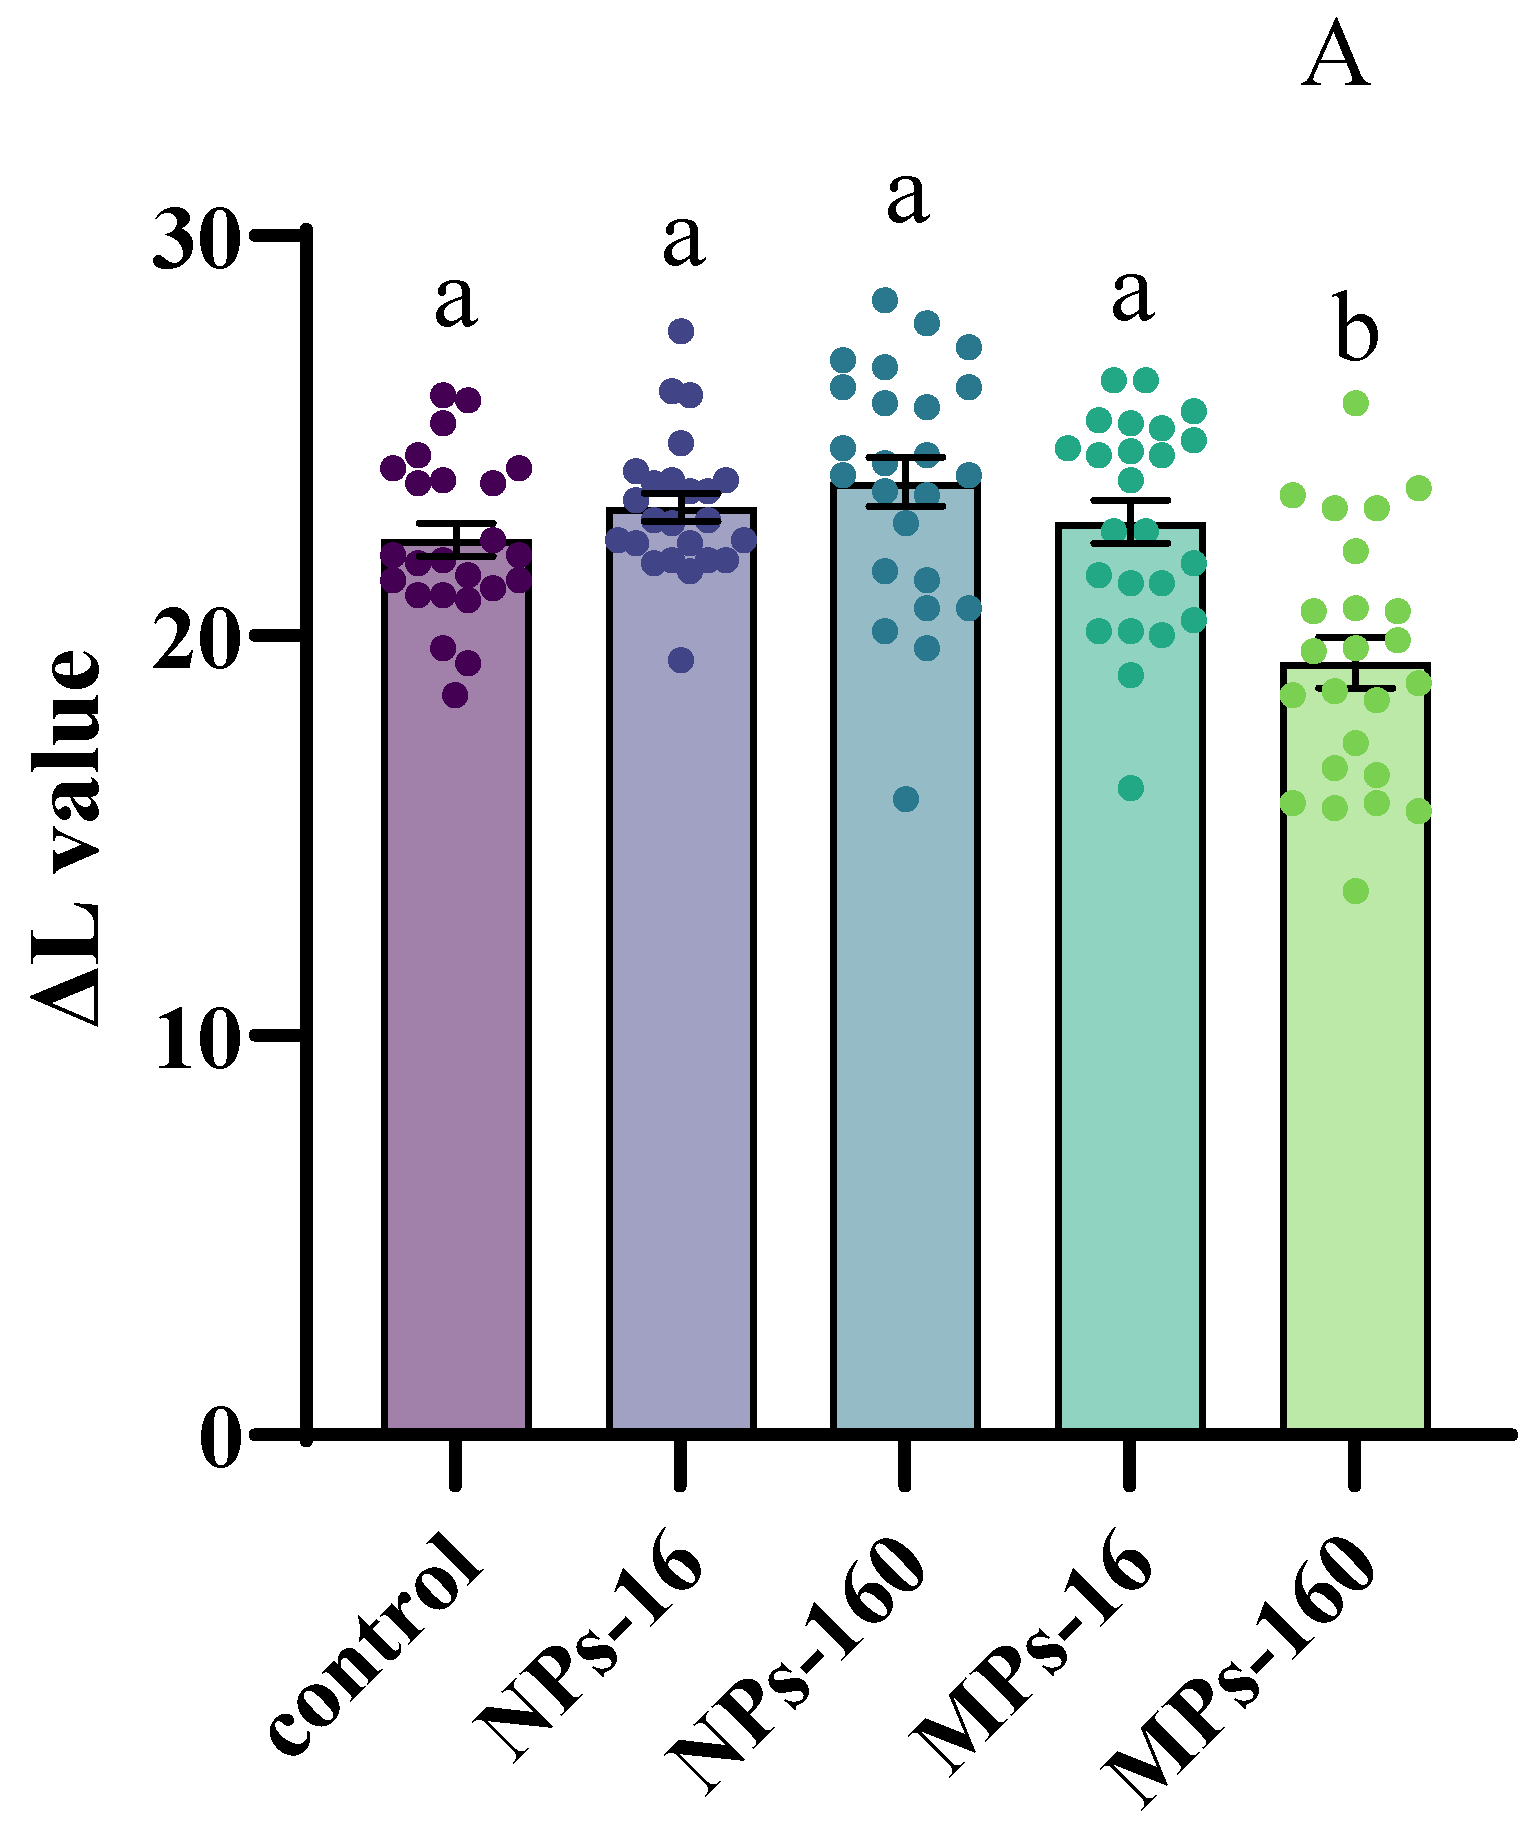
After 14 days of exposure, the lightness value (ΔL) of guppies of MPs-160 was significantly lower than that of the control (Figure 3A). No significant differences were observed in redness (Δa) between control and NPs-16/NPs-160 and between control and MPs-16/MPs-160 (Figure 3B). The yellowness value (Δb) of guppies of MPs-160 was significantly higher than that of the control (Figure 3C). The color difference value (ΔE) of guppies of MPs-160 was significantly lower than that of the control (Figure 3D).

3.4. Antioxidant Enzyme Activity

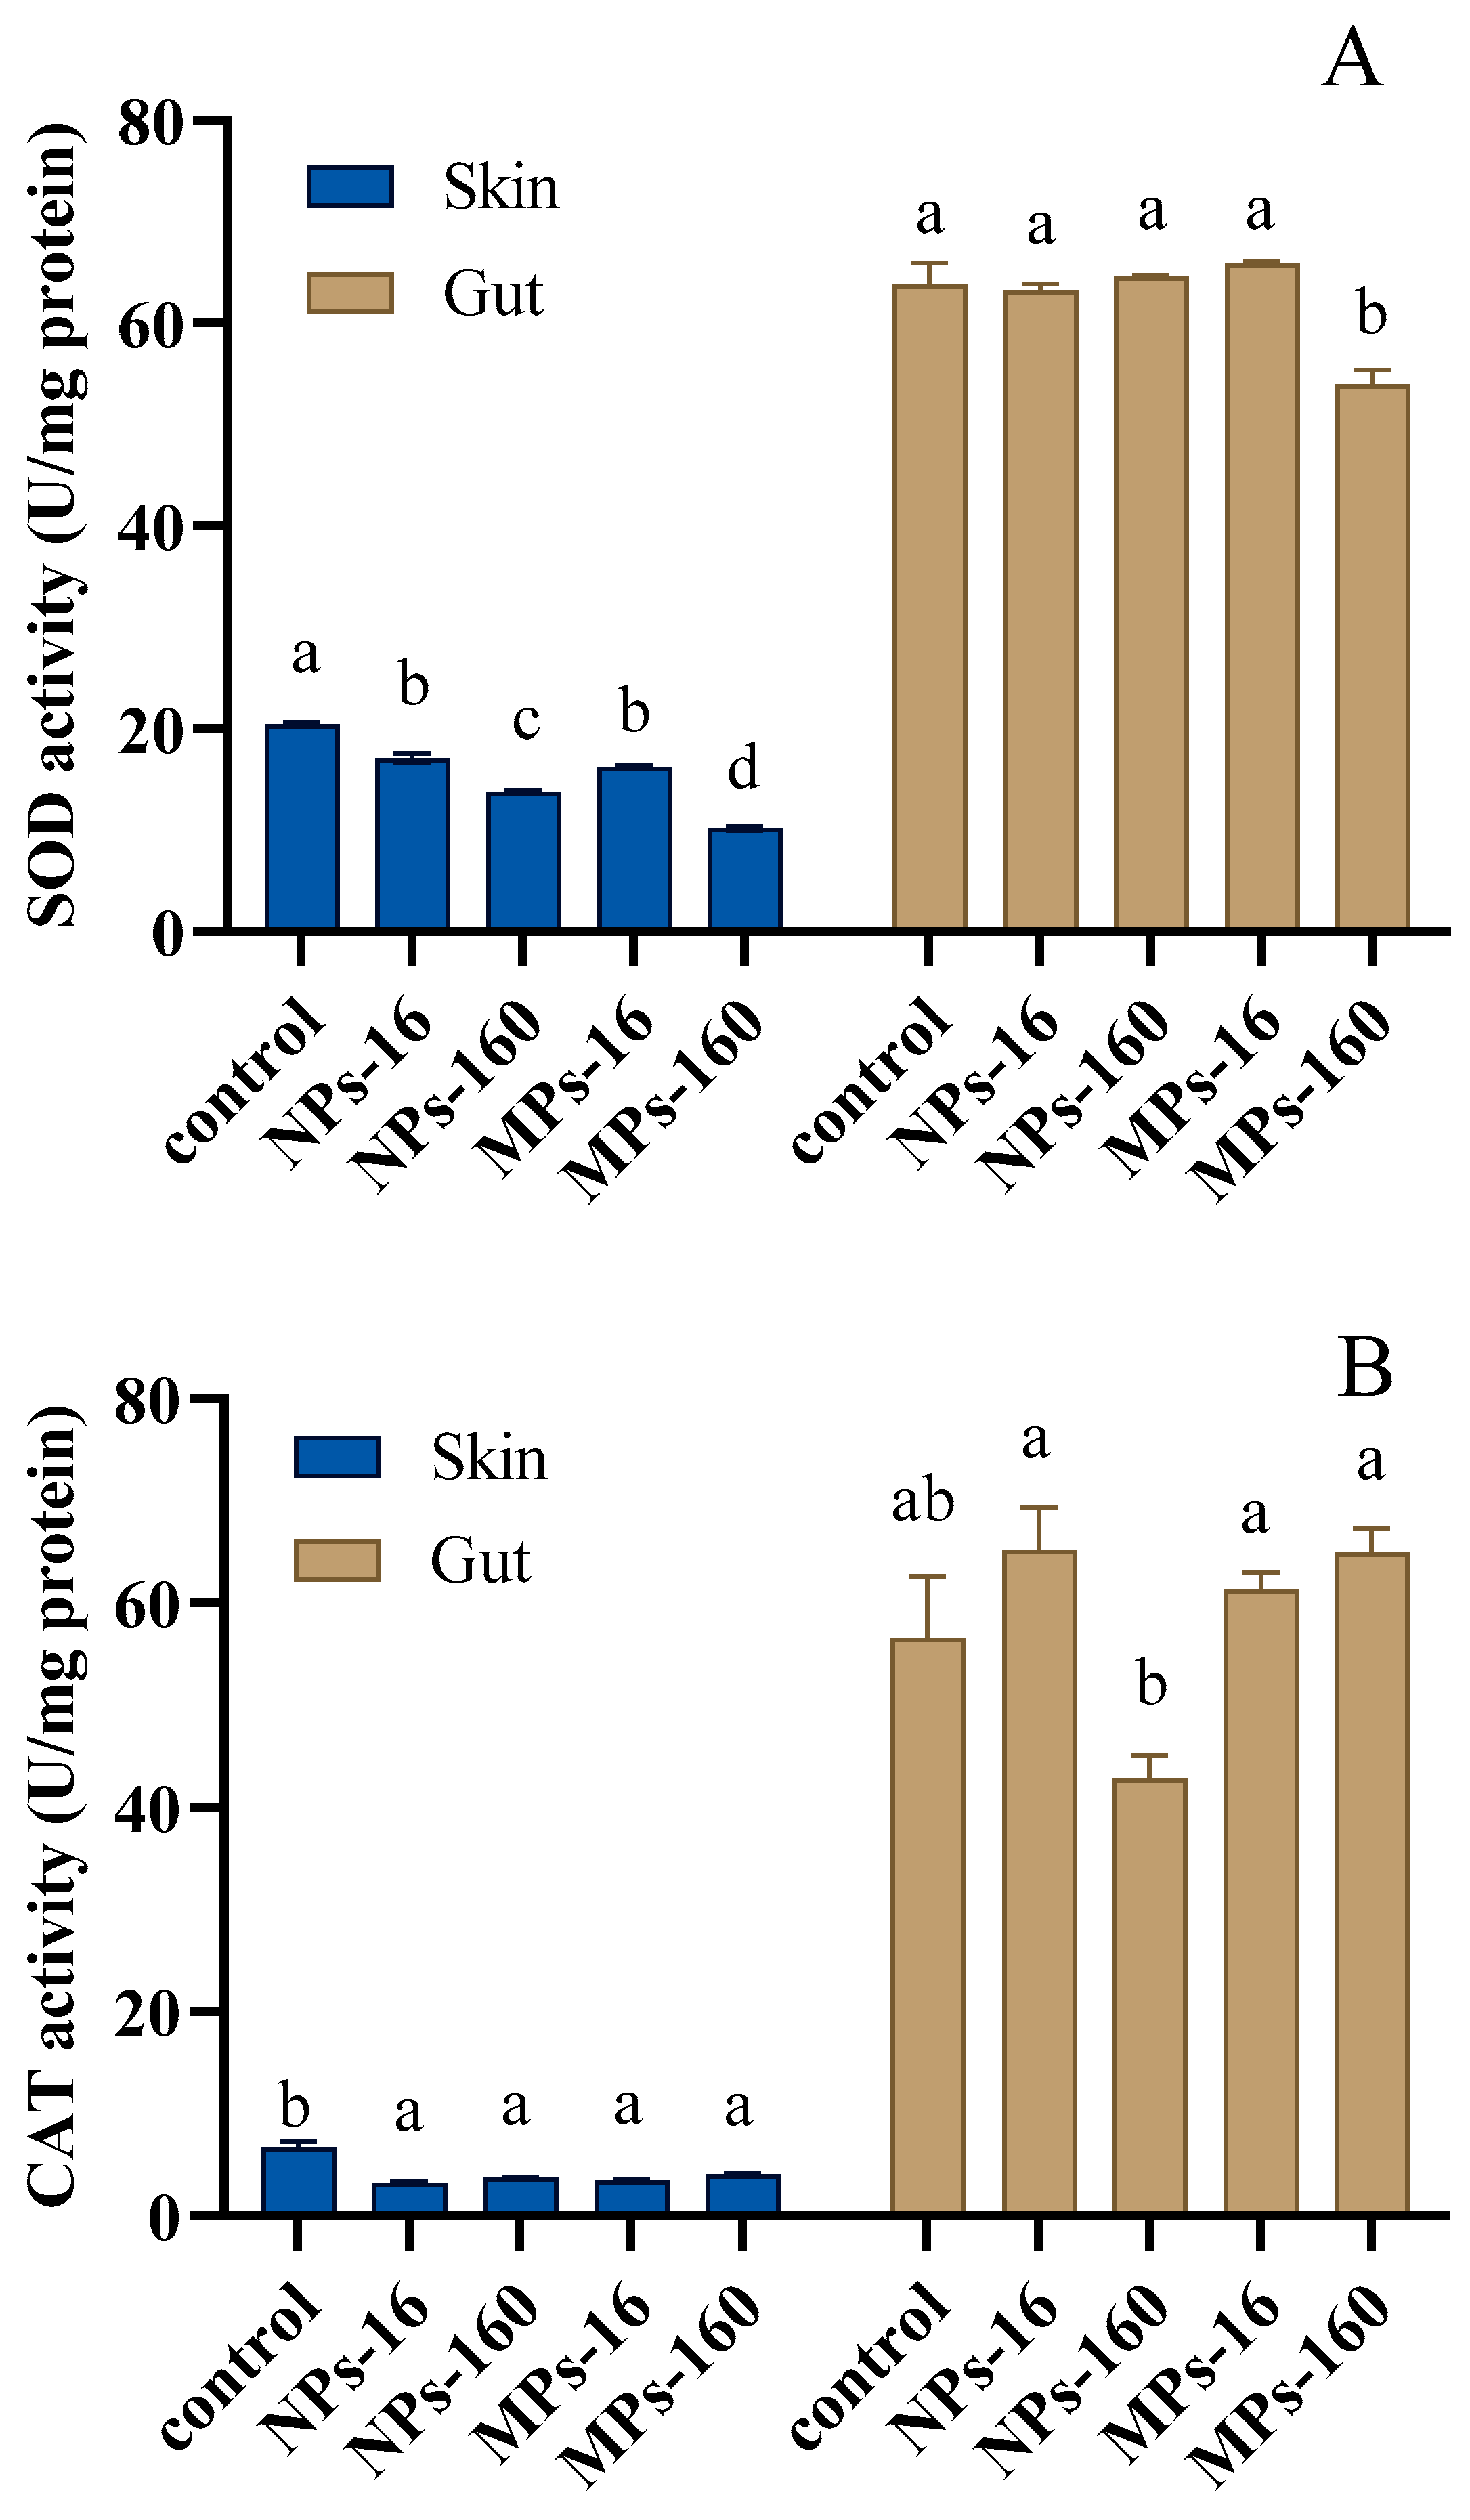
SOD activity in the skin of fish in NPs-16 and MPs-160 was significantly lower than that of the control, but was significantly higher than that of the NPs-160 and MPs-160, respectively. No significant differences were observed in gut SOD activity between control and NPs-16/NPs-160, and between control and MPs-16. However, SOD activity in the gut of fish in MPs-160 was significantly lower than that of the control (Figure 4A).
CAT activity in the skin of fish in control was significantly higher than in NPs-16 and NPs-160, and was significantly higher than in MPs-16 and MPs-160. CAT activity in the gut of fish in NPs-160 was significantly lower than that in NPs-16, MPs-16, and MPs-160 (Figure 4B).
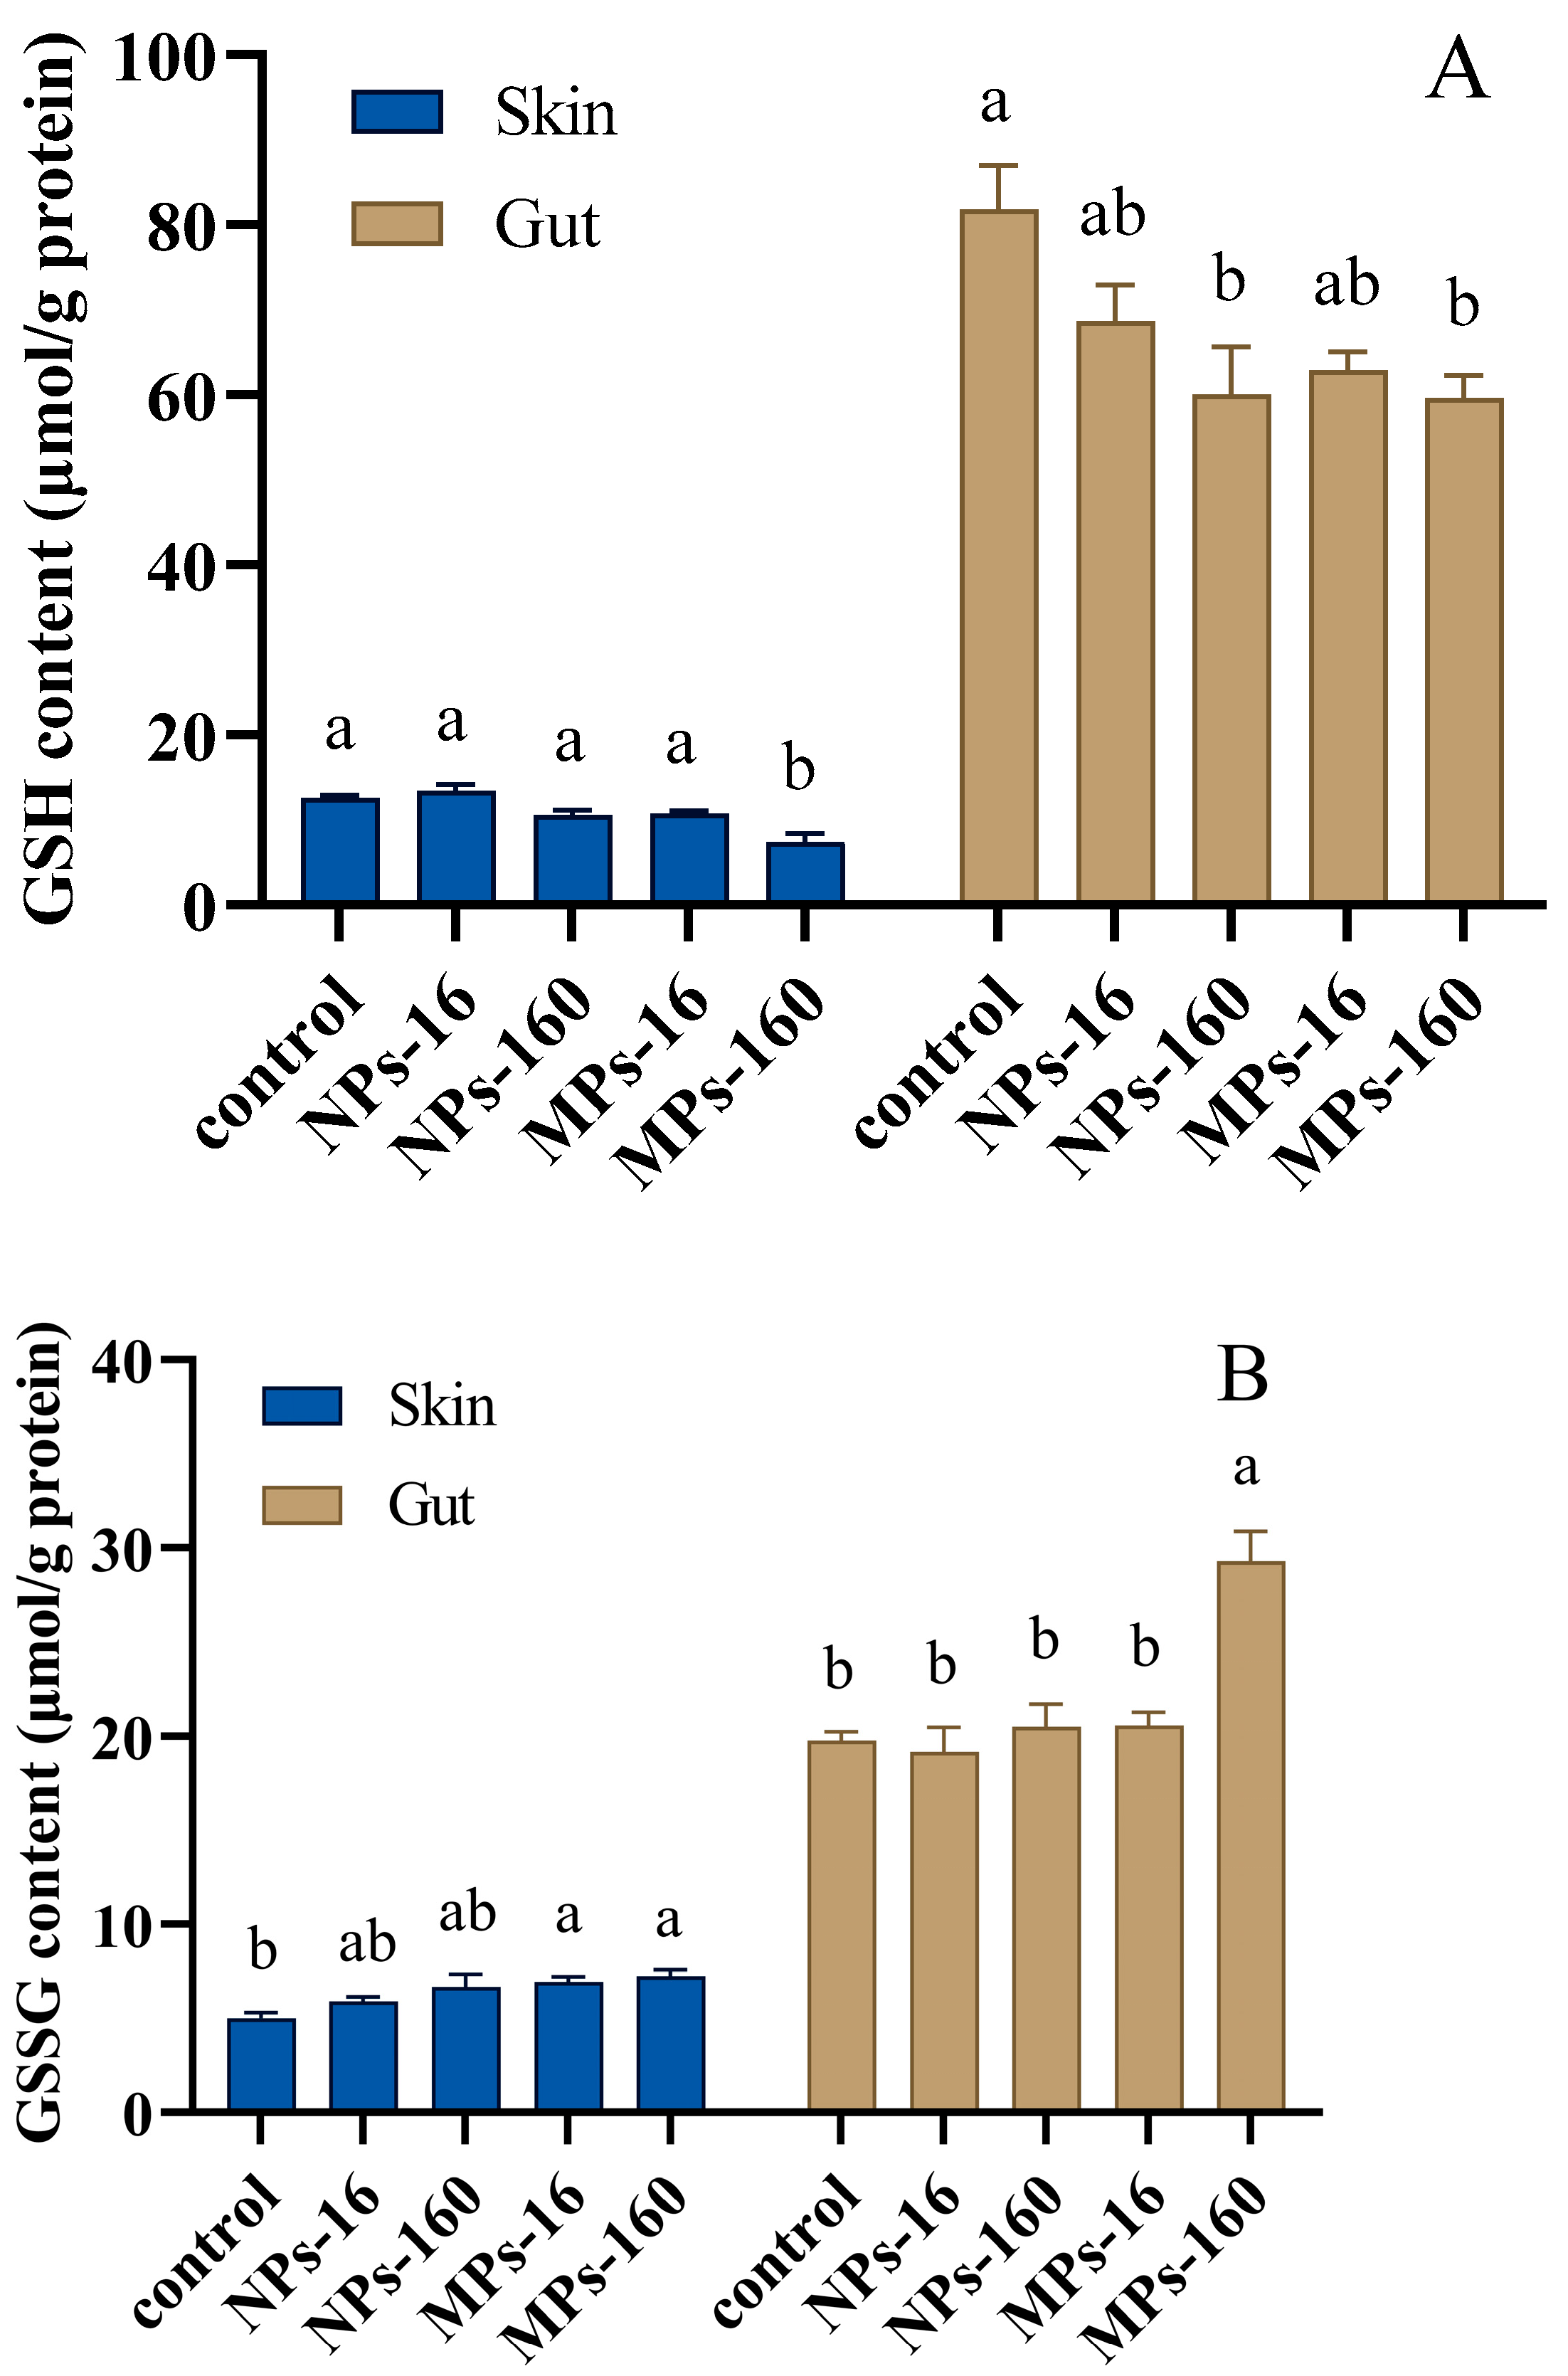
No significant difference in skin GSH content between control and NPs-16/NPs-160 was observed. However, GSH content in the skin of fish in MPs-160 was significantly lower than that of the control. Similarly, no significant difference in gut GSH content between control and NPs-16/NPs-160 was observed. However, GSH contents in the gut of fish in MPs-16 and MPs-160 were significantly lower than those in the control (Figure 5A).
No significant difference in skin GSSG content between control and NPs-16/NPs-160 was observed. However, GSSG contents in the skin of fish in MPs-16 and MPs-160 were significantly higher than in the control. Similarly, no significant difference in gut GSSG content between control and NPs-16/NPs-160 was observed. However, GSSG content in the gut of fish in MPs-160 was significantly higher than in the control (Figure 5B).
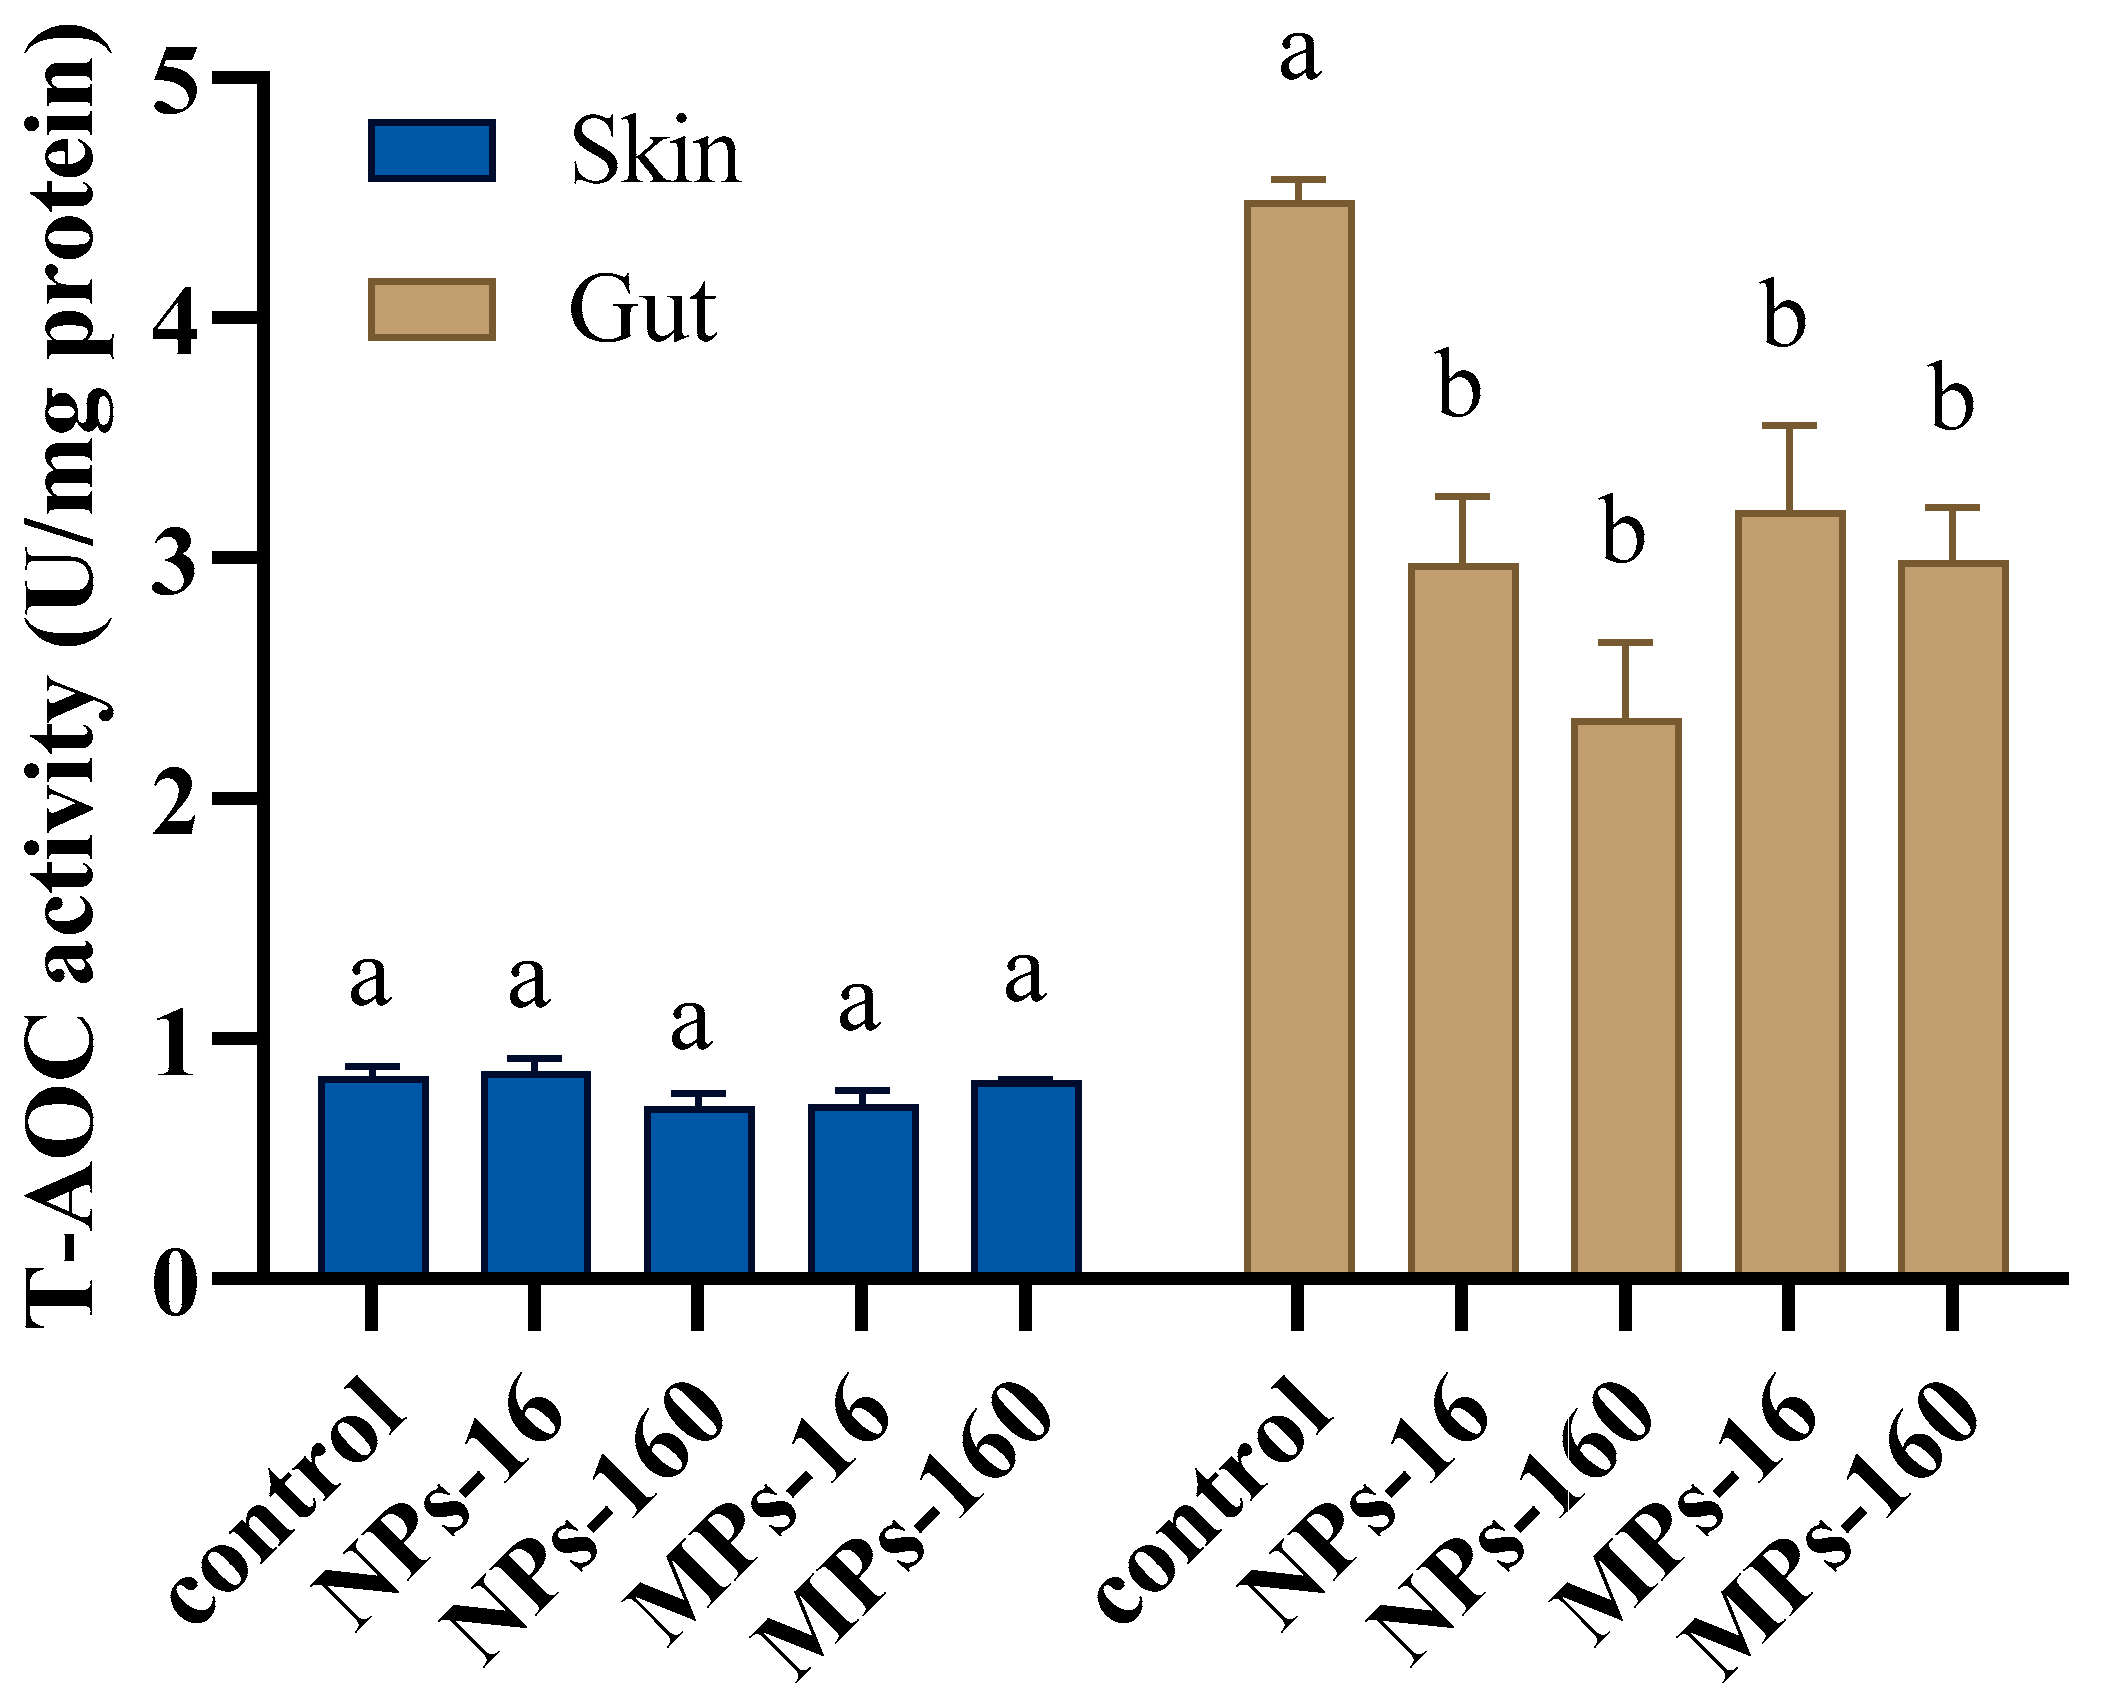
No significant differences in skin T-AOC activity between control and NPs-16/NPs-160 and between control and MPs-16/MPs-160 were observed. However, T-AOC activities in the gut of fish in MPs-16/MPs-160 and in NPs-16/NPs-160 were significantly lower than the control (Figure 6).
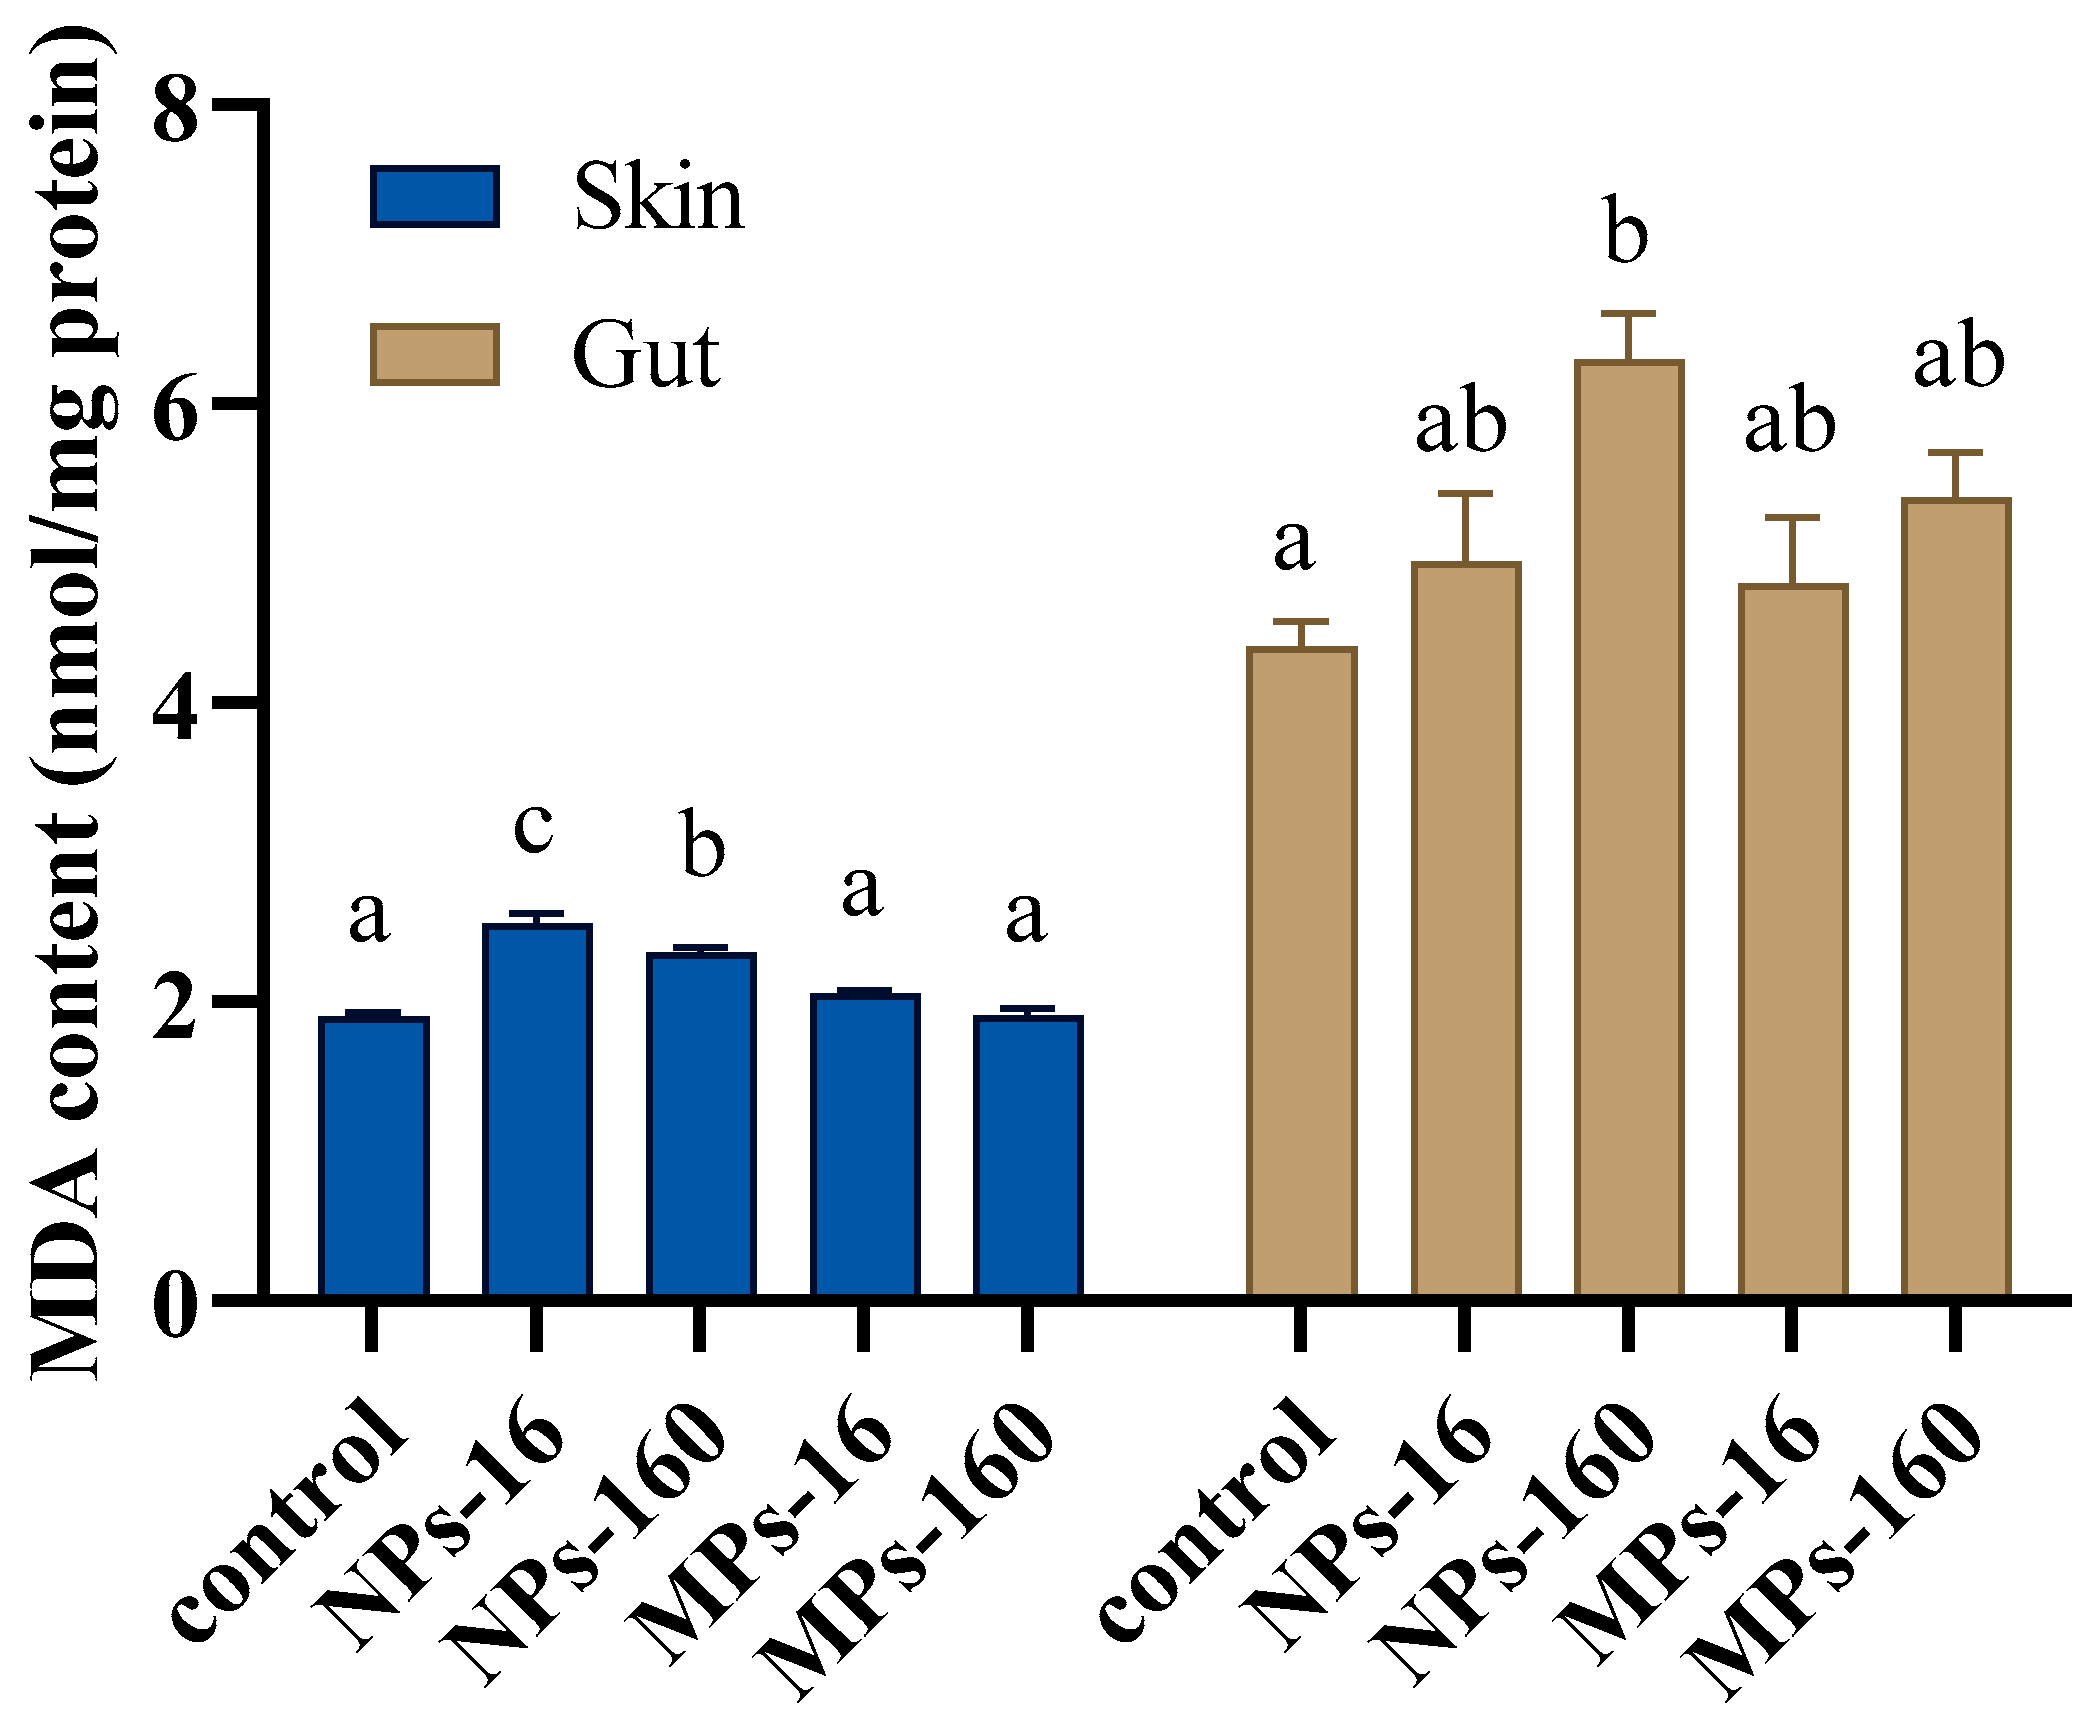
No significant difference in skin MDA content between control and MPs-16/MPs-160 was observed. However, MDA contents in the skin of fish in NPs-16 and NPs-160 were significantly higher than those in the control. Similarly, no significant difference in gut MDA content between control and MPs-16/MPs-160 was observed. However, MDA contents in the gut of fish in NPs-160 were significantly higher than those in the control (Figure 7).
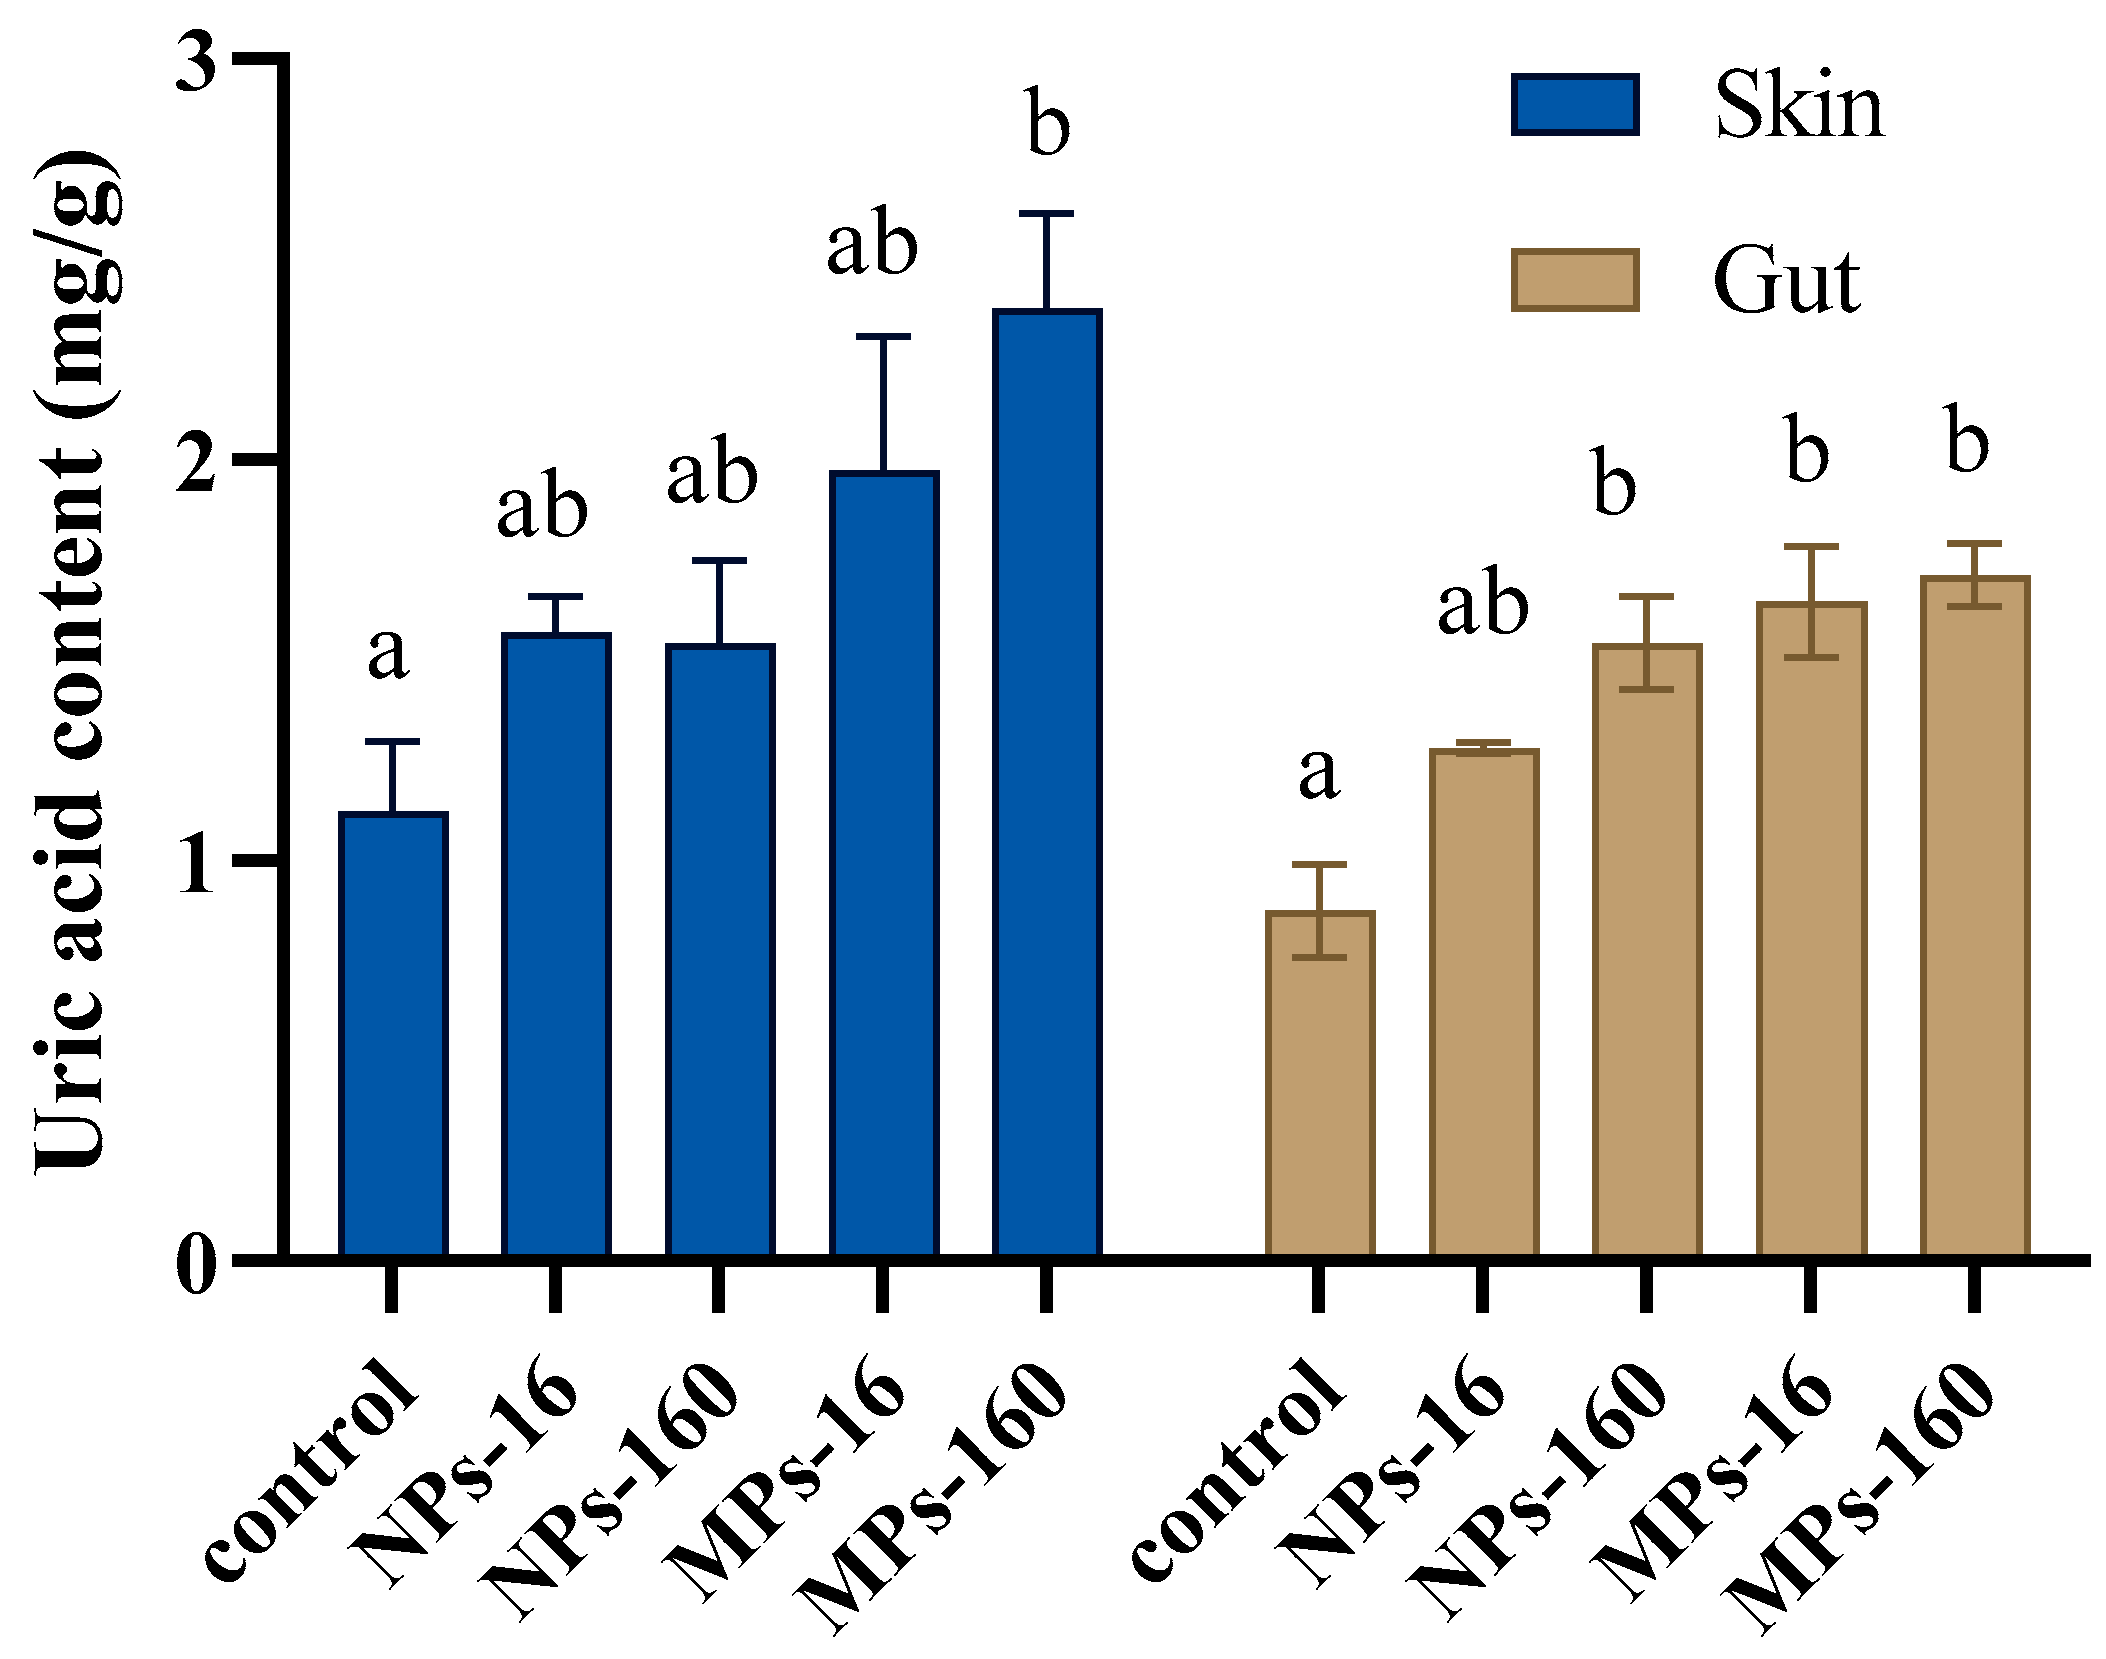
No significant difference in skin uric acid content between control and NPs-16/NPs-160 was observed. However, the uric acid content in the skin of fish in MPs-160 was significantly higher than that of the control. Uric acid content in the gut of fish in NPs-160 was significantly higher than that of the control. Also, uric acid contents in the gut of fish in MPs-16 and MPs-160 were significantly higher than those in the control (Figure 8).

4. Discussion

There was no significant difference in the SR of guppies after 30 days of exposure to MPs/NPs, but a significant decrease was observed in the SGR of the MPs-160 group. Due to their diminutive size, MPs are readily ingested and bioaccumulated within aquatic organisms [37]. The accumulation of large amounts of MPs can lead to blockage of the digestive tract, causing satiety, reduced feeding ability, slowed growth, and suppression of reproductive capacity and respiration [38]. Similarly, koi exposed to polystyrene-MPs (100/1000 µg/L) for 30 days and recovered for 30 days showed reduced growth during the recovery period compared to the control [27]. Discus fish exposed to polystyrene-MPs (0/20/200 μg/L) for 28 days also showed a significant decrease in survival and growth performance [23]. However, guppies exposed to polystyrene-MPs (0/100/1000 μg/L) for 28 days did not show significant changes in SR and SGR [20]. The detection of MPs and NPs in the gut and gills of guppies reveals significant accumulation, with higher concentrations in the gut due to ingestion [39]. Moreover, the accumulation of MPs/NPs in fish tissues increased with the increase in exposure concentration, highlighting a dose-dependent effect, consistent with findings in other aquatic species [40]. Reduced SGR for the MPs-160 group was probably due to the extensive accumulation of MPs in the gut, which might be more likely to cause satiety, and the larger size was more likely to cause intestinal obstruction, reducing their feeding rate, and thus inhibiting their growth performance.
In this study, SOD activity decreased in the fish skin with the increase in MPs/NPs concentrations, and remained relatively constant in the gut, but decreased at high MPs concentration. Similarly, CAT activity tended to decrease under exposure to MPs/NPs, especially in the NPs-160 group. Oxygen radicals are produced by organisms involved in oxygen-related life activities. Under normal conditions, these oxygen radicals are continuously produced and scavenged at the same time [41]. When the organism is subjected to oxidative stress, a large amount of oxygen radicals are produced, which could cause an imbalance of the antioxidant system, leading to peroxidation, cell damage, and reduced immunity and growth performance. Many studies have demonstrated that MPs can cause oxidative stress in fish [21,23,33,42,43]. The SOD–CAT system is frequently considered the first line of defense against ROS formation under stress [44]. SOD converts the superoxide radical into H2O2, which is then metabolized by CAT. SOD and CAT activities usually increase under oxidative stress conditions to counteract reactive oxygen species [45]. In the early stage of oxidative stress, the activity of SOD might increase to cope with the increased levels of superoxide anion (O2) in the body. However, if oxidative stress persists and is intense, the activity of SOD may gradually decrease. This could be due to oxidative damage to SOD itself, or inhibition of its gene expression and protein synthesis [46]. The activity of CAT may increase temporarily to accelerate the decomposition of H2O2 produced by SOD, preventing it from causing further oxidative damage. However, under long-term oxidative stress, if the production rate of H2O2 exceeds the decomposition capacity of CAT, or if CAT itself is also damaged by oxidation, its activity could subsequently decrease [47].
After the exposure, a decrease in GSH levels accompanied by an increase in GSSG levels was observed in the gut and skin of guppies, especially in the MPs-160 group. Non-enzymatic small organic molecules such as GSH also play important roles in the maintenance of cellular redox status. GSH becomes GSSG upon binding to free radicals, so the ratio of GSH/GSSG in the body could reflect the level of oxidative stress [48]. The results of this study indicate that the GSH antioxidant system responded more positively to MPs than NPs, and GSH might be extensively consumed to counteract the oxidative stress caused by MPs. Similarly, decreased GSH content was also observed in discus fish exposed to MPs [20].
In this study, exposure to MPs and NPs did not affect the T-AOC within the skin of guppies, but resulted in reduced T-AOC within the gut of guppies. Total antioxidant capacity (T-AOC) refers to the total antioxidant level of an organism, which is made up of antioxidant enzymes and substances. T-AOC is an important indicator of the antioxidant system for detoxifying excessive free radicals [49]. The present result might be due to the decrease in GSH, especially in the fish gut. The reduction of SGH could lower T-AOC because GSH is one of the main contributors to T-AOC. As a result, MDA content was increased, especially in NPs-exposed groups, indicating that NPs might cause more serious oxidative damage to juvenile guppy than MPs. Similar results are reported by Ziajahromi et al. [50], probably due to the smaller volume and larger specific surface area of NPs than MPs [51]. The contents of MDA, an important index of lipid peroxidation [52], increased in the gut and skin, suggesting that lipid peroxidation was increased by NPs exposure.
After exposure to MPs/NPs for 30 days, guppies in the MPs-160 group showed significantly reduced lightness, but increased yellowness (i.e., decreased blueness). The gloss and blue are typical structural colors produced by guanine stacks within the iridophore in fish [5,15]. The results suggest that exposure to MPs but not NPs could affect the structural colors of the caudal fin of guppies. The oxidative stress caused by MPs could reduce gloss and blue, supporting the hypothesis that iridophore appearance could be related to condition. Uric acid is an efficient scavenger of singlet oxygen, hydroxyl radicals, and peroxyl radicals [53], and has been shown previously to act as an antioxidant in fishes [15,54]. In this study, the reduction in gloss and blue was accompanied by an increase in uric acid in the skin, especially for the MPs-160 group, indicating that guppies may be metabolizing the guanine in their iridophores to combat oxidative stress. Under oxidative stress conditions, the increase in uric acid levels may be a compensatory mechanism adopted by the body to make up for the reduction of GSH. However, the mechanism of MPs/NPs affecting the body color of guppies through oxidative stress needs to be studied more intensely. For example, the changes in guanine and its various metabolites in the skin after fish were subjected to oxidative stress. Fish body color should be investigated as a non-invasive comprehensive indicator that can reflect its health status; it is possible to evaluate fish health by quantifying its body color in the future, which is beneficial to animal welfare.

5. Conclusions

This study demonstrates that MPs exposure at 160 μg/L significantly impairs guppy growth and induces oxidative stress, while simultaneously degrading structural coloration through guanine metabolism pathways. Three key findings emerge: (1) MPs reduce growth performance through gut accumulation while showing stronger oxidative effects than NPs; (2) the reduction in blue coloration correlates with uric acid levels, indicating guanine’s antioxidant role; (3) particle size critically determines biological impacts, with larger MPs causing more severe effects than smaller NPs at equivalent concentrations. These results reveal how MPs may disrupt visual communication by altering structural coloration, potentially affecting mating success and predator–prey dynamics. The work establishes fish coloration as a novel, non-invasive biomarker for MPs pollution monitoring. The distinct size-dependent effects further highlight the need for differentiated risk assessment frameworks for MPs versus NPs in aquatic ecosystems. These findings provide critical baseline data for understanding plastic pollution’s cascading effects on aquatic biodiversity and ecological processes.

Author Contributions

H.-Y.R.: formal analysis, data curation, writing—original draft. H.-C.M.: investigation. R.-P.H.: data curation. C.-C.G.: formal analysis. B.W.: conceived the study, methodology, funding acquisition, writing—review and editing. J.-Z.G.: supervision. Z.-Z.C.: supervision. All authors have read and agreed to the published version of the manuscript.

Funding

This research was funded by the National Natural Science Foundation of China (31902376 and 32373134) and Shanghai Oriental Talent Youth Project of China (2023).

Institutional Review Board Statement

The study was conducted and approved by Institutional Animal Care and Use Committee at Shanghai Ocean University, China SHOU-DW-2019-013 6 March 2019.

Informed Consent Statement

Not applicable.

Data Availability Statement

The data that support the findings of this study are available in the manuscript.

Acknowledgments

The study presented in the manuscript was funded by the National Natural Science Foundation of China (31902376 and 32373134) and Shanghai Oriental Talent Youth Project of China (2023).

Conflicts of Interest

The authors declare no competing interests.

References

  1. Cuthill, I.C.; Allen, W.L.; Arbuckle, K.; Caspers, B.; Chaplin, G.; Hauber, M.E.; Hill, G.E.; Jablonski, N.G.; Jiggins, C.D.; Kelber, A.; et al. The biology of color. Science 2017, 357, eaan0221. [Google Scholar] [CrossRef] [PubMed]
  2. Schartl, M.; Larue, L.; Goda, M.; Bosenberg, M.W.; Hashimoto, H.; Kelsh, R.N. What is a vertebrate pigment cell? Pigment Cell Melanoma Res. 2016, 29, 8–14. [Google Scholar] [CrossRef]
  3. Braasch, I.; Schartl, M.; Volff, J.N. Evolution of pigment synthesis pathways by gene and genome duplication in fish. BMC Evol. Biol. 2007, 7, 74. [Google Scholar] [CrossRef]
  4. Nilsson Skold, H.; Aspengren, S.; Wallin, M. Rapid color change in fish and amphibians—function, regulation, and emerging applications. Pigment Cell Melanoma Res. 2013, 26, 29–38. [Google Scholar] [CrossRef]
  5. Yang, B.T.; Wen, B.; Ji, Y.; Wang, Q.; Zhang, H.R.; Zhang, Y.; Gao, J.Z.; Chen, Z.Z. Comparative metabolomics analysis of pigmentary and structural coloration in discus fish (Symphysodon haraldi). J. Proteom. 2021, 233, 104085. [Google Scholar] [CrossRef] [PubMed]
  6. Ziegler, I. The pteridine pathway in zebrafish: Regulation and specification during the determination of neural crest cell-fate. Pigment Cell Res. 2003, 16, 172–182. [Google Scholar] [CrossRef]
  7. Maan, M.E.; Sefc, K.M. Colour variation in cichlid fish: Developmental mechanisms, selective pressures and evolutionary consequences. Semin. Cell. Dev. Biol. 2013, 24, 516–528. [Google Scholar] [CrossRef]
  8. Kaur, R.; Dua, A. Colour changes in Labeo rohita (Ham.) due to pigment translocation in melanophores, on exposure to municipal wastewater of Tung Dhab drain, Amritsar, India. Environ. Toxicol. Pharmacol. 2015, 39, 747–757. [Google Scholar] [CrossRef]
  9. Lifshitz, N.; St Clair, C.C. Coloured ornamental traits could be effective and non-invasive indicators of pollution exposure for wildlife. Conserv. Physiol. 2016, 4, cow028. [Google Scholar] [CrossRef]
  10. Parolini, M.; Iacobuzio, R.; Bassano, B.; Pennati, R.; Saino, N. Melanin-Based Skin Coloration Predicts Antioxidant Capacity in the Brown Trout (Salmo trutta). Physiol. Biochem. Zool. 2018, 91, 1026–1035. [Google Scholar] [CrossRef] [PubMed]
  11. Tian, H.; Li, Y.; Wang, W.; Wu, P.; Ru, S. Exposure to monocrotophos pesticide during sexual development causes the feminization/demasculinization of the reproductive traits and a reduction in the reproductive success of male guppies (Poecilia reticulata). Toxicol. Appl. Pharmacol. 2012, 263, 163–170. [Google Scholar] [CrossRef]
  12. Ward, J.L.; Blum, M.J. Exposure to an environmental estrogen breaks down sexual isolation between native and invasive species. Evol. Appl. 2012, 5, 901–912. [Google Scholar] [CrossRef] [PubMed]
  13. Zhang, J.L.; Zhang, C.N.; Li, E.C.; Jin, M.M.; Huang, M.X.; Cui, W.; Lin, Y.Y.; Shi, Y.J. Triphenyltin exposure affects mating behaviors and attractiveness to females during mating in male guppies (Poecilia reticulata). Ecotoxicol. Environ. Saf. 2019, 169, 76–84. [Google Scholar] [CrossRef]
  14. Lennquist, A.; Lindblad, L.G.E.M.; Hedberg, D.; Kristiansson, E.; Forlin, L. Colour and melanophore function in rainbow trout after long term exposure to the new antifoulant medetomidine. Chemosphere 2010, 80, 1050–1055. [Google Scholar] [CrossRef]
  15. Cahn, M.D.; Brown, A.C.; Clotfelter, E.D. Guanine-based structural coloration as an indicator of oxidative stress in a cichlid fish. J. Exp. Zool. Part A Ecol. Integr. Physiol. 2015, 323, 359–367. [Google Scholar] [CrossRef] [PubMed]
  16. Goldstein, M.C.; Rosenberg, M.; Cheng, L.N. Increased oceanic microplastic debris enhances oviposition in an endemic pelagic insect. Biol. Lett. 2012, 8, 817–820. [Google Scholar] [CrossRef]
  17. Zhao, S.Y.; Zhu, L.X.; Wang, T.; Li, D.J. Suspended microplastics in the surface water of the Yangtze Estuary System, China: First observations on occurrence, distribution. Mar. Pollut. Bull. 2014, 86, 562–568. [Google Scholar] [CrossRef]
  18. Luo, W.Y.; Su, L.; Craig, N.J.; Du, F.N.; Wu, C.X.; Shi, H.H. Comparison of microplastic pollution in different water bodies from urban creeks to coastal waters. Environ. Pollut. 2019, 246, 174–182. [Google Scholar] [CrossRef]
  19. Horton, A.A.; Walton, A.; Spurgeon, D.J.; Lahive, E.; Svendsen, C. Microplastics in freshwater and terrestrial environments: Evaluating the current understanding to identify the knowledge gaps and future research priorities. Sci. Total Environ. 2017, 586, 127–141. [Google Scholar] [CrossRef]
  20. Huang, J.N.; Wen, B.; Meng, L.J.; Li, X.X.; Wang, M.H.; Gao, J.Z.; Chen, Z.Z. Integrated response of growth, antioxidant defense and isotopic composition to microplastics in juvenile guppy (Poecilia reticulata). J. Hazard. Mater. 2020, 399, 10. [Google Scholar] [CrossRef] [PubMed]
  21. Lei, L.; Wu, S.; Lu, S.; Liu, M.; Song, Y.; Fu, Z.; Shi, H.; Raley-Susman, K.M.; He, D. Microplastic particles cause intestinal damage and other adverse effects in zebrafish Danio rerio and nematode Caenorhabditis elegans. Sci. Total Environ. 2018, 619–620, 1–8. [Google Scholar] [CrossRef]
  22. Besseling, E.; Wang, B.; Lurling, M.; Koelmans, A.A. Nanoplastic affects growth of S. obliquus and reproduction of D. magna. Environ. Sci. Technol. 2014, 48, 12336–12343. [Google Scholar] [CrossRef]
  23. Huang, J.N.; Zhang, Y.; Xu, L.; He, K.X.; Wen, B.; Yang, P.W.; Ding, J.Y.; Li, J.Z.; Ma, H.C.; Gao, J.Z.; et al. Microplastics: A tissue-specific threat to microbial community and biomarkers of discus fish (Symphysodon aequifasciatus). J. Hazard. Mater. 2022, 424, 14. [Google Scholar] [CrossRef]
  24. Huang, J.N.; Wen, B.; Li, X.X.; Xu, L.; Gao, J.Z.; Chen, Z.Z. Astaxanthin mitigates oxidative stress caused by microplastics at the expense of reduced skin pigmentation in discus fish. Sci. Total Environ. 2023, 874, 162494. [Google Scholar] [CrossRef]
  25. Brown, G.B.; Roll, P.M. The utilization of adenine for nucleic acid synthesis and as a precursor of guanine. J. Biol. Chem. 1948, 172, 469–484. [Google Scholar] [CrossRef] [PubMed]
  26. San-Jose, L.M.; Granado-Lorencio, F.; Sinervo, B.; Fitze, P.S. Iridophores and Not Carotenoids Account for Chromatic Variation of Carotenoid-Based Coloration in Common Lizards (Lacerta vivipara). Am. Nat. 2013, 181, 396–409. [Google Scholar] [CrossRef] [PubMed]
  27. Ouyang, M.Y.; Feng, X.S.; Li, X.X.; Wen, B.; Liu, J.H.; Huang, J.N.; Gao, J.Z.; Chen, Z.Z. Microplastics intake and excretion: Resilience of the intestinal microbiota but residual growth inhibition in common carp. Chemosphere 2021, 276, 130144. [Google Scholar] [CrossRef] [PubMed]
  28. Ma, J.; Niu, X.; Zhang, D.; Lu, L.; Ye, X.; Deng, W.; Li, Y.; Lin, Z. High levels of microplastic pollution in aquaculture water of fish ponds in the Pearl River Estuary of Guangzhou, China. Sci. Total Environ. 2020, 744, 140679. [Google Scholar] [CrossRef]
  29. Huang, J.-N.; Xu, L.; Wen, B.; Gao, J.Z.; Chen, Z.Z. Characteristics and risks of microplastic contamination in aquaculture ponds near the Yangtze Estuary, China. Environ. Pollut. 2024, 343, 123288. [Google Scholar] [CrossRef]
  30. Materic, D.; Kasper-Giebl, A.; Kau, D.; Anten, M.; Greilinger, M.; Ludewig, E.; van Sebille, E.; Rockmann, T.; Holzinger, R. Micro- and Nanoplastics in Alpine Snow: A New Method for Chemical Identification and (Semi)Quantification in the Nanogram Range. Environ. Sci. Technol. 2020, 54, 2353–2359. [Google Scholar] [CrossRef]
  31. Liu, Z.; Huang, Y.; Jiao, Y.; Chen, Q.; Wu, D.; Yu, P.; Li, Y.; Cai, M.; Zhao, Y. Polystyrene nanoplastic induces ROS production and affects the MAPK-HIF-1/NFkB-mediated antioxidant system in Daphnia pulex. Aquat. Toxicol. 2020, 220, 105420. [Google Scholar] [CrossRef]
  32. Zuo, J.; Huo, T.; Du, X.; Yang, Q.; Wu, Q.; Shen, J.; Liu, C.; Hung, T.-C.; Yan, W.; Li, G. The joint effect of parental exposure to microcystin-LR and polystyrene nanoplastics on the growth of zebrafish offspring. J. Hazard. Mater. 2021, 410, 124677. [Google Scholar] [CrossRef]
  33. Huang, J.N.; Wen, B.; Xu, L.; Ma, H.C.; Li, X.X.; Gao, J.Z.; Chen, Z.Z. Micro/nano-plastics cause neurobehavioral toxicity in discus fish (Symphysodon aequifasciatus): Insight from brain-gut-microbiota axis. J. Hazard. Mater. 2022, 421, 126830. [Google Scholar] [CrossRef]
  34. Gómez-Polo, C.; Muñoz, M.P.; Lorenzo Luengo, M.C.; Vicente, P.; Galindo, P.; Martín Casado, A.M. Comparison of the CIELab and CIEDE2000 color difference formulas. J. Prosthet. Dent. 2016, 115, 65–70. [Google Scholar] [CrossRef]
  35. Karami, A.; Golieskardi, A.; Choo, C.K.; Romano, N.; Ho, Y.B.; Salamatinia, B. A high-performance protocol for extraction of microplastics in fish. Sci. Total Environ. 2017, 578, 485–494. [Google Scholar] [CrossRef]
  36. Sinha Ray, S.; Zumr, D.; Wilken, F.; Dostál, T.; Fiener, P. A cost-effective protocol for detecting fluorescent microplastics in arable soils to study redistribution processes. Polym. Test. 2025, 147, 108824. [Google Scholar] [CrossRef]
  37. Wright, S.L.; Thompson, R.C.; Galloway, T.S. The physical impacts of microplastics on marine organisms: A review. Environ. Pollut. 2013, 178, 483–492. [Google Scholar] [CrossRef] [PubMed]
  38. van Franeker, J.A.; Blaize, C.; Danielsen, J.; Fairclough, K.; Gollan, J.; Guse, N.; Hansen, P.L.; Heubeck, M.; Jensen, J.K.; Le Guillou, G.; et al. Monitoring plastic ingestion by the northern fulmar Fulmarus glacialis in the North Sea. Environ. Pollut. 2011, 159, 2609–2615. [Google Scholar] [CrossRef]
  39. Ghosh, T. Microplastics bioaccumulation in fish: Its potential toxic effects on hematology, immune response, neurotoxicity, oxidative stress, growth, and reproductive dysfunction. Toxicol. Rep. 2025, 14, 101854. [Google Scholar] [CrossRef]
  40. Nuamah, F.; Tulashie, S.K.; Debrah, J.S.; Pèlèbè, R.O.E. Microplastics in the Gulf of Guinea: An analysis of concentrations and distribution in sediments, gills, and guts of fish collected off the coast of Ghana. Environ. Res. 2023, 234, 9. [Google Scholar] [CrossRef] [PubMed]
  41. Sohal, R.S.; Weindruch, R. Oxidative stress, caloric restriction, and aging. Science 1996, 273, 59–63. [Google Scholar] [CrossRef] [PubMed]
  42. Qiao, R.; Deng, Y.; Zhang, S.; Wolosker, M.B.; Zhu, Q.; Ren, H.; Zhang, Y. Accumulation of different shapes of microplastics initiates intestinal injury and gut microbiota dysbiosis in the gut of zebrafish. Chemosphere 2019, 236, 124334. [Google Scholar] [CrossRef]
  43. Wang, X.; Huang, W.; Wei, S.; Shang, Y.; Gu, H.; Wu, F.; Lan, Z.; Hu, M.; Shi, H.; Wang, Y. Microplastics impair digestive performance but show little effects on antioxidant activity in mussels under low pH conditions. Environ. Pollut. 2020, 258, 113691. [Google Scholar] [CrossRef]
  44. Pandey, S.; Parvez, S.; Sayeed, I.; Haque, R.; Bin-Hafeez, B.; Raisuddin, S. Biomarkers of oxidative stress: A comparative study of river Yamuna fish Wallago attu (Bl. & Schn.). Sci. Total Environ. 2003, 309, 105–115. [Google Scholar] [CrossRef]
  45. Ighodaro, O.M.; Akinloye, O.A. First line defence antioxidants-superoxide dismutase (SOD), catalase (CAT) and glutathione peroxidase (GPX): Their fundamental role in the entire antioxidant defence grid. Alex. J. Med. 2018, 54, 287–293. [Google Scholar] [CrossRef]
  46. Kono, Y. Generation of superoxide radical during autoxidation of hydroxylamine and an assay for superoxide dismutase. Arch. Biochem. Biophys. 1978, 186, 189–195. [Google Scholar] [CrossRef]
  47. Kono, Y.; Fridovich, I. Superoxide radical inhibits catalase. J. Biol. Chem. 1982, 257, 5751–5754. [Google Scholar] [CrossRef]
  48. Jones, D.P. [11] Redox potential of GSH/GSSG couple: Assay and biological significance. In Methods in Enzymology; Sies, H., Packer, L., Eds.; Academic Press: Cambridge, MA, USA, 2002; Volume 348, pp. 93–112. [Google Scholar]
  49. Jia, R.; Cao, L.-P.; Du, J.-L.; Wang, J.-H.; Liu, Y.-J.; Jeney, G.; Xu, P.; Yin, G.-J. Effects of carbon tetrachloride on oxidative stress, inflammatory response and hepatocyte apoptosis in common carp (Cyprinus carpio). Aquat. Toxicol. 2014, 152, 11–19. [Google Scholar] [CrossRef]
  50. Ziajahromi, S.; Kumar, A.; Neale, P.A.; Leusch, F.D.L. Environmentally relevant concentrations of polyethylene microplastics negatively impact the survival, growth and emergence of sediment-dwelling invertebrates. Environ. Pollut. 2018, 236, 425–431. [Google Scholar] [CrossRef] [PubMed]
  51. Wang, L.; Wu, W.M.; Bolan, N.S.; Tsang, D.C.W.; Li, Y.; Qin, M.; Hou, D. Environmental fate, toxicity and risk management strategies of nanoplastics in the environment: Current status and future perspectives. J. Hazard. Mater. 2021, 401, 123415. [Google Scholar] [CrossRef] [PubMed]
  52. Leibovitz, B.E.; Siegel, B.V. Aspects of Free Radical Reactions in Biological Systems: Aging1. J. Gerontol. 1980, 35, 45–56. [Google Scholar] [CrossRef] [PubMed]
  53. Sautin, Y.Y.; Johnson, R.J. Uric Acid: The Oxidant-Antioxidant Paradox. Nucleosides Nucleotides Nucleic Acids 2008, 27, 608–619. [Google Scholar] [CrossRef] [PubMed]
  54. Ciereszko, A.; Dabrowski, K.; Kucharczyk, D.; Dobosz, S.; Goryczko, K.; Glogowski, J. The presence of uric acid, an antioxidantive substance, in fish seminal plasma. Fish Physiol. Biochem. 1999, 21, 313–315. [Google Scholar] [CrossRef]
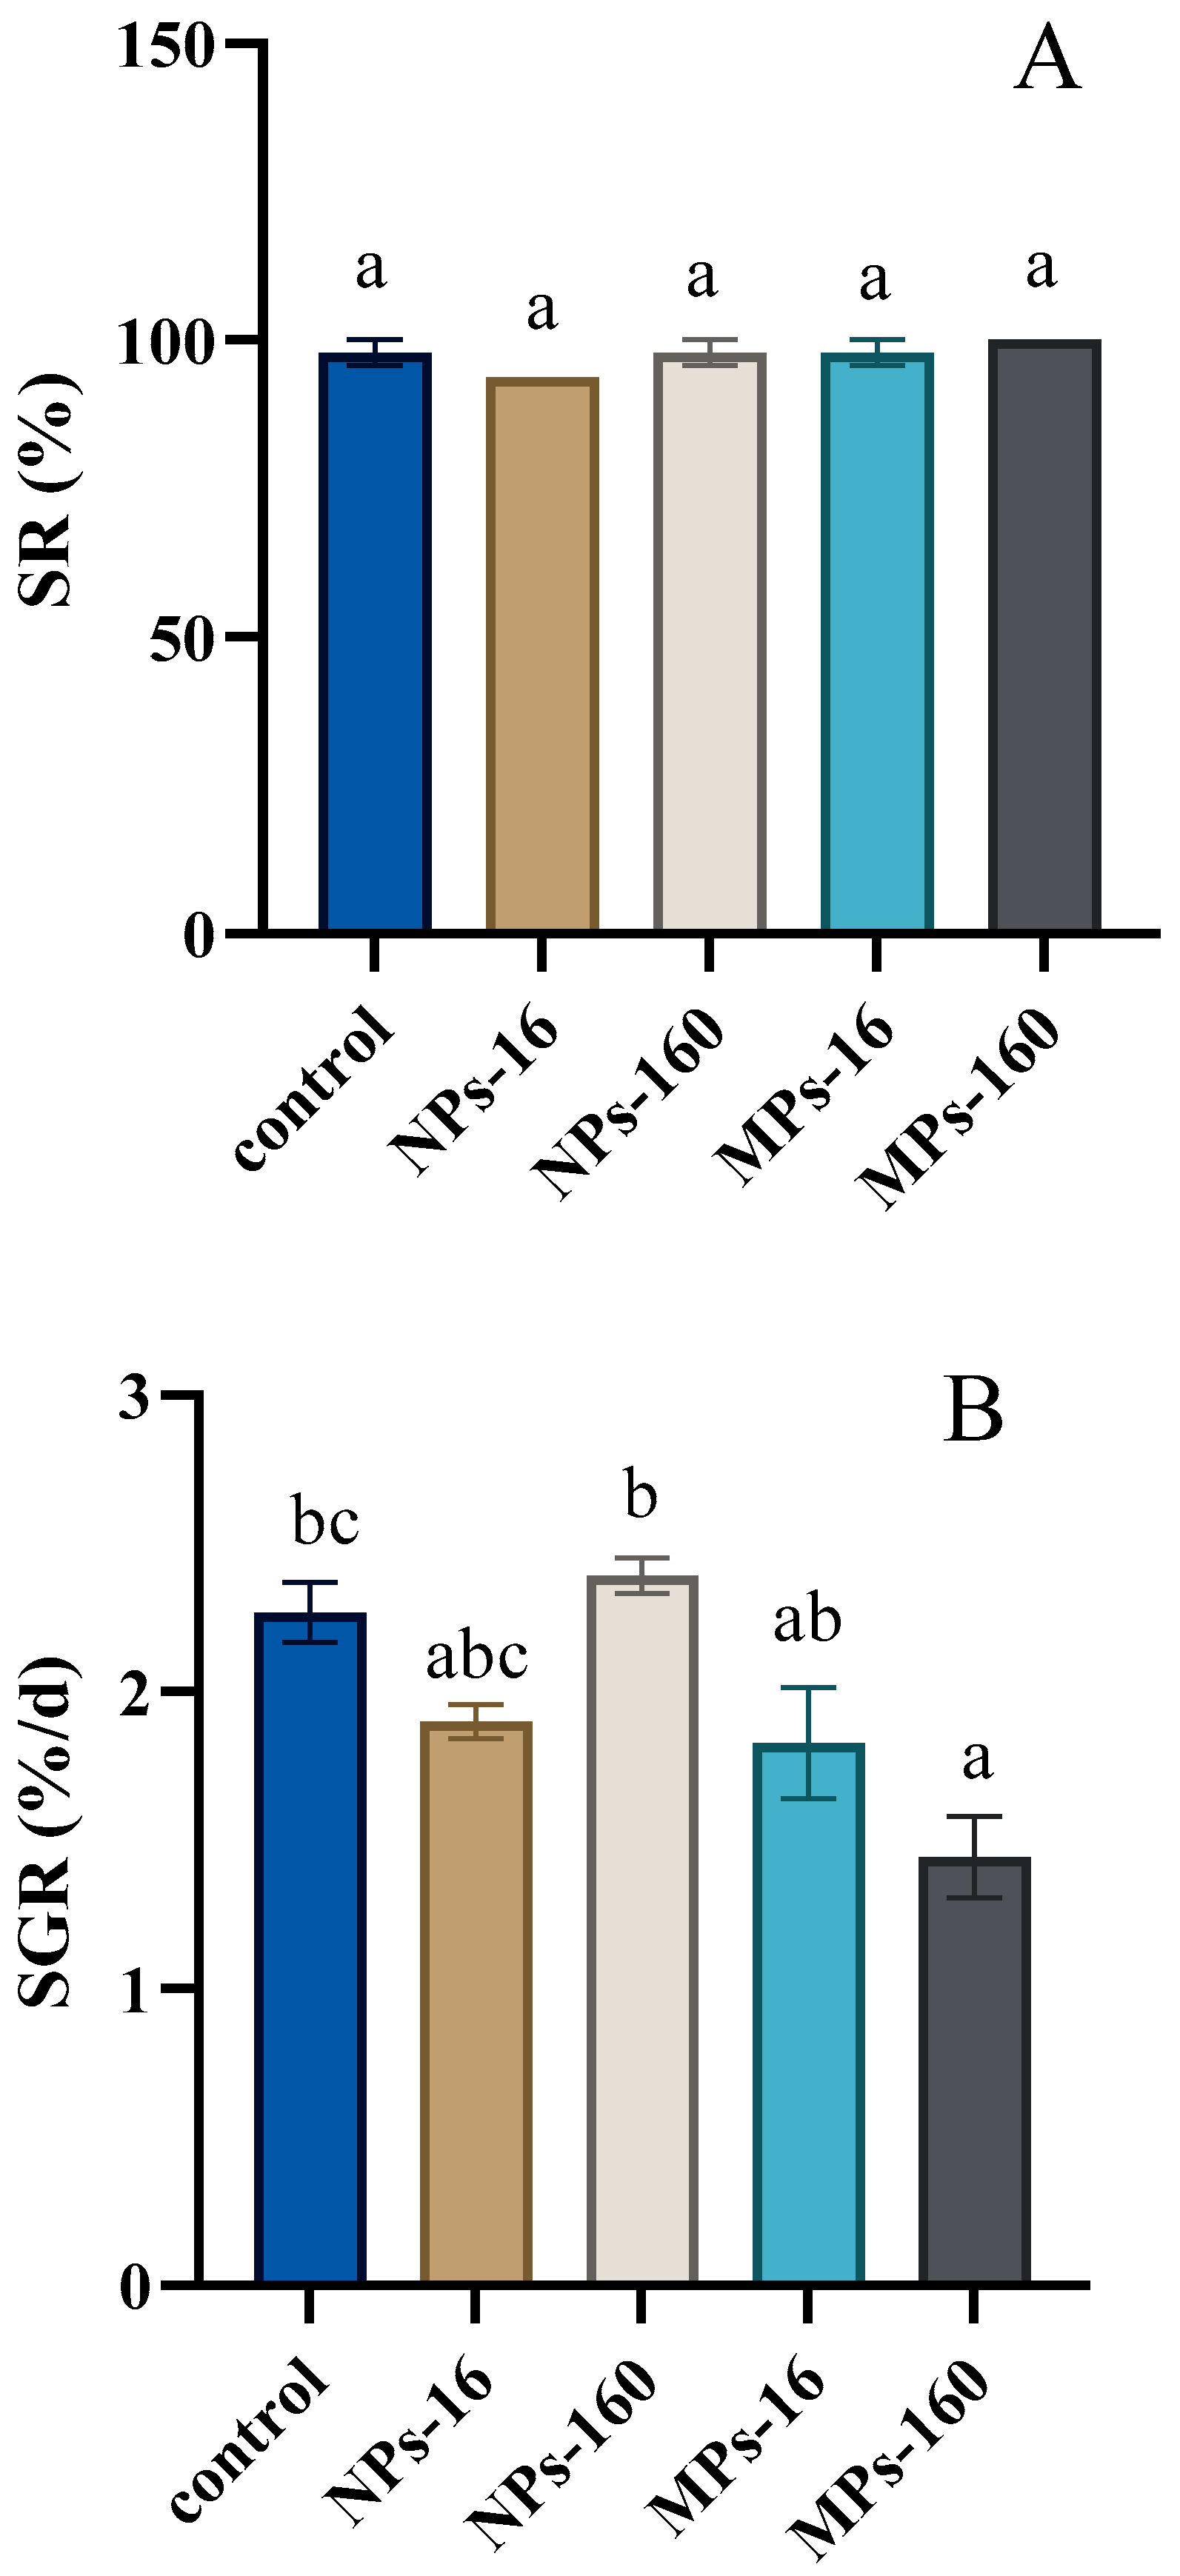
Figure 1. SR (A) and SGR (B) of guppies after exposure to MPs/NPs. Data are presented as mean ± SD (n = 3). Different lowercase letters represent significant differences between treatments (p < 0.05). SR = survival rate; SGR = specific growth rate.
Fishes 10 00382 g001
Figure 2. Accumulation of MPs and NPs in the gill and gut of guppies after exposure to MPs/NPs. Data are presented as mean ± SD (n = 3). Different lowercase letters represent significant differences between treatments (p < 0.05).
Fishes 10 00382 g002
Figure 3. Lightness ΔL (A), redness Δa (B), yellowness Δb (C) and total color ΔE (D) of guppies after exposure to MPs/NPs. Data are presented as mean ± SD (n = 24). Different lowercase letters represent significant differences between treatments (p < 0.05).
Fishes 10 00382 g003aFishes 10 00382 g003b
Figure 4. SOD and CAT activities in the skin and gut of guppies after exposure to MPs/NPs. Data are presented as mean ± SD (n = 3). Different lowercase letters represent significant differences between treatments (p < 0.05). (A) SOD = Superoxide dismutase, (B) CAT = catalase.
Fishes 10 00382 g004
Figure 5. GSH (A) and GSSG (B) contents in the skin and gut of guppies after exposure to MPs/NPs. Data are presented as mean ± SD (n = 3). Different lowercase letters represent significant differences between treatments (p < 0.05). GSH = glutathione; GSSG = oxidized glutathione.
Fishes 10 00382 g005
Figure 6. Total antioxidant capacity (T-AOC) in the skin and gut of guppies after exposure to MPs/NPs. Data are presented as mean ± SD (n = 3). Different lowercase letters represent significant differences between treatments (p < 0.05).
Fishes 10 00382 g006
Figure 7. Malondialdehyde (MDA) level in the skin and gut of guppies after exposure to MPs/NPs. Data are presented as mean ± SD (n = 3). Different lowercase letters represent significant differences between treatments (p < 0.05).
Fishes 10 00382 g007
Figure 8. Uric acid level in the skin and gut of guppies after exposure to MPs/NPs. Data are presented as mean ± SD (n = 3). Different lowercase letters represent significant differences between treatments (p < 0.05).
Fishes 10 00382 g008
Disclaimer/Publisher’s Note: The statements, opinions and data contained in all publications are solely those of the individual author(s) and contributor(s) and not of MDPI and/or the editor(s). MDPI and/or the editor(s) disclaim responsibility for any injury to people or property resulting from any ideas, methods, instructions or products referred to in the content.