Article

The Economic Contributions of the Virginia Seafood Industry and the Effects of Virginia Seafood Products in Retail Stores and Restaurants in 2023

by
Fernando H. Gonçalves
*,
Jonathan van Senten
and
Michael H. Schwarz
Virginia Seafood AREC, Virginia Polytechnic Institute and State University, Hampton, VA 23669, USA
*
Author to whom correspondence should be addressed.
Fishes 2025, 10(8), 373; https://doi.org/10.3390/fishes10080373 (registering DOI)
Submission received: 25 June 2025 / Revised: 21 July 2025 / Accepted: 28 July 2025 / Published: 2 August 2025
(This article belongs to the Section Fishery Economics, Policy, and Management)

Abstract

Virginia’s coastal location and abundant marine resources make its seafood industry a vital contributor to the state’s economy, supporting both local communities and tourism. This study applied input–output models and updates the economic contributions of the Virginia seafood industry using 2023 data, building on models developed for 2019 that capture both direct effects and broader economic ripple effects. In 2023, the industry generated USD 1.27 billion in total economic output and supported over 6500 jobs—including watermen, aquaculture farmers, processors, and distributors—resulting in USD 238.3 million in labor income. Contributions to state GDP totaled USD 976.7 million, and tax revenues exceeded USD 390.4 million. The study also evaluates the economic role of Virginia seafood products sold in retail stores and restaurants, based on secondary data sources. In 2023, these sectors generated USD 458 million in economic output, supported more than 3600 jobs, produced USD 136.7 million in labor income, and USD 280.8 million in value-added. Combined tax contributions surpassed USD 74 million. Importantly, the analysis results for the Virginia seafood products from retail and restaurant should not be summed to the seafood industry totals to avoid double-counting, as seafood products move as output from one sector as an input to another. These results provide evidence-based insights to guide decision-making, inform stakeholders, and support continued investment in Virginia’s seafood supply chain and related economic activities.
Key Contribution: This manuscript provides an updated and comprehensive assessment of the economic contributions of Virginia’s seafood industry and its retail and restaurant sales of Virginia seafood products, using 2023 data. By quantifying the direct and ripple effects across production and consumer sectors, it offers valuable insights for policymakers and stakeholders to inform evidence-based decisions and support sustainable investment in the state’s seafood supply chain.

1. Introduction

Economic contribution studies provide a robust framework for quantifying the ripple effects of industry activity, including direct, indirect, and induced effects [1,2]. The findings of this line of research studies help stakeholders and policymakers understand how industry expenditures flow through local and regional economies, generating employment, income, and tax revenues [3]. Due to the quality and accessibility of its datasets, IMPLAN is one of the most-used forms of modeling software to perform economic impact and contributions analyses based on input–output (I-O) models [1,4,5]. Recent studies have quantified the economic contributions of Virginia’s seafood industry, though many assessments focus primarily on production, processing, and distribution activities. For instance, Virginia’s seafood industry contributed approximately USD 1.1 billion in total economic output and supported over 7000 jobs in 2019, representing industry expenditure patterns developed from pre-COVID-19 data [3]. However, these estimates did not account for the retail and restaurant sectors, where seafood products ultimately reach consumers, thereby limiting the understanding of the seafood industry’s full impact, particularly given the scale and significance of these downstream sectors. Due to budgetary and time constraints, the economic contributions from local seafood product sales in restaurants and retail stores in Virginia were not considered in the previous study. Similarly, other studies examining the economic contributions of seafood industry sectors often overlook or fail to consider retail and restaurant sectors in their analysis [6,7,8]. Virginia ranks as the third-largest seafood producer in the nation [9]; retail stores and dining establishments link consumers to regional seafood offerings, acting as intermediaries between fishermen or aquaculture producers and end customers. They also provide distinctive gastronomic experiences that appeal to both locals and visitors, helping to enrich Virginia’s lively culinary scene. [10]. Although their significance is clear, the role of seafood sales within these retail and food service businesses has not been extensively studied.
The retail sector is the biggest private employer in the United States, supporting over 55 million jobs and serving as a foundational pillar of the national economy [11]. In Virginia alone, the total economic impact of retail was USD 128.1 billion in 2022, supporting more than 835,000 jobs and generating over USD 19 billion in labor income [11]. Similarly, the restaurant industry generated an estimated USD 24.4 billion in economic output and supported more than 366,000 jobs in 2023 [12]. These figures highlight the potential scale of seafood’s economic footprint beyond the dockside and processing plant. By not accounting for these downstream transactions, traditional seafood economic analyses risk underestimating the industry’s true contribution to Virginia’s economy. Incorporating seafood-specific retail and restaurant expenditures into economic contribution studies provides a more complete approach, considering the value of raw seafood products and their transformation into consumer-ready goods and dining experiences. However, conducting such studies presents several challenges, namely the availability of accurate and representative primary data. Industry-specific data are often proprietary, inconsistently collected, or unavailable, particularly in downstream sectors such as restaurants and retail seafood markets [1]. Analysts need to rely on informed assumptions, proxy data, and mixed-methods approaches to address these limitations. Thoughtful survey design, stakeholder engagement, and validation techniques are necessary for developing credible and defensible estimates. Moreover, the capacity to adjust approaches from the originally intended strategies is crucial for alleviating potential negative outcomes stemming from data collection, low respondent engagement, and insufficient coverage. Additionally, the assumptions embedded within I-O models, such as local purchase coefficients, margins, and labor intensities, can significantly influence results and must be transparently documented [3]. Despite these methodological complexities, economic contribution studies offer critical insights for investment decisions, policy development, and public communication. In Virginia, a state that leads the nation in hard clam production and ranks among the top producers of oysters on the U.S. Atlantic coast [9,13], local seafood is not only a vital source of income for fishers and processors but also a valued component of culinary identity, tourism, and cultural heritage [14]. By integrating retail and restaurant expenditures on local seafood into an economic contribution analysis, this study aims to fill an important gap and present a more holistic estimate of the seafood industry’s role in Virginia’s economy that was not covered in the previous study [3]. However, models that capture retail and restaurant expenditures associated with local seafood purchases and sales can only be developed through effective data collection that achieves statistical significance in its coverage. Therefore, we updated the estimates of the economic contributions of the seafood industry for output, jobs, labor income, and tax revenue for the year 2023. This approach considered an update on the production side (commercial fisheries and aquaculture), as well as processors and distributors. Additionally, this study provides the economic contributions of Virginia seafood products sold by retailers and purchased by restaurants, which were estimated separately rather than summed, as their inputs are part of the production side’s output; integrating the results would lead to double-counting effects. Our study also revealed how different supporting economic sectors are interconnected and their collective impact on the overall economy of the Commonwealth. Therefore, this study aims to quantify the economic contributions of the Virginia seafood industry and the impact of Virginia seafood products in retail stores and restaurants for 2023, providing reference values that can inform decision-making policies supporting industry activities.

2. Materials and Methods

The estimates of the economic contributions derived from local seafood expenditures from retail stores and restaurants required efforts to obtain data from multiple sources, an assessment of expenditure data at the firm level, and the design and execution of surveys to collect additional information to fill gaps, in line with previous publications [1,2,3], following the framework described below.

2.1. Identification of Required Data and Gaps

Identifying sources of information about restaurants and retail stores dealing with seafood in Virginia involved consulting seafood distributors and state agencies to determine the number of business entities. Regulatory bodies including government agencies like the Virginia Department of Taxation and the Virginia Department of Tourism (virginia.org), other organizations overseeing restaurants and retail establishments, and restaurant associations, were consulted to obtain the number of active permits and commercial licenses within the state and to obtain contact lists. Some secondary data was only accessible via a formal request and was not publicly available online. Data from secondary sources and literature reviews were used to verify and validate the number of restaurants and retail stores selling seafood in Virginia and to identify potential data gaps, which is necessary when conducting an economic contribution assessment of Virginia’s seafood sector.

2.2. Data on Direct Effects and Expenditure Data

The direct economic effects encompass the overall production value produced by the main sectors under review. For the seafood sector in Virginia, these effects involve revenue from commercial fishing, aquaculture operations, seafood processing plants, distribution channels, retail stores, and dining establishments. The economic contributions of commercial fisheries, aquaculture, processors, and distributors were estimated based on updates and secondary data applied to the existing primary-data models developed for the year 2019 [3]. The updates on the direct effects in the existing 2019 models included the newest values of seafood landings for commercial fishers of USD 186 million [15] and USD 104 million for aquaculture [16]. The number of active licenses in operation for both commercial fishers and aquaculture farmers who reported production of USD 1000 or more was obtained for the estimates of direct effects on employment [17]. Data on direct effects on labor income covers payments to proprietors and employees. The survey asked about total payroll costs, including income for both groups. To focus on Virginia’s economic contributions and exclude leakages, we collected data on the percentage of sales and employment occurring within the state, ignoring out-of-state transactions. In this setting, economic leakages pertain to imported goods—whether from other countries or different states—that Virginia’s seafood companies buy. These imports do not produce further direct impacts within Virginia and are viewed as economic spillovers [3].
For retail sales, we obtained scanner data from Nielsen IQ. Since collecting primary data from businesses was expected to be challenging, our analysis utilized seafood sales figures from retail outlets in Virginia, gathered through barcode-scanning data provided by NielsenIQ, a firm renowned for its expertise in marketing analytics and consumer insights. The dataset for 2023 covers 80–82% of retail activities in Virginia. In addition, existing expenditure models for both the retail and restaurant sectors are available on the 2025 IMPLAN modeling online application through their subscription-based platform. Unlike other sectors, such as aquaculture, which is aggregated to industry 14—animal production (except for cattle, poultry, and eggs) industry 389—retail- food and beverage stores do not require disaggregation. Similarly, for the food service industry, industries 491—full-service restaurants; industry 492—limited-service restaurants; and industry 493—all other food and drinking places are fully disaggregated, highly detailed, and provide reliable and defensible data for 2023, which is necessary to perform the economic contribution analysis.

2.3. Survey Design and Data Collection

Data not available from secondary sources or consultations with stakeholders was collected through a survey (administered using QuestionPro online) aiming to gather economic information from retail stores, restaurants, and blended services that combine retail and restaurant elements, following the guidelines set by the Virginia Tech Institutional Review Board (IRB #24-680). The survey was pre-tested and reviewed by restaurant owners and representatives from restaurant associations. After receiving insightful feedback, adjustments were made to enhance the accuracy and representativeness of the survey to capture retail and restaurant business expenditures. The expenditure pattern model was built using intermediate input, employee compensation, and total output, while also integrating the corresponding local purchase percentages (LPP).

2.4. Scope of Data Collection

The survey was designed to collect primary data that accurately represents businesses across the entire state entities, applying best practices in data collection. It aimed to gather sufficient observations for retail stores and restaurants within the overall dataset, recognizing the differences in spending and revenue patterns at various supply chain levels. To support the development of economic contribution models in IMPLAN, each item collected with the survey was summed for each individual business. The total values were subsequently converted into coefficients, serving as the basis for creating new models or adjusting existing IMPLAN models for the retail and restaurant sectors.

2.5. List Frame, Recruitment of Participants, and Survey Activities

Virginia has over 118 thousand retail establishments [11] and over 17 thousand eating and drinking place locations [12]. Contact lists were obtained from the Virginia Department of Tourism, responsible for the listing directory on the portal virginia.org. Google searches helped locate and contact some businesses in the state of Virginia. We obtained a list of 5982 establishments; only 810 of them had email addresses, which were used as a list frame for applying the survey instrument. The Virginia Beach Restaurant Association, the Virginia Restaurant Lodging Travel Association, the County of Louisa, through their community engagement manager, and other industry stakeholders shared the survey instrument with their members and contacts. Our recruitment strategy involved emailing eligible entities from the contact lists that described the study, emphasizing the voluntary nature of participation and data confidentiality, and requesting their involvement. Furthermore, in the recruitment process, in-person meetings were arranged with individual business owners. Each survey response was recorded and coded to protect respondent identities and ensure confidentiality. Data collection spanned 55 days, with the survey being active from February to April 2025. Various efforts were undertaken to reach out to individuals within the intended groups during this period. After survey activities concluded, the data were input into Microsoft Excel spreadsheets, thoroughly cleaned, and analyzed.

2.6. Accounting for Non-Responses

As anticipated by Virginia’s numerous retail and restaurant establishments, obtaining statistically significant coverage of the survey data presented the biggest challenge. Therefore, we accounted for non-responses by adjusting the NielsenIQ dataset derived from scanner data, which represents 80–82% of retail activities in Virginia for 2023, making it a robust and reliable data source. In this instance, we opted for the most conservative rate of 80%. Considering the dataset from NielsenIQ, total seafood sales in Virginia’s retail stores for 2023 were estimated at USD 154.9 million. This figure accounted for coverage adjustments and included only local Virginia seafood, where we applied a local purchase percentage (LPP) of 26.49% from the IMPLAN sector 389 [18] and was seen as the overall output for the sector in this economic contribution analysis. In relation to restaurants, we used the IMPLAN data for fish and seafood items from the system’s industry demand commodity balance sheets, along with their respective LPP, to define the total local Virginia seafood expenditure as a baseline for intermediate inputs in the economic modeling of its contribution to the Virginia seafood industry. IMPLAN is a widely used economic modeling tool that is considered a reliable and robust data source in economic modeling due to its tradition and partnerships with official data sources. The total value of locally purchased fish and seafood items for full-service, limited-service, and all other food and drinking establishments was USD 57.8 million in 2023 [18].

2.7. Economic Contributions Assessment—Theory of Input–Output Modeling

This research utilized an Input–Output (IO) methodology grounded in the IMPLAN framework, referencing the IMPLAN data from 2023. This database includes matrices of technical coefficients that reflect both backward and forward linkages related to all economic activities in Virginia. IMPLAN models produce linear production functions, which link an industry’s outputs to the inputs needed to generate those outputs. The mathematical rationale outlined below was used in previous studies [1,2,3]. The model assumes a straight-line connection between the total output q of sector i , depicted in a generalized input–output model as the aggregate of goods and services sold to other sectors ( z i j ) and to the final demand sector ( f i ). This relationship can be formulated as follows:
q i = 1 N z i j + f i
The variable z i j , which denotes intermediate sales across all sectors j , is a unique linear expression based on q j , the output from intermediate industries. Dividing this function by q j produces a matrix of technical coefficients used in the input–output model. The indices i and j can take any values from 1 to N. Inverting this matrix enables the following depiction of the input–output relationships:
q = I A 1 F = m i j m i j m i j m i j F = M F
In Equation (2), the symbol I stands for an identity matrix, while A is the technical coefficient matrix, typically obtained by dividing z i j by q j . The element m i j refers to the supply chain interaction coefficients within the multiplier matrix M. However, in this research, A was derived by dividing z i j by z j , as the detailed data available only covered commodity purchases and did not include labor costs or taxes [18]. F denotes the matrix of final demand for all sectors in the economy. The output multiplier for each sector j is obtained by dividing M by I , which illustrates the magnitude of economic effects, particularly the rates at which production levels change. These multipliers are useful for assessing the direct, indirect, and induced impacts of spending activities throughout each stage of the Virginia seafood supply chain. Additionally, similar to the output multiplier, there are employment, labor income, and value-added multipliers that indicate the rate at which these variables change due to their influence on the core level of economic activity [1]. These multipliers provide insight into how economic activities within the Virginia seafood sector impact various parts of the economy.
The economic analysis is enhanced by integrating a Social Accounting Matrix (SAM), offering a more comprehensive view of the region’s economic interactions [19]. The SAM encompasses exchanges among different economic agents, offering a better insight into how household income is produced [19]. The online IMPLAN platform allows for seamless incorporation of the input–output framework and social accounting matrix, offering an intuitive and adaptable method to assess the direct, indirect, and induced economic effects of Virginia’s seafood sector. In summary, the IMPLAN multipliers from its SAM are responsible for estimates of the ripple effects of how much each supporting section is benefited by the direct expenditures of the seafood industry’s activities.
Regarding the description of economic effects, direct effects refer to outcomes within the industry under study, such as employment and sales by seafood companies. Indirect effects occur in connected sectors, such as how watermen’s fuel purchases impact the larger oil and gas industry. Induced effects involve changes in household spending, driven by variations in income across related sectors, including salaries paid, which stimulate further economic activity through expenditures on housing, utility bills, groceries, and other goods and services [19].

2.8. Industry Impact Analysis

County-level IMPLAN datasets for Virginia in 2023 were obtained via a one-year subscription to The IMPLAN Group’s cloud-based platform [18]. The IMPLAN datasets now include 528 industries, such as commercial fishing (industry 17), seafood product preparation and packaging (industry 92), and truck transportation (industry 417) [15]. Aquaculture is not assigned to a specific sector as it falls under animal production (industry 14), excluding cattle, poultry, and eggs. Additionally, industry 417 (Truck transportation) is not solely linked to seafood distribution. In the case of retail stores, IMPLAN has aggregated food and beverage stores in industry 389. For the restaurant sector, IMPLAN has three dedicated industries with a high level of detailing: full-service restaurants (Industry 491), limited-service restaurants (Industry 492), and all other food and drinking places (Industry 493).
For estimating the 2023 economic contributions of the Virginia seafood industry and the economic effects of Virginia seafood products sales and purchases in retail stores and restaurants, we utilized IMPLAN’s Industry Impact Analysis (Detailed) tool. The Industry Impact Analysis (IIA) is an updated analytical tool available in the IMPLAN system derived from the Analysis by Parts (ABP) [1,2,3] that allows for the input of separate components of direct effects and the customization of expenditure patterns for each industry being studied. Thus, it was feasible to refine the commodity inputs specification, specify a share of local labor income, establish local purchase percentages (LPP), and apply IMPLAN’s spending data patterns.
To utilize this model effectively, it is crucial to first identify the direct impacts of Virginia’s seafood sector. These impacts were derived from survey responses and adjusted for non-respondents. Data on labor income per worker from the survey, combined with industry averages from IMPLAN for Taxes on Production and Imports (TOPI) and Other Property Income (OPI), were used to calculate the direct value-added impact. An expenditure pattern within the industry was established to estimate indirect effects, considering spending within the seafood supply chain at each stage—watermen, aquaculture farmers, processors, and distributors. Coefficients for these patterns were calculated by dividing each specific input cost by the total cost of all intermediate inputs at each level. These coefficients were then mapped to relevant NAICS industry codes and corresponding IMPLAN commodity codes. Separate expenditure patterns were created for each activity, excluding seafood expenses purchased from processors and distributors, as these expenses are offset by the revenue obtained from watermen and aquaculture farmers. Including these costs as expenses for processors and distributors would result in double-counting in the estimates. The Industry Impact Analysis (IIA) method captures total revenue at each stage of the supply chain without double-counting sales, considering this as only part of the gross revenue at the gate, and excluding it from expenses in forward linkages. To assess the induced effects of the Virginia seafood industry, a labor income component was incorporated into the model to represent employee compensation. After development, the economic impact scenarios were carried out without implementing any scaling modifications. The IMPLAN platform provides a user-friendly and adaptable environment for integrating the input–output analysis with the social accounting matrix [1,19]. This combination enables the creation of estimates covering the Virginia seafood industry’s direct, indirect, and induced economic impacts.
As survey responses did not present statistical representativeness, the models developed for retail and restaurants can be considered questionable due to the reduced number of observations of economic data provided by businesses. Therefore, we utilized the level of seafood items purchased available on the IMPLAN system, and estimated the economic contributions of these purchases as the only item in the spending pattern. The values cannot be incorporated into the economic contributions of the Virginia seafood industry because these intermediate inputs (fish- and seafood-related items) are the output of production from fishers and aquaculture farmers and should not be double-counted. Therefore, this manuscript provides an updated value of the economic contributions of the Virginia seafood industry for 2023 and the economic contributions of Virginia seafood purchases and sales from retail stores and restaurants in 2023.

2.9. Study Area Characteristics

Virginia is in the Mid-Atlantic region and borders the District of Columbia, Maryland, West Virginia, Tennessee, Kentucky, North Carolina, and the Atlantic Ocean. Its population exceeds 8.7 million residents and 3.4 million households. Virginia’s Gross Domestic Product (GDP) was USD 721 billion in 2023. This was generated by 498 of the 528 existing industries, sustained over 5.7 million jobs, produced USD 633 billion in personal income, and yielded a total output of USD 1 trillion [19]. Most seafood production occurs in Eastern Virginia, which is situated between Chesapeake Bay and the Atlantic Ocean, serving as a hub for seafood consumers.

3. Results

3.1. Response and Coverage Rates

The survey was sent to 810 email addresses of restaurant and retail businesses in Virginia. The QuestionPro platform showed 350 recipients accessed the survey instrument, with a 12.8% completion rate. The survey received 39 responses, representing 50 business locations in Virginia. Of these, 53.1% were full-service restaurants, 34.4% were limited-service restaurants, 3.1% were retail stores, and 9.4% were retail stores with limited-service restaurants. The businesses represented by respondents were distributed as follows: 44% from Hampton Roads/Southeastern Virginia (Tidewater), 28% from Northern Virginia, 24% from Central Virginia, 4% from Shenandoah Valley/Western Virginia, and 4% from Central/South–Central Virginia. In 38.1% of these businesses, seafood sales were responsible for 51% or more of their total revenue (28.6% between 51% and 75%, and 9.5% more than 75%). Additionally, for 61.9% of these businesses, up to 50% of their total revenue originated from seafood sales (9.5% less than 10%, 38.1% between 11% and 25%, and 14.3% between 26% and 50%).
The survey responses indicated that 74% of restaurant owners know which seafood species they purchase are Virginia seafood products, and 56% of them (or 41.4% of all respondents) distinguish Virginia seafood from other seafood for marketing purposes. Shrimp (10%) and salmon (9.5%) are the leading species offered in restaurants, followed by oysters (8.6%) and scallops (8.6%). Finfish such as Mahi-Mahi (7.7%), tuna (7.3%), striped bass (5.9%), and flounder (5.9%) follow in rank. Squid (5.5%), cod (5%), lobster (5%), blue crabs (4.1%), and clams (3.6%) come next, along with black seabass (3.2%). Farm-raised catfish (2.3%), blue catfish (1.8%), tilapia (1.4%), croaker (0.9%), and spot (0.9%) follow. Moreover, 2.7% responded with other options, including octopus, grouper, halibut, and haddock. These seafood products are purchased mainly from large corporation distributors (48.8%), followed by local Virginia distributors (22.6%), local Virginia aquaculture farms (12.2%), and local Virginia fishers (3.3%).
The survey captured business owners’ perceptions regarding the importance of factors influencing a customer’s decision to visit a seafood business, along with the challenges they face that affect their business’s success. These perceptions were measured on a scale from 0 to 10, where 0 is not relevant and 10 is very relevant. In terms of significant factors, the quality of seafood scored the highest, with 9.2 points, followed by the variety of seafood products at 8.8, price at 8.4, atmosphere at 7.4, and location at 7.2. Among the lowest-ranked factors in importance to business owners, community engagement in hosting events and hiring teens and the elderly scored 6.6, while proximity to the coast ranked 5.5, and offering local Virginia seafood was shown to have the least importance on the scale, with a score of 5. Among business owners’ challenges, tight margins and overhead costs are tied with the highest score of 9, followed by price volatility at 8, and labor availability/reliability at 7.8. Next are inflation, steady supply, and weather, tied at 7.4.
While survey respondents provided insights into general aspects of their businesses, the survey questions related to economic data led to a substantial drop in participation; with only five responses representing full-service restaurants, nine representing limited-service restaurants, and one single retail store. This limited response poses challenges to the validity of the models generated due to the lack of statistical relevance of the sample size. Therefore, we decided to approach the analysis of the retail and restaurant sectors in a different way, considering the economic contributions of Virginia seafood purchases and sales from retail stores and restaurants in 2023, utilizing secondary data sources from INPLAN datasets and NielsenIQ scanner data. This information is presented separately from the economic contributions of the Virginia seafood industry, considering watermen, aquaculture farmers, seafood processors, and distributors for 2023.

3.2. Economic Contributions of the Virginia Seafood Industry, 2023

In 2023, Virginia’s seafood sector contributed an overall economic output of approximately USD 1.27 billion, encompassing activities from watermen, aquaculture operations, seafood processing, and distribution channels. This figure comprises a direct contribution of USD 986.7 million, an indirect contribution of USD 157.2 million, and an induced contribution of USD 128.5 million. The industry supported around 6507 jobs in total, with direct employment accounting for 5224 positions, indirect employment for 580, and induced employment for 703. The total labor income generated was estimated at USD 238.3 million, while the total value-added was approximately USD 976.7 million.
Table 1 highlights the industry’s economic impacts segmented into direct, indirect, and induced effects for the year 2023. All monetary values are inflation-adjusted to 2023 standards and rounded to the nearest whole number.
Seafood processors have the greatest impact on employment, labor income, and output, followed by watermen, aquaculture, and seafood distributors (Table 2). This study of the Virginia seafood sector highlighted its overall impact but excluded expenses related to seafood purchased by processors and distributors from commercial fisheries and aquaculture to avoid counting the revenue from producers as input for processing and distribution.
The Virginia seafood sector’s output multiplier was 1.29 in 2023, indicating that every dollar spent contributed an extra 29 cents to the state’s economy. The employment and labor income multipliers stood at 1.25 and 1.61, respectively. This suggests that for every five direct jobs created, one additional job is supported, and each dollar invested in wages generates an extra 61 cents in economic value. Additionally, the value-added multiplier of 1.20 signifies that each dollar produced by the industry yields 20 cents in labor income (including wages and proprietor earnings), other proprietary income (OPI), and taxes on production and imports (TOPI). A comprehensive breakdown of the supply chain’s economic impact is available in Table 2.
The Virginia seafood industry affects 480 (91%) of the 528 existing industries in the state through economic linkages. The Virginia seafood industry impacts different sectors differently, depending on factors such as employment, labor income, value-added, and economic output. Table 3 presents the economic contributions of the Virginia seafood Industry to the top 15 industries in 2023, ranked by output.
The seafood industry supports jobs in 479 industries, representing 91% of the 528 industries listed in Virginia in 2023. Nondepository credit intermediation and related activities; commercial and industrial machinery and equipment repair and maintenance; and insurance agencies, brokerages, and related activities were the most affected sectors based on employment, with an estimated 63, 60, and 48 jobs affected, respectively. While the owner-occupied housing sector is supported with value-added and output in excess of USD 20 million, this industry does not benefit from jobs and labor income.

3.3. Tax Revenue Generated by the Virginia Seafood Industry in 2023

In 2023, Virginia’s seafood industry generated a total of USD 164.4 million in taxes from federal, state, and local sources (see Table 4). Of this, 24% (USD 39.5 million) was local tax revenue, derived from sub-county general, sub-county special districts, and county levels. The state contribution was 27% (USD 45 million), while the federal government accounted for 49% (USD 79.9 million).

3.4. Economic Contributions of Virginia Seafood Products from Retail Stores and Restaurants in 2023

Retail stores selling Virginia seafood generated an output of USD 225.8 million in 2023, supporting 2111 jobs, a labor income of USD 76.4 million, and value-added USD 168.8 million. The combined economic effects of Virginia seafood purchases by each segment of restaurants generated an output of USD 232.2 million in 2023, supporting 1578 jobs, a labor income of USD 60.3 million, and value-added USD 112 million. Table 5 shows the breakdown of the direct, indirect, and economic effects of Virginia seafood sales in retail stores and Virginia seafood purchases in all restaurant segments in 2023.
The sales of Virginia seafood products by retail stores affect 480 (96%) of the 498 existing industries in the state through economic linkages. The retail seafood sales in Virginia impacted different sectors depending on metrics such as employment, labor income, value-added, and overall economic output. Table 6 presents the economic contributions of the Virginia seafood sales from retail stores to the top 15 industries in 2023, ranked by output. Commercial fishing is the industry that received the highest levels of supporting employment, labor income, value-added, and output from Virginia seafood sales by retail stores. Owner-occupied housing sector is next in the rank by output, but this industry does not benefit from jobs and labor income. Hospitals, other real estate, offices of physicians, limited-service restaurants, and full-service restaurants follow in the list of industries that are most supported by Virginia seafood sales by retail stores.
The purchase of Virginia seafood products by restaurants affects 480 (96%) of the 498 existing industries in the state through economic linkages. The sectors most impacted by Virginia seafood purchases by restaurants varied depending on employment, labor income, value-added, and economic output. Table 7 presents the economic contributions of the Virginia seafood purchases from restaurants to the top 15 industries in 2023, ranked by output. Seafood product preparation and packaging is the industry that received the highest levels of supporting employment, labor income, value-added, and output from Virginia seafood purchases by restaurants. Owner-occupied housing sector is next in the rank by output, but this industry does not benefit from jobs and labor income. Truck transportation and commercial fishing follow in the list of industries that are most supported by Virginia seafood purchases by restaurants.

3.5. Tax Revenue Generated by Virginia Seafood Products from Retail Stores and Restaurants, 2023

Virginia seafood products from retail stores and restaurants generated USD 74.7 million in federal, state, and local taxes in 2023 (Table 8). Retail stores selling Virginia seafood accounted for 62.2% (USD 46.5 million) of the total tax revenue, while restaurants purchasing Virginia seafood contributed 37.8% (USD 28.2 million). Local taxes include revenue generated at the sub-county general, sub-county special districts, and county levels, totaling USD 21.4 million, or 28.7% of the total taxes generated. The state of Virginia generated 26% (USD 19.4 million), while the federal government generated 45.4% (USD 33.9 million).

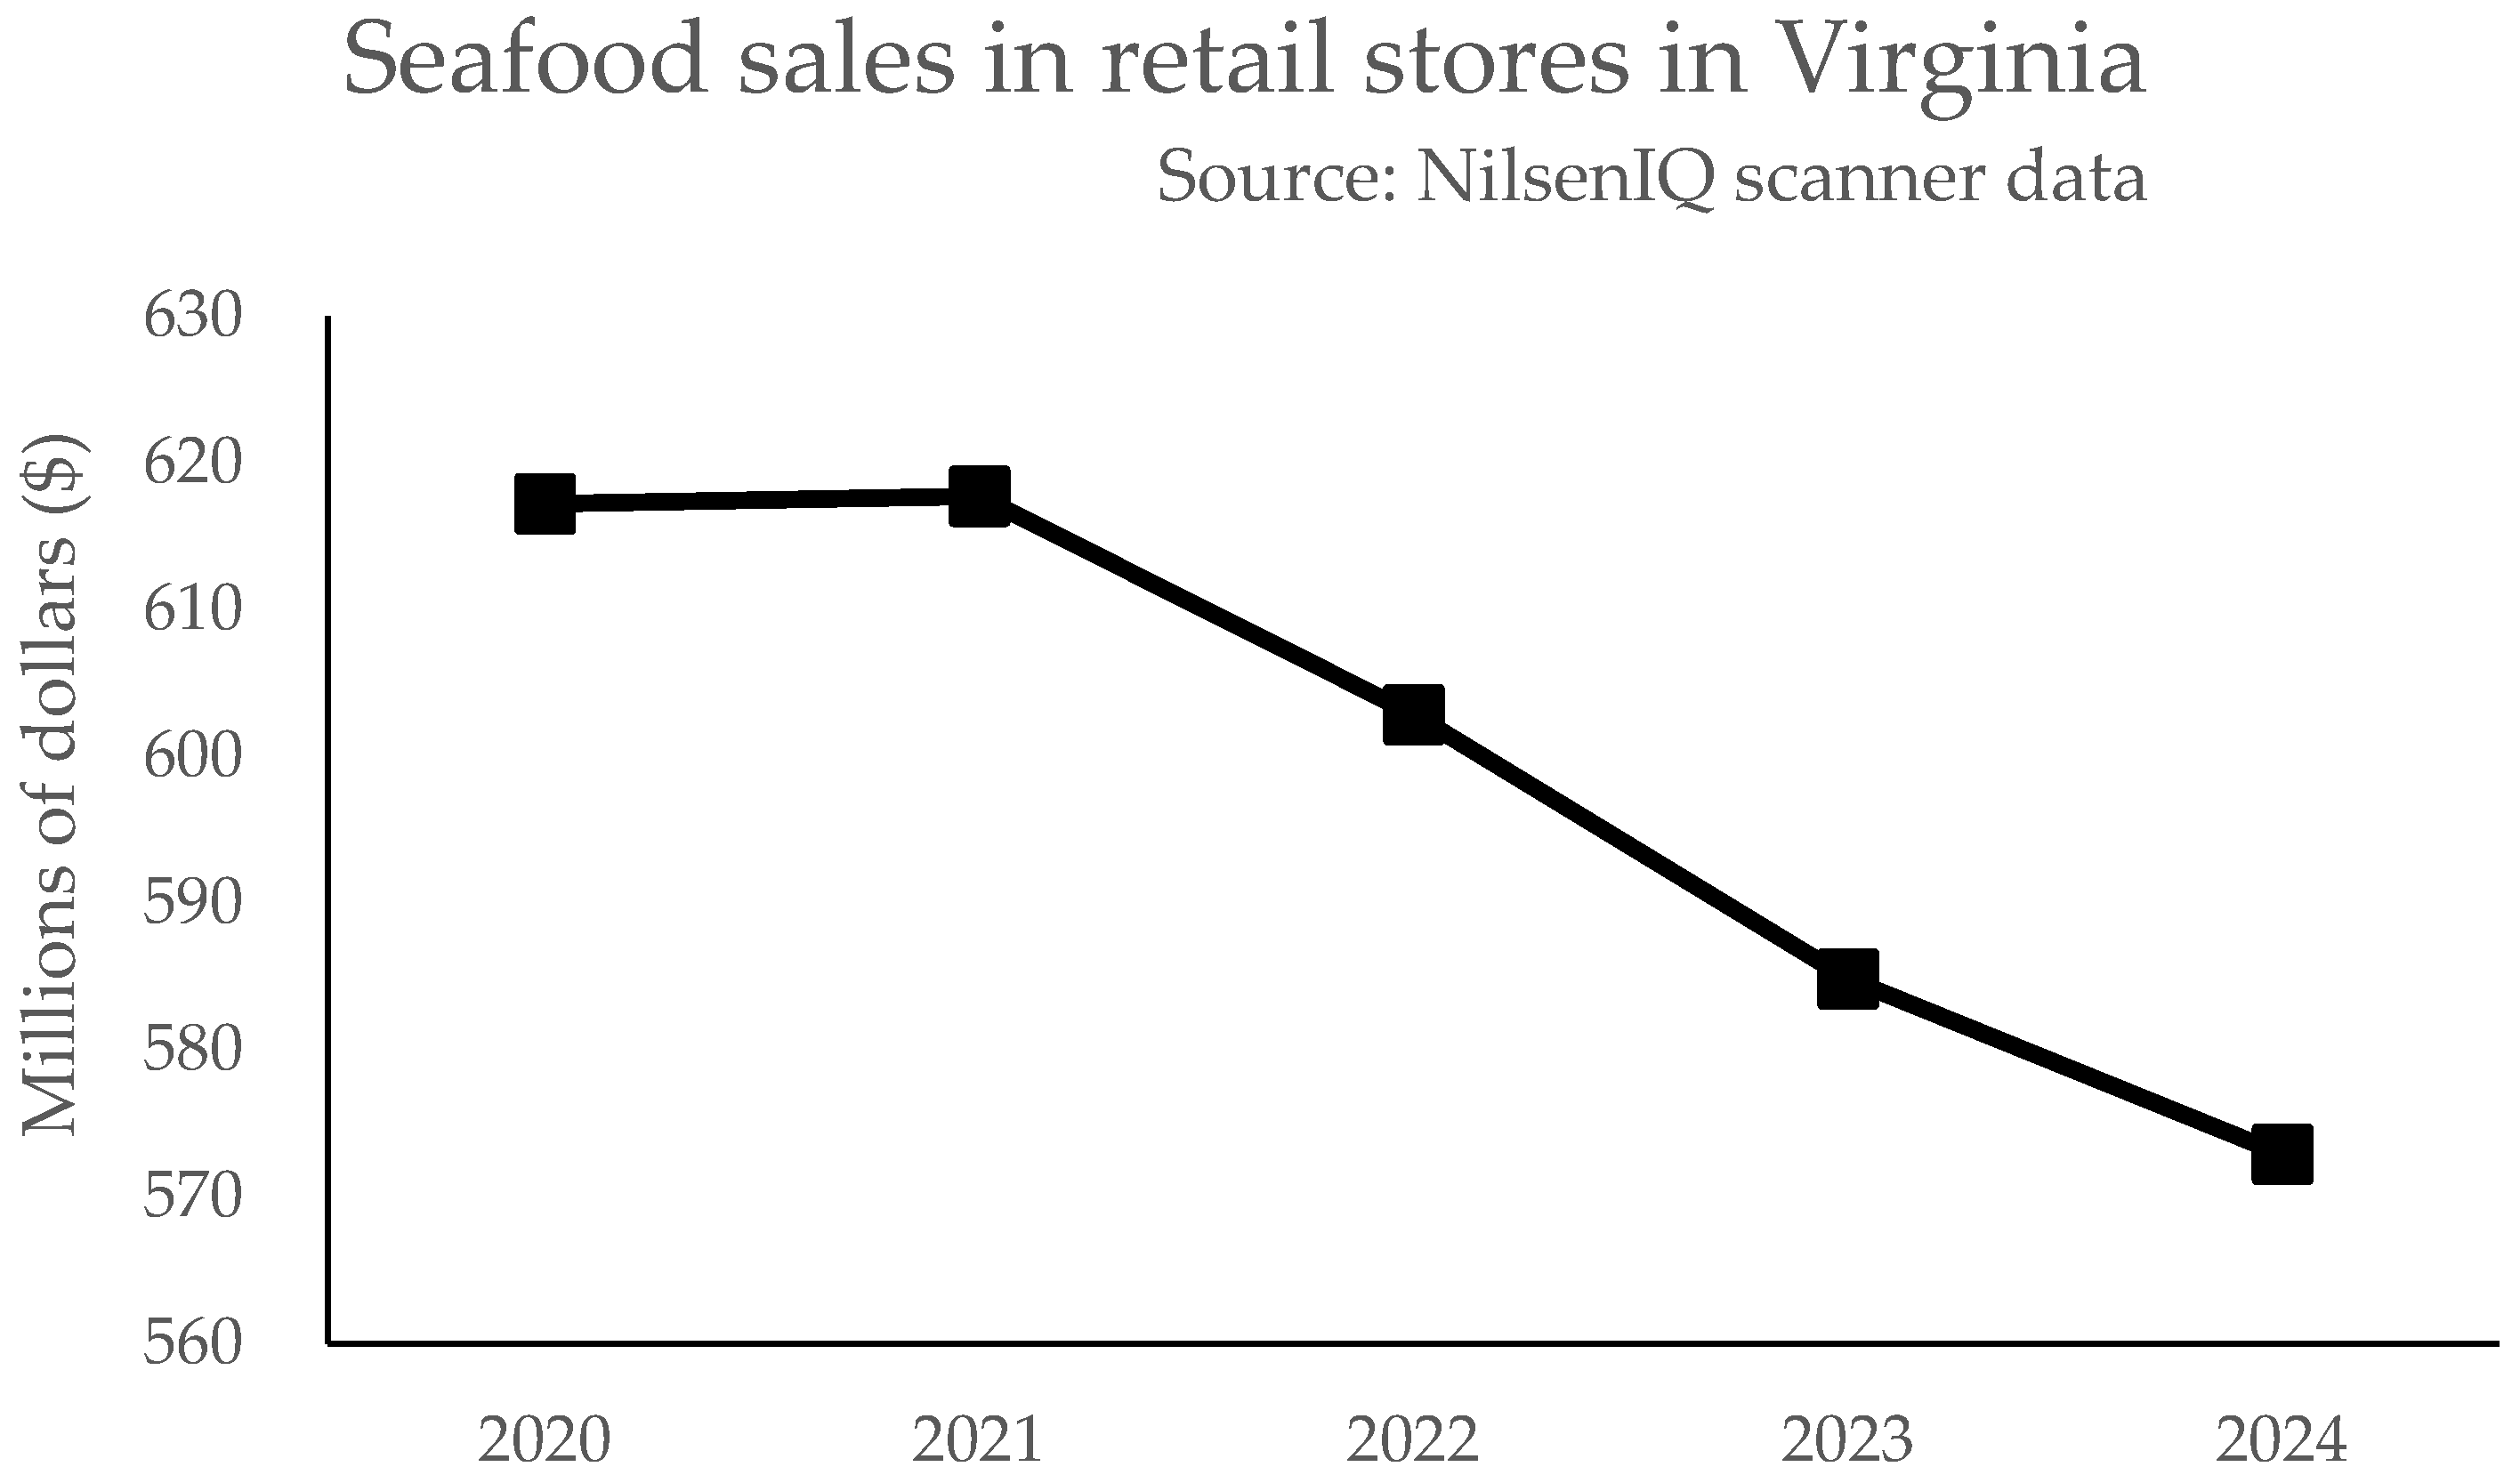
3.6. Seafood Sales Trend in Retail Stores

Scanner data from NielsenIQ on seafood products sold by Virginia retail stores indicates that since 2020, total seafood sales, including imports, have experienced a downward trend (Figure 1). The year 2024 observed an accumulated decline of 7.2% in total seafood sales compared to 2020. When analyzing EQ unit sales, the accumulated decline was 17.2% compared to 2020.

4. Discussion

Comparing the economic contributions of the Virginia seafood industry from 2019 [3] to 2023 reveals a notable decrease in the number of active watermen and aquaculture farms, adversely affecting job numbers and labor income. The hardships of working on the water, the lack of social benefits, and the increased supply costs make seafood production, especially for wild harvesters, unattractive to the younger generation of watermen [3]. However, this updated analysis shows that the total output rose from USD 1.1 billion in 2019 to USD 1.27 billion in 2023, largely due to seafood processors’ activities in producing value-added products. A simple inflation adjustment of the 2019 economic contribution would bring the total output to USD 1.32 billion, reflecting the accumulated inflation rate of 19.37% from December 2019 to December 2023 [20]. Therefore, while the nominal output contribution has increased, the Virginia seafood industry remains relatively smaller than before the COVID-19 pandemic. This highlights the importance of periodic assessments of the economic contributions of industries to monitor how an industry responds to economic stressors, such as a pandemic, tariffs, environmental regulations, climate change, immigration policies, and other variables. Additionally, changes in the number of commodities and industries in the IMPLAN system required further adjustments to the 2019 models, which could potentially influence the analytical outcomes through the IMPLAN’s social account matrix. Moreover, the increasing efficiency in food production systems, vertical integration, the adoption of technological innovations, and the acquisition of businesses by large corporations have social implications as fewer people participate in the production processes. The decline in the labor workforce supply has been impacting the USA and other countries that send farm workers to the USA, such as Mexico. Labor conservation and management strategies are needed to mitigate the effects of the lack of labor availability [21].
Fisheries communities connect and provide economic benefits to the tourism sector by supplying local seafood, leading to increased tourism-related expenditure, including the number of visitation days in coastal towns [22]. This translates to the fact that Virginia, as a coastal state, attracts millions of visitors to seafood restaurants and family cookouts with seafood products from Chesapeake Bay. The connection between the seafood industry, the community, and tourists has economic impacts from both the production and consumer sides, which are undeniably important to the state’s economy, but has been underexplored. The survey results indicated that 41.4% of seafood restaurants participating in the survey advertise the availability of Virginia seafood products on their menus for marketing purposes. Additionally, 44% of seafood businesses aware of the origin of their products opted not to advertise or do not perceive value in promoting Virginia seafood products on their menus for marketing purposes. Menu information highlights what consumers prioritize or overlook at both casual and fine dining seafood restaurants [23]. The qualitative and quantitative results of this study can inform policies, marketing strategies, funding allocation, and other decisions that support the seafood industry, highlighting the interconnected sectors that shape Virginia’s identity as a seafood destination.
Scanner data pointed to a decreasing trend in seafood sales in retail stores compared to previous years (Figure 1). The COVID-19 pandemic disrupted traditional seafood marketing channels [24]. With the closure of restaurants and food services and the lockdown of businesses, consumers experimented with more culinary recipes at home. According to the time series of scanner data for seafood sales, 2020 recorded the highest sales of seafood products in retail stores, with a yearly decline following the pandemic. Consumer behaviors post-COVID-19 have shifted demand for seafood products in both retail stores and restaurants. The choice between cooking at home and dining out can be influenced by factors such as age, social status, education level, urban residency [25], and ultimately, cost [26]. In many low- and middle-income countries, the consumption of food prepared away from home has been rising [25], which diminishes the demand on retail stores for products requiring preparation. In the USA and other high-income countries, the consumption of food-away-from-home affects negatively individual’s nutritional status and health [25]. Additionally, value-added products, like ready-to-eat meals, are gaining in popularity due to their convenience and the costs of time involved in cooking at home, which can be 30% of the total food cost for the general population if the individual works in the market [26].
Scanner data from NielsenIQ on seafood products sold by retail stores in Virginia provides attributes such as product description, type, packaging materials, and country of origin, and may include information regarding domestic production. The details in the product description can identify if the seafood product is a processed, prepared, or raw product. This scanner data can be used to estimate market trends, understand consumer preferences and demand, and guide marketing strategies [27]. However, the datasets have information gaps, and for supposed domestic products, they lack the details necessary to identify which products are Virginia seafood. Due to the lack of information about the origin of seafood products, the IMPLAN LPP of 26.49% was used to estimate the value of Virginia seafood sold in retail stores.
The decision to separate the analysis approach, focusing on Virginia seafood products from retail stores and restaurants from the Virginia seafood industry models, is due to the reduced participation in sharing economic data, such as expenditure data associated with seafood preparation and sales. The reduced involvement can be attributed to the overwhelming nature of the survey questions, requiring economic information that demands man-hours from busy workers to compile, who may not see a direct benefit or incentive to participate voluntarily. For future studies, financial incentives should be accounted for when budgeting a project as an effort to increase participation. In addition, survey fatigue is a common issue in economic impact studies. Since the responses did not achieve a sufficient sample size to provide statistical significance, using secondary data from reliable datasets targeting the economic effects of seafood sales in retail stores and seafood purchases from restaurants allowed for good analytical practices in economic modeling [28,29]. Therefore, the results of the economic contributions of Virginia seafood products from retail stores and restaurants should not be summed with the economic contributions of the Virginia seafood industry. The reason for this is that the inputs considered for retail stores and restaurants are outputs from watermen, aquaculture farmers, seafood processors, and distributors, and the results could be double-counted. Nevertheless, the insights into the economic contributions from the Virginia seafood products from retail stores and restaurants provided are a targeted snapshot of these very large industries. For example, the total output of USD 225.8 million for retail stores analyzing Virginia seafood products accounts for 0.18% of the USD 128.1 billion in economic contributions from the entire retail sector [11], which includes all products and linkages. Similarly, the total output of USD 232.2 million for restaurants analyzing Virginia seafood products makes up 0.95% of the USD 24.4 billion in economic contributions from the overall restaurant sector [12], considering all products and linkages.

5. Conclusions

In 2023, the total economic output of the Virginia seafood industry reached USD 1.27 billion and supported over 6500 jobs, including those held by watermen, aquaculture farmers, seafood processors, and distributors. The wages and salaries for these jobs generated USD 238.3 million in labor income. The value-added, or contributions to GDP, amounted to USD 976.7 million. The Virginia watermen, aquaculture farmers, seafood processors, and distributors paid over USD 390.4 million in taxes in 2023. Retail stores and restaurants are large industries in Virginia, engaging with multiple sectors to provide various products and commodities. Based solely on Virginia seafood products, both retail stores and restaurants generated an economic output of USD 458 million and supported over 3600 jobs in 2023. The total labor income amounted to USD 136.7 million in wages and salaries, while the total value-added, or contributions to the state’s GDP, reached USD 280.8 million. Retail stores and restaurants paid over USD 74 million in local, state, and federal taxes in 2023. These numbers are conservative, and the economic contributions of Virginia seafood products from retail stores and restaurants cannot be summed with those of the Virginia seafood industry. Virginia seafood products are outputs from one industry and serve as input for retail stores and restaurants; therefore, they should not be double-counted. It is recommended that future research consider providing financial incentives to respondents, as compiling the requested data is time-consuming. These results are intended to support evidence-based decision-making, inform industry and government stakeholders, and strengthen the case for continued investment in Virginia’s seafood supply chain.

Author Contributions

Conceptualization, F.H.G., J.v.S. and M.H.S.; data collection and curation, F.H.G.; formal analysis, F.H.G.; writing—original draft preparation, F.H.G.; writing—review and editing, F.H.G., J.v.S. and M.H.S.; visualization, F.H.G.; supervision, F.H.G. and J.v.S.; project administration, F.H.G.; funding acquisition, F.H.G. All authors have read and agreed to the published version of the manuscript.

Funding

This research was funded by the Virginia Marine Products Board (Virginia Department of Agriculture and Consumer Services, Commonwealth of Virginia), contract number 301-24-038.

Institutional Review Board Statement

The Virginia Tech Human Research Protection Program (HRPP) determined that this study meets the criteria for exemption from IRB review (IRB #24-680, August 22, 2024). Ethical review and approval were waived because all data were maintained as Confidential Business Data that were coded, and all types of identifiable information were removed.

Data Availability Statement

The data collected were confidential business data that cannot be shared.

Acknowledgments

The authors thank the Virginia Marine Products Board, the Virginia Department of Agriculture and Consumer Services, the Virginia Marine Resources Commission, the Virginia Watermen Association, the Shellfish Growers of Virginia, the Virginia Beach Restaurant Association, and all the Virginia seafood stakeholders for contributing to this study. This project was made possible thanks to the support from the Virginia seafood industry and their trust in us to maintain the confidentiality of their data.

Conflicts of Interest

The authors declare no conflicts of interest. The funders had no role in the design of the study; in the collection, analyses, or interpretation of data; in the writing of the manuscript; or in the decision to publish the results.

References

  1. Hegde, S.; Kumar, G.; Engle, C.; Hanson, T.; Roy, L.A.; van Senten, J.; Johnson, J.; Avery, J.; Aarattuthodi, S.; Dahl, S.; et al. Economic Contribution of the U.S. Catfish Industry. Aquac. Econ. Manag. 2022, 26, 384–413. [Google Scholar] [CrossRef]
  2. Kumar, G.; Hegde, S.; van Senten, J.; Engle, C.; Boldt, N.; Parker, M.; Quagrainie, K.; Posadas, B.; Asche, F.; Dey, M.; et al. Economic Contribution of U.S. Aquaculture Farms. J. World Aquac. Soc. 2024, 55, e13091. [Google Scholar] [CrossRef]
  3. Gonçalves, F.H.; van Senten, J.; Schwarz, M.H.; Hegde, S. Assessing Economic Contributions of the Virginia Seafood Industry: An Estimation Framework Utilizing Primary Data. Fishes 2024, 9, 200. [Google Scholar] [CrossRef]
  4. Kumar, G.; Engle, C.; van Senten, J.; Sun, L.; Hegde, S.; Richardson, B.M. Resource Productivity and Costs of Aquaculture Practices: Economic-Sustainability Perspectives from U.S. Catfish Farming. Aquaculture 2023, 574, 739715. [Google Scholar] [CrossRef]
  5. Leontief, W.W. Quantitative Input and Output Relations in the Economic Systems of the United States. Rev. Econ. Stat. 1936, 18, 105. [Google Scholar] [CrossRef]
  6. Dumas, C. Economic Impact Analysis of North Carolina’s Commercial Fisheries—Commercial Harvesters Survey; Commercial Fishing Resource Fund Program: Morehead City, NC, USA, 2021. [Google Scholar]
  7. Botta, R.; Court, C.D.; Ropicki, A.; Camp, E.V. Evaluating the Regional Economic Contributions of US Aquaculture: Case Study of Florida’s Shellfish Aquaculture Industry. Aquac. Econ. Manag. 2021, 25, 223–244. [Google Scholar] [CrossRef]
  8. Deisenroth, D.B.; Bond, C.A.; Loomis, J.B. The Economic Contribution of the Private, Recreation-Based Aquaculture Industry in the Western United States. Aquac. Econ. Manag. 2012, 16, 1–21. [Google Scholar] [CrossRef]
  9. National Marine Fisheries Service. Fisheries of the United States, 2022; National Marine Fisheries Service: Silver Spring, MD, USA, 2024. [Google Scholar]
  10. National Restaurant Association Restaurant Economic Insights. 2025. Available online: https://restaurant.org/research-and-media/research/restaurant-economic-insights/economic-indicators/ (accessed on 25 April 2025).
  11. National Retail Federation. The Economic Contribution of the U.S. Retail Industry; National Retail Federation: Washington, DC, USA, 2024. [Google Scholar]
  12. National Restaurant Association. Economic Contributions of the Restaurant & Foodservice Industry—Virginia; National Restaurant Association: Washington, DC, USA, 2024. [Google Scholar]
  13. VMPB About Virginia Seafood. Virginia Marine Products Board. Available online: https://www.virginiaseafood.org/about-virginia-seafood/ (accessed on 5 June 2025).
  14. Virginia Marine Products Board (VMPB). Virginia Seafood Supplier’s Directory. Available online: https://virginiaseafood.org (accessed on 26 February 2024).
  15. NOAA Fisheries. Fisheries One Stop Shop (FOSS); NOAA Fisheries: Silver Spring, MD, USA, 2025. [Google Scholar]
  16. USDA-NASS. 2023 Census of Aquaculture; USDA-NASS: Washington, DC, USA, 2024. [Google Scholar]
  17. Virginia Marine Resources Commission (VMRC). Public Records from the Commercial Fishing License System (CFLS). Requested via VMRC Plans & Statistics Data Request Form 2024. Available online: https://mrc.virginia.gov/ (accessed on 26 February 2024).
  18. IMPLAN Economic Impact Analysis for Planning. Available online: https://implan.com (accessed on 26 February 2024).
  19. Kaliba, A.R.; Engle, C.R. The Economic Impact of the Catfish, Ictalurus Punctatus, Industry on Chicot County, Arkansas. J. Appl. Aquac. 2004, 15, 29–59. [Google Scholar] [CrossRef]
  20. U.S. Bureau of Labor Statistics CPI Inflation Calculator. Available online: https://www.bls.gov/data/inflation_calculator.htm (accessed on 27 May 2025).
  21. Taylor, J.E.; Charlton, D.; Yuńez-Naude, A. The End of Farm Labor Abundance. Appl. Econ. Perspect. Policy 2012, 34, 587–598. [Google Scholar] [CrossRef]
  22. Pascoe, S.; Paredes, S.; Coglan, L. The Indirect Economic Contribution of Fisheries to Coastal Communities through Tourism. Fishes 2023, 8, 138. [Google Scholar] [CrossRef]
  23. Nguyen, L.; Gao, Z.; Anderson, J.L. Regulating Menu Information: What Do Consumers Care and Not Care about at Casual and Fine Dining Restaurants for Seafood Consumption? Food Policy 2022, 110, 102272. [Google Scholar] [CrossRef]
  24. van Senten, J.; Engle, C.R.; Smith, M.A. Effects of COVID-19 on U.S. Aquaculture Farms. Appl. Econ. Perspect. Policy 2021, 43, 355–367. [Google Scholar] [CrossRef]
  25. Landais, E.; Miotto-Plessis, M.; Bene, C.; Maitre D’hotel, E.; Truong, M.T.; Erome, J.; Som, W.; Verger, E.O. Consumption of Food Away from Home in Low- and Middle-Income Countries: A Systematic Scoping Review. Nutr. Rev. 2023, 81, 727–754. [Google Scholar] [CrossRef]
  26. Davis, G.C.; You, W. The Time Cost of Food at Home: General and Food Stamp Participant Profiles. Appl. Econ. 2010, 42, 2537–2552. [Google Scholar] [CrossRef]
  27. Sun, L.; Engle, C.; Kumar, G.; van Senten, J. Retail Market Trends for Seafood in the United States. J. World Aquac. Soc. 2023, 54, 603–624. [Google Scholar] [CrossRef]
  28. Cerar, J.; Nell, P.C.; Reiche, B.S. The Declining Share of Primary Data and the Neglect of the Individual Level in International Business Research. J. Int. Bus. Stud. 2021, 52, 1365–1374. [Google Scholar] [CrossRef]
  29. Watson, P.; Cooke, S.; Kay, D.; Alward, G. A Method for Improving Economic Contribution Studies for Regional Analysis. J. Reg. Anal. Policy 2015, 45, 1–15. [Google Scholar] [CrossRef]
Figure 1. Seafood sales in retail stores in Virginia, adjusted to account for the 80% coverage of the NielsenIQ dataset.
Fishes 10 00373 g001
Table 1. Economic contributions of the Virginia seafood industry in 2023. Values expressed in 2023 USD.
Effect TypeEmploymentLabor IncomeValue-AddedOutput
Direct Effect5224USD 147,679,352USD 811,637,573USD 986,703,783
Indirect Effect580USD 49,215,728USD 82,653,390USD 157,223,744
Induced Effect703USD 41,436,023USD 82,439,558USD 128,479,826
Total Effect6507USD 238,331,103USD 976,730,521USD 1,272,407,353
Table 2. Economic contributions of the Virginia seafood industry activities for each level of the supply chain in 2023. Values expressed in 2023 USD.
Effect TypeEmploymentLabor IncomeValue-AddedOutput
Watermen1820USD 55,926,829USD 186,831,211USD 244,234,108
Direct Effect1571USD 37,890,309USD 153,593,400USD 186,653,808
Indirect Effect84USD 8,319,317USD 13,904,307USD 27,449,670
Induced Effect165USD 9,717,202USD 19,333,504USD 30,130,630
Aquaculture756USD 39,735,750USD 92,114,626USD 175,471,201
Direct419USD 16,526,981USD 50,465,055USD 104,225,000
Indirect219USD 16,240,540USD 27,790,798USD 49,646,603
Induced118USD 6,968,229USD 13,858,773USD 21,599,599
Processors2545USD 90,103,093USD 589,064,589USD 701,403,082
Direct2089USD 56,681,019USD 528,362,990USD 593,261,318
Indirect193USD 17,931,618USD 29,867,880USD 60,091,388
Induced263USD 15,490,456USD 30,833,719USD 48,050,375
Distributors1386USD 52,565,432USD 108,720,095USD 151,298,962
Direct1145USD 36,581,043USD 79,216,128USD 102,563,657
Indirect84USD 6,724,253USD 11,090,405USD 20,036,083
Induced157USD 9,260,136USD 18,413,562USD 28,699,222
Total Effect 6507USD 238,331,104USD 976,730,521USD 1,272,407,353
Table 3. Economic contributions of the Virginia seafood industry to supporting sectors in 2023, ranked by economic output. Values expressed in 2023 USD.
Industry DescriptionEmploymentLabor IncomeValue-AddedOutput
Nondepository credit intermediation and related activities63USD 10,960,448USD 16,524,684 USD 26,891,547
Owner-occupied housing0USD 0 USD 20,408,048USD 23,131,605
Insurance agencies, brokerages, and related activities48USD 4,730,684USD 7,506,122 USD 15,109,213
Commercial and industrial machinery and equipment repair and maintenance60USD 4,742,691USD 5,268,634USD 8,349,706
Polystyrene foam product manufacturing13USD 922,776USD 1,435,925 USD 6,625,427
Hospitals31USD 3,009,601USD 3,660,714 USD 6,436,174
Other real estate32USD 837,226 USD 2,686,566USD 6,142,422
Air conditioning, refrigeration, and warm air heating equipment manufacturing12USD 1,030,657USD 1,831,887 USD 5,631,221
Monetary authorities and depository credit intermediation11USD 1,144,335USD 3,238,249USD 4,770,293
Electric power generation—nuclear4USD 775,067USD 2,687,925USD 4,514,392
Water, sewage and other systems16USD 1,935,320USD 2,873,537 USD 4,506,452
Other animal food manufacturing3USD 204,154USD 735,925 USD 4,330,616
Electric power generation—fossil fuel2USD 395,652USD 2,376,040 USD 4,275,647
Data processing, hosting, and related services11USD 1,605,346USD 2,554,180USD 4,270,775
Limited-service restaurants38USD 1,070,505USD 1,980,938 USD 4,230,234
All other industries *6164USD 216,534,169USD 920,282,285USD 1,143,191,628
Indirect and induced impact1284USD 90,651,751USD 165,092,947USD 285,703,570
* Include commercial fishing, seafood product preparation and packaging, truck transportation, and animal production, except for cattle, poultry, and eggs.
Table 4. Tax revenue generation by the Virginia seafood industry activities in 2023. Values expressed in 2023 USD.
Tax CategoryWatermenAquacultureProcessorsDistributorsTotal
Local tax *USD 9,556,157USD 7,927,187USD 17,931,200USD 4,130,964USD 39,545,508
State taxUSD 9,893,745USD 6,958,179USD 23,149,663USD 5,024,333USD 45,025,921
Federal taxUSD 16,832,195USD 9,884,516USD 40,780,367USD 12,374,080USD 79,871,159
Total tax USD 36,282,098USD 24,769,882USD 81,861,230USD 21,529,378USD 164,442,588
* Includes sub-county general, sub-county special districts, and county-level.
Table 5. Economic contributions of Virginia seafood products from retail stores and restaurants in 2023. Values expressed in 2023 USD.
Effect TypeEmploymentLabor IncomeValue-AddedOutput
Retail stores2111USD 76,422,996USD 168,835,178USD 225,826,595
Direct1509USD 56,579,779USD 112,994,846USD 154,926,269
Indirect378USD 6,684,900USD 29,650,432USD 30,086,372
Induced224USD 13,158,317USD 26,189,900USD 40,813,954
Full-service restaurants839USD 32,847,343USD 59,387,211USD 117,233,380
Direct638USD 20,683,835USD 34,448,612USD 61,889,727
Indirect105USD 6,511,627USD 13,688,960USD 37,812,450
Induced96USD 5,651,881USD 11,249,639USD 17,531,203
Limited-service restaurants686USD 25,156,361USD 48,908,633USD 108,605,469
Direct500USD 13,899,236USD 25,720,127USD 54,924,579
Indirect112USD 6,925,137USD 14,566,300USD 40,244,162
Induced74USD 4,331,989USD 8,622,206USD 13,436,728
All other food and drink places53USD 2,277,731USD 3,741,194USD 6,377,802
Direct42USD 1,606,615USD 2,376,150USD 3,547,371
Indirect5USD 279,538USD 585,611USD 1,615,783
Induced7USD 391,578USD 779,434USD 1,214,648
Total Effect 3689USD 136,704,431USD 280,872,216USD 458,043,246
Table 6. Economic impact on supporting sectors of Virginia seafood sales from retail stores in 2023, ranked by output. Values expressed in 2023 USD.
Industry DescriptionEmploymentLabor IncomeValue-AddedOutput
Commercial fishing375USD 6,491,199USD 29,314,842USD 29,486,185
Owner-occupied housing0USD 0USD 4,916,955USD 5,573,148
Hospitals10USD 956,558USD 1,163,505USD 2,045,645
Other real estate7USD 188,862USD 606,038USD 1,385,613
Offices of physicians8USD 927,039USD 893,940USD 1,340,134
Limited-service restaurants12USD 334,060USD 618,169USD 1,320,081
Full-service restaurants12USD 385,149USD 641,461USD 1,152,436
Retail—motor vehicle and parts dealers4USD 307,255USD 661,985USD 892,832
Monetary authorities and depository credit intermediation2USD 213,865USD 605,197USD 891,521
Tenant-occupied housing2USD 55,907USD 818,076USD 873,720
Insurance carriers, except direct life2USD 146,757USD 331,959USD 752,491
Other financial investment activities4USD 169,204USD 189,593USD 721,819
Management of companies and enterprises2USD 405,793USD 490,405USD 712,562
Data processing, hosting, and related services2USD 248,784USD 395,827USD 661,851
Retail—general merchandise stores7USD 252,091USD 451,309USD 643,582
All other industries *1,662USD 65,340,471USD 126,735,919USD 177,372,975
Indirect and induced impact602USD 19,843,217 USD 55,840,332 USD 70,900,326
* Include the industry retail—food and beverage stores.
Table 7. Economic impact on supporting sectors of Virginia seafood purchases from restaurants in 2023, ranked by output. Values expressed in 2023 USD.
Industry DescriptionEmploymentLabor IncomeValue-AddedOutput
Seafood product preparation and packaging96USD 6,381,887USD 15,444,137USD 58,632,059
Owner-occupied housing0USD 0USD 3,876,547USD 4,393,892
Truck transportation15USD 1,059,540USD 1,471,975USD 3,189,140
Commercial fishing38USD 660,334USD 2,982,128USD 2,999,558
Management of companies and enterprises10USD 1,653,477USD 1,998,244USD 2,903,461
Wholesale—Grocery and related product wholesalers10USD 806,651USD 1,583,546USD 2,789,933
Other real estate9USD 230,064USD 738,250USD 1,687,896
Hospitals8USD 754,279USD 917,464USD 1,613,061
Offices of physicians6USD 731,015USD 704,915USD 1,056,760
Monetary authorities and depository credit intermediation2USD 238,711USD 675,507USD 995,095
Insurance agencies, brokerages, and related activities3USD 290,027USD 460,183USD 926,311
Electric power transmission and distribution1USD 95,115USD 414,456USD 855,397
Data processing, hosting, and related services2USD 297,625USD 473,536USD 791,786
Insurance carriers, except direct life2USD 151,231USD 342,078USD 775,428
Retail—Motor vehicle and parts dealers3USD 247,375USD 532,973USD 718,832
All other industries *1524USD 46,684,106USD 79,421,099USD 147,888,041
Indirect and induced impact398USD 24,091,749USD 49,492,149USD 111,854,973
* Include full-service restaurants, limited-service restaurants, and other food and drink places.
Table 8. Tax revenue generation by Virginia seafood products from retail stores and restaurants, 2023. Values expressed in 2023 USD.
Tax
Category
Retail
Stores
Full-Service RestaurantsLimited-Service RestaurantsAll Other Food and Drink PlacesTotal
Local tax *USD 14,418,608 USD 3,391,512 USD 3,395,179 USD 187,739 USD 21,393,038
State taxUSD 12,592,431 USD 3,410,165 USD 3,175,719 USD 199,436 USD 19,377,751
Federal taxUSD 19,458,058 USD 7,792,721 USD 6,107,644 USD 524,640 USD 33,883,063
Total tax USD 46,469,097 USD 14,594,398 USD 12,678,542 USD 911,816 USD 74,653,853
* Includes sub-county general, sub-county special districts, and county-level.
Disclaimer/Publisher’s Note: The statements, opinions and data contained in all publications are solely those of the individual author(s) and contributor(s) and not of MDPI and/or the editor(s). MDPI and/or the editor(s) disclaim responsibility for any injury to people or property resulting from any ideas, methods, instructions or products referred to in the content.

