Article

Spatial–Seasonal Shifts in Phytoplankton and Zooplankton Community Structure Within a Subtropical Plateau Lake: Interplay with Environmental Drivers During Rainy and Dry Seasons

1
School of Environment and Surveying Engineering, Suzhou University, Suzhou 234000, China
2
Institute of Hydrobiology, Chinese Academy of Sciences, Wuhan 430072, China
3
Kunming Dianchi & Plateau Lakes Institute, Kunming 650000, China
*
Author to whom correspondence should be addressed.
Fishes 2025, 10(7), 343; https://doi.org/10.3390/fishes10070343
Submission received: 16 June 2025 / Revised: 8 July 2025 / Accepted: 8 July 2025 / Published: 11 July 2025
(This article belongs to the Section Biology and Ecology)

Abstract

Subtropical plateau lakes, which are distinguished by their elevated altitudes and subtropical climates, display distinct ecological dynamics. Nevertheless, the spatial and seasonal variations in the plankton community structure, as well as their interactions with environmental factors, remain inadequately understood. This study investigated the alterations in the phytoplankton and zooplankton community structure across different geographical regions (southern, central, and northern) and seasonal periods (rainy and dry) in Erhai lake, located in a subtropical plateau in China. The results indicated that the average values of total nitrogen (TN), total phosphorus (TP), chlorophyll-a (Chla), pH, and conductivity are significantly higher during the rainy season in comparison to the dry season. Furthermore, during the rainy season, there were significant differences in the concentrations of TN, TP, and Chla among the three designated water areas. Notable differences were also observed in the distribution of Microcystis, the density of Cladocera and copepods, and the biomass of copepods across the three regions during this season. Conversely, in the dry season, only the biomass of Cladocera exhibited significant variation among the three water areas. The redundancy analysis (RDA) and variance partitioning analysis demonstrated that the distribution of plankton groups (Cyanophyta, Cryptophyta, and Cladocera) is significantly associated with TN, Secchi depth (SD), and Chla during the rainy season, whereas it is significantly correlated with TP and SD during the dry season. These findings underscore the critical influence of environmental factors, shaped by rainfall patterns, in driving these ecological changes. In the context of the early stages of eutrophication in Lake Erhai, it is essential to ascertain the spatial distribution of water quality parameters, as well as phytoplankton and zooplankton density and biomass, during both the rainy and dry seasons.
Key Contribution: These findings are crucial for understanding how environmental changes impact lake ecosystems and can guide strategies for managing and protecting water quality in subtropical plateau lakes.

1. Introduction

Understanding the spatial and seasonal dynamics of phytoplankton and zooplankton communities and their interactions with environmental factors is essential for elucidating the ecological functioning of aquatic ecosystems [1,2,3]. Phytoplankton and zooplankton constitute a vital functional component within these ecosystems, significantly contributing to material cycling and energy flow in food webs [4,5,6,7,8]. The complexity and diversity of these two plankton communities are essential for sustaining the integrity of ecosystem functions [9]. As key groups in aquatic environments, the community structure, abundance, and succession of phytoplankton and zooplankton are highly sensitive to environmental variables. This sensitivity allows them to serve as effective indicators of the health status of aquatic ecosystems and fluctuations in water quality [10,11]. Prior research has established that both abiotic factors such as light, temperature, inorganic nutrients (including nitrogen, phosphate, silicate, and iron), rainfall, and hydrological connectivity and biotic factors (e.g., predation by planktivorous fish), can significantly affect the growth and community succession of phytoplankton and zooplankton [12,13,14,15,16]. Consequently, it is imperative to understand the characteristics of the phytoplankton and zooplankton community structure and its relationship with environmental factors to enhance water management practices and promote biodiversity conservation in lakes (and reservoirs).
The spatial distribution of phytoplankton and zooplankton communities in lacustrine environments exhibits considerable variability, influenced by factors such as water depth, light availability, and nutrient gradients [17,18,19,20,21]. These spatial discrepancies, in conjunction with seasonal environmental fluctuations, establish distinct ecological niches for various plankton taxa [22,23]. For example, during the rainy season, heightened precipitation results in increased nutrient influx from terrestrial runoff, which can have differential impacts on phytoplankton proliferation across different regions of the lake [24]. In contrast, the dry season, characterized by diminished water levels and enhanced light penetration, may favor certain zooplankton communities due to changes in food availability and predation dynamics [25,26]. Prior research has underscored the necessity of examining both spatial and temporal dimensions when investigating the dynamics of phytoplankton and zooplankton communities [27,28]. In subtropical plateau lakes, which are marked by significant spatial heterogeneity and seasonal variations in precipitation and temperature, the dynamics of phytoplankton and zooplankton communities are particularly intricate and shaped by a multitude of environmental factors [29,30,31]. Nevertheless, research on the spatial–seasonal dynamics of plankton in these lakes, which feature a unique combination of high altitude and subtropical climate, remains relatively scarce [29,32]. These lakes frequently experience substantial anthropogenic pressures, including nutrient loading from agricultural practices and urban development, which further exacerbate the dynamic complexity of phytoplankton and zooplankton across both spatial and temporal scales [33,34].
Lake Erhai, situated in Yunnan Province, China, is recognized as the second-largest plateau freshwater lake in the region. Due to its diverse functions, this lake is vulnerable to agricultural non-point source pollution. When pollutants enter it through seepage, runoff, etc., eutrophication will occur if the nitrogen and phosphorus levels in the water exceed standards and the water temperature is suitable [35,36]. Furthermore, Lake Erhai is characterized by a distinct separation between its dry and rainy seasons, leading to significant variations in the physical and chemical conditions associated with rainfall, which may impact cyanobacterial dynamics [37,38]. Although cyanobacterial blooms are prevalent in the eutrophic waters of Lake Erhai in summer and autumn [39], the spatial and seasonal variations in planktonic community structure during the wet and dry seasons in subtropical highland lakes, as well as their interactions with environmental drivers, remain inadequately understood.
The primary aim of this research is to conduct a thorough examination of the spatial and seasonal dynamics of the plankton community within a subtropical plateau lake. This study seeks to clarify the intricate relationships among plankton abundance, diversity, and environmental variables across the southern, central, and northern regions during both the rainy and dry seasons. Through this investigation, we aspire to enhance the understanding of the ecological processes that regulate plankton dynamics in these distinctive ecosystems and to offer significant insights into lake management and the conservation of lake environments.

2. Materials and Methods

2.1. Study Area

Lake Erhai, situated in Yunnan Province in southwestern China (coordinates: 25°35′–58′ N, 100°05′–17′ E, at an elevation of 1966 m), is a freshwater lake on a plateau that is presently experiencing the initial phases of eutrophication [40]. It is part of the Lancang watershed, which encompasses an area of 2565 km2, receives an annual precipitation of 1048 mm, and possesses a water volume of 27.7 billion m3. The lake encompasses a surface area of 251 km2 (Figure 1), and the region is characterized by a subtropical monsoon climate with an average annual temperature of 15.0 °C. Additionally, it has a mean depth of 10.5 m and a maximum depth of 20.9 m.
The northern section of Lake Erhai is predominantly nourished by the Mi-Ju River, Luo-Shi River, and Yong-an River, which are collectively referred to as the “Northern Three Rivers” hydrological system. The western boundary is characterized by 18 mountain stream-type rivers that run to the lake, collectively known as the “Cang-Shan Eighteen Streams” water hydrological system. These streams traverse densely populated villages, exhibit short flow lengths, and transport relatively modest volumes of water [41,42]. In the southern area, the Bo-Luo River and its tributary, the Bai-ta River, are the primary waterways. These rivers flow through regions undergoing rapid urbanization and are experiencing a shift from traditional agricultural pollution sources, such as farming and livestock rearing, to urban surface pollution [43].
The “Northern Three Rivers” water system is sourced from mountainous vegetation and traverses an extended route. Prior to its entry into the lake, it flows through three dam regions located in low-lying areas that are surrounded by mountainous vegetation, which constitutes between 42% and 56% of the overall vegetation cover. In contrast, the “Cang-Shan Eighteen Streams” water system also originates from mountain vegetation but reaches the lake through a buffer zone situated downstream of the Cang-Shan dams. This particular area is characterized by a higher degree of development, with construction land representing an average of 13% of the total land area [44].

2.2. Sampling Methods

Monthly sampling in Lake Erhai was performed utilizing a 5 L modified Patalas bottle sampler during both the rainy season (from May 2016 to October 2016) and the dry season (from November 2016 to April 2017). A total of nine sampling stations were established throughout the lake (Figure 1), with three stations situated in the northern region (E1–E3), three in the central region (E4–E6), and three in the southern region (E7–E9) [45] (Figure 1).
Water samples were collected from three distinct depths at each site: the upper layer (0.5 m below the water surface), the middle layer (midway between the surface and the bottom), and the lower layer (0.5 m above the sediment surface). These samples were subsequently combined for the analysis of physicochemical parameters and plankton communities [46]. The water quality was assessed through the measurement of various indicators, including dissolved oxygen (DO), pH, transparency (SD), chlorophyll-a (Chla) concentration, and nutrient parameters. The nutrient parameters analyzed included total nitrogen (TN), dissolved inorganic nitrogen (DIN), total phosphorus (TP), and soluble reactive phosphorus (SRP), as well as specific nitrogen forms such as ammonia-N (NH4+) and nitrate (NO3), in accordance with the methodologies outlined in [47]. Chlorophyll-a concentration was determined using a spectrophotometer as per the procedures described in [47]. Dissolved oxygen (DO), conductivity (Cond), and pH values were measured using a YSI Professional Plus (YSI Inc., Yellow Springs, OH, USA). Water transparency was assessed using a 20 cm diameter Secchi’s disk, and results were expressed as Secchi’s depth (SD).
A total of 50 mL of quantitative crustacean samples was obtained by filtering 10 L of integrated water samples through a 25# (69 μm) plankton net, followed by fixation with 1 mL of saturated formalin. Additionally, 1 L water samples were collected at each sampling site. These water samples were preserved in situ with 10–15 mL of 1.5% Lugol’s iodine solution and then transported to the laboratory. The water samples were poured into sedimentation vessels and allowed to stand for 24–48 h to enable the phytoplankton to settle. Subsequently, the upper algae-free supernatant was carefully drawn off, leaving approximately 50 mL of bottom sediment for phytoplankton analysis [48]. In the quantitative analysis of phytoplankton and zooplankton samples, the image recording equipment typically consists of a microscope-mounted digital camera, the Olympus DP74 (Olympus Corporation, Tokyo, Japan). This system is connected to the Olympus compound microscope (model BH2-RFC; Olympus America, Inc., Melville, NY, USA) and used to capture high-resolution microscopic images to assist in species identification and enumeration. Phytoplankton in 0.1 mL samples were counted and measured under a 400× magnification using an Olympus compound to calculate their density and biomass. The phytoplankton were identified to the genus (or species) level. Among them, Microcystis is one of the most common cyanobacteria in Lake Erhai and the dominant species in the lake’s algal blooms. Therefore, the cell density and biomass of Microcystis were calculated separately. The zooplankton in 0.1 mL samples were counted and measured under a 40× magnification to calculate the density and biomass of each zooplankton species [15,49]. The identification of copepods (zooplankton) and cladocerans (zooplankton) was conducted based on the aforementioned references.

2.3. Data Analysis

The data collected from sampling stations E1 to E3 were averaged to represent the northern region of the lake, while the averages from stations E4 to E6 were utilized to characterize the central region, and the averages from stations E7 to E9 were indicative of the southern region. Significant differences in the values of various indicators across different seasons (factor 1) and among the three regions (factor 2) were assessed using a general linear model with a multivariate analysis of variance (ANOVA), followed by a least significant difference (LSD) post hoc test. The results are presented as means ± standard error (STDVE), with differences deemed statistically significant at p < 0.05, incorporating Bonferroni adjustments. The aforementioned statistical analyses were conducted using SPSS (Statistical Product and Service Solutions, IBM Inc., Armonk, NY, USA) version 22.0 for Windows, while statistical figures were generated using R version 4.3.2 (R Development Core Team, Vienna, Austria, 2020).
Principal component analysis (PCA) was performed on the water physicochemical dataset of water using the R packages “FactoMineR” and “factoextra”. PCA serves to convert a multivariate dataset into a new format that enhances interpretability [50]. The contribution of each variable to the variability of a specific principal component is illustrated through percentages represented in various colors, with higher contribution values indicating a more substantial influence of the variable on that component. In the analysis of individual principal components, those individuals with significant contributions are highlighted in orange.
To explore the relationships and effects of environmental variables on plankton communities in Erhai Lake across different seasons and water areas, redundancy analysis (RDA) was conducted utilizing the R software packages “vegan”, “plyr”, “ggplot2”, “ggrepel”, and “colorspace”. Prior to conducting the analysis, all species data and other environmental variables, with the exception of pH, were transformed using the log10 (x + 1) function to satisfy the assumptions of normal distribution. Variance partitioning analysis was employed to clarify the relative importance of environmental factors in shaping the plankton community. This study specifically utilized variance partitioning to estimate the percentage contribution of individual predictors, such as total nitrogen (TN) or total phosphorus (TP), to the explained variance in plankton biomass. All statistical analyses were executed using R 4.3.2.

3. Results

3.1. Variations in Water Quality and Environmental Factors

The mean values for all physical and chemical indicators measured during the rainy and dry seasons across different areas are presented in Table 1. During the rainy season, the average concentrations of total nitrogen (TN), total phosphorus (TP), and chlorophyll-a (Chla) were recorded as 0.68 ± 0.03 mg/L, 0.04 ± 0.001 mg/L, and 20.16 ± 1.52 μg/L, respectively. Conversely, during the dry season, these average concentrations were 0.53 ± 0.03 mg/L, 0.03 ± 0.001 mg/L, and 12.9 ± 0.86 μg/L, respectively.
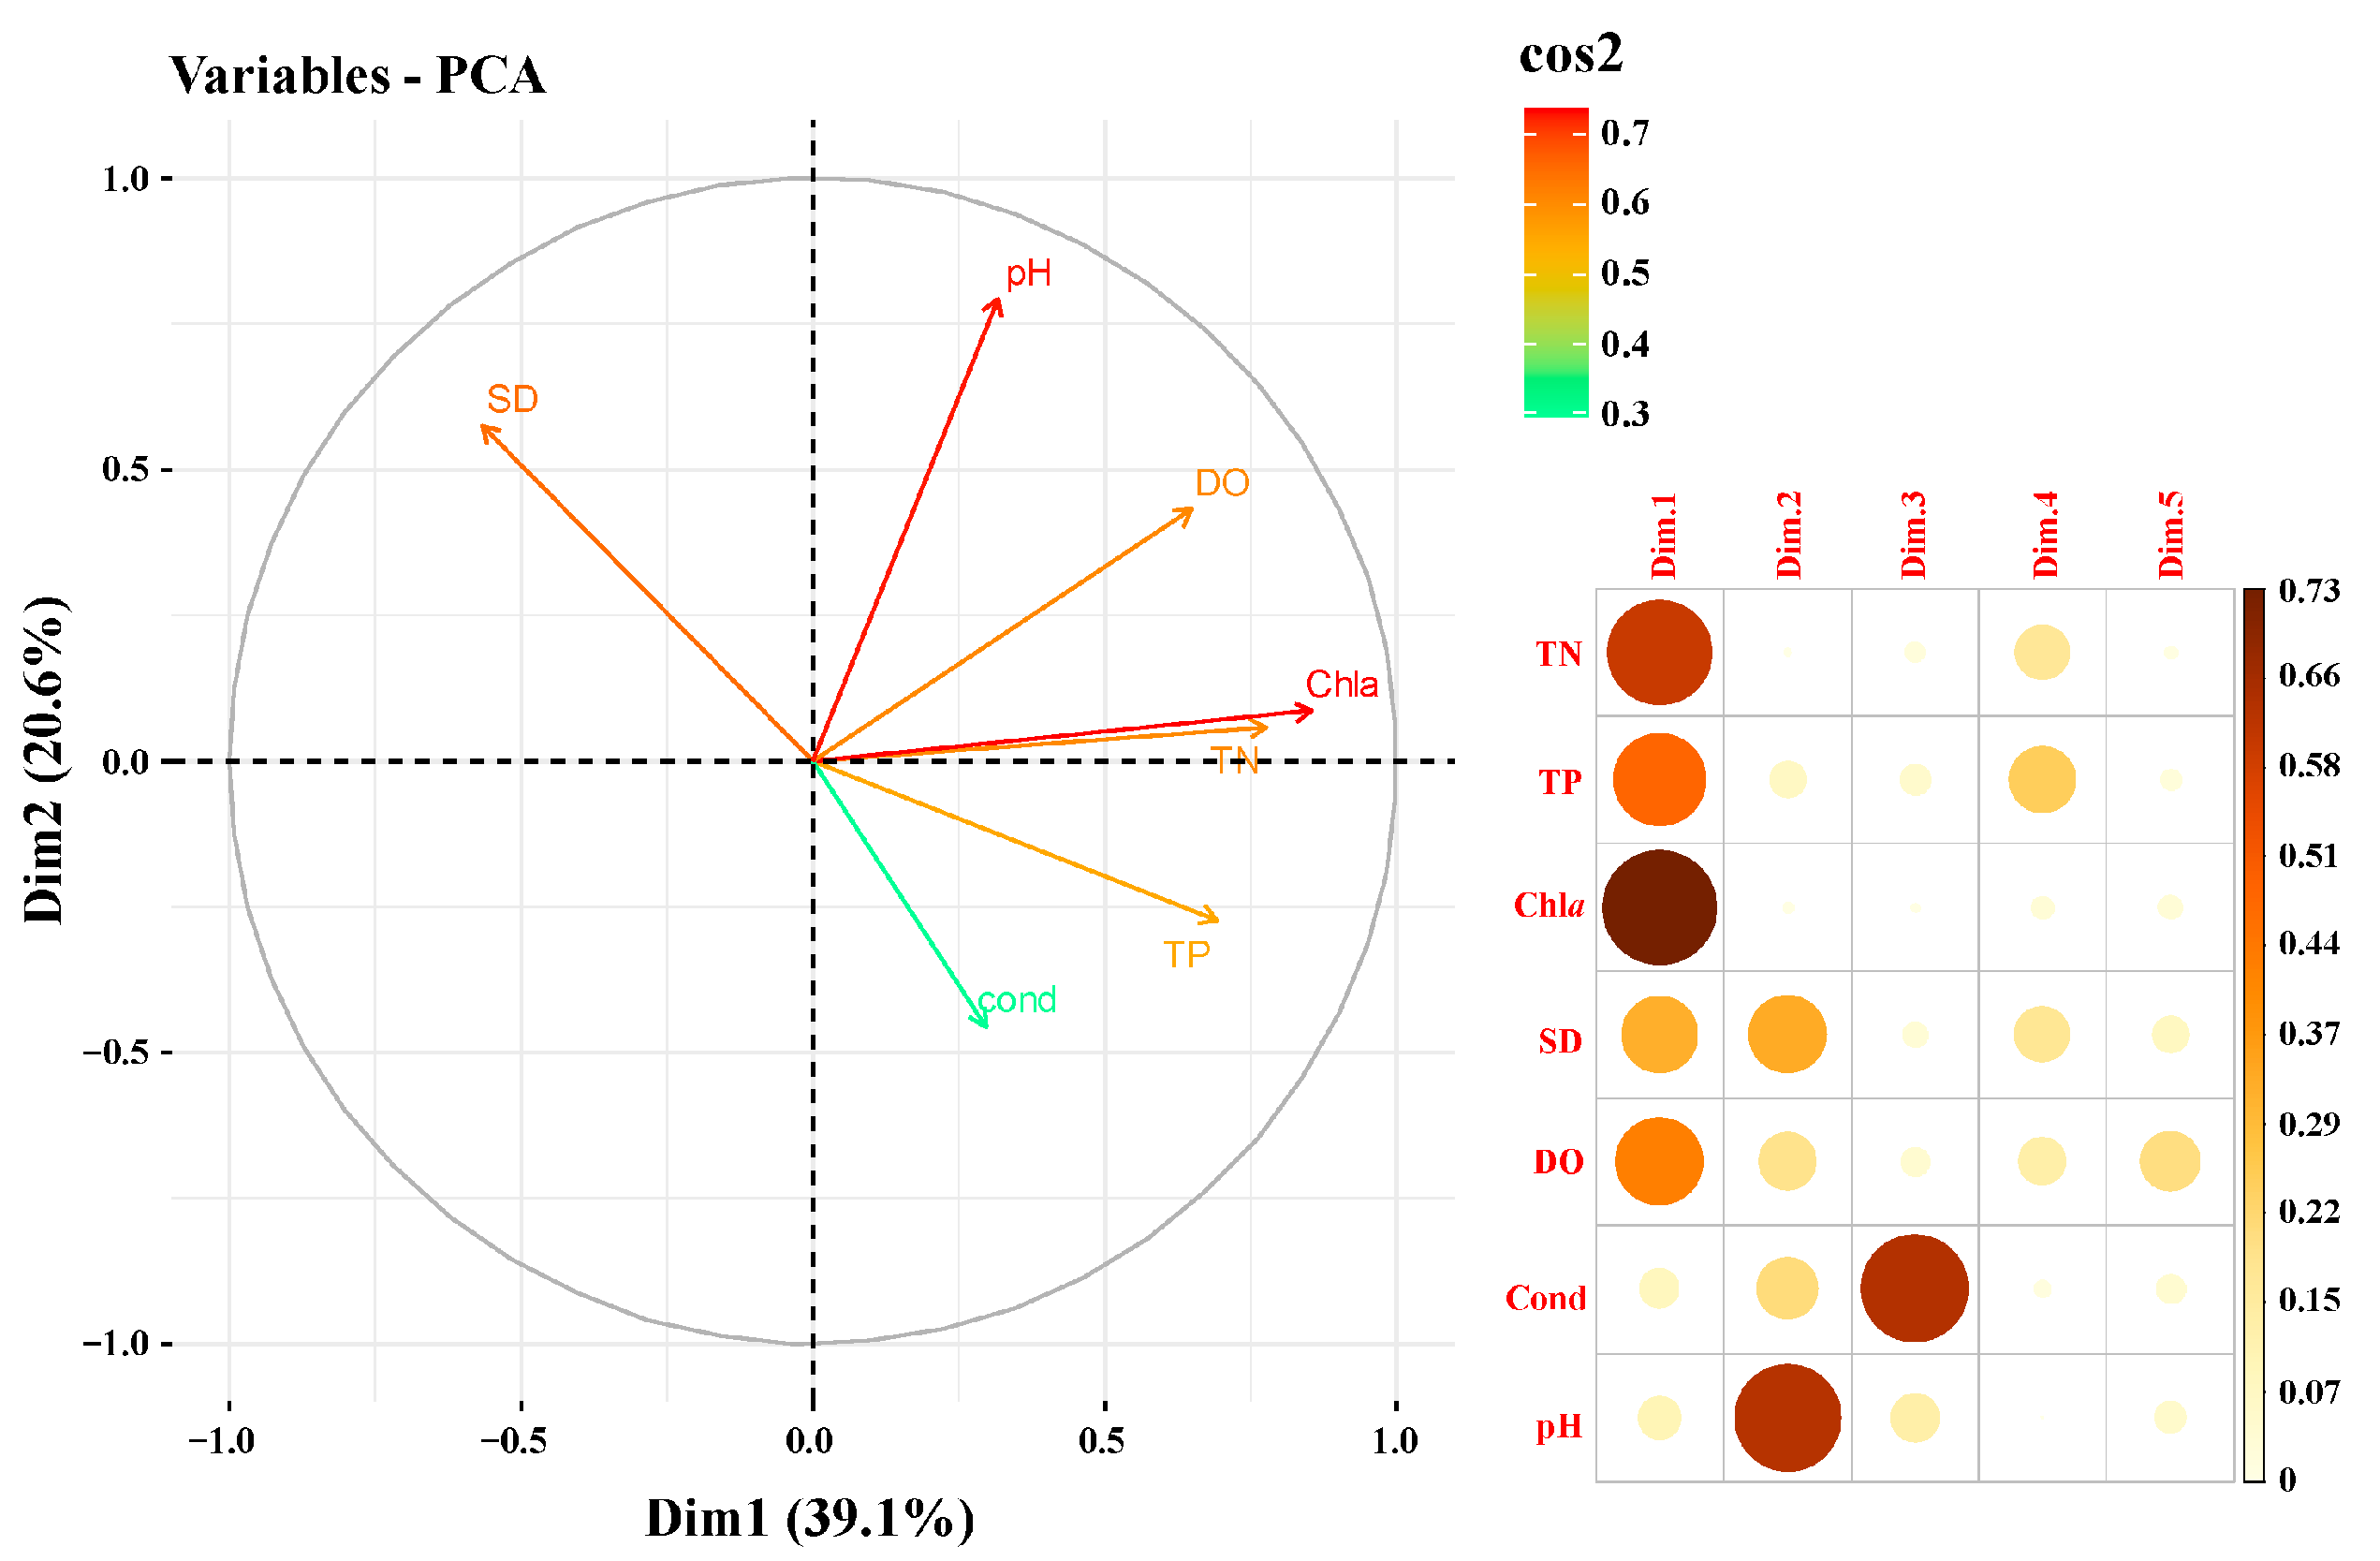
The findings from the principal component analysis (PCA) conducted on various environmental factors in Lake Erhai are illustrated in Figure 2. The degree of contribution of each variable is visually indicated by the intensity of the red coloration in the figure. The analysis reveals, for the first principal component (Dim1), that TN, TP, Chla, SD, and DO were the predominant variables with significant contributions. In contrast, the second principal component (Dim2) was primarily influenced by pH and SD, with DO and conductivity (Cond) also contributing notably.
During the entire period from May 2016 to April 2017, the average concentration of total nitrogen in the northern region was significantly higher than that observed in the central and southern regions during the rainy season (p < 0.05, Figure 3). Conversely, no significant differences were detected between the northern and southern regions during the dry season (p > 0.05, Figure 3). Additionally, during the rainy season, the concentrations of total phosphorus (p < 0.05) and Chla (p < 0.05) in the northern region were significantly higher than those the southern region; however, there was no significant difference in total phosphorus (p > 0.05) and Chla (p > 0.05) concentrations found among the three regions during the rainy season. Furthermore, while the values for SD (p < 0.05), pH (p < 0.05), and conductivity (p < 0.05) during the rainy season were significantly different from those in the dry season, no significant variations were observed among the northern, central, and southern regions. Overall, there were no significant variations in the DO during the dry and rainy season (p > 0.05); however, the total nitrogen, total phosphorus, chlorophyll-a, conductivity, and pH values exhibited significant differences between the two seasons (p < 0.05).

3.2. Spatial Distribution Differences of Plankton Density and Biomass in Rainy and Dry Seasons

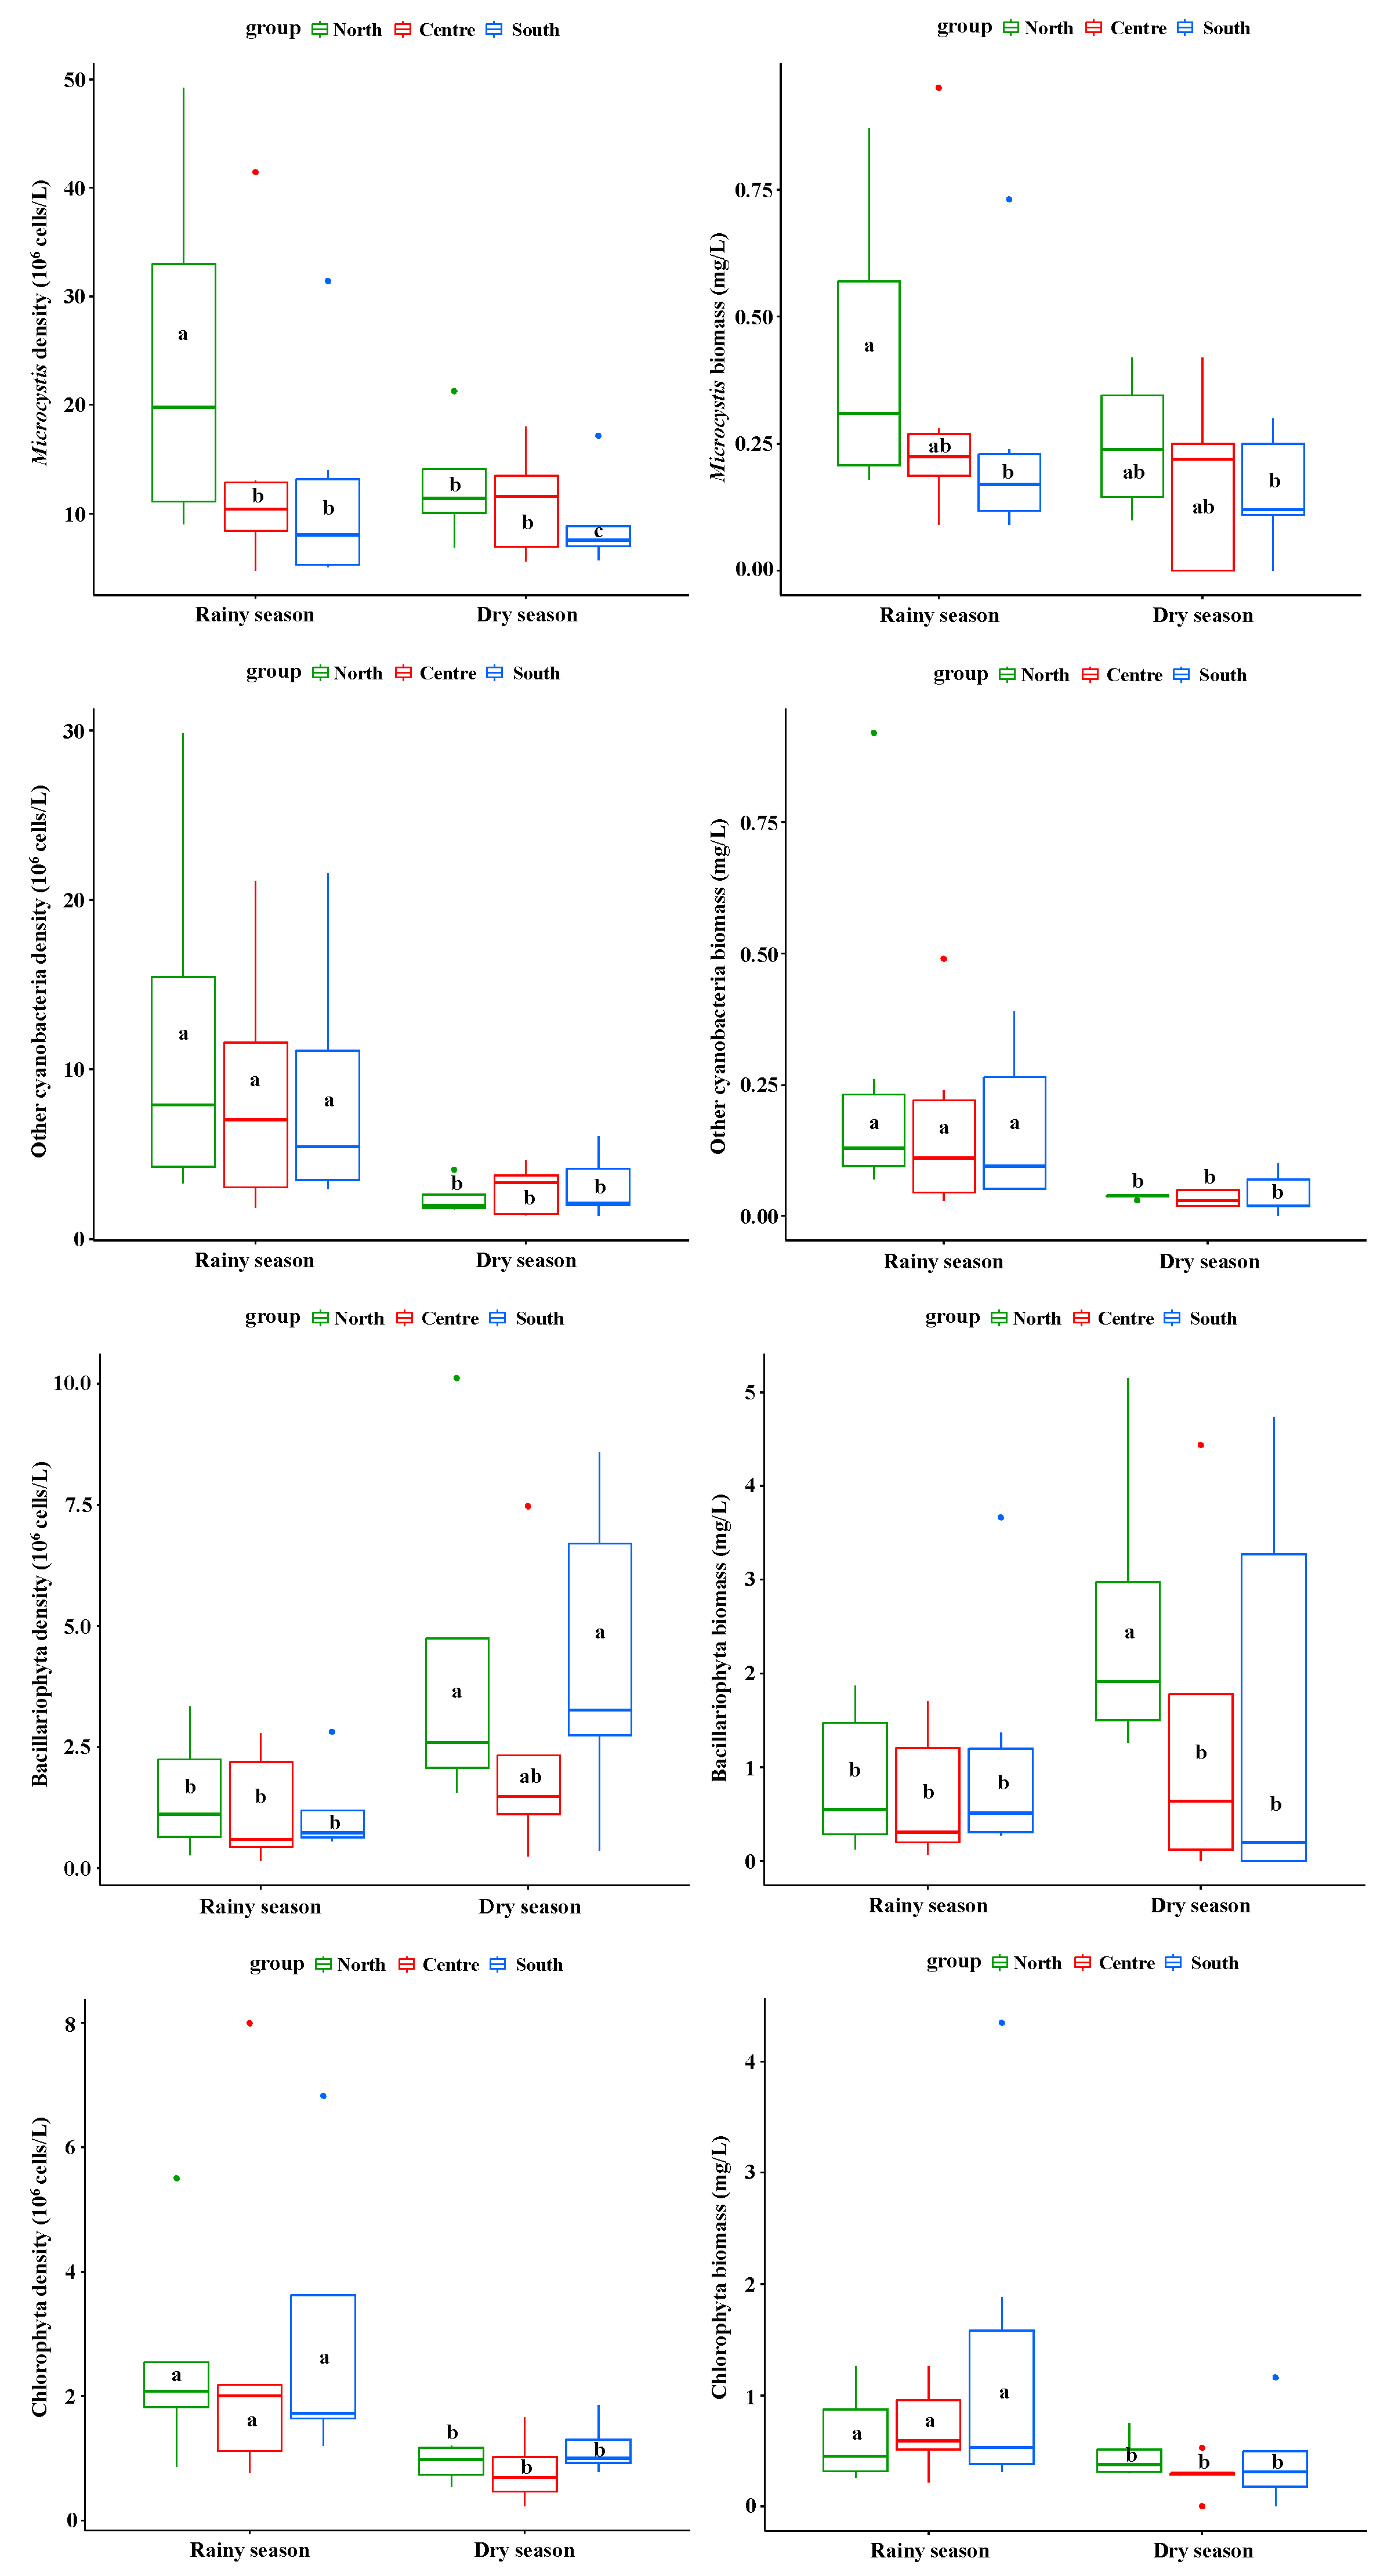
During the rainy season, the density of Microcystis in the northern region was found to be significantly greater than that observed in the central and southern regions (p < 0.05, Figure 4). Conversely, in the dry season, the density of Microcystis in the southern area was significantly lower than that in both the central and northern regions (p < 0.05, Figure 4). Furthermore, the ANOVA tests also revealed that the density and biomass of other cyanobacteria, as well as the density of chlorophyta and Bacillariophyta, exhibited significant variations between the rainy and dry seasons (p < 0.05). Notably, during the dry season, the biomass of Bacillariophyta was significantly higher in the northern region compared to in the central and southern regions (p <0.05). However, no significant differences were observed in the biomass of Microcystis and chlorophyta between the rainy and dry seasons (p > 0.05).
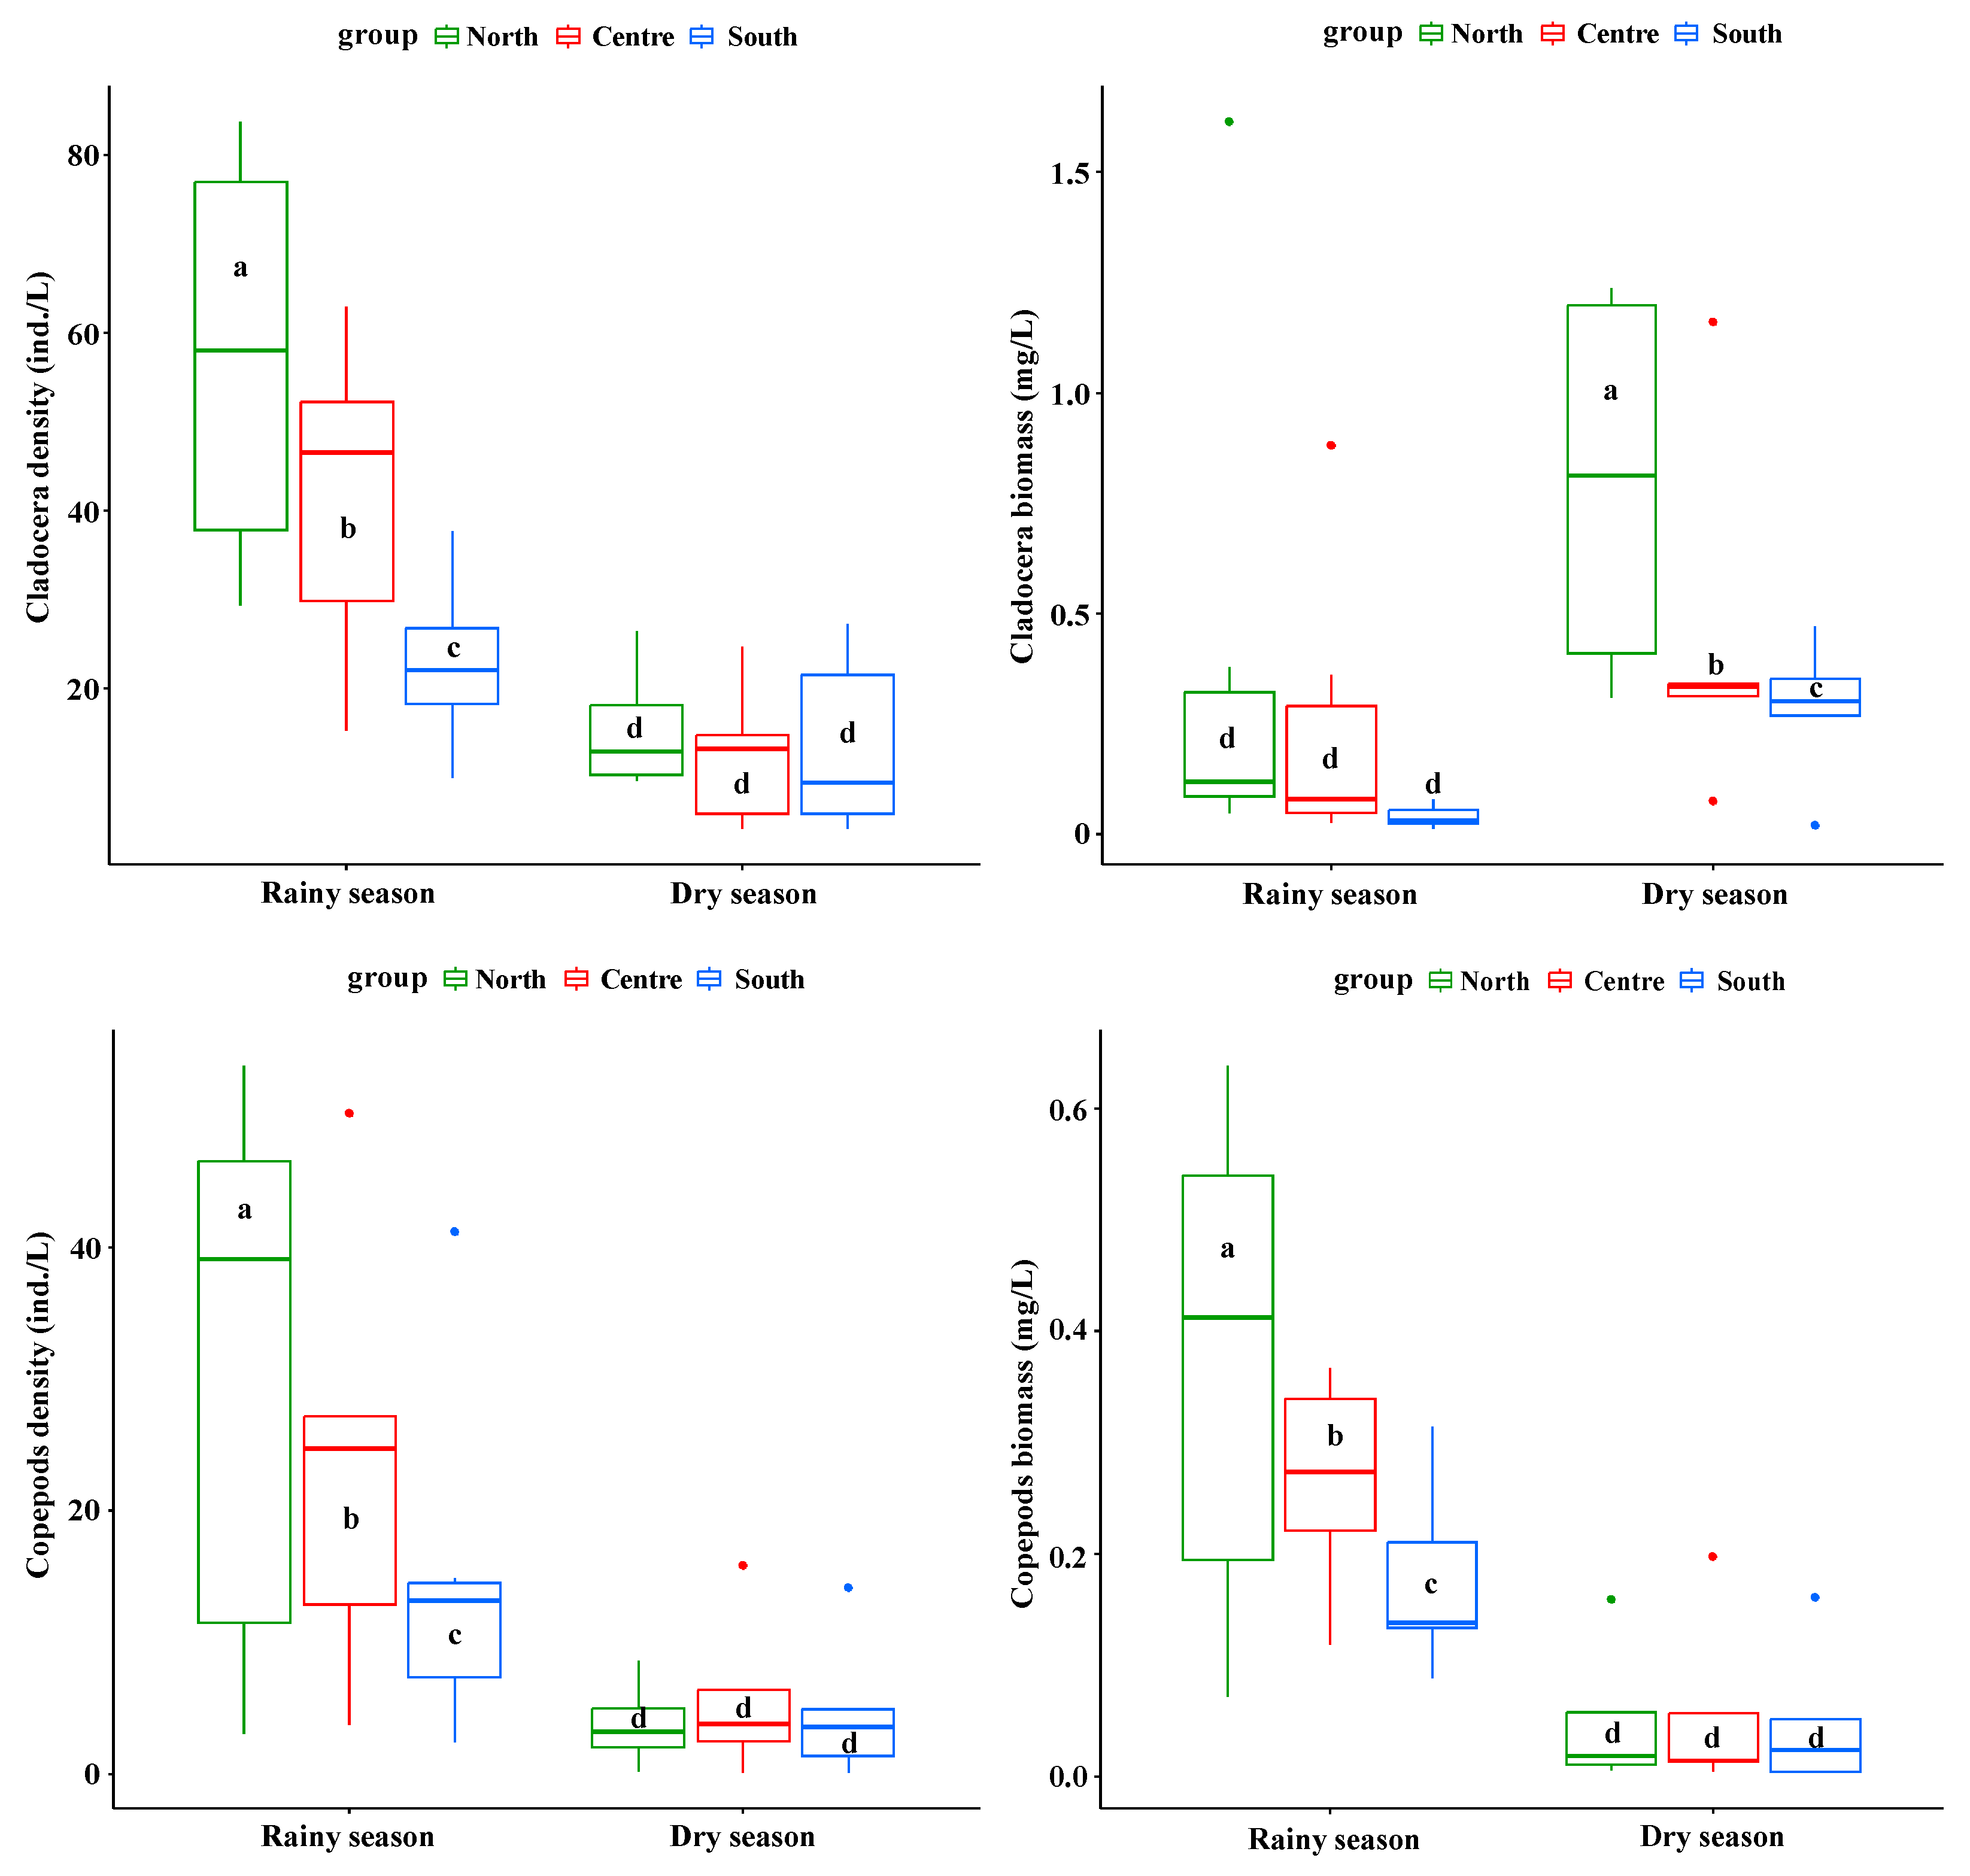
The research findings regarding the density of Cladocera and copepods, as well as the biomass of copepods, reveal that during the rainy season, the densities in the northern region are markedly higher than those in the central region, which are in turn significantly higher than those in the southern region (p < 0.05, Figure 5). Conversely, during the dry season, no significant differences are observed among the three regions (p > 0.05). Additionally, the data concerning the density and biomass of Cladocera indicate that the density of Cladocera is elevated significantly higher during the rainy season compared to the dry season, whereas the biomass of Cladocera is significantly reduced in the rainy season relative to the dry season (p < 0.05). These results imply that small-sized Cladocera are more prevalent during the rainy season, while large-sized Cladocera are predominantly found during the dry season.

3.3. The Relationship Between Plankton Biomass and Environmental Factors

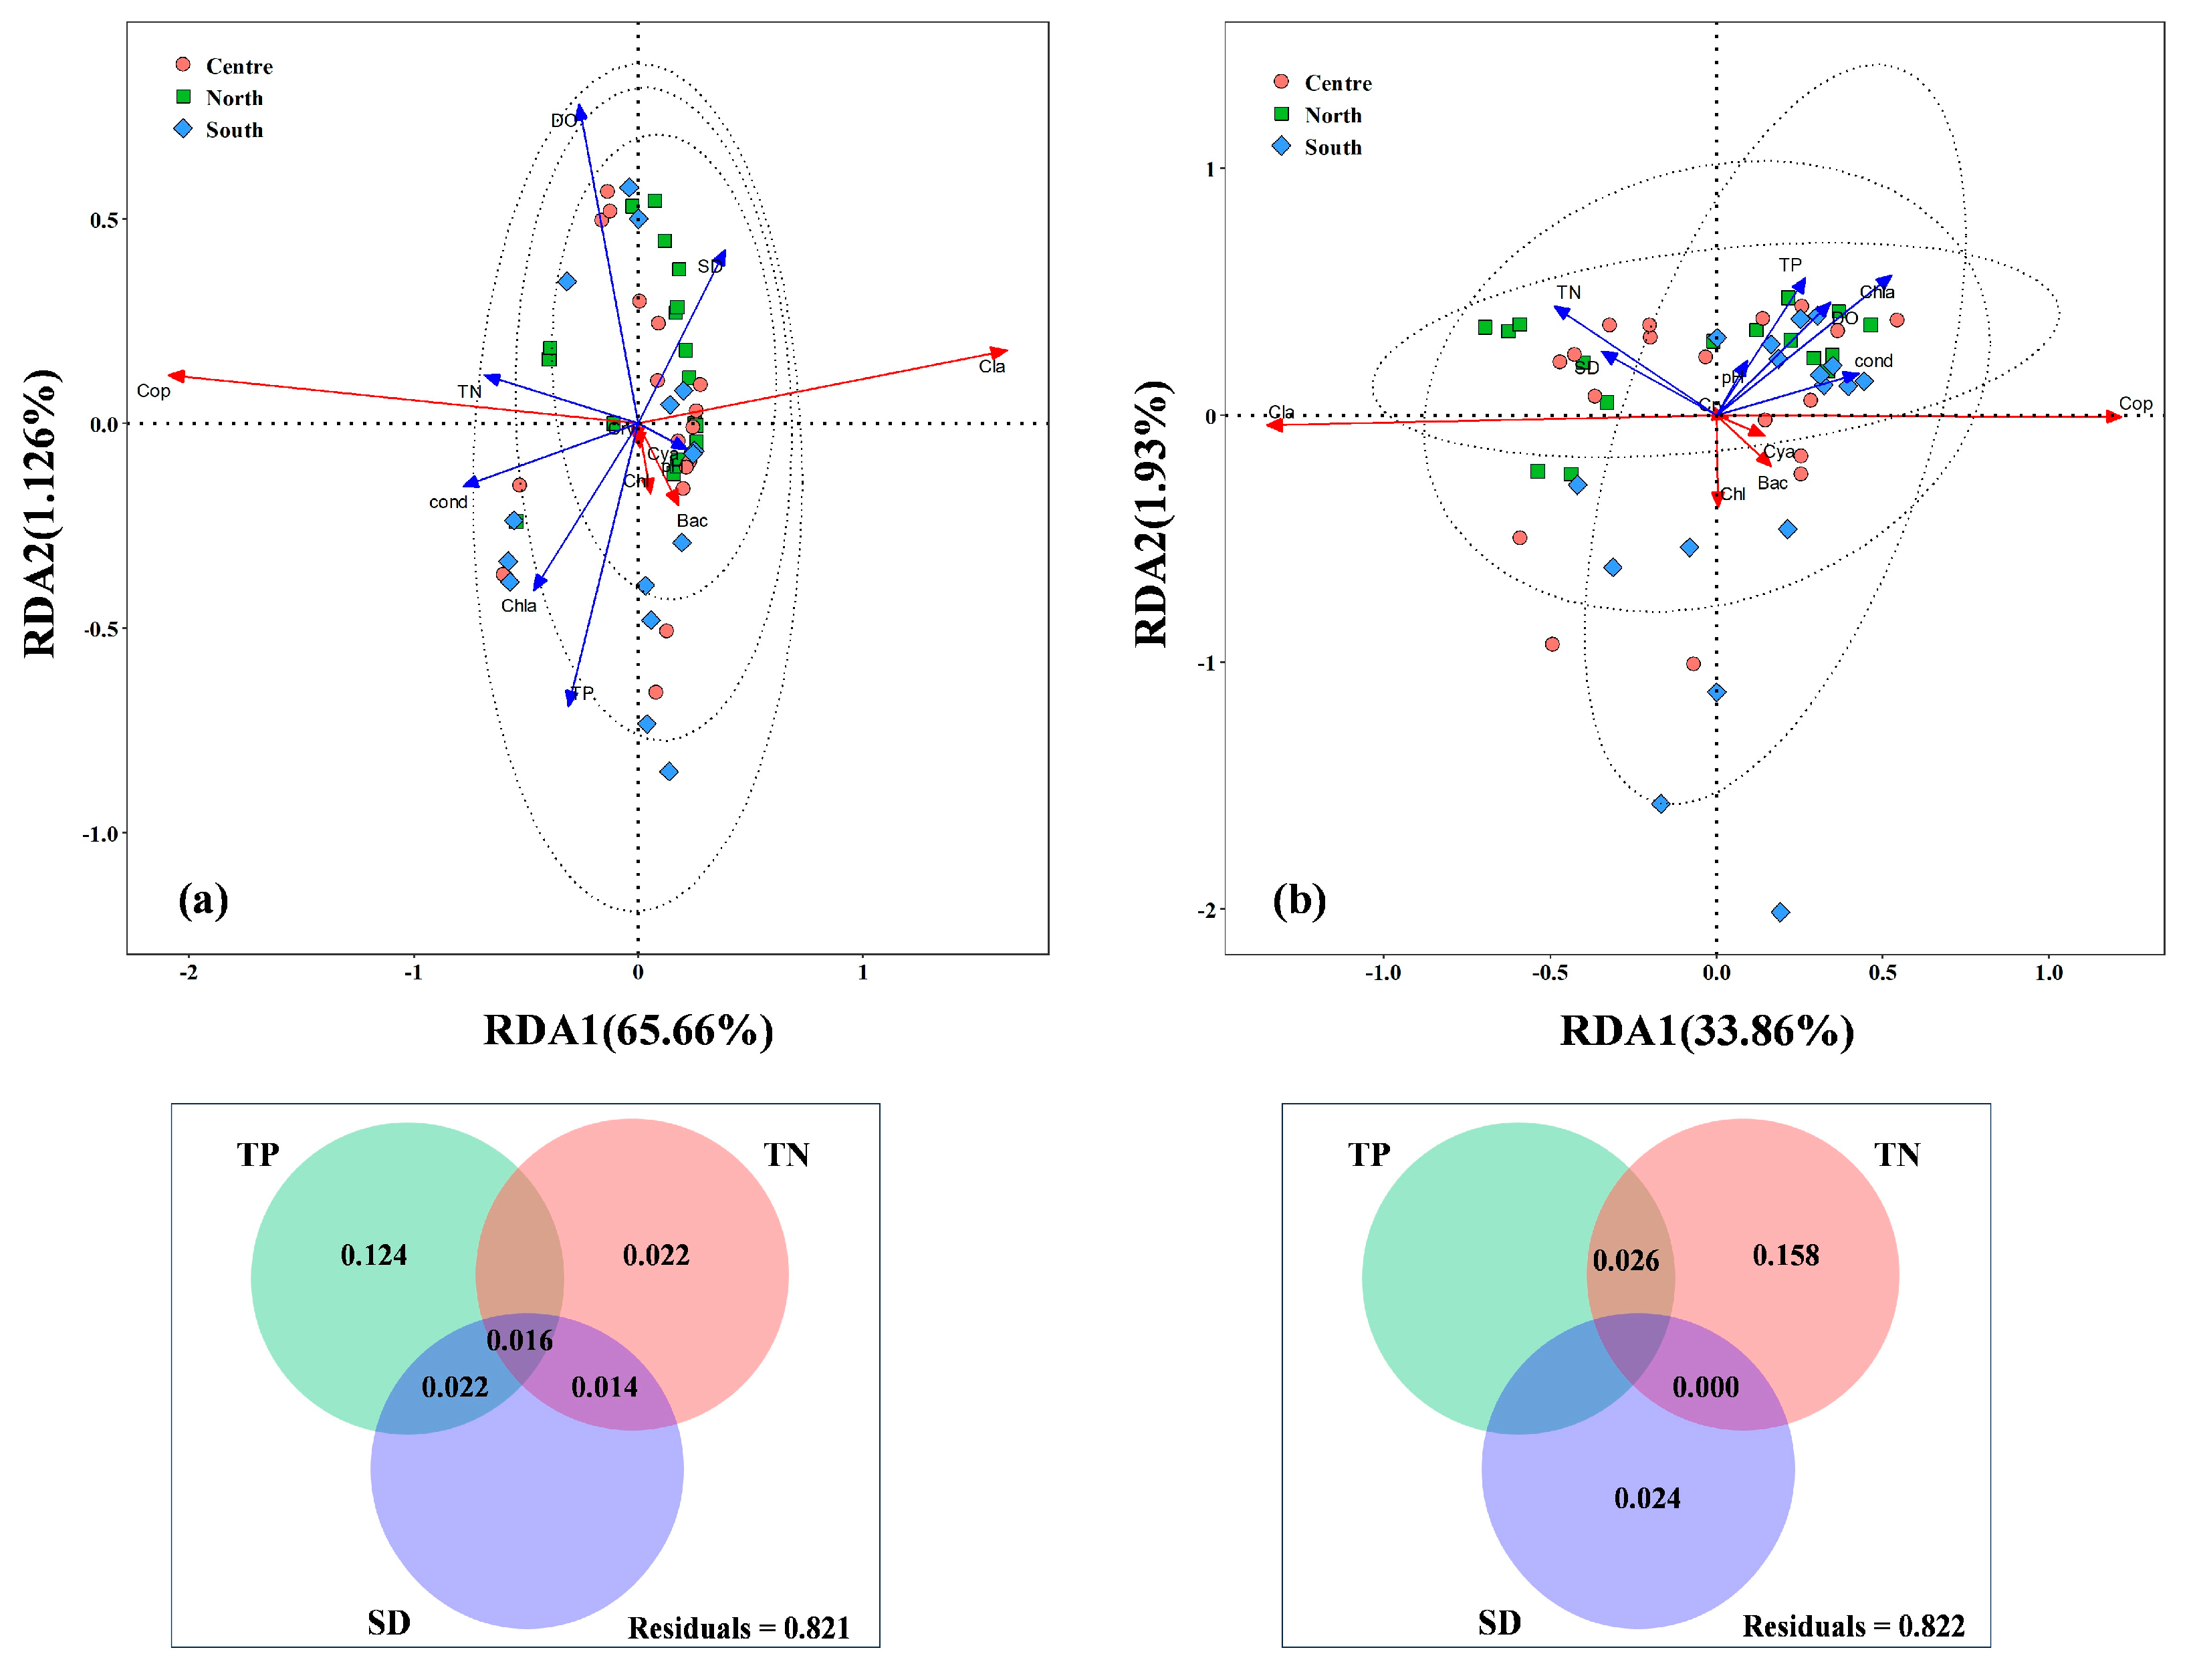
The findings from the redundancy analysis (RDA) were employed to assess the influence of environmental factors on the predominant phytoplankton and zooplankton species in Lake Erhai, considering variations across different seasons and spatial distributions (Figure 6). In the dry season, the first and second axes of the RDA accounted for 65.66% and 1.12% of the variance, respectively (Figure 6a). Within this context, TP, DO, and SD emerged as the most significant determinants affecting the biomass of both phytoplankton and zooplankton. Furthermore, the variance partitioning analysis indicated that TP concentration during the dry season was the primary factor influencing the biomass of the plankton community. It is noteworthy that no significant spatial distribution differences were detected among various water areas in Lake Erhai during this season.
In contrast, in the rainy season, the first and second axes of the RDA explained 33.86% and 1.93% of the variance, respectively (Figure 6b). In this season, TN and Chla were identified as the key factors impacting the biomass of cladocerans and copepods. The results of the variance partitioning analysis further indicated that TN concentration during the rainy season was the most critical factor affecting the biomass of the plankton community. Additionally, significant spatial distribution differences were observed among various water areas in Lake Erhai during the rainy season.

4. Discussion

This study reveals significant spatial and temporal distribution differences in the phytoplankton and zooplankton communities in Lake Erhai and identifies the key environmental drivers influencing their dynamics. Spatially, high biomass values of Microcystis are observed in the northern region, primarily driven by elevated nutrient concentrations (e.g., total nitrogen and total phosphorus) in the lake. Meanwhile, zooplankton (such as copepods and cladocerans) exhibit distinct spatial distribution patterns, closely correlated with phytoplankton biomass and nutrient concentrations. Temporally, the density and biomass of phytoplankton (including Microcystis, other cyanobacteria, bacillariophyte, and chlorophyta) during the rainy season differ significantly from those in the dry season, with similar seasonal trends observed for zooplankton. Further analysis indicates that nutrient concentration is the core variable regulating the community structure of both phytoplankton and zooplankton. These findings provide critical insights into material cycling and energy flow in subtropical plateau lake ecosystems, while also offering a scientific reference for subsequent lake eutrophication management strategies based on niche theory.
The findings of this study indicated that nutrient concentrations during the rainy season were significantly higher compared to those observed in the dry season. Furthermore, nutrient levels in the northern region of Lake Erhai were markedly higher than those in the southern region during the rainy season, suggesting that rainfall may facilitate the transport of riverine sewage into Lake Erhai. The ecosystem of Lake Erhai exhibits pronounced seasonal variations attributable to the subtropical rainfall climate. The Water Environment Monitoring Center of Dali conducted monitoring of 23 main streams surrounding Lake Erhai during both the dry and rainy seasons. The results indicated that the rivers discharging into the northern part of the lake contributed 47.0% and 28.7% of the total nitrogen and total phosphorus loads, respectively [51]. This observation aligns with the hypothesis proposed by [52], which posits that external nutrients from stormwater runoff in the upper watershed may also increase the nutrient concentrations in the Yang-He reservoir, as evidenced by a marked increase in TN on 5 August and TP on 29 July. Additionally, our results suggested that rainfall may have expedited the influx of sewage from upstream rivers into Lake Erhai, as indicated by a significant increase in TN and TP concentrations in the northern region of the lake during the rainy season.
The phytoplankton community in Lake Erhai exhibits significant spatial distribution differences between the rainy and dry seasons, primarily attributed to the influence of rainfall runoff [42]. On one hand, rainfall can lead to eutrophication, as nutrients from nutrient-rich bottom layers become quickly available for cyanobacteria utilization [53,54,55]. On the other hand, rainfall may transport airborne pollutants to the ground and underground systems, thereby harming rivers and lakes [56]. Rainfall events can also result in the mixing and re-suspension of dormant cyanobacteria [57,58], as well as light limitation under conditions of high nutrient supply [59]. Previous studies also proposed that rainfall leads to a significant increase in nutrient input into water bodies, thus creating favorable conditions for cyanobacterial growth during heavy rainfall events [39]. Our research results indicated that the density and biomass of Microcystis, other cyanobacteria, and chlorophyta were higher in the rainy season than in the dry season, whereas the density and biomass of bacillariophyte are lower. Prior studies have shown that with the arrival of the rainy season in summer and autumn, large amounts of external pollutants are carried into the lake through rainfall runoff. Under conditions of high temperature and elevated nutrient levels, cyanobacteria (especially Microcystis) and chlorophyta (e.g., Chlorella, Scenedesmus) emerge as the dominant genera in Lake Erhai during the summer and autumn months due to their rapid growth rates [60]. Moreover, other investigations have established that during the dry season, lower water temperatures and diminished nutrient levels favor bacillariophyte, which capitalize on their siliceous cell walls to withstand and adapt to low-light environments [42]. For example, the proportion of Aphanizomenon flos-aquae increases during winter, ultimately becoming the dominant species by March–April of the subsequent year. In contrast, during the rainy season, heightened water turbidity and decreased transparency hinder bacillariophyte photosynthesis, and their longer growth cycles impede their ability to establish dominance in the rapidly fluctuating environmental conditions characteristic of this season.
The spatial distribution analysis of the zooplankton community reveals that during the rainy season, cladoceran density is elevated, yet their biomass is diminished, in contrast to the dry season where the reverse trend is observed. Furthermore, both the density and biomass of copepods are significantly greater in the rainy season compared to the dry season. These observations imply that an increase in nutrient concentrations within the aquatic environment leads to a gradual replacement of larger cladocerans by smaller ones, resulting in a scenario characterized by high density but low biomass. Prior research has suggested that the escalation of eutrophication may trigger a shift in the dominant zooplankton species from larger cladocerans to smaller variants [46]. The bottom-up effect, driven by nutrient enrichment, fuels phytoplankton blooms. This often favors small-sized phytoplankton, leading to a food shift. Consequently, zooplankton communities may undergo a transition from large cladocerans to smaller ones. During the rainy season, rainfall runoff carries substantial amounts of nutrients, such as nitrogen and phosphorus, into Lake Erhai, exacerbating water eutrophication. In the process of eutrophication, large cladocerans (e.g., Daphnia) are gradually replaced by small cladocerans (e.g., Bosmina, Chydorus) due to feeding pressure and competitive disadvantages [61]. Although small cladocerans exhibit high numerical density, their individual biomass remains low, leading to an overall reduction in biomass, which is consistent with our findings. Additionally, fish predation pressure during the rainy season may be a factor contributing to changes in the cladoceran community structure [15,62]. During this period, small planktivorous fish are in a rapid growth phase, and large cladocerans are more susceptible to predation, while small species survive due to their small size and strong evasion abilities. This further exacerbates the shift from a community structure dominated by large-sized cladocerans to one dominated by small-sized cladocerans. Previous studies have shown that under conditions of low cladoceran biomass, copepod biomass tends to increase due to competitive interactions, a finding that is generally consistent with our research results [62].
Numerous studies have demonstrated that nutrients and light serve as essential resources that significantly influence phytoplankton growth [24,63]. During the rainy season, heightened precipitation can result in alterations to nutrient concentrations and light availability within aquatic ecosystems, thereby impacting both the growth and community composition of phytoplankton. Variability in factors such as water depth and flow velocity across different regions of a lake may lead to differential responses to changes in nutrient and light conditions [23]. In the present study, results from the redundancy analysis (RDA) indicated that during the dry season in Lake Erhai, TP and light (SD) emerged as the most significant determinants of the biomass of both phytoplankton and zooplankton. Furthermore, variance partitioning analyses revealed that TP concentration during the dry season was the predominant factor influencing the biomass of the plankton community. In contrast, during the rainy season, TN and Chla were considered the most significant factors influencing the biomass of copepods. The variance partitioning results also indicated that TN concentration during the rainy season was the primary factor influencing the biomass of the plankton community. Previous research has suggested that the Canonical Correspondence Analysis (CCA) of the dominant chlorophytes, specifically Psephonema aenigmaticum and Mougeotia, was significantly affected by TN [64]. In our investigation, cyanobacteria exhibited a notable correlation with TN and DO during the rainy season. This is because one of the major cyanobacterial species, Aphanizomenon, is capable of nitrogen fixation and can grow in water bodies with low nitrogen concentrations [65]. The findings also indicated that TN remains a key factor affecting the density and biomass of chlorophytes in Lake Erhai, with nitrogen concentration being more critical than phosphorus concentration [64]. This finding aligns with previous studies conducted on other lakes [66]. The results may be explained by the fact that increased precipitation can lead to fluctuations in nutrient concentrations and light conditions within aquatic systems, thereby affecting the structure of the plankton community. During the summer when rainfall is abundant, alterations in nutrient input due to anthropogenic activities—such as non-point source pollution from agricultural practices and increased pollutant loads in rivers resulting from urbanization—can significantly influence the dynamics of lake phytoplankton and zooplankton. Consequently, it is imperative to implement measures to mitigate nutrient inputs into the Lake Erhai basin.

5. Conclusions

This study reveals key spatial–seasonal shifts in Lake Erhai’s phytoplankton and zooplankton communities. During the rainy season, nutrient-rich runoff drives eutrophication, favoring rapid-growing cyanobacteria (Microcystis) and chlorophyta, whereas in the dry season, bacillariophyte emerge as the dominant group due to lower nutrient concentrations. Zooplankton exhibit contrasting patterns: cladocerans show high density but low biomass in the rainy season, as eutrophication leads to the replacement of larger Daphnia spp. by smaller Bosmina spp. Copepods thrive in both density and biomass during the rainy season, benefiting from reduced competition. These findings underscore the lake’s vulnerability to pollution and climate variability, highlighting the need for seasonally adaptive management to curb eutrophication and protect ecosystem health. Future research should explore the long-term impacts of climate change on seasonal patterns, as altered precipitation regimes may exacerbate eutrophication and disrupt trophic interactions.

Author Contributions

Conceptualization, L.G. (Longgen Guo) and C.Y.; methodology, C.Y.; software, C.Y.; formal analysis, C.Y.; investigation, C.Y., J.Y., Y.Y. and L.G. (Li Gong); data curation, C.Y. and L.G. (Longgen Guo); writing—original draft preparation, C.Y.; writing—review and editing, L.G. (Longgen Guo); supervision, L.G. (Longgen Guo); funding acquisition, C.Y. and L.G. (Longgen Guo). All authors have read and agreed to the published version of the manuscript.

Funding

This research was funded by the National Water Pollution Control and Management Technology Major Projects (Grant 2012ZX07105-004), the Key Project of Anhui Provincial Department of Education (2023AH052248), Doctoral Research Initiation Fund of Suzhou University (2023BSK007), and China Postdoctoral Science Foundation funded project (2023M743728).

Institutional Review Board Statement

Not applicable.

Informed Consent Statement

Informed consent was obtained from all subjects involved.

Data Availability Statement

The original contributions presented in the study are included in the article; further inquiries can be directed to the corresponding author.

Acknowledgments

Thanks to YanJin Che for help in setting up the field investigations.

Conflicts of Interest

The authors declare no conflicts of interest.

References

  1. Cadier, M.; Gorgues, T.; Sourisseau, M.; Edwards, C.A.; Aumont, O.; Marié, O.; Memery, L. Assessing spatial and temporal variability of phytoplankton communities’ composition in the Iroise Sea ecosystem (Brittany, France): A 3D modeling approach. Part 1: Biophysical control over plankton functional types succession and distribution. J. Mar. Syst. 2017, 165, 47–68. [Google Scholar] [CrossRef]
  2. Moe, S.J.; Hobæk, A.; Persson, J.; Skjelbred, B.; Løvik, J.E. Shifted dynamics of plankton communities in a restored lake: Exploring the effects of climate change on phenology through four decades. Clim. Res. 2022, 86, 125–143. [Google Scholar] [CrossRef]
  3. Xu, B.; Huang, X.F.; Xu, K.; Wang, X. Spatial and Seasonal Dynamics of Plankton Community and Its Relationship with Environmental Factors in an Urban River: A Case Study of Wuxi City, China. Water 2024, 17, 51. [Google Scholar] [CrossRef]
  4. Doi, H.; Chang, K.H.; Ando, T.; Imai, H.; Nakano, S.; Kajimoto, A.; Katano, I. Drifting plankton from a reservoir subsidize downstream food webs and alter community structure. Oecologia 2008, 155, 363–371. [Google Scholar] [CrossRef] [PubMed]
  5. Bunnell, D.B.; Barbiero, R.P.; Ludsin, S.A.; Madenjian, C.P.; Warren, G.J.; Dolan, D.M.; Brenden, T.O.; Briland, R.; Gorman, O.T.; Hi, J.X.; et al. Changing ecosystem dynamics in the Laurentian Great Lakes: Bottom-up and top-down regulation. Bioscience 2014, 64, 26–39. [Google Scholar] [CrossRef]
  6. Cael, B.B.; Dutkiewicz, S.; Henson, S. Abrupt shifts in 21st-century plankton communities. Sci. Adv. 2021, 7, eabf8593. [Google Scholar] [CrossRef]
  7. Lin, S.J. Phosphate limitation and ocean acidification co-shape phytoplankton physiology and community structure. Nat. Commun. 2023, 14, 2699. [Google Scholar] [CrossRef] [PubMed]
  8. El Dine, Z.S.; Guinet, C.; Picard, B. Influence of the phytoplankton community structure on the southern elephant seals’ foraging activity within the Southern Ocean. Commun. Biol. 2025, 8, 620. [Google Scholar] [CrossRef]
  9. Rodríguez-Gómez, C.F.; Vázquez, G.; Papiol, V.; Mariño-Tapia, I.; Enriquez, C. Phytoplankton distribution and its ecological and hydrographic controls in two contrasting areas of a stratified oligotrophic system. Hydrobiologia 2022, 849, 3175–3195. [Google Scholar] [CrossRef]
  10. Xu, Y.P.; Xiang, Z.L.; Rizo, E.Z.; Naselli-Flores, L.; Han, B.P. Combination of linear and nonlinear multivariate approaches effectively uncover responses of phytoplankton communities to environmental changes at regional scale. J. Environ. Manag. 2022, 305, 114399. [Google Scholar] [CrossRef]
  11. Xu, Z.M.; Cheung, S.Y.; Endo, H.; Xia, X.M.; Wu, W.X.; Chen, B.Z.; Ernest Ho, N.H.; Suzuki, K.; Li, M.; Liu, H.B. Disentangling the ecological processes shaping the latitudinal pattern of phytoplankton communities in the Pacific Ocean. Msystems 2022, 7, e01203-21. [Google Scholar] [CrossRef]
  12. Jacobsen, B.A.; Simonsen, P. Disturbance events affecting phytoplankton biomass, composition and species-diversity in a shallow, eutrophic, temperate lake. Hydrobiologia 1993, 249, 9–14. [Google Scholar] [CrossRef]
  13. James, T.R.; Chimney, M.J.; Sharfstein, B.; Engstrom, D.R.; Schottler, S.P.; East, T.; Jin, K.R. Hurricane effects on a shallow lake ecosystem, Lake Okeechobee, Florida (USA). Fund. Appl. Limnol. 2008, 172, 273–287. [Google Scholar] [CrossRef]
  14. Han, X.; Pan, B.Z.; Zhao, G.N.; Li, D.B.; Sun, H.; Zhu, P.H.; Lu, Y. Local and geographical factors jointly drive elevational patterns of phytoplankton in the source region of the Yangtze River, China. River Res. Appl. 2021, 37, 1145–1155. [Google Scholar] [CrossRef]
  15. Yin, C.J.; He, W.C.; Guo, L.G.; Gong, L.; Yang, Y.L.; Yang, J.J.; Ni, L.Y.; Chen, Y.S.; Jeppesen, E. Can top-down effects of planktivorous fish removal be used to mitigate cyanobacterial blooms in large subtropical highland lakes? Water Res. 2022, 218, 118483. [Google Scholar] [CrossRef] [PubMed]
  16. Yin, C.J.; Yang, Y.L.; Ni, L.Y.; Chen, Y.S.; Wen, Z.H.; Su, H.J.; Guo, L.G. Temperature, nutrients and planktivorous fish predation interact to drive crustacean zooplankton in a large plateau lake, southwest China. Aquat. Sci. 2023, 85, 22. [Google Scholar] [CrossRef]
  17. Becker, V.; Caputo, L.; Ordóñez, J.; Marcé, R.; Armengol, J.; Crossetti, L.O.; Huszar, V.L.M. Driving factors of the phytoplankton functional groups in a deep Mediterranean reservoir. Water Res. 2010, 44, 3345–3354. [Google Scholar] [CrossRef]
  18. Engels, S.; Cwynar, L.C. Changes in fossil chironomid remains along a depth gradient: Evidence for common faunal thresholds within lakes. Hydrobiologia 2011, 661, 15–38. [Google Scholar] [CrossRef]
  19. Fan, L.M.; Song, C.; Meng, S.L.; Qiu, L.P.; Zheng, Y.; Wu, W.; Qu, J.H.; Li, D.D.; Zhang, C.; Hu, G.D.; et al. Spatial distribution of planktonic bacterial and archaeal communities in the upper section of the tidal reach in Yangtze River. Sci. Rep. 2016, 6, 39147. [Google Scholar] [CrossRef] [PubMed]
  20. Zhang, M.; Shi, X.L.; Yang, Z.; Yu, Y.; Shi, L.M.; Qin, B.Q. Long-term dynamics and drivers of phytoplankton biomass in eutrophic Lake Taihu. Sci. Total Environ. 2018, 645, 876–886. [Google Scholar] [CrossRef]
  21. Wang, J.Y.; Huo, D.; Guo, C.X.; Zhu, G.W.; Gong, Z.J.; Fan, Y.W.; Wang, J.J. Vertical distribution characteristics of phytoplankton communities and its influencing factors in Qiandao Lake, a deep-water reservoir. Environ. Sci. 2022, 43, 3575–3586. (In Chinese) [Google Scholar] [CrossRef]
  22. Tian, W.; Zhang, H.Y.; Zhao, L.; Huang, H. Responses of a phytoplankton community to seasonal and environmental changes in Lake Nansihu, China. Mar. Freshw. Res. 2022, 68, 1877–1886. [Google Scholar] [CrossRef]
  23. Gehlot, B.; Chandra, S.; Joshi, R.; Arya, M.; Chakrabarti, R. Temporal variations in plankton communities and environmental factors in the Shipra, a central Himalayan tributary of the Kosi River in Uttarakhand, India. Environ. Monit. Assess. 2024, 196, 326. [Google Scholar] [CrossRef] [PubMed]
  24. Ding, X.; Liu, J.X.; Liu, W.W.; Dai, S.; Ke, Z.X.; Guo, J.; Lai, Y.J.; Tan, Y.H. Phytoplankton communities miniaturization driven by extreme weather in subtropical estuary under climate changes. Water Res. 2024, 245, 120588. [Google Scholar] [CrossRef]
  25. Gulati, R.D. Zooplankton and its grazing as indicators of trophic status in Dutch lakes. Environ. Monit. Assess. 1983, 3, 343–354. [Google Scholar] [CrossRef]
  26. Primo, A.L.; Azeiteiro, U.M.; Marques, S.C.; Martinho, F.; Pardal, M.A. Changes in zooplankton diversity and distribution pattern under varying precipitation regimes in a southern temperate estuary. Estuar. Coast. Shelf S. 2009, 82, 341–347. [Google Scholar] [CrossRef]
  27. de Jonge, V.N. Importance of temporal and spatial scales in applying biological and physical process knowledge in coastal management, an example for the Ems estuary. Cont. Shelf Res. 2000, 20, 1655–1686. [Google Scholar] [CrossRef]
  28. Nayak, A.R.; Jiang, H.S.; Byron, M.L.; Sullivan, J.M.; McFarland, M.N.; Murphy, D.W. Small scale spatial and temporal patterns in particles, plankton, and other organisms. Front. Mar. Sci. 2021, 8, 669530. [Google Scholar] [CrossRef]
  29. Zhang, X.; Xie, P.; Chen, F.Z.; Li, Y.L.; Li, S.X.; Guo, N.C.; Qin, J.H. Present status and changes of the phytoplankton community after invasion of Neosalanx taihuensis since 1982 in a deep oligotrophic plateau lake, Lake Fuxian in the subtropical China. J. Environ. Sci. 2005, 17, 389–394. [Google Scholar] [CrossRef]
  30. Wu, Y.; Zhang, J.P.; Hou, Z.Y.; Tian, Z.B.; Chu, Z.S.; Wang, S.R. Seasonal dynamics of algal net primary production in response to phosphorus input in a mesotrophic subtropical plateau lake, southwestern China. Water 2022, 14, 835. [Google Scholar] [CrossRef]
  31. Tiberti, R.; Dory, F.; Arthaud, F.; Augé, V.; Birk, C.; Cavalli, L.; Fontaneto, D.; Napoleoni, R.; Perga, M.E.; Sabás, I.; et al. Long-term changes of zooplankton in alpine lakes result from a combination of local and global threats. Biol. Conserv. 2025, 308, 111222. [Google Scholar] [CrossRef]
  32. Wang, Y.; Jiang, X.; Li, Y.L.; Yang, L.J.; Li, Y.H.; Liu, Y.; Zhou, L.; Wang, P.Z.; Zhao, X.; Wang, H.J.; et al. Interactive effects of nutrients and salinity on phytoplankton in subtropical plateau lakes of contrasting water depths. Water 2023, 15, 69. [Google Scholar] [CrossRef]
  33. Chen, Z.D.; Huang, L.P.; Chen, L.; Liang, H.; Liu, Y.Y.; Chen, X.L.; Zhang, T.; Chen, G.J. Seasonal variation and driving factors of carbon and nitrogen stable isotope values of plankton in four lakes of Yunnan Province. J. Lake Sci. 2021, 33, 761–773. [Google Scholar] [CrossRef]
  34. Yin, C.J.; Gong, L.; Chen, Y.S.; Pitcher, T.J.; Kang, B.; Guo, L.G. Modeling ecosystem impacts of invasive Japanese smelt Hypomesus nipponensis in Lake Erhai, southwestern China. Ecol. Inform. 2022, 67, 101488. [Google Scholar] [CrossRef]
  35. Du, B.H. Study on hydrological characteristics and non-point source pollution load in the Erhai lake watershed. Yunnan Environ. Prot. 1992, 2, 25–33. (In Chinese) [Google Scholar]
  36. Duan, S.X.; Yang, Z.; Li, Y.L.; He, B.; Shi, J.C.; Song, W.Z. Progress of agricultural non-point source pollution in Erhai Lake Basin: A review. J. Ecol. Rural Environ. 2021, 37, 279–286. [Google Scholar] [CrossRef]
  37. Wang, Z.; Wang, Y.C.; Hu, M.M.; Li, Y.H.; Liu, Y.D.; Shen, Y.W.; Li, G.B.; Wang, G.H. Succession of the phytoplankton community in response to environmental factors in north Lake Erhai during 2009–2010. Fresen. Environ. Bull. 2011, 20, 2221–2231. [Google Scholar]
  38. Reichwaldt, E.S.; Ghadouani, A. Effects of rainfall patterns on toxic cyanobacterial blooms in a changing climate: Between simplistic scenarios and complex dynamics. Water Res. 2012, 46, 1372–1393. [Google Scholar] [CrossRef]
  39. Yu, G.L.; Jiang, Y.J.; Song, G.F.; Tan, W.H.; Zhu, M.L.; Li, R.H. Variation of Microcystis and microcystin coupling nitrogen and phosphorus nutrient in Lake Erhai, drinking water source in Southwest Plateau, China. Environ. Sci. Pollut. Res. 2014, 21, 9887–9898. [Google Scholar] [CrossRef]
  40. Chu, X.L.; Chen, Y.Y. The Fishes of Yunnan; Science Press: Beijing, China, 1990. (In Chinese) [Google Scholar]
  41. Lu, S.Y.; Zhang, W.T.; Xing, Y.; Qu, J.T.; Li, K.; Zhang, Q.; Xue, W. Spatial distribution of water quality parameters of rivers around Erhai Lake during the dry and rainy seasons. Environ. Earth Sci. 2015, 74, 7423–7430. [Google Scholar] [CrossRef]
  42. Cao, J.; Hou, Z.Y.; Li, Z.K.; Chu, Z.S.; Yang, P.P.; Zheng, B.H. Succession of phytoplankton functional groups and their driving factors in a subtropical plateau lake. Sci. Total Environ. 2018, 631–632, 1127–1137. [Google Scholar] [CrossRef]
  43. Xiang, S.; Pang, Y.; Chu, Z.S.; Hu, X.Z.; Sun, L.; Xue, L.Q. Response of inflow water quality to land use pattern in northern watershed of Lake Erhai. Environ. Sci. 2016, 37, 2947–2956. [Google Scholar] [CrossRef]
  44. Pang, Y.; Xiang, S.; Chu, Z.S.; Xue, L.Q.; Ye, B.B. Relationship between agricultural land and water quality of inflow river in Erhai Lake basin. Environ. Sci. 2015, 36, 4005–4011. [Google Scholar] [CrossRef]
  45. Zhang, L.; Xu, K.C.; Wang, S.R.; Wang, S.G.; Li, Y.P.; Li, Q.C.; Meng, Z. Characteristics of dissolved organic nitrogen in overlying water of typical lakes of Yunnan Plateau, China. Ecol. Indic. 2017, 84, 727–737. [Google Scholar] [CrossRef]
  46. Li, Y.; Xie, P.; Zhao, D.D.; Zhu, T.S.; Guo, L.G.; Zhang, J. Eutrophication strengthens the response of zooplankton to temperature changes in a high-altitude lake. Ecol. Evol. 2016, 6, 6690–6701. [Google Scholar] [CrossRef]
  47. Greenberg, A.E.; Clesceri, L.S.; Eaton, A.D. Standard Methods for the Examination of Water and Wastewater; American Public Health Association: Washington, DC, USA, 1992. [Google Scholar]
  48. Yang, J.R.; Lv, H.; Alain, I.; Liu, L.M.; Yu, X.P.; Chen, H.H.; Yang, J. Disturbance-induced phytoplankton regime shifts and recovery of cyanobacteria dominance in two subtropical reservoirs. Water Res. 2017, 120, 52–63. [Google Scholar] [CrossRef]
  49. Yin, C.J.; Guo, L.G.; Yi, C.L.; Luo, C.Q.; Ni, L.Y. Physiochemical process, crustacean zooplankton and Microcystis changes in water column after introduction of silver carp, an in-situ enclosure experiment to control cyanobacteria bloom at Meiliang Bay, Lake Taihu. Scientifica 2017, 2017, 9643234–9643243. [Google Scholar] [CrossRef]
  50. Abdi, H.; Williams, L.J. Principal component analysis, wiley interdisciplinary reviews. Computation. Stat. 2010, 2, 433–459. [Google Scholar] [CrossRef]
  51. Yan, C.Z.; Jin, X.C.; Zhao, J.Z. Ecological protection and sustainable utilization of Erhai Lake, Yunnan. Environ. Sci. 2005, 26, 38–42. Available online: https://pubmed.ncbi.nlm.nih.gov/16366467/ (accessed on 6 June 2025).
  52. Hui, T.X.; Xie, P.; Guo, L.G.; Chu, Z.S.; Liu, M.H. Phytoplankton dynamics and their equilibrium phases in the Yanghe Reservoir, China. J. Freshwater Ecol. 2014, 29, 1–15. [Google Scholar] [CrossRef]
  53. Shaw, G.; Garnett, C.; Moore, M.R.; Florian, P. The predicted impact of climate change on toxic algal (Cyanobacterial) blooms and toxin production in Queensland. Environ. Health 2001, 1, 76–88. Available online: https://search.informit.org/doi/abs/10.3316/INFORMIT.229352650430349 (accessed on 6 June 2025).
  54. Ahn, C.Y.; Chung, A.S.; Oh, H.M. Rainfall, phycocyanin, and N:P ratios related to cyanobacterial blooms in a Korean large reservoir. Hydrobiologia 2002, 474, 117–124. [Google Scholar] [CrossRef]
  55. Prepas, E.E.; Charette, T. Worldwide Eutrophication of Water Bodies: Causes, Concerns, Controls. In Treatise on Geochemistry; Holland, H.D., Turekian, K.K., Eds.; Elsevier: Amsterdam, The Netherlands, 2005; pp. 311–331. [Google Scholar] [CrossRef]
  56. Zhang, Y.P. Urbanization and urban water environment. Urban Environ. Urban Ecol. 1998, 11, 20–22. (In Chinese) [Google Scholar]
  57. Fabbro, L.D.; Duivenvoorden, L.J. Profile of a bloom of the cyanobacterium Cylindrospermopsis raciborskii (Woloszynska) Seenaya and Subba Raju in the Fitzroy River in tropical central Queensland. Mar. Freshw. Res. 1996, 47, 685–694. [Google Scholar] [CrossRef]
  58. Kebede, E.; Belay, A. Species composition and phytoplankton biomass in a tropical African Lake (Lake Awassa, Ethiopia). Hydrobiologia 1994, 288, 13–32. [Google Scholar] [CrossRef]
  59. Van de Waal, D.B.; Verspagen, J.M.H.; Lurling, M.; Donk, E.V.; Visser, P.M.; Huisman, J. The ecological stoichiometry of toxins produced by harmful cyanobacteria: An experimental test of the carbon-nutrient balance hypothesis. Ecol. Lett. 2009, 12, 1326–1335. [Google Scholar] [CrossRef]
  60. Hou, Z.J.; Jiang, Y.; Liu, Q.; Tian, Y.L.; He, K.J.; Fu, L. Impacts of environmental variables on a phytoplankton community: A case study of the tributaries of a subtropical river, southern China. Water 2018, 10, 152. [Google Scholar] [CrossRef]
  61. Zhao, P.P.; Wei, Z.H.; Wu, Q.T.; Han, B.P.; Lin, Q.Q. Response of planktonic copepods to seasonal fishing moratorium in Erhai Lake, Yunnan, China. Chin. J. Appl. Environ. Biol. 2012, 18, 421–425. (In Chinese) [Google Scholar] [CrossRef]
  62. Lu, H.B.; Chen, G.J.; Cai, Y.F.; Wang, J.Y.; Chen, X.L.; Duan, L.Z.; Zhang, H.C. Cladoceran community responses to eutrophication, fish introduction and macrophyte degradation over the past century in Lake Erhai. J. Lake Sci. 2016, 28, 132–140. [Google Scholar] [CrossRef]
  63. Paczkowska, J.; Rowe, O.F.; Figueroa, D.; Andersson, A. Drivers of phytoplankton production and community structure in nutrient-poor estuaries receiving terrestrial organic inflow. Mar. Environ. Res. 2019, 151, 104778. [Google Scholar] [CrossRef]
  64. Zhu, R.; Wang, H.; Chen, J.; Shen, H.; Deng, X.W. Use the predictive models to explore the key factors affecting phytoplankton succession in Lake Erhai, China. Environ. Sci. Pollut. Res. 2018, 25, 1283–1293. [Google Scholar] [CrossRef] [PubMed]
  65. Bradburn, M.; Lewis, W.M.; McCutchan, J.H. Comparative adaptations of Aphanizomenon and Anabaena for nitrogen fixation under weak irradiance. Freshwater Biol. 2012, 57, 1042–1049. [Google Scholar] [CrossRef]
  66. Elser, J.J.; Bracken, M.E.; Cleland, E.E.; Gruner, D.S.; Harpole, W.S.; Hillebrand, H.; Ngai, J.T.; Seabloom, E.W.; Shurin, J.B.; Smith, J.E. Global analysis of nitrogen and phosphorus limitation of primary producers in freshwater, marine and terrestrial ecosystems. Ecol. Lett. 2007, 10, 1135–1142. [Google Scholar] [CrossRef] [PubMed]
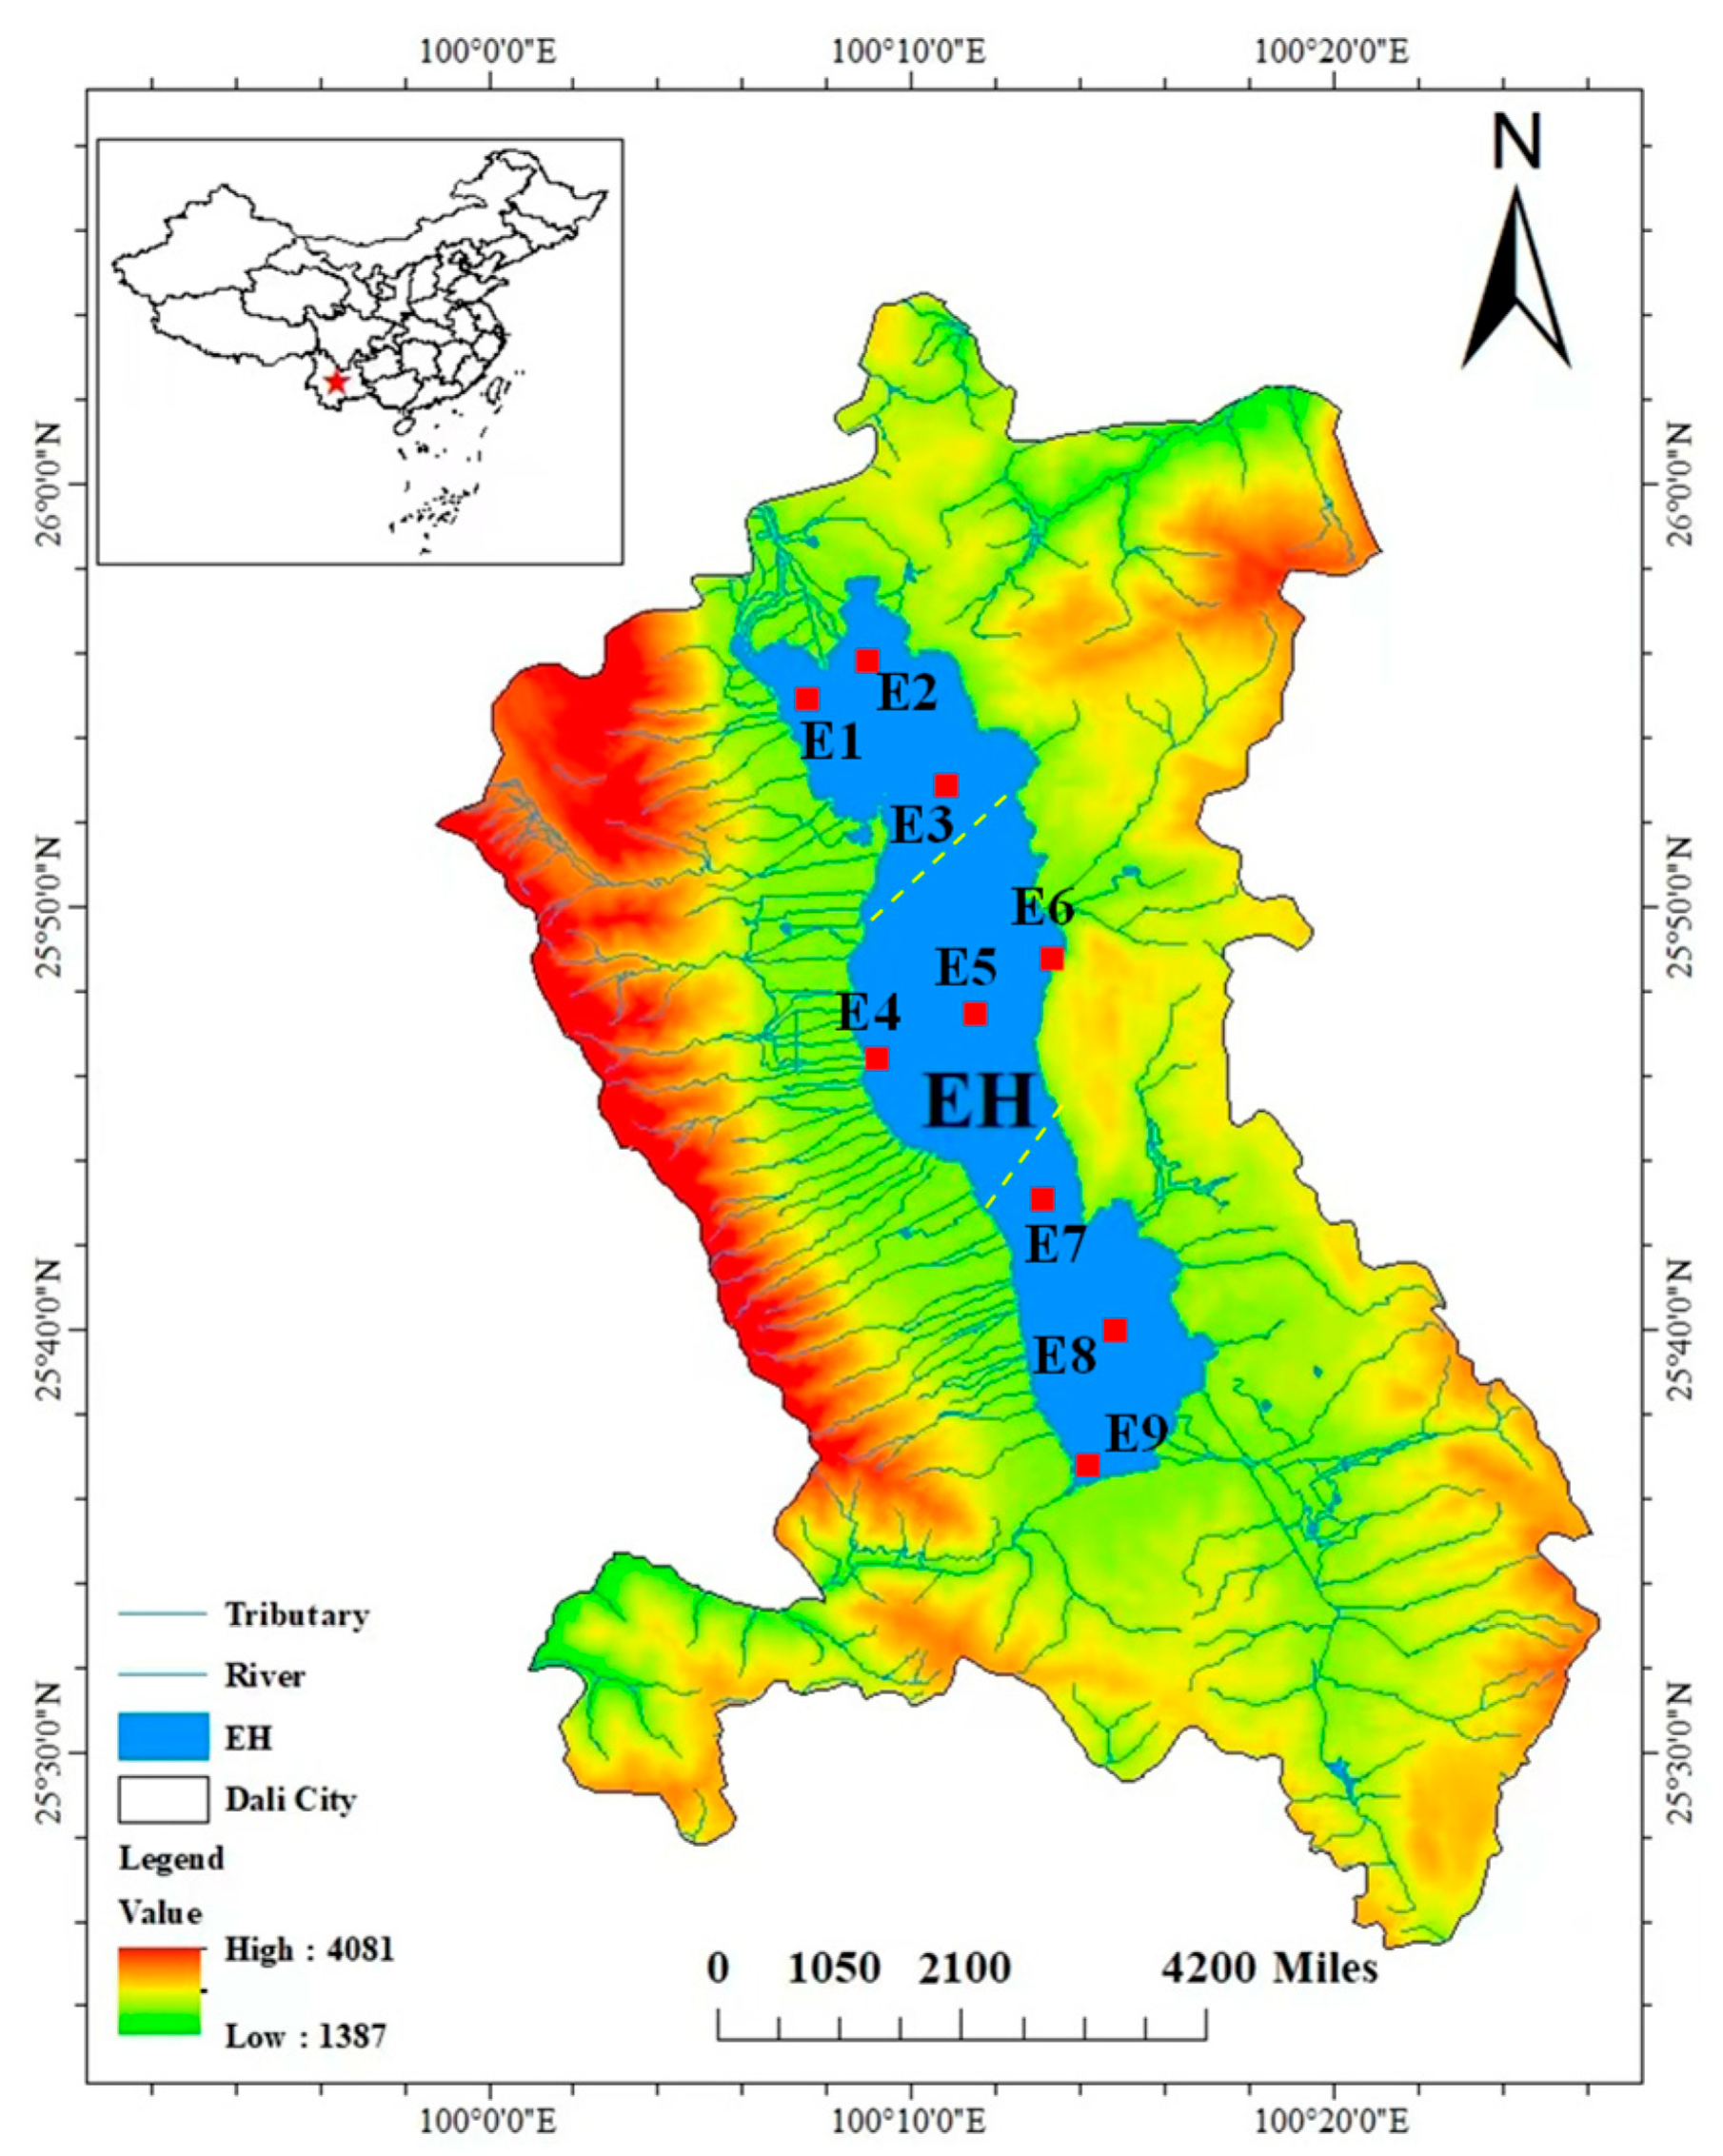
Figure 1. The location of Lake Erhai sampling sites. Among them, the red star, red squares, E(1–9), and EH represent the location of Lake Erhai in China, sampling point location, sampling point number, and the abbreviation of Lake Erhai, respectively, and the dashed line in the figure represents the dividing line between the southern, central and northern parts of Lake Erhai.
Fishes 10 00343 g001
Figure 2. Principal component analysis (PCA) of major environmental factors in Lake Erhai. The different sizes of circles in the figure represent the high and low correlations, which are proportional to the size of the circles.
Fishes 10 00343 g002
Figure 3. Box plot of mean TN, TP, Chla, SD, DO, pH, and Cond values during the dry and rainy seasons from May 2016 to April 2017. Different letters indicate significant differences between treatments at p < 0.05, as determined by a post hoc test (LSD, least significant difference) of the analysis of variance (ANOVA) with treatments treated as a fixed factor.
Fishes 10 00343 g003
Figure 4. Spatial difference of Microcystis, other cyanobacteria, chlorophyta, and Bacillariophyta density and biomass in rainy and dry seasons. Different letters indicate significant differences between treatments at p < 0.05, as determined by a post hoc test (LSD, least significant difference) of the analysis of variance (ANOVA) with treatments treated as a fixed factor.
Fishes 10 00343 g004
Figure 5. Box plot of mean Cladocera density, Cladocera biomass, copepods density and copepods biomass in rainy and dry seasons. Different letters indicate significant differences between treatments at p < 0.05, as determined by a post hoc test (LSD, least significant difference) of the analysis of variance (ANOVA) with treatments treated as a fixed factor.
Fishes 10 00343 g005
Figure 6. Species–environmental variables biplot of redundancy analysis for (a) the dry season and (b) the rainy season. The triangles represent dominant plankton taxa, and the arrows represent environmental variables. Abbreviations: Cya (Cyanophyta), Bac (Bacillariophyta), Cry (Cryptophyta), Chl (chlorophyta), Cla (Cladocera), Cop (copepods).
Fishes 10 00343 g006
Table 1. Mean values of physicochemical indicators studied. All data are shown as the means ± SD (standard error).
ParametersRainyDry
NorthCenterSouthNorthCenterSouth
TN (mg/L)0.822 ± 0.0720.645 ± 0.0360.625 ± 0.0340.630 ± 0.0220.502 ± 0.0410.578 ± 0.021
DIN (mg/L)0.445 ± 0.0420.427 ± 0.0340.421 ± 0.0260.381 ± 0.0560.359 ± 0.0500.323 ± 0.055
NO3-N (mg/L)0.150 ± 0.0080.155 ± 0.0130.160 ± 0.0170.154 ± 0.0050.139 ± 0.0060.133 ± 0.003
NH4-N (mg/L)0.021 ± 0.0070.029 ± 0.0160.019 ± 0.0080.024 ± 0.0290.029 ± 0.0060.018 ± 0.005
TP (mg/L)0.042 ± 0.0020.035 ± 0.0010.033 ± 0.0030.027 ± 0.0030.025 ± 0.0030.027 ± 0.003
SRP (mg/L)0.016 ± 0.0010.013 ± 0.0010.015 ± 0.0010.012 ± 0.0020.011 ± 0.0020.010 ± 0.002
Chla (µg/L)23.32 ± 2.6817.49 ± 2.1613.84 ± 0.9613.52 ± 1.0211.98 ± 1.3713.22 ± 2.09
DO (mg/L)7.86 ± 0.516.76 ± 0.386.66 ± 0.276.89 ± 0.416.85 ± 0.417.63 ± 0.23
pH8.92 ± 0.228.88 ± 0.269.04 ± 0.368.59 ± 0.0548.57 ± 0.0498.52 ± 0.048
SD (cm)132.98 ± 8.52170.5 ± 15.8160 ± 14.8206 ± 12.02227.7 ± 14.5214.6 ± 19.2
Cond (µs/cm)324.2 ± 5.99307.9 ± 8.39309.5 ± 11266.8 ± 7.3258.2 ± 8.27254.8 ± 8.68
Notes: DO—dissolved oxygen; SD—transparency; Cond—conductivity; Chla—chlorophyll-a; TN—total nitrogen; DIN—dissolved inorganic nitrogen; TP—total phosphorus; SRP—soluble reactive phosphorus.
Disclaimer/Publisher’s Note: The statements, opinions and data contained in all publications are solely those of the individual author(s) and contributor(s) and not of MDPI and/or the editor(s). MDPI and/or the editor(s) disclaim responsibility for any injury to people or property resulting from any ideas, methods, instructions or products referred to in the content.