Article

Comparative Analysis of Different Body Composition, Mucus Biochemical Indices, and Body Color in Five Strains of Larimichthys crocea

1
College of Food Science and Technology, Shanghai Ocean University, Shanghai 201306, China
2
East China Sea Fisheries Research Institute, Chinese Academy of Fisheries Sciences, Shanghai 200090, China
3
College of Marine Science, Ningde Normal University, Ningde 352100, China
*
Authors to whom correspondence should be addressed.
Fishes 2025, 10(7), 305; https://doi.org/10.3390/fishes10070305
Submission received: 9 May 2025 / Revised: 21 June 2025 / Accepted: 23 June 2025 / Published: 25 June 2025
(This article belongs to the Section Genetics and Biotechnology)

Abstract

The large yellow croaker, or Larimichthys crocea, is highly prized for its golden color and nutritional content. The purpose of this study was to investigate the differences in body composition, mucus biochemical indices and body color in five strains of large yellow croakers (body weight: 347.01 ± 5.86 g). To conduct genetic diversity analyses of the populations, a total of 50 tailfin samples were randomly chosen from the following populations of large yellow croakers: wild (LYC1), Dai-qu population (LYC2), Yongdai 1 (LYC3), Min-yuedong population (LYC4), and Fufa 1 (LYC5). The findings demonstrated that the LYC3 group’s pigment contents, crude protein, crude lipid, and chromatic values were comparable to those of the LYC1 group (p > 0.05). There was no significant difference between the LYC1 and LYC5 groups’ mucus superoxide dismutase (SOD) and catalase (CAT) activities (p > 0.05). The alkaline phosphatases (ALP), acid phosphatases (ACP), and lysozyme (LYS) activities of the mucus in the LYC1 group were not significantly different from the LYC3 group (p > 0.05). The back skin mRNA expressions of tyrosinase (tyr), tyrosinase-related protein 1 (tyrp1), dopachrome tautomerase (dct), microphtalmia-associated transcription factor (mitf), and melanocortin 1 receptor (mc1r) were significantly up-regulated in the LYC2 and LYC4 groups compared to the LYC1, LYC3, and LYC5 groups (p < 0.05). Forkhead box d3 (foxd3), paired box 3 (pax3), purine nucleoside phosphorylase 4a (pnp4a), aristaless-like homeobox 4a (alx4a), cAMP dependent protein kinase (pka), anaplastic lymphoma kinase (alk), leukocyte receptor tyrosine kinase (ltk), and colony stimulating factor (fms) were among the mRNA expressions of the abdominal skin in the LYC1, LYC3, and LYC5 groups significantly higher than those in the LYC2 and LYC4 groups (p < 0.05). In conclusion, the LYC3 group’s crude protein, crude lipid, carotenoid, and lutein contents were most similar to those of the large yellow croaker found in the wild. Furthermore, the molecular mechanism underlying the variations in body color among the various strains of large yellow croakers was supplied for additional research.
Key Contribution: The body composition, chromatic values, and pigment contents of the LYC3 group were similar to those of the wild large yellow croaker. The mRNA expression of tyr, tyrp1, dct, pnp4a, alx4a, pka, and fms in the LYC3 and LYC5 groups was similar to those of the wild fish.

1. Introduction

The yellow croaker, cucumber fish, and golden dragon are common names for the large yellow croaker (Larimichthys crocea) [1]. It belongs to the Perciformes, Staphylinidae, and Larimichthys [2]. In China, large yellow croaker farming is mainly located in Fujian, Zhejiang, Shandong, and Guangdong, where 281,000 tons were produced in 2023 [3]. A valuable edible fish, the large yellow croaker is highly valued globally due to its distinctive flavor and vibrant appearance [4,5]. The devastation of the marine ecosystem and overfishing, however, were the main causes of the sharp drop in wild large yellow croaker resources [6]. A critically endangered species, the large yellow croaker was listed by the International Union for Conservation of Nature (IUCN) [7]. Large yellow croakers were artificially cultivated as a means of meeting the real demand while preserving and replenishing its resources. Fufa 1 and Yongdai 1 were two large yellow croakers that scientists have successfully bred. They have a faster growth rate, a better body shape, and a golden body color [8,9]. Large yellow croaker strains have shown variations in body color and growth performance, though, as aquaculture has grown in scale and intensity [10]. Thus, the commercial value of different strains of large yellow croakers in terms of growth performance and body color have also attracted much attention.
As a matter of fact, the fish’s body color is not only a sign of health, but also one of the phenotypic characteristics to judge the quality and freshness of the fish [11]. Body color is used as protection and camouflage effects during life activities such as reproduction and avoidance of natural enemies [12,13]. The body color of the fish is mainly determined by the pigment cells in the skin, which include melanin cells, red pigment cells, yellow pigment cells, and iridescent pigment cells [14]. These pigment cells form the body color of the fish by migration, distribution, and concentration or diffusion of pigment granules [15,16]. Among them, the primary chromophores of melanin cells are melanin granules, appearing as black and brown colors; the main chromophores of yellow pigment cells and red pigment cells are carotenoids and pteridine, showing red and orange colors; the pigment granules are not found in the iridescent pigment cells; instead, the colors blue, white, and silver are rendered by reflecting incident light [12,17]. The formation and differentiation of pigment cells are regulated by the neural crest, as well as various genes [18]. During embryonic development, the neural crest cells migrate from the back region of the neural tube to the skin and scales, etc., where they differentiate into various types of pigment cells [19]. Previous studies in Zebrafish (Danio rerio) had verified that the anaplastic lymphoma kinase (alk), leukocyte receptor tyrosine kinase (ltk), forkhead box d3 (foxd3), paired box 3 (pax3), and sry-box containing gene 10 (sox10) genes were able to regulate pigment cells polarization by participating in the regulation of the neural crest [20,21,22,23]. Furthermore, in fishes like Zebrafish [24,25,26], Siamese fighting fish (Betta splendens) [27], and Gold fish (Carassius auratus) [28], the expression of genes like tyrosinase (tyr), microphtalmia-associated transcription factor (mitf), melanocortin 1 receptor (mc1r), purine nucleoside phosphorylase 4a (pnp4a), and colony stimulating factor (fms) was closely linked to the development and differentiation of pigmented cells.
The skin of the fish is easily in contact with diverse pathogens inhabiting the complicated and changeable water environment [29]. The body color of the fish appears dull or loses vitality when they suffer from illness or a stressful condition. The skin of the fish interacts with the environment directly, which not only acts as a mechanical barrier insulating from outside but also plays a role in antioxidant and specific immunity [30]. The skin surface of the fish is covered with a layer of the mucus, primarily formed by the mucus secreted by mucus-secreting cells, which serve as a cushion against friction [31]. The mucus contains many immunoglobulins, immunity enzymes, as well as eliminates oxidative free radical enzymes [32]. For example, immunoglobulin M (Ig M) is able to recognize and bind antigens on the surface of invading pathogens in the mucus by agglutinating, preventing, and marking the pathogens for phagocyte recognition and phagocytosis; immunoglobulin T (Ig T) is a key mediator of mucosal adaptive immunity in fish, with specific immune responses to pathogens at mucosal sites; both acid phosphatases (ACP) and alkaline phosphatases (ALP) play an important role in degrading phosphorylated sugars in the bacterial cell wall, regulating phosphate concentrations inside and outside the cell, and inhibiting the growth of pathogens [33,34,35]. Studies in Grouper (Epinephelus coioides) and Rainbow trout (Oncorhynchus mykiss) showed that Ig M and Ig T exhibited a high immune response in skin mucosa that effectively eliminated parasites [34,36]. It was demonstrated that ACP and ALP in the skin mucus of freshwater fish (Carassius auratus gibelio var.) were able to alter the surface structure of pathogens and increase the phagocytosis ability of phagocytes, thus enhancing the immunity of the fish [35]. In addition, there are differences in the activities of antioxidant enzymes in the mucus of different fishes. It was shown that the mucus extracts of European eel (Anguilla anguilla) and Blotched sole (Brachirus orientalis) showed different activity levels in scavenging oxidative free radicals (DPPH and H2O2) assays [37]. Yet, the problems of fish skin injuries, ulcers, and abrasions occur frequently in high-density intensive aquaculture, with differences in body color occurring in different fishes [38]. Although there were many reports on the study of fish body color, a systematic comparative study on the differences in body color among different strains of large yellow croakers was still insufficient, especially a comprehensive analysis at the physiological, biochemical, and molecular levels. For this reason, this study aimed to systematically compare the body composition, mucus biochemical indices, and skin pigmentation of five distinct strains of large yellow croakers in order to uncover the physiological and biochemical basis of body color differences. A scientific foundation and theoretical justification for the selection and breeding of new large yellow croaker strains with superior body color were provided by the molecular analysis of the mechanism underlying the variations in body color amongst strains.

2. Materials and Methods

2.1. Experimental Fish

The information about large yellow croakers is shown in Table 1 and Figure 1. Yongdai 1 (registration number: GS-01-001-2020) was produced by using the Dai-qu population large yellow croaker as the base population, with growth speed and body shape as the target traits and using the population selection technique for five generations. Fufa 1 (registration number: GS-01-006-2022) was produced by using the Min-yuedong population large yellow croaker as the base population, with body weight as the target trait, and taking the population selection technique for five generations.

2.2. Analysis of Population Genetic Diversity

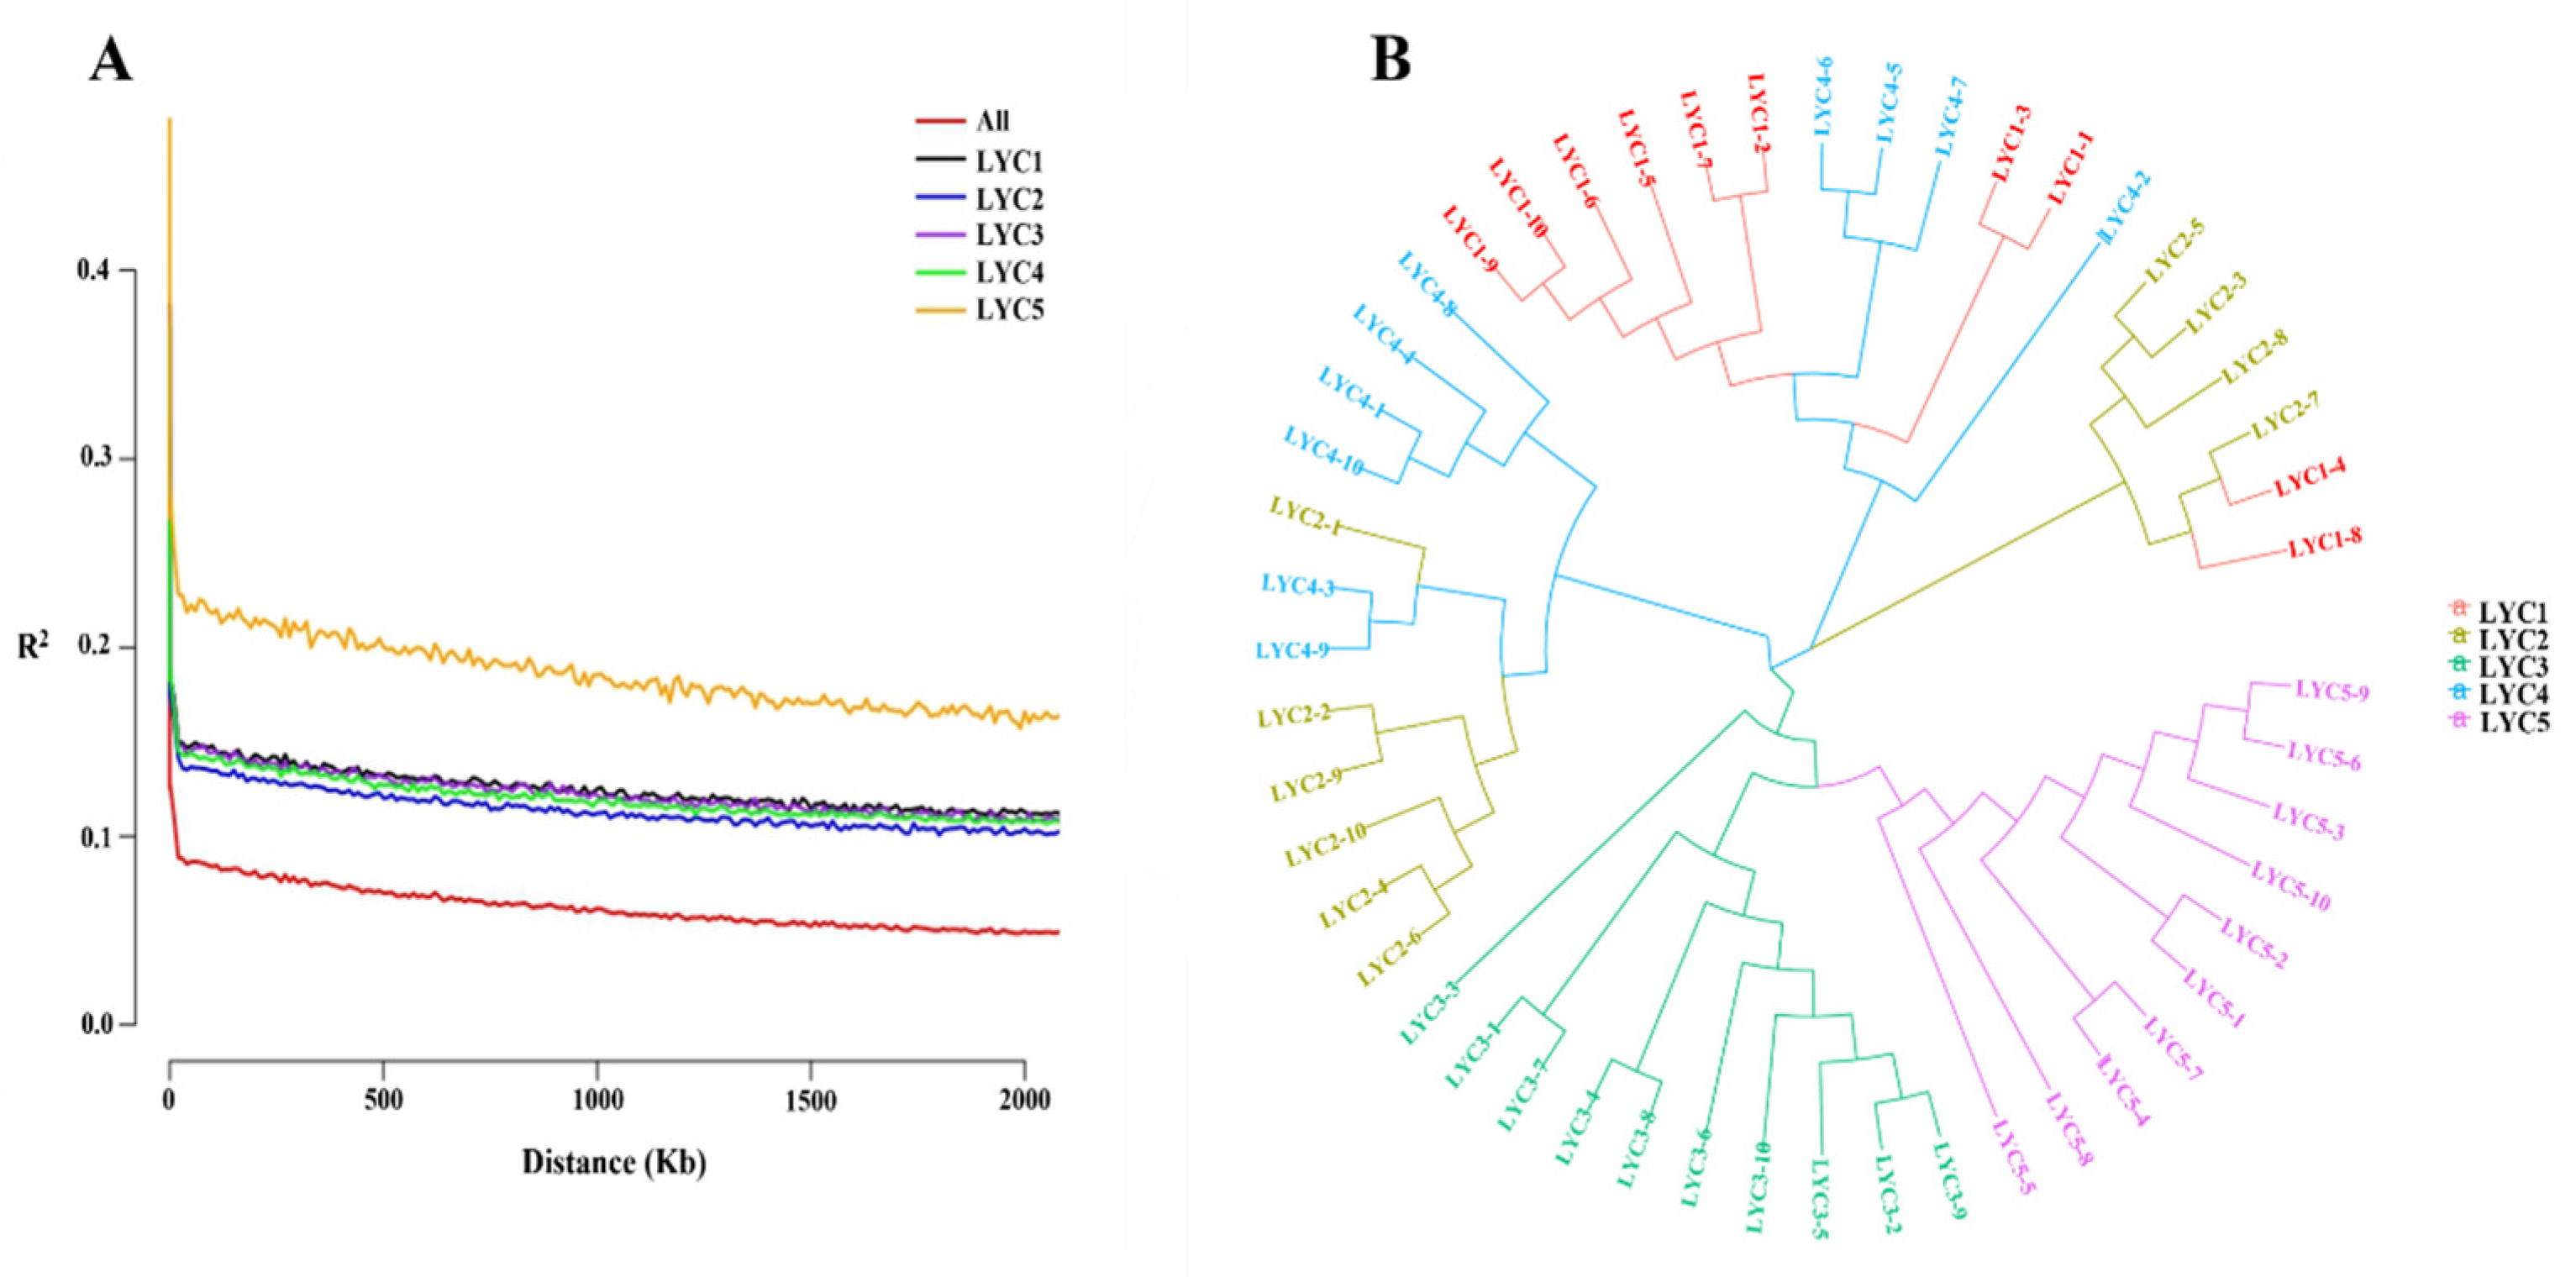
Ten tailfin samples of the fish from each group were conducted at Molbreeding Biotechnology Co., Ltd. (Shijiazhuang, Hebei, China) for the genetic diversity analysis of populations. The genotype of the samples was performed by using the DongHai Chip-1. Subsequently, its database construction and analysis were conducted using the Molbreeding online analysis platform (http://big.molbreeding.com/, accessed on 25 July 2024). Linkage disequilibrium analysis (LD) and phylogenetic tree were included in genetic diversity analysis of populations. LD was defined as non-random combinations between alleles at different genetic loci within a population. Phylogenetic trees were used to express evolutionary relationships between groups, and they could be inferred to be close or distantly related.

2.3. The Body Composition

The moisture, crude protein, crude lipid, and crude ash contents of the whole fish were measured with reference to the AOAC method [39,40]. First of all, the moisture and crude ash contents of the whole fish were burned at 105 °C and 550 °C to a constant weight, respectively. Next, the crude protein level of the whole fish was measured by using Kjeldahl Nitrogen Analyzer (KDN-19Y, Xianjian Instrument Co, Shanghai, China). Finally, the crude lipid content of the whole fish was measured with using Soxhlet Extraction Method (SXT-06, Hongji Instrument Co, Shanghai, China) (Extraction agent: petroleum ether).

2.4. Mucus Samples Collecting and Analyzing Parameters

The skin mucus samples were lightly scraped from the side surface of large yellow croakers with a scalpel. Samples were placed in 2.0 mL centrifuge tubes. Thus, the skin mucus samples were centrifuged for 10 min (4 °C and 12,000× g) to obtain the supernatant. The supernatant samples were used for analyzing antioxidants and immunity indicators. Among them, malondialdehyde (MDA, item number: YJ555268), superoxide dismutase (SOD, item number: YJ926247), and catalase (CAT, item number: YJ454948) were contained in the antioxidant indicators; alkaline phosphatase (ALP, item number: YJ555961), acid phosphatase (ACP, item number: YJ445860), lysozyme (LYS, item number: YJ556394), immunoglobulin M (Ig M, item number: YJ204789), and immunoglobulin T (Ig T, item number: YJ955010) were included in the immunity indicators. The above instructions for ELISA kits (Enzyme-linked Biotechnology Technology Ltd., Shanghai, China) were strictly referenced.

2.5. Skin Samples Collecting and Analyzing Parameters

Before the sample collection, large yellow croakers were anesthetized by using 3-aminobenzoic acid ethyl ester methanesulfonate (MS-222, 100 mg/L). Then, the chromatic value of back skin and abdomen skin of large yellow croakers in each group were measured in vivo with a Chroma Meter (CR-400, H. J. Unkel Int’l Trading Co., Ltd., Shanghai, China), adopting L*, a*, and b* standards specified by the International Commission on Illumination (CIE) in 1976 [41]. The color parameters were L*, a*, and b* for brightness value, red and green values, yellow and blue values, respectively. The measurement points of the back skin and abdomen skin are shown in Figure 2.
Large yellow croaker’s back skin and abdomen skin (length × width × height = 2 cm × 2 cm × 1.5 mm) in each group were randomly chosen to analyze Ig M and Ig T activities. The carotenoids (item number: YJ196581), lutein (item number: YJ289964), and melanin (item number: YJ965254) contents of the fish’s back skin and abdomen skin in each group were assessed by the ELISA kits. In addition, the back skin and abdomen skin were used to analyze the gene’s expression of pigment cells development and neural crest regulation.
From each group, the hematoxylin-eosin staining (H&E) tissue sections (Baiqiandu Biotechnology Co, Wuhan, China) were prepared by cutting three back skin and abdomen skin samples (length × width × height = 2 cm × 2 cm × 1.5 mm). They were glued to the filter paper to ensure straightness of the skin. Then, the back skin and abdomen skin were fixed with 4% paraformaldehyde and stored at 24 h. The back skin and abdomen skin were placed in a dehydrator with different concentrations of ethanol (75%, 85%, 90%, 95%, and anhydrous ethanol) in sequence. The xylene was used to make the skin clear. Then, the back skin and abdomen skin were dipped in wax in stages. The wax-impregnated skin was placed in an embedding machine for encapsulation. Next, the wax blocks were sliced on a slicer to a thickness of 4 μm. Finally, staining was performed using hematoxylin and eosin.

2.6. Real-Time PCR Quantitative

The Eastep® Super Kit (Promega Biotechnology Co., Ltd., Beijing, China) was used to extract the total RNA from the back and abdomen skin samples (approximately 30 mg) of large yellow croakers. The quality of the RNA was assessed by Nano Drop One assay (Thermo Fisher Scientific Inc., Shanghai, China) and agarose gel electrophoresis. The Reverse Transcription Kit (Biosharp Biotechnology Co., Hefei, Anhui, China) was used to transcribe into the cDNA. A Universal SYBR qPCR Master Mix (Biosharp Biotechnology Co., Hefei, Anhui, China) was used to perform the qRT-PCR, which used an applied biosystems real-time fluorescence quantitative PCR instrument (Thermo Fisher Scientific Inc., Shanghai, China). Forty cycles (95 °C and 2 min, 95 °C and 15 s, 60 °C and 30 s) were included in the reaction conditions. In the relative mRNA expression analysis, the β-actin was used as a reference gene. The data were calculated using the 2−ΔΔCt method [42]. The primer sequences of Table 2 were designed using Primer 5.0.

2.7. Statistical Analysis

The software SPPS 21.0 was used to analyze the experimental results using one-way variance analysis. Multiple comparisons were performed using Tukey’s test. The experimental results were presented as mean ± standard error (SE). A difference in p < 0.05 was deemed significant. GraphPad Prism 8.0, Image Pro Plus 6.0, and Origin Pro 10.1 were utilized to create experimental graphs.

3. Results

3.1. Diversity Analysis of Populations

As Figure 3 shows, the linkage disequilibrium (LD) was defined as a nonrandom combination between alleles at different genetic loci within a population. In general, LD factors (R2) above 0.8 were strongly correlated, and less than 0.1 could be considered uncorrelated (Figure 3A). The phylogenetic tree was used to describe the evolutionary relationship between populations, which could be inferred due to the closeness of kinship between populations. As is known from Figure 3B, five strains of large yellow croakers could be distinguished in this experiment.

3.2. The Body Components

As presented in Table 3, the crude ash level of the whole fish was not significantly different between all groups (p > 0.05). The moisture content of the whole fish in the LYC1 group was not significantly different from the LYC3 and LYC5 groups, but significantly higher than those in the LYC2 and LYC4 groups (p < 0.05). The crude protein content of the whole fish in the LYC1 and LYC3 groups was significantly higher than those in the LYC2, LYC4, and LYC5 groups (p < 0.05). The whole fish’s crude lipid content in the LYC1 group was not significantly different from those in the LYC3 group but significantly lower than those of the other three groups (p < 0.05).

3.3. The Mucus Antioxidant Indices

The mucus antioxidant indicators of large yellow croakers are given in Table 4. In the five experimental groups, there was no significant difference in the MDA content of the mucus (p > 0.05). The SOD and CAT activities in the LYC5 group were significantly higher than those in the LYC2, LYC3, and LYC4 groups but significantly lower than that of the LYC1 group (p < 0.05).

3.4. The Mucus Immune Indices

The fish’s mucus ALP, ACP, and LYS levels in the LYC1 group were not significantly different from the LYC3 group, while significantly higher than those in the LYC2, LYC4, and LYC5 groups (p < 0.05). The Ig M and Ig T activities of the LYC3 group were significantly higher than those of the LYC2, LYC4, and LYC5 groups, while significantly lower than that of the LYC1 group (p < 0.05) (Table 5).

3.5. Histological Analysis of the Skin

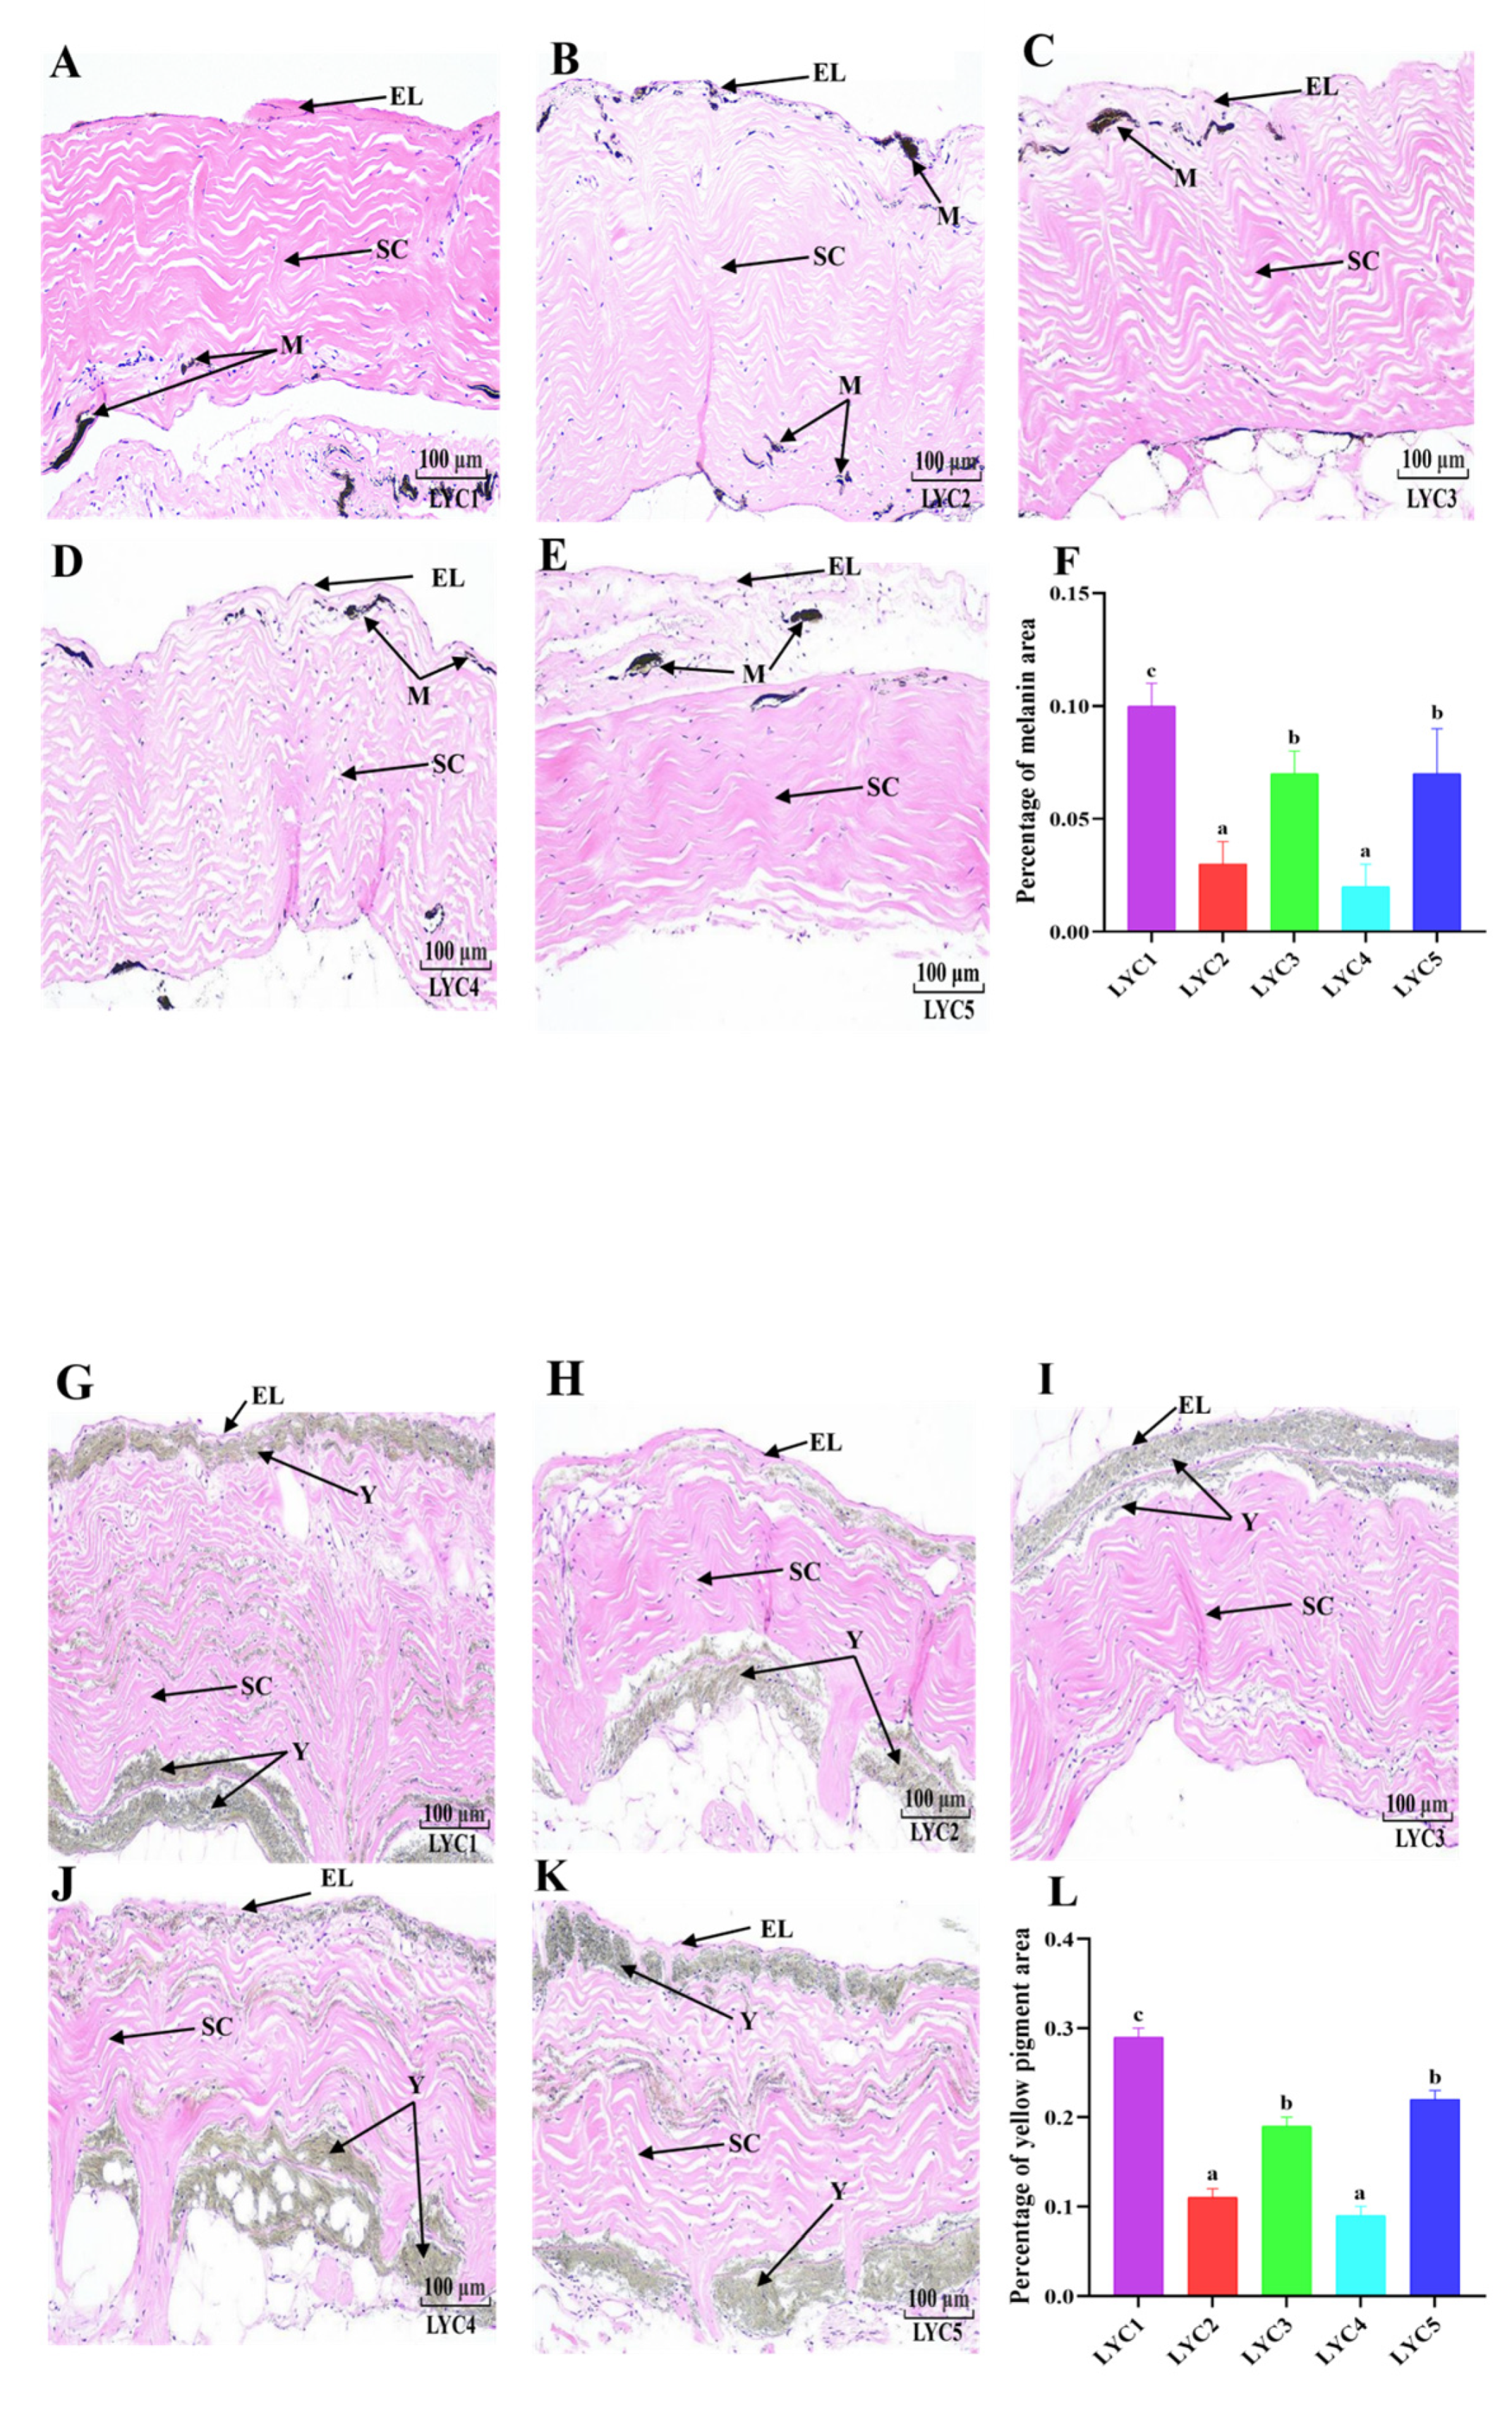
The back and abdomen skin morphology results are shown in Figure 4. The epidermal layer and stratum compactum of the back and abdomen skin in the LYC1, LYC3, and LYC5 groups were neater than those of the LYC2 and LYC4 groups (Figure 4A–E,G–K). The melanin area percentage of back skin in the LYC3 and LYC5 groups was significantly lower than that in the LYC1 group, while significantly higher than those in the LYC2 and LYC4 groups (p < 0.05) (Figure 4F). The yellow pigment area percentage of abdomen skin in the LYC3 and LYC5 groups was significantly higher than those in the LYC2 and LYC4 groups, but significantly lower than that of the LYC1 group (p < 0.05) (Figure 4L).

3.6. Skin Chroma Value

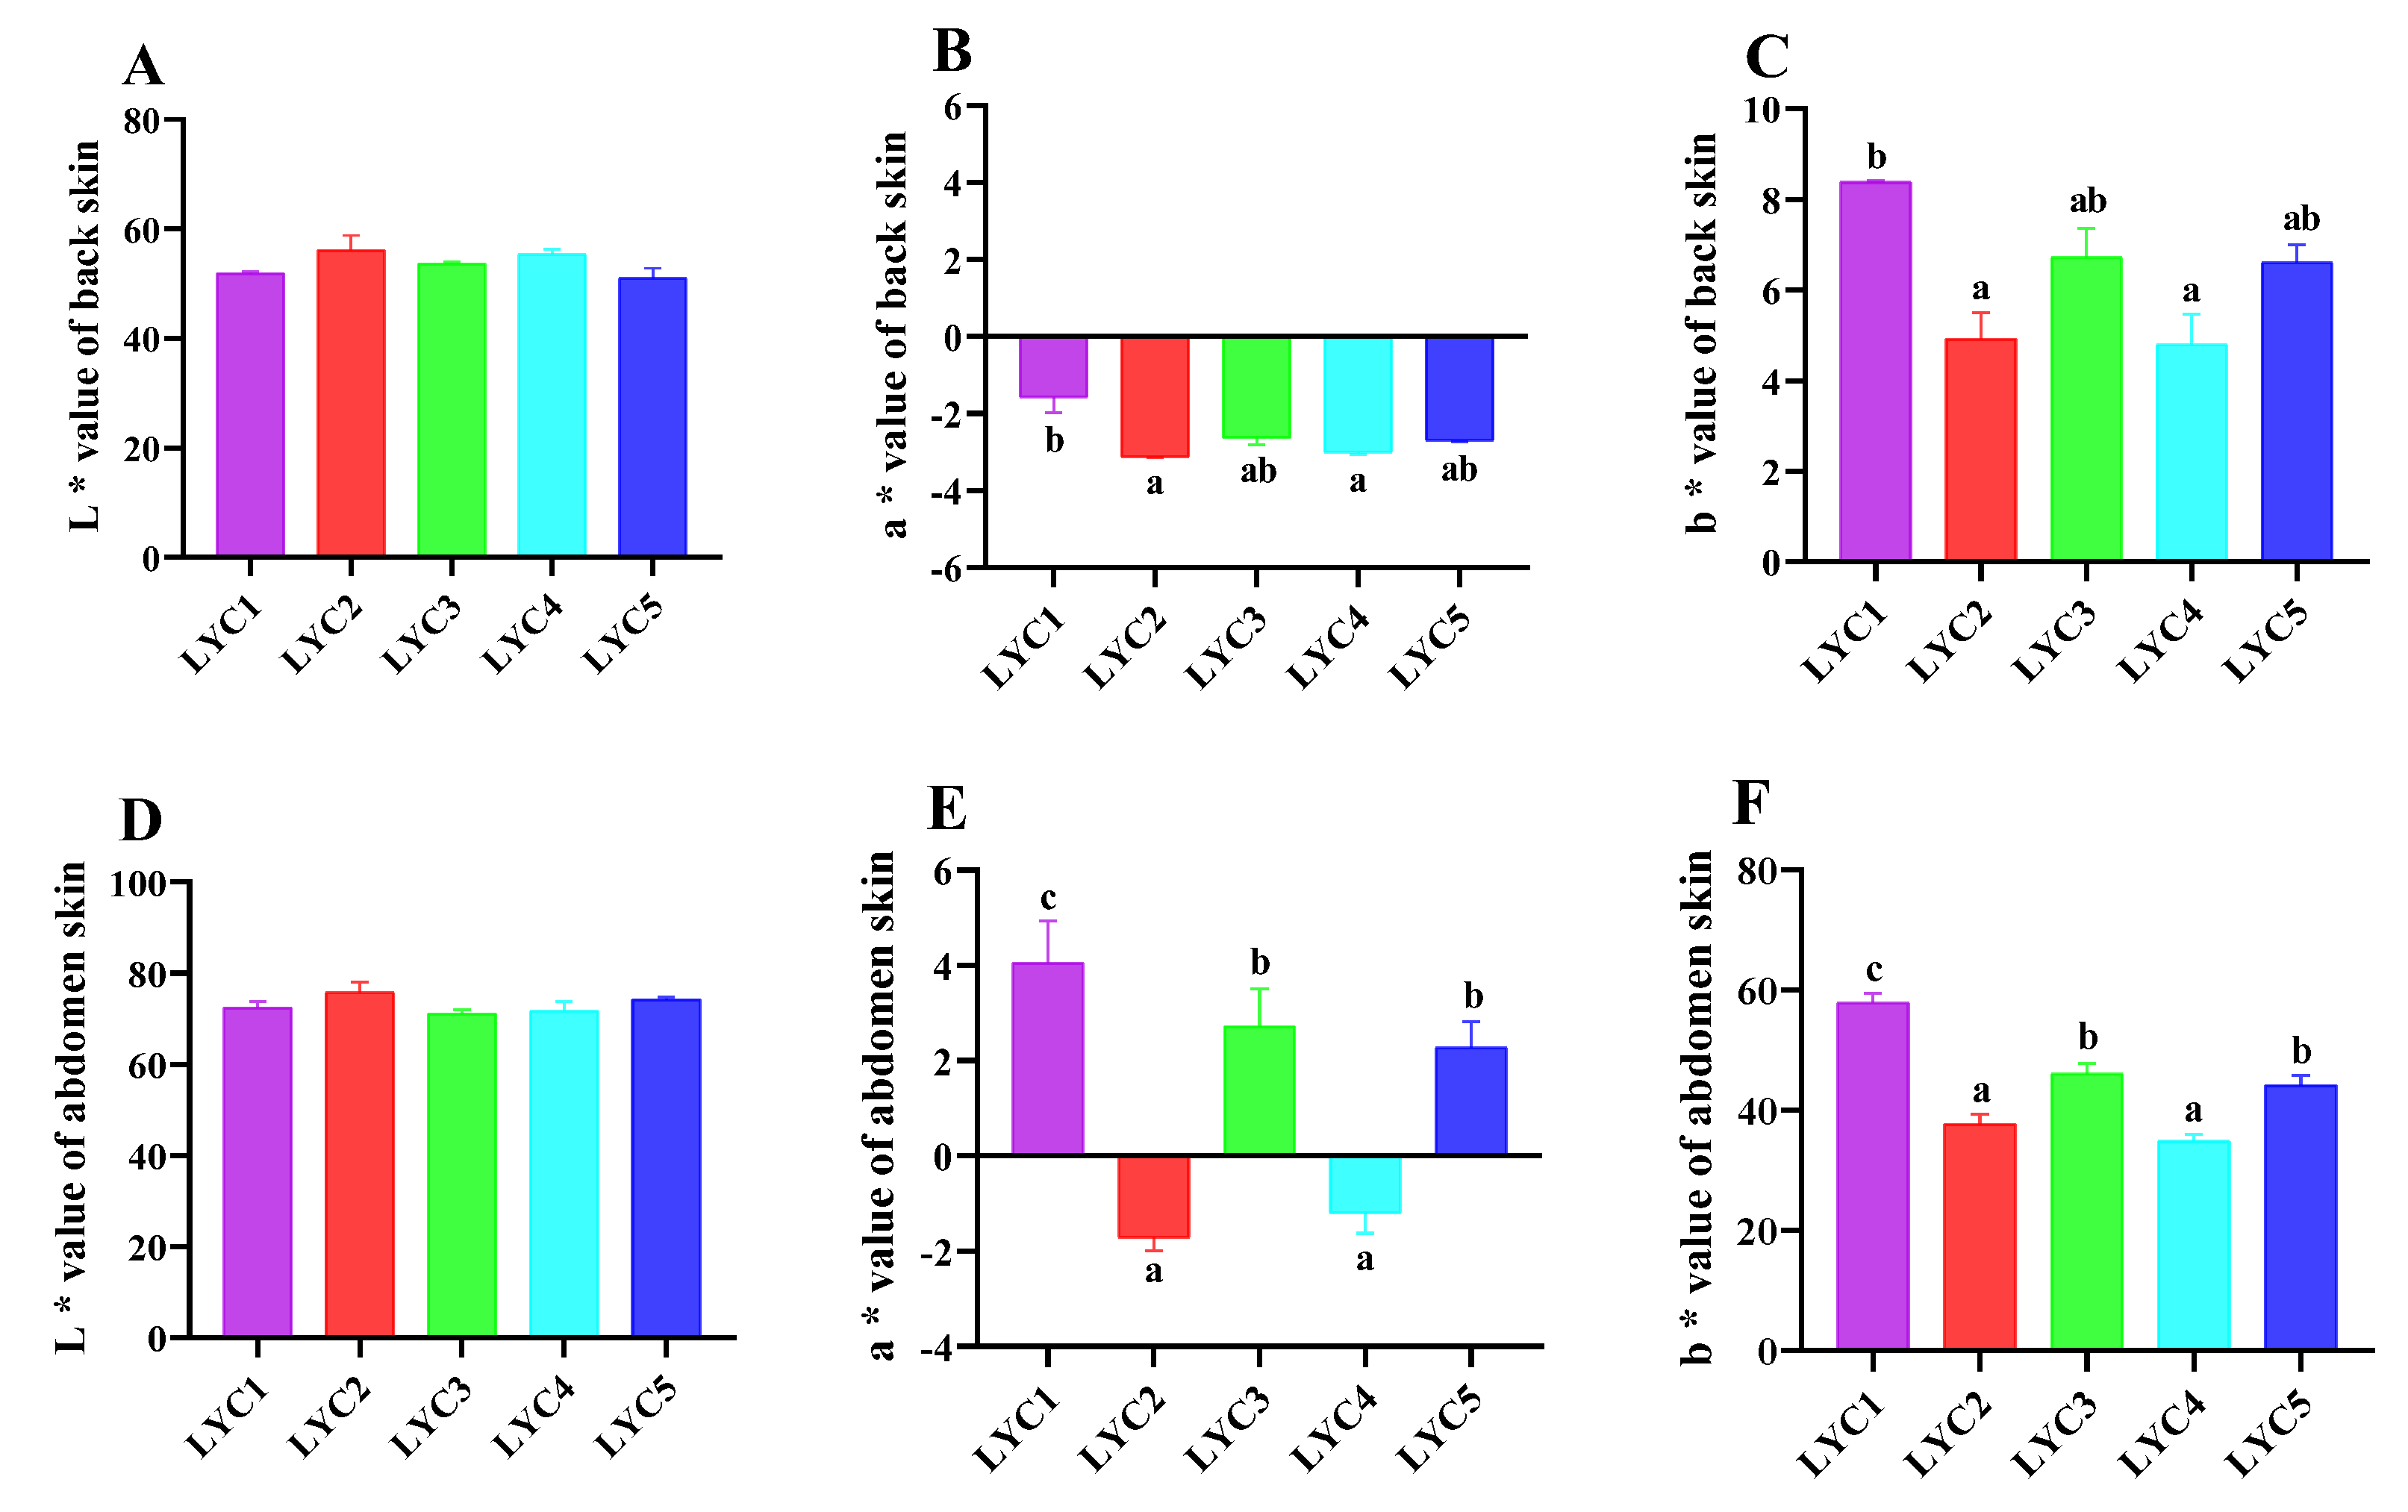
There was no statistically significant difference in the back skin and abdomen skin L* values of all experimental groups (p > 0.05) (Figure 5A,D). The a* and b* values of back skin in the LYC1 group were not significantly different from the LYC3 and LYC5 groups but significantly higher than those in the rest of the two groups (p < 0.05) (Figure 5B,C). The a* and b* values of abdomen skin in the LYC3 and LYC5 groups were significantly higher than those in the LYC2 and LYC4 groups, but significantly lower than that in the LYC1 group (p < 0.05) (Figure 5E,F).

3.7. Skin Immune Indicators

As shown in Figure 6, the back and abdomen skin TP contents were similar in each group. The Ig M and Ig T activities of back skin and abdomen skin in the LYC1 group were not significantly different from the LYC3 group but significantly higher than those in the LYC2, LYC4, and LYC5 groups (p < 0.05) (Figure 6A,B).

3.8. Skin Pigmentation

The back skin melanin contents of the LYC3 and LYC5 groups were significantly lower than those in the LYC2 and LYC4 groups, while significantly higher than that of the LYC1 group (p < 0.05) (Figure 7A). The back skin carotenoid levels of the LYC1 and LYC3 groups were significantly higher than those of the rest of the three groups (p < 0.05). The fish’s back skin lutein content in the LYC5 group was significantly higher than those in the LYC2 and LYC4 groups but significantly lower than those in the LYC1 and LYC3 groups (p < 0.05).
Compared to the LYC1 group, the abdomen skin melanin content of the LYC3 group was not significantly different but significantly lower than those of the remaining three groups (p < 0.05) (Figure 7B). The abdomen skin carotenoid level of the LYC1 group was not significantly different from the LYC3 and LYC5 groups, while significantly higher than those in the LYC2 and LYC4 groups (p < 0.05). The abdomen skin lutein contents in the LYC4 and LYC5 groups were significantly higher than that in the LYC2 group but significantly lower than those in the LYC1 and LYC3 groups (p < 0.05).

3.9. The Neural Crest Regulation of mRNA Expression in the Skin

From Figure 8A,B, compared with the LYC1 group, the alk, ltk, foxd3, and pax3 mRNA expressions of back skin and abdomen skin were not significantly different from the LYC3 and LYC5 groups but significantly higher than those in the LYC2 and LYC4 groups (p < 0.05). The sox10 mRNA expression of back skin and abdomen skin in the LYC2 and LYC4 groups was significantly higher than those in the rest of the three groups (p < 0.05).

3.10. The mRNA Expression of Back Skin Melanin Synthesis

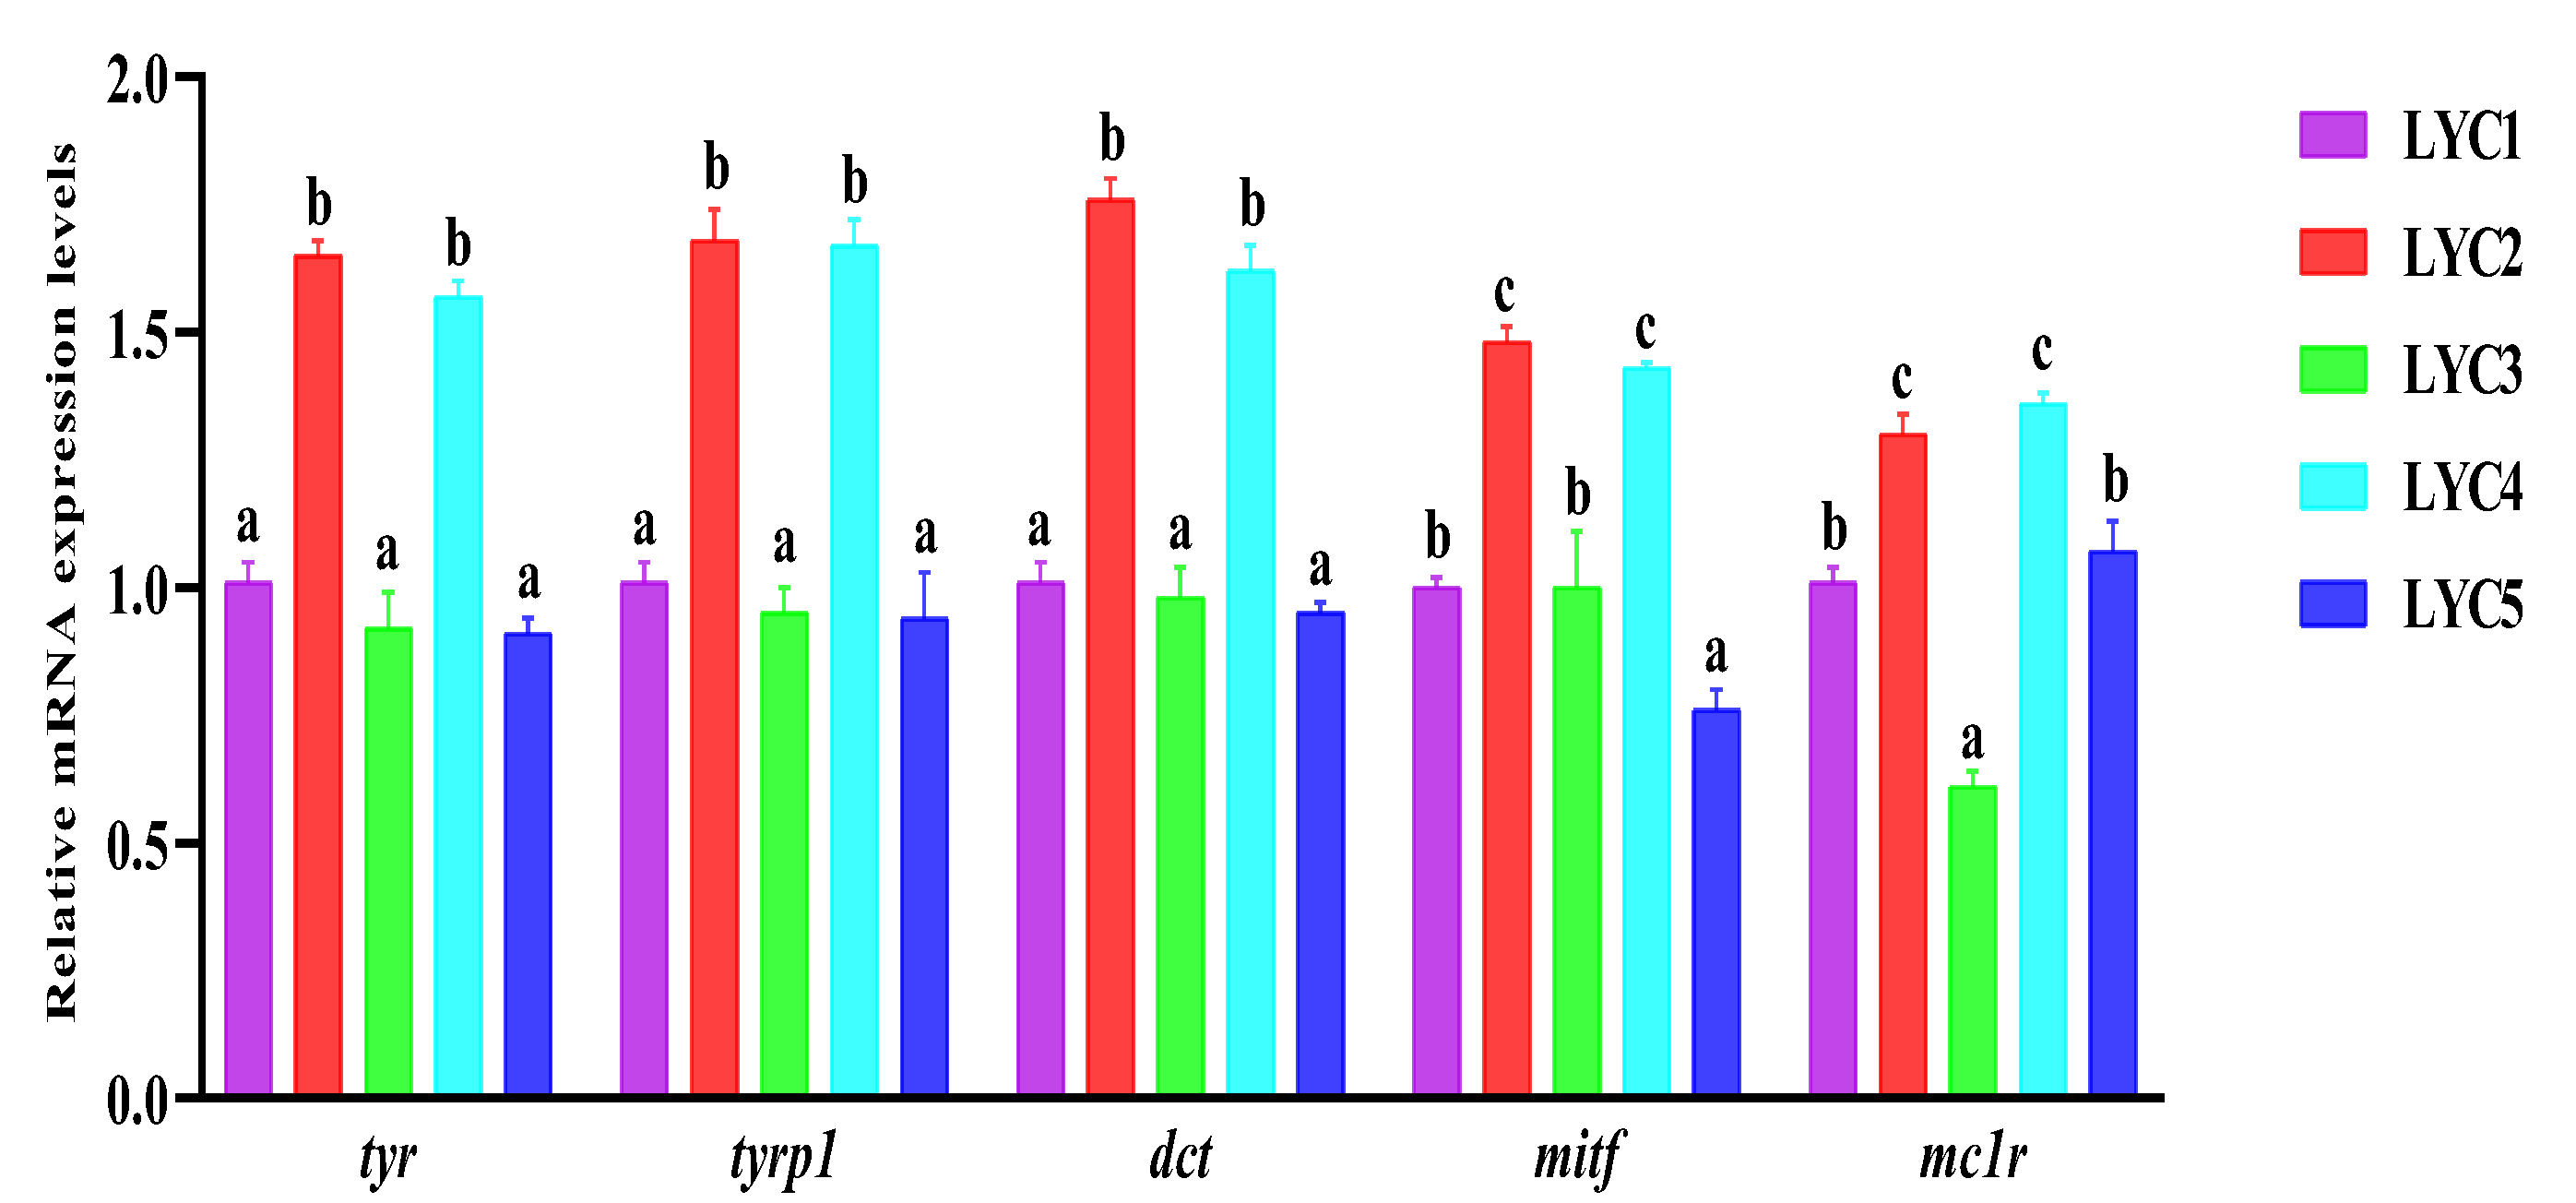
As Figure 9 shows, compared with the LYC1 group, the mRNA expressions of tyr, tyrp1, and dct in the LYC3 and LYC5 groups were not significantly different, while significantly lower than those in the rest of the two groups (p < 0.05). The mitf mRNA expression of the LYC1 and LYC3 groups was significantly higher than that in the LYC5 group but significantly lower than those of the LYC2 and LYC4 groups (p < 0.05). The mc1r mRNA expression of the LYC1 and LYC5 groups was significantly higher than that in the LYC3 group but significantly lower than those of the LYC2 and LYC4 groups (p < 0.05).

3.11. The mRNA Expression of Iridocytes and Yellow Pigment Cells Related to Genes in the Abdomen Skin

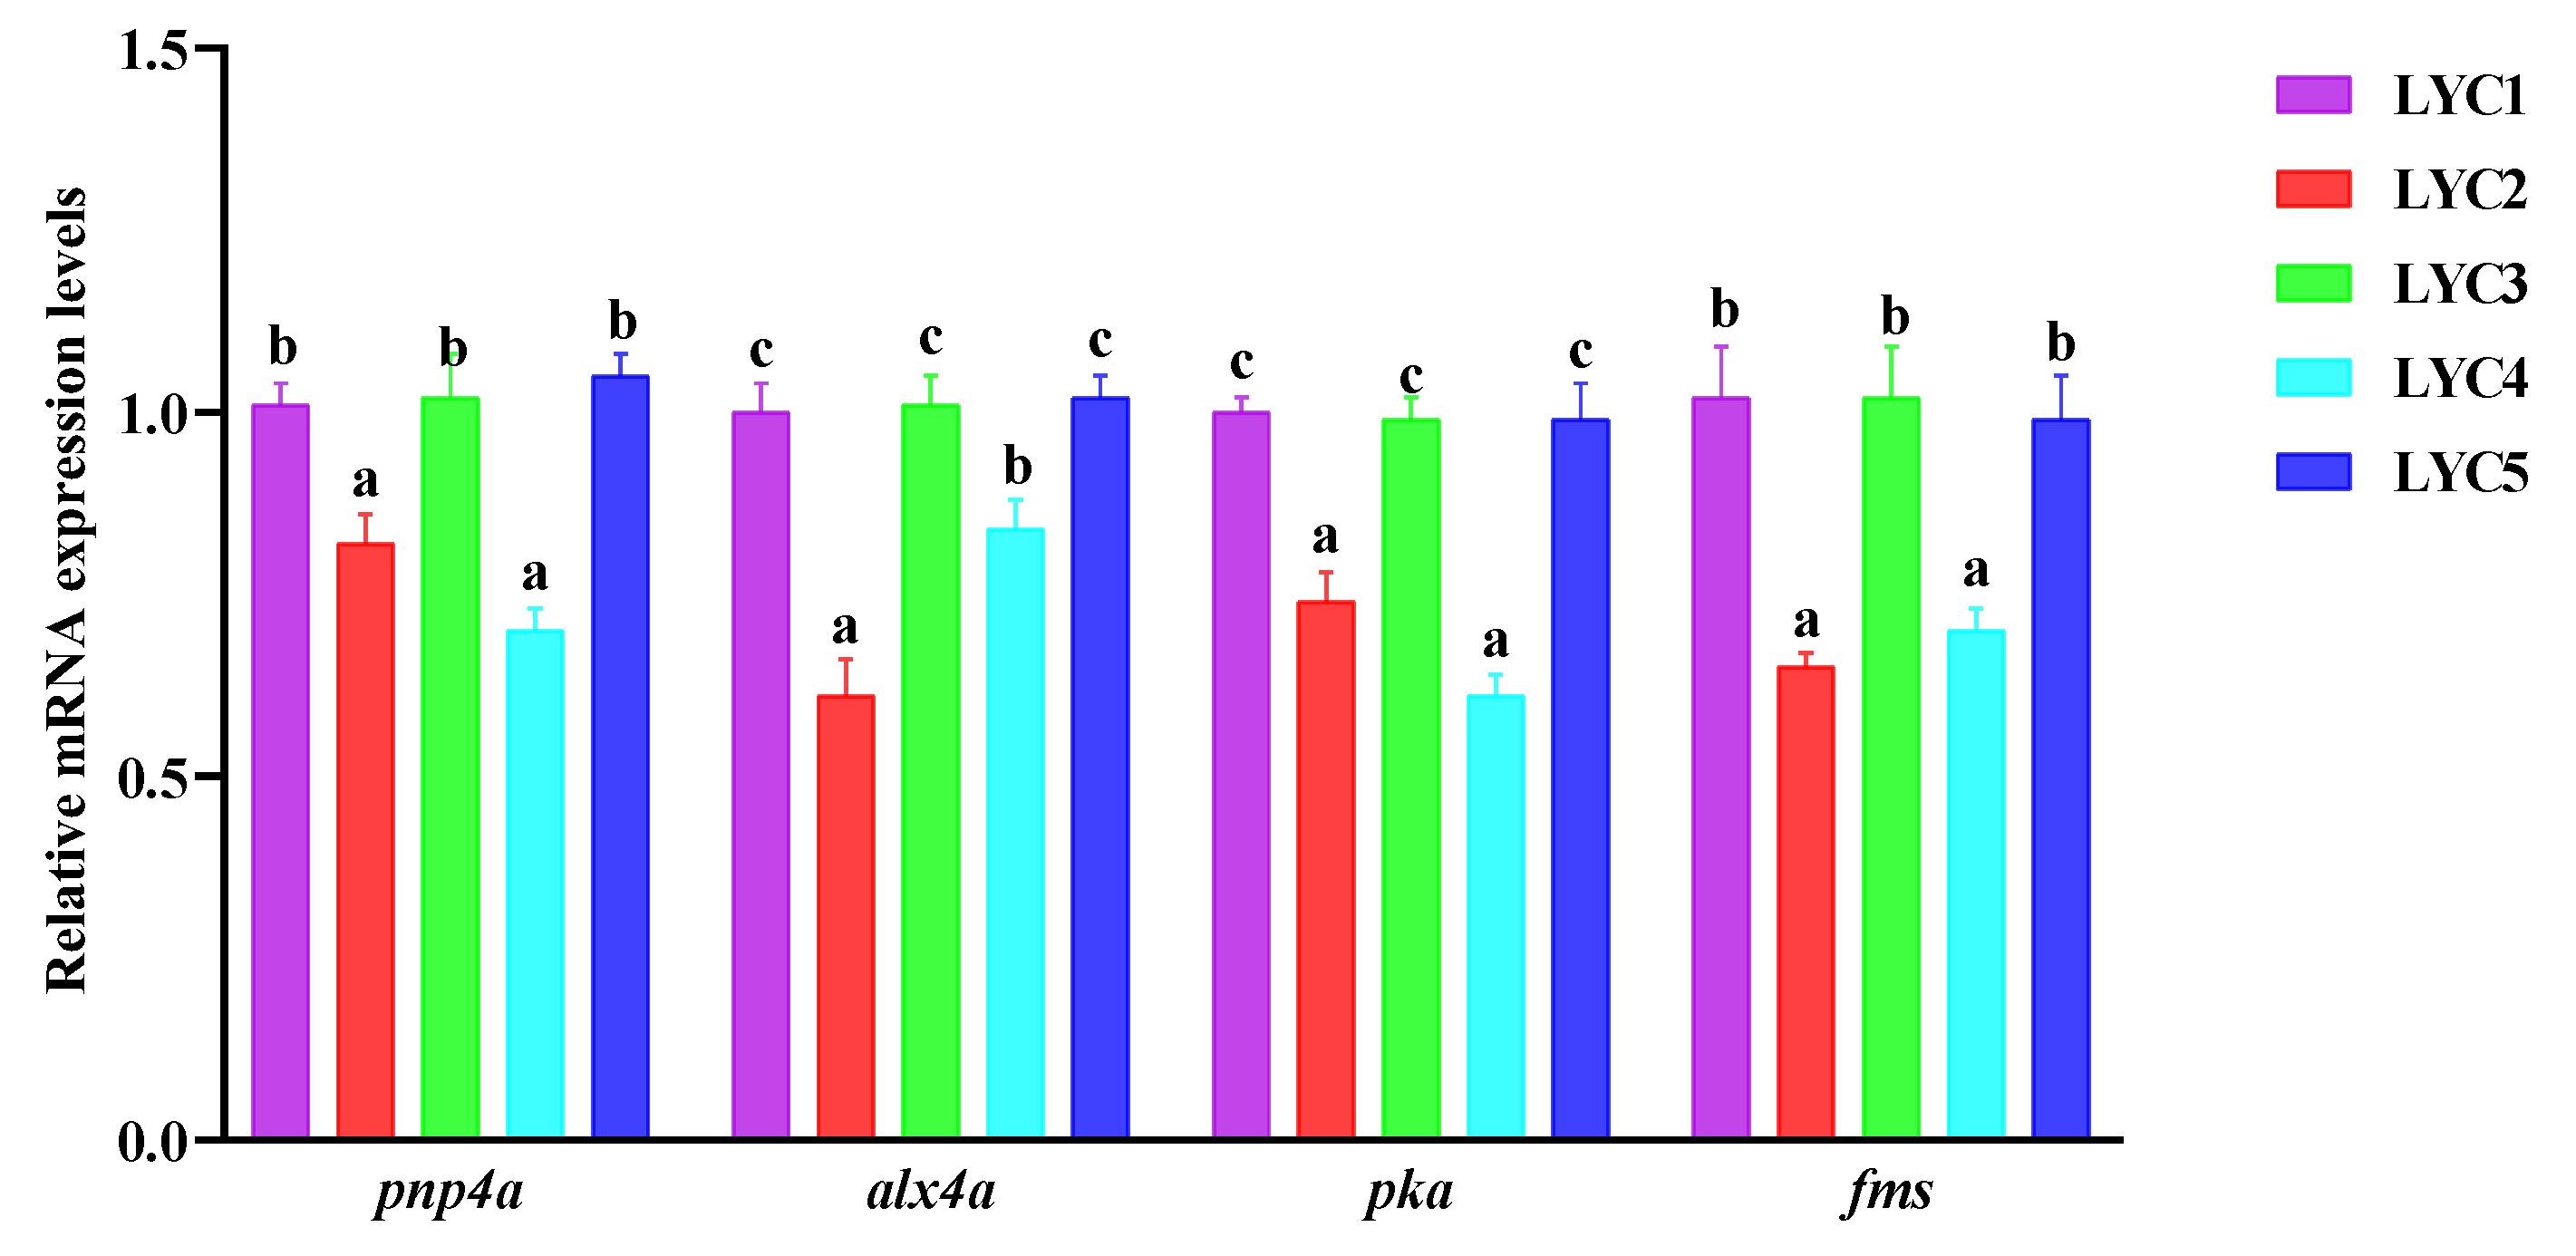
The mRNA expressions of iridocytes and yellow pigment cells related to genes in the abdomen skin are shown in Figure 10. The pnp4a, alx4a, pka, and fms mRNA expressions of the LYC1 group were not significantly different from the LYC3 and LYC5 groups but significantly higher than those in the LYC2 and LYC4 groups (p < 0.05).

4. Discussion

As the economy has grown quickly and people’s quality of life has improved, more attention has been paid to the nutritional benefits of fish [43,44,45,46]. Body composition contents have been used as important parameters for evaluating the growth performance and nutritional values of the fish [47,48]. An early study in different strains of large yellow croakers had proven that differences were observed in moisture, crude protein, and crude lipid content [49]. In the same culture conditions, compared with unselected large yellow croakers, Fufa 1 and Yongdai 1 were selected after five consecutive generations with significantly lower crude lipid content and higher crude protein and moisture contents [9,50]. In this study, compared with the wild large yellow croaker (LYC1 group), the crude protein and crude lipid contents of the whole fish were not significantly different from the LYC3 group. Meanwhile, the moisture content of the whole fish in the LYC1 group was not significantly different from the LYC3 and LYC5 groups. It indicated that the body components of the LYC3 group were closest to the wild large yellow croaker. Nevertheless, the crude protein and moisture contents of the LYC2 and LYC4 groups were significantly lower than those in the LYC1 group. And the crude lipid contents of the LYC2 and LYC4 groups were significantly higher than those in the LYC1 group. This was most likely caused by a variety of food sources, reduced energy expenditure, variations in the composition of their diet, and genetic adaptations to the wild large yellow croakers’ natural growing conditions [1,2].
As the fish’s first line of defense against invasive pathogens, its skin is essential to its immune system [51]. The skin of the fish not only exhibits a physical barrier function but also provides biological and chemical protection through secreting the mucus [52]. A variety of anti-microbial factors are contained in the mucus of the fish, such as ALP, ACP, LYS, and immunoglobulins. As an important indicator of non-specific immunity in fish, ALP, ACP, and LYS can enhance the body’s defense by improving the function of phagocytosis [53]. Immunoglobulins are primarily responsible for the humoral immune response in fish, which can specifically recognize and bind to antigens, thereby performing an immune function [54]. In this study, the ALP, ACP, and LYS activities of the mucus in the LYC3 group were not significantly different from the LYC1 group, and the Ig M and Ig T activities of the mucus, back skin, and abdomen skin in the LYC3 group were significantly lower than those in the LYC1 group, but significantly higher than those in the LYC2, LYC4, and LYC5 groups. This indicated that immune enzyme activities of large yellow croakers in the LYC3 group were higher to enhance the fish’s immunity. In addition, the skin mucus of the fish also contained antioxidant substances (such as SOD and CAT) [55]. The O2- was catalyzed by the SOD to H2O2, and then H2O2 was catalyzed by the CAT to H2O and O2, thereby protecting the organism from oxidative damage [12]. In the present experiment, compared with the LYC1 group, the SOD and CAT activities of the mucus in the LYC5 group were not significantly different, while significantly higher than that of the LYC2, LYC3, and LYC4 groups. This was attributed to significantly higher SOD and CAT activities in the mucus of the LYC5 group, which effectively scavenged harmful free radicals in fish and enhanced the antioxidant capacity of the organism, thus making the fish healthier [56].
The body color of the fish mainly depends on the accumulation of carotenoid contents in the skin, of which lutein is one of the critical pigments [57]. As a well-known and highly effective colorant and antioxidant, lutein is widely used to improve the deposition of pigmentation and antioxidant capacity of the fish [58]. A study had shown that lutein could mitigate oxidative stress in a microplastics challenge but at the expense of pigment deposition [59]. This indicated that lutein could react with oxidative free radicals and consume itself in the process of antioxidants in vivo [60]. In the present study, the melanin, carotenoid, and lutein contents of different strains of large yellow croaker were found to be different, probably related to the differences in the genetic background of different strains of large yellow croakers, resulting in different pigment metabolism and storage capacity. The percentage of melanin area and yellow pigment area in the LYC3 and LYC5 groups was significantly lower than that in the LYC1 group, while significantly higher than those in the remaining two groups by showing the tissue section of back and abdomen skin (H&E staining). The coloration values of the skin were further examined, and the results revealed that the a* and b* values of abdominal skin in the LYC3 and LYC5 groups were significantly higher than those in the LYC2 and LYC4 groups, while significantly lower than that in the LYC1 group, which followed the same trend as that of the percentage of yellow pigment area in the abdomen skin. A study in Rivulated rabbitfish (Siganus rivulatus) was validated and showed that lutein could increase the a* and b* values of the abdominal skin as well as enhance its antioxidant enzyme activity, thereby improving the health of the fish [58]. However, a higher SOD and CAT activity with lower melanin content was observed in the LYC5 group in the present experiment. This suggested that enhanced SOD and CAT activity might contribute to the reduction in melanin production. A study verified that the purslane treatment significantly increased the SOD and CA activity but decreased melanin content [61].
The kind, quantity, and distribution of pigment cells as well as the control of associated important genes are also factors in the fish’s body color [18]. A study in Zebrafish found that the knockout of the foxd3 gene led to differentiation defects in neural crest derivatives (such as melanin cells, yellow pigment cells, and iridescent cells), in which iridescent cells were massively reduced, while the melanin cells and yellow pigment cells were largely unaffected [62]. The gene expression of foxd3 was expressed in pre-migratory neural crest cells and required for iridescent cells’ development and differentiation [63]. Investigations in Zebrafish demonstrated that the alk and ltk genes had an influence on the onset of the body color pattern of the organism through participating in the regulation of the entorhinal crest, in which overexpression of both promoted the formation and increase in iridescent cells [20,21,64]. In the present study, the foxd3, alk, and ltk mRNA expressions of back and abdomen skin in the LYC1 group were not significantly different from the LYC3 and LYC5 groups, while significantly higher than those of the remaining two groups. In addition, in this experiment, compared to the LYC1 group, the pnp4a and alx4a mRNA expressions of abdomen skin in the LYC3 and LYC5 groups were not significantly different, but significantly higher than that of the remaining two groups. The pnp4a gene was a marker gene for early iridocyte development and differentiation. As a transcription factor, alx4a was highly enriched in iridocytes. Research in Zebrafish revealed that the knockout of the pnp4a and alx4a genes in the skin led to the reduction in pigmentation in the iridescent cells [65].
The growth of iridescent cells encourages the production of melanin and yellow pigment cells, and the various pigment cells work together to control the development of body color patterns [66]. A study in Koi carp (Cyprinus carpio var. koi) demonstrated that the gene expression of pax3 was significantly higher, corroborating its important role in the development of yellow pigment cells [67]. The pax3 was required for the differentiation of Zebrafish neural crest cells into yellow pigmented cells with an important role in the development of the neural crest [68]. In the present study, compared to the LYC1 group, the pax3 mRNA expression of back skin and abdomen skin in the LYC3 and LYC5 groups was not significantly different, while significantly higher than those in the remaining two groups. This suggested that the higher pax3 mRNA expression in the skin promoted the differentiation of neural crest cells into yellow pigment cells. In this study, the mRNA expressions of pka and fms in the abdominal skin were significantly higher in the LYC1, LYC3, and LYC5 groups than in the LYC2 and LYC4 groups. As an essential gene for yellow pigment cytokinesis, fms and pka were involved in yellow pigment cells’ differentiation by phosphorylating proteins to affect body color in fish [12]. Studies in Danio albolineatus and Poecilia reticulata were found to promote the development of yellow pigment cells by increasing the number and distribution of yellow pigment cells through up-regulation of fms and pka genes’ expressions [69,70]. Furthermore, in the present study, compared to the LYC1 group, the sox10, tyr, tyrp1, dct, mitf, and mc1r mRNA expressions of back skin in the LYC3 and LYC5 groups were not significantly different but significantly lower than those in the LYC2 and LYC4 groups. The sox10 and mc1r could encode transcription factors in melanin synthesis by inhibiting the expression of mitf and tyrosinase family genes (tyr, tyrp1, and dct), thereby inhibiting melanin synthesis [71,72,73]. Further analysis of the melanin content revealed that the LYC1 group’s back skin had significantly less melanin than the LYC2 and LYC4 groups, but it was not significantly different from the LYC3 and LYC5 groups. This suggested that large yellow croakers in the LYC3 group had lower melanin content in their skin due to decreased expression of genes involved in melanin synthesis.

5. Conclusions

In conclusion, the chromatic values, crude protein, crude lipid, and pigment contents of the LYC3 group were closest to those of the LYC1 group. The antioxidant and immune enzymes’ activities in the skin and mucus of the LYC3 group were significantly higher than those in the LYC2 and LYC4 groups, which enhanced the antioxidant capacity and immunity of the fish. In addition, compared with the LYC1, LYC3, and LYC5 groups, the mRNA expressions of relevant regulating melanin cells were significantly up-regulated in the skin of the LYC2 and LYC4 groups, while the mRNA expressions of relevant regulating iridocytes and yellow pigment cells were significantly down-regulated in the skin of the LYC2 and LYC4 groups. In-depth study of the functions and interactions of these genes could help to understand the molecular mechanism of body color formation in large yellow croakers and provide theoretical guidance for the selection and breeding of economic fish.

Author Contributions

Conceptualization, B.W., J.Z., M.Z., Y.Z., and N.L.; methodology, H.D., Q.G., B.W., J.Z., M.Z., Y.Z., N.L., and S.Z.; data curation, H.D.; writing—original draft, H.D.; project administration, Q.G. and S.Z.; funding acquisition, Q.G. and S.Z. All authors have read and agreed to the published version of the manuscript.

Funding

This research was funded by the National Key Research and Development Program of China, grant number 2023YFD2401400; the Central Public-interest Scientific Institution Basal Research Fund, ECSFR, CAFS, grant number 2024QT01, 2022ZD02; and the Startup Fund for Advanced Talents of Ningde Normal University, grant number 2024Y09.

Institutional Review Board Statement

For this experiment, ethical approval was obtained from the Ethics Committee of Shanghai Ocean University (SHOU-DW-2022-059) for handling large yellow croakers.

Informed Consent Statement

Not applicable.

Data Availability Statement

The data presented in this study are available in the main article.

Conflicts of Interest

The authors declare no conflicts of interest.

References

  1. Chen, S.; Su, Y.; Hong, W. Aquaculture of the large yellow croaker. In Aquaculture in China: Success Stories and Modern Trends; Wiley Online Library: Hoboken, NJ, USA, 2018; Volume 2018, pp. 297–308. [Google Scholar]
  2. Yuan, J.; Lin, H.; Wu, L.; Zhuang, X.; Ma, J.; Kang, B.; Ding, S. Resource status and effect of long-term stock enhancement of large yellow croaker in China. Front. Mar. Sci. 2021, 8, 743836. [Google Scholar] [CrossRef]
  3. Fisheries Administration of the Ministry of Agriculture and Rural Areas; National Fisheries Technology Extension Center; China Society of Fisheries. Fishery Statistical Yearbook 2024; Chinese Agricultural Press: Beijing, China, 2024. (In Chinese) [Google Scholar]
  4. Lei, C.; Ke, H.; Huo, Y.; Yang, Q.; Liang, P. Physicochemical, flavor, and microbial dynamic changes of cured large yellow croaker (Larimichthys crocea) roe. ACS Food Sci. Technol. 2023, 3, 683–698. [Google Scholar] [CrossRef]
  5. Shi, Y.; Zheng, Y.; Li, B.; Yang, X.; Guo, Q.; Liu, A. Prevention of quality characteristic decline in freeze-thawed cultured large yellow croaker (Larimichthys crocea) using flammulina velutipes polysaccharide. Food Sci. Nutr. 2023, 11, 181–190. [Google Scholar] [CrossRef]
  6. Ren, Q.Q.; Sun, M.; Xie, B.; Zhang, L.L.; Chen, Y.; Liu, M. Evaluating performance of data-limited management procedures in an ecosystem perspective: A case study for Larimichthys crocea (Sciaenidae) in the Min River Estuary, China. Ecol. Indic. 2023, 146, 109772. [Google Scholar] [CrossRef]
  7. Wu, L.; Li, J.; Tong, F.; Zhang, J.; Li, M.; Ding, S. Resource assessment of Larimichthys crocea in the East China Sea based on eDNA analysis. Front. Mar. Sci. 2022, 9, 890756. [Google Scholar] [CrossRef]
  8. Xie, S.; Jiang, L.; Song, W.; Zheng, J.; Liu, Y.; Chen, S.; Yan, X. Skeletal muscle features of different populations in large yellow croaker (Larimichthys crocea): From an epigenetic point of view. Front. Mol. Biosci. 2024, 11, 1403861. [Google Scholar] [CrossRef] [PubMed]
  9. Yu, M.; Xie, Q.; Wei, F.; Wu, X.; Xu, W.; Zhan, W.; Liu, F.; Guo, D.; Niu, B.L.; Lou, B. Development and identification of a sex-specific molecular marker in Dai-qu stock large yellow croaker (Larimichthys crocea). Aquaculture 2022, 555, 738172. [Google Scholar] [CrossRef]
  10. Zhou, L.; Zhou, R.; Xie, X.; Yin, F. Characteristics and risk assessment of cryptocaryoniasis in large yellow croaker (Larimichthys crocea) at different densities in industrialized aquaculture. Aquaculture 2024, 582, 740501. [Google Scholar] [CrossRef]
  11. Li, L.; Shi, F.; Wang, C. Fish image recognition method based on multi-layer feature fusion convolutional network. Ecol. Inform. 2022, 72, 101873. [Google Scholar] [CrossRef]
  12. Luo, M.; Lu, G.; Yin, H.; Wang, L.; Atuganile, M.; Dong, Z. Fish pigmentation and coloration: Molecular mechanisms and aquaculture perspectives. Rev. Aquac. 2021, 13, 2395–2412. [Google Scholar] [CrossRef]
  13. Nilsson, S.H.; Aspengren, S.; Wallin, M. Rapid color change in fish and amphibians-function, regulation, and emerging applications. Pigment. Cell Melanoma Res. 2013, 26, 29–38. [Google Scholar] [CrossRef] [PubMed]
  14. Zhang, Y.; Wang, T.; Zhang, X.; Wei, Y.; Chen, P.; Zhang, S.; Du, Z. Observation of body color formation and pigment cells in grey-black and golden Paramisgumus dabryanus. Aquac. Res. 2022, 53, 2657–2669. [Google Scholar] [CrossRef]
  15. Parichy, D.M. Evolution of pigment cells and patterns: Recent insights from teleost fishes. Curr. Opin. Genet. Dev. 2021, 69, 88–96. [Google Scholar] [CrossRef]
  16. Subkhankulova, T.; Camargo Sosa, K.; Uroshlev, L.A.; Nikaido, M.; Shriever, N.; Kasianov, A.S.; Kelsh, R.N. Zebrafish pigment cells develop directly from persistent highly multipotent progenitors. Nat. Commun. 2023, 14, 1258. [Google Scholar] [CrossRef]
  17. Liu, X.; Wang, S.; Feng, Q.; Cheng, L.; Teng, R.; Wei, L.; Yuan, D. Thyroid hormone regulates both melanin and non-melanin pigmentation in Sinibrama taeniatus via three types of chromophores. Front. Mar. Sci. 2024, 11, 1482306. [Google Scholar] [CrossRef]
  18. Kyriakoudi, S.A.; Chatzi, D.; Dermitzakis, I.; Gargani, S.; Manthou, M.E.; Meditskou, S.; Theotokis, P. Genetic identity of neural crest cell differentiation in tissue and organ development. Front. Biosci. Landmark 2024, 29, 261. [Google Scholar] [CrossRef] [PubMed]
  19. Leblanc, G.G.; Bronner-Fraser, M.E. Neural crest cell differentiation. In Development, Regeneration and Plasticity of the Autonomic Nervous System; Taylor & Francis Group: Abingdon, UK, 2024; Volume 2024, pp. 95–137. [Google Scholar]
  20. Fadeev, A.; Mendoza-Garcia, P.; Irion, U.; Guan, J.; Pfeifer, K.; Wiessner, S.; Palmer, R.H. ALKALs are in vivo ligands for ALK family receptor tyrosine kinases in the neural crest and derived cells. Proc. Natl. Acad. Sci. USA 2018, 115, 630–638. [Google Scholar] [CrossRef]
  21. Mo, E.S.; Cheng, Q.; Reshetnyak, A.V.; Schlessinger, J.; Nicoli, S. Alk and Ltk ligands are essential for iridophore development in zebrafish mediated by the receptor tyrosine kinase Ltk. Proc. Natl. Acad. Sci. USA 2017, 114, 12027–12032. [Google Scholar] [PubMed]
  22. Petratou, K.; Subkhankulova, T.; Lister, J.A.; Rocco, A.; Schwetlick, H.; Kelsh, R.N. A systems biology approach uncovers the core gene regulatory network governing iridophore fate choice from the neural crest. PLoS Genet. 2018, 14, 1007402. [Google Scholar] [CrossRef]
  23. Stewart, R.A.; Arduini, B.L.; Berghmans, S.; George, R.E.; Kanki, J.P.; Henion, P.D.; Look, A.T. Zebrafish foxd3 is selectively required for neural crest specification, migration and survival. Dev. Biol. 2006, 292, 174–188. [Google Scholar] [CrossRef]
  24. Wu, Y.C.; Wang, I.J. Heat-shock-induced tyrosinase gene ablation with CRISPR in Zebrafish. Mol. Genet. Genom. 2020, 295, 911–922. [Google Scholar] [CrossRef] [PubMed]
  25. Zhang, J.; Mou, Y.; Gong, H.; Chen, H.; Xiao, H. Microphthalmia-associated transcription factor in senescence and age-related diseases. Gerontology 2021, 67, 708–717. [Google Scholar] [CrossRef]
  26. Navarro, S.; Crespo, D.; Schulz, R.W.; Ge, W.; Rotllant, J.; Cerdá-Reverter, J.M.; Rocha, A. Role of the melanocortin system in gonadal steroidogenesis of zebrafish. Animals 2022, 12, 2737. [Google Scholar] [CrossRef] [PubMed]
  27. Tang, S.; Janpoom, S.; Prasertlux, S.; Rongmung, P.; Ittarat, W.; Ratdee, O.; Klinbunga, S. Identification of pigmentation genes in skin, muscle and tail of a Thai-flag variety of Siamese fighting fish Betta splendens. Comp. Biochem. Physiol. Part D Genom. Proteom. 2024, 50, 101243. [Google Scholar] [CrossRef]
  28. Gouife, M.; Ban, Z.; Yue, X.; Jiang, J.; Xie, J. Molecular characterization, gene expression and functional analysis of goldfish (Carassius auratus L.) macrophage colony stimulating factor 2. Front. Immunol. 2023, 14, 1235370. [Google Scholar] [CrossRef] [PubMed]
  29. Harikrishnan, R.; Balasundaram, C.; Heo, M.S. Fish health aspects in grouper aquaculture. Aquaculture 2011, 320, 1–21. [Google Scholar] [CrossRef]
  30. Nigam, A.K.; Kumari, U.; Mittal, S.; Mittal, A.K. Comparative analysis of innate immune parameters of the skin mucous secretions from certain freshwater teleosts, inhabiting different ecological niches. Fish Physiol. Biochem. 2012, 38, 1245–1256. [Google Scholar] [CrossRef]
  31. Sanahuja, I.; Fernández-Alacid, L.; Ordóñez-Grande, B.; Sánchez-Nuño, S.; Ramos, A.; Araujo, R.M.; Ibarz, A. Comparison of several non-specific skin mucus immune defenses in three piscine species of aquaculture interest. Fish Shellfish Immunol. 2019, 89, 428–436. [Google Scholar] [CrossRef]
  32. Santoso, B.H.; Suhartono, E.; Yunita, R.; Biyatmoko, D. Epidermal mucus as a potential biological matrix for fish health analysis. Egypt. J. Aquat. Biol. Fish. 2020, 24, 361–382. [Google Scholar] [CrossRef]
  33. Mu, Q.; Dong, Z.; Kong, W.; Wang, X.; Yu, J.; Ji, W.; Xu, Z. Response of immunoglobulin M in gut mucosal immunity of common carp (Cyprinus carpio) infected with Aeromonas hydrophila. Front. Immunol. 2022, 13, 1037517. [Google Scholar] [CrossRef]
  34. Han, Q.; Hu, Y.; Lu, Z.; Wang, J.; Chen, H.; Mo, Z.; Li, Y. Study on the characterization of grouper (Epinephelus coioides) immunoglobulin T and its positive cells. Fish Shellfish Immunol. 2021, 118, 102–110. [Google Scholar] [CrossRef]
  35. Jiang, H.; Yang, H.; Kong, X.; Wang, S.; Liu, D.; Shi, S. Response of acid and alkaline phosphatase activities to copper exposure and recovery in freshwater fish Carassius auratus gibelio var. Life Sci. J. 2012, 9, 233–245. [Google Scholar]
  36. Hou, Y.Y.; Suzuki, Y.; Aida, K. Effects of steroid hormones on immunoglobulin M (IgM) in rainbow trout, Oncorhynchus mykiss. Fish Physiol. Biochem. 1999, 20, 155–162. [Google Scholar] [CrossRef]
  37. Hemapoojavalli, G.; Bragadeeswaran, S. Evaluating the antioxidant activity of epidermal mucus extract in marine fishes Anguilla anguilla and Brachirus orientalis. Int. J. Vet. Res. 2022, 2, 27–38. [Google Scholar] [CrossRef]
  38. Chen, Z.; Ceballos-Francisco, D.; Guardiola, F.A.; Huang, D.; Esteban, M.Á. Skin wound healing in gilthead seabream (Sparus aurata L.) fed diets supplemented with arginine. Fish Shellfish Immunol. 2020, 104, 347–358. [Google Scholar] [CrossRef]
  39. Feldsine, P.; Abeyta, C.; Andrews, W.H. AOAC International methods committee guidelines for validation of qualitative and quantitative food microbiological official methods of analysis. J. AOAC Int. 2002, 85, 1187–1200. [Google Scholar] [CrossRef] [PubMed]
  40. McCleary, B.V.; Sloane, N.; Draga, A.; Lazewska, I. Measurement of total dietary fiber using AOAC Method 2009.01 (AACC International Approved Method 32-45.01): Evaluation and updates. Cereal Chem. 2013, 90, 396–414. [Google Scholar] [CrossRef]
  41. Sliney, D.H. Radiometric quantities and units used in photobiology and photochemistry: Recommendations of the Commission Internationale de l’Eclairage (International Commission on Illumination). Photochem. Photobiol. 2007, 83, 425–432. [Google Scholar] [CrossRef]
  42. Arocho, A.; Chen, B.; Ladanyi, M.; Pan, Q. Validation of the 2−ΔΔCt calculation as an alternate method of data analysis for quantitative PCR of BCR-ABL P210 transcripts. Diagn. Mol. Pathol. 2006, 15, 56–61. [Google Scholar] [CrossRef]
  43. Salerno, T.M.G.; Coppolino, C.; Arena, P.; Aichouni, A.; Cerrato, A.; Capriotti, A.L.; Mondello, L. Circular economy in the Food Chain: Retrieval and characterization of antimicrobial peptides from Fish Waste hydrolysates. Food Anal. Methods 2024, 17, 178–199. [Google Scholar] [CrossRef]
  44. Sarvi, B.; Pourmozaffar, S.; Alibeygi, T. The role of live food in reproduction and rearing of marine ornamental fish. J. Ornam. Aquat. 2024, 11, 11–27. [Google Scholar]
  45. Seidgar, M.; Abbaspour, A.A.; Nahali, S. A review on the use of live feeds in marine ornamental fish culture. J. Ornam. Aquat. 2024, 11, 63–85. [Google Scholar]
  46. Petrellis, N. Measurement of fish morphological features through image processing and deep learning techniques. Appl. Sci. 2021, 11, 4416. [Google Scholar] [CrossRef]
  47. Mastoraki, M.; Ferrándiz, P.M.; Vardali, S.C.; Kontodimas, D.C.; Kotzamanis, Y.P.; Gasco, L.; Antonopoulou, E. A comparative study on the effect of fish meal substitution with three different insect meals on growth, body composition and metabolism of European sea bass (Dicentrarchus labrax L.). Aquaculture 2020, 528, 735511. [Google Scholar] [CrossRef]
  48. Zhang, Y.Q.; Guo, H.Y.; Liu, B.S.; Zhang, N.; Zhu, K.C.; Zhang, D.C. Analysis of morphological differences in five large yellow croaker (Larimichthys crocea) populations. Isr. J. Aquac. Bamidgeh 2024, 76, 1–9. [Google Scholar] [CrossRef]
  49. Mu, J.; Hu, W.; Chen, R.; Yang, Y.; Li, H.; Li, W.; Xu, D. Production of neomale and neofemale large yellow croaker (Larimichthys crocea) and establishment of all-female populations. Aquaculture 2024, 590, 741010. [Google Scholar] [CrossRef]
  50. Mokhtar, D.M.; Zaccone, G.; Alesci, A.; Kuciel, M.; Hussein, M.T.; Sayed, R.K. Main components of fish immunity: An overview of the fish immune system. Fishes 2023, 8, 93. [Google Scholar] [CrossRef]
  51. Ranjan, D.; Singh, M.B.; Verma, P.; Pathak, A.; Kanaujiya, S. Fish skin mucus and its importance in fish and humans. Curr. J. Appl. Sci. Technol. 2023, 42, 34–38. [Google Scholar] [CrossRef]
  52. Pei, Q.; He, M.; Tang, P.; Zhang, X.; Huang, X.; Zhang, X.; Chen, D. Salvia miltiorrhiza polysaccharide promotes the health of crayfish (Procambarus clarkii) by promoting hemocyte phagocytosis, protecting hepatopancreas and enhancing intestinal barrier function. Fish Shellfish Immunol. 2024, 146, 109405. [Google Scholar] [CrossRef]
  53. Salinas, I.; Fernández-Montero, Á.; Ding, Y.; Sunyer, J.O. Mucosal immunoglobulins of teleost fish: A decade of advances. Dev. Comp. Immunol. 2021, 121, 104079. [Google Scholar] [CrossRef]
  54. Espinosa-Ruíz, C.; Esteban, M.Á. Wound-induced changes in antioxidant enzyme activities in skin mucus and in gene expression in the skin of gilthead seabream (Sparus aurata L.). Fishes 2021, 6, 15. [Google Scholar] [CrossRef]
  55. Koner, D.; Banerjee, B.; Kumari, A.; Lanong, A.S.; Snaitang, R.; Saha, N. Molecular characterization of superoxide dismutase and catalase genes, and the induction of antioxidant genes under the zinc oxide nanoparticle-induced oxidative stress in air-breathing magur catfish (Clarias magur). Fish Physiol. Biochem. 2021, 47, 1909–1932. [Google Scholar] [CrossRef] [PubMed]
  56. Giri, S.S.; Sukumaran, V.; Park, S.C. Effects of bioactive substances from turmeric on growth, skin mucosal immunity and antioxidant factors in common carp, Cyprinus carpio. Fish Shellfish Immunol. 2019, 92, 612–620. [Google Scholar] [CrossRef] [PubMed]
  57. Luo, K.; Li, J.; Chen, J.; Pan, Y.; Zhang, Y.; Zhou, H.; Mai, K. Proteomics analysis of skin coloration of large yellow croaker Larimichthys crocea fed different dietary carotenoids. Aquac. Nutr. 2020, 26, 1981–1993. [Google Scholar] [CrossRef]
  58. Mansour, A.T.; El-Feky, M.M.; El-Beltagi, H.S.; Sallam, A.E. Synergism of dietary co-supplementation with lutein and bile salts improved the growth performance, carotenoid content, antioxidant capacity, lipid metabolism, and lipase activity of the marbled spinefoot rabbitfish, Siganus rivulatus. Animals 2020, 10, 1643. [Google Scholar] [CrossRef]
  59. Meilisza, N.; Jusadi, D.; Zairin, J.M.; Artika, I.M.; Priyo, U.N.B.; Kadarini, T.; Suprayudi, M.A. Digestibility, growth and pigmentation of astaxanthin, canthaxanthin or lutein diets in Lake Kurumoi rainbowfish, Melanotaenia parva (Allen) cultured species. Aquac. Res. 2017, 48, 5517–5525. [Google Scholar] [CrossRef]
  60. Obukohwo, O.M.; Ejiro, O.P. Luteolin co-treatment abates polystyrene microplastics (PSMPs) induced spermatotoxicity and dysgonadogenesis in rats via up-regulation of gonadotropin, enhanced spermatogenesis, downregulation of caspases, and oxido-inflammation. J. Chem. Health Risks 2024, 14, 415–425. [Google Scholar]
  61. Zhang, X.; Meng, L.; Ran, X.; Li, S.; Wen, C. Investigating the molecular mechanism of purslane-based vitiligo treatment using network pharmacology, molecular docking and in vitro analyses. Mol. Med. Rep. 2025, 31, 117. [Google Scholar] [CrossRef]
  62. Neuffer, S.J.; Cooper, C.D. Zebrafish syndromic albinism models as tools for understanding and treating pigment cell disease in humans. Cancers 2022, 14, 1752. [Google Scholar] [CrossRef]
  63. Costa, R.; Muccioli, S.; Brillo, V.; Bachmann, M.; Szabò, I.; Leanza, L. Mitochondrial dysfunction interferes with neural crest specification through the FoxD3 transcription factor. Pharmacol. Res. 2021, 164, 105385. [Google Scholar] [CrossRef]
  64. Kabangu, M.; Cecil, R.; Strohl, L.; Timoshevskaya, N.; Smith, J.J.; Voss, S.R. Leukocyte tyrosine kinase (LTK) is the mendelian determinant of the axolotl melanoid color variant. Genes 2023, 14, 904. [Google Scholar] [CrossRef]
  65. Jang, H.S.; Chen, Y.; Ge, J.; Wilkening, A.N.; Hou, Y.; Lee, H.J.; Wang, T. Epigenetic dynamics shaping melanophore and iridophore cell fate in zebrafish. Genome Biol. 2021, 22, 282. [Google Scholar] [CrossRef] [PubMed]
  66. Fang, W.; Huang, J.; Li, S.; Lu, J. Identification of pigment genes (melanin, carotenoid and pteridine) associated with skin color variant in red tilapia using transcriptome analysis. Aquaculture 2022, 547, 737429. [Google Scholar] [CrossRef]
  67. Luo, M.; Shi, X.; Guo, J.; Lin, K.; Zhu, W.; Fu, J.; Dong, Z. Deep spatiotemporal transcriptome analysis provides new insights into early development of koi carp (Cyprinus carpio var. koi). Aquaculture 2023, 575, 739767. [Google Scholar] [CrossRef]
  68. Miyadai, M.; Takada, H.; Shiraishi, A.; Kimura, T.; Watakabe, I.; Kobayashi, H.; Hashimoto, H. A gene regulatory network combining Pax3/7, Sox10 and Mitf generates diverse pigment cell types in medaka and zebrafish. Development 2023, 150, dev202114. [Google Scholar] [CrossRef]
  69. Quigley, I.K.; Manuel, J.L.; Roberts, R.A.; Nuckels, R.J.; Herrington, E.R.; MacDonald, E.L.; Parichy, D.M. Evolutionary diversification of pigment pattern in Danio fishes: Differential fms dependence and stripe loss in D. albolineatus. Development 2005, 132, 89–104. [Google Scholar] [CrossRef]
  70. Zhou, C.; Liu, L.; Jiang, M.; Wang, L.; Pan, X. Identification of Philaster apodigitiformis in aquaculture and functional characterization of its β-PKA gene and expression analysis of infected Poecilia reticulata. Parasitology 2024, 151, 370–379. [Google Scholar] [CrossRef]
  71. Henning, F.; Renz, A.J.; Fukamachi, S.; Meyer, A. Genetic, comparative genomic, and expression analyses of the Mc1r locus in the polychromatic Midas cichlid fish (Teleostei, Cichlidae Amphilophus sp.) species group. J. Mol. Evol. 2010, 70, 405–412. [Google Scholar] [CrossRef] [PubMed]
  72. Nagao, Y.; Takada, H.; Miyadai, M.; Adachi, T.; Seki, R.; Kamei, Y.; Hashimoto, H. Distinct interactions of Sox5 and Sox10 in fate specification of pigment cells in medaka and zebrafish. PLoS Genet. 2018, 14, 1007260. [Google Scholar] [CrossRef]
  73. Zhang, X.T.; Wei, K.J.; Chen, Y.Y.; Shi, Z.C.; Liu, L.K.; Li, J.; Ji, W. Molecular cloning and expression analysis of tyr and tyrp1 genes in normal and albino yellow catfish Tachysurus fulvidraco. J. Fish Biol. 2018, 92, 979–998. [Google Scholar] [CrossRef]
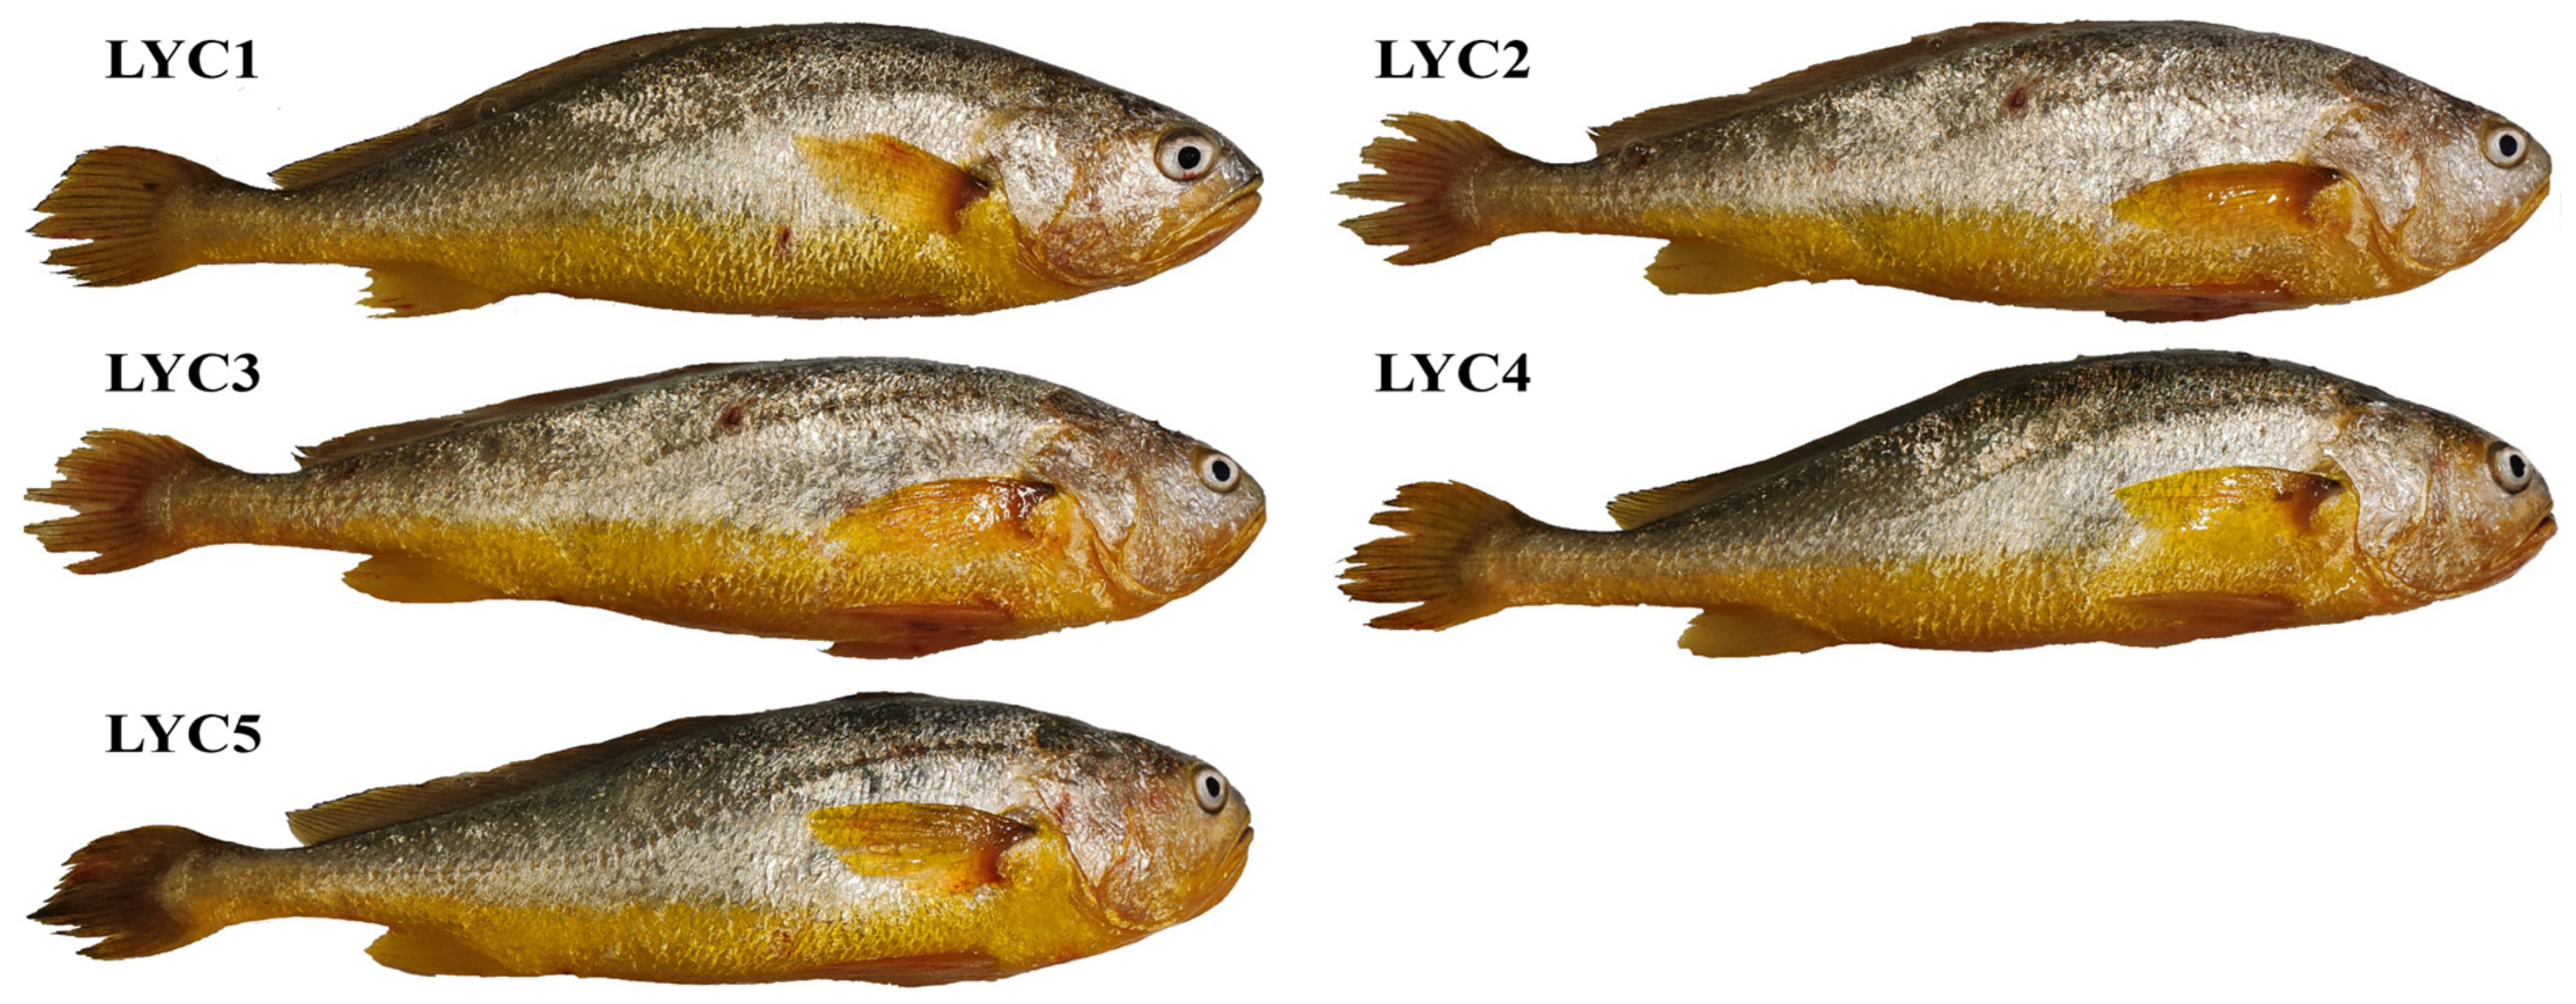
Figure 1. The exterior morphology for five distinct strains. Note: LYC1 = Wild large yellow croaker, LYC2 = Dai-qu population large yellow croaker, LYC3 = Yongdai 1 large yellow croaker, LYC4 = Min-yuedong population large yellow croaker, LYC5 = Fufa 1 large yellow croaker. Scale bar = 1:4.59.
Fishes 10 00305 g001
Figure 2. The measurement points of back skin and abdomen skin. Note: A1–A3 were abdominal test points. B1–B3 were back test points. The strain was Yongdai 1 large yellow croaker. Note: Scale bar = 1:3.38.
Fishes 10 00305 g002
Figure 3. The genetic diversity analysis of populations with different strains Larimichthys crocea. Note: (A) is the linkage disequilibrium analysis (LD); (B) is the phylogenetic tree. LYC1-1 to LYC1-10 tailfin samples from LYC1 group; LYC2-1 to LYC2-10 tailfin samples from LYC2 group; LYC3-1 to LYC3-10 tailfin samples from LYC3 group; LYC4-1 to LYC4-10 tailfin samples from LYC4 group; LYC5-1 to LYC5-10 tailfin samples from LYC5 group.
Fishes 10 00305 g003
Figure 4. The skin morphology of different strains Larimichthys crocea. Note: (a–c): The letters are listed from smallest to largest. a, b and c in the same row different targets have significant value (p < 0.05) (n = 3). (AE) are the back skin morphology sections observation (H&E staining, 200×). Epidermal layer (EL); stratum compactum (SC); melanin (M). (F) is the percentage of melanin area in the back skin. (GK) are the abdomen skin morphology sections observations (H&E staining, 200×). Yellow pigment (Y). (L) is the percentage of yellow pigment area in the abdomen skin.
Fishes 10 00305 g004
Figure 5. The chromatic value in the skin of different strains Larimichthys crocea. Note: (a–c): The letters are listed from smallest to largest. a, b and c in the same row different targets have significant value (p < 0.05) (n = 9). (AC) are brightness value (L*), red and green values (a*), yellow and blue values (b*) in the back skin. (DF) are L*, a*, and b* in the abdomen skin.
Fishes 10 00305 g005
Figure 6. The immune indicators in the skin of different strains Larimichthys crocea. Note: (a–c): The letters are listed from smallest to largest. a, b and c in the same row different targets have significant value (p < 0.05) (n = 6). (A) is the immune indicator for back skin. (B) is the immune indicator for abdominal skin. Total protein (TP, mg/mL); immunoglobulin M (Ig M, μg/mL); immunoglobulin T (Ig T, g/L).
Fishes 10 00305 g006
Figure 7. The pigmentation contents in the skin of different strains Larimichthys crocea. Note: (a–c): The letters are listed from smallest to largest. a, b and c on the same row different targets have significant value (p < 0.05) (n = 6). (A) is the pigmentation contents for back skin. (B) is the pigmentation contents for abdominal skin. Melanin (mg/mL); carotenoid (μg/mL); lutein (pg/mL).
Fishes 10 00305 g007
Figure 8. The relative mRNA expressions levels of different strains Larimichthys crocea. Note: (a–c): The letters are listed from smallest to largest. a–c on the same row different targets have significant value (p < 0.05) (n = 6). (A) is the mRNA expression of internal neural crest regulation in the back skin. (B) is the mRNA expression of internal neural crest regulation in the abdomen skin. Anaplastic lymphoma kinase (alk); leukocyte receptor tyrosine kinase (ltk); forkhead box d3 (foxd3); paired box 3 (pax3); sry-box containing gene 10 (sox10).
Fishes 10 00305 g008
Figure 9. The relative mRNA expressions levels in the back skin of different strains Larimichthys crocea. Note: (a–c): The letters are listed from smallest to largest. a–c on the same row different targets have significant value (p < 0.05) (n = 6). Tyrosinase (tyr); tyrosinase-related protein 1 (tyrp1); dopachrome tautomerase (dct); microphtalmia-associated transcription factor (mitf); melanocortin 1 receptor (mc1r).
Fishes 10 00305 g009
Figure 10. The relative mRNA expressions levels of iridocytes and yellow pigment cells in the abdomen skin of different strains Larimichthys crocea. Note: (a–c): The letters are listed from smallest to largest. a–c on the same row different targets have significant value (p < 0.05) (n = 6). Purine nucleoside phosphorylase 4a (pnp4a); aristaless-like homeobox 4a (alx4a); cAMP dependent protein kinase (pka); colony stimulating factor (fms).
Fishes 10 00305 g010
Table 1. The information about large yellow croakers.
ItemsLYC1LYC2LYC3LYC4LYC5
Large yellow croakerWildDai-qu populationYongdai 1Min-yuedong populationFufa 1
Body weight (g)343.13 ± 7.21343.60 ± 17.61364.90 ± 14.72355.17 ± 3.58328.27 ± 15.03
Total length31.76 ± 0.2932.12 ± 0.5533.96 ± 1.3633.09 ± 0.4532.40 ± 0.66
Tail number3030303030
Time15 August 202413 August 202413 August 202417 August 202417 August 2024
CompanyWenzhou Linbao Feng Aquatic Co. (Wenzhou, Zhejiang, China)Ningde Jinsheng Aquatic Co. (Ningde, Fujian, China)Ningde Jinsheng Aquatic Co. (Ningde, Fujian, China)Fujian Yuhuizhan Agricultural Technology Co. (Ningde, Fujian, China)Fujian Yuhuizhan Agricultural Technology Co. (Ningde, Fujian, China)
Table 2. Sequence of qRT-PCR primers.
Accession No.PrimerForward, 5′ to 3′Reverse, 5′ to 3′Tm (°C)Product Length (bp)
XM_027274897.1alkGTGCCTGTTCCTCAGCCTCTCACGGACAAGGAGTCGGAGA59.0106
XM_010744505.3pkaGTGCCTGTTCCTCAGCCTCTGGAGAAGAGGAAGGACGAGC60.0121
XM_010748017.3sox10GTGCCTGTTCCTCAGCCTCTCACGGACAAGGAGTCGGAGA59.0156
XM_010737016.3pax3CCTCTTCTCCTTCCTGCTCGGGAGAAGAGGAAGGACGAGC59.0196
NM_001002102.1pnp4aCTTCTCCTTCCTGCTCCGTGGCGGTGGTGCGACAAGACAGA60.7187
XM_019254989.2ltkGCCACCACGCTCTTCTGTCTGGTGCGAGAAGACAGACGAC59.0190
XM_001340930.8alx4aCCACGCTCTTCTGTCTGCTGGGGGCTCACTGTTCGGACAT60.7112
XM_010730933.3foxd3CTCCTCACCCACACCGTCAGGAAGCGGCAGAGGATGGCT60.9165
XM_019254738.2tyrCTTCTCCTTCCTGCTCGTGGCGGTGGTGCGAGAAGACAGA59.7149
XM_027279798.1fmsGGTCAACCTCCTCTCTGCCAGGTGCGAGAAGACAGACGAC59.6153
XM_010732276.3tyrp1CACGGACAAGGAGTCGGAGAAGACGTGGAGCTGGCCGAGGAG60.8107
XM_027283126.1mitfGGAGAAGAGGAAGGACGAGCATCCCTCTAATCAGCCTCTGGA60.2135
XM_010746837.3dctGCCTGTTCCTCAGCCTCTTCTGGAGAAGAGGAAGGACGAGCA60.1122
XM_047732415.1mc1rACCTCCCTCTAATCAGCCCTCGGAGAAGAGGAAGGACGAGCA59.0132
GU584189.1β-actinGACAAGGAGTGCGAGAAGAGGAGACGTGGAGCTGGCCGAGGAGG59.6112
Note: Anaplastic lymphoma kinase (alk); cAMP dependent protein kinase (pka); sry-box containing gene 10 (sox10); paired box 3 (pax3); purine nucleoside phosphorylase 4a (pnp4a); leukocyte receptor tyrosine kinase (ltk); aristaless-like homeobox 4a (alx4a); forkhead box d3 (foxd3); tyrosinase (tyr); colony stimulating factor (fms); tyrosinase-related protein 1 (tyrp1); microphtalmia-associated transcription factor (mitf); dopachrome tautomerase (dct); melanocortin 1 receptor (mc1r).
Table 3. The whole fish basic nutritional components of different strains Larimichthys crocea.
ItemsLYC1LYC2LYC3LYC4LYC5
Moisture (%)75.83 ± 0.94 c71.29 ± 0.48 a75.24 ± 0.16 c72.20 ± 0.18 ab74.25 ± 0.50 bc
Crude protein (%, dry matter)20.42 ± 0.25 b16.65 ± 0.16 a19.48 ± 0.16 b15.71 ± 0.34 a16.75 ± 0.25 a
Crude lipid (%, dry matter)3.60 ± 0.23 a7.40 ± 0.28 c4.60 ± 0.53 ab5.84 ± 0.34 bc5.69 ± 0.29 b
Crude ash (%, dry matter)1.34 ± 0.121.72 ± 0.121.39 ± 0.101.67 ± 0.091.69 ± 0.11
Note: (a–c): The letters are listed from smallest to largest. a, b and c in the same row different targets have significant value (p < 0.05). Experimental results are shown as mean ± standard error (SE) (n = 3).
Table 4. The mucus antioxidant indicators of different strains Larimichthys crocea.
ItemsLYC1LYC2LYC3LYC4LYC5
MDA (nmol/mL)5.21 ± 0.176.07 ± 0.385.24 ± 0.165.98 ± 0.375.51 ± 0.27
SOD (U/mL)113.37 ± 4.38 b70.73 ± 7.48 a83.25 ± 1.93 a76.82 ± 3.98 a104.12 ± 3.86 b
CAT (U/mL)46.27 ± 3.64 b28.42 ± 4.05 a32.23 ± 4.02 a27.74 ± 0.53 a45.64 ± 1.71 b
Note: (a, b): The letters are listed from smallest to largest. a and b in the same row different targets have significant value (p < 0.05). Experimental results are shown as mean ± standard error (SE) (n = 6). Malondialdehyde (MDA); superoxide dismutase (SOD); catalase (CAT).
Table 5. The mucus immunity indicators of different strains Larimichthys crocea.
ItemsLYC1LYC2LYC3LYC4LYC5
ALP (IU/L)171.67 ± 7.55 c98.85 ± 2.85 a138.22 ± 4.25 bc77.52 ± 14.25 a107.07 ± 6.20 ab
ACP (IU/L)9.30 ± 0.13 b6.74 ± 0.30 a8.39 ± 0.30 b6.50 ± 0.28 a7.25 ± 0.25 a
LYS (U/mL)4.69 ± 0.26 c3.44 ± 0.19 a4.60 ± 0.11 bc3.60 ± 0.05 a3.86 ± 0.28 ab
Ig M (μg/mL)1251.62 ± 66.11 c545.63 ± 73.96 a928.33 ± 24.24 b576.62 ± 22.78 a615.30 ± 81.42 a
Ig T (g/L)4.71 ± 0.11 d1.24 ± 0.15 a3.51 ± 0.15 c1.44 ± 0.08 a1.94 ± 0.06 b
Note: (a–d): The letters are listed from smallest to largest. a–d on the same row different targets have significant value (p < 0.05). Experimental results are shown as mean ± standard error (SE) (n = 6). Alkaline phosphatases (ALP); acid phosphatases (ACP); lysozyme (LYS); immunoglobulin M (Ig M); immunoglobulin T (Ig T).
Disclaimer/Publisher’s Note: The statements, opinions and data contained in all publications are solely those of the individual author(s) and contributor(s) and not of MDPI and/or the editor(s). MDPI and/or the editor(s) disclaim responsibility for any injury to people or property resulting from any ideas, methods, instructions or products referred to in the content.