Article

Enhancing African Catfish (Clarias gariepinus) Aquaculture in Uganda: Insights into Hatchery Propagation, Population Suitability, and Broodstock Management

by
Gerald Kwikiriza
1,2,*,
Sylvie Muwanga Tebitendwa
3,
Philip Rwezawula
3,4,
Waiswa Wilson Mwanja
3,
Ivan Abaho
5 and
Harald Meimberg
1
1
Institute for Integrative Nature Conservation Research, Department of Ecosystem Management, Climate and Biodiversity, BOKU University, Gregor-Mendel-Strasse 33, 1180 Vienna, Austria
2
Kachwekano Zonal Agricultural Research and Development Institute, National Agricultural Research Organization, Kabale P.O. Box 421, Uganda
3
Maritime Institute, Busitema University, Kamuli P.O. Box 1, Uganda
4
Department of Animal Production and Aquatic Ecology, Faculty of Bioscience Engineering, Ghent University, 9000 Ghent, Belgium
5
Bulindi Zonal Agricultural Research and Development Institute, National Agricultural Research Organization, Hoima P.O. Box 101, Uganda
*
Author to whom correspondence should be addressed.
Fishes 2025, 10(6), 290; https://doi.org/10.3390/fishes10060290
Submission received: 10 May 2025 / Revised: 11 June 2025 / Accepted: 12 June 2025 / Published: 14 June 2025

Abstract

The African catfish, Clarias gariepinus, is among the most farmed fish species in Uganda’s rapidly growing aquaculture sub-sector. The enhanced growth performance, increased survival, and resilience to environmental stressors have driven a rising demand among farmers for improved African catfish broodstock and seed. Until recently, most studies of this species have focused on nutrition, physiology, and culture systems, with little known about the genetics, broodstock, and hatchery management of the cultured C. gariepinus populations. This knowledge gap has led to inbreeding depression, resulting in poor seed quality and reduced performance of the broodstock. To enhance catfish aquaculture production, a survey was conducted across multiple catfish hatcheries and farms in Uganda. Using semi-structured questionnaires, the study assessed broodstock management practices, hatchery propagation methods, the suitability of various populations, demographics, challenges, and prospects of hatchery operators. Responses were coded, and descriptive statistics such as frequency, percentages, and means were calculated. Results indicate that there are farmers who continue to source their broodstocks from the natural water bodies in addition to acquiring them from fellow farmers. The estimated effective population size (Ne) for the majority of the respondents was 133.33 and 178.22, with an average breeding coefficient of 0.4% and 0.3%, respectively. There is also a continuous use of shooters (fast-growing cannibalistic fish) by the farmers who hatch and select them to be used as broodstocks later, under the assumption that they have superior genetic traits. The reported hatchability rate was above 70%, with an average survival rate of 60% from larvae to fry. The study identified diseases, inadequate water supply, and electricity as the primary challenges for catfish breeding. While Uganda’s African catfish aquaculture industry is expanding rapidly, certain hatchery practices pose significant risks to its sustainability if not properly addressed.
Key Contribution: This manuscript provides a comprehensive assessment of broodstock and hatchery management practices for African catfish in Uganda, identifying critical gaps that threaten the sector’s genetic quality and sustainability.

1. Introduction

Aquaculture has become an increasingly important pillar of global food production and security, especially as capture fisheries continue to decline due to overfishing, habitat loss, and the impacts of climate change [1]. As the demand for aquatic food rises, aquaculture is projected to play a central role in bridging the growing gap between fish supply and consumption [2]. In Africa, aquaculture is particularly significant given the continent’s rapidly growing population, widespread food insecurity, and the economic reliance of millions of people on fisheries and aquatic resources [3]. Despite this reliance, Africa’s contribution to global aquaculture remains modest, accounting for only about 2.7% of total production [4]. This low output is largely due to limited investment, resulting in an underdeveloped infrastructure and insufficient technological advancement across the continent [4,5]. However, some African countries like Egypt, Nigeria, Ghana, and Uganda have made notable strides in expanding their aquaculture sub-sector industries [4].
Uganda’s National Fisheries and Aquaculture Policy (NFAP) aims to produce at least 1,000,000 MT of farmed fish annually by 2030, as fish are one of the 12 prioritized agricultural commodities for investment in Uganda’s National Development Plan (NDP IV) [6]. Recent investments in aquaculture are already showing positive outcomes, with production increasing from 820 MT in 2000 to 138,558 MT in 2021 [4].
Nile tilapia (Oreochromis niloticus) and African catfish (Clarias gariepinus, hereafter C. gariepinus) dominate Uganda’s aquaculture sector [7]. Among these species, C. gariepinus has recently surpassed Nile tilapia as the most farmed species in local communities due to its faster growth rate and suitability for small-scale farmers [5,8]. Its high fecundity, resilience, and capability to thrive in various environmental conditions, including low oxygen levels and high stocking densities, make it the preferred choice for rural and peri-urban aquaculture projects [9]. However, C. gariepinus does not reproduce easily in captivity and requires specialized facilities, such as hatcheries, for artificial propagation [10]. The government and development partners have supported aquaculture growth through capacity building for farmers and hatchery operators and the provision of fingerlings to small-scale farmers, which has resulted in a surge in the number of farmers and increased catfish production nationwide [11,12].
Most catfish hatcheries are located within the Lake Victoria Crescent and Albertine Drainage Basins [9,13]. Smallholder fish farmers, over 90% of whom rely on private commercial hatcheries for seed supply, often face challenges in achieving optimal growth due to poor quality fish seed, leading to smaller fish and higher mortality rates [13]. These issues are driven by genetic degeneration in hatchery stocks, with most commercial hatcheries sourcing their broodstock from the genetically degenerated stocks of fellow farmers or natural water bodies with unknown genetic profiles [12,14,15].
While studies have focused on nutrition [16,17,18], physiology [19], and culture systems [10,20], little information is known about broodstock and hatchery management in Uganda’s farmed C. gariepinus [13]. Broodstock and hatchery management are crucial for the seed quality, survival, and overall aquaculture productivity of C. gariepinus [14]. Key aspects such as broodstock selection, replacement strategies, management, and spawning methods remain poorly documented. Additionally, the influence of hatchery operations and grow-out culture systems on fry and fingerling survival and production across various hatchery settings is not well understood. For example, a study by [13] concluded that the hatchery industry in Uganda is still struggling, which, unless overhauled, will continue to see an increasing gap between fish seed supply and demand both within the country and in the broader region. Moreover, information on the demographic characteristics and challenges of hatchery operators is limited. This lack of integrated technical and socio-economic data hinders the development of effective, context-specific interventions to improve the broodstock and seed quality. Addressing these gaps is essential to enhance seed supply systems and support the sustainable growth of Uganda’s C. gariepinus aquaculture sub-sector. Therefore, this study assessed the current broodstock and hatchery management practices along with farmer operator demographics, challenges, and recommendations for improving seed production. This was guided by the research questions: (1) What are the current broodstock management practices, mating methods, and spawning techniques used by C. gariepinus hatcheries in Uganda? (2) How do hatchery operations and grow-out culture systems influence fry/fingerling survival, quality, and production in different hatchery settings? and (3) What are the demographic characteristics of hatchery operators, and what challenges and practical recommendations do they identify for improving C. gariepinus seed production in Uganda? Findings from this study will provide the baseline data for establishing a selective breeding program for C. gariepinus in Uganda.

2. Materials and Methods

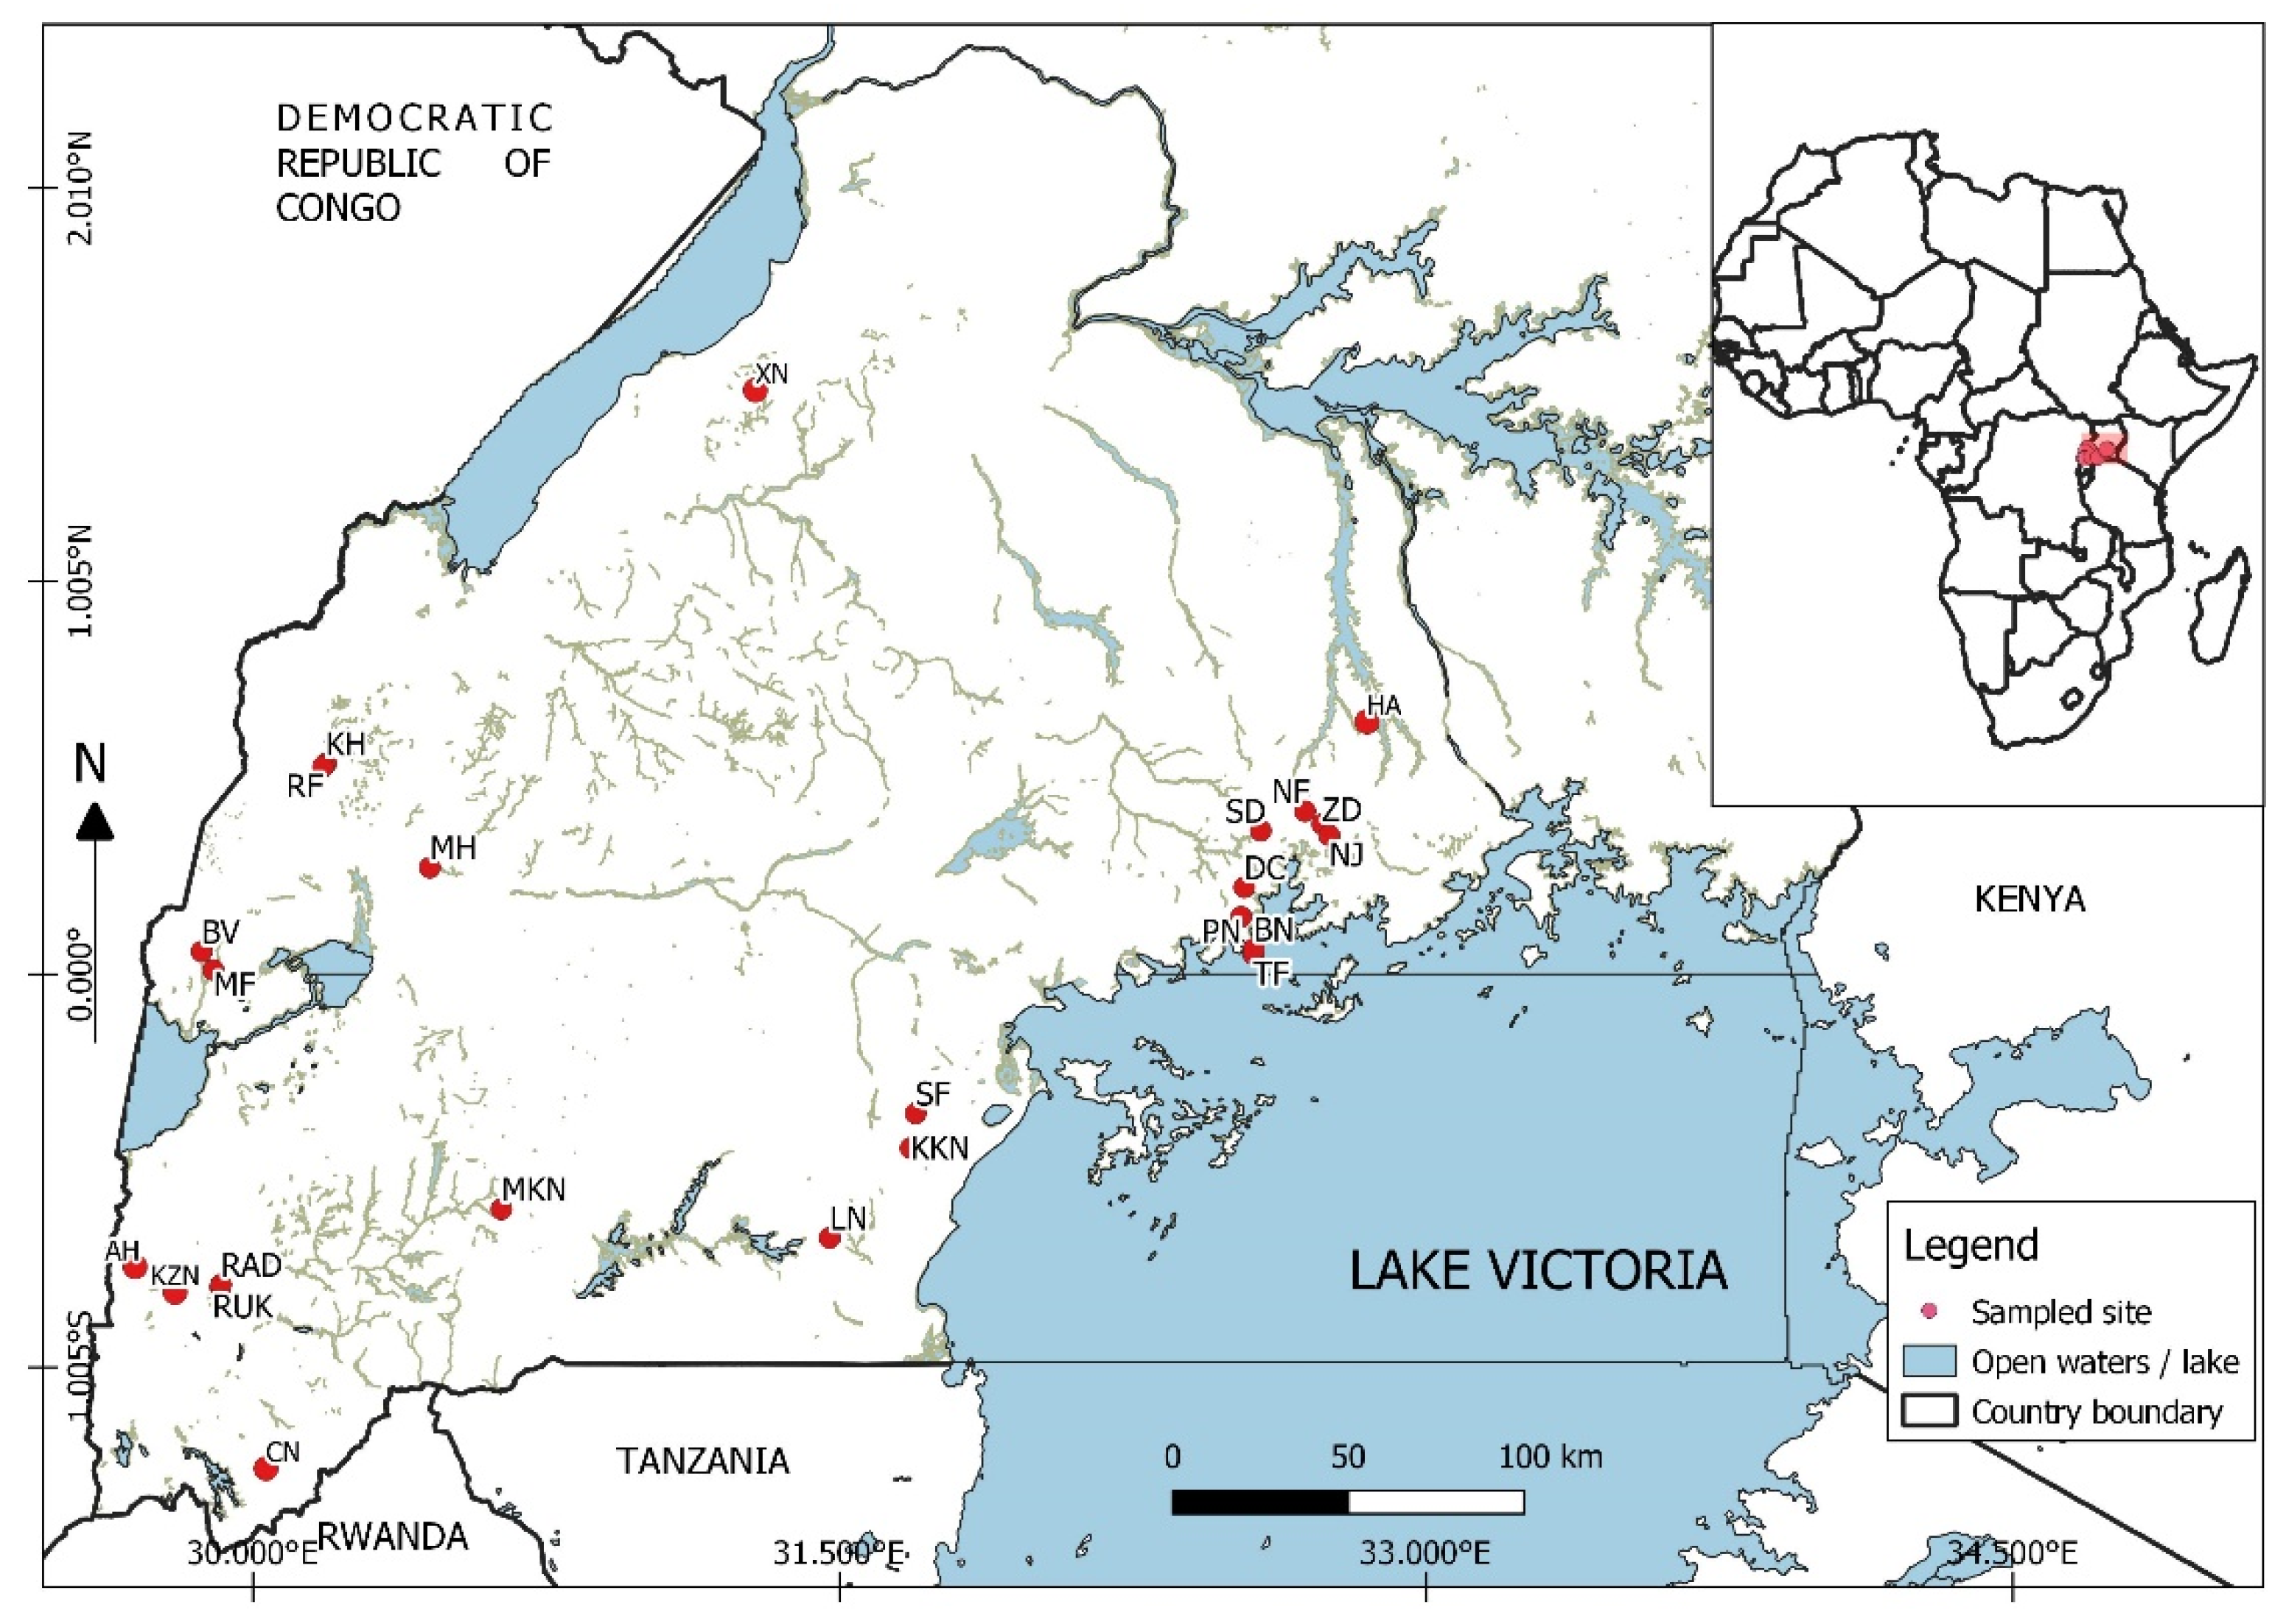
2.1. Description of the Study Area

The study was conducted in the lakes: Victoria Basin and Albertine Drainage Basins. These are among the most active areas for C. gariepinus aquaculture production in Uganda [8,12].
The Albertine Drainage Basin with a latitude range 0°30′ N to 2°30′ N and longitude range 29°30′ E to 31°30′ E is situated within the Albertine Rift, the western branch of the African Great Rift Valley, extending from Lake Albert in the north to Lake Tanganyika in the south [21]. It spans multiple countries, including the Democratic Republic of Congo (DRC), Uganda, Rwanda, Burundi, Tanzania, and Zambia. The rift hosts diverse ecosystems, including montane forests, lowland rainforests, savannahs, wetlands, mountains, rivers, and lakes. These lakes include Albert, Edward, George, Kivu, and Tanganyika, which are vital for local livelihoods and fisheries production. The Ugandan part of the Albertine region covers a total of 21,234 km2 [6]. Apart from Lake George, all lakes are transboundary; thus, they require collaborative management among the border countries. Within Uganda’s Albertine region, four semi-autonomous Public Agricultural Research Institutes (PARIs) operate under the policy guidance of the National Agricultural Research Organisation (NARO), conducting research on various commodities, including fish. These Zonal Agricultural and Development Institutes (ZARDIs) include the Kachwekano ZARDI in Rubanda District, the Bulindi ZARDI in Hoima City, the Mbarara ZARDI in Mbarara City, and the Rwebitaba ZARDI in Fort Portal City. Additionally, there are more than 20 small-, medium-, and large-scale fish hatcheries within the Albertine drainage basin [12].
The Lake Victoria Basin (LVB) is located within the upper Nile River basin and contains a complex system of lakes, wetlands, and rivers. Covering an estimated surface area of 194,200 km2, the basin spans five East African countries: Tanzania (44%), Kenya (22%), Uganda (16%), Rwanda (11%), and Burundi (7%) [22]. It is bordered to the north by the Upper Nile and the Turkana/Omo basins, and to the south by the Lake Tanganyika Basin. The basin receives an average annual rainfall of approximately 1060 mm [23]. The basin supports a wide range of ecosystems, including tropical forests, vegetated wetlands, rivers, and numerous satellite lakes across Tanzania, Kenya, Uganda, Rwanda, and Burundi [24]. The River Kagera, which originates in the highlands of Rwanda, is the principal tributary and inflow to Lake Victoria [23], while the River Nile serves as the main outflow, transporting water from Lake Victoria northward to the Mediterranean Sea. The basin plays a key ecological and socio-economic role in East Africa by supporting fisheries, agriculture, and water resources [25]. Alongside Lake Victoria, the basin also contains several satellite lakes that contribute to the livelihood of the surrounding communities.
In the Lake Victoria basin, there are several aquaculture research institutes, including the Aquaculture Research and Development Centre (ARDC).
The Aquaculture Research and Development Centre, Kajjansi (ARDC), located at 0°13′19″ N, 32°32′04″ E and 1148 m above sea level, serves as Uganda’s national center for aquaculture research and development. It operates under the National Fisheries Resources Research Institute (NaFIRRI), a semi-autonomous public agricultural research institute. NaFIRRI is one of seven National Agricultural Research Institutes (NARIs) coordinated and guided by the National Agricultural Research Organisation (NARO). The ARDC conducts adaptive research in various areas, including fish feed development, fish health, genetics, market and spatial mapping, ornamental fish, aquaculture production systems, and hatchery performance. Additionally, several ZARDIs are engaged in basic fisheries and aquaculture research within the Lake Victoria basin. These include the Mukono ZARDI, located in the Mukono district, and the Buginyanya in the Bulambuli District. The Lake Victoria basin boasts at least 19 fish hatcheries [12].

2.2. Field Survey

Data were collected using a semi-structured questionnaire designed to capture both quantitative and qualitative information on C. gariepinus breeding and seed production practices. The questionnaire included both closed- and open-ended questions and was organized into the following sections:
Broodstock management. This section covered the origin of the broodstock (e.g., natural water bodies, sourced from other hatcheries, number of broodstocks kept at the farm at a time, source of water, selection criteria (e.g., size and age), and replacement strategies, including the frequency of renewal, the methods used to avoid inbreeding, and the criteria for selecting replacement broodstock, etc.
Mating and spawning methods. Data were collected on the use of natural versus induced spawning, the types of hormones used (if applicable), the spawning tanks or facilities, and the mating ratios, milt collection from males, etc.
Hatchery operations and fingerling production. Hatchery operators were asked to describe their larval rearing practices, incubation systems, hatchery infrastructure, feed and feeding schedules, hatchability and survival rates, and the estimated annual production of fry and fingerlings.
Grow-out culture systems. Information was gathered on the types of systems used (e.g., earthen ponds, tanks), the stocking densities, water management, feeding practices, and duration of grow-out phases.
Demographics. Questions were focused on the type of establishment (e.g., hatchery, grow-out, or both), education levels, gender perspective, form of ownership (family, association of producers, public or government enterprise), etc.
Challenges and recommendations. Hatchery operators were asked to identify the key challenges affecting broodstock management and fry/fingerling production (e.g., limited broodstock quality, diseases, market constraints, input costs) and to provide recommendations for improving catfish breeding practices in Uganda.
Among these sections, broodstock management, mating and spawning methods, hatchery operations and fry/fingerling production, and grow-out culture systems included both open-ended and closed-ended questions. Demographics, challenges, and recommendations were explored using open-ended questions to allow the respondents to express their experiences and suggest practical, context-specific solutions without being restricted by predefined options. The questionnaire tool was initially developed and piloted at the ARDC hatchery in Kajjansi to assess its clarity, relevance, and completeness, and revisions were made based on the pilot feedback. The finalized tool was then administered to selected hatcheries across the Victoria and Albertine regions, as well as to targeted research institutions engaged in aquaculture research and development.

2.3. Sampling Technique

A blend of purposive and random sampling was used based on the following criteria: (i) at least five years of operational experience in seed production, (ii) consistent annual production records, (iii) certification by the Ministry of Agriculture, Animal Industry and Fisheries (MAAIF), and (iv) geographic representation across key aquaculture zones in the country. Certification and licensing of the fish hatcheries is granted by the Department of Aquaculture Management and Development, one of the departments under the Ministry of Agriculture, Animal Industry and Fisheries in Uganda (MAAIF). To achieve this, consultations were held with the district fisheries officers (DFOs) in the respective regions to ascertain the state of the hatcheries. Hatchery operators that achieved a score above 75% were subsequently included in the survey. Both private and public hatcheries were included to capture the variations in management practices and institutional support. Data were collected between October 2024 and January 2025, with 27 operators randomly selected for interview (Figure 1).

2.4. Quality Check

All 27 questionnaires were scrutinized and categorized based on their level of completion. Those with more than 90% of the questions answered were selected, resulting in 24 respondents who were included in the subsequent analysis.

2.5. Ethical Approach

This study was conducted following ethical research principles. Before data collection, all respondents were informed about the purpose and objectives of the research. Participation was voluntary, and verbal informed consent (VIC) was obtained from each participant. All personal information collected from the respondents has been treated with strict confidentiality. Where identifiable data was necessary for publication, prior written consent was obtained. The manuscript presents anonymized information that cannot be traced to any individual. Hatchery operators are identified using codes to ensure privacy.

2.6. Potential Biases and Bias Control Measures (BCM)

While designing this questionnaire, potential biases were anticipated. For instance, self-reported data may introduce recall bias or social desirability bias, with the respondents possibly exaggerating best broodstock management and hatchery practices or minimizing challenges. Additionally, relying on verbal consent and face-to-face interviews could lead to interviewer bias, depending on how questions were phrased or interpreted. Despite these limitations, steps were taken to ensure clarity, consistency, and confidentiality throughout the data collection process.
Before the field work, enumerators were trained in ethical research conduct and neutral interviewing to ensure consistency across respondents. Questions were carefully worded to avoid leading language, with closed-ended questions offering clear response options and open-ended items allowing for elaboration. To encourage honest responses, anonymity and confidentiality were assured. Hatchery operators were identified using codes; no personal identifiers were linked to the data. Verbal informed consent (VIC) was obtained after explaining the study’s objectives and voluntary nature. Where possible, face-to-face interviews allowed the clarification of questions. The combined use of open- and closed-ended questions enabled both quantitative assessment and contextual insight, improving the reliability and depth of the findings.

2.7. Statistical Analysis

Closed-ended responses were coded and entered into Microsoft Excel (MS 2021). Coded data were later summarized using descriptive statistics (frequencies, percentages, and averages) to highlight the trends in broodstock practices, culture systems, and hatchery performance, etc. Graphs and tables were created in MS Excel to visualize the key findings. Responses to open-ended questions were thematically analyzed to extract the major challenges and suggested recommendations. These qualitative results were used to contextualize the quantitative findings and emphasize the practical concerns of hatchery operators.

2.8. Determination of Effective Breeding Number (Ne) and Average Inbreeding Coefficient (ΔF)

An estimate of the effective breeding number (Ne) was derived from the average broodstock population, mating structure, sex ratios, and the proportion of individuals contributing to offspring [26].
The formula below was applied:
N e = 4 N m × N f N m + N f
where
Ne = effective breeding number;
Nm = number of breeding males;
Nf = number of breeding females.
Average inbreeding coefficient
The average inbreeding coefficient was determined using the formula below:
Δ F = 1 2 N e
where
ΔF = average inbreeding coefficient;
Ne = effective breeding number.

3. Result

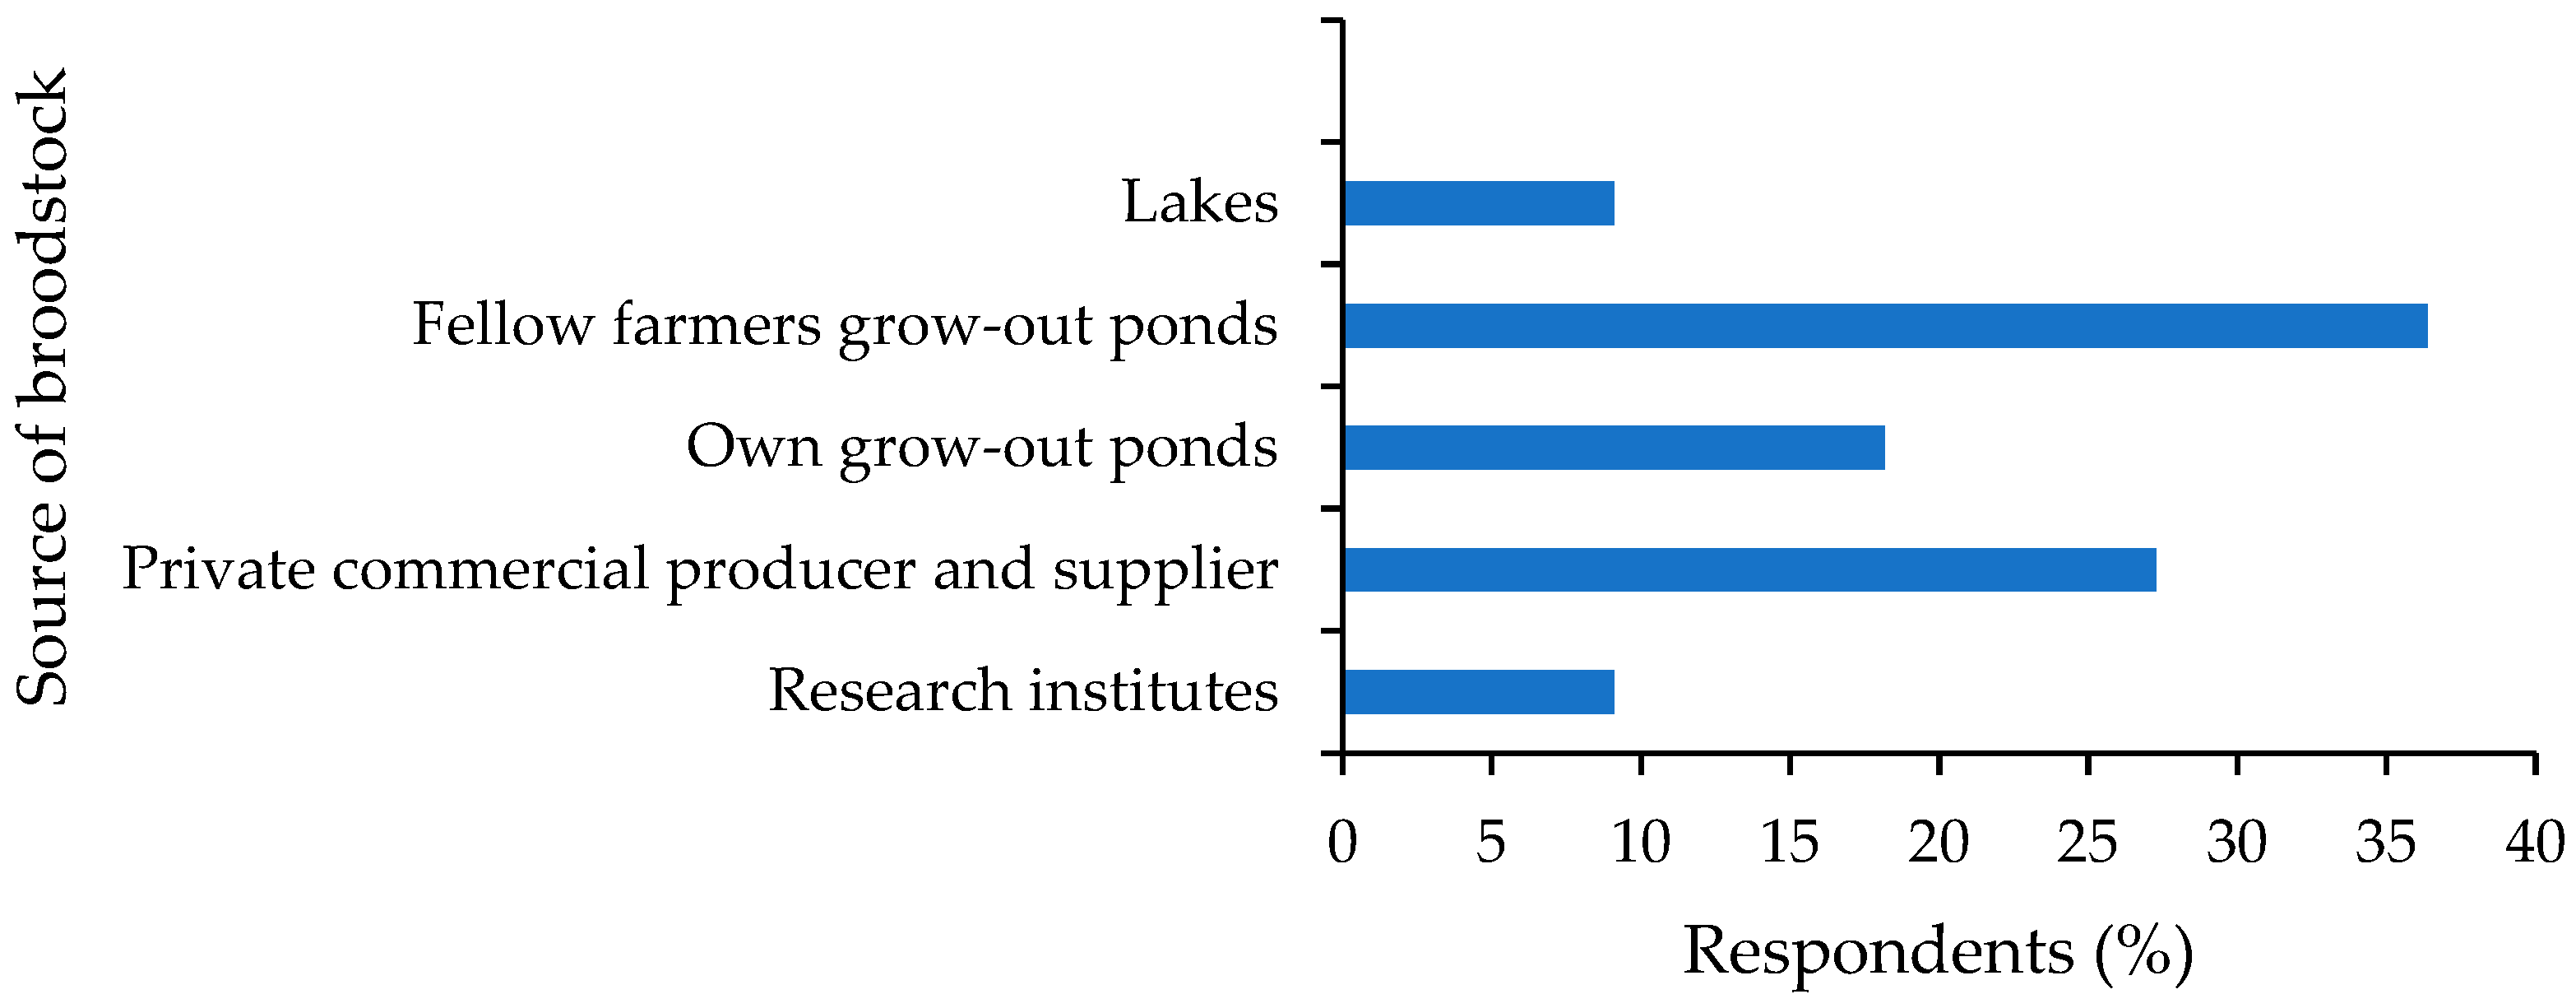
3.1. Broodstock Source and Production Systems

The majority of hatchery operators (37%) acquire their broodstock from fellow farmers, while 27% rely on privately prequalified commercial producers, and 18% raise their broodstock (Figure 2). Additionally, 9% of farmers still obtain broodstock directly from natural water bodies, and another 9% source them from research institutions (Figure 2). Most farmers (75%) who hatch fish on their farms select only the fast growers (shooters) to be raised as broodstock (Figure S1, supplementary). Among those sourcing from other farms, most of them initially purchase the fish as grow-out (table fish) and later develop them into broodstock. Of the farmers who source from lakes, 50% obtain their broodstock from Lake Victoria, followed by 25% from Lake Albert, and 12% from Lake Kyoga (Figure S2, supplementary).
Ponds are the primary production system used, accounting for 50% of the total, while 42% utilize outdoor tanks to raise their broodstocks, and a small percentage (8%) employ recirculating systems (Figure S3, supplementary). The main sources of water at the farms are boreholes and wells (36%), as well as streams (36%), while 18% and 9% use wells and boreholes, respectively (Figure S4, supplementary).

3.2. Broodstock Evaluation and Replacement Strategies

Evaluation of the broodstock kept annually indicated that 56% of the hatchery operators reported keeping 200 or more individuals, while 22% maintained between 100 and 199, and the remainder kept less than 99 individuals (11%) (Figure 3A). A total of 71% of respondents implemented a broodstock replacement strategy, whereas 29% did not (Figure S5, supplementary). Among those with a strategy, 40% reported replacing broodstock biannually or after more than four consecutive uses (Figure 3B). Approximately 50% of farmers indicated that 25–50% of the broodstock contributed to the next generation of families (Figure 3C). The primary reasons cited for broodstock replacement were declining productivity and aging (Figure S6, supplementary). Notably, 95% of respondents reported exclusively sacrificing males, while 5% occasionally retained some for further breeding (Figure S7, supplementary).
The majority of respondents (67%) used 12-month-old broodstock, while 20% used broodstock that were nine months old, and 13% used those that were 15 months old (Figure S8, supplementary). Most of the farmers (46%) used broodstock that weighed between 700–1000 g for breeding in their hatcheries, followed by 1000–1200 g (31%), 500–700 g (15%), and then above 1200 g (8%) (Figure 4).

3.3. Effective Breeding Number (Ne) and Average Inbreeding Coefficient (F)

Figure 3A indicates that 56% of hatchery operators maintain more than 200 broodstock annually, with 25–50% (approximately 50–100 individuals) (Figure 3C) contributing to the next generation. The most commonly reported sex ratios were 1 male–2 females and 1 male–3 females (Figure S9, supplementary).
Overall, there was an inverse relationship between the sex ratio and the effective breeding number; as the sex ratio increased, the effective breeding number decreased. Based on the sex ratios used by the different correspondents, a ratio of 1:1 had the highest Ne value (400), followed by 2:2 (200), while the 1:4 ratio had the least Ne (128) (Table 1).
The average breeding coefficient (F) was inversely proportional to the effective breeding number (Ne) (Figure 5). The lowest average breeding coefficient (F = 0.1%) was observed with an effective breeding number of 400 at a 1:1 mating ratio, followed by 200 (F = 0.2%). The highest inbreeding coefficient (F = 0.4%) was recorded for effective breeding numbers of 133 and 128, with mating ratios of 1:3 and 1:2, respectively (Table 1).

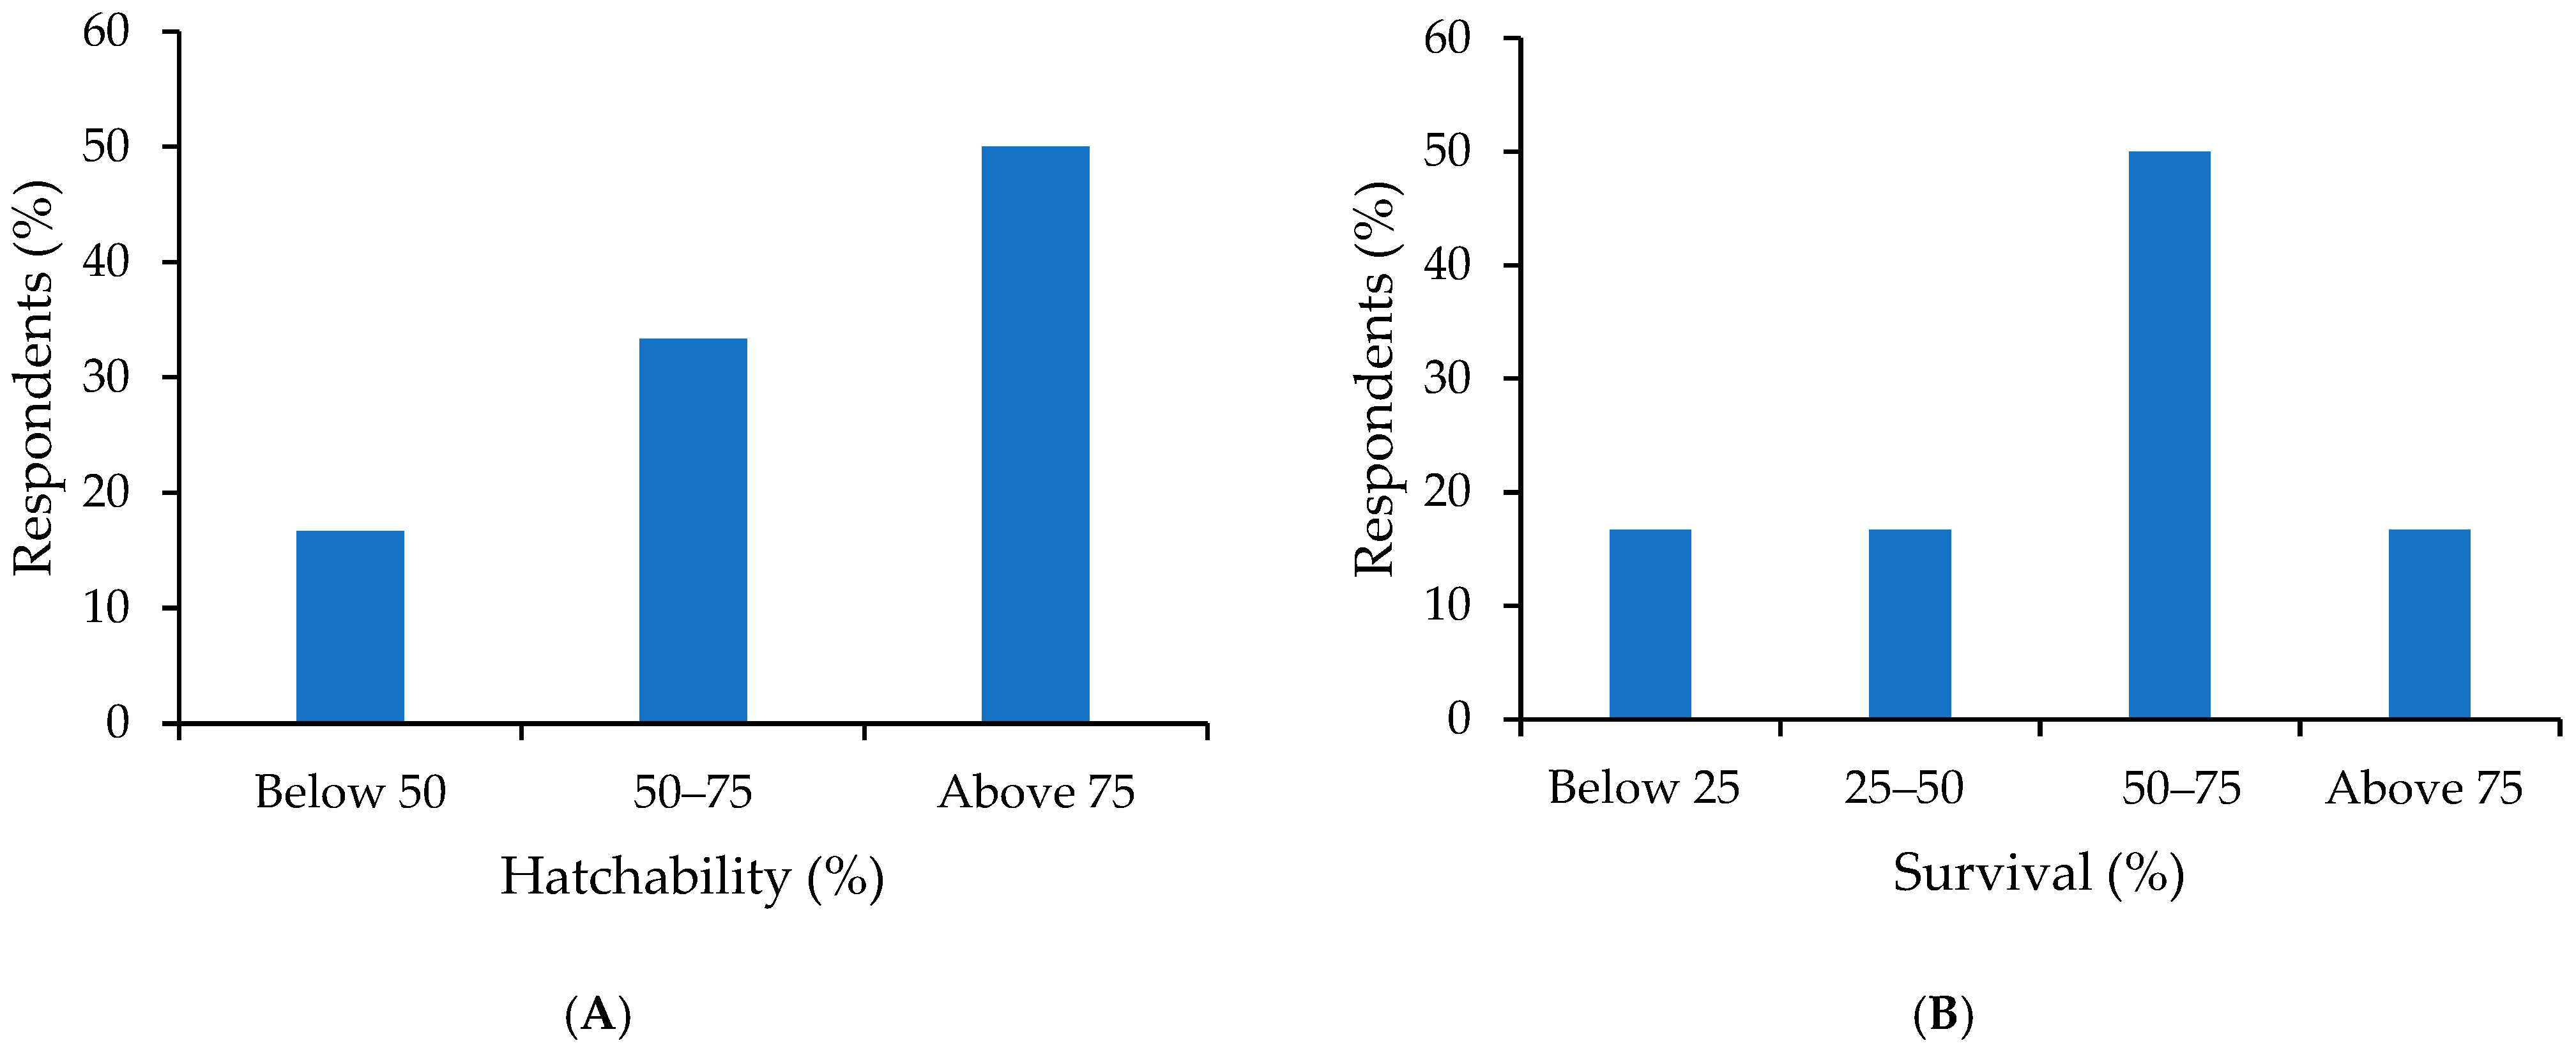
3.4. Induction and Spawning of the Broodstock

Among the respondents, 88% use indoor tanks in the fry and fingerling production, while the remainder (22%) use both systems (Figure 6). All the surveyed farmers induce their female broodstock during breeding; 90% of the farmers use hormones to induce, while the rest apply environmental simulations (10%) (Figure S10, supplementary). Synthetic hormones (63%) were the most frequently used by farmers, while natural pituitary was the least (37%) (Figure S11, supplementary). Further interaction with farmers who used synthetic hormones indicated that Ovaprimu and Ovatide were the most commonly used hormones. For the males, 100% of the farmers sacrificed their males to extract the gonads.

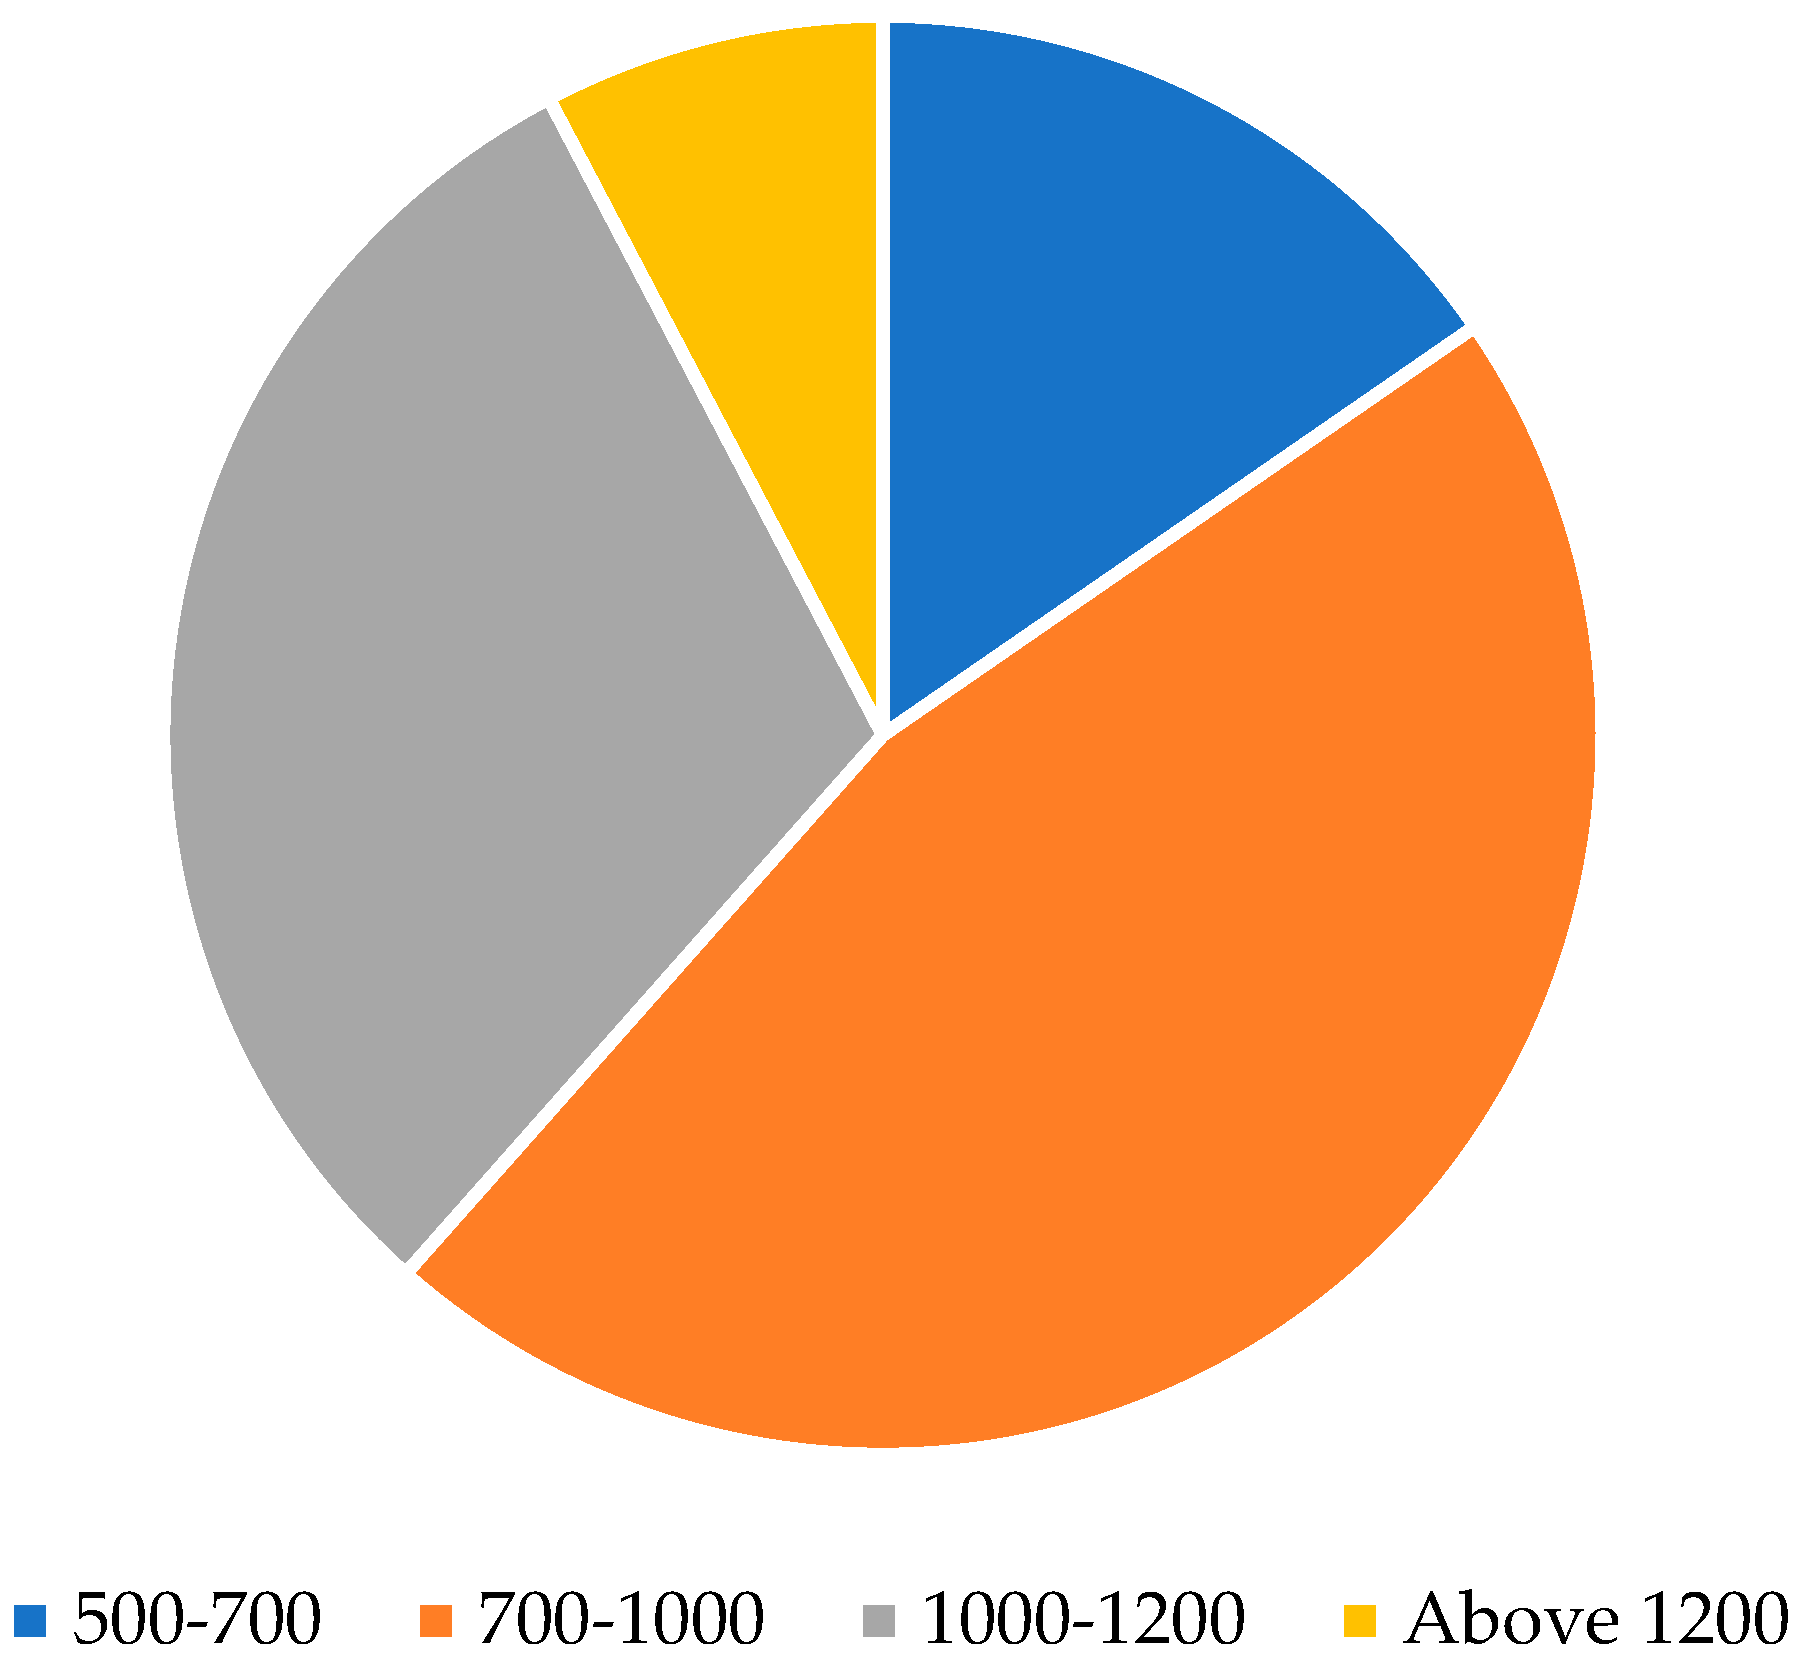
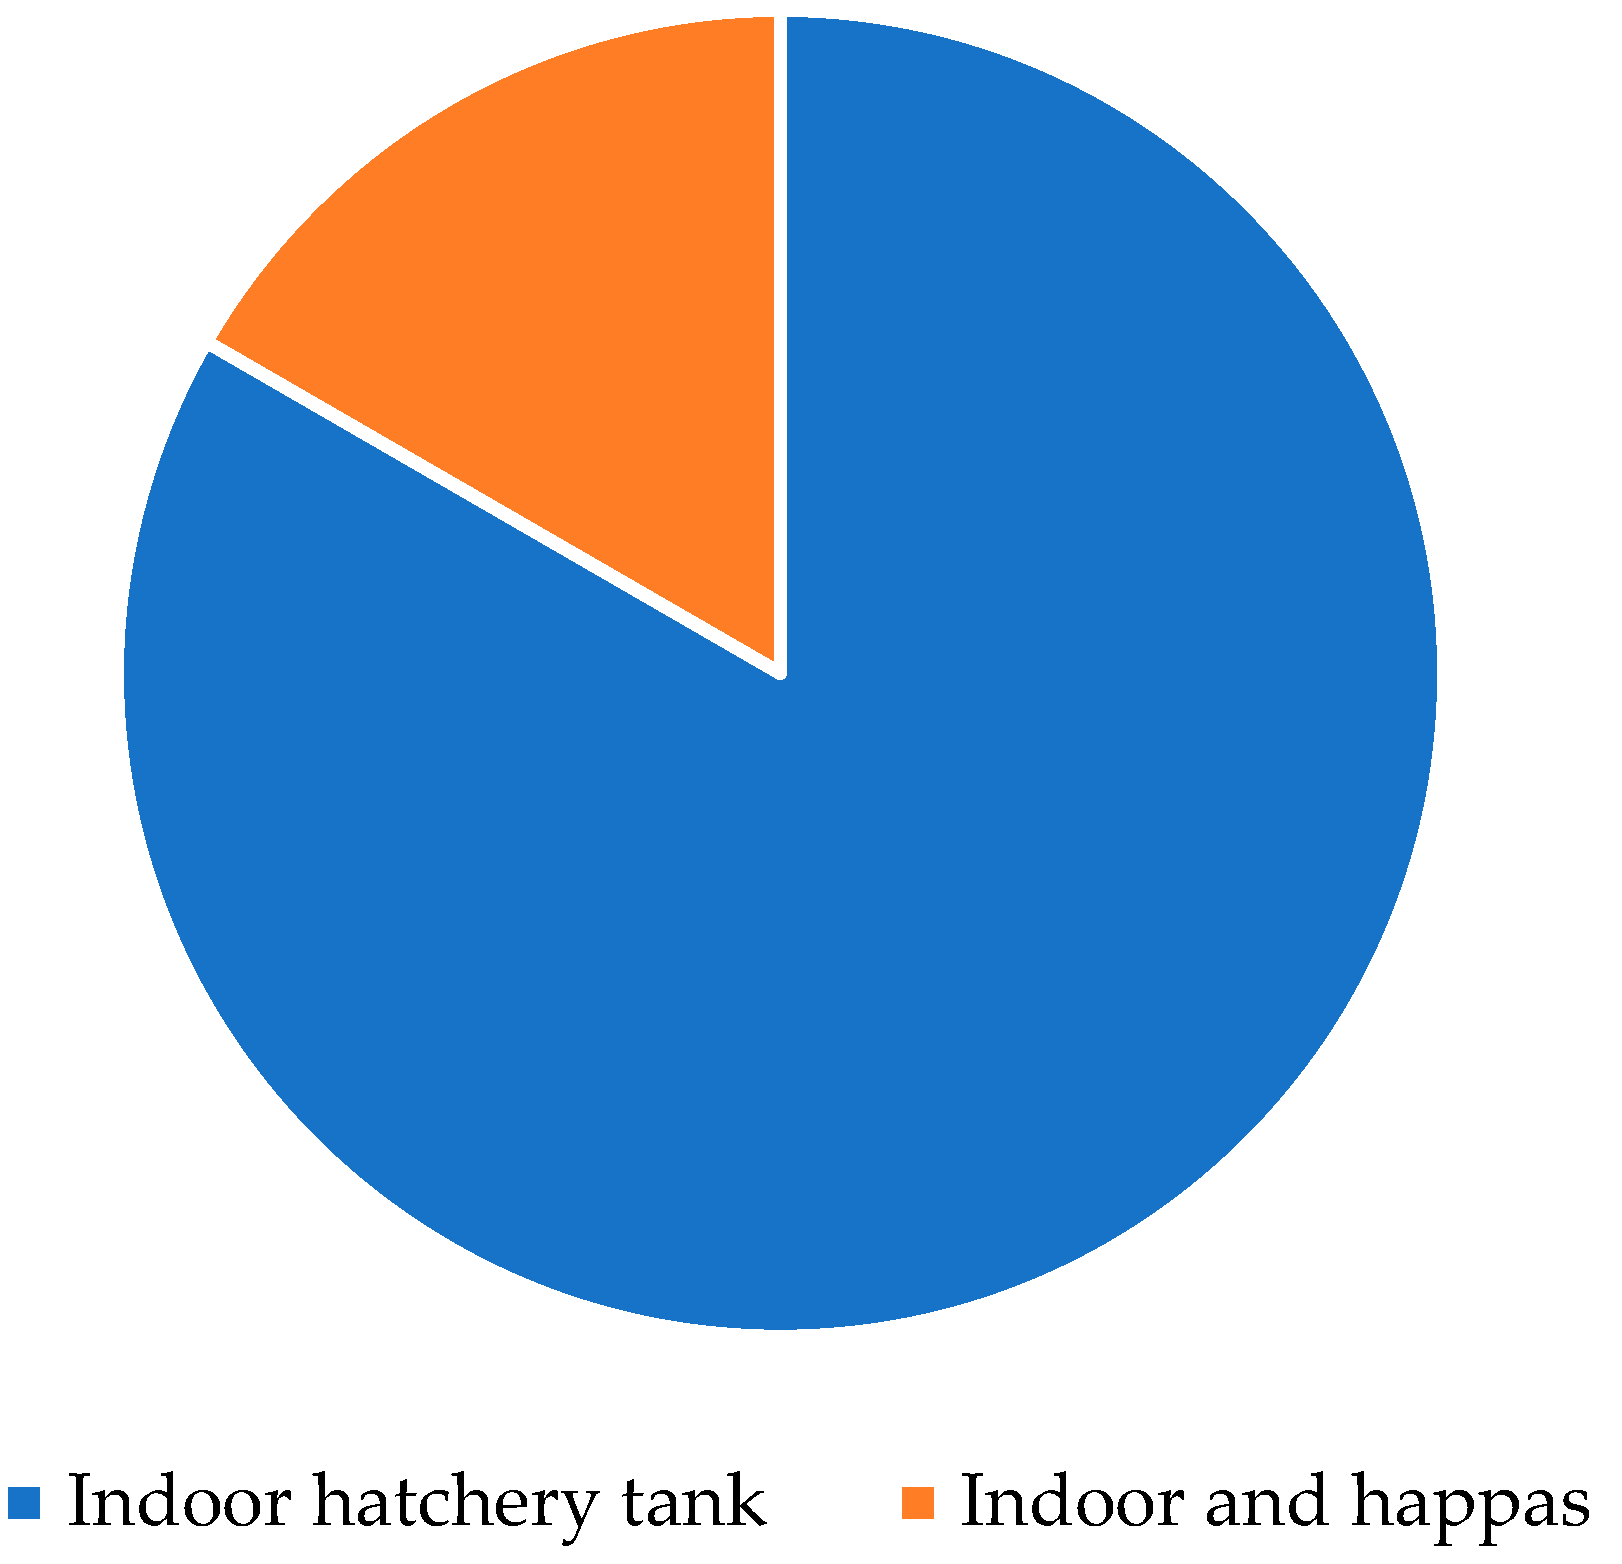
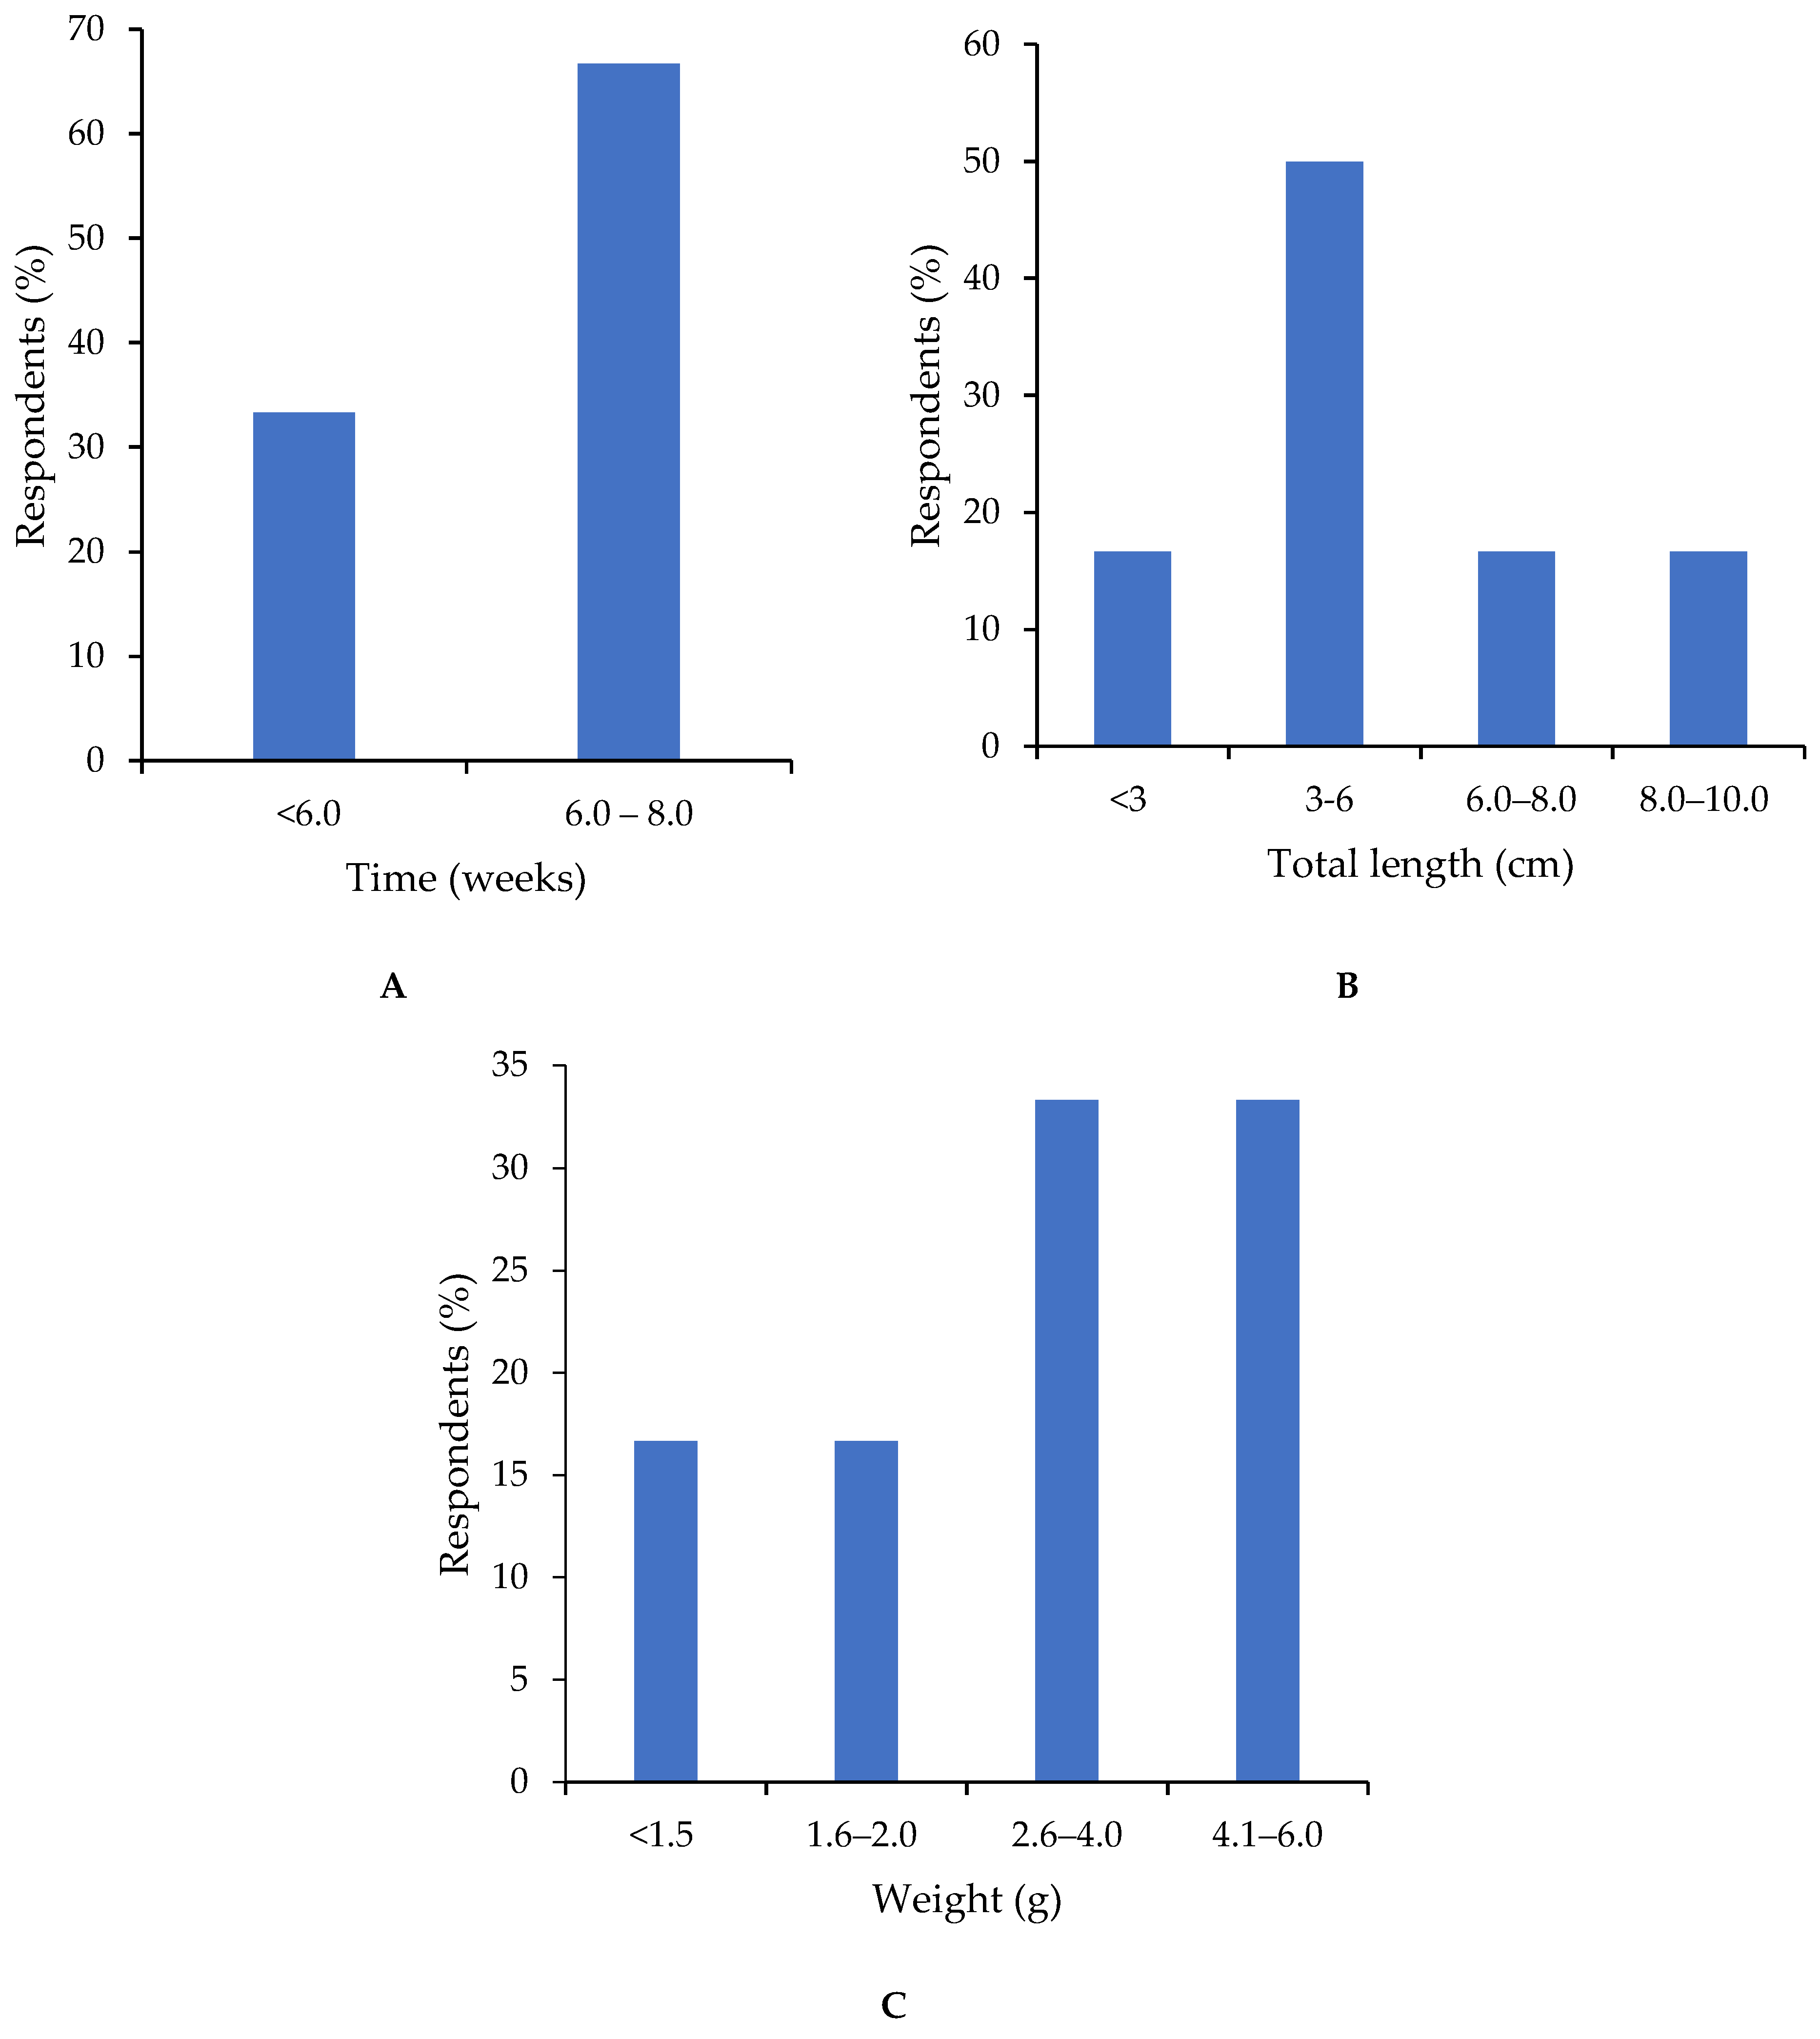
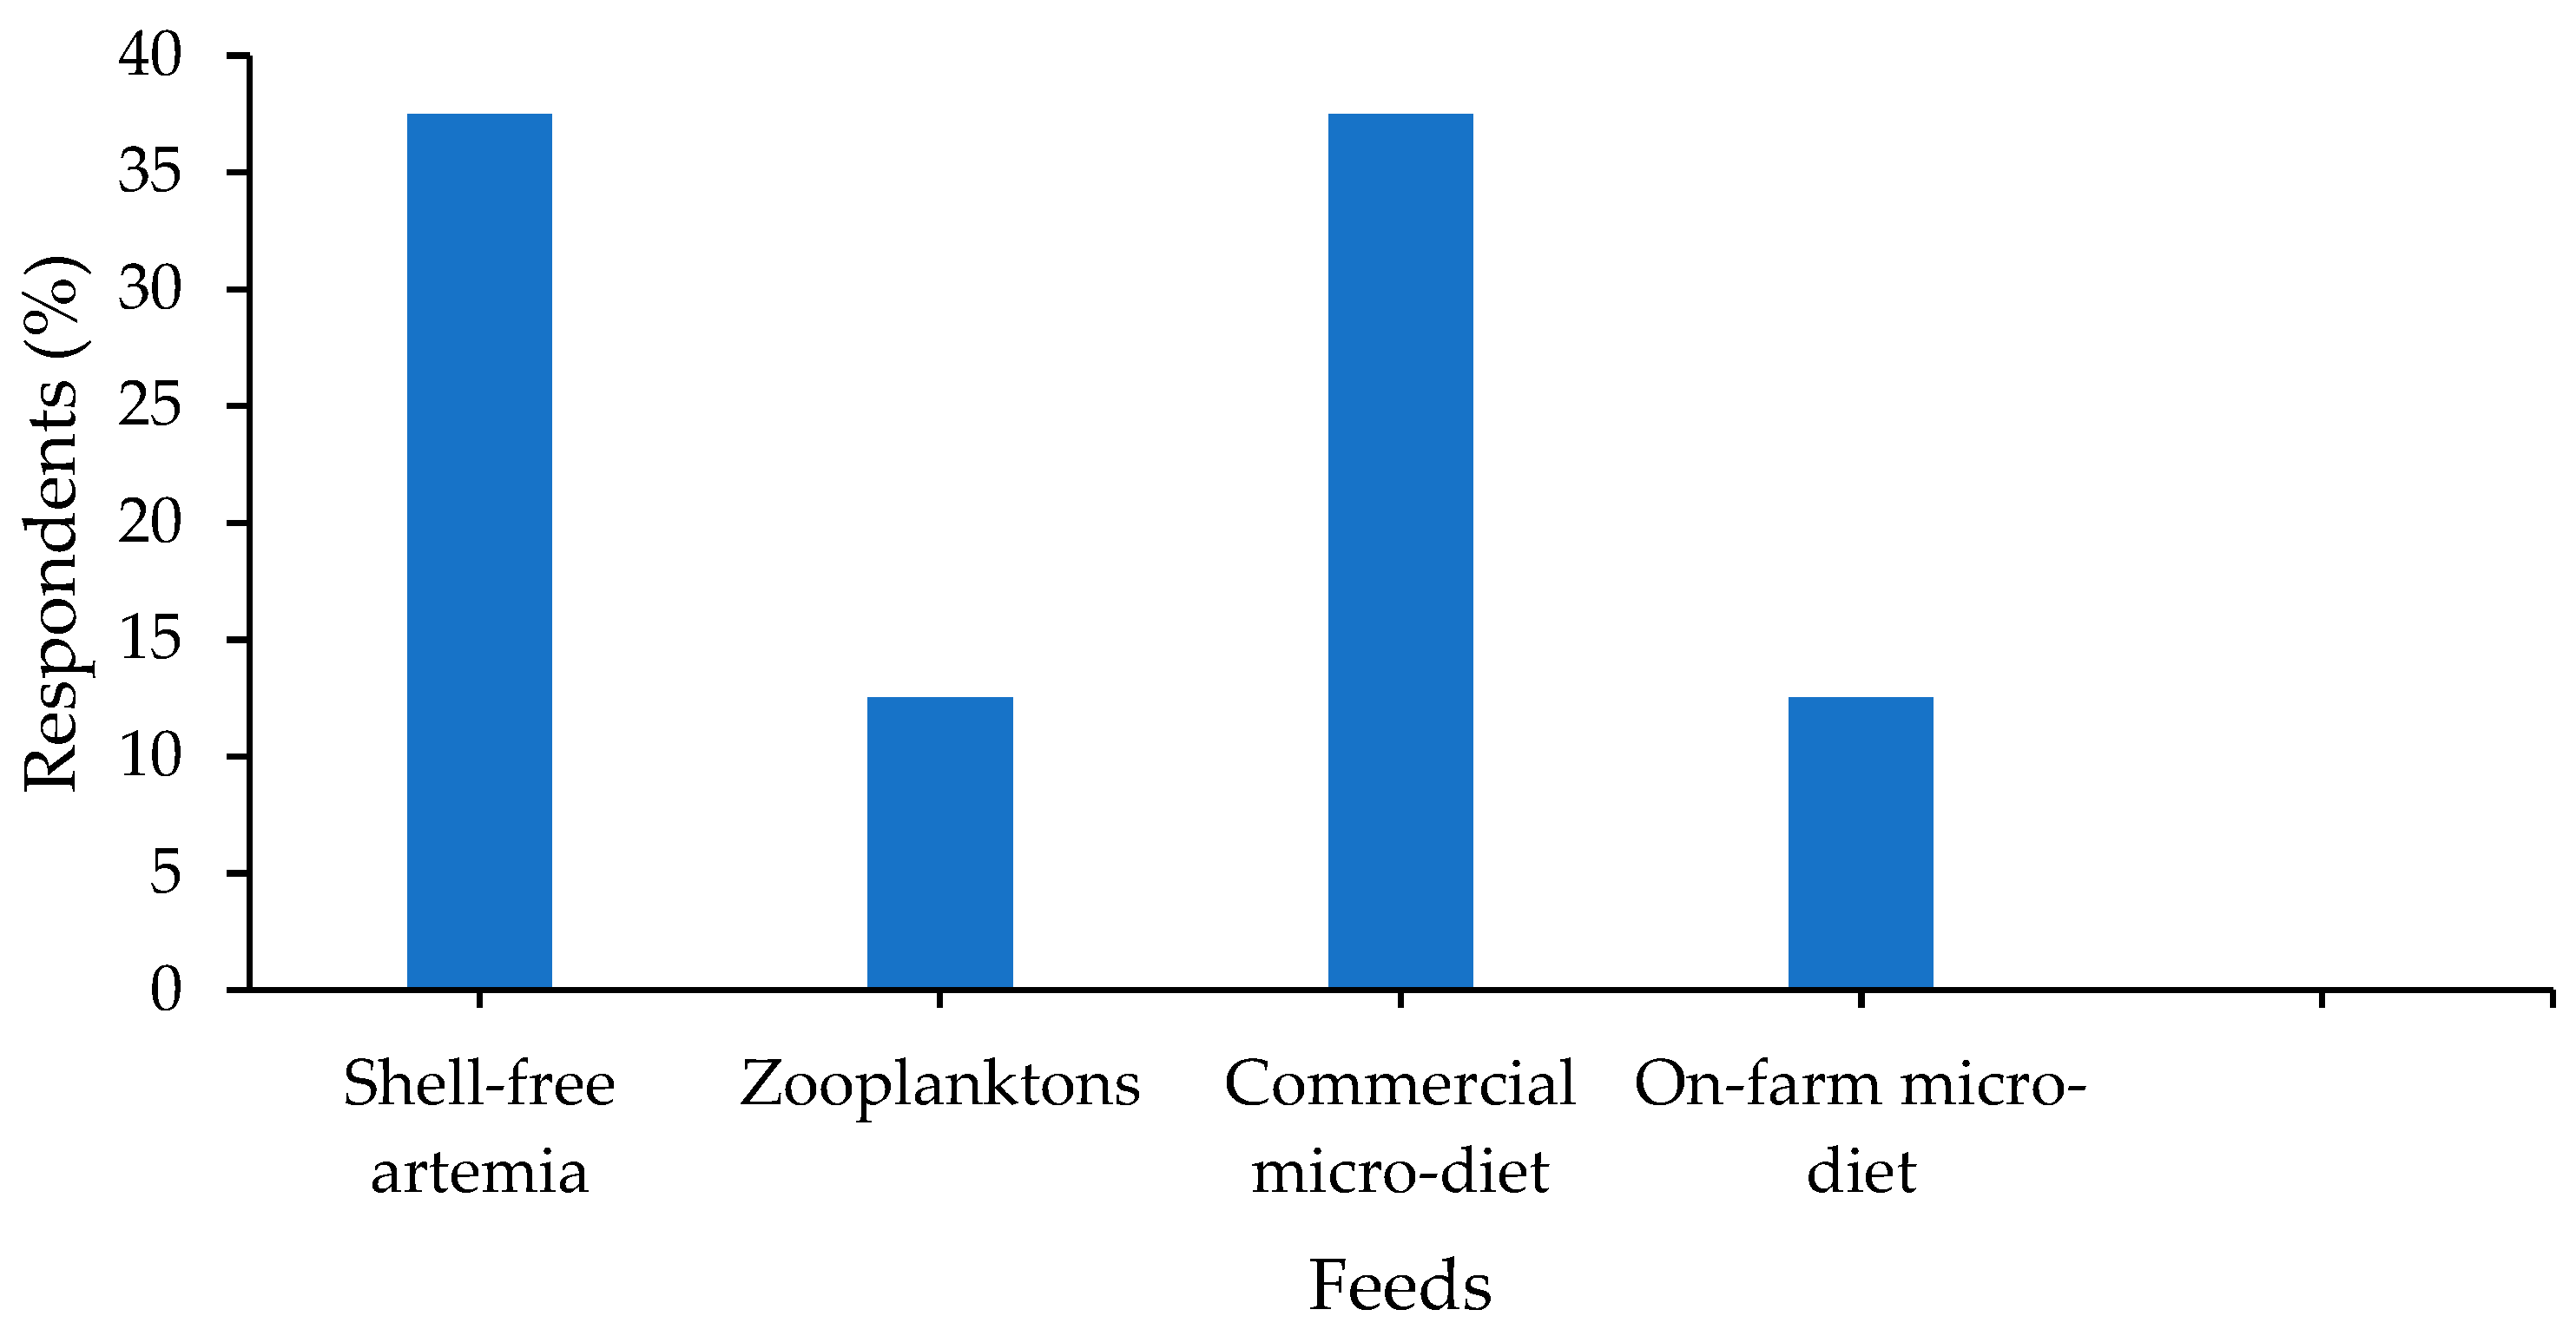
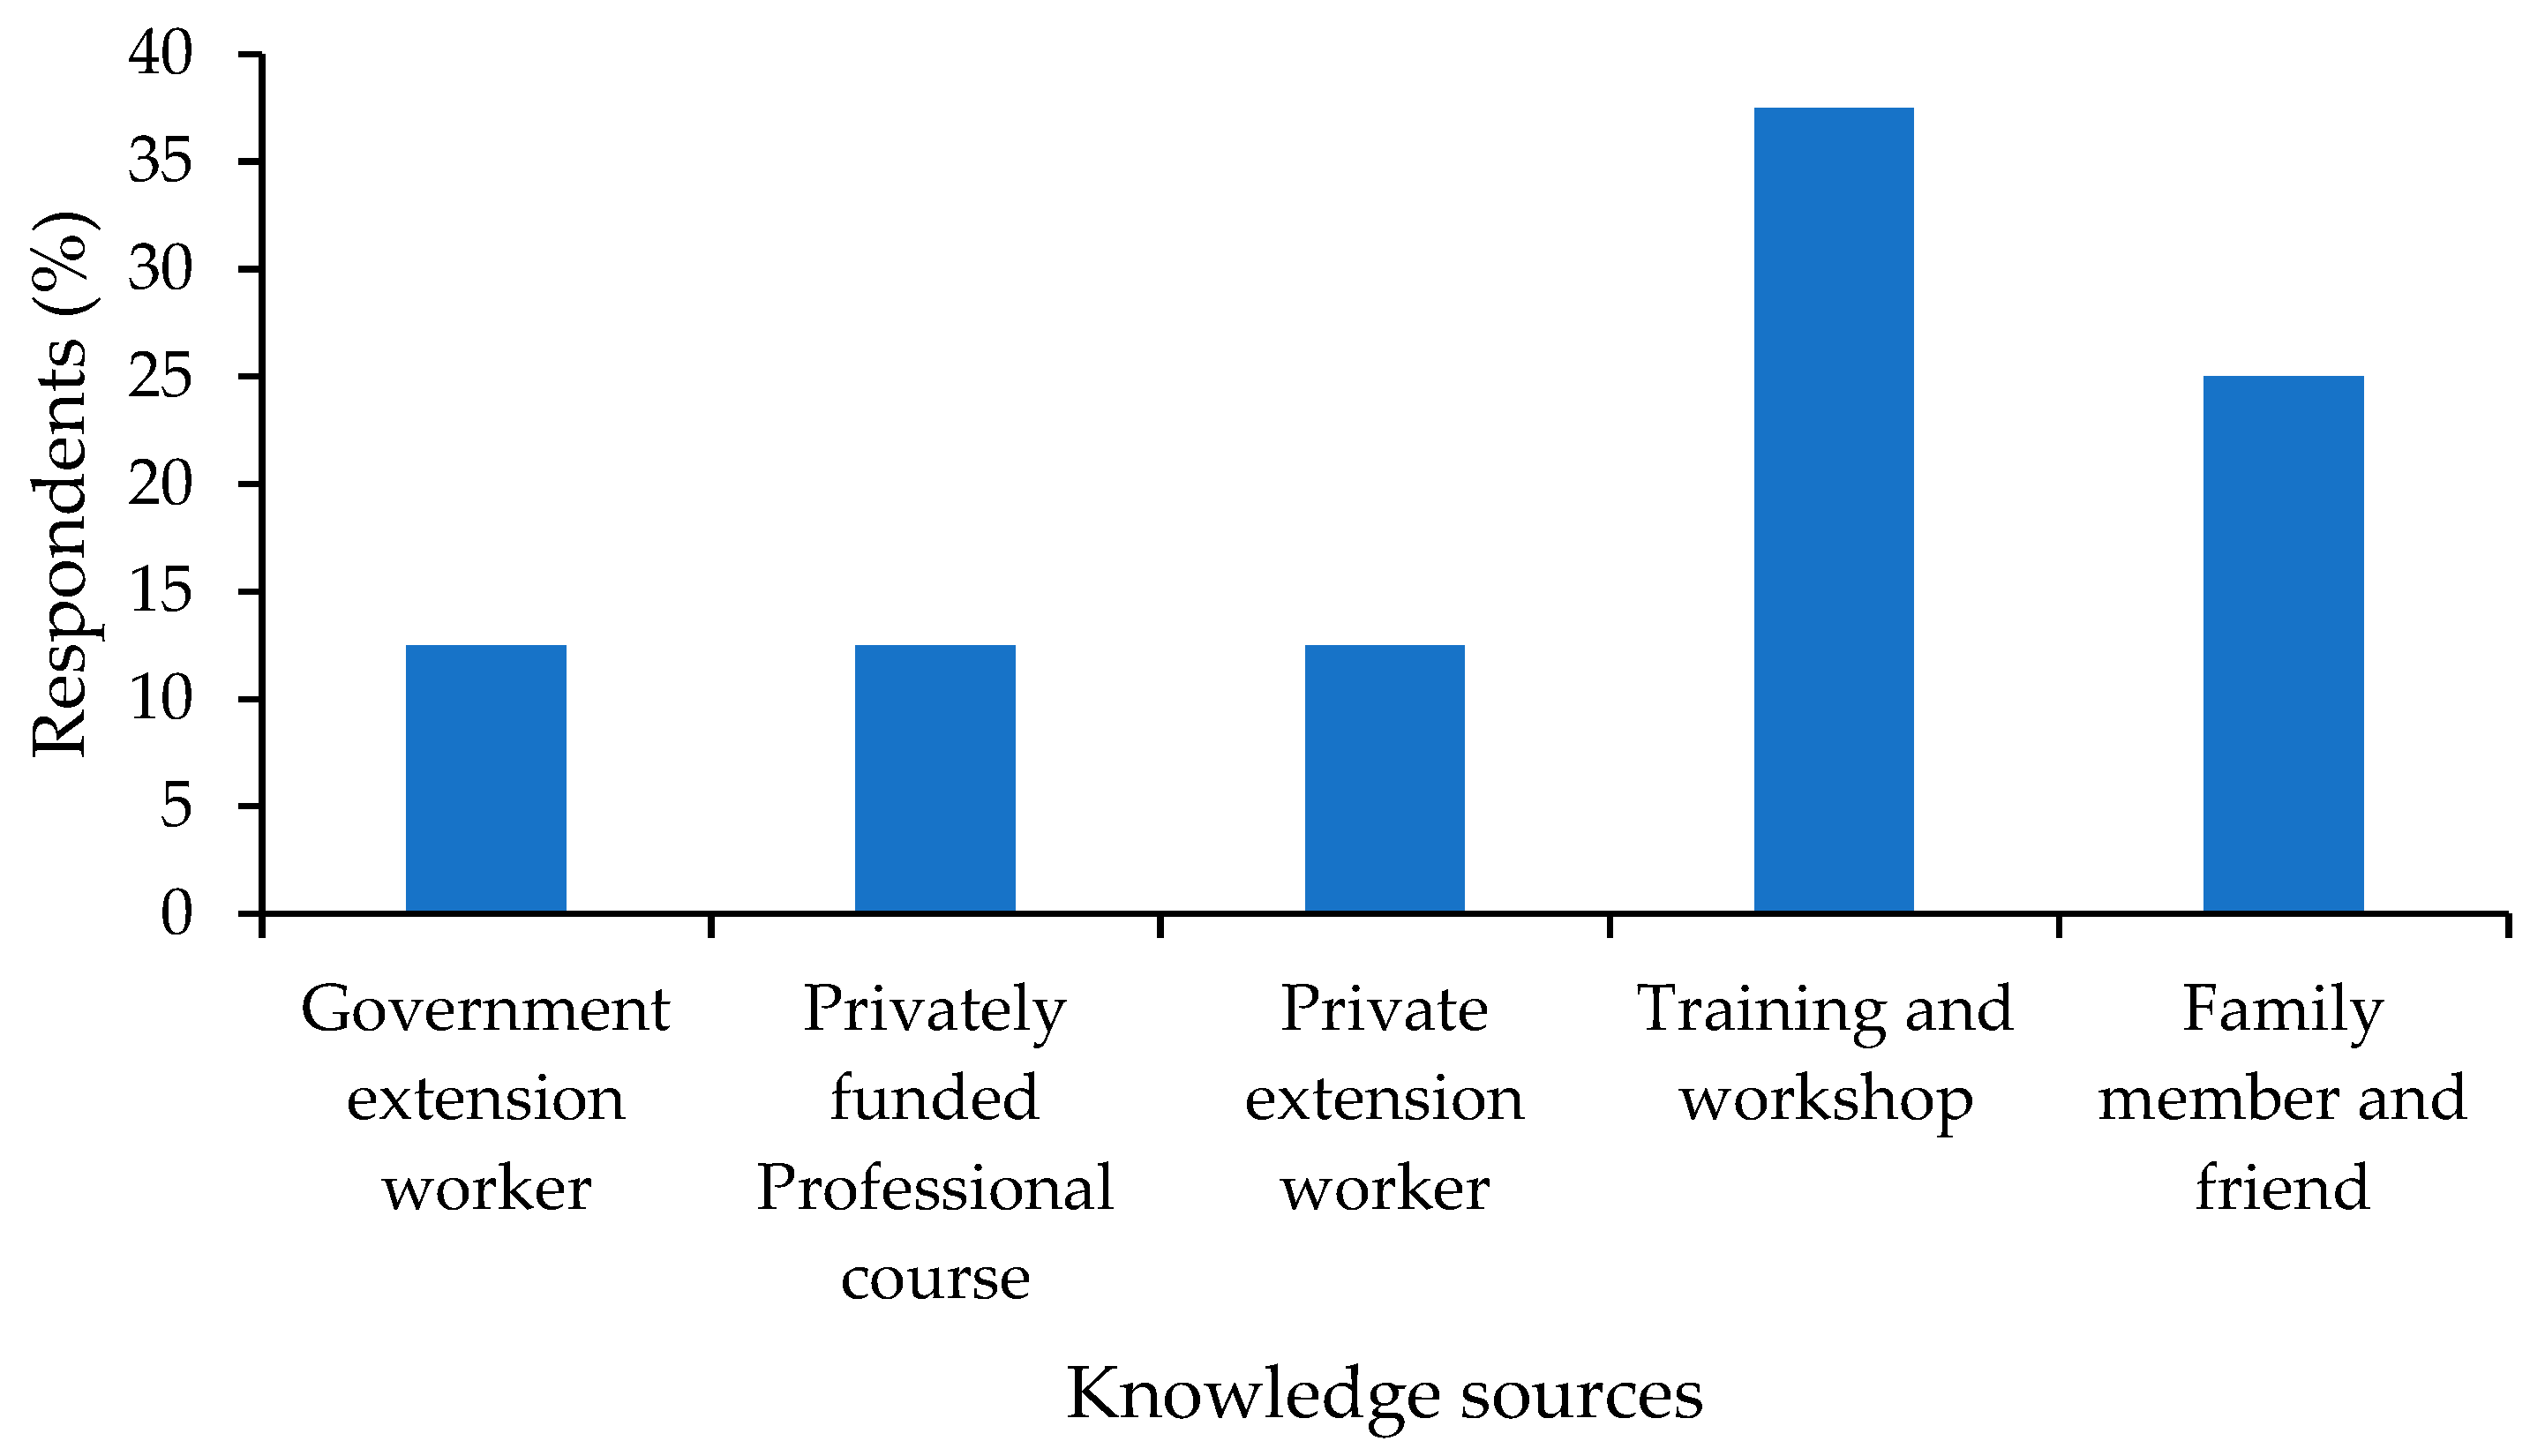
3.5. Hatchery Management
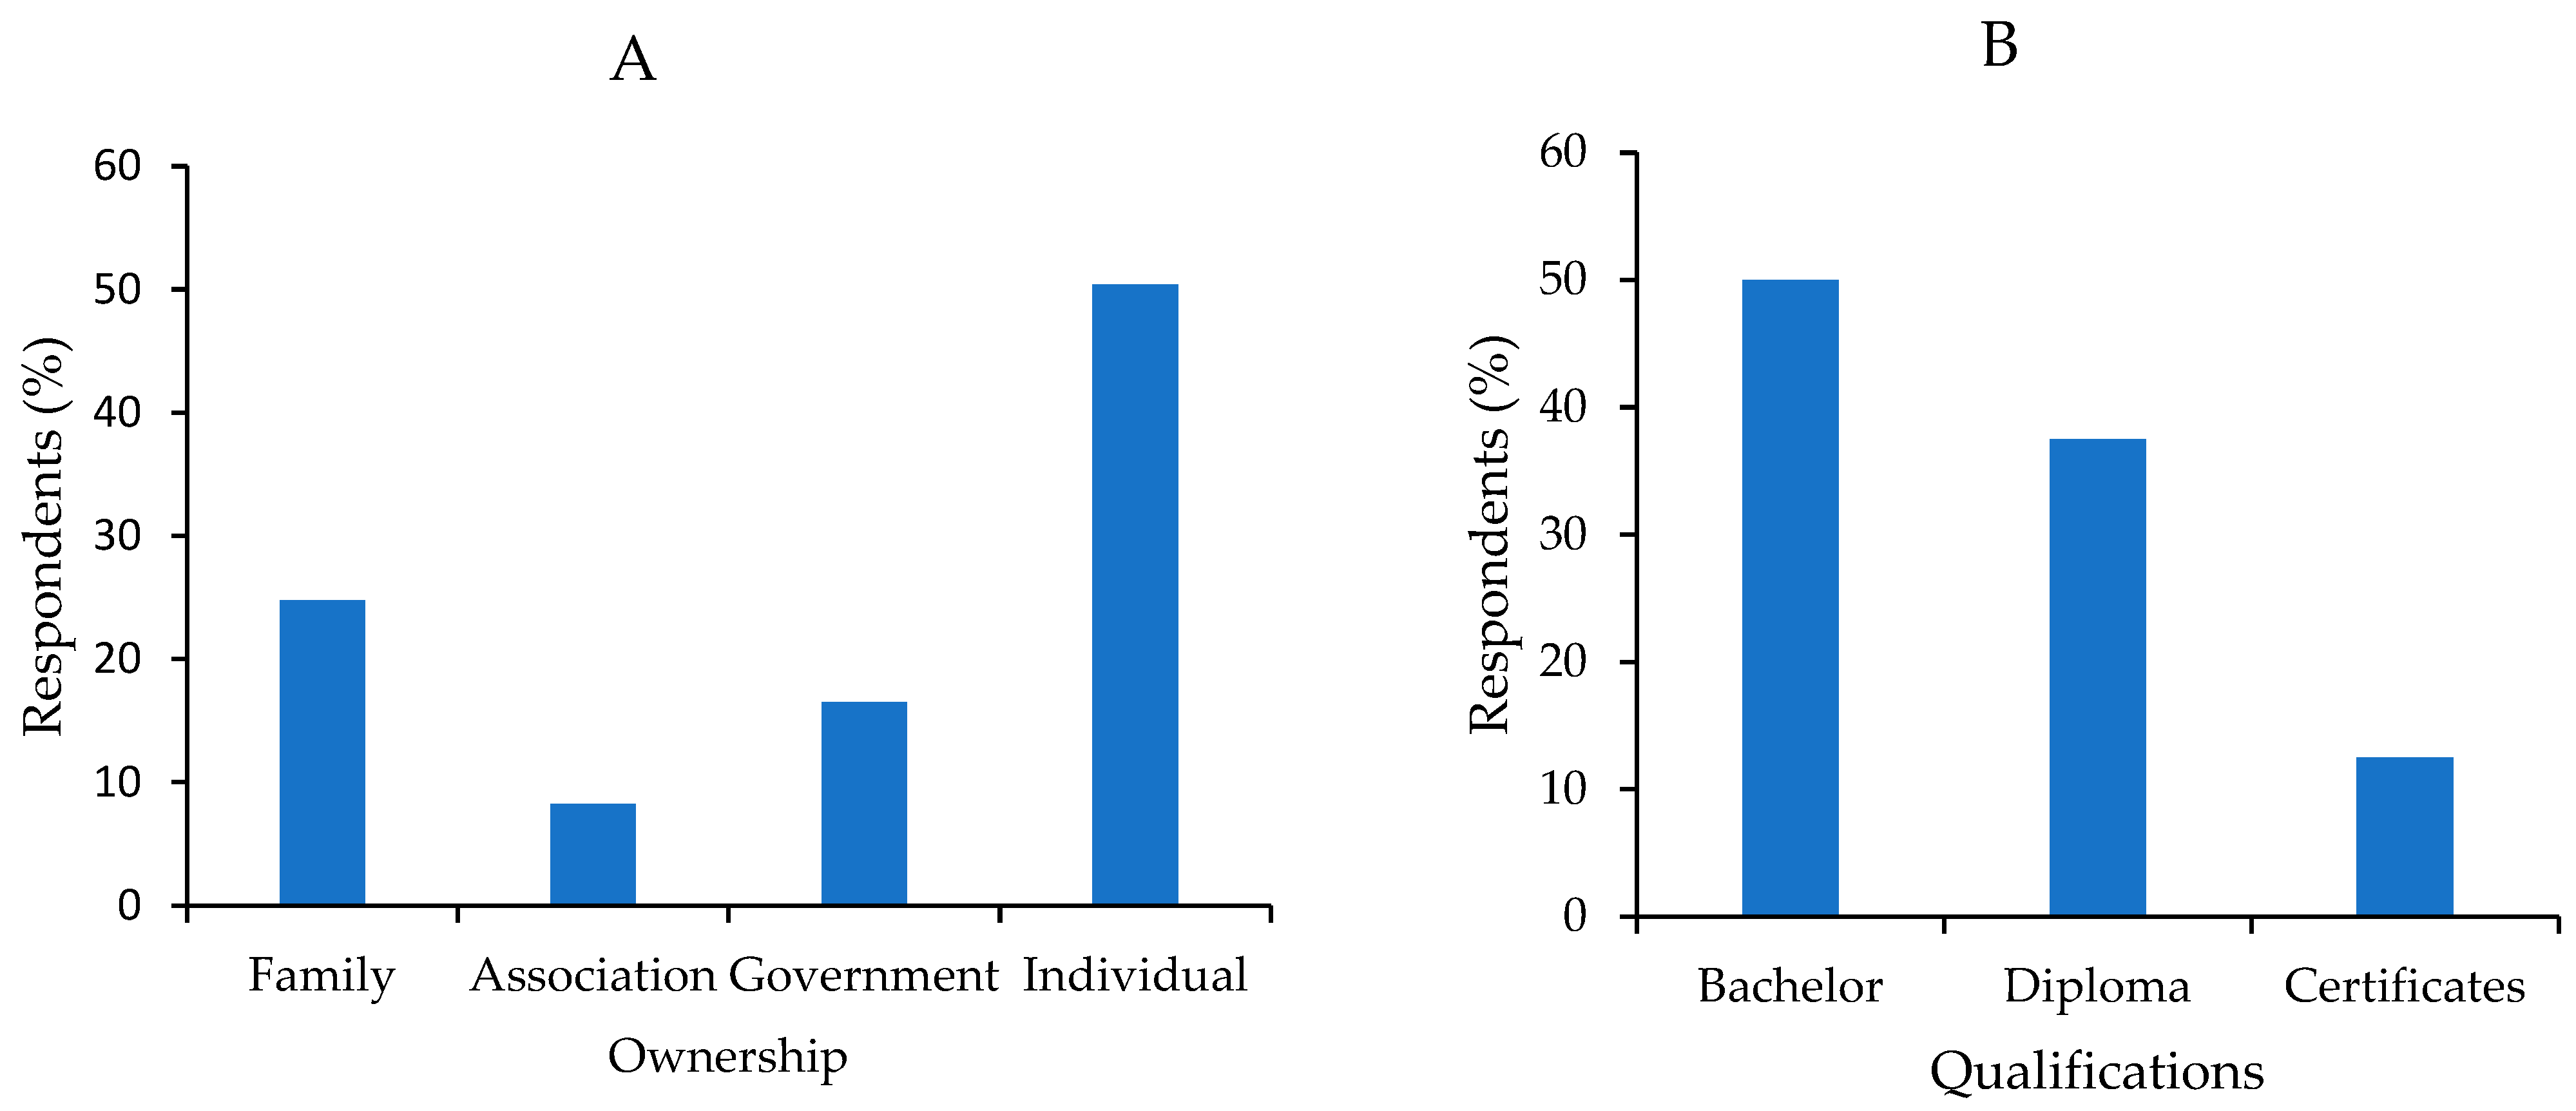
In the last 12 months, 50% of farmers achieved above 75% survival rates after hatching, followed by 33% who achieved between 50–75% (Figure 7A). Some farmers (17%) still experience hatchability below 50%. Although 75% survival is reached during hatching, half of the farmers (50%) achieve survival rates between 50% and 75% from larvae to juveniles (Figure 7B). Most farmers (67%) indicated that it takes them an average of seven weeks to raise a 3–6 cm fingerling with an average weight of 4 g, ready for market (Figure 8). Most farmers (38%) raised these fingerlings on a commercial micro diet and shell-free artemia (Figure 9). A few farmers (13%) solely used zooplankton to grow their fingerlings to market size.

3.6. Demographics

The workforce within these hatcheries was largely male-dominated, with 83% of workers identified as male and only 17% as female (Figure S12, supplementary).
Among the respondents, 50% reported being the sole proprietors of hatcheries primarily engaged in commercial production (Figure 10A). Family-owned hatcheries comprised 25%, government enterprises, including research institutions and regional fry centers, accounted for 17%, while 8% were managed by group associations (Figure 10A). Regarding educational qualifications, 50% of respondents held university degrees, 38% possessed diplomas across various disciplines, some of which were related to fisheries and aquaculture, and 13% had completed senior secondary education (Figure 10B). Regarding the sources of their expertise in hatchery operations and broodstock management, 38% reported acquiring it through privately organized training programs and workshops, while 25% cited learning from family members and friends (Figure 11). Fewer than 15% had participated in privately funded professional courses or workshops, in addition to accessing government extension services.

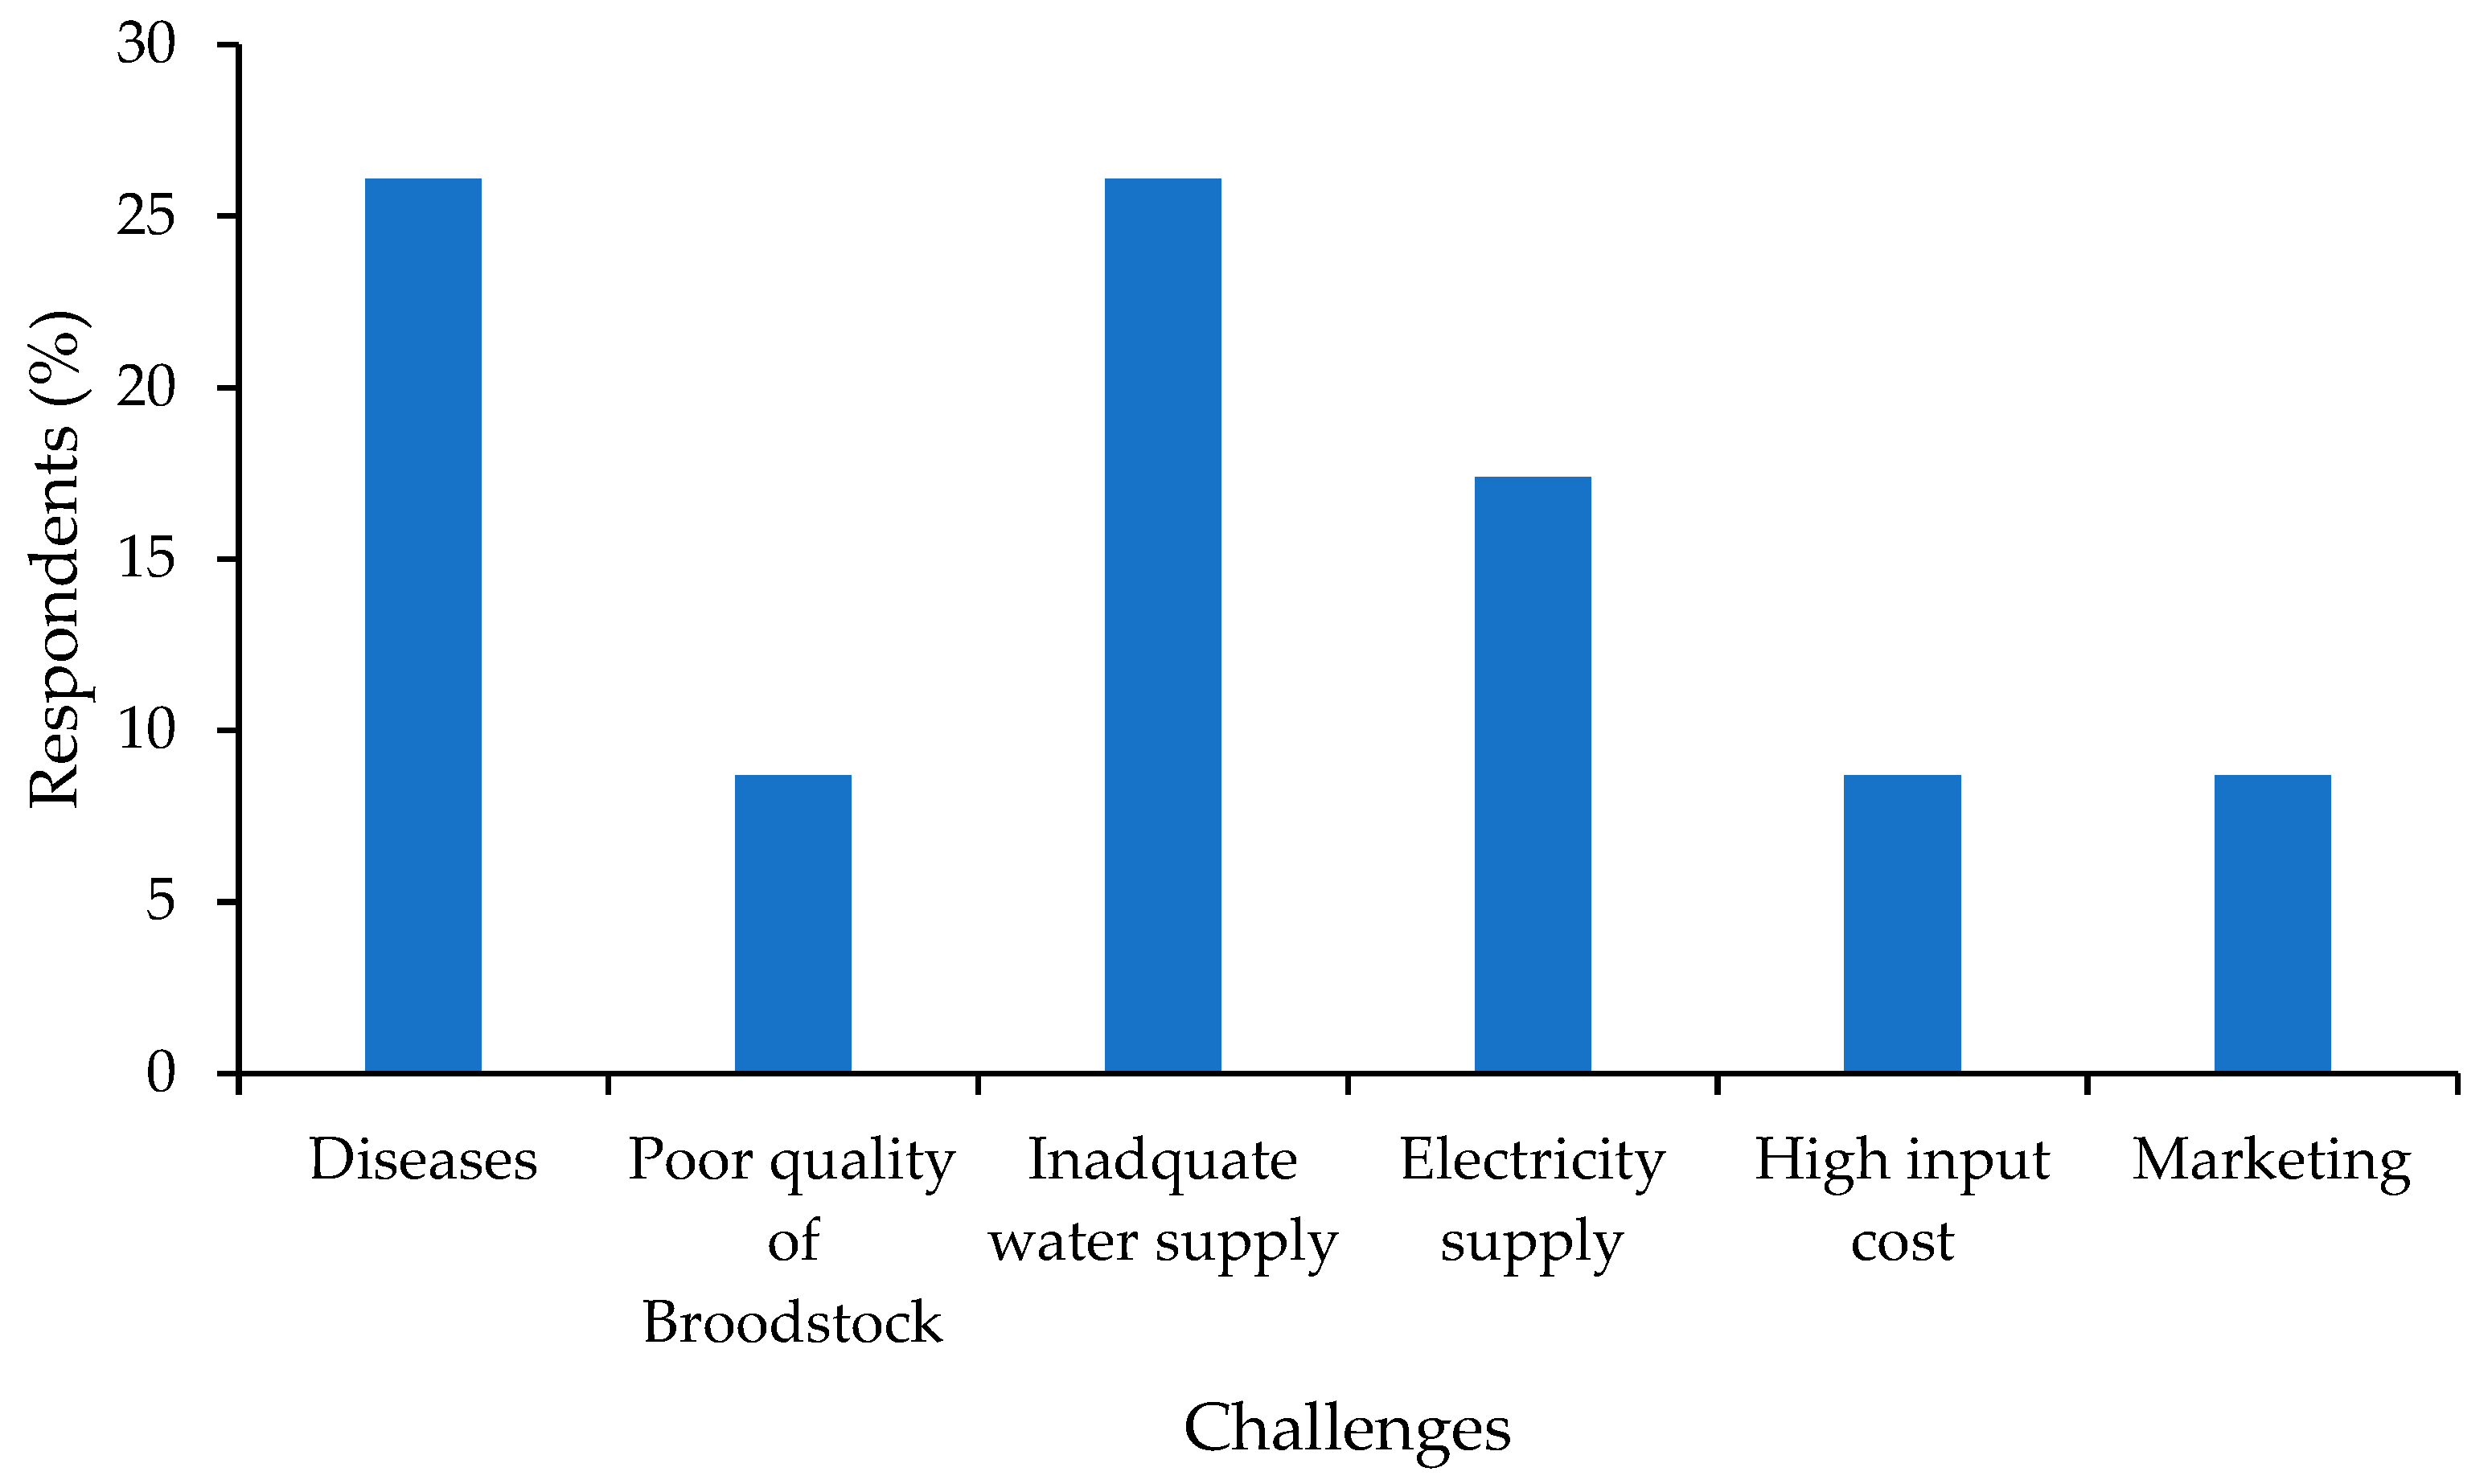
3.7. Main Obstacles in Hatchery Operation

Fish hatchery operators were queried about the main challenges hindering their farm production. Diseases and an inadequate water supply were the major challenges, followed by the electricity supply (17%) (Figure 12). Interestingly, only 8% of fish hatchery operators identified broodstock quality as their primary challenge (Figure 12).

4. Discussion

Growing investments in aquaculture have led to a steady rise in the demand for C. gariepinus fingerlings in Uganda, aiming to close significant production and supply gaps [5]. Despite the high demand for fingerlings, challenges such as broodstock quality and quantity, water quality, and electricity supply continue to hinder the sub-sector. Therefore, this study provides valuable information on broodstock and fingerling management in Uganda.

4.1. Broodstock Source

The study reveals that there are still some fish hatcheries that continue to source C. gariepinus broodstock directly from the natural water bodies. This practice persists despite the known risks associated with using uncharacterized genetic material in breeding programs. Similar trends have been reported in Nigeria, where many hatcheries still depend on wild or farmed stocks without a clear pedigree, often resulting in variable reproductive performance and poor seed quality [27,28]. These findings reflect a broader regional challenge in sub-Saharan Africa, where structured genetic improvement programs are limited [12]. The limited studies on the genetic characterization of wild C. gariepinus in Uganda exacerbates the situation [12,13,29]. While some African countries, such as Kenya, Ethiopia, and Nigeria, have initiated the molecular characterization of wild and cultured populations [30,31,32], similar efforts are limited in Uganda, hindering selective breeding and increasing the risk of inbreeding among the fish farmers.
The study also shows that most hatchery operators are located in the central region, near Lake Victoria. Similar results were previously reported by [9]. This proximity facilitates the easier and more cost-effective collection of broodstock from the lake compared to sourcing from more distant water bodies like Lake Albert. However, relying on a single gene pool risks genetic depletion if not managed properly.
The fact that 37% of farmers purchase table-sized fish to grow into broodstock reflects the challenge of broodstock access and affordability. This informal practice, also seen in Rwanda, contributes to inbreeding and poor seed quality [33]. Similar problems are evident in Nile tilapia breeding in Uganda, where informal sourcing has led to high inbreeding and poor growth traits [12,34], as well as in Ethiopia [35]. These regional patterns underscore the need for structured broodstock management systems.

4.2. Use of Shooters and Their Implications

The continued use of shooters (fast-growing fingerlings) as broodstock remains a common practice among C. gariepinus farmers, largely due to the assumption that these individuals carry superior genetic traits for growth and performance. However, this practice raises concerns about genetic diversity and long-term sustainability. Research indicates that the repeated use of shooters as broodstock often leads to mating among closely related individuals, resulting in reduced genetic variability and increased inbreeding in hatchery populations [36]. This loss of diversity can compromise fitness, reduce disease resistance, and limit adaptability to environmental changes. A study by [28] utilized mitochondrial DNA markers to assess genetic variation in C. gariepinus populations and found significant evidence of reduced heterozygosity and signs of inbreeding among hatchery stocks relying heavily on shooters. Similar findings were reported by [37], who highlighted that the unregulated selection of shooters contributed to genetic bottlenecks, emphasizing the risks associated with non-systematic broodstock management. Similar patterns have been observed in other aquaculture species, where strong selection for specific traits without proper genetic oversight has caused smaller effective population sizes and an increase in inbreeding depression [32].
While farmers often manage cannibalism and mortality among shooters through grading, increased feeding frequencies, and adjustments in stocking density, these measures address the symptoms rather than the underlying genetic causes. It remains unclear whether the rapid growth of shooters is predominantly genetic, environmental, or a combination of both [38]. Research by [38] revealed that while growth traits in C. gariepinus are moderately heritable, environmental factors also play a significant role. This suggests that breeding strategies should integrate genetic selection with careful environmental management.
There is a need to maintain broad genetic variation during broodstock selection to avoid fixing deleterious alleles and losing the alleles important for traits such as disease resistance and stress tolerance [39,40]. Structured breeding programs, as demonstrated in tilapia breeding initiatives like GIFT [12], highlight the benefits of controlled mating, genetic monitoring, and multi-trait selection in preventing inbreeding while improving performance traits. Recent genomic tools offer new opportunities to improve broodstock management in C. gariepinus. Studies utilizing SNP genotyping and genome-wide association analyses [41,42] have identified genetic markers linked to growth and survival traits, paving the way for marker-assisted selection and genomic selection approaches. These methods can complement traditional selection based on phenotype and reduce the risk of genetic erosion caused by a reliance on shooters.

4.3. Broodstock Production, Evaluation, and Replacement Strategies

The fact that most hatcheries still raise their broodstocks in ponds indicates that catfish production in Uganda continues to depend on this method, unlike countries that primarily use outdoor tanks for production. The current study aligns with the findings of [9] and [43], who noted that pond culture remains the predominant production system for broodstock. This was attributed to affordability, natural fish behavior support, and lower technical requirements in pond management. We also observed that hatchery operators are using outdoor tanks to raise fingerlings, especially for farmers located in towns. This trend aligns with findings by [44], who noted that in areas with land scarcity or high urbanization, farmers prefer tanks or concrete systems due to space efficiency, ease of management, and better control over water quality and disease outbreaks. Also, the increasing availability and accessibility of materials such as tanks, fiberglass, and skilled personnel, in addition to limited land for pond construction, support this transition [44]. Compared to earlier studies that emphasized the dominance of ponds across all stages of production, the current findings suggest a growing diversification in system use, especially in response to urbanization and resource constraints. This indicates a gradual modernization of the hatchery practices in Uganda, albeit unevenly distributed depending on location and access to capital and technical support.
Matured 12-month-old broodstock weighing 1000 g were mostly used by catfish hatcheries in Uganda. Previous studies showed that this age and weight translate to high Gonadosomatic Index (GSI), hatchability (mostly > 75%), and survival rates (>50%) [45,46]. Additionally, the hatchability and survival rates of the fingerlings align with the findings of [10]. The fact that most hatcheries have a broodstock replacement strategy indicates an awareness of the need for maintaining genetic diversity among the farmed stock [47].
Due to the relatively high fecundity of catfish, there is a tendency that while some broodstock are used in breeding, others are sold; indeed, the survey revealed that <50% of the 200 individuals kept annually contributed to the next generation. Studies on catfish broodstock management indicate that the percentage of broodstock contributing to the next generation can vary based on breeding practices and management strategies [48,49]. For instance, a selective breeding program for C. gariepinus in Indonesia involved spawning 100 broodstock to produce breeding candidates, with 5% of the best-performing fish selected from each generation [50]. This approach resulted in over 50% cumulative genetic gain across three generations, demonstrating the effectiveness of selective breeding in improving aquaculture performance. As most farmers continue sacrificing males, this practice results in a reduction in the genetic diversity of the breeding population. Since males contribute to the genetic pool, killing them reduces the number of breeding males available in subsequent cycles, resulting in an over-reliance on a smaller genetic pool, which could cause inbreeding [51]. Therefore, revising such practices and adopting strategies that conserve male broodstock could help to enhance genetic diversity and ensure more balanced contributions from both sexes.

4.4. Effective Breeding Number (Ne) and Average Inbreeding Coefficient (F) and Its Implications on C. gariepinus Broodstock Management

The estimated Ne for most respondents was 133.33 and 178.22. The effective breeding number (Ne) indicates genetic stability within a population and is inversely related to the degree of inbreeding and genetic drift [26,52]. Factors influencing the effective breeding number include the number of male and female broodfish producing viable offspring, the sex ratio of the broodstock, the variance in family size, and the mating system used [53,54]. The lower Ne indicated by the number of respondents in this study suggests minimal levels of inbreeding among the catfish farms, which aligns with findings from [53]. However, other factors, such as mating siblings, management practices, skewed sex ratios, high fecundity, limited genetic studies of C. gariepinus, and, importantly, the lack of structured breeding programs, cannot rule out the possibility of existing inbreeding depression in the C. gariepinus strains cultured in Uganda. This situation is particularly pertinent since most hatchery operators’ source broodstock from fellow farmers (37%) whose genetic diversity remains unknown; this raises the risk of inbreeding, especially if the broodstock is drawn from small or related populations in a water body, consistent with other studies [13]. The observed sex ratios of 1 male to 2 females (F = 0.4%) and 1:3 (F = 0.3%) correspond with findings from other studies [3,54]. Many farmers in Nigeria practice mating ratios of 1:2 and 1:3, showing no significant differences in hatchery performance [7]. Additionally, it is crucial not to overlook how frequently the same females are used throughout their lifetime, as most operators rely on broodstocks more than four times a year. Such practices heighten the risk of inbreeding and genetic bottlenecks, as these broodstocks are maintained in the same closed systems. Studies by [55] highlight that repeatedly using the same broodstock without rotation or introducing new genetic material can accelerate inbreeding.

4.5. Hatchery Operations and Fry Production

The current study indicates that most farmers utilize indoor tanks to raise their fingerlings, a beneficial practice as it provides a controlled environment for production. One previous study emphasized the benefits of indoor tanks in aquaculture, as they facilitate easier monitoring and management of environmental factors [49]. This study noted that indoor tank systems enable farmers to maintain optimal water quality, essential for the growth and health of fingerlings. This is in line with the findings of the current study, where the controlled environment in indoor tanks is recognized as advantageous for production. Regulating factors such as oxygen levels, pH, and temperature results in a more stable and predictable rearing environment, particularly vital during the early life stages when fingerlings are particularly susceptible to environmental stressors.
The overdependence on synthetic hormones, especially Ovaprimu and Ovatide, while inducing females is attributed to their availability and reasonable prices in the market in Uganda. The use of synthetic hormones like Ovaprimu and Ovatide is widely recognized for its ability to improve breeding efficiency in aquaculture. A review by [56] noted that these hormones can significantly enhance spawning rates and help induce reproductive maturity in females, allowing farmers to control and synchronize spawning, which is vital for improving production efficiency. This aligns with the findings in the current study, where the affordability and availability of hormones like Ovaprimu and Ovatide are seen as key factors driving their use in Uganda.
Many studies report that the weight of standard fingerlings ranges from 5 to 10 g [39,57,58], which aligns with the current findings. Most respondents indicated that it takes an average of seven weeks to raise 5.0 g fingerlings using commercial micro diets and shell-free Artemia. The introduction of shell-free Artemia and cost-effective commercial micro diets has resolved the persistent challenges associated with feed nutrition [59].

4.6. Demographics and Their Implications on Broodstock Management and Hatchery Practices

While the breeding and management of catfish seem straightforward, technical education contributes to their success. Despite 50% of hatchery operators having attained tertiary education, the majority lacked the relevant qualifications in fisheries or aquaculture, relying instead on informal training through relatives, friends, or short government courses. Such educational shortcomings impact the overall management of the fish breeding chain. For example, issues like genetic management, variation, inbreeding depression, and heritability define the broodstock quality, and without a tertiary degree in fisheries and aquaculture or a related course, it is hard to achieve this in aquaculture [60]. Previous studies have consistently emphasized the role of education and training in the success of aquaculture ventures. For example, ref. [60] found that formal education in aquaculture and fisheries significantly improves the management of breeding programs, particularly regarding genetic selection and maintaining stock health.
The current study’s finding that many hatchery managers rely on informal training from family, friends, or government short courses aligns with Khademi-Vidra et al.’s [61] observation that a lack of specialized training can lead to inefficiencies in breeding management, particularly in small-scale, family-operated farms. Moreover, inadequate education in genetic management can lead to poor broodstock choices, resulting in decreased genetic diversity and potential inbreeding, which undermines the sustainability of the breeding program [62].

4.7. Main Challenges of Hatchery Operations

Uganda’s aquaculture sector continues to face structural challenges despite notable growth. This study found that the broodstock quality was perceived as a minor concern by hatchery operators, contrasting with previous studies that emphasize its critical role in ensuring fingerling quality and sector sustainability [13,63,64]. The fact that most hatchery operators are not academically trained aquaculture professionals limits their knowledge of the genetics and genetic potential of different C. gariepinus strains and populations. Similar results were reported by [13], where most hatchery operators (82.6%) had attained a tertiary education, although not aquaculture-specific qualifications. Such an educational gap affects their ability to appreciate broodstock quality issues, which may explain the low results observed. Without the proper knowledge, it is difficult to know whether the disease challenges recorded as a major challenge in this study are endemic or as a result of decreased disease resistance/increased susceptibility due to inbreeding depression. Also, the fact that many respondents buy males and females from separate farms is an indication of the insight into existing broodstock quality issues.
The current study shows that diseases, electricity supply, and inadequate water quality are the main issues affecting hatchery management. Unreliable electricity has been a national issue affecting many sectors including aquaculture, increasing production costs [65,66]. Also, an inadequate water and electricity supply reduces the production yields, especially when poor water quality and mortalities result from power shortages. This concern is heightened in peri-urban and intensive tank systems, where maintaining the water quality depends entirely on a continuous access to electricity. Other studies have reported that water quality is a major challenge affecting aquaculture production in Uganda [67]. A study by [67] observed that if the ammonia content, temperature, pH, and iron content were slightly outside the recommended ranges, these had significant effects on the aquaculture growth.

5. Conclusions

The selection of hatcheries and regions for this survey was intended to capture a comprehensive understanding of the hatchery practices, challenges, and opportunities in C. gariepinus aquaculture in Uganda. Despite the availability of inputs and technology, knowledge gaps persist, particularly in broodstock management, largely due to the limited training among hatchery operators. This underscores the need for enhanced education, research, regulation, and capacity-building initiatives.
The study also indicated that farmers continue to get broodstock from fellow farmers and natural waterbodies whose genetic information is unknown, increasing the risk of inbreeding. Research institutions (ARDC and ZARDIs) should play a central role in characterizing both the farmed and wild stocks of C. gariepinus to provide updated genetic information to the farmers. Additionally, these institutions should genetically characterize shooters to determine whether they possess superior genetic traits, as commonly assumed by farmers, given the widespread use of this practice. Also, more studies need to be undertaken to establish appropriate mating schemes so that the best scheme is adopted by the hatchery operators. The hatchery operators should reduce the repeated use of the same broodfish and prioritize sourcing from genetically verified stocks.
Since most farmers lack aquaculture-tailored training, the Ministry of Agriculture, Animal Industry and Fisheries (MAAIF) must support these farmers by equipping them with short courses tailored to hatchery operation Best Management Practices (BMPs), including broodstock management, hatchery operations, farm record keeping, and fry feeds and feeding. Also, ARDC and MAAIF must work hand-in-hand with the hatchery operators to standardize protocols for the replacement and selection of broodstocks to enhance genetic quality while preventing inbreeding.
Additionally, the use of commercial grow-out feeds for broodstock highlights the need for affordable, specialized nutrition. Government intervention is essential, particularly in addressing hatchery energy needs, exploring solar power, and offering input subsidies and technical support.
Above all, effective broodstock genetic management and selective breeding are critical for improving performance and ensuring the long-term sustainability of the African catfish aquaculture sub-sector.

Supplementary Materials

The following supporting information can be downloaded at: https://www.mdpi.com/article/10.3390/fishes10060290/s1, Figure S1: Use of the shooters at the farm (N = 24), Figure S2: Lakes to which broodstocks are collected, Figure S3: Production systems at the farm (N = 24), Figure S4: Source of water at the farm, Figure S5: Brood stock replacement strategy, Figure S6: Reasons for broodstock replacement (N = 24), Figure S7: Milt collection from males, Figure S8: Brood stock age at spawning (n = 24), Figure S9: Mating ratios, Figure (N = 24), S10:Hormones used during the induction of the female broodstock (N = 24), Figure S11: Methods used in the induction of the females, Figure S12: Gender segregation in farm ownership.

Author Contributions

G.K.: Conceptualization, review and editing, writing—original draft, visualization, validation, software, project administration, investigation, formal analysis. S.M.T.: Software, data collection, writing, review, and editing, formal analysis. P.R.: Writing, review and editing, formal analysis. I.A.: Writing, review and editing, conceptualization. W.W.M.: Supervision, project administration, funding, writing, review and editing. H.M.: Supervision, project administration, writing, review and editing, funding acquisition, conceptualization. All authors have read and agreed to the published version of the manuscript.

Funding

This study received financial support from the Austrian–African Research Network (Africa-UniNet), under grant number P133. Africa-UniNet is an Austrian Development Cooperation (ADC) program implemented by the Austrian Agency for International Cooperation in Education and Research (OeAD-GmbH).

Institutional Review Board Statement

Not applicable.

Informed Consent Statement

Not applicable.

Data Availability Statement

All data are included in this manuscript.

Acknowledgments

The study acknowledges hatchery operators for their cooperation during the survey. Different fisheries officers in the Albertine and Victoria basins are acknowledged. The authors have reviewed and edited the output and take full responsibility for the content of this publication.

Conflicts of Interest

The authors declare no conflicts of interest.

References

  1. Munguti, J.; Muthoka, M.; Mboya, J.B.; Kyule, D.; Meenakshisundaram, M.; Tanga, C.M. Unraveling the Potential of Black Soldier Fly Larvae as a Sustainable Protein Source for Nile Tilapia Production in Diverse Aquaculture Systems. Aquac. Nutr. 2025, 2025, 3598843. [Google Scholar] [CrossRef] [PubMed]
  2. Subasinghe, R.; Soto, D.; Jia, J. Global aquaculture and its role in sustainable development. Rev. Aquac. 2009, 1, 2–9. [Google Scholar] [CrossRef]
  3. Saidu, M. Contributions of Fisheries and Aquaculture to Food Security in Africa. In Food Security, Nutrition and Sustainability Through Aquaculture Technologies; Springer: Berlin/Heidelberg, Germany, 2025; pp. 493–502. [Google Scholar]
  4. The State of World Fisheries and Aquaculture. In The State of World Fisheries and Aquaculture; Blue Transformation in Action; FAO: Rome, Italy, 2024.
  5. Adeleke, B.; Robertson-Andersson, D.; Moodley, G.; Taylor, S. Aquaculture in Africa: A comparative review of Egypt, Nigeria, and Uganda vis-a-vis South Africa. Rev. Fish. Sci. Aquac. 2020, 29, 167–197. [Google Scholar] [CrossRef]
  6. MAAIF. The National Fisheries and Aquaculture Policy Implementation Strategy and Action Plan; MAAIF: Entebbe, Uganda, 2018; p. 53. [Google Scholar]
  7. Aanyu, M.; Denis, O.; Cassius, A.; Gertrude, A. Potential for enhancing and sustaining commercial aquaculture in Uganda: Producer organizations, contract farming schemes and public-private partnerships. Int. J. Fish. Aquat. Stud. 2020, 8, 258–264. [Google Scholar]
  8. Rutaisire, J.; Nandi, S.; Sundaray, J.K. A review of Uganda and India’s freshwater aquaculture: Key practices and experience from each country. J. Ecol. Nat. Environ. 2017, 9, 15–29. [Google Scholar]
  9. Safina, N.; Gertrude, A.; Lawrance, O.; Ronald, W.; Alphonse, C.; Samuel, O.; Izaara, A.A. Profitability and viability analysis of aquaculture production in Central Uganda: A case of urban and peri-urban areas. Asian J. Agric. Ext. Econ. Soc. 2018, 22, 1–11. [Google Scholar] [CrossRef]
  10. Aruho, C.; Mwanja, M.T.; Bugenyi, F.; Rutaisire, J. Effectiveness of African catfish pituitary extracts, dagin and water flow for optimising egg production, fertilisation and hatchability in artificial spawning of Barbus altianalis. Uganda J. Agric. Sci. 2016, 17, 183–195. [Google Scholar] [CrossRef]
  11. MAAIF. Ministry of Agriculture, Animal Industry and Fisheries, Uganda. Agriculture Sector Strategic Plan (2020/21–2024/25) ASSP III; Fish Thematic Area. 2025, p. 50. Available online: https://www.agriculture.go.ug/agriculture-sector-strategic-plan-assp/ (accessed on 11 June 2025).
  12. Abaho, I.; Kwikiriza, G.; Atukwatse, F.; Izaara, A.A.; Ekwangu, J.; Baguma, S.D.; Kasozi, N. Selective Breeding for Genetic Improvement of Nile tilapia (Oreochromis niloticus Linnaeus, 1758) in Uganda: Current Status, Challenges, and Future Perspectives. Animals 2025, 15, 142. [Google Scholar] [CrossRef]
  13. Matthew, M.; Justus, R.; Constantine, O.; Richard, D.; Casius, A. Current fish hatchery practices in Uganda: The potential for future investment. Int. J. Fish. Aquat. Stud. 2015, 2, 224–232. [Google Scholar]
  14. Mwanja, M.; Ondhoro, C.; Sserwada, M.; Achieng, P.; Ddungu, R.; Mwanja, W. Morphological variation of Nile tilapia populations from major water bodies of Uganda. Uganda J. Agric. Sci. 2016, 17, 21–32. [Google Scholar] [CrossRef]
  15. Kwikiriza, G.; Yegon, M.J.; Byamugisha, N.; Beingana, A.; Atukwatse, F.; Barekye, A.; Nattabi, J.K.; Meimberg, H. Morphometric variations of Nile tilapia (Oreochromis niloticus) (Linnaeus, 1758) local strains collected from different fish farms in South Western Highland Agro-Ecological Zone (SWHAEZ), Uganda: Screening strains for aquaculture. Fishes 2023, 8, 217. [Google Scholar] [CrossRef]
  16. Nabulime, M.; Rutaisire, J.; Ssekaayi, J.; Smith, D.; Kabasa, J.D. Development of fry diets for African catfish (C. gariepinus) larvae in Uganda. J. Fish. Aqua. Sci. 2015, 10, 45. [Google Scholar] [CrossRef]
  17. Beingana, A.; Kwikiriza, G.; Bwanika, G.; Abaho, I.; Izaara, A.A. Performance of African Catfish Clarias gariepinus (Clariidae) fry fed on live rotifers (Brachionus calyciflorus), formulated diet, and a mixture of rotifers and formulated diet. Int. J. Fish. Aquat. Stud. 2016, 4, 11–15. [Google Scholar]
  18. Langi, S.; Maulu, S.; Hasimuna, O.J.; Kaleinasho Kapula, V.; Tjipute, M. Nutritional requirements and effect of culture conditions on the performance of the African catfish (Clarias gariepinus): A review. Cogent Food Agric. 2024, 10, 2302642. [Google Scholar] [CrossRef]
  19. Kemigabo, C.; Abdel-Tawwab, M.; Lazaro, J.W.; Sikawa, D.; Masembe, C.; Kang’Ombe, J. Combined effect of dietary protein and phytase levels on growth performance, feed utilization, and nutrients digestibility of African catfish, Clarias gariepinus (B.), reared in earthen ponds. J. Appl. Aquac. 2018, 30, 211–226. [Google Scholar] [CrossRef]
  20. Tibihika, P.D.M.; Barekye, A.; Byakora, E. Critical analysis of the growth performance of three fish species: Mirror carp (Cyprinus carpio), Nile tilapia (Oreochromis niloticus), and Sharp-toothed African catfish (Clarias gariepinus), cultured in earthen ponds in Kigezi region, Southwestern Uganda. Int. J. Fish. Aqua. Stud. 2015, 2, 63–73. [Google Scholar]
  21. Kayima, P.; Karasiewicz, T. Harnessing Geo-Diversity: Geosites and Geotourism in Uganda’s Albertine Region. Geoheritage 2025, 17, 1–21. [Google Scholar] [CrossRef]
  22. Awange, J. Lake Victoria Monitored from Space; Springer: Berlin/Heidelberg, Germany, 2021; pp. 1–321. [Google Scholar]
  23. Odada, E.O.; Olago, D.O.; Kulindwa, K.; Ntiba, M.; Wandiga, S. Mitigation of environmental problems in Lake Victoria, East Africa: Causal chain and policy options analyses. Ambio.J. Hum. Environ. 2004, 33, 13–23. [Google Scholar] [CrossRef]
  24. Mugo, R.; Waswa, R.; Nyaga, J.W.; Ndubi, A.; Adams, E.C.; Flores-Anderson, A.I. Quantifying land use land cover changes in the Lake Victoria basin using satellite remote sensing: The trends and drivers between 1985 and 2014. Remote Sens. 2020, 12, 2829. [Google Scholar] [CrossRef]
  25. Kwikiriza, G.; Tibihika, P.D.; Abaho, I.; Nattabi, J.K.; Vijayan, T.; Rupprecht, C.; Curto, M.; Melcher, A.; Meimberg, H. Genetic characterization and interspecies gene flow among the Oreochromis species in the Lake Victoria and Kyoga basins, Uganda: Implications for conservation. J. Great Lakes Res. 2025, 51, 102535. [Google Scholar] [CrossRef]
  26. Crow, J.F.; Denniston, C. Inbreeding and variance effective population numbers. Evolution 1988, 42, 482–495. [Google Scholar] [CrossRef] [PubMed]
  27. Adewumi, A.A.; Olaleye, V.F. Catfish culture in Nigeria: Progress, prospects and problems. Afr. J. Agric. Res. 2011, 6, 1281–1285. [Google Scholar]
  28. Isa, S.I. Development of Genetic Improvement in the African Catfish (Clarias Gariepinus, Burchell, 1822). Ph.D. thesis, Institute of Aquaculture, Faculty of Natural Sciences, University of Stirling, Scotland, UK, 2019. [Google Scholar]
  29. Ojiambo, D. Population Genetic Structure of Wild and Domesticated African Catfish (Clarias Gariepinus) in Victoria and Albertine Drainage Basins. Master’s thesis, Makerere University, Kampala, Uganda, 2015. [Google Scholar]
  30. Barasa, J.E.; Abila, R.; Grobler, J.P.; Dangasuk, O.G.; Njahira, M.N.; Kaunda-Arara, B. Genetic diversity and gene flow in Clarias gariepinus from Lakes Victoria and Kanyaboli, Kenya. Afr. J. Aquat. Sci. 2014, 39, 287–293. [Google Scholar] [CrossRef]
  31. Kebtieneh, N.; Alemayehu, K.; Tilahun, G. Genetic Diversity and Population Structure of African Catfish (Clarias gariepinus) Species: Implications for Selection and Sustainable Genetic Improvement. A Review. J. Aquac. Res. Dev. 2024, 15, 828. [Google Scholar]
  32. Sanda, M.K.; Metcalfe, N.B.; Capstick, M.; Nichols, J.; Mable, B.K. Genetic diversity, population structure, and differentiation of farmed and wild African catfish (Clarias gariepinus) in Nigeria. bioRxiv 2024, 2024-10. [Google Scholar] [CrossRef]
  33. Niyibizi, L.; Vidakovic, A.; Norman Haldén, A.; Rukera Tabaro, S.; Lundh, T. Aquaculture and aquafeed in Rwanda: Current status and perspectives. Appl. Aquac. 2023, 35, 743–764. [Google Scholar] [CrossRef]
  34. Kwikiriza, G.; Abaho, I.; Tibihika, P.D.; Izaara, A.A.; Atukwatse, F.; Omara, T.; Nattabi, J.K.; Kasozi, N.; Curto, M.; Melcher, A.; et al. Genetic Diversity and Population Differentiation of Farmed Nile Tilapia (Oreochromis niloticus Linnaeus, 1758) to Advance Selective Breeding in Uganda. Diversity 2025, 17, 128. [Google Scholar] [CrossRef]
  35. Geletu, T.T.; Tang, S.; Zhao, J. Genetic diversity and differentiation of cultured Nile tilapia populations from Ethiopia revealed by ddRAD-seq: Implications for better hatchery management. Aquat. Living Resour. 2025, 38, 2. [Google Scholar] [CrossRef]
  36. Fregene, B.T.; Bolorunduro, P.; Yossa, R.; Karisa, H.C.; Olaniyi, A.; Ajose, I. Extension manual on the production of quality catfish seed. Gates Open Res. 2024, 8, 68. [Google Scholar]
  37. Abdulraheem, I.; Ojelade, O.C.; Idi-Ogede, A.M.; Onimisi, H.U.; Tokede, O.E. Emergence of new shooters from the populations of selected shooters of African mudcatfish Clarias gariepinus (BURCHELL, 1822). Ife J. Agric. 2019, 31, 3. [Google Scholar]
  38. Srimai, W.; Koonawootrittriron, S.; Manee-Aphai, W.; Chatchaiphan, S.; Koolboon, U.; Na-Nakorn, U. Genetic parameters and genotype-environment interaction for growth traits of North African catfish, Clarias gariepinus (Burchell, 1822). Aquaculture 2019, 501, 104–110. [Google Scholar] [CrossRef]
  39. Tave, D. Growth of triploid and diploid bighead carp, Hypophthalmichthys nobilis. J. Appl. Aquac. 1993, 2, 13–26. [Google Scholar] [CrossRef]
  40. Beardmore, J.A.; Mair, G.C.; Lewis, R.I. Monosex male production in finfish as exemplified by tilapia: Applications, problems, and prospects. Aquaculture 2001, 197, 283–301. [Google Scholar] [CrossRef]
  41. Chaivichoo, P.; Sukhavachana, S.; Khumthong, R.; Srisapoome, P.; Chatchaiphan, S.; Na-Nakorn, U. Genome–wide association study and genomic prediction of growth traits in bighead catfish (Clarias macrocephalus Günther, 1864). Aquaculture 2023, 562, 738–748. [Google Scholar] [CrossRef]
  42. Nguyen, D.H.M.; Ponjarat, J.; Laopichienpong, N.; Panthum, T.; Singchat, W.; Ahmad, S.F.; Kraichak, E.; Muangmai, N.; Duengkae, P.; Peyachoknagul, S.; et al. Genome-wide SNP analysis of hybrid clariid fish reflects the existence of polygenic sex-determination in the lineage. Front. Genet. 2022, 13, 789573. [Google Scholar] [CrossRef]
  43. Miller, J.W.; Atanda, T. The rise of peri-urban aquaculture in Nigeria. Int. J. Agric. Sustain. 2011, 9, 274–281. [Google Scholar] [CrossRef]
  44. Mafwila Kinkela, P.; Kambashi Mutiaka, B.; Dochain, D.; Rollin, X.; Mafwila, J.; Bindelle, J. Smallholders’ practices of integrated agriculture aquaculture system in peri-urban and rural areas in Sub-Saharan Africa. Tropicultura 2019, 37. [Google Scholar] [CrossRef]
  45. Amoah, K.; Adu-Asiamah, P.; Dong, X.H.; Ampofo-Yeboah, A.; Abarike, E.D. A comparative study on the hatchability and survival rate of African catfish, Clarias gariepinus (Burchell, 1822), induced with catfish’s pituitary gland hormone from farmed and wild sources. Aquac. Int. 2020, 28, 2221–2234. [Google Scholar] [CrossRef]
  46. Esa, Y.B.; Dadile, A.M.; Syukri, F.; Christianus, A.; Diyaware, M.Y. Evaluation of fecundity, fertilization, hatching, and gonadosomatic index of exotic Clarias gariepinus (Burchell, 1822) and native Clarias macromystax (Gunther, 1864) under semi-arid conditions of Nigeria. Animals 2023, 13, 1723. [Google Scholar] [CrossRef]
  47. Sriphairoj, K.; Kamonrat, W.; Na-Nakorn, U. Genetic aspect in broodstock management of the critically endangered Mekong giant catfish, Pangasianodon gigas in Thailand. Aquaculture 2007, 264, 36–46. [Google Scholar] [CrossRef]
  48. Opiyo, M.A.; Orina, P.; Charo-Karisa, H. Fecundity, growth parameters, and survival rate of three African catfish (Clarias gariepinus) strains under hatchery conditions. J. Aquac. Eng. Fish. Res. 2017, 3, 75–81. [Google Scholar] [CrossRef]
  49. Ferosekhan, S.; Sahoo, S.K.; Giri, S.S.; Das, B.K.; Pillai, B.R.; Das, P.C. Broodstock development, captive breeding and seed production of bagrid catfish, Mahanadi rita, Rita chrysea (Day, 1877). Aquaculture 2019, 503, 339–346. [Google Scholar] [CrossRef]
  50. Imron, I.; Iswanto, B.; Suparapto, R.; Marnis, H. Development of genetically improved farmed African catfish, Clarias gariepinus; A review and lessons learned from Indonesian fish breeding program. IOP Conf. Ser. Earth Environ. Sci. 2020, 593, 012032. [Google Scholar] [CrossRef]
  51. Tine, M.; Ndiaye, F.; Bale, K.; Magblenou, L.D.; Sene, M.A. Effects of inbreeding depression on the success of artificial reproduction in the African catfish Clarias gariepinus (Burchell, 1822). Int. J. Aquac. Fish. Sci. 2022, 8, 045–053. [Google Scholar]
  52. Niu, J.S.; Wang, T.; Li, Z.; Wang, Z.W.; Ding, M.; Wang, M.T.; Li, X.Y. Efficient breeding and growth advantage of all-male population in Lanzhou catfish (Silurus lanzhouensis). Aquaculture 2024, 578, 740023. [Google Scholar] [CrossRef]
  53. Dupont-Nivet, M.; Vandeputte, M.; Haffray, P.; Chevassus, B. Effect of different mating designs on inbreeding, genetic variance and response to selection when applying individual selection in fish breeding programs. Aquaculture 2006, 252, 161–170. [Google Scholar] [CrossRef]
  54. Busack, C.; Knudsen, C.M. Using factorial mating designs to increase the effective number of breeders in fish hatcheries. Aquaculture 2007, 273, 24–32. [Google Scholar] [CrossRef]
  55. Kánainé Sipos, D.; Bakos, K.; Ősz, Á.; Hegyi, Á.; Müller, T.; Urbányi, B.; Kovács, B. Development and characterization of 49 novel microsatellite markers in the African catfish, Clarias gariepinus (Burchell, 1822). Mol. Biol. Rep. 2019, 46, 6599–6608. [Google Scholar] [CrossRef]
  56. Zamri, A.S.; Zulperi, Z.; Esa, Y.; Syukri, F. Hormone Application for Artificial Breeding Towards Sustainable Aquaculture–A Review. Pertanika J. Trop. Agric. Sci. 2022, 45. [Google Scholar] [CrossRef]
  57. Ataguba, G.A.; Kwala, G.J.; Abum, T. The Effect of Diluted Doses of GnRHa (Ovulin) Supplemented with Buserelin Acetate-GnRHa (Suprecur) on Final Ova Maturation and Breeding of the African Catfish (Clarias gariepinus). Aqua. Sci. Fish Res. 2023, 4, 55–63. [Google Scholar] [CrossRef]
  58. Toko, I.; Fiogbe, E.D.; Koukpode, B.; Kestemont, P. Rearing of African catfish (Clarias gariepinus) and vundu catfish (Heterobranchus longifilis) in traditional fish ponds (whedos): Effect of stocking density on growth, production, and body composition. Aquaculture 2007, 262, 65–72. [Google Scholar] [CrossRef]
  59. Brown, T.W.; Mischke, C.C.; Roy, L.A.; Li, M.H. A length–weight relationship for pond-raised hybrid catfish fingerlings. J. World Aquac. Soc. 2016, 47, 93–96. [Google Scholar] [CrossRef]
  60. Pita, C.; Eleftheriou, M.; Fernández-Borrás, J.; Gonçalves, S.; Mente, E.; Santos, M.B.; Seixas, S.; Pierce, G.J. Generic skills needs for graduate employment in the aquaculture, fisheries, and related sectors in Europe. Aquac. Int. 2015, 23, 767–786. [Google Scholar] [CrossRef]
  61. Khademi-Vidra, A.; Urbányi, B.; Bakos, I.M. Educational and training innovation opportunities in the aquaculture and fisheries sector of Hungarian secondary agricultural education. Aquac. Int. 2024, 32, 5437–5459. [Google Scholar] [CrossRef]
  62. Boyd, C.E.; D’Abramo, L.R.; Glencross, B.D.; Huyben, D.C.; Juarez, L.M.; Lockwood, G.S.; McNevin, A.A.; Tacon, A.G.; Teletchea, F.; Tomasso, J.R., Jr.; et al. Achieving sustainable aquaculture: Historical and current perspectives and future needs and challenges. J. World Aquac. Soc. 2020, 51, 578–633. [Google Scholar] [CrossRef]
  63. Nkambo, M.; Mwanja, M.; Balirwa, J.S.; Nayiga, S.; Bugenyi, F.W. Hatchability of Selected Commercial Artemia Strains using waters from selected saline crater lakes of Western Uganda. J. Nat. Sci. Res. 2019, 9, 37–42. [Google Scholar]
  64. Nyonje, B.M.; Opiyo, M.A.; Orina, P.S.; Abwao, J.; Wainaina, M.; Charo-Karisa, H. Current status of freshwater fish hatcheries, broodstock management, and fingerling production in the Kenya aquaculture sector. Livestock Res. Rural Dev. 2018, 30, 1–15. [Google Scholar]
  65. Mugyenyi, J.; Kinhonhi, I.V.; Modi, V. Electricity outages in Uganda: Causes, trends and regional disparities. In Proceedings of the 2024 IEEE PES/IAS PowerAfrica, Johannesburg, South Africa, 7–11 October 2024; IEEE: Piscataway, NJ, USA, 2024; pp. 1–5. [Google Scholar]
  66. Migisha, A.G.; Ntayi, J.M.; Adaramola, M.S.; Buyinza, F.; Senyonga, L.; Abaliwano, J. Effects of technical and security factors on grid electricity reliability: Evidence from Uganda national electricity grid network. Technol. Sustain. 2024, 3, 41–67. [Google Scholar] [CrossRef]
  67. Tumwesigye, Z.; Tumwesigye, W.; Opio, F.; Kemigabo, C.; Mujuni, B. The effect of water quality on aquaculture productivity in Ibanda District, Uganda. Aquac. J. 2022, 2, 23–36. [Google Scholar] [CrossRef]
Figure 1. Sample collection sites. The sites indicated on this map are the ones whose data were considered for subsequent analysis and presentation in this paper.
Fishes 10 00290 g001
Figure 2. Source of broodstock at the farm (N = 24).
Fishes 10 00290 g002
Figure 3. Broodstock evaluation (N = 24). (A) Number of broodstock kept annually, (B) frequency of broodstock use, (C) broodstock contributing to the next generation.
Fishes 10 00290 g003
Figure 4. Weight of broodstock at induction (N = 24).
Fishes 10 00290 g004
Figure 5. The relationship between (Ne) and (F) for different mating ratios.
Fishes 10 00290 g005
Figure 6. Hatchery production systems used during breeding.
Fishes 10 00290 g006
Figure 7. Larvae and fry production. (N = 24). (A) Hatchability, (B) survival from larvae to fingerlings.
Fishes 10 00290 g007
Figure 8. Raising fingerlings to market size (N = 24). (A) Time taken to raise fingerlings, (B) total length of fingerlings achieved at the time of sale, (C) weight of fingerlings at the time of sale.
Fishes 10 00290 g008
Figure 9. Starter feeds used at the hatchery (N = 24).
Fishes 10 00290 g009
Figure 10. Farm ownership and academic qualifications (N = 24). (A) Ownership, (B) educational level.
Fishes 10 00290 g010
Figure 11. Knowledge sources acquired by the hatchery operators (N = 24).
Fishes 10 00290 g011
Figure 12. Challenges faced by the hatchery operators (N = 24).
Fishes 10 00290 g012
Table 1. Effective breeding number and average breeding coefficient for the different mating pairs.
Mating RatiosNeFF (%)
1 male–1 female 4000.0010.1
2 males–2 females 2000.0020.2
1 male–3 females1780.0030.3
1 male–2 females 1330.0040.4
1 male–4 females 1280.0040.4
Disclaimer/Publisher’s Note: The statements, opinions and data contained in all publications are solely those of the individual author(s) and contributor(s) and not of MDPI and/or the editor(s). MDPI and/or the editor(s) disclaim responsibility for any injury to people or property resulting from any ideas, methods, instructions or products referred to in the content.

